active and passive stethoscope frequency … and passive stethoscope frequency transfer functions...
TRANSCRIPT
Active and Passive Stethoscope Frequency Transfer Functions
Electronic Stethoscope Frequency Response
Dr G.Drzewiecki, Ph. D. and H. Katta Biomedical Engineering Dept.
Rutgers University Piscataway, NJ, USA
[email protected], [email protected]
Andreas Pfahnl1 ScD, David Bello2, MD and
David Dieken1
1Devicix LLC, Eden Prairie, MN, USA 2Orlando Health, Orlando, FL, USA
Abstract—New low cost electronic stethoscopes are being developed to address telemedicine needs [6,7,8] and hospital acquired infections [4,5] that will require a means to effectively compare their acoustical performance. While the human ear may detect some qualitative differences between scopes the study here presents an experimental method that measures the step response of different electronic and passive stethoscopes, and then calculates their frequency transfer function so that they may be compared quantitatively. This study presents comparative results of passive stethoscopes (disposable and nurse types) with a commercially available electronic stethoscope (Littmann) and a new, very low cost, electronic stethoscope still in development for medical purposes [6]. This new design utilizes a commercially available cell phone for signal processing. Our results show that both passive and electronic types have resonant type responses resulting in poor low and high frequency transmission, but electronic amplification helps aid the stethoscope function in those extremes. We also show that the new, very low cost, electronic stethoscope design was found to have comparable performance and even better sensitivity to currently marketed electronic stethoscopes.
Keywords—Stethoscope; Acoustic transfer function; Frequency response, Electronic stethoscope.
I. INTRODUCTION Different stethoscope designs are to be evaluated for their
acoustic performance. Three are commercially available as medical devices, and the fourth is only available for non-medical use. The intent is to use the data and evaluation from this work as part of an application for regulatory clearance for the fourth device. Evaluations by human ear are too subjective and prone to preference. It is preferred to evaluate the stethoscope using a more quantitative measure. Drzewiecki [1] has applied the use of the Linear Systems Transfer Function concept to quantitatively characterize stethoscope devices. This method will be employed in this report to evaluate four different stethoscopes.
History: the physician Lennac invented the original stethoscope as a means of listening to his patients’ heart sounds without physically contacting them. The original stethoscope took the form of a long hollow wooden tube.
Out of convenience the tube was eventually redesigned into the more notable form of today of a bell, flexible tubing and earpieces. The electronic scopes tend to eliminate the bell and diaphragm and replace them with vibration transducers. Additionally, the tubing can be eliminated if an earphone transducer replaces them. Some kind of electronic process then provides amplification or filtering to supply sound to the ear transducers. Methods: Four stethoscopes were examined to find their separate frequency transfer functions. These were two passive nurses scopes, a Littmann electronic stethoscope, and an electronic HeartBuds listening device. All scopes were tested using the identical equipment and procedures. In summary, a step change in pressure was applied to the bell and diaphragm, and then a calibrated microphone was used to record the scope step response at one earpiece while the opposite earpiece was plugged.
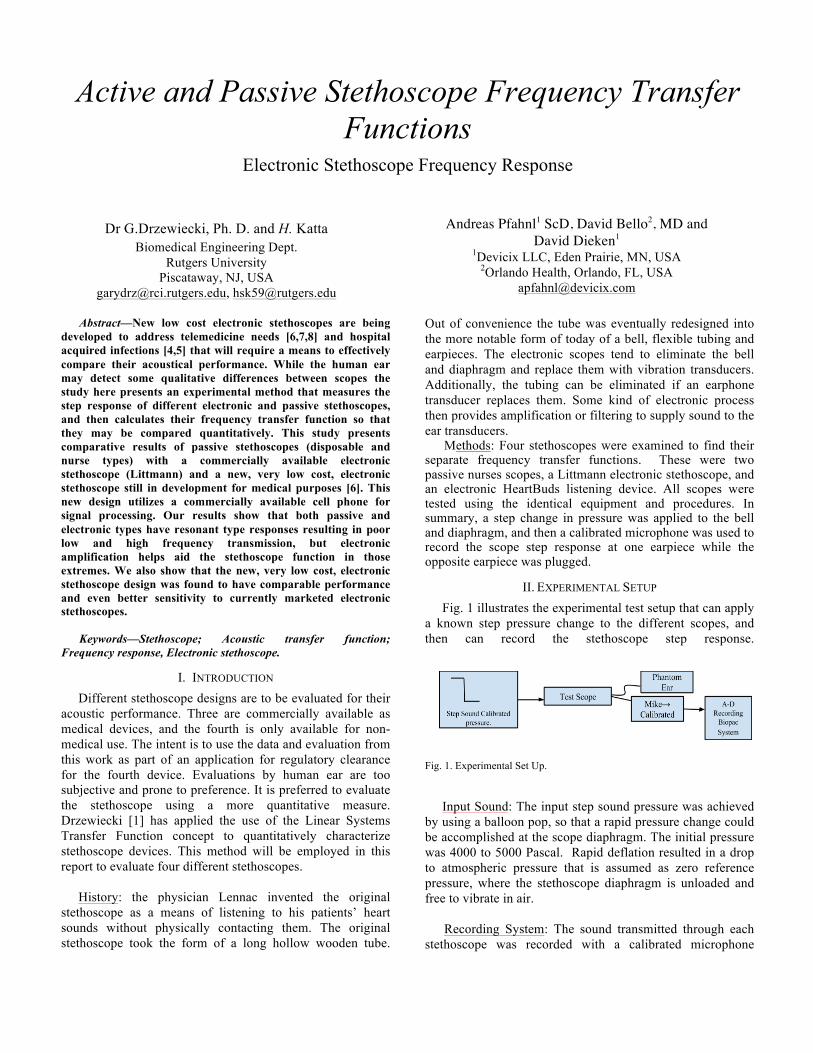
II. EXPERIMENTAL SETUP Fig. 1 illustrates the experimental test setup that can apply
a known step pressure change to the different scopes, and then can record the stethoscope step response.
Fig. 1. Experimental Set Up.
Input Sound: The input step sound pressure was achieved
by using a balloon pop, so that a rapid pressure change could be accomplished at the scope diaphragm. The initial pressure was 4000 to 5000 Pascal. Rapid deflation resulted in a drop to atmospheric pressure that is assumed as zero reference pressure, where the stethoscope diaphragm is unloaded and free to vibrate in air.
Recording System: The sound transmitted through each
stethoscope was recorded with a calibrated microphone

[Dayton Audio; EMM-6]. The microphone is powered by 10 Volts using a phantom power circuit. The microphone sound output was then input to an analog-to-digital recording system [Biopac Systems MP-36 and software]. The acoustic connection from one earpiece to the microphone was made through a ¼ inch latex tubing to simulate the human ear canal and minimize acoustic vibration. The opposite earpiece is connected to similar ¼ latex tubing and clipped closed to provide a closed volume of air [2 to 5 mL] to represent the opposite ear canal.
Signal Processing: In all cases, the input step pressure was maintained at 4000 Pascal. Data recording was initiated before the step and maintained for a total record of 6 seconds. The acquisition rate was constant at 5000 samples/sec. No filtering or signal processing of any kind was applied to the step record. Next, the stethoscope step response was analyzed to find the frequency response. The sequence of calculations is outlined as follows: 1. Apply input step pressure and measure step response.
2. Convert to sound pressure in Pascals by multiplying by 0.1 Pascal/mV.
3. Compute the numerical derivative, which is approximated by 2 point differencing to yield the impulse response.
4. Normalize the step response by the sound input magnitude of 4000 Pascal.
5. Calculate the numerical Fourier Transform (FFT) to get the final result of stethoscope frequency transfer function magnitude [normalized].
III. RESULTS For all stethoscopes the step response appears as one that
is typical of a resonant system or a “ringing “response curve. A single Stethoscope response for the passive nurse’s scope is shown in Fig. 2.
Figure 2. Step response for the passive nurse’s stethoscope showing a ringing resonant system response.
This data was obtained for every scope and processed
according to the signal processing procedure outlined earlier to obtain the scope’s Transfer function frequency response.
As an example of an electronic stethoscope response the step response of the HeartBuds device is provided in Fig. 3.
Figure 3. Step response of the HeartBuds' listening device.
The Littmann electronic stethoscope possessed a similar
step response curve and is therefore not shown. Next the transfer function data is calculated. The results from Figures 2 and 3 is provided in Figs. 4 and 5, respectively along with the Littmann scope response in Fig. 6.
Figure 4. Passive nurse’s stethoscope transfer function.
Figure 5. HeartBuds device transfer function.
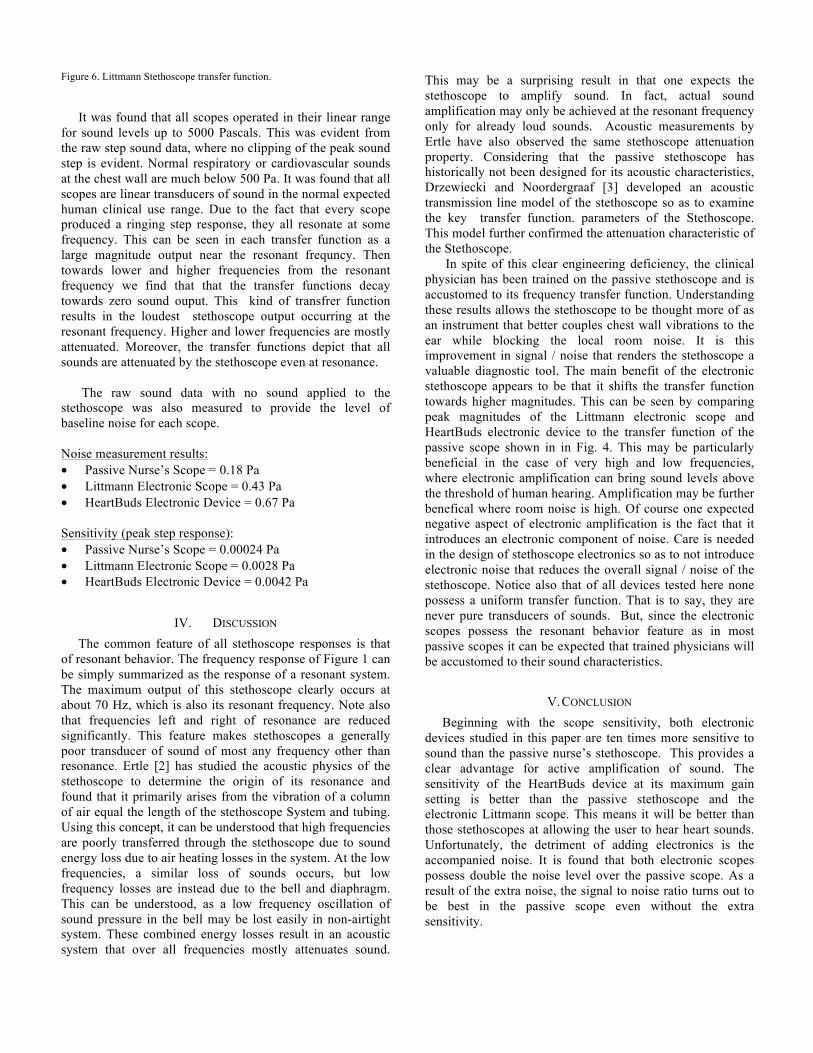
Figure 6. Littmann Stethoscope transfer function.
It was found that all scopes operated in their linear range
for sound levels up to 5000 Pascals. This was evident from the raw step sound data, where no clipping of the peak sound step is evident. Normal respiratory or cardiovascular sounds at the chest wall are much below 500 Pa. It was found that all scopes are linear transducers of sound in the normal expected human clinical use range. Due to the fact that every scope produced a ringing step response, they all resonate at some frequency. This can be seen in each transfer function as a large magnitude output near the resonant frequncy. Then towards lower and higher frequencies from the resonant frequency we find that that the transfer functions decay towards zero sound ouput. This kind of transfrer function results in the loudest stethoscope output occurring at the resonant frequency. Higher and lower frequencies are mostly attenuated. Moreover, the transfer functions depict that all sounds are attenuated by the stethoscope even at resonance.
The raw sound data with no sound applied to the
stethoscope was also measured to provide the level of baseline noise for each scope. Noise measurement results: • Passive Nurse’s Scope = 0.18 Pa • Littmann Electronic Scope = 0.43 Pa • HeartBuds Electronic Device = 0.67 Pa
Sensitivity (peak step response): • Passive Nurse’s Scope = 0.00024 Pa • Littmann Electronic Scope = 0.0028 Pa • HeartBuds Electronic Device = 0.0042 Pa
IV. DISCUSSION The common feature of all stethoscope responses is that
of resonant behavior. The frequency response of Figure 1 can be simply summarized as the response of a resonant system. The maximum output of this stethoscope clearly occurs at about 70 Hz, which is also its resonant frequency. Note also that frequencies left and right of resonance are reduced significantly. This feature makes stethoscopes a generally poor transducer of sound of most any frequency other than resonance. Ertle [2] has studied the acoustic physics of the stethoscope to determine the origin of its resonance and found that it primarily arises from the vibration of a column of air equal the length of the stethoscope System and tubing. Using this concept, it can be understood that high frequencies are poorly transferred through the stethoscope due to sound energy loss due to air heating losses in the system. At the low frequencies, a similar loss of sounds occurs, but low frequency losses are instead due to the bell and diaphragm. This can be understood, as a low frequency oscillation of sound pressure in the bell may be lost easily in non-airtight system. These combined energy losses result in an acoustic system that over all frequencies mostly attenuates sound.
This may be a surprising result in that one expects the stethoscope to amplify sound. In fact, actual sound amplification may only be achieved at the resonant frequency only for already loud sounds. Acoustic measurements by Ertle have also observed the same stethoscope attenuation property. Considering that the passive stethoscope has historically not been designed for its acoustic characteristics, Drzewiecki and Noordergraaf [3] developed an acoustic transmission line model of the stethoscope so as to examine the key transfer function. parameters of the Stethoscope. This model further confirmed the attenuation characteristic of the Stethoscope.
In spite of this clear engineering deficiency, the clinical physician has been trained on the passive stethoscope and is accustomed to its frequency transfer function. Understanding these results allows the stethoscope to be thought more of as an instrument that better couples chest wall vibrations to the ear while blocking the local room noise. It is this improvement in signal / noise that renders the stethoscope a valuable diagnostic tool. The main benefit of the electronic stethoscope appears to be that it shifts the transfer function towards higher magnitudes. This can be seen by comparing peak magnitudes of the Littmann electronic scope and HeartBuds electronic device to the transfer function of the passive scope shown in in Fig. 4. This may be particularly beneficial in the case of very high and low frequencies, where electronic amplification can bring sound levels above the threshold of human hearing. Amplification may be further benefical where room noise is high. Of course one expected negative aspect of electronic amplification is the fact that it introduces an electronic component of noise. Care is needed in the design of stethoscope electronics so as to not introduce electronic noise that reduces the overall signal / noise of the stethoscope. Notice also that of all devices tested here none possess a uniform transfer function. That is to say, they are never pure transducers of sounds. But, since the electronic scopes possess the resonant behavior feature as in most passive scopes it can be expected that trained physicians will be accustomed to their sound characteristics.
V. CONCLUSION Beginning with the scope sensitivity, both electronic
devices studied in this paper are ten times more sensitive to sound than the passive nurse’s stethoscope. This provides a clear advantage for active amplification of sound. The sensitivity of the HeartBuds device at its maximum gain setting is better than the passive stethoscope and the electronic Littmann scope. This means it will be better than those stethoscopes at allowing the user to hear heart sounds. Unfortunately, the detriment of adding electronics is the accompanied noise. It is found that both electronic scopes possess double the noise level over the passive scope. As a result of the extra noise, the signal to noise ratio turns out to be best in the passive scope even without the extra sensitivity.
Looking at the frequency response characteristics of all scopes, it was found that each scope possesses a resonance. The resonant frequency is lowest for the passive nurse’s stethoscope. As explained earlier, resonance is a result of the stethoscope tubing’s acoustic wavelength. Since the electronic scopes have little or no tubing, the resonant frequency can be much higher. This puts the electronic scopes as having an advantage over the passive stethoscopes at high frequencies. It puts the electronic scopes at a disadvantage over the passive stethoscopes for the low frequencies. Since all scopes possess the bell and diaphragm, this causes them all to have very poor sensitivity at the sub-100 Hz frequencies. Diaphragm stiffness is the determining factor at the very low frequencies.
In terms of the medical application of the stethoscope, since the nurse’s scope is mostly used for determining the blood pressure, it is a suitable design for this purpose. Since the electronic scopes provide the highest usable frequencies, they are more suited to heart and valvular sound. The nurse’s scope would be more suitable for gastric sounds and the blood pressure sounds.
VI. REFERENCES 1. Drzewiecki, G.M., J. “Lab Manual for Biomedical Systems and
Devices, Revised edition” Cognella Press, University readers 2014. 2. P.Y. Ertel, M. Lawrence, R.K. Brown, and A. M. Stern: Stethoscope
Acoustics, I. The doctor and his Sthoscope, II.Transmission and filtration patterns, Circulation, 34:899, 1966.
3. Drzewiecki and Noordergraaf, “The origin of the Korotkoff sound and Arterial Tonometry”, University Microfilms, 1985.
4. Sanchez-Zambrano S., “The Daily Use of Disposable Acoustic Diaphragms Prevents Costly Cross-Contamination, Nosocomial Infections and Medical Legal Pro,” EP Lab Digest, on-line publication posted May 3, 2008.
5. Bowerman M., “Stethoscopes could play a part in spreading germs”, USA Today, February 28, 2014.
6. Pfahnl A.C., Bello D., Dieken D., Drzewiecki G., Designing An Extremely Low Cost Electronic Stethoscope for mHealth and In-Hospital Use,” IEEE Metrocon, Arlington Convention Center, Arlington Texas, October 2, 2014.
7. “Electronic stethoscopes advancing telemedicine”, Today’s Medical Developments, on-line publication posted May 2, 2011.
8. Raj C Thiagarajan R.C., Sankaran P., Baig A.H., Elangovan K., Gururajan R., “Acoustical Design of Digital Stethoscope for Improved Performance” Proceedings of the 2012 COMSOL Conference in Bangalore.