activated sludge process control
DESCRIPTION
NOTES ON ACTIVATED SLUDGE PROCESS CONTROLTRANSCRIPT

_________________________________
NOTES ON ACTIVATED SLUDGE
PROCESS CONTROL
_________________________________
Prepared By: State of Maine
Department of Environmental Protection
___________________________________________
2009
Notes on Activated Sludge Process Control Page i
PREFACE
The Federal Water Pollution Control Act Amendments of 1972 (Public Law 92-500)
established the National goals to restore and maintain the chemical, physical and
biological integrity of the Nation’s waters.
In August 1973, the US EPA published its definition of secondary treatment. Three
major effluent parameters were defined: 5 day Biochemical Oxygen Demand (BOD5),
total suspended solids (TSS) and pH. Secondary plants treating municipal wastewater are
limited to 30 mg/L monthly average, 45 mg/L weekly average and 85 percent removal of
BOD5 and TSS.
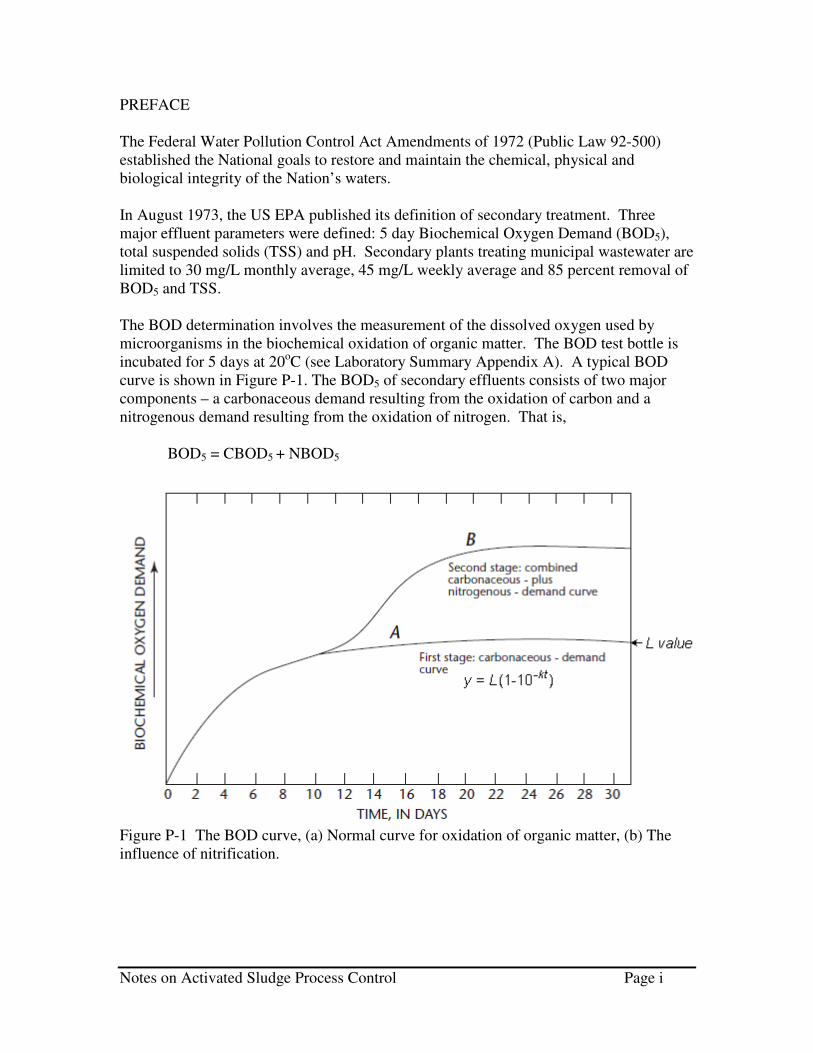
The BOD determination involves the measurement of the dissolved oxygen used by
microorganisms in the biochemical oxidation of organic matter. The BOD test bottle is
incubated for 5 days at 20oC (see Laboratory Summary Appendix A). A typical BOD
curve is shown in Figure P-1. The BOD5 of secondary effluents consists of two major
components – a carbonaceous demand resulting from the oxidation of carbon and a
nitrogenous demand resulting from the oxidation of nitrogen. That is,
BOD5 = CBOD5 + NBOD5
Figure P-1 The BOD curve, (a) Normal curve for oxidation of organic matter, (b) The
influence of nitrification.

Notes on Activated Sludge Process Control Page ii
Total solids are defined as all the matter that remains as residue upon evaporation at 103
to 105oC. Total solids can be classified as either suspended solids or filterable solids by
passing a known volume of liquid through a filter. The filter is commonly chosen so that
the minimum diameter of the suspended solids is about 1 micron. The suspended solids
fraction includes the settleable solids that will settle to the bottom of a cone shaped
container (called an Imhoff cone) in a 60 minute period and those solids which are
retained on a filter and heated for one hour at 103-105oC (see Figure P-2).
Figure P-2 Classification and size range of particles found in wastewater.
The measure of pH is the hydrogen ion concentration. pH is used to express the intensity
of the acid or alkaline condition of a solution. The scale of pH ranges from 0 to 14, with
7 being neutral. The effluent limit for pH is typically 6 to 9.0
There are four major biological processes used for wastewater treatment. These four
major groups are: aerobic process, anoxic processes, anaerobic processes and a
combination of the aerobic/anoxic or anaerobic. The aerobic processes include
suspended growth process (such as activated sludge and aerated lagoons) and attached
growth facilities which include trickling filters and Rotating Biological Contactors
(RBDs). Maine has about 70 activated sludge treatment plants, 17 aerated lagoons, nine
RBCs, two trickling filters and two activates biolfilter (a combination of tricking filter
and activated sludge) plants.
The objectives of the activated sludge wastewater treatment plants are to coagulate and
remove the nonsettlable colloidal solids and to stabilize the organic matter.
The purpose of activated sludge wastewater treatment plants was to accelerate the forces
of nature under controlled conditions in treatment facilities of comparatively small size.

Notes on Activated Sludge Process Control Page iii
In the removal of carbonaceous BOD, the coagulation of nonsettleable colloidal solids
and the stabilization of organic matter are accomplished biologically using a variety of
microorganisms, principally bacteria.
The microorganisms are used to convert the colloidal and dissolved carbonaceous organic
matter into various gases and cell tissue.
Because the cell tissue has a specific gravity slightly greater than that of water, the
resulting tissue can be removed from the treated liquid by gravity settling.
Studies in the early 1980’s by the United States Environmental Protection Agency (EPA),
the Water Pollution Control Federation (WPCF), and the General Accounting Office
(GAO), indicate that 50 percent or more of the wastewater treatment facilities nationwide
were failing to meet their discharge permit requirements. Those reports cited the lack of
adequate training for operators as a major factor limiting the performance of these
facilities.
Congress acknowledged the need for improvements in operator training programs and
through the use of add-on funds in Section 104 (g)(1) of the Clean Water Act directed
EPA to make grants to State training centers and agencies to provide on-site, over-the-
shoulder training. The State of Maine has received Section 104(g)(1) funds for over
twenty years.
The State of Maine’s legislature also recognized the need for operator training and
established the Joint Environmental Training Coordinating Committee (JETCC) to
provide state-wide training opportunities.
Notes on Activated Sludge Process Control was started in the spring of 1987 by the
DEP’s Operation and Maintenance Division to served as a training resource for JETCC
and during 104(g)(1) on-site training. It soon became evident that a set of notes was
necessary to enable the person receiving the training to concentrate on the fundamental
concepts without fear of missing the details. This collection of notes was prepared for
use by wastewater treatment plant operators as a reference to help improve activated
sludge plants performance through increased understanding of process control principles.
After over 20 years of experience providing training and technical assistance this
collection of notes was updated in 2009 by the staff of the Maine Department of
Environmental Protection, Division of Water Quality Management.
Notes on Activated Sludge Process Control Page 1
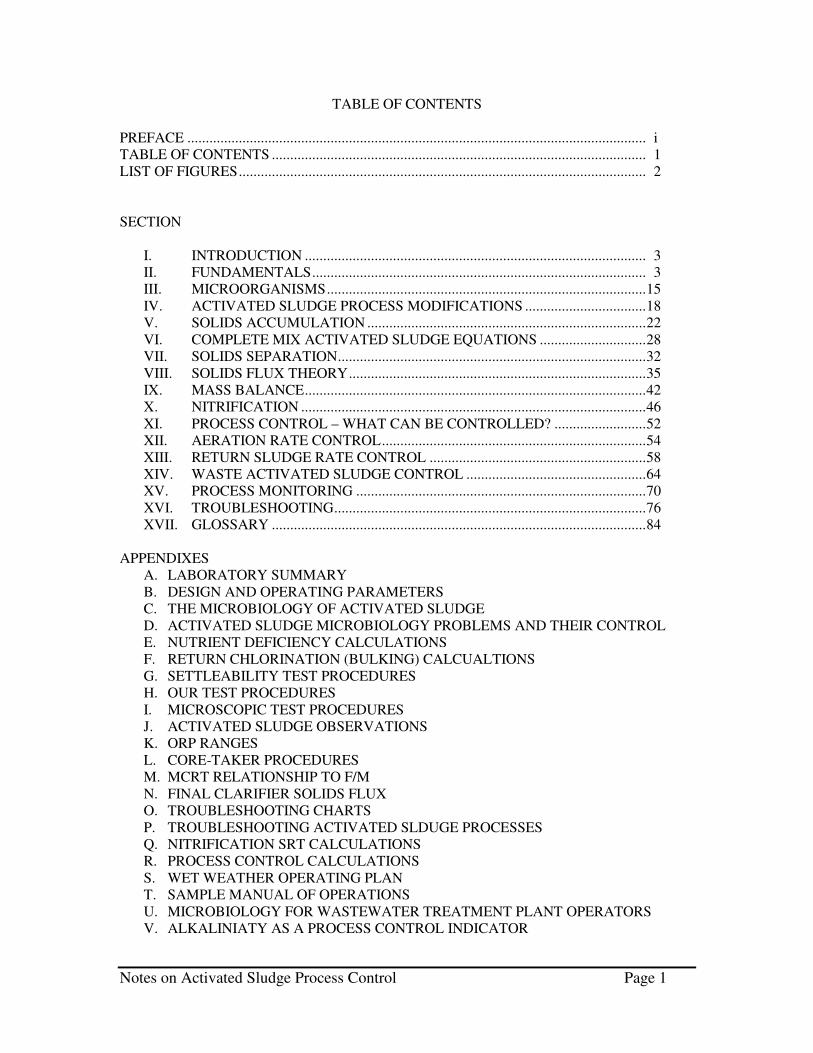
TABLE OF CONTENTS
PREFACE ............................................................................................................................. i
TABLE OF CONTENTS ...................................................................................................... 1
LIST OF FIGURES............................................................................................................... 2
SECTION
I. INTRODUCTION ............................................................................................. 3
II. FUNDAMENTALS........................................................................................... 3
III. MICROORGANISMS.......................................................................................15
IV. ACTIVATED SLUDGE PROCESS MODIFICATIONS .................................18
V. SOLIDS ACCUMULATION ............................................................................22
VI. COMPLETE MIX ACTIVATED SLUDGE EQUATIONS .............................28
VII. SOLIDS SEPARATION....................................................................................32
VIII. SOLIDS FLUX THEORY.................................................................................35
IX. MASS BALANCE.............................................................................................42
X. NITRIFICATION ..............................................................................................46
XI. PROCESS CONTROL – WHAT CAN BE CONTROLLED? .........................52
XII. AERATION RATE CONTROL........................................................................54
XIII. RETURN SLUDGE RATE CONTROL ...........................................................58
XIV. WASTE ACTIVATED SLUDGE CONTROL .................................................64
XV. PROCESS MONITORING ...............................................................................70
XVI. TROUBLESHOOTING.....................................................................................76
XVII. GLOSSARY ......................................................................................................84
APPENDIXES
A. LABORATORY SUMMARY
B. DESIGN AND OPERATING PARAMETERS
C. THE MICROBIOLOGY OF ACTIVATED SLUDGE
D. ACTIVATED SLUDGE MICROBIOLOGY PROBLEMS AND THEIR CONTROL
E. NUTRIENT DEFICIENCY CALCULATIONS
F. RETURN CHLORINATION (BULKING) CALCUALTIONS
G. SETTLEABILITY TEST PROCEDURES
H. OUR TEST PROCEDURES
I. MICROSCOPIC TEST PROCEDURES
J. ACTIVATED SLUDGE OBSERVATIONS
K. ORP RANGES
L. CORE-TAKER PROCEDURES
M. MCRT RELATIONSHIP TO F/M
N. FINAL CLARIFIER SOLIDS FLUX
O. TROUBLESHOOTING CHARTS
P. TROUBLESHOOTING ACTIVATED SLDUGE PROCESSES
Q. NITRIFICATION SRT CALCULATIONS
R. PROCESS CONTROL CALCULATIONS
S. WET WEATHER OPERATING PLAN
T. SAMPLE MANUAL OF OPERATIONS
U. MICROBIOLOGY FOR WASTEWATER TREATMENT PLANT OPERATORS
V. ALKALINIATY AS A PROCESS CONTROL INDICATOR

Notes on Activated Sludge Process Control Page 2
LIST OF FIGURES
Number Page
P-1 The BOD curve ................................................................................................... i
P-2 Classification and size range of particles found in wastewater........................... ii
1.01 Bacteria cell metabolism ................................................................................... 4
2.01 Synthesis and oxidation of organic matter ........................................................ 7
2.02 Energy conversion ............................................................................................ 9
2.03 SVI versus sludge age ....................................................................................... 11
2.04 Sludge setteability vs. organic loading ............................................................. 12
2.05 Growth curve .................................................................................................... 13
4.01 Basic activated sludge process diagram ............................................................ 19
4.02 Mixing regime and flow variations ................................................................... 21
5.01 Derivation of F/M & MCRT Relationship ........................................................ 24
5.02 Organic load vs. solids production .................................................................... 25
5.03 Sludge age vs. solids production ....................................................................... 25
6.01 Mixed Liquor Suspended Solids vs. sludge age ................................................ 31
7.01 Solids concentration vs. settling type ................................................................ 33
7.02 Zone settling rate ............................................................................................... 34
8.01 Flux resulting from gravitational settling ......................................................... 36
8.02 State point analysis ........................................................................................... 39
8.03 Variations in influent flow ................................................................................ 40
8.04 Effects of recycle rate changes ......................................................................... 41
8.05 Effects of an increase in MLSS ........................................................................ 43
8.06 Effects of sludge settling characteristics ........................................................... 44
10.01 Wastewater nitrogen cycle .............................................................................. 51
11.01 Relationship between physical limitations and operations ............................. 53
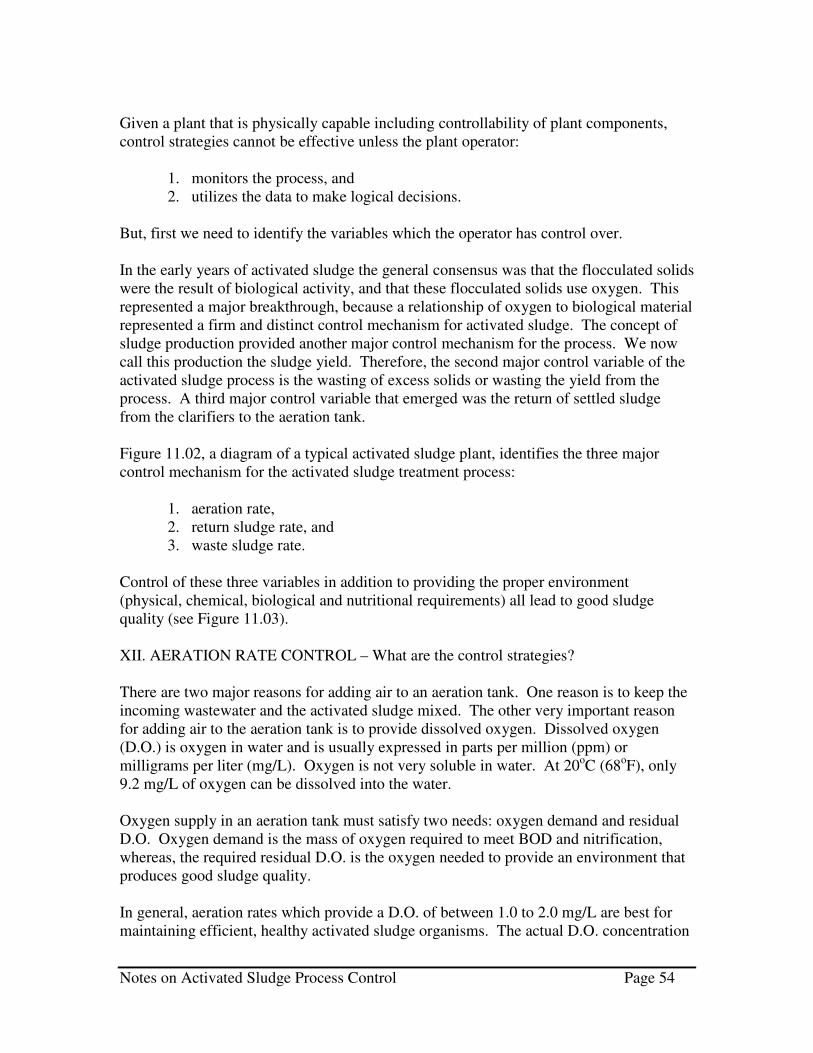
11.02 Diagram of typical activated sludge plant ...................................................... 55
11.03 Relationship of proper environment and process control ............................... 56
13.01 Three types of sludge settleability .................................................................. 63
15.01 Process control test location ............................................................................ 76
16.01 Diagram of the troubleshooting process ......................................................... 80
Notes on Activated Sludge Process Control Page 3
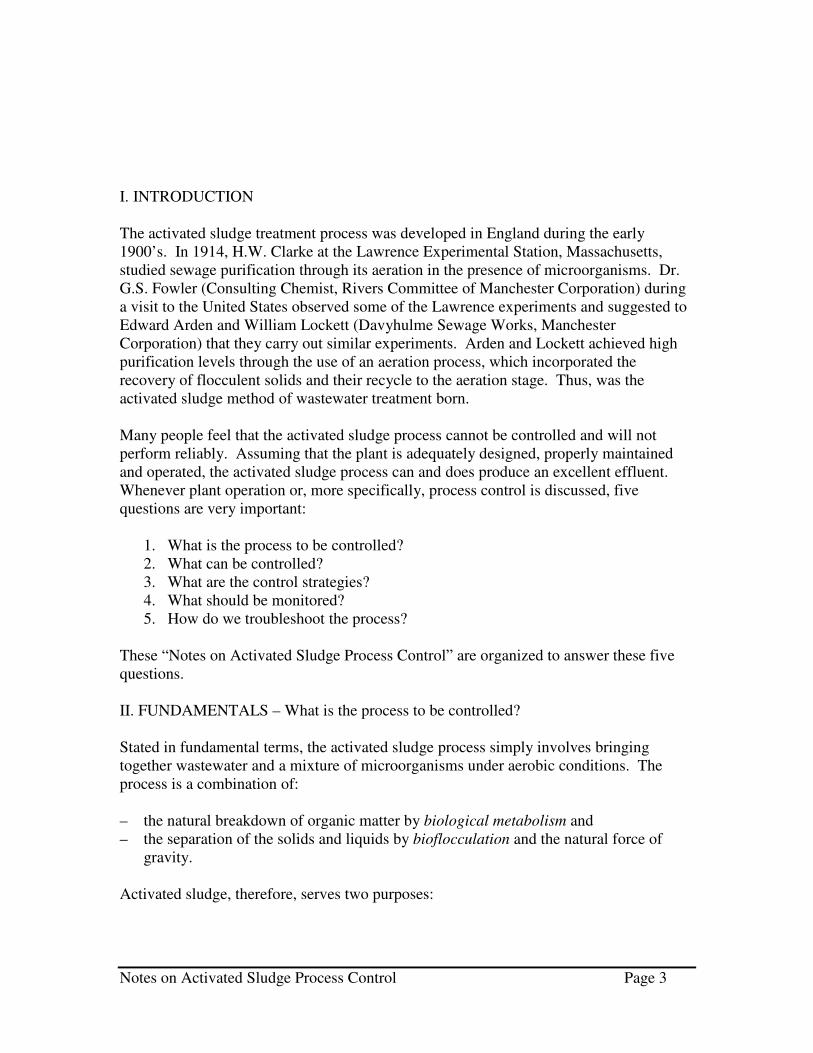
I. INTRODUCTION
The activated sludge treatment process was developed in England during the early
1900’s. In 1914, H.W. Clarke at the Lawrence Experimental Station, Massachusetts,
studied sewage purification through its aeration in the presence of microorganisms. Dr.
G.S. Fowler (Consulting Chemist, Rivers Committee of Manchester Corporation) during
a visit to the United States observed some of the Lawrence experiments and suggested to
Edward Arden and William Lockett (Davyhulme Sewage Works, Manchester
Corporation) that they carry out similar experiments. Arden and Lockett achieved high
purification levels through the use of an aeration process, which incorporated the
recovery of flocculent solids and their recycle to the aeration stage. Thus, was the
activated sludge method of wastewater treatment born.
Many people feel that the activated sludge process cannot be controlled and will not
perform reliably. Assuming that the plant is adequately designed, properly maintained
and operated, the activated sludge process can and does produce an excellent effluent.
Whenever plant operation or, more specifically, process control is discussed, five
questions are very important:
1. What is the process to be controlled?
2. What can be controlled?
3. What are the control strategies?
4. What should be monitored?
5. How do we troubleshoot the process?
These “Notes on Activated Sludge Process Control” are organized to answer these five
questions.
II. FUNDAMENTALS – What is the process to be controlled?
Stated in fundamental terms, the activated sludge process simply involves bringing
together wastewater and a mixture of microorganisms under aerobic conditions. The
process is a combination of:
– the natural breakdown of organic matter by biological metabolism and
– the separation of the solids and liquids by bioflocculation and the natural force of
gravity.
Activated sludge, therefore, serves two purposes:

Notes on Activated Sludge Process Control Page 4
1. Reducing organic matter in wastewater by using a complex biological community in
the presence of oxygen and converting the organic matter to new cell mass, carbon
dioxide and energy; and,
2. Producing solids capable of bio-flocculating and settling out in the clarifier to
produce an effluent low in Biochemical Oxygen Demand (BOD) and Total
Suspended Solids (TSS).
Activated sludge is formed in three distinct steps:
1. Transfer step
2. Conversion step
3. Flocculation step
During the transfer step (see Figure 1.01), soluble organic matter is absorbed through the
cell wall and into the cell where it is converted. Insoluble matter is adsorbed onto the cell
wall and broken down and then absorbed through the cell wall.
Figure 1.01
Before cell respiration and synthesis reactions can take place, the organic material
(soluble or non-settleable particles) must be taken inside the bacterium. This proceeds in
the following manner. First, the external food source comes into contact with the
bacterial cell capsular layer (slime layer). The cell capsular layer provides elementary
cell protection and serves as a depository for both food and waste materials.
Notes on Activated Sludge Process Control Page 5
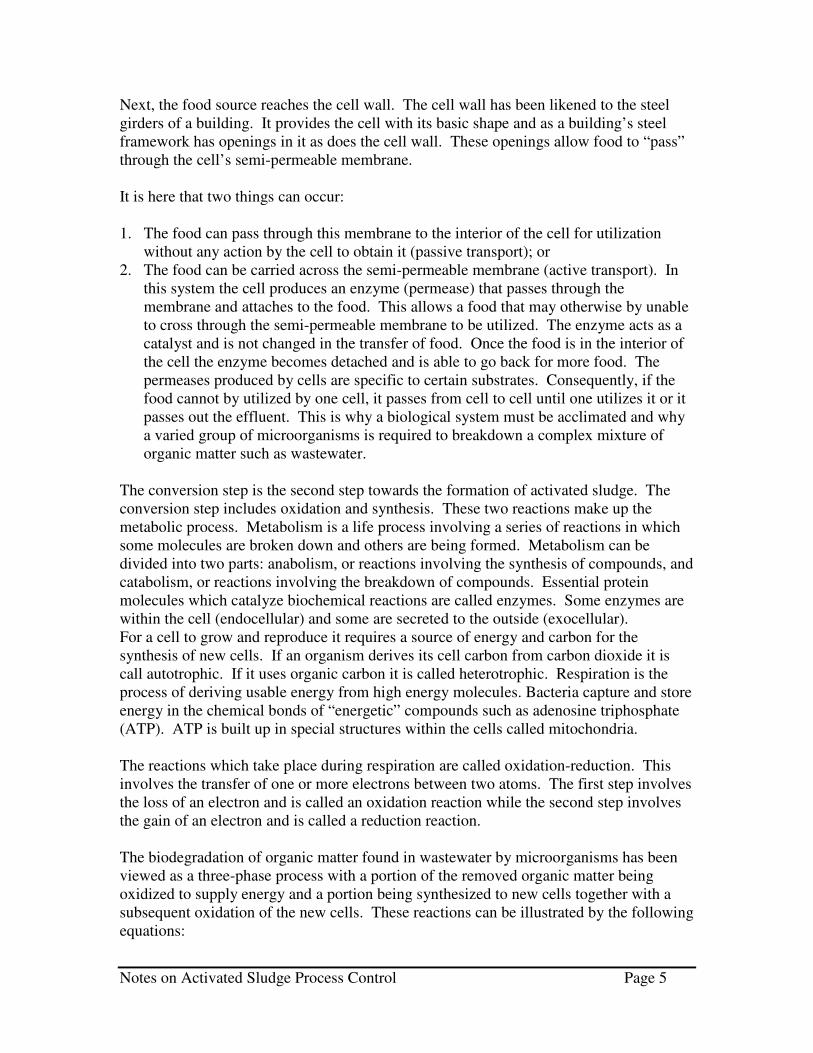
Next, the food source reaches the cell wall. The cell wall has been likened to the steel
girders of a building. It provides the cell with its basic shape and as a building’s steel
framework has openings in it as does the cell wall. These openings allow food to “pass”
through the cell’s semi-permeable membrane.
It is here that two things can occur:
1. The food can pass through this membrane to the interior of the cell for utilization
without any action by the cell to obtain it (passive transport); or
2. The food can be carried across the semi-permeable membrane (active transport). In
this system the cell produces an enzyme (permease) that passes through the
membrane and attaches to the food. This allows a food that may otherwise by unable
to cross through the semi-permeable membrane to be utilized. The enzyme acts as a
catalyst and is not changed in the transfer of food. Once the food is in the interior of
the cell the enzyme becomes detached and is able to go back for more food. The
permeases produced by cells are specific to certain substrates. Consequently, if the
food cannot by utilized by one cell, it passes from cell to cell until one utilizes it or it
passes out the effluent. This is why a biological system must be acclimated and why
a varied group of microorganisms is required to breakdown a complex mixture of
organic matter such as wastewater.
The conversion step is the second step towards the formation of activated sludge. The
conversion step includes oxidation and synthesis. These two reactions make up the
metabolic process. Metabolism is a life process involving a series of reactions in which
some molecules are broken down and others are being formed. Metabolism can be
divided into two parts: anabolism, or reactions involving the synthesis of compounds, and
catabolism, or reactions involving the breakdown of compounds. Essential protein
molecules which catalyze biochemical reactions are called enzymes. Some enzymes are
within the cell (endocellular) and some are secreted to the outside (exocellular).
For a cell to grow and reproduce it requires a source of energy and carbon for the
synthesis of new cells. If an organism derives its cell carbon from carbon dioxide it is
call autotrophic. If it uses organic carbon it is called heterotrophic. Respiration is the
process of deriving usable energy from high energy molecules. Bacteria capture and store
energy in the chemical bonds of “energetic” compounds such as adenosine triphosphate
(ATP). ATP is built up in special structures within the cells called mitochondria.
The reactions which take place during respiration are called oxidation-reduction. This
involves the transfer of one or more electrons between two atoms. The first step involves
the loss of an electron and is called an oxidation reaction while the second step involves
the gain of an electron and is called a reduction reaction.
The biodegradation of organic matter found in wastewater by microorganisms has been
viewed as a three-phase process with a portion of the removed organic matter being
oxidized to supply energy and a portion being synthesized to new cells together with a
subsequent oxidation of the new cells. These reactions can be illustrated by the following
equations:
Notes on Activated Sludge Process Control Page 6
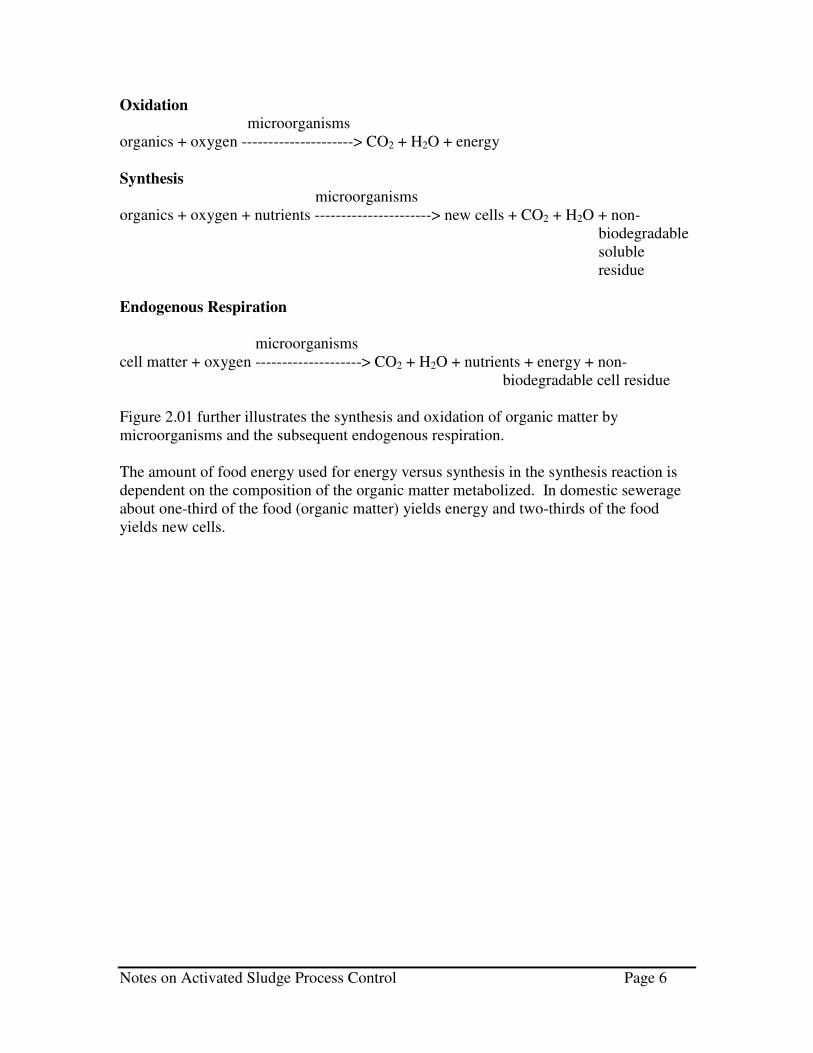
Oxidation
microorganisms
organics + oxygen ---------------------> CO2 + H2O + energy
Synthesis
microorganisms
organics + oxygen + nutrients ----------------------> new cells + CO2 + H2O + non-
biodegradable
soluble
residue
Endogenous Respiration
microorganisms
cell matter + oxygen --------------------> CO2 + H2O + nutrients + energy + non-
biodegradable cell residue
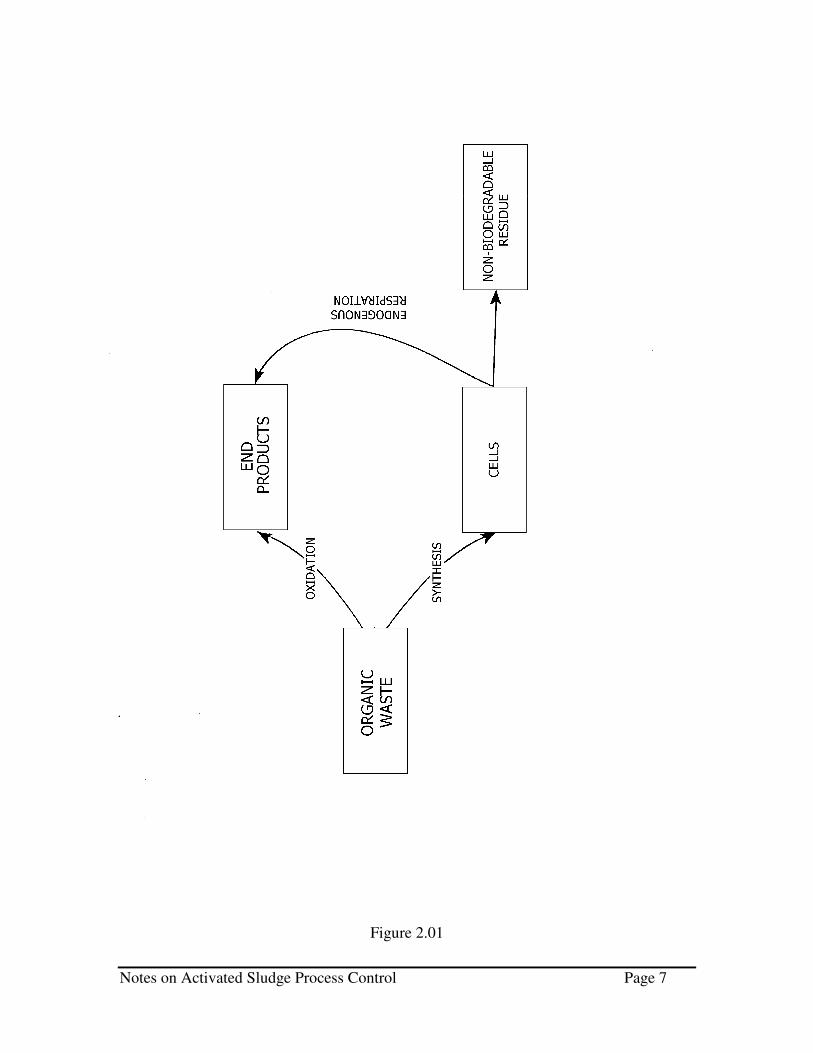
Figure 2.01 further illustrates the synthesis and oxidation of organic matter by
microorganisms and the subsequent endogenous respiration.
The amount of food energy used for energy versus synthesis in the synthesis reaction is
dependent on the composition of the organic matter metabolized. In domestic sewerage
about one-third of the food (organic matter) yields energy and two-thirds of the food
yields new cells.
Notes on Activated Sludge Process Control Page 7
Figure 2.01

Notes on Activated Sludge Process Control Page 8
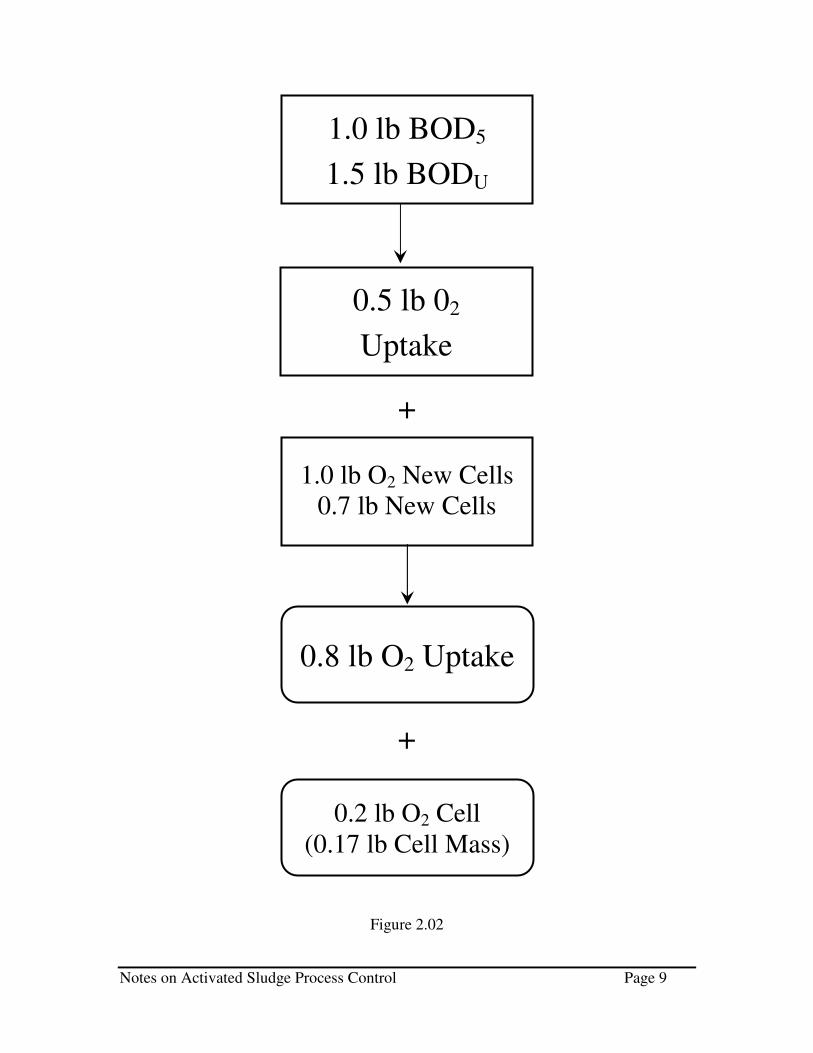
Therefore, in the synthesis reaction:
1.0 lb BOD5 -------> 0.5 lb O2 uptake + 1.0 lb O2 new cells
(Note: 1.0 lb BOD5 = 1.5 lb BODu)
In the endogenous respiration reaction:
1.0 lb cells ----------> 0.8 lb O2 uptake + 0.2 lb O2 cell residue
Since,
C5H7NO2 (cells) + 5O2 ----------> 5CO2 + 2H2O + NH3
MW=113 MW=160
160 = 1.42 lb O2/lb SS
113
The extreme possible oxygen requirements and solids production are:
Oxygen Required Solids Production
(lb O2/lb BOD5 removed) (lb SS/lb BOD5 removed)
Synthesis 0.5 0.7
Endogenous
Respiration 1.3 0.14
Figure 2.02 further illustrates the energy conversion.
Although it is important for bacteria to utilize the available substrate in wastewaters as
efficiently as possible, it is also necessary to form solids that can be easily separated from
the liquid in the final clarifier. The third step in the formation of activated sludge is the
flocculation step.
This bio-flocculation or floc-formation is not totally understood, however, it is believed
to result, in part, from the production of extra cellular polymers (polysaccharides) by the
cells as the cell age increases. Eventually, the cell becomes encapsulated in this slime
layer, which then helps promote the formation of bacterial floc particles by enabling the
individual bacteria cells to “stick” together. As cells in the sludge age and die, the floc
can break-up and new cells attach. However, if there are too many “old” cells in the floc
(a high sludge age), it becomes difficult to get good floc formation and we get a turbid
effluent. If, however, the bacterial cells grow too fast (a low sludge age) the cell surface
area increases more quickly than the ability for the cell to cover it with a good slime
layer, consequently, a low density floc with a lot of entrapped water develops, and it
separates poorly from the liquid in the final clarifier.
Notes on Activated Sludge Process Control Page 9
1.0 lb BOD5
1.5 lb BODU
0.5 lb 02
Uptake
1.0 lb O2 New Cells
0.7 lb New Cells
+
+
Figure 2.02
0.8 lb O2 Uptake
0.2 lb O2 Cell
(0.17 lb Cell Mass)

Notes on Activated Sludge Process Control Page 10
Therefore, an optimum “sludge age” exists which provide an adequate separation of the
cell mass from the liquid. For a specific system the optimum sludge age can be
determined by plotting the sludge volume index (SVI) versus the sludge age (see Figure
2.03). Figure 2.04 shows the SVI versus the F:M ratio.
In order to better understand the activated sludge process, which normally runs in a
continuous flow mode, it is beneficial to first look at the process in a batch operation.
This is done by taking a container of biologically degradable wastewater and aerating it
with an air stone to provide sufficient oxygen and mixing energy. Measuring the number
of microorganisms at constant time intervals, and plotting these numbers versus time, we
get what is known as the growth curve. The growth curve has five distinct phases (see
Figure 2.05).
These are:
1. Adaptation (Lag) Phase – This portion of the curve represents the time
required for the organisms to acclimate themselves to the organic material
present in the wastewater. The numbers of bacteria are not increasing,
however, a shift in the population of the different species of bacteria in the
wastewater is occurring so that the bacteria that can best utilize these organic
materials become predominate.
2. Log Growth Phase – Once the bacteria have “adapted”, only the number of
organisms present limit the rate of growth. Because bacterial cells reproduce
by binary fission (i.e., cell division – one cell divides and becomes two, these
two divide and become four, then eight, sixteen … ), this is known as
logarithmic growth. Food is not a limiting factor for growth in this phase, that
is, for each cell formed enough food is present to allow it to grow and divide.
3. Declining Growth Phase – In this phase food becomes a limiting factor to the
growth of the bacterial cell mass because not every bacterium that is formed
has the food required to grow.
4. Maximum Stationary Phase – Here the available food is just sufficient to keep
the cell mass at a constant level with a rate of growth equal to zero.
5. Endogenous (Cell Death) Phase – When the supply of food becomes
insufficient to maintain the bacterial mass at a constant level, the
microorganisms are forced to metabolize their own protoplasm.
Microorganisms may be classified according to the source of their energy and carbon
requirements. Chemolithotrophs oxidize inorganic substances for their energy needs,
whereas, chemoorganotrophs oxidize organic substances for their energy. Heterotrophs
use organic substances as a carbon source for making cell materials, whereas, autotrophs
use carbon dioxide as the source of carbon. Most of the microorganisms in activated
sludge are chemoorganotrophic and heterotrophs.

Notes on Activated Sludge Process Control Page 11
Figure 2.03

Notes on Activated Sludge Process Control Page 12
Figure 2.04

Notes on Activated Sludge Process Control Page 13
Figure 2.05

Notes on Activated Sludge Process Control Page 14
There are essential elements required for nutrition and they are often classified as 1)
major elements, 2) minor elements, 3) trace elements and 4) growth factors.
The major elements are carbon, hydrogen, oxygen, nitrogen and phosphorus. The minor
elements are sulfur, potassium, sodium, magnesium, calcium and chlorine. The trace
elements are principally iron, manganese, cobalt, copper, boron, zinc, molybdenum and
aluminum. The growth factors include vitamins and amino acids. Generally, in
municipal wastewater all of the essential elements and growth factors are present. Some
industrial wastewaters may be deficient in nitrogen or phosphorus. As a general rule of
thumb, 5 pounds of nitrogen and 1 pound of phosphorus are required for each 100 pounds
of BOD removed.
Another important classification of microorganisms pertains to their respiration
requirements. Microorganisms may be classified as aerobic, anaerobic or facultative.
In aerobic respiration the hydrogen (or electron) acceptor is molecular oxygen and the
end product is water.
organics + bacteria + O2 -------> more bacteria + CO2 + H2O + end products
In anoxic and anaerobic respiration, the hydrogen (or electron) acceptor is combined
oxygen in the form of radicals (carbonate, nitrate, sulfate and organic compounds) and
the end products (for anaerobic respiration) are methane, ammonia, hydrogen sulfide or a
reduced organic compound.
organics + combined O2 + bacteria --------> more bacteria + CO2 + H2O + end
products
The table below shows the energy released during aerobic, anoxic and anaerobic
respiration. As can be seen, more energy is released during aerobic respiration, therefore,
biochemical reactions will take precedence in the order of most to least energy released.
Electron Acceptor By-products Energy Released
O2 CO2 25.3 kcal
Nitrate N2 23.7 kcal
Sulfate H2S 1.5 kcal
CO2 CH4 0.9 kcal
All organisms naturally seek conditions yielding the greatest amount of energy for their
life processes.
Notes on Activated Sludge Process Control Page 15
There are several environmental factors that affect microbial activity. They may be
classified as physical, chemical or biological. Three of the important physical factors are
temperature, osmotic pressure and oxygen/mixing.
Temperature has a tremendous effect on the rate of cell growth. An increase in
temperature of 10oC (within the range of temperature that bacteria can grow) can
approximately double the rate of cell growth and substrate utilization. Microorganisms
may be classified according to their optimum temperature range as psychrophils,
mesophils, and thermophils, which have respective optimum temperature ranges of 0 to
10oC, 10
o to 45
oC and 45
o to 75
oC.
Because microorganisms feed by osmosis, the osmotic pressure, which is dependent upon
the salt concentration, must be within a certain range. Most microbes are not affected by
salt concentrations between 500 to 35,000 mg/L. In general, a dissolved oxygen of 1.0 to
2.0 mg/L is best for maintaining efficient, healthy microorganisms. If the D.O. drops
below 1.0 mg/L, and especially below 0.5 mg/L, aerobic treatment efficiency will suffer.
A well-mixed aeration basin will keep the microorganisms in suspension and increase the
contact of the microbes with the food source.
The major chemical factors are 1) pH, 2) the presence of acids and bases, 3) the presence
of oxidizing and reducing agents, 4) the presence of heavy metals, and 5) certain
chemicals.
The pH of the wastewater is important because bacteria grow best in a pH range of 6 to 9.
Outside of this range bacterial growth is inhibited. Bacteria can acclimate to long term
changes in pH and to a certain degree they can buffer the wastewater against variations in
pH because of the production of CO2 in the oxidation of organic matter. However, rapid
changes have severe detrimental impacts on bacterial growth. Toxic substances, (e.g.,
phenol, chlorinated hydrocarbons, heavy metals, halogens, acid and bases, etc.) inhibit
cell growth and substrate utilization even at very low concentrations. In general, the
toxicity of metal ions increases with an increase in atomic weight.
III. MICROORGANISMS
The principal microorganisms involved in the breakdown of organic matter in wastewater
are single-celled bacteria. Other microorganisms of importance in biological treatment
are: fungi, algae, protozoa, rotifers and nematodes. The predominant species are
determined by the characteristics of the influent, the environmental conditions, process
design and mode of operation.
Bacteria are small (0.5 – 1.0 microns by 1.0 – 5.0 microns), single-celled protista. They
grow in many shapes: round, rod, spiral, comma or budding. They are either aerobic,
anoxic or anaerobic. The majority of the bacteria in activated sludge are facultative, that
is, they can live in either aerobic or anoxic conditions. The bulk of the bacteria in
activated sludge prefer the pH to be between 6.5 and 9.0. Bacteria adsorb to soluble and
particulate wastewater solids and produce enzymes that break down those solids into
Notes on Activated Sludge Process Control Page 16
nutrient forms that can be absorbed into the cell. Floc-forming bacteria produce compact
flocs which settle well. Filamentous bacteria grow in either an open or bridging floc
structure. It is important for a strong floc to have some filaments growing through it to
act as a backbone. Excessive growth of filaments is known as filamentous bulking.
Floc-forming and filamentous bacteria compete for food, oxygen and nutrients, but differ
in the way they metabolize these compounds. Floc-forming bacteria prefer short
duration, high doses of food whereas filamentous bacteria prefer steady low doses. Floc-
forming bacteria can survive and, in some cases, prefer alternating aerobic and anoxic
conditions whereas some filamentous bacteria prefer low concentrations of dissolved
oxygen.
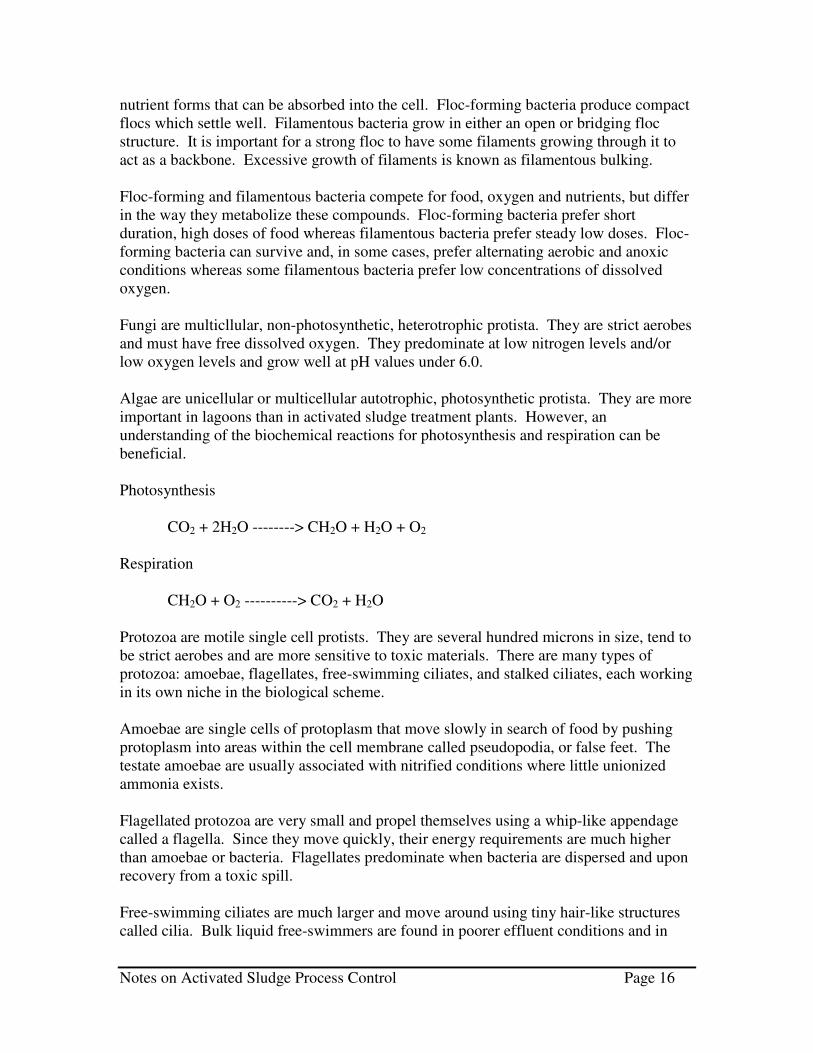
Fungi are multicllular, non-photosynthetic, heterotrophic protista. They are strict aerobes
and must have free dissolved oxygen. They predominate at low nitrogen levels and/or
low oxygen levels and grow well at pH values under 6.0.
Algae are unicellular or multicellular autotrophic, photosynthetic protista. They are more
important in lagoons than in activated sludge treatment plants. However, an
understanding of the biochemical reactions for photosynthesis and respiration can be
beneficial.
Photosynthesis
CO2 + 2H2O --------> CH2O + H2O + O2
Respiration
CH2O + O2 ----------> CO2 + H2O
Protozoa are motile single cell protists. They are several hundred microns in size, tend to
be strict aerobes and are more sensitive to toxic materials. There are many types of
protozoa: amoebae, flagellates, free-swimming ciliates, and stalked ciliates, each working
in its own niche in the biological scheme.
Amoebae are single cells of protoplasm that move slowly in search of food by pushing
protoplasm into areas within the cell membrane called pseudopodia, or false feet. The
testate amoebae are usually associated with nitrified conditions where little unionized
ammonia exists.
Flagellated protozoa are very small and propel themselves using a whip-like appendage
called a flagella. Since they move quickly, their energy requirements are much higher
than amoebae or bacteria. Flagellates predominate when bacteria are dispersed and upon
recovery from a toxic spill.
Free-swimming ciliates are much larger and move around using tiny hair-like structures
called cilia. Bulk liquid free-swimmers are found in poorer effluent conditions and in

Notes on Activated Sludge Process Control Page 17
activated sludge systems that yield turbid effluents. Crawlers are found in medium aged
activated sludge and are usually associated with better effluent quality.
The stalked ciliates are very energy efficient and are found in high numbers in effluents
of very good quality.
Rotifers are much larger multicellular animals which are generally strict aerobes.
Nematodes and annelids (bristle worms) are multicelluar worms. Nematodes occur in
higher sludge age systems. Bristle worms (and water bears) occur in nitrifying systems.

Notes on Activated Sludge Process Control Page 18
IV. ACTIVATED SLUDGE PROCESS MODIFICATIONS
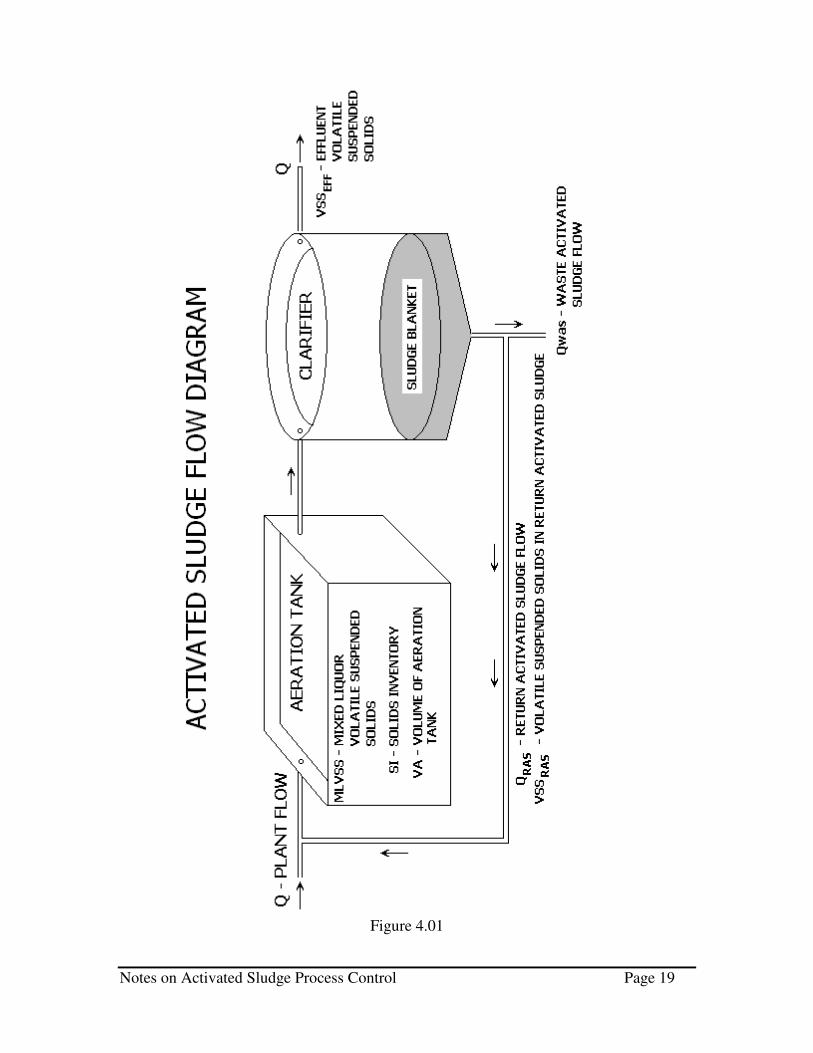
The basic activated sludge process has several interrelated components. These
components are (see Figure 4.01):
1. aeration tank
2. aeration source
3. clarifier,
4. recycle, and
5. waste
Aeration tank. A single tank or multiple tanks designed generally for either complete
mix or plug flow with a detention time of as little as 2 hours and up to over 24 hours.
The contents of the aeration tank are referred to as mixed liquor.
Aeration source. Generally either diffused air or surface mechanical aeration used to
supply oxygen and mix the aeration tank contents.
Clarifier. A settling tank where the mixed liquor solids are separated from the treated
wastewater. Most treatment plants employ several secondary clarifiers.
Recycle. Solids that settle in the clairifier and are returned to the aeration tank.
Waste. Excess solids that must be removed from the system.
There are three classic variations of the activated sludge process – high rate, conventional
rate, and extended aeration (see Appendix B).
High rate systems have short-term aeration times (2-4 hours) and higher F:M ratios.
These systems must be operated more carefully because the shorter aeration times make
the system more sensitive to washouts.
Conventional is used to define a system of intermediate loading. Plants operating in the
middle range do not nitrify.
Extended aeration plants are characterized by long aeration time (24 hours), high mixed
liquor concentrations, high sludge retention times, total oxygen requirements are higher
and nitrification may occur. The losses of pin floc and heat are common problems.
Notes on Activated Sludge Process Control Page 19
Figure 4.01
Notes on Activated Sludge Process Control Page 20
Process loading ranges for the activated sludge process are as follows:
Process Aeration BOD F/M Return
(hrs.) #/1000 cu.ft. %
High 2-3 100 1.0 100
Conventional 4-8 30-40 0.2-0.5 25-75
Extended 18-30 10-20 0.01-0.15 50-100
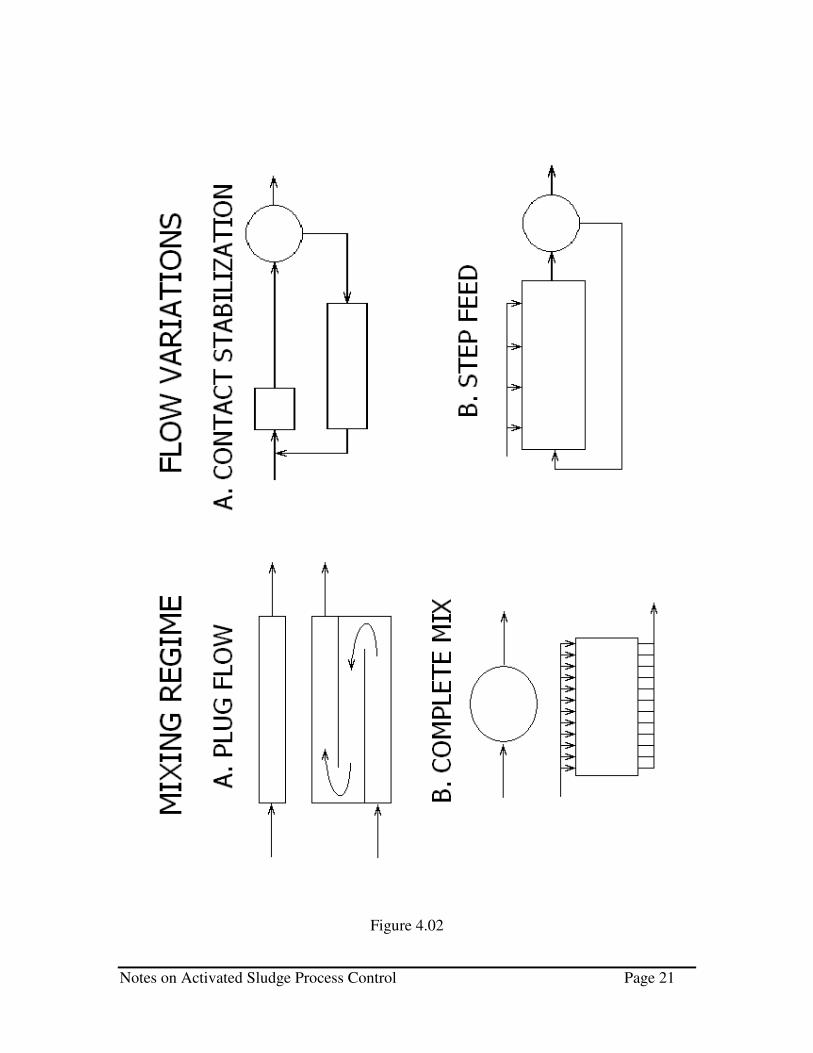
Within these three loading ranges, the mixing regime and flow patterns can be varied (see
Figure 4.02).
Mixing regime:
The complete mix activated sludge process was developed in 1927 to address high
organic and/or toxic loads. In this system, the characteristics of the mixed liquor
are similar throughout the aeration tank. From an operational point of view, tanks
with detention time of 2 to 4 hours can be considered as complete mix. Since
there is a low level of food available to a large mass, complete mix is able to
handle large surges of organic loading.
Plug flow is defined as flow in which individual particles of feed pass through the
reactor vessel in the same sequence they entered. Long, narrow tanks approach
plug flow. This process was developed in 1917 at the Lawrence Experimental
Station.
Flow variations:
In 1951, Ullrick & Smith developed the contact stabilization process. Contact
stabilization uses a short-term contact tank and a sludge stabilization tank with
about six times the detention time used in the contact tank.
Step feed is a modification of the plug flow configuration in which influent is fed
at two or more points along the length of the aeration tank. This process was
developed in New York City in the mid 1930s.
Step Aeration involves distributing the influent wastewater in a stepwise fashion
from the influent to the effluent end.
Tapered Aeration involves distributing the air proportional according to the air
demands from the influent to the effluent end.
As a general rule, plug flow is used under the most lightly loaded conditions. Step feed is
used as the organic or hydraulic load increases. Contact stabilization is used under peak
hydraulic or organic load.
Notes on Activated Sludge Process Control Page 21
Figure 4.02

Notes on Activated Sludge Process Control Page 22
V. SOLIDS ACCUMULATION
Solids will accumulate in activated sludge systems unless they are constantly wasted.
This accumulation results from: 1) the removal of applied BOD, 2) the production of new
cells through synthesis, and 3) the removal of inert materials. Offsetting this
accumulation are: 1) the endogenous respiration of the new cells, 2) the loss of solids out
the effluent, and 3) intentional wasting.
Mass balances can be used to mathematically define this accumulation. In words, the
equation for mass balance is:
accumulation = inflow – outflow + net growth
For solids mass, lbs/day = (flow, mgd)(solids, mg/L)(8.34)
For primary clarifiers, the accumulation of solids is assumed to be zero or the sludge
blanket will increase and the net growth is zero because there is no bio-conversion,
therefore:
inflow = outflow
Q = 1.0 mgd Q = 0.95 mgd
SS = 200 mg/L SS = 100 mg/L
Q = 0.05 mgd
SS = 2100 mg/L
For an activated sludge system, the accumulation of biological solids can be expresses as:
accumulation = inflow – outflow + net growth – endogenous decay
= QXo – QX + Um X S - KdX V
Ks + S
where, Kd = endogenous decay coefficient
V= reactor volume
Q = flow rate
Xo = concentration of microorganisms, influent
X = concentration of microorganisms in reactor
Um = maximum specific growth rate
Ks = half velocity constant
S = concentration of the growth-limiting substrate

Notes on Activated Sludge Process Control Page 23
Assuming steady state, accumulation = 0
Assuming negligible influent solid, Xo = 0
V
Q1
KSK
SmU
V
Qd
S
=θ
−+
=
Where θ = hydraulic detention time
mass of cells in reactor
mass of cells wasted
Where θc = mean cell residence time
Substituting θc for θ
where,
θc = mean cell residence time
Y = sludge yield coefficient
F/M = food to mass ratio
Kd = endogenous coefficient
See Figure 5.01 for a diagram of the derivation of F/M & MCRT relationship.
Note: Growth is related to loading (F/M) and the sludge age. Also control of the F/M
ratio implies control of the sludge age (SRT) and vice versa.
x
xC
Q
V=θ
dc
S
m
dS
m
K)M/F(Y1
)M/F(YSK
SULet
V
Q1
KSK
SU1
−=θ
∴
=+
=θ
−+
=

Notes on Activated Sludge Process Control Page 24
DERIVATION OF F/M & MCRT RELATIONSHIP
1. KINETICS EXPLAINS BIOCHEMICAL
REACTIONS FOR GROWTH
2. EQUATIONS FOR
GROWTH RATE ASSUMES GROWTH IS LINEAR TO
AVAILABE FOOD
3. EQUATIONS FOR MASS
BALANCE STEADY STATE
4. SLUDGE YIELD ACTIVE SYSTEM BIOMASS
5. 1/MCRT = Y × F/M - Kd
WHERE: MCRT = Mean Cell Residence Time
Y = Sludge Yield Coefficient
F/M = Food to Mass Ratio
Kd = Endogenous Coefficient
Figure 5.01

Notes on Activated Sludge Process Control Page 25
Figure 5.02
Figure 5.03
From the relationship above the net growth of biological solids per pound of
organic loading can be given as:
Process lb solids/lb BOD
High 0.50
Conventional 0.40 – 0.50
Extended 0.15 – 0.30
In addition to the net growth of biological solids, activated sludge systems will
accumulate inert solids from the non-biodegradable raw influent TSS. These inert
solids are represented by the inert fraction of the incoming solids and the non-
biodegradable solids (generally 40 percent of the volatile fraction).

Notes on Activated Sludge Process Control Page 26
Example: Calculate the total solids production (accumulation) in an extended aeration
plant.
Given: TSS = 100 lbs/day
VSS = 85 lbs/day
BOD = 100 lbs/day
Solution: Accumulation = net growth + inert + non-biodegradable
Example: Calculate the total solids production (accumulation) in a high rate plant.
Given: TSS = 100 lbs/day
VSS = 85 lbs/day
BOD = 100 lbs/day
Solution: Accumulation = net growth + inert + non-biodegradable
day/lbs69
)TSSday/lbs100(100
854.0)TSSday/lbs100(
100
85100)BODday/lbs100(2.0
=
××+×−
+×=
An example can be used to illustrate the concepts of sludge inventory, F/M SRT, and
solids production.
Example: Calculate the F/M, SRT, and solids production.
Given: F = 100 lbs/d
M = 300, 100, 1000
Y = 0.55
Kd = 0.02
Solution:
1a) F/M = 100/300 = 0.33
1b) 1/SRT = Y(F/M) – Kd
SRT = 1/0.55(0.33) – 0.02
SRT = 6.2 days
1c) solids accumulation = Y(F) – M(Kd)
= 0.55(100) – 300(0.02)
= 49 lbs
Notes on Activated Sludge Process Control Page 27
1d) SRT = M/W
= 300/49
= 6.1 days
2a) F/M = 100/100 = 1.0
2b) SRT = 1/0.55(1.0) – 0.02 = 1.9 days
2c) solids accumulation = 0.55(100) – 100(0.02) = 53 lbs
2d) SRT = M/W = 100/53 = 1.9 days
3a) F/M = 100/1000 = 0.01
3b) SRT = 1/(0.55(0.1) – 0.02) = 28.6 days
3c) solids accumulation = 0.55(100) – 1000(0.02) = 35 lbs
3d) SRT = M/W = 1000/35 = 28.6 days
In this example, the aeration tank MLSS (M) at a given loading (F) is varied from 300,
100 to 1000 lbs. As shown, the F/M ratio varies from 0.33 (conventional), to 1.0 (high)
and finally to 0.1 (extended). At these three loading rates, the net growth of biological
solids (W) is 49 lbs., 53 lbs., and 35 lbs., respectively. This represents 0.49, 0.53 and
0.35 pounds of solids per pound of BOD.

Notes on Activated Sludge Process Control Page 28
VI. COMPLETE MIX ACTIVATED SLUDGE EQUATIONS1
Developed by McKinney the following equations apply to a complete mix activated
sludge systems in the declining growth phase.
The unmetabolized substrate in the effluent is calculated as follows:
F = Fi
Kmt + 1 6.1
Where F = unmetabolized BOD in the effluent, mg/L
Fi = influent BOD, mg/L
Km = metabolism factor, 7.2/hr at 20oC
t = raw waste aeration time, hour
The value F represents only the unmetabolized substrate in the effluent and does not
include excess microbial solids carryover.
Effluent BOD is computed from the following equation:
BODeff = F + KbMaeff 6.2
where BODeff = BOD in effluent, mg/L
F = unmetabolized BOD from Equation 6-1
Kb = 0.8 (BOD factor)
Maeff = active microbial mass in the effluent, mg/L of VSS
The Maeff for Equation # can be calculated as follows:
Maeff = Mteff X Ma
MT 6.3
Where Mteff = total suspended solids in effluent, mg/L
Ma = active microbial mass, mg/L of VSS
MT= mixed liquor suspended solids, mg/L
Composition of the mixed liquor suspended solids in the aeration basin is determined by
the following equation:
MT = Ma + Me + Mi + Mii 6.4
Where MT = mixed liquor suspended solids, mg/L
Ma = active microbial mass, mg/L of VSS
Me = endogenous respiration mass, mg/L VSS
1 John W. Clark, Warren Viessman Jr., Mark J Hammer, Water Supply and Pollution Control, IEP-A Dun-
Donnelley Publisher, 1977

Notes on Activated Sludge Process Control Page 29
Mi = inert, nonbiodegradable organic suspended solids, mg/L
Mii = inert, inorganic suspended solids, mg/L of nonvolatile SS
Ma, Me, Mi, Mii are calculated as follows:
Ma = KsF
Ke - (1/ts) 6.5
Me = 0.2 KeMats 6.6
Mi = Miinfts/t 6.7
Mii = Miiinfts/t + 0.1(Ma + Me) 6.8
where Ks = synthesis factor, 5.0/hr at 20oC
Ke = endogenous respiration factor, 0.02/hr at 20oC
F = unmetabolized BOD
ts = sludge turnover time, hours
ts = lb of MLSS in aeration tank
lb of SS in effluent and waste sludge/day +/- lb of SS change in mixed
liquor /day
Miinf = nonbiodegradable organic suspended solids in influent, approximately
40% of the VSS in normal domestic wastewater, mg/L of VSS
Miiinf = inert suspended solids in influent, mg/L of nonvolatile SS
t = raw waste aeration time, hour
The metabolism factor, Km, synthesis factor, Ks, and endogenous respiration factor, Ke,
are all temperature dependent. Values for these factors at temperatures other than 20oC
may be determined using the following relationship:
KT = K20(1.072)T-20
6.9
where KT = Km, Ks, or Ke at temperature T (oC)
K20 = Km, Ks, or Ke at 20oC
The oxygen utilization rate of mixed liquor in the aeration tank is calculated by the
following equation:
Notes on Activated Sludge Process Control Page 30
dO = 1.5(Fi – F) - 1.42(Ma + Me) 6.10
dt t ts
Where dO/dt = oxygen utilization rate, mg/l/hr
Fi = influent BOD, mg/L
Figure 6.01 illustrates the relationship between the various solids makeup concentration
versus sludge age.

Notes on Activated Sludge Process Control Page 31
Figure 6.01

Notes on Activated Sludge Process Control Page 32
VII. SOLIDS SEPARATION
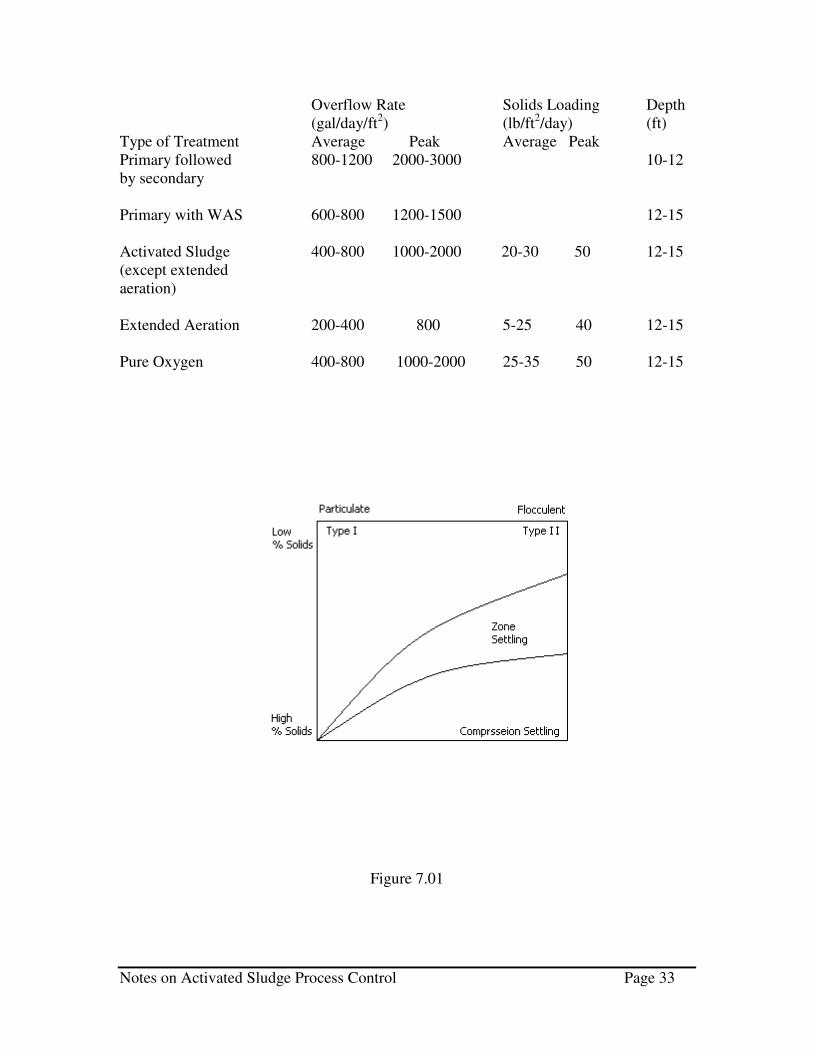
Type I sedimentation is concerned with the removal of non-flocculent, discrete particles
in dilute suspension. Under such conditions, the settling is called “unhindered” and is a
function only of fluid properties and the characteristics of the particle. The settling of
heavy inert matter, such as grit, is an example of this type of sedimentation.
Type II is applicable to dilute suspensions of flocculating particles, such as primary
solids. In this case, heavier particles with large settling velocities overtake and coalesce
with smaller particles to form still larger particles with increased rates of settling. The
chance of particle contact increases with the depth of the settling tank. As a result, both
overflow rate and the depth of the settling tank are important whereas Type I
sedimentation depends on overflow rate only.
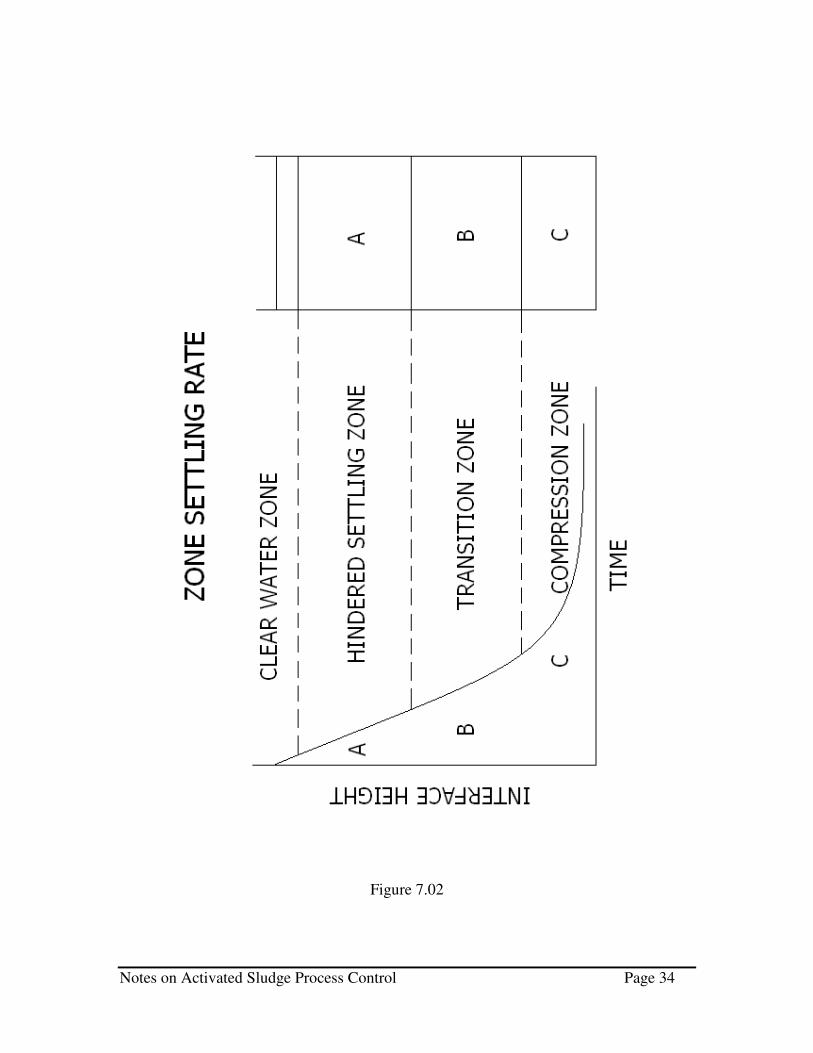
Zone Settling and Compression type of settling is characterized by activated sludge when
the solids concentration exceeds approximately 500 mg/L. In such cases, the sludge
settles at a uniform velocity initially which is a function of the initial solids
concentration. Then a zone of transition occurs when the settling velocity decreases due
to the increasing concentration of solids. Finally, a compression zone develops as the
rising layer of settled sludge reaches the solid-liquid interface. Under these conditions,
the particle is supported in part by the structure formed by the compacting mass.
In the separation of flocculent suspensions, both clarification of the liquid overflow and
thickening of the sludge underflow are involved. The overflow rate for clarification
should be such that the average rise velocity of the liquid overflowing the tank is less
than the zone settling velocity of the suspension. The degree of thickening of the
underflow to a desired concentration determines the tank surface area required and it is
related to the solids loading to the unit. The thickening requirement is expressed in terms
of mass loading (lb solids/ft2/day) or a unit area (ft
2/lb solids/day).
overflow rate = Q = gpd/ft2
surface area, ft2
solids loading = (Q, gpd + Qr, gpd)(MLSS, mg/L)(8.34)
surface area, ft2
Note: The only controllable variable in the equation above is Qr, return sludge flow.
Notes on Activated Sludge Process Control Page 33
Overflow Rate Solids Loading Depth
(gal/day/ft2) (lb/ft
2/day) (ft)
Type of Treatment Average Peak Average Peak
Primary followed 800-1200 2000-3000 10-12
by secondary
Primary with WAS 600-800 1200-1500 12-15
Activated Sludge 400-800 1000-2000 20-30 50 12-15
(except extended
aeration)
Extended Aeration 200-400 800 5-25 40 12-15
Pure Oxygen 400-800 1000-2000 25-35 50 12-15
Figure 7.01
Notes on Activated Sludge Process Control Page 34
Figure 7.02
Notes on Activated Sludge Process Control Page 35
VIII. SOLIDS FLUX THEORY2
Secondary clarifiers have three primary functions: clarification, thickening and storage.
In general, the clarification function is satisfied as long as the thickening function is
fulfilled. This generalization does not hold true if the mixed liquor is experiencing
deflocculation, dispersed growth and pin floc. These conditions are the result of
environmental factors in the aeration basin and usually cannot be corrected in the
clarifier. Given this situation, the primary goal of secondary clarifier operation should be
to satisfy the thickening function. The solids flux analysis is the best tool for evaluating
settling characteristics which affect thickening.
Both gravity settling and bulk flow (recycle flow) carry solids to the bottom of an
activated sludge clarifier. Figure 8.01 below shows the important aspects of solids flux
theory.
Equation 8.1 indicates that the flux resulting from gravitational settling (Gs) is a function
of the solids concentration (Ci) and the settling velocity (vi).
Gs = CivI 8.1
2 Datastream System Incorporated, Performance Pac Manual, 1990

Notes on Activated Sludge Process Control Page 36
Figure 8.01
Notes on Activated Sludge Process Control Page 37
The settling velocity is dependent on the following factors:
• solids concentration
• temperature
• system organic loading
• aeration basin DO
It is important to evaluate the settling characteristics of the sludge frequently because of
the effects of these variables. The accumulation of historical data provides a useful tool
for predicting clarification problems.
As shown is equation 8.2 the bulk flux (GB) is dependent on the solids concentration and
the bulk downward velocity (u) imposed by the recycle.
GB = Ciu 8.2
The bulk velocity is a function only of recycle flow rate and, therefore, is a controllable
process variable.
The total flux, as represented in equation 8.3, is the sum of the bulk and settling fluxes.
GT = GS + GB = Ci(vi + u) 8.3
As the sludge thickens from the MLSS concentration to that of the underflow, it passes
through all intervening concentrations. One of these concentrations is critical to clarifier
operation and defines the solids handling capacity or limiting flux, GL. Equation 8.4
defines the applied flux GA which represents the biosolids sent to the clarifier.
GA = Co(QI + QR)/CSA 8.4
where: Co = aeration basin MLSS concentration
QI = influent flow rate
QR = clarifier recycle flow rate
CSA = clarifier surface area
The sludge blanket rises when the applied flux (GA) exceeds the solids handling
capacity. If the condition persists, the solids blanket can rise and solids will be
discharged out the effluent.
The previous equations do not consider the wastage flow rate as contributing to bulk
flow. The more limiting condition occurs when wastage is not additive to recycle.
Wastage is usually a small part of the clarifier sludge removal rate. In highly
concentrated waste streams wastage should be considered. For this condition, the bulk
downward velocity results from the sum of recycle rate and wastage rate.

Notes on Activated Sludge Process Control Page 38
GB = Ci(u + w) 8.5
where: wastage flow rate (w) is the continuous rate of sludge wastage
The state point method is one of the most useful techniques for evaluating the solids
handling capacity of secondary clarifiers. This method uses a curve representing the
gravitational settling characteristics and two operating lines to define feasible operating
conditions.
The two operating lines constitute a graphical material balance on solids constrained by
the settling characteristics defined by the flux curve. The Y axis of the graph represents
the gravitational flux in lbs/sq.ft.-day. The X axis represents the MLSS concentration in
mg/L. A sample curve is shown in Figure 8.02.
The overflow line begins at the origin and has a slope equal to the plant influent flow rate
(Qi) divided by the clarifier surface area (CSA) on line. The slope is expressed in feet
per day. The overflow rate is the influent flow rate minus the wastage rate divided by the
clarifier surface area on line. Since the wastage rate the generally small in comparison to
the influent flow, the approximation does not cause an appreciable error.
The intersection of overflow rate operating line and a vertical line drawn from the
aeration basin MLSS concentration is known as the state point. The state point acts as a
pivot point for the second operating line. The seconds line represents recycle flow rate
from the clarifier to the aeration basin. The slope of the recycle flow rate operating line
is equal to the negative of the recycle rate (QR) divided by the clarifier surface area on
line, or the negative of the bulk velocity (-u). The intersection of the recycle rate
operating line with the X axis represents the predicted clarifier underflow MLSS
concentration.
The clarifier is under loaded and operates successfully when the shaded area confined by
the two operating lines is completely below the flux curve. The clarifier is overloaded
and solids will be transferred from the aeration basin to the clarifier if a portion of the
shaded area lies above the flux curve. The sludge blanket will rise and the applied flux,
which is directly related to the MLSS concentration, will decrease. After the applied flux
decreases the system will stabilizes with a lower MLSS and a higher sludge blanket.
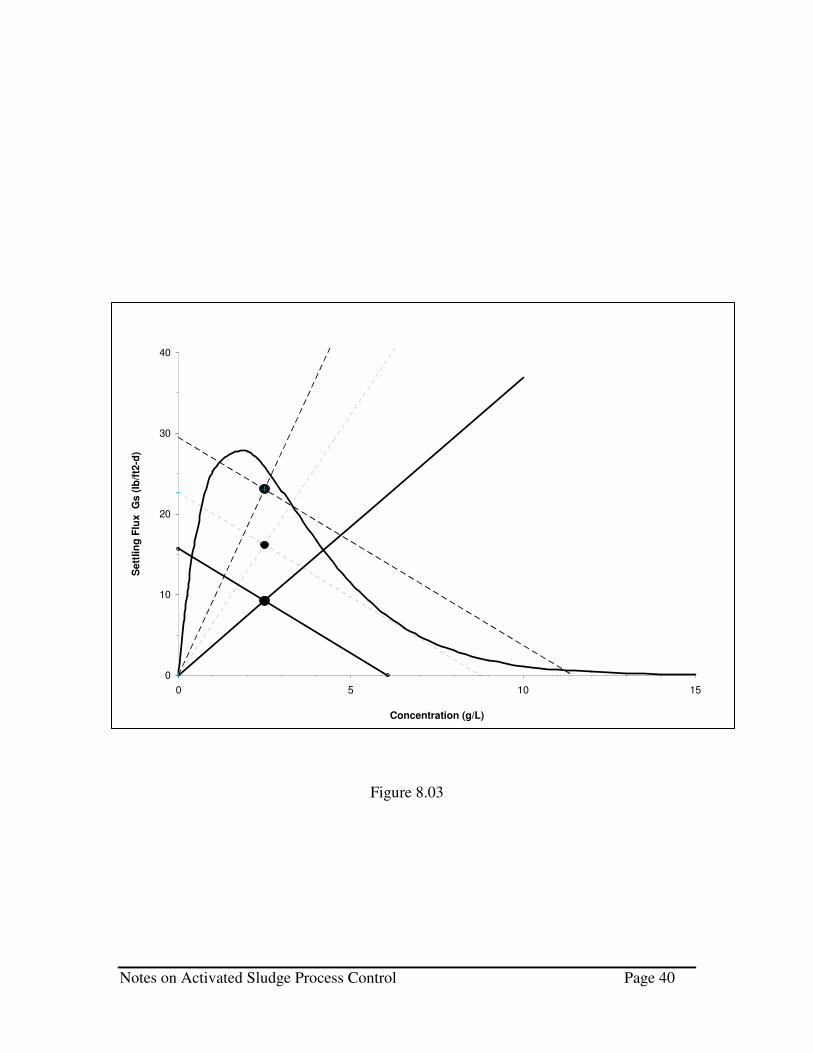
Operational changes are readily seen by the state point approach. The variation in
influent flow rate is illustrated in Figure 8.03. As the flow rate increases from Q11 to
Q12, the recycle flow operating line moves upward and become critically loaded. An
applied flux greater than these results in the transfer of solids from the aeration tank to
the secondary clarifier. As the flow increase to Q13 the recycle operating line moves
above the flux curve which results in an overloaded clarifier.
The effects of recycle rate changes are illustrated by Figure 8.04. Qr1 depicts the
underloaded condition while Qr2 depicts a critically loaded condition and Qr3 depicts an

Notes on Activated Sludge Process Control Page 39
Figure 8.02
Notes on Activated Sludge Process Control Page 40
Figure 8.03
0
10
20
30
40
0 5 10 15
Concentration (g/L)
Sett
lin
g F
lux
Gs
(lb
/ft2
-d)

Notes on Activated Sludge Process Control Page 41
Figure 8.04
0
10
20
30
40
0 5 10 15
Concentration (g/L)
Se
ttli
ng
Flu
x
Gs (
lb/f
t2-d
)

Notes on Activated Sludge Process Control Page 42
overloaded condition. Decreasing the recycle flow rate increases the underflow
concentration and lowers the pumping costs. However, these benefits cause lower
limiting flux thereby less solids handling capacity. Optimizing the performance means
selecting the lowest recycle rate with an acceptable margin of safety.
An increase in organic loading generally means an increase in the MLSS concentration.
The state point analysis can be used to evaluate an increase in the MLSS concentration.
As shown in Figure 8.05 the clarifier goes from an underloaded condition to an
overloaded condition as the MLSS increases. As illustrated the overflow rate line
remains unchanged because the influent flow rate remains the same. Also, the recycle
rate does not change therefore the slope on the recycle operating line remains constant.
However the position of the recycle operating line changes because as the MLSS
increases the state point moves upward.
Many changes can occur that results in deterioration of the sludge settling characteristics
(see Figure 8.06). This deterioration results in changes in the shape and position of the
gravity flux curve. As a result of these changes a clarifier can go from an underloaded to
an overloaded condition at constant MLSS, influent flow and recycle flow (see Figure
8.06).
IX. MASS BALANCE
Where is the Sludge?
How long has it been there?
How much sludge is there?
Sludge Units Definition
Pounds
Concentration X Volume in MG X 8.34
(concentration in mg/L)
Aerator Sludge Inventory (ASI)
ASI, lb = MLSS, mg/L X Volume, MG X 8.34 9.1
Clarifier Sludge Inventory (CSI)
CSI, lb = CSC, mg/L X Volume, MG x 8.34 9.2
Total Sludge Inventory (TSI)
TSI, lb = ASI, lb + CSI, lb 9.3

Notes on Activated Sludge Process Control Page 43
Figure 8.05
0
10
20
30
40
0 5 10 15
Concentration (g/L)
Se
ttli
ng
Flu
x
Gs (
lb/f
t2-d
)

Notes on Activated Sludge Process Control Page 44
Figure 8.06
0
5
10
15
20
25
30
35
40
45
50
0 5,000 10,000 15,000 20,000 25,000 30,000

Notes on Activated Sludge Process Control Page 45
Return Activated Sludge (RAS)
RAS, lb/day = RASSS, mg/L X RSF, MG X 8.34 9.4
Waste Activated Sludge (WAS)
Sludge Wasted from the system.
WAS, lb/day = WSC, mg/L X WSF, MGD X 8.34 9.5
Effluent Solids Lost (ESL)
Sludge lost in the effluent
ESL, lb/day = TSS, mg/L X Q, MGD X 8.34 9.6
Solids Inventory Lost (SIL)
Intentionally wasted sludge = WAS
Effluent Solids Lost = ESL
Sludge Inventory Lost
SIL, lb/day = WAS, lb/day + ESL, lb/day 9.7
SIL, lb/day = (WSC, mg/L X WSF, MGD X 8.34) + (Q, MGD X TSS, mg/L X 8.34)
Mean Cell Residence Time (MCRT)
MCRT, days = _________TSI, lb_______
WAS, lb/day + ESL, lb/day 9.8
Clarifier Solids Detention Time (SDTc )
SDTc, hours = __CSI X 24__
RAS, lb/day 9.9
RSF and WSF are measured separately from the same draw-off point in the clarifier.
SDTc, hours = ____________CSI, lb X 24______________
(RSF + WSF), MGD X RASSS, mg/L X 8.34 9.10
RSF and WSF are measured from separate draw-off points in the clarifier

Notes on Activated Sludge Process Control Page 46
SDTc, hours = _____CSI, lb X 24____
(RAS + WAS), lb/day 9.11
Aeration Solids Detention Time (SDTa)
SDTa, hours = ___________ASI, lbs X 24___________
(Q + RSF), MGD X MLSS, mg/L X 8.34 9.12
Oxidation Pressure
OXP = MLSS, mg/L X SDTa 9.13
X. NITRIFICATION
Nitrogen in the Environment
• atmosphere
• the Earth's crust
• hydrosphere
• tissues of living and dead organisms
Nitrogen compounds
Compound Formula Oxidation
State
Ammonia NH3 -3
Ammonium ion NH4+ -3
Nitrogen gas N2 0
Nitrite ion NO2- +3
Nitrate ion NO3- +5
Fixation: Fixation of nitrogen means the incorporation of inert gaseous nitrogen into a
chemical compound such that it can be used by plants and animals.
N2 ----> biological ----> organic nitrogen
----> lighting -----> nitrate
----> industrial ----> ammonium, nitrate

Notes on Activated Sludge Process Control Page 47
Ammonification: Ammonification is the change from organic nitrogen to the ammonium
form. An important hydrolysis reaction involves urea. In general, ammonification
occurs during decomposition of animal and plant tissue.
organic nitrogen + microorganisms ----> NH3/NH4+
Synthesis: Synthesis is a biochemical mechanism that used ammonium or nitrate
compounds to form plant protein and other nitrogen-containing compounds.
NO3- + CO2 + green plants + sunlight ----> protein
NH3/NH4+ + CO2 + green plants + sunlight ----> protein
Nitrification: Nitrification is the biological oxidation of ammonium. This is done in two
steps, first to the nitrite form, then to the nitrate form. Two specific chemoautotrphic
bacterial genera are involved, using inorganic carbon as their source of cellular carbon.
NH4+ + O2 ------------> NO2
- + O2 ----------> NO3-
ammonium Nitrosomonas nitrate Nitrobacter nitrite
Nitrogen is most often found in wastewater as ammonia and organic nitrogen in the form
of amines and other nitrogenated compounds. During the wastewater treatment process,
organic nitrogen is converted to ammonia by ammonifying bacteria. Ammonia is
removed in activated sludge processes by 1) stripping to the atmosphere (this can be
significant at pH above 8), 2) assimilation into bacteria cells, and 3) bacterial nitrification
(which may be followed by denitrification). Nitrification is a naturally occurring, two-
step aerobic biological process in which autotrophic bacteria oxidize the ammonium ion
to nitrite or nitrate. In the first step, the ammonia is oxidized to nitrite by Nitrosomonas
bacteria.
Step 1:
NH4+ + 3/2 O2 ------> 2H+ + H20 + NO2
-
Oxygen Required = 3.43 lb/lb N oxidized
Alkalinity Required = 7.14 lb/lb N oxidized
Step 2:
Next, the nitrite is oxidized to nitrate by Nitrobacter bacteria.
NO2- + 1/2O2 ------> NO3
-

Notes on Activated Sludge Process Control Page 48
For both reactions together:
Total oxygen requirement = 4.57 lbs/lb N oxidized
Total alkalinity requirement = 7.14 as CaCO3/lb N oxidized
From the reactions above it can be seen that oxidation of ammonia to nitrite produces
acid. Once released by the bacteria, the acid reacts immediately with different forms of
alkalinity. This tends to decrease the pH of the mixed liquor.
The nitrification process requires a significant amount of oxygen, produces a small
amount of biomass, and results in substantial destruction of alkalinity through the
production of hydrogen ions
The factors that influence nitrification include: influent characteristics, dissolved oxygen,
BOD loading, detention time, pH/alkalinity, temperature, mass of nitrifying bacteria, and
a lack of toxins. Nitrification consumes a large amount of oxygen. In order for
uninhibited nitrification to occur, an operating D.O. level of 2.0 mg/L is suggested.
Nitrifying bacteria do not compete well against hetrotrophic bacteria for D.O. and
nutrients. Therefore, before nitrification can take place, the soluble BOD must be
sufficiently reduced to eliminate this competition, generally down to 20-30 mg/L. This
condition is usually achieved in activated sludge systems. In general, the longer the
detention time, the more likely that nitrification will occur. Activated sludge plants are
able to nitrify in 6 - 48 hours. Nitrification is enhanced at higher pH's where 7.5 - 8.5,
although nitrifying bacteria can adapt outside this range. Nitrification tends to produce
acids and alkalinity is consumed at a rate of 7.14 lbs CaCO3/lb NH3 oxidized. Therefore,
sufficient alkalinity must be present to buffer the acids produced during nitrification.
Alkalinity concentrations less than 150 mg/L inhibit both nitrification. The rate of
nitrification is greatly influenced by temperature. As the temperature increases, the rate
of nitrification increases. Temperatures greater than 20 degrees up to about 35 degrees C
enhance nitrification. Nitrification slows down dramatically or may stop altogether at
around 5 degrees C. In the winter activated sludge plants get down to 0 degrees C.
Nitrobacter is more temperature sensitive than Nitrosomonas. With decreasing
temperature, Nitrobacter growth decreases resulting in decreased nitrification and a
build-up of NO2-.
A very important factor is that a sufficient population of nitrifying bacteria must be
present in order to complete nitrification. These bacteria are attached growth organisms,
meaning that they must attach themselves to the surface of an object. In an activated
sludge plant, the surface is a floc particle. In a trickling filter or RBC, the surface is the
artificial media. In lagoons and ponds, it is believed that nitrifiers may attach to
sideslopes, baffles and algal particles.
Nitrifying bacteria are more sensitive to inhibitory compounds, such as heavy metals,
than are the BOD reducing bacteria, thus the nitrifying bacteria would be the first ones to
die off. Nitrifying bacteria are found in the soil and enter the waste treatment system

Notes on Activated Sludge Process Control Page 49
through infiltration and inflow. During the winter, when the ground is frozen, less
nitrifying bacteria will be coming into the system.
Should any of the factors necessary for complete nitrification be missing or in limited
supply, the nitrification cycle may not go to completion during the time the wastewater is
contained in the treatment process. This phenomenon, called "partial nitrification",
leaves ammonia and/or residual nitrite in the effluent. The residual ammonia and nitrite
will exert an oxygen demand during the “standard” BOD test when sufficient numbers of
nitrifying bacteria are present in the test sample.
Nitrifiers grow slowly compared to most other bacterial populations and therefore must
be retained in the treatment process for a relatively long period of time. The nitrifying
bacteria are mixed together with all other mixed liquor suspended solids. Therefore, their
total retention time in the treatment process is the same as that for the rest of the activated
sludge. The variable describing the total retention time of nitrifiers in the treatment
process if the mean cell residence time (MCRT).
MCRT = Mass of MLSS in the System
Mass of WAS + Mass of Eff. TSS
In treatment processes that include unaerated reactors in addition to aerated reactors, it is
useful to compute the specific amount of time that nitrifiers spend in the aerated reactors.
This is termed the oxic SRT. The equation for computing oxic SRT is:
OXIC SRT = Mass of MLSS under aeration
Mass of WAS + Mass of Eff. TSS
The appropriate oxic SRT for a treatment process depends on how fast the nitrifiers can
grow under the environmental conditions of the process. As discussed already, important
environmental conditions include dissolved oxygen concentration, pH, and temperature.
(See appendix Q for SRT calculations)
The conditions which promote nitrification in activated sludge treatment systems are:
1. Low BOD loading;
2. Adequate D.O. (1.0 – 2.0 mg/L);
3. Optimum pH (6.0 – 7.5);
4. Adequate temperature (5o – 45
o C);
5. Long solids retention time (2 days or more); and,
6. Adequate MLVSS (1500 mg/L)
Denitrification is the biological reduction of nitrate to nitrogen gas. A fairly broad range
of heterotrophic bacteria are involved in the process, requiring an organic carbon source
for energy.
6NO3- + 5CH3OH ----� 5CO2 + 3N2 + 7H2O + 6OH
- + cells
Notes on Activated Sludge Process Control Page 50
Alkalinity produced = 3.57 lbs as CaCO3 per lb nitrate denitrified
Oxygen recovered = 2.86 lb per lb nitrate denitrified
For denitrification to occur, specific environmental conditions must be met. Most of the
varieties of bacteria which can denitrify are facultative. However, if they have a choice
they will get their energy from aerobic respiration because they get more energy with less
effort. Therefore, anoxic (oxygen absent, nitrate present) conditions must be created for
denitrification to occur. A small amount of denitrification can occur with DO present if
the centers of the floc particles become anoxic.
The second critical factor for the reaction to occur is a source of carbon. A common
carbon source is methanol. Some systems are designed to use raw influent.
Denitrification rates also increase and occur at low MCRT’s as the water temperature
increases. The optimum pH for denitrification is 7 to 8.
Nitrogen gas is relatively insoluble in water and forms small bubbles when produced in
the denitrification process. These bubbles can attach to floc particles and float them to
the surface. Denitrification in a clarifier can increase effluent turbidity and cause
significant accumulation of scum and floating sludge on the surface.
In wastewater treatment the cycling of nitrogen is very important. The control of the
activated sludge process is important in this cycling. Figure 10.01 depicts the cycle
through which nitrogen travels in the wastewater treatment process.
The control strategies for nitrification/denitrification are not always successful and may
result in further complications. First, you must identify whether
nitrification/denitrification is required. The most common control strategies if
nitrification/denitrification is not required are:
1. Increase recycle rate. This does keep the sludge off the bottom of the clarifier and
limits denitrification. Unfortunately a thin sludge may result, and the floc is
susceptible to damage by mechanical aerators.
2. Increase wasting rate. An increase wasting rate does reduce the SRT and thus
reduce nitrification. Unfortunately, a poor settling sludge may result.
3. Limit the dissolved oxygen. Nitrification is an aerobic process which requires a
lot of oxygen (4.6 lbs of oxygen per lb. of ammonia nitrogen converted).
Limiting the oxygen does not promote the microbes that are also required for
carbonaceous BOD removal.
The proper monitoring of an activated sludge system is essential to the troubleshooting
process. A simple and inexpensive method for monitoring nitrification and
denitrification is alkalinity. Theorectically 7.14 mg of alkalinity is destroyed per mg of
NH3-N oxidized. Dentrification produces 3.57 mg of alkalinity per mg of nitrate

Notes on Activated Sludge Process Control Page 51
Figure 10.01
Wastewater Nitrogen Cycle
Organic
Nitrogen
- NH3
Atmospheric
Nitrogen
- N2
Nitrite
Nitrogen
- NO2-
Nitrate
Nitrogen
- NO3-
Ammonia
Nitrogen
- NH4+

Notes on Activated Sludge Process Control Page 52
converted to N2. Thus, by monitoring the changes in alkalinity in the influent and
effluent of the aeration basin, it is possible to estimate the extent of nitrification.
Monitoring the pH of the aeration basin and comparing BOD5 results with and without
nitrifying inhibiters can also be used to determine the nitrifying state of the system.
The oxidation-reduction-potential (ORP) relates to measuring the effects of growth. The
ORP uses a pH meter with either a specific ORP probe or a combination pH/ORP probe.
The millivolt scale on the meter indicates ORP. The ORP measures the relative amount
of oxidized versus reduced materials in the system (or capability of the sludge to gain or
release electrons). For instance oxygen or O2 represents the upper end of the oxidation
scale and moves the ORP into the positive or plus range. A positive ORP shows the
system has potential to gain electrons, but nitrate is also an oxidized form of nitrogen and
adds to the positive value. Thus, if there is nitrate and dissolved oxygen available, the
ORP should be positive and large, probably 200-400 mV. Any nitrogen as ammonia will
cause that value to be lower. Any anaerobic conditions will make the value lower yet. A
negative ORP shows the system has electrons to release and contains little dissolved
oxygen or nitrate.
In 1992, Goronszy and his coworkers developed a chart relating the ORP to various
biological processes. Appendix K shows eight different biological growth activities and
the range of ORP within which that activity occurs. For instance oxidation of organic
carbon proceeds when the ORP is between approximately +50 and +225 mV while
nitrification may occur between +100 and +325 mV. If anoxic conditions prevail, the
ORP would range from about -50 and +50 mV. Thus, by periodic readings of the ORP at
the end of the aeration tank and at the clarifier weirs, an operator can tell the amount of
nitrification and denitrification in the aeration tank and clarifier.3
XI. PROCESS CONTROL – What can be controlled?
The use of test data in a logical sequence of reactions to modify a process and maintain a
specified result is a process control strategy.
Before we discuss process control strategies, we need to understand that there are many
interrelated factors that limit the performance of wastewater treatment plants.
Performance limiting factors at wastewater treatment facilities can be broadly grouped in
administration, design, operation and maintenance. Administration, design and
maintenance all lead to a plant physically capable of achieving the desired performance.
It is operation, or more specifically the process control that takes a physically capable
plant and produces a good effluent. Figure 11.01 illustrates the relationship between
physical limitations and operations (or process control).
3 ORP discussion taken from materials produced by Ronald Schuyler.

Notes on Activated Sludge Process Control Page 53
Figure 11.01
Effluent Quality
Environmental Conditions
Operations (Process Control)
Capable Plant
Administration Maintenance Design
Notes on Activated Sludge Process Control Page 54
Given a plant that is physically capable including controllability of plant components,
control strategies cannot be effective unless the plant operator:
1. monitors the process, and
2. utilizes the data to make logical decisions.
But, first we need to identify the variables which the operator has control over.
In the early years of activated sludge the general consensus was that the flocculated solids
were the result of biological activity, and that these flocculated solids use oxygen. This
represented a major breakthrough, because a relationship of oxygen to biological material
represented a firm and distinct control mechanism for activated sludge. The concept of
sludge production provided another major control mechanism for the process. We now
call this production the sludge yield. Therefore, the second major control variable of the
activated sludge process is the wasting of excess solids or wasting the yield from the
process. A third major control variable that emerged was the return of settled sludge
from the clarifiers to the aeration tank.
Figure 11.02, a diagram of a typical activated sludge plant, identifies the three major
control mechanism for the activated sludge treatment process:
1. aeration rate,
2. return sludge rate, and
3. waste sludge rate.
Control of these three variables in addition to providing the proper environment
(physical, chemical, biological and nutritional requirements) all lead to good sludge
quality (see Figure 11.03).
XII. AERATION RATE CONTROL – What are the control strategies?
There are two major reasons for adding air to an aeration tank. One reason is to keep the
incoming wastewater and the activated sludge mixed. The other very important reason
for adding air to the aeration tank is to provide dissolved oxygen. Dissolved oxygen
(D.O.) is oxygen in water and is usually expressed in parts per million (ppm) or
milligrams per liter (mg/L). Oxygen is not very soluble in water. At 20oC (68
oF), only
9.2 mg/L of oxygen can be dissolved into the water.
Oxygen supply in an aeration tank must satisfy two needs: oxygen demand and residual
D.O. Oxygen demand is the mass of oxygen required to meet BOD and nitrification,
whereas, the required residual D.O. is the oxygen needed to provide an environment that
produces good sludge quality.
In general, aeration rates which provide a D.O. of between 1.0 to 2.0 mg/L are best for
maintaining efficient, healthy activated sludge organisms. The actual D.O. concentration
Notes on Activated Sludge Process Control Page 55
Figure 11.02

Notes on Activated Sludge Process Control Page 56
Figure 11.03

Notes on Activated Sludge Process Control Page 57
required depends on the F:M ratio. At high F:M ratios, the oxygen uptake rate is high
and oxygen is depleted quickly from the bulk solution. This creates oxygen stress and
therefore a higher D.O. residual is required at higher F:M ratios.
If the D.O. drops below 1.0 mg/L and especially below 0.5 mg/L, treatment efficiency
will suffer. On the other hand, if the D.O. is maintained above 2.0 mg/L, a large amount
of power is being wasted. Therefore, careful measurement and control of D.O. in the
aeration tank is necessary.
Most aeration tanks will not have D.O. concentrations that are constant throughout the
tank. There will be locations of high or low D.O. called stratification. Therefore, an
aeration tank D.O. profile is necessary. A D.O. profile should be run 3 to 4 times per
year and should include different times of the day.
Aeration rate control simply means using the D.O. profile information and adjusting the
location of aerators or air flow rates to maintain the desired level of residual D.O.
There are many factors that may affect the oxygen requirements of the microorganisms in
the aeration tank. One of the important relationships is between the influent BOD (food)
and the oxygen demand.
As the influent BOD entering the aeration tank increases, the amount of oxygen required
to maintain a desired level of D.O. also increases.
Another important relationship to remember involves the oxygen demand (utilized) and
the degree of endogenous respiration.
As the endogenous respiration increases (extended aeration), the amount of oxygen
required also increases. In other words, the oxygen uptake rate is decreased, but the total
amount of oxygen increases due to the increased biomass needs for respiration.
The oxygen uptake test is one of the process control tools available to the operator.
Besides monitoring the health of the biomass and its ability to treat wastes, the oxygen
uptake test can also be used to calculate the oxygen consumption of the biomass. The
oxygen consumption can be compared against the capacity of the aeration system. This
may help determine if additional aeration capacity is required or if some other process
adjustment is needed. See Appendix H for OUR/SOUR test procedures.
The fed and unfed tests use the simple OUR test on simulated sludges. Once the two
tests have been completed, a ratio of fed over unfed is calculated. If the ratio is less than
1.0, a toxic effect is shown since the fed would be using oxygen slower than the unfed. A
value of 1-2 is found with very dilute influents or with wastes that contain slowly
degradable materials. A ratio between 2-5 is usually normal for a domestic waste while a
value above 5.0 indicates extremely high loading. Industrial waste can greatly affect this
ratio and their effects must be evaluated on a plant by plant basis. See Appendix H for
fed/unfed test procedures.

Notes on Activated Sludge Process Control Page 58
XIII. RETURN SLUDGE RATE CONTROL
Return sludge is the liquid pumped from the bottom of the final clarifier back to the
aeration tank. If the liquid was not pumped from the bottom of the final clarifier, the
solids would get deeper and deeper and deeper and soon flow over the effluent weirs.
The return sludge is pumped back to the aeration tank to return the live, hungry bugs on
the bottom of the clarifier back to the aeration tank to continue eating the incoming food.
The objective of return rate control is to optimize the distribution of solids between the
aeration tank and final clarifier and to optimize both functions of the final clarifier:
clarification and thickening.
Clarification is defined as the separation of solid particles and liquid. Thickening is
defined as the increase in solid concentration in which particles move closer to each
other.
To illustrate the objectives of return sludge rate control, let us consider what happens if
the return was shut off:
- The sludge blanket would begin to rise and soon solids would go over the effluent
weirs.
- The aeration basin solids level would decrease and result in an insufficient number of
bugs to eat the incoming BOD.
- The solids in the final clarifier would quickly become anaerobic.
What would happen if the return was full open:
- The sludge on the bottom would be very thin.
- The increased return rate would increase the solids loading and decrease the settling
time in the clarifier.
As you can see, the optimum rate is somewhere between full open and turned off. To
begin discussing return rate control, we need to review typical return rates for various
types of activated sludge processes as a percent of the incoming wastewater flow.
Process Average Lower Upper
Limit Limit
Conventional 30 15 75
Extended 100 50 200
Contact Stabilization 100 50 150
There are two basic methods for returning sludge to the aeration tank.
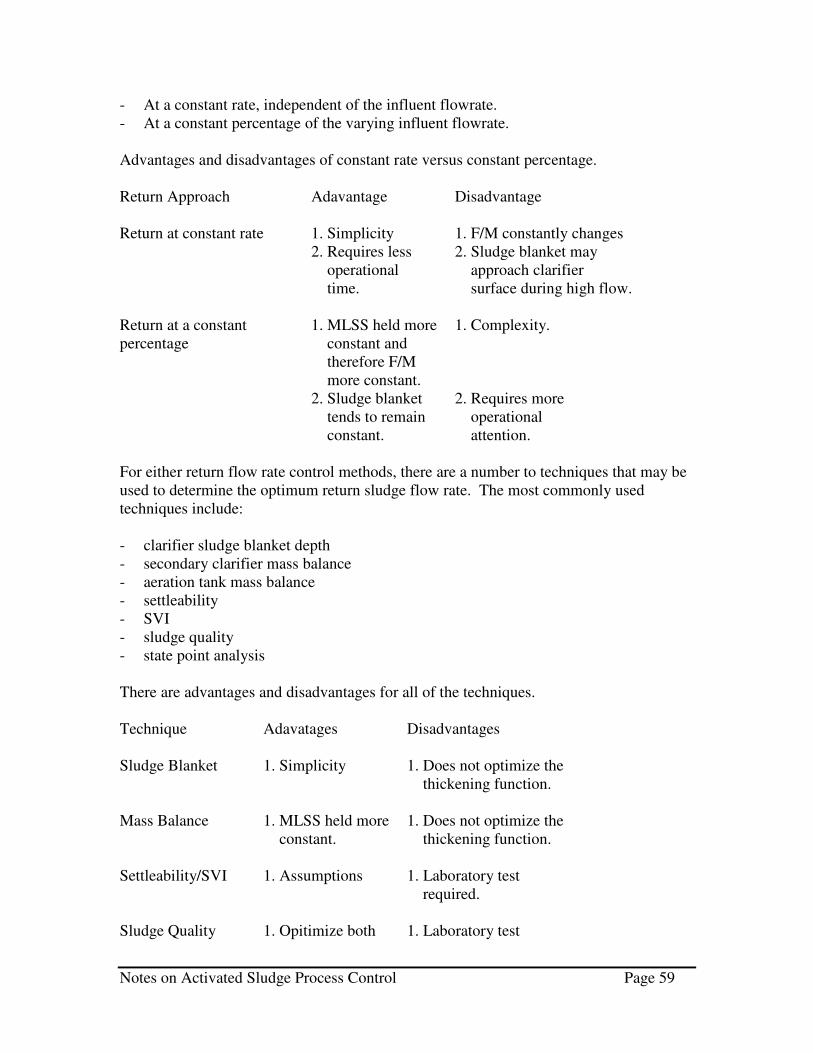
Notes on Activated Sludge Process Control Page 59
- At a constant rate, independent of the influent flowrate.
- At a constant percentage of the varying influent flowrate.
Advantages and disadvantages of constant rate versus constant percentage.
Return Approach Adavantage Disadvantage
Return at constant rate 1. Simplicity 1. F/M constantly changes
2. Requires less 2. Sludge blanket may
operational approach clarifier
time. surface during high flow.
Return at a constant 1. MLSS held more 1. Complexity.
percentage constant and
therefore F/M
more constant.
2. Sludge blanket 2. Requires more
tends to remain operational
constant. attention.
For either return flow rate control methods, there are a number to techniques that may be
used to determine the optimum return sludge flow rate. The most commonly used
techniques include:
- clarifier sludge blanket depth
- secondary clarifier mass balance
- aeration tank mass balance
- settleability
- SVI
- sludge quality
- state point analysis
There are advantages and disadvantages for all of the techniques.
Technique Adavatages Disadvantages
Sludge Blanket 1. Simplicity 1. Does not optimize the
thickening function.
Mass Balance 1. MLSS held more 1. Does not optimize the
constant. thickening function.
Settleability/SVI 1. Assumptions 1. Laboratory test
required.
Sludge Quality 1. Opitimize both 1. Laboratory test

Notes on Activated Sludge Process Control Page 60
clarification & required.
thickening
functions.
State Point Analysis 1. Opitimize both 1. Complexity
clarification &
thickening
functions.
Clarifier Sludge Blanket Depth. Monitoring the depth of the sludge blanket in the
clarifier is both quick and easy. The sludge depth should be checked on a routine basis at
the same time (preferably during the period of maximum flow). The blanket depth
should be kept to less than two feet. The blanket should never be allowed to rise beyond
25% of the nominal sidewall depth of the tank.
Secondary Clarifier Mass Balance. The mass balance approach is useful for calculating
the return sludge flowrate necessary to maintain the solids distribution. However, it does
assume that the system is operating at a steady state and that the sludge blanket in the
secondary clarifier is constant. A side benefit of the mass balance approach is that, in
plants without functioning return sludge metering, the return flow can be estimated from
the measured mixed liquor and return concentrations. The calculations are based on a
mass balance of suspended solids that enter and leave the secondary clarifier.
Solids entering the secondary clarifier can be estimated as:
Solids in, lbs/day = (MLSS)(Q + Qr)(8.34 lbs/gal)
where:
MLSS = mixed liquor suspended solids, mg/L
Q = influent flow, mgd
Qr = return flow, mgd
Assuming negligible solids in the effluent, the solids leaving equals:
Solids out, lbs/day = (RASSS)(8.34 lbs/gal) + (WASSS)(Qw)(8.34 lbs/gal)
where:
RASSS = return sludge suspended solids, mg/L
WASSS = waste sludge suspended solids, mg/L
Qw = waste sludge flow rate, mgd
Mass Balance:
(MLSS)(Q + Qr)(8.34 = (RASSS)(Qr)(8.34) + (WASSS)(Qw)(8.34)
(MLSS)(Q + Qr) = (RASSS)(Qr) + (WASSS)(Qw)

Notes on Activated Sludge Process Control Page 61
(MLSS)(Q) + (MLSS)(Qr) = (RASS)(Qr) = (WASSS)(Qw)
(MLSS)(Q) – (WASSS)(Qw) = (RASSS – MLSS)(Qr)
Qr = (MLSS)(Q) – (WASSS)(Qw)
RASSS – MLSS
Example: Calculate the return sludge flow rate, Qr
Given:
Q = 1.0 mgd
Qw = 0.01 mgd
MLSS = 2500 mg/L
RASSS = 8000 mg/L
WASSS = 8000 mg/L
Solution:
Qr, mgd = (2500)(1.0) – (8000)(0.01)
8000 – 2500
= 0.44 mgd
Aeration Tank Mass Balance. From an aeration tank mass balance the solids entering the
tank will equal the solids leaving the tank if new cell growth is considered negligible.
The solids which enter the tank are estimated by:
Solids in, lbs/day = (RASSS)(Qr)(8.34 lbs/day)
Solids out, lbs/day = (MLSS)(Q + Qr)(8.34 lb/day)
Mass balance:
(Qr)(RASSS)(8.34) = (MLSS)(Q + Qr)(8.34)
Qr = (MLSS)(Q)
RASSS – MLSS
Settleability. The setteability test can be used to estimate the desirable sludge return rate.
This method uses the sludge volume in a 2-liter settleometer at the end of 30 minutes
settling. The underflow, Qr, is given according to the following equation:
Qr = (SSV)(Q)
1000 –SSV
where,
SSV = volume of settled sludge after 30 minutes, ml/L

Notes on Activated Sludge Process Control Page 62
Example: Calculate the return sludge flow, Qr
Given: SSV 300 ml/L
Q = 1.0 mgd
Solution:
Qr = (300)(1.0)
1000 – 300
= 0.43 mgd
SVI. The SVI method is a mass balance approach using the SVI to estimate the
suspended solids concentration in the return. Using this technique, Qr is given as:
Qr = (MLSS)(Q)
1,000,000 – MLSS
SVI
where:
SVI = (SSV30)(1000)
MLSS, mg/L
Example: Calculate the return sludge flow, Qr
Given: SVI = 120
Q = 1.0 mgd
MLSS = 2500 mg/L
Solution:
Qr = (1.0)((2500)
1,000,000 - 2500
120
0.43 mgd
Sludge Quality. Al West of the U.S. EPA developed a method using the information
from the settleability test and the sludge solids concentration. The figure 13.01 below
shows three general types of sludge settleability: normal, rapid and slow.
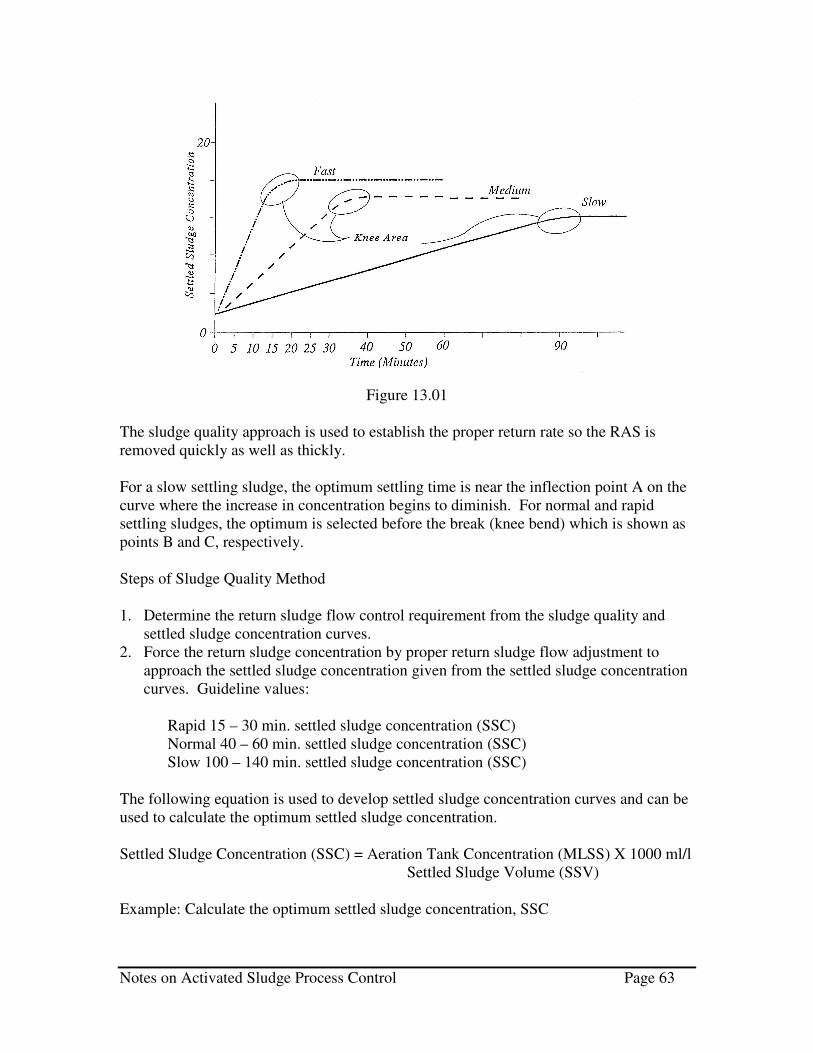
Notes on Activated Sludge Process Control Page 63
Figure 13.01
The sludge quality approach is used to establish the proper return rate so the RAS is
removed quickly as well as thickly.
For a slow settling sludge, the optimum settling time is near the inflection point A on the
curve where the increase in concentration begins to diminish. For normal and rapid
settling sludges, the optimum is selected before the break (knee bend) which is shown as
points B and C, respectively.
Steps of Sludge Quality Method
1. Determine the return sludge flow control requirement from the sludge quality and
settled sludge concentration curves.
2. Force the return sludge concentration by proper return sludge flow adjustment to
approach the settled sludge concentration given from the settled sludge concentration
curves. Guideline values:
Rapid 15 – 30 min. settled sludge concentration (SSC)
Normal 40 – 60 min. settled sludge concentration (SSC)
Slow 100 – 140 min. settled sludge concentration (SSC)
The following equation is used to develop settled sludge concentration curves and can be
used to calculate the optimum settled sludge concentration.
Settled Sludge Concentration (SSC) = Aeration Tank Concentration (MLSS) X 1000 ml/l
Settled Sludge Volume (SSV)
Example: Calculate the optimum settled sludge concentration, SSC

Notes on Activated Sludge Process Control Page 64
Given: From the daily settleability curves the optimum settling time is t = 40 min., SSV
at the end of 40 min. = 280 ml/L, ATC = 2500 mg/L, RSC = 8,000 mg/L.
Calculate SSC at 40 min.
SSC40 = (2500)(1000)
280
= 8,930 mg/L
In this example, the actual RSC of 8,000 mg/L is more dilute than the calculated
optimum of 8930 mg/L, therefore, the return sludge flowrate should be decreased to
concentrate the return until it approaches the optimum.
SUMMARY NOTES ON RETURN SLUDGE RATE CONTROL
1. The basic control strategy is: 1) maintain a optimal distribution of solids between the
aeration tank and the secondary clarifier (solids belong in the aeration tank), 2) return
the solids to the aeration tank quickly (avoid anaerobic conditions), and 3) optimize
the sludge concentration (thickly).
2. Check your plant’s current return sludge flowrate versus typical rates given for your
mode of operation.
3. Select an appropriate control method (i.e., constant rate or constant percentage),
4. All plants should monitor the sludge blankets,
5. Return rate changes should be made whenever: 1) the average daily flow changes, or
2) the sludge settling characteristics change.
6. In most plants, there is a limit to how low the return sludge flowrate can be reduced
before the return sludge piping plugs up.
7. Return sludge flow rate changes should be limited to +/- 15 to 25 percent per day.
8. System response to RAS flow changes are somewhat rapid. Normally, the system
responds within ½ the aeration detention time.
XIV. WASTE ACTIVATED SLUDGE CONTROL
Sludge wasting represents the operator’s greatest control adjustment. Sludge wasting
affects the following:
- solids inventory
- F/M and Sludge Age
- the production of biological solids
- oxygen consumption
- mixed liquor settleability
- nutrient quantities needed
- the occurrence of foaming
- the possibility of nitrification

Notes on Activated Sludge Process Control Page 65
The fundamental reason that wasting is required in the activated sludge process is the fact
that the net rate of MLSS cell formation exceeds the net rate of MLSS decay.
Accumulation = inflow – outflow + netgrowth – endogenous decay
These excess solids must be wasted in order to regulate the MLSS inventory at the
desired F/M range. In addition to biological growth, inert non-biodegreable solids from
the raw influent TSS tend to accumulate in the aeration basin and require wasting.
The objective of sludge wasting is to control the wasting rate to maintain steady state. In
other words: wasting equals the accumulation of solids (net growth + inert non-
biodegradable). If sufficient sludge is not wasted intentionally, it will waste itself in the
final effluent until a process equilibrium is reached.
An example can be used to illustrate the concepts of sludge inventory, F/M, SRT and
solids production.
Example: Calculate the F/M, SRT, and solids production.
Given: F = 100 lbs/day
M = 300, 100, 1000 lbs
Y = 0.55
Kd = 0.02
Solution: 1a) F/M = 100
300
= 0.33
1b) 1/SRT = Y(F/M) – Kd
SRT = 1
0.55(0.33) – 0.02
= 6.2 days
1c) solids accumulation = Y(F) – M(Kd)
= 0.55(100) – 300(0.02)
= 49 lbs
1d) SRT = M/W
= 300
49
= 6.1 days
2a) F/M = 100
100

Notes on Activated Sludge Process Control Page 66
= 1.0
2b) SRT = 1
0.5(1.0) – 0.02
= 1.9 days
2c) solids accumulation = 0.55(100) – 100(0.02)
= 53 lbs
2d) SRT = M/W
= 100
53
= 1.9 days
3a) F/M = 100
1000
= 0.1
3b) SRT = 1
0.55(0.1) – 0.02
= 28.6 days
3c) solids accumulation = 0.55(100) – 1000(0.02)
= 35 lbs
3d) SRT = M/W
= 1000
35
= 28.6 days
In this example, the aeration tank MLSS (M) at a given loading (F) is varied from 300,
100, to 1000 lbs. As shown, the F/M ratio varies from 0.33 (conventional), to 1.0 (high)
and finally to 0.1 (extended). At these three loading rates, the net growth of biological
solids (W) is 49 lbs., 53 lbs., and 35 lbs., respectively. This represents 0.49, 0.53 and
0.35 pounds of solids per pound of BOD.
Optimizing the activated sludge process depends on properly controlling the mass of
active microorganisms in relationship to the loading. The mass of microorganisms is
controlled by wasting solids. The four most common methods to determine the waste
sludge rates are:

Notes on Activated Sludge Process Control Page 67
- constant MLSS
- constant F/M
- constant sludge age (SRT, MCRT)
- sludge quality
Constant MLSS. This technique is simple to understand and involves a minimum of
laboratory work. It usually produces good quality effluent as long as the incoming
wastewater characteristics are fairly constant. The initial step to use this technique is to
determine the target MLSS concentration. The target MLSS should be selected by
monitoring the process, observing trends and considering seasonal effects. Once a target
MLSS is selected, the following procedure is used:
1. Measure the MLSS in each aeration tank, in mg/L, and average the results.
2. Measure the return sludge concentration, mg/L.
3. Calculate the mass to be wasted
MLSS to waste, lbs. = (Actual MLSS – Target MLSS)(V)(8.34)
where V = aeration tank volume in million gallons
4. Calculate the volume of WAS:
Qw = (MLSS)(1,000,000)
(RASSS)(8.34)
where Qw = WAS, million gallons
MLSS = mixed liquor suspended solids to waste, lbs
RASSS = return sludge concentration, mg/L
Example: Calculate the required wasting volume, Qw, based on constant MLSS.
Given:
Aeration tank volume = 50,000 gallons
Actual MLSS = 2833 mg/L
Target MLSS = 2500 mg/L
RASSS = 8000 mg/L
MLSS to waste, lbs = (2833 - 2500)(0.05)(8.34)
= 138.9 lbs
Qw, gals = (138.9)(1,000,000)
(8000)(8.34)
= 2080 gals
Constant F/M. This method requires a significant amount of laboratory work. Because it
takes 5 days to get the results of the BOD analysis, a correlation between BOD and COD
is desirable. Because it takes the process several days to fully respond to changes in
conditions, the actual F/M should be calculated using a 7-day moving average. The
target F/M should be within a desirable range to prevent upsets due to large swings in

Notes on Activated Sludge Process Control Page 68
wasting rates. For example: 0.02 units on either side of the target F/M for extended
aeration and 0.05 units on either side for conventional.
The F/M ratio is expressed as:
F/M = influent BOD, lbs/day
solids in the aeration tank, lbs
The example below shows how to calculate the wasting rate, Qw, to operate at a target
F/M.
Given: Target F/M = 0.39
Influent BOD, F = 346 lbs/day
Actual MLSS, M = 1181 lbs/day
MLVSS/MLSS = 0.85
RASSS = 8000 mg/L
Solution:
MLVSS to waste, lbs = actual MLVSS – influent BOD
target F/M
= 117 lbs
MLSS to waste = MLVSS to waste
MLVSS/MLSS ratio
117
0.85
= 138 lbs
Constant SRT. The solids retention time (SRT) is widely used and reliable. The SRT is
the average number of days that the microorganisms are kept under aeration. The
expression for SRT is:
SRT = Mass of solids under aeration
Mass of solids leaving the system
The mass of solids leaving the system is defined as:
solids out, lbs/day = SS wasted, lbs/day + SS in effluent, lbs/day
The mass of solids under aeration is given as:
(MLSS, mg/L)(V, mg)(8.34)
The expression for SRT becomes:
Notes on Activated Sludge Process Control Page 69
SRT = (MLSS)(V)(8.34)
(WASSS)(Qw)(8.34) + (ESS)(Q)(8.34)
where:
WASSS = waste activated sludge suspended solids, mg/L
ESS = effluent suspended solids, mg/L
Qw = waste sludge flow, mgd
Q = influent flow, mgd
MLSS = mixed liquor suspended solids, mg/L
V = aeration tank volume, mg
Re-expressing for formula for SRT and solving for waste sludge, lbs/day.
WAS, lb/day = (MLSS)(V)(8.34) - (ESS)(Q)(8.34)
SRT, days
Example: Calculate the wasting rate, Qw
Given: WASSS = 8000 mg/L
Target SRT = 7 days
MLSS = 2833 mg/L
Effluent SS = 30 lbs/day
V = 0.05 mg
Solution:
WAS, lbs/day = (2833)(0.05)(8.34) - 30
7
= 139 lbs/day
Qw, gals/day = (139)(1,000,000)
(8000)(8.34)
= 2083 gallons
Sludge Quality Control. Using the sludge quality control method, the aeration tanks and
final clarifiers are studied carefully for informative physical characteristics that help
identify sludge quality and process status. The inferences of these physical findings are
used to supplement the results of the other more specific control methods previously
described. Using an integrated control strategy, the direction and magnitude of the
control adjustments can be made. A basic concept of the method is that the best
performance is achieved by satisfying all interrelated process requirements

Notes on Activated Sludge Process Control Page 70
simultaneously – not by exclusive dependence upon any single or preconceived factor.
The control method includes the following observations and laboratory test:
- Aeration tank observations
- Secondary clarifier observations
- Microscopic examination of the MLSS
- Mixed liquor settling characteristics
- Depth of the sludge blanket
- MLSS respiration rates
Characteristics of Good Sludge Quality
1. Settles fairly rapidly as contrasted to a sludge that settles very fast of very slowly.
2. Concentrates uniformly in 30 to 60 minutes as contrasted to a sludge that concentrates
very rapidly is less than 30 minutes or very slowly needing 2 hours or more.
3. Produces flocculent solids which form large strong flow particles which settle well,
resist shear in the aeration tank and filter the supernate to remove stray particles.
4. Produces a clear supernate.
5. Is normally deep tan to light brown.
6. Normally has a pleasant musk or earthy odor.
Summary Notes on Waste Activated Sludge Rate Control
1. Waste sludge control has two goals: 1) excess accumulation of solids must be
removed and 2) the appropriate sludge quality must be maintained.
2. System response to waste activated sludge rate changes are normally slow. Usually
from about 1 to 2 SRTs.
3. Waste sludge changes should be limited to +/- 15 percent per day.
Summary – Process Control Strategies
In summary, while there are many different techniques to activated sludge process
control, all of the methods are directed towards three common goals. First the operator
must provide the proper environment in the system. For most municipal plants, this
means providing adequate aeration and mixing. In industrial plant, this means providing
the nutrients (nitrogen & phosphorus) requirements and adjusting the pH within the range
of 6.0 to 8.5. Secondly, the operator must balance the mass of solids under aeration with
the organic loading. The aeration tank F/M ratio provides a measure of the kinetics
(growth rates) of the system. In plants where F/M is not monitored routinely, it is still
implied by some other control parameter. For example, maintaining a given MLSS
implicitly defines the F/M ratio. Finally, the operator must maintain a balance return
sludge rate which allows mixed liquor thickening in the secondary clarifiers, yet also
removing the MLSS rapidly enough to prevent septic sludge conditions.
XV. PROCESS MONITORING
Notes on Activated Sludge Process Control Page 71
Monitoring the process is essential to successful process control. Organized and proper
sampling, measurement, and data collection is used to make proper control decisions.
Monitoring tests are used to evaluate the performance of the system. Monitoring test
include effluent quality test such as BOD and TSS. Process control test include
observations of the aeration tank and secondary clarifiers, flow data, solids
concentrations, sludge quality data, and environmental data. In addition, calculated data
is required for aeration, return sludge and waste sludge (e.g., SRT). Data for plant
process control and monitoring might include the following.
Flow:
- Influent/Effluent
- Return RAS
- Waste (WAS)
- Air
- Recycle Flows
BOD and COD:
- Influent/Effluent
TSS:
- Influent/Effluent
Observations:
- Aeration Tank
- Spray patterns
- Flow patterns
- Turbulences
- Color
- Odor
- Foam
- Secondary Clarifiers
- Clarity
- Bulking
- Washout
- Clumping/Ashing
- Straggler floc
- Pin floc
Solids concentration:
- Mixed liquor
- Return sludge
Notes on Activated Sludge Process Control Page 72
- Waste sludge
- Reaeration (for contact stabilization)
Sludge settling test data:
- Settled Sludge Volume (SSV)
- Settled Sludge Concentration (SSC)
- SVI
- Settling velocity
- Settling curves
Sludge blanket depth (for each clarifier)
Dissolved Oxygen DO:
- Aeration tank (inlet, midpoint, outlet)
- Reaeration tank (for contact stabilization)
Microscopic enumeration and characterization:
- Mixed liquor
- Return sludge
Turbidity
- Secondary effluent
Heavy metals
- Influent/effluent
SOUR (specific oxygen uptake rate)
- Aeration tank inlet/outlet (mixed liquor)
- Fed and unfed samples
Aeration Tank and Clarifier Oxygen Reduction Potential (ORP)
Nitrogen (ammonia TKN, nitrite, nitrate)
- Influent/effluent
Phosphorus
- Influent/effluent

Notes on Activated Sludge Process Control Page 73
Alkalinity
- Influent/Effluent
Note: An alkalinity drop of more than 30 mg/L as CaCO3 usually indicates nitrification.
As you can see there are many process evaluation and control test available to monitor
and control the activated sludge system. The operator must decide which test are
essential, how often to test, where to test and the sample type. Once the test have been
selected, the operator must than identify common ranges or targets for the test data
collected. An example process monitoring plan for a medium size plant (0.5 – 1.0 mgd)
follows:
Process Mode: Extended Aeration
Log of Events
Loading Data
Avg. Daily BOD
Avg. Daily TSS
Detention Time – 20 hrs.
Aeration Tank Loading – 10 lbs/1000 ft3
Clarifier Solids Loading – 12 lbs/ft2
Clarifier Surface Overflow Rates – 220 gal/ft2
Return Rates – 100%
Frequency Location4 Sample Type Common Range
Flows:
Influent 99 1 CN -
RAS 99 6 CN 50 – 200%
WAS 01/BA 6a ES 2700 – 3300 GPD
Recycle 01/BA 6 ES -
Performance:
BOD 02/07 1,5 CP -
TSS 02/07 1,5 CP -
Turbidity 01/01 5 CP -
Solids Concentration:
4 See Figure 15.01 for a diagram of the process control test locations.

Notes on Activated Sludge Process Control Page 74
Mixed Liquor 03/07 2a,b GR 2250 – 2750 mg/L
Return Sludge 03/07 6 GR 6000 – 10000 mg/L
Waste Sludge 03/07 6a GR 6000 – 10000 mg/L
Sludge Quality:
Observations
Color 01/01 2a,b VI -
Odor 01/01 2a,b VI -
Foam 01/01 2a,b VI -
Settling Test Data
SSV 03/07 2b GR -
SSC 03/07 2b GR -
SVI 03/07 2b MC 70 - 110
Settling Velocity 77/77 2b GR -
Settling Curve 77/77 2b GR -
Microscopic
Examination 02/07 2b GR -
Respiration Rate
SOUR 77/77 2a,b GR 6-12 mgO2/hr/gm
Environmental:
Physical
Temperature 01/07 1,5 GR -
Salinity 77/77 1 GR
Oxygen/Mixing 02/07 2a,b GR -
Chemical
pH 01/01 1,5 GR -
acidity/alkalinity 77/77 1,5 GR -
metals 77/77 1 GR -
other 77/77 1 GR -
Biological
microscopic 02/07 2b GR -
Nitrogen (nitrification)
ammonia 77/77 1,5 GR -
TKN 77/77 1,5 GR -
nitrite 77/77 1,5 GR -
nitrate 77/77 1,5 GR -
Nutrition
BOD/COD/TOC 77/77 1 CP -
Oxygen 02/07 2a,b GR -
Nitrogen/Phosphorus 77/77 5 CP -
ORP 77/77 2b, 4 GR 100 mV

Notes on Activated Sludge Process Control Page 75
Aeration:
Observations
Spray Patterns 01/01 2a,b VI -
Flow Patterns 01/01 2a,b VI -
Turbulences 01/01 2a,b VI -
Dissolved Oxygen
Aeration Tank 01/01 2a,b VI 1 – 2 mg/L
Return:
Clarifier Sludge Blanket
05/07 4 MS 1 – 2 feet
Mass Balance 03/07 2,4 MC
Settleability 03/07 2,4 MC
SVI 03/07 2,4 MC
Sludge Quality 03/07 2,4 ES
State Point Analysis 77/77 4 MC
Sludge Inventory (Wasting):
Constant MLSS 03/07 2b MC 2250 – 2750 mg/L
F:M 77/77 2b MC 0.06 – 0.07
Sludge Age (MCRT) 03/07 2b MC 22 – 26 days
Sludge Quality 03/07 2b ES -
Secondary Clarifier:
Observations
Clarity 05/07 4 VI -
Bulking 05/07 4 VI -
Washout 05/07 4 VI -
Clumping/Ashing 05/07 4 VI -
Straggler Floc 05/07 4 VI -
Pin Floc 05/07 4 VI -
Gasification 05/07 4 VI -
CN = Continuous
ES = Estimate
CP = Composite
VI = Visual
GR = Grab
MC = Math Calculation
99 = Continuous
01/BA = Once per batch
02/07 = Twice per week

Notes on Activated Sludge Process Control Page 76
01/01 = Once per day
03/07 = Three per week
77/77 = Contingent
05/07 = Five per week

Notes on Activated Sludge Process Control Page 77
Figure 15.01
XVI. TROUBLESHOOTING
Good troubleshooting techniques are important for meeting performance objectives in the
most cost effective manner. Troubleshooting is a step-by-step procedure to diagnose and
correct a problem.
Troubleshooting consists of seven major activities:
• Recognizing that a problem exists.
• Assigning priorities to ensure that each problem receives adequate attention.
• Gathering facts in an organized manner to establish base data.
• Finding the cause of the problem as quickly as possible to minimize the impact on
process and cost.
• Identifying possible alternative courses of action.
• Recording the facts in an organized manner.
• Eliminating or reducing the cause of the problem to minimize recurrence.
The first step in troubleshooting is to recognize that there is a problem. All plants should
have Standard Operating Procedures (SOP’s) which include procedures for operators to
detect problems. The ability to recognize minor problems and to correct them early can
prevent them from developing into major problems.
Once a problem is detected, an assessment must be made as to its priority over other
existing problems. The three major factors in assigning priorities are seriousness,
urgency, and growth of the problem in terms of impact on process performance or safety
of personnel or equipment.
Gathering facts is a four-step process: stating the problem, defining the boundaries,
noting differences and changes, deciding on cause/effect.
Problem statement. The problem statement should be a precise description of the
problem in terms of observable facts.
Boundary definition. Ask the following types of questions: Where is the problem
observed? When was the problem first detected? What is the extent of the
problem?
Differences and Changes. Note any difference or changes from what is normal.
Cause/effect. Identify probable cause

Notes on Activated Sludge Process Control Page 78
Possible alternative courses of action may be from the following five categories:
contingent, interim, corrective, adaptive and preventive.
Contingent actions. These are taken immediately to minimize the effect of the
problem.
Interim actions. Interim actions are taken while the problem is being solved and
repairs are being made.
Corrective actions. Corrective actions address the cause of the problem.
Adaptive actions. Adaptive actions allow the plant to live with the problem.
Preventive actions. These reduce or eliminate the cause of a problem.
Procedure needs to be established to ensure that facts are recorded so that:
• Important facts are not lost when a problem occurs.
• The cause of a problem is more quickly isolated.
• Management is provided with the records.
• Engineering is provided with the data to analyze alternatives.
The establishment of a good process control strategy and monitoring program is essential
to troubleshooting the activated sludge process. Before troubleshooting a problem it is
important to review the plant’s physical capabilities and limitations. A design audit
should be conducted. The design audit should include:
1. Plant loading
a. Organic
b. Hydraulic
c. Industrial
d. Toxic
e. Seasonal variations
f. Infiltration/inflow
g. Return process streams
2. Plant layout
3. Flow measurements
4. Bar Screens
5. Comminutors
6. Grit Removal
7. Primary Clairfiers
8. Aeration
a. Hydraulic detention time
b. BOD loading
c. Oxygen availability

Notes on Activated Sludge Process Control Page 79
9. Secondary clarifier
a. Surface overflow rates
b. Solids loading rates
c. Depth at weirs
d. Possible RAS flow range
e. Short circuiting
10. Solids handling
Operational problems which are commonly experienced are:
1. Aeration. The operator should observe the entire aeration tank for turbulence.
The extent of turbulence will indicate whether or not all sewage, return sludge,
and mixed liquor are thoroughly mixed throughout the tank.
2. Foaming. The type of foam or scum, if any, accumulated over the aeration tank
surface and to a lesser extent the color of the mixed liquor reveals process status
and indicates generalized long-term sludge wasting requirements.
3. Solids Washout. Excessive solids washout over the final effluent weirs, when the
upper surface of the sludge blanket is more than three feet below the clarifier
surface and when the sludge settles properly in the laboratory, should not be
confused with classic sludge bulking. Solids washout, which differs form classic
sludge bulking, is more frequently caused by hydraulic overloading, toxic
substances (such as high pH, heavy metals, phenols, etc.) or inappropriate
secondary clarifier design.
4. Bulking. Such conditions are evidence by a homegenous appearing sludge
blanket that extends throughout the entire clarifier, and can be observed at the
surface while the mixed liquor solids pour over the final effluent weirs.
5. Clumping/rising sludge. At times, large masses of sludge, possibly one foot in
diameter, may be seen rising, then bursting, and finally spreading over the
clarifier surface.
6. Cloudy secondary effluent. Secondary effluent is cloudy and contains suspended
matter.
7. Ashing. Small particles of ash-like material floating on the surface of the clarifier
and in mixed liquor settleability test.
8. Pinpoint floc. Very small, compact pin floc, usually less than on thirty-second of
an inch in diameter, may be observed suspended throughout moderately turbid
final clarifier tank contents.
9. Straggler floc. Small, almost transparent, very light fluffy, buoyant sludge
particles (one eighth to one-quarter inch in diameter) may be observed rising to
the clarifier surface near the outlet weirs.
The tables in Appendix O list observations, probable causes, necessary checks and
alternatives for these operational problems.
When troubleshooting process problems at an activated sludge plant, it is important to
proceed in an organized manner and to check all of the possibilities.

Notes on Activated Sludge Process Control Page 80
Figure 16.01 shows a diagram of the troubleshooting process. First, the problem(s) are
identified using tools such as brainstorming. Next, a problem is selected and described.
A written statement of the problem is prepared. Baseline data is gathered and
Notes on Activated Sludge Process Control Page 81
Figure 16.01
summarized. Tools include multivoting, selection grid, impact analysis, data-gathering,
run charts, Pareto analysis, and control charts.
Next is the expansion and analysis of the cause. This phase starts with analysis of the
problem from data. A list of the most influential factors is developed and priorities are
identified. The tools for this step include data-gathering, sampling, surveys, Pareto
analysis, fishbone diagram, flow charts, control charts, relationship analysis.
The third step is the expansion and development of the solution(s) and plan. The output
of this phase is a solution(s) to the problem and a plan for implementation. The tools
include technology transfer, cost-benefit analysis, and force field analysis.
The final step is the execution and implementation of the plan. The outputs include
organizational commitment, an executed plan, and a record of the plan’s impact. The
tools include building individual support, presentations, measuring and monitoring,
descriptive charts, specifications and control limits.
In addition to organizing thoughts on process control figures 11.01 and 11.03 can serve as
a guide to troubleshooting.
The first step is to define the problem in terms of effluent quality. Next, check the
environmental conditions (“growth pressures”), such as D.O., BOD loading,
MLSS/MLVSS, F:M, temperature, nutrients, toxins, hydraulics (detention time),
alkalinity, ORP, and pH. Next check the process control. This includes good sludge
quality, such as aeration tank/secondary clarifier observations, sludge settling (diluted
settleability), microbiology and respiration rate. Using the microscope check the
viability, floc size, filaments (amount and type), and predominant form of
protozoa/metazoa. And finally check the process control parameters. Check the aeration
tank dissolved oxygen at the inlet/outlet and midpoint. Check the sludge blanket depth.
Check the MLSS, F:M and SRT/MCRT. If the process control looks good, check the
physical capability of the process. This includes administrative, design and maintenance
factors.
Administrative factors include: 1) policies, 2) staffing, and 3) financial. Maintenance
factors include: 1) housekeeping, 2) scheduling & recording, 3) preventive maintenance,
and 4) emergency. See the EPA Handbook on Improving POTW Performance Using the
Composite Correction Program Approach, October 1984.
Problems associated with the activated sludge process can usually be related to four
conditions (Schuyler, 1995). The first is foam, the second is high effluent suspended
solids, the third is high concentrations of soluble materials (BOD and ammonia) and the
fourth is a general problem related to low effluent pH. See Appendix P for a section on

Notes on Activated Sludge Process Control Page 82
Troubleshooting Activated Sludge Processes that was prepared for the Maine DEP and
JETCC by Ronald Schuyler, P.E., Rothberg, Tabburini, and Winsor (RTW).
Foam problems can be summarized as:
• Pumice-like – Solids Return
• Grey, Thick, Slimy – Nutrient Deficiency
• Dark Brown, Thick, Scummy – Old sludge
• Billowy White – Surfactant
o Plant Start-up
o High Surfactant load
Excess effluent suspended solids:
• Blanket Washout
o Controllable Settling
o Uncontrollable Settling
• Individual Particle
o Pin-Floc
o Straggler Floc
• Controllable Settling
o Hydraulic Overload
o Inadequate sludge return
• Uncontrollable Settling
o Good Settling with Diluted Settleometer
� Excess old sludge
� Glutted system
o Poor Settling with Diluted Settleometer
� Bulking
� Slime
� Filamentous
• Filamentous Problems
o Foam Trapping
o Low D.O.
o Low pH
o Nutrient Deficiency
o Sulfides
o Readily Metabolized Substrate
o Slowly Metabolized Substrate
o Surface Seeding
• Individual Particle Washout
o Pin Floc
� High MCRT

Notes on Activated Sludge Process Control Page 83
• Grossly Underloaded Plant
• Clarifier Denitrification
� Recycle from Solids Processing
o Straggler Floc
� Filamentous
� Nonfilamentous
o Individual Bacterial Cells
� High SOUR, Young sludge
� Low SOUR, Toxic load
Excess BOD5 or NH3
• Very Low respiration Rate
o Toxic Load
• 0.0 Respiration Rate
o Microoganisms Killed
• Low Respiration Rate
o Inhibition
• Medium-High SOUR
o Material Difficult to Stabilize
o Slight inhibition
• High SOUR
o Hydraulic Overload for Given SDT
o Organic Overload for Given Biomass
Low Effluent pH
• Low influent pH
• Normal influent pH – Nitrification
o Nitrification required
o Nitrification not required

Notes on Activated Sludge Process Control Page 84
XVII. GLOSSARY
Absorption The use of oxygen, water, and organic
matter for the metabolism of the organisms.
Accuracy Correctness. When doing laboratory testing,
accurate results are values that are close to
the true value.
Acid A chemical compound that forms
hydronium ions in water, the resultant
solution has a pH less than 7.
Acid-forming bacteria Anaerobic bacteria that produce volatile
acids as a waste product.
Acidity The ability of a solution to react with or
neutralize a strong base to a specific pH.
Measured in terms of mg/L CaCO3 (calcium
carbonate).
Activated Sludge Activated sludge is a brownish floc-like
material consisting largely of organic matter
obtained from the sewage. This material is
inhabited by millions of bacteria and other
forms of biological life, mainly aerobic in
nature.
Activated Sludge Loading The pounds of biochemical oxygen demand
(BOD) in the applied liquid per unit volume
of aeration capacity or per pound of
activated sludge per day.
Adsorption The adherence of dissolved, colloidal or
finely divided solids on the surface of the
solid bodies with which they are brought
into contact.
Aeration The bringing about of intimate contact
between air and liquid by one of the
following methods: spraying the liquid into
the air; bubbling air through the liquid, or by
agitation of the liquid to promote surface
adsorption of the air; or any combination of
these methods.

Notes on Activated Sludge Process Control Page 85
Aeration Period The theoretical time, usually expressed in
hours during which mixed liquor is
subjected to aeration in an aeration tank
while undergoing activated sludge
treatment. It is equal to the volume of the
tank divided by the volumetric rate of flow
Aeration Rate The amount of air supplied to the mixed
liquor, measured in cubic feet per minute
(cfm) for diffused aeration and measured in
and horsepower for surface aeration.
Aeration Tank Concentration (ATC) The concentration of solids under aeration.
Another term for MLSS.
of the wastewater.
Aerator A structure, round or rectangular built for
the purpose of aerating and mixing activated
sludge liquor.
Aerobic Environmental conditions that contain free
dissolved oxygen.
Aerobic Digestion Sludge stabilization using aerobic
microoganisms, free oxygen must be
available.
Aerobic Respiration Respiration process that uses free molecular
oxygen.
Air Cleaner A device for removing foreign material from
the air that is used for aeration through
diffusers.
Air Diffusers Devices for breaking up air into fine bubbles
in water for the purpose of transferring a
part of the oxygen in the air to the liquid
surrounding the bubble.
Alkaline A solution with a pH greater than 7.0.
Alkalinity Buffering, or acid neutralizing capacity of
water primarily due to its carbonate,
bicarbonate, and hydroxide content.
Measured in mg/L of CaCO3 (calcium
carbonate).

Notes on Activated Sludge Process Control Page 86
Ambient temperature Temperature of the surroundings.
Anabolism Chemical reaction forming molecules within
a bacterial cell.
Anaerobic Respiration Respiration process that uses chemically
combined oxygen.
Anoxic A condition in which oxygen is absent and
nitrate is present.
Area A measurement of the amount of surface of
an object; measured in linear units squared
(for example, sq ft).
Arithmetic Average The sum of a group of numbers divided by
how many numbers there are in the group.
Ashing In activated sludge, small particles of sludge
which look like ash on the surface of the
secondary clarifier. Usually indicates the
beginning in nitrification.
Assimilation The process by which food is converted to
cell protoplasm.
Autotroph An organism that can use sunlight or
inorganic chemicals as energy sources; these
are photosynthetic and chemosynthetic
organisms.
Bacteria Single-celled microorganisms of primary
importance in most biological wastewater
treatment processes. They are the first step
in removing most of the fine suspended and
dissolved solids.
Baffle A structure the directs the wastewater flow
or retains floating materials.
Barminutor A preliminary treatment shredding device in
which the shredding mechanism moves up
and down the bar screen.
Notes on Activated Sludge Process Control Page 87
Bar Screen An arrangement of uniformly spaced,
parallel bars placed in the influent stream to
catch large objects.
Base A chemical compound that forms hydroxide
ions in water; the resultant solution has a pH
greater than 7.
Billowing Sludge Indicates the potential for solids washout in
the activated sludge secondary clarifier.
Can be identified by localized clouds of
sludge solids rising near the surface in
certain areas of the clarifier.
Biochemical Oxygen Demand (BOD) The quantity of oxygen required by bacteria
to biologically oxidize material under
aerobic conditions.
Biodegradation The destruction or mineralization of organic
materials by microorganisms.
Bioflocculation A condition whereby organic materials tend
to be transferred from the dispersed form in
wastewater to settleable material by
mechanical entrapment and assimilation.
Biomass Active or dead microorganisms present in a
particular area of a biological treatment
plant.
Biosorption An application of the activated sludge
process where the returned activated sludge
is aerated for a prolonged time.
Blanket Thickness (BLT) The measurement from the bottom of the
clarifier to the top of the sludge blanket,
usually determined with a core sampler or
electronic interface detector.
Bulking A condition in which activated sludge does
not concentrate and will not settle well
(SVI>150).
Carbonaceous Oxidation Biochemical process by which heterotrophic
microorganism derive energy from organic
wastes, rendering more stable organics or
inorganics end-products.
Notes on Activated Sludge Process Control Page 88
Catabolism Chemical reaction breaking down molecules within a
bacterial cell.
Catalyst A substance that speeds up a chemical reaction
without being altered itself.
Chemical Oxygen Demand (COD) The amount of oxygen required for the chemical
oxidation of organic material using chemicals as
oxidants.
Ciliate A type of protozoan characterized by short hairlike
filament (cilia) used for motility and/or capturing
food.
Clarifier Tank in which suspended solids are allowed to
separate from water by gravity settling.
Clarifier Sludge Detention Time (CSDT) The time sludge remains in a secondary clarifier.
Clarifier Sludge Flow (CSF) The sludge flow rate from the secondary clarifier.
Clarifier Sludge Flow Demand Refers to the return rate which allows sludge to
thicken in the clarifier based on its settling
characteristics.
Colloids Finely divided, nonsettleable solids which may be
removed by coagulation or biochemical action.
Comminutor A device used to shred materials entering with the
influent.
Complete Mix Idealized continuous flow reaction in which fluid
particles are immediately dispersed throughout the
reactor.
Contact Stabilization Process A modification of the activated sludge process in
which wastewater is aerated with a high concentration
of activated sludge for a short period usually less than
60 minutes to obtain BOD removal. The solids are
subsequently separated by sedimentation and
transferred to a stabilization tank where aeration is
continued, starving the activated sludge before
returning it to the aeration basin.

Notes on Activated Sludge Process Control Page 89
Conventional Activated Sludge An aerobic biological sewage treatment
process in which a mixture of sewage and
activated sludge is separated from the
treated sewage (mixed liquor) by
sedimentation and wasted or returned to the
process as needed. The treated sewage
overflows the weir of the settling tank in
which separation from the sludge takes
place.
Decant (1) To draw off liquid without disturbing the
sediment or the lower liquid layers. (2) To
pour from one vessel into another.
Deflocculation The break up of flocculated sludge particles;
often results in pin floc and/or ashing.
Denitrification The reduction of nitrates to nitrites and
nitrogen gas.
Depth of Blanket (DOB) The distance from the clarifier water surface
to the top of the sludge blanket. When
subtracted from the total clarifier depth, this
should equal the blanket thickness (BLT).
Detention Time The time it takes to fill a tank at a given rate
of flow.
Diffuser A device which divides air into minute
bubbles for diffusion into liquids.
Digestion The process of sludge stabilization that
reduces the sludge volatile content and
destroys most pathogenic microorganisms.
Dissolved Oxygen (D.O.) The amount of oxygen dissolved in water,
usually measured in aeration tanks and
expressed in mg/L.
Dissolved Solids Material that passes through a filter in a
laboratory test. Dissolved solids must be
measured by evaporation.
Endogenous Decay A reduced level of respiration in which
materials previously stored by the cell are
oxidized.

Notes on Activated Sludge Process Control Page 90
Endogenous Respiration Utilization of internal cellular material as
food under aerobic conditions when an
adequate external food supply is
unavailable.
Enzyme A biological catalyst that speed up or makes
a reaction occur without being changed
itself.
Extended Aeration The activated sludge modification that
operates in the endogenous respiration zone.
The aeration detention time is usually about
24 hours.
Facultative Organisms Bacteria that can utilize either free dissolved
oxygen or chemically combined oxygen
under aerobic or anaerobic conditions.
Field Transfer Rate (FTR) The actual oxygen transfer rate applied in
the field.
Flocculation Gathering together of fine particles to form
larger particles that are heavier and more
easily settled.
Food-to-Microoganism Ratio (F/M) A mathematical calculation of the mass of
food, measured as BOD, divided by the
mass of solids under aeration, or MLSS.
Facultative Refers to organisms that are able to function
both in the presence or absence of free
oxygen.
Heterotrophic An organism that consumes and decomposes
organic mater as an energy source.
Hi-Rate Activated Sludge A new variation of the conventional
activated sludge process where faster and
better treatment can be obtained through
better controls.
Hydraulic Detention Time The theoretical time required to displace the
contents of a tank or unit at a given
discharge rate (volume of tank divided by
discharge rate).

Notes on Activated Sludge Process Control Page 91
Hydrogen Sulfide A gas (molecular formula H2S) which
produces a characteristic “rotten egg” odor.
Imhoff Cone Laboratory glassware used in settleable
solids testing of sample with low solids
concentrations.
Inorganic Material such as sand, salt, iron, calcium,
and other mineral materials which are not
converted in large quantities by
microorganism action. Inorganic materials
are chemical substances of mineral origin
and may contain carbon and oxygen.
Log Growth Phase The period of time when the mass of
microorganism is doubling in regular
intervals. Food supply is not limiting,
therefore, increases in population size are
geometric.
Mean Cell Residence Time (MCRT) A mathematical determination of the length
of time activated sludge bacteria spend in
the system, expressed in days.
Mechanical Aeration The transfer of oxygen from the air to the
liquid by mechanical means. Such as
mixing, spraying or pumping.
Mesophilic Operationally, the temperature range most
conducive to the maintenance of optimum
digestion by mesophic bacteria; generally
accepted as between 27o and 32
oC.
Metabolism The process in which bacteria break down
organic matter releasing energy and
producing waste products.
Methane The flammable gas produced from the
anaerobic decomposition of organic matter.
Microonutrients Inorganic nutrients required in only trace
amounts.
Microoganisms Small organisms that can only be seen with
a microscope.

Notes on Activated Sludge Process Control Page 92
Mixed Liquor Contents of aeration tank which is the
combination of aeration tank influent and
return sludge.
Mixers Mechanical equipment designed to mix the
liquor in the aerator.
Mixed Liquor Suspended Solids (MLSS) The mass of solids contained in the mixture
in an aeration tank, determined by
laboratory analysis.
Mixed Liquor Volatile Suspended The volatile or organic portion of the mixed
Solids (MLVSS) liquor suspended solids, determined by
laboratory analysis.
Nematode Unsegmented worm.
Nitrate A stable form of oxidized nitrogen; chemical
formula NO3-.
Neutral Solution A solution that is neither acidic nor basic; a solution
with pH 7.
Nitrification The biochemical conversion of ammonia to
nitrate.
Nitrite The unstable intermediate nitrogen
compound between ammonia and nitrate;
chemical formula NO2-.
Nitrogen An element required for growth and
reproduction by organisms. Nitrogen in
wastewater is available in forms of nitrate,
nitrite, ammonia, and organic nitrogen.
Kjeldahl nitrogen is the combined
concentration of ammonia and organic
nitrogen. Total oxidized nitrogen is the sum
of the nitrite and nitrate nitrogen.
Nutrients Substances that are required to support
living organisms. Nitrogen and phosphorus
are commonly referred to as nutrients.
Organic Substances that are of plant or animal origin.
Organic Loading The pounds of BOD applied to each 1000
gallons of a process.

Notes on Activated Sludge Process Control Page 93
Organic Nitrogen Sources of organic nitrogen may be natural,
such as proteins and urea. Today there are a
number of sources of synthetic organic
nitrogen.
Oxidation The addition of oxygen, removal of
hydrogen, or the removal of electrons from
an element or compound.
Oxygen The gas required by most plants and animals
to break down organic matter for energy.
Oxygen Transfer Efficiency (OTE) The efficiency at which oxygen is
transferred to water.
Oxygen Uptake Rate (OUR) The rate at which dissolved oxygen is used
by the microorganisms.
Oxygen Utilization The oxygen consumed to support aerobic
biological treatment processes.
pH A term used to express the intensity of the
acid or alkaline sources. A pH of 7 is
considered neutral, with acidity increasing
as the pH decreases. Normal pH for
wastewater treatment is 6.5 to 7.5.
Phosphorus The nutrient that usually limits the
productivity of a body of water.
Photosynthesis The use of sunlight by plants to obtain the
energy necessary to synthesize new cell
material.
Pin Floc Very fine floc particles with poor settling
characteristics. Usually associated with old,
overoxidized mixed liquor.
Plant Balance When all factors such a food supply, MLSS,
D.O., and detention time are in the correct
proportions, the plant is said to be in
balance.
Notes on Activated Sludge Process Control Page 94
Plug Flow Reactor Idealized continuous flow reactor in which
fluid particles are discharged in the same
order in which they entered.
Pre-Aeration A preparatory treatment of sewage,
comprising aeration to add oxygen to the
sewage, to promote the flotation of grease
and to aid coagulation of the solids.
Precision When doing laboratory testing, precise
results are produced when there is a high
degree of agreement between repeated
measurements from a single sample. It is
possible to have precision without accuracy.
Primary Treatement The first phase of wastewater treatment,
consisting of separating the readily
settleable or floatable solids by
sedimentation and skimming A physical
form of treatment.
Process A sequence of operations.
Process Control Deliberate efforts to regulate the F/M ratio
in activated sludge processes; any
systematic effort to regulate process
performance.
Protoplasm The material of a living cell.
Protozoa Microscopic animals.
Q A term used for plant flow rate.
Reaeration The absorption of oxygen by a liquid where
the D.O. has been depleted, such as
reaerating the returned activated sludge for
considerable time to promote the aerobic
digestion of the solids adsorbed. Use with
the biosorption activated sludge process.
Recirculation The absorption of oxygen by a liquid where
the D.O. has been depleted, such as
reaerating the returned activated sludge for
considerable time to promote the aerobic
digestion of solids adsorbed. Use with the
biosorption activated sludge process.

Notes on Activated Sludge Process Control Page 95
Respiration The biological activity of utilizing oxygen
and releasing carbon dioxide.
Return Activated Sludge (RAS) The settled or concentrated activated sludge
solids collected from the secondary clarifier
bottom and returned back to the aeration
tank.
Return Sludge Flow (RSF) The hydraulic rate at which sludge is
returned from the clarifier to the aeration
tank.
Rising Sludge A problem in secondary settling tanks;
generally attributed to denitrification in the
sludge blanket.
Rotifer A small multicelled animal that gets its
name from the rotating action of rows of
cilia near its mouth.
Secondary Treatment Phase of wastewater treatment in which
dissolved and suspended material is
converted into a form more readily separated
from the wastewater.
Sedimentation The process of settling suspended solids by
gravity.
Septic A condition produced by the growth of
anaerobic organisms . If severe, the
wastewater turns black, giving off foul odors
and creating a heavy oxygen demand.
Settleability A measure of the tendency of mixed liquor
suspended solids to settle.
Settleable Solids The matter in wastewater that will not stay
in suspension during a preselected settling
period.
Settled Sludge Concentraton (SSC) The concentration of settled sludge based on
the volume occupied in the settlometer.
Settlometer A wide-mouthed graduated cylinder used to
evaluate settling properties of activated
sludge.
Notes on Activated Sludge Process Control Page 96
Settled Sludge Volume (SSV) The volume occupied by activated sludge in
a settlometer.
Sewage Used water of a community.
Shock Load The arrival at a plant of a waste which is
toxic to organisms in sufficient quantity or
strength to cause operating problems.
Organic or hydraulic overloads can also
cause shock load.
Sludge Blanket The distance under the surface of the final
clarifier the settled sludge is lying.
Sludge Bulking When the weight of the activated sludge floc
becomes lighter than water, the sludge will
float out of the final clarifier. Bulking
sludge will have a very disagreeable odor,
be light gray in color and have a very high
SVI. This condition is caused by the plant
being out of balance or by some toxic
material in the sewage.
Sludge Concentration Curves Plots of the SSC data calculated form the
settlometer test data.
Sludge Cycle The length of time takes for bacteria to make
one pass through the aeration basin and
clarifier before being returned to aeration.
Sludge Density Index (SDI) The reciprocal of the sludge volume index
multiplied by 100 (that is, 1/SVI X 100).
Settled Sludge Concentraton (SSC) The concentration of settled sludge based on
the volume occupied in the settlometer.
Sludge Digestion A process by which the volatile organic
in sludge is gasified, liquefied, mineralized,
converted to a more stable form by
anaerobic or aerobic organisms.
Sludge Loading A ratio of pounds of organic matter in the
primary effluent to the pounds of MLSS.

Notes on Activated Sludge Process Control Page 97
Sludge Volume Index (SVI) The volume in milliliters occupied by one
gram of activated sludge after 30 minutes of
settling. This is used as a measurement of
sludge quality.
Sludge Settling Curves Plots of the SSV data generated from the
settlometer test.
Sludge Residence Time (SRT) A term expressing the length of time
bacteria spend in the aeration tank.
Solids Inventory The pounds of mixed liquor suspended
solids in the aeration tank and secondary
clarifier.
Solids Loading The weight or mass of solids applied to a
treatment process per unit time.
Solids Retention Time (SRT) The average residence time of suspended
solids in the aeration tank; equal to the total
weight of suspended solids in the aeration
tank divided by the total weight of
suspended solids leaving the system per unit
time.
Solids Washout The removal of sludge solids in the effluent
from the secondary clarifier of an activated
sludge plant because of excessive turbulence
and/or a sludge buildup.
Sparger The air distribution device used with mixers
for aeration of the mixed liquor in the hi-rate
activated sludge process.
Step Aeration A variation of the conventional activated
sludge process where settled sewage is
introduced into the aerator at several
different points along the aerator. This is
done to improve the mixing and to minimize
shock loads.
Straggler Floc In activated sludge, flow particles1/4” or
larger extending throughout the clarifier,
associated with low mixed liquor suspended
solids.
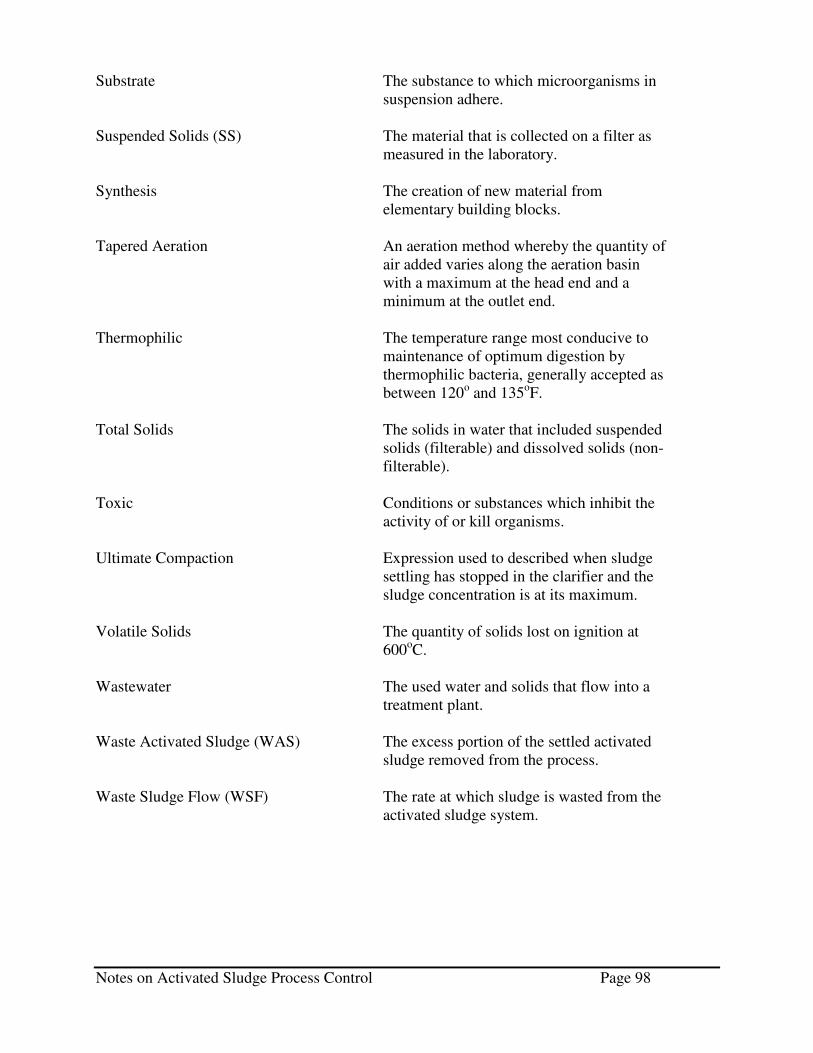
Notes on Activated Sludge Process Control Page 98
Substrate The substance to which microorganisms in
suspension adhere.
Suspended Solids (SS) The material that is collected on a filter as
measured in the laboratory.
Synthesis The creation of new material from
elementary building blocks.
Tapered Aeration An aeration method whereby the quantity of
air added varies along the aeration basin
with a maximum at the head end and a
minimum at the outlet end.
Thermophilic The temperature range most conducive to
maintenance of optimum digestion by
thermophilic bacteria, generally accepted as
between 120o and 135
oF.
Total Solids The solids in water that included suspended
solids (filterable) and dissolved solids (non-
filterable).
Toxic Conditions or substances which inhibit the
activity of or kill organisms.
Ultimate Compaction Expression used to described when sludge
settling has stopped in the clarifier and the
sludge concentration is at its maximum.
Volatile Solids The quantity of solids lost on ignition at
600oC.
Wastewater The used water and solids that flow into a
treatment plant.
Waste Activated Sludge (WAS) The excess portion of the settled activated
sludge removed from the process.
Waste Sludge Flow (WSF) The rate at which sludge is wasted from the
activated sludge system.
APPENDIX A
LABORATORY SUMMARY

PARAMETER HOLDING/SAMPING PRETREATMENT APPARATUS PROCEDURE COMMENTS CALCULATIONS
Biochamical Oxygen Demand
(BOD), mg/L [See Appendix W]
24 hr, refrigerate at 4°C, grab or composite
-pH 6.4 to 7.5 -dechlorinate
- temperature 20°C
-300 mL BOD incubation bottles
-Incubator @ 20°C
5 days in the dark @ 20°C
-dilution water depletion must not
exceed 0.2 mg/L
volumesample
300)DODO( finalinitial ×−
DO depletion in sample bottles must be at
least 2 mg/L and final DO must be at least 1.0 mg/L
Total Suspended Solids (TSS), mg/L
7 days, refrigerate at 4°C, grab or composite
- well mixed sample
-glass fiber filter (Whatman 934AM,
Millipore AP40. Gelman A/E)
Dry in oven @ 105°C ± 2°C until
constant weight is
achieved
-insert filter paper wrinkled side up.
)mL(volumesample
)filterofwtsample&filterof.Wt( −
Settleable Solids
mL/L
48 hr, refrigerate at 4°C, grab
-Imhoff cone Settle for 45 min.,
stir gently, settle for 15 min. longer
Direct read
Fecal Coliform colonies/100mL
30 hr, refrigerate @ 4°C, grab
-dechlorinate if necessary
-filter paper -filter funnel
-nutrient broth -culture dishes
-incubator
Incubate at 35°C ±0.5°C for 22 to 24
hours
20 to 60 colony range desired
)mL(volumesample
100)countedcolonies( ×
E. coli Colonies/100 mL
30 hr, refrigerate @
4°C, grab
-dechlorinate if
necessary
-filter paper
-filter funnel -nutrient broth
-culture dishes
-incubator
Incubate at 35°C
for 2 hrs then at 44.5°C for 22 hrs ±2 hrs
20 to 80 colony
range desired
)mL(volumesample
100)countedcolonies( ×
pH Analysis must be
done immediately, grab
-pH meter Calibrate pH meter
against at least 2 known buffers that
bracket the expected pH value
-meter must be accurate to ±0.1 units
-sample must fall between buffer
values
Direct read
Total Chlorine Residual (TRC),
mg/L
Analysis must be done immediately,
grab
-spectrophotometer or colorimeter
-TRC reagents
Add reagent to sample, mix well,
let stand 3-5 min., read results
Direct read
Specific Oxygen Uptake Rate
(SOUR), (mg/g)/hr [See Appendix H]
Analysis must be done immediately,
grab
-adjust temp to ~20°C
-oxygenate sample by vigorous shaking
-DO meter/ stirrer probe & temp
-stopwatch -BOD bottle
Fill BOD bottle to overflowing with
sample. Insert probe and activate
stirrer
After DO stabilizes, read DO level every
minute for 15 min or until DO <1.0 hr
min60
)L/g(MLVSS
rateUptakeDO×
Settled Sludge
Volume (SSV) mL/L and Sludge Volume
Index (SVI) [See Appendix G]
Analysis must be
done immediately, grab
-Mallory settle-
ometer or equiv w/ stirrer
-thermometer
Mix sample w/
stirrer, pull striier gently from
settleometer, record settled
sludge volume every 5 min.
SVI Calculated from
SSV at 30 minutes and MLSS
concentration )L/mg(MVSS
1000min30atSSV ×

APPENDIX B
DESIGN AND OPERATING PARAMETERS
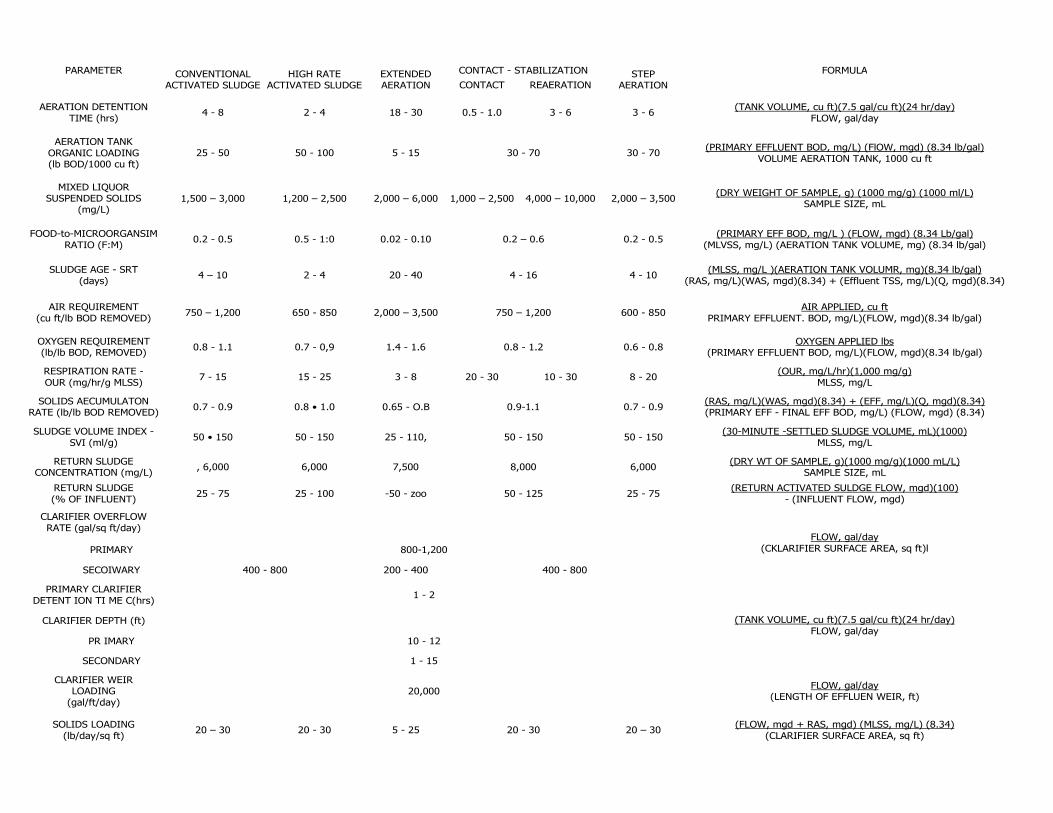
PARAMETER CONTACT - STABILIZATION FORMULA
CONVENTIONAL
ACTIVATED SLUDGE HIGH RATE
ACTIVATED SLUDGE EXTENDED AERATION CONTACT REAERATION
STEP AERATION
AERATION DETENTION
TIME (hrs) 4 - 8 2 - 4 18 - 30 0.5 - 1.0 3 - 6 3 - 6
(TANK VOLUME, cu ft)(7.5 gal/cu ft)(24 hr/day)
FLOW, gal/day
AERATION TANK
ORGANIC LOADING (lb BOD/1000 cu ft)
25 - 50 50 - 100 5 - 15 30 - 70 30 - 70 (PRIMARY EFFLUENT BOD, mg/L) (FlOW, mgd) (8.34 lb/gal)
VOLUME AERATION TANK, 1000 cu ft
MIXED LIQUOR SUSPENDED SOLIDS
(mg/L) 1,500 – 3,000 1,200 – 2,500 2,000 – 6,000 1,000 – 2,500 4,000 – 10,000 2,000 – 3,500
(DRY WEIGHT OF 5AMPLE, g) (1000 mg/g) (1000 ml/L) SAMPLE SIZE, mL
FOOD-to-MICROORGANSIM
RATIO (F:M) 0.2 - 0.5 0.5 - 1:0 0.02 - 0.10 0.2 – 0.6 0.2 - 0.5
(PRIMARY EFF BOD, mg/L ) (FLOW, mgd) (8.34 Lb/gal)
(MLVSS, mg/L) (AERATION TANK VOLUME, mg) (8.34 lb/gal)
SLUDGE AGE - SRT
(days) 4 – 10 2 - 4 20 - 40 4 - 16 4 - 10
(MLSS, mg/L )(AERATION TANK VOLUMR, mg)(8.34 lb/gal)
(RAS, mg/L)(WAS, mgd)(8.34) + (Effluent TSS, mg/L)(Q, mgd)(8.34)
AIR REQUIREMENT
(cu ft/lb BOD REMOVED) 750 – 1,200 650 - 850 2,000 – 3,500 750 – 1,200 600 - 850
AIR APPLIED, cu ft
PRIMARY EFFLUENT. BOD, mg/L)(FLOW, mgd)(8.34 lb/gal)
OXYGEN REQUIREMENT (lb/lb BOD, REMOVED)
0.8 - 1.1 0.7 - 0,9 1.4 - 1.6 0.8 - 1.2 0.6 - 0.8 OXYGEN APPLIED lbs
(PRIMARY EFFLUENT BOD, mg/L)(FLOW, mgd)(8.34 lb/gal)
RESPIRATION RATE -
OUR (mg/hr/g MLSS) 7 - 15 15 - 25 3 - 8 20 - 30 10 - 30 8 - 20
(OUR, mg/L/hr)(1,000 mg/g)
MLSS, mg/L
SOLIDS AECUMULATON RATE (lb/lb BOD REMOVED)
0.7 - 0.9 0.8 • 1.0 0.65 - O.B 0.9-1.1 0.7 - 0.9 (RAS, mg/L)(WAS, mgd)(8.34) + (EFF, mg/L)(Q, mgd)(8.34) (PRIMARY EFF - FINAL EFF BOD, mg/L) (FLOW, mgd) (8.34)
SLUDGE VOLUME INDEX -
SVI (ml/g) 50 • 150 50 - 150 25 - 110, 50 - 150 50 - 150
(30-MINUTE -SETTLED SLUDGE VOLUME, mL)(1000)
MLSS, mg/L
RETURN SLUDGE CONCENTRATION (mg/L)
, 6,000 6,000 7,500 8,000 6,000 (DRY WT OF SAMPLE, g)(1000 mg/g)(1000 mL/L)
SAMPLE SIZE, mL
RETURN SLUDGE
(% OF INFLUENT) 25 - 75 25 - 100 -50 - zoo 50 - 125 25 - 75
(RETURN ACTIVATED SULDGE FLOW, mgd)(100)
- (INFLUENT FLOW, mgd)
CLARIFIER OVERFLOW
RATE (gal/sq ft/day)
PRIMARY 800-1,200
SECOIWARY 400 - 800 200 - 400 400 - 800
FLOW, gal/day
(CKLARIFIER SURFACE AREA, sq ft)l
PRIMARY CLARIFIER
DETENT ION TI ME C(hrs) 1 - 2
CLARIFIER DEPTH (ft)
PR IMARY 10 - 12
SECONDARY 1 - 15
(TANK VOLUME, cu ft)(7.5 gal/cu ft)(24 hr/day)
FLOW, gal/day
CLARIFIER WEIR LOADING
(gal/ft/day) 20,000
FLOW, gal/day (LENGTH OF EFFLUEN WEIR, ft)
SOLIDS LOADING
(lb/day/sq ft) 20 – 30 20 - 30 5 - 25 20 - 30 20 – 30
(FLOW, mgd + RAS, mgd) (MLSS, mg/L) (8.34)
(CLARIFIER SURFACE AREA, sq ft)
Appendix C
The Microbiology of Activated Sludge
From http://www.dnr.state.wi.us/org/water/wm/ww/tech/biol.htm
And
Process Control
From: http://dnr.wi.gov/org/water/wm/ww/tech/process.htm
The Microbiology of Activated Sludge
Activated sludge can be defined as "a mixture of microorganisms which contact and digest bio-degradable materials (food) from wastewater."
• Activated sludge is microorganisms. • The Activated sludge process is a biological process. • To properly control the activated sludge process, you must properly control the growth
of microorganism. This involves controlling the items which may affect those microorganisms.
Additional technical assistance with wastewater treatment plant operations is available from the DNR. Contact Jack Saltes in Madison at (608) 264-6045. For additional help from the DNR, you might also try the Laboratory Certification Program at http://www.dnr.state.wi.us/org/es/science/lc/
Bacteria
• Make up about 95% of the activated sludge biomass. • These single celled organisms grow in the wastewater by consuming (eating) bio-
degradable materials such as proteins, carbohydrates, fats and many other compounds.
The Role of Enzymes
Enzymes are compounds that are made by living organisms. Their purpose is to help biochemical reactions to occur. Almost all biochemical reactions require the presence of enzymes to cause the reaction to occur.
Enzymes help bacteria in the process of breaking down nutrients, and in rebuilding broken down nutrients into the new compounds that they require for growth and reproduction.
Enzymes only do what they are supposed to when environmental conditions are right. If the conditions are not right the enzymes will not function properly, thus, the bacteria will not function properly, and they will not survive. If conditions are right the bacteria will live and prosper.
Growth Characteristics
When there is plenty of food available, bacteria use the food mostly for growth and some for energy.
• A growing bacterium has flagella (hair-like structures on the outside of the cell) which makes it motile, able to move in search of food.
• A bacterium reproduces into two bacteria. The cell splits into two smaller cells and this process occurs over and over again.
When there is very little food available, the bacteria use the limited food to produce energy and to maintain the cell. Very little is available for growth so less reproduction occurs.
• With little food available, and in an attempt to conserve energy, the bacterium loses it flagella and thus, its motility.
• The waste products start to form a thick slime layer outside the cell wall, making the cells stick together.
The growth characteristics of bacteria are better understood by studying the growth curve.
• Lag-phase During this phase bacteria become acclimated to their new surroundings. They are digesting food, developing enzymes and other things required for growth.
• Accelerated Growth-phase The bacteria are growing as fast as they can, since there is an excess of food. The cells are mostly dispersed, not sticking together.
• Declining Growth-phase Reproduction slows down because there is not an excess of food. A lot of food has been eaten and there are now a large number of bacteria to compete for remaining food, so the bacteria do not have enough remaining food to keep the growth rate at a maximum.
• Stationary-phase The number of bacteria is the highest possible, but not much food is left, so the bacteria cannot increase in number. There is some reproduction, but some cells are also dying, so the number of bacteria remain relatively constant. The bacteria have now lost their flagella and have a sticky substance covering the outside of the cell, allowing them to agglomerate into floc. In fact, the floc get big enough that if aeration and mixing were stopped, the floc could settle to the bottom.
• Death-phase The death rate increases with very little if any growth occurring. Therefore, the total number of living bacteria keeps reducing. The bacteria are just trying to keep alive.
F:M (Food to Microorganism ratio)
We measure the amount of biodegradable matter the bacteria use for food by measuring the amount of BOD (biochemical oxygen demand) or COD (chemical oxygen demand) in the influent to the aeration basin. We estimate the weight of microorganisms in the mixed liquor by measuring the amount of volatile suspended solids (VSS) in the activated sludge. We use this information to form a relationship called food to microorganism ratio (F/M ratio). The F/M ratio tells us something about growth and cell condition. If the F/M ratio is high, the bugs normally grow quite rapidly (because this means there is a lot of "food" available in comparison to the amount of microorganism); if the F/M ratio is low, the bug normally grow very slowly (because little food is available for growth).

The Use of Oxygen
Microorganisms need oxygen to live. Oxygen use and be used to determine the activity of the organisms.
- Actively growing organisms are rapidly metabolizing the food, so they are use oxygen at a rapid rate.
- We measure the rate at which oxygen is used by a test called the Oxygen Uptake Rate (OUR), or the Respiration Rate. It is measured in mg O2/hr/gm of MLSS.
- Normally a higher uptake rate is associated with high F/M ratios and younger sludges and a lower uptake rate is associated with lower F/M and older sludges. So, if you want a higher uptake rate, more sludge should be wasted. Less should be wasted if you want a lower F/M ratio.
The Formation of Floc
As bacteria begin growing, they generally develop into small chains or clumps. They are very active and motile and it is difficult for them to settle. They have not yet developed the slime layer which aids in their sticking together. So, when mixing occurs, the small chains or clumps are broken up and the bugs are dispersed, and they will not flocculate or settle.
As the sludge is allowed to age, the bugs lose their motility and accumulate more slime. Then the clumps and chains are better able to stick together. The clumps grow bigger and bigger until they form a floc. If the organisms are allowed to develop properly, under the right conditions, the floc get large and compact and begin to settle. The mixing in the aeration tank tends to keep the floc small since, even though the bugs are sticky, the bond formed holding the organisms together is not very strong. This is good because it allows the cells, food, and oxygen to contact each other.
Dissolved Oxygen
Oxygen is required by these bugs to metabolize food for cell maintenance and growth. Although the bugs need oxygen, some bugs can get along with less oxygen than others.
Each bug must have a concentration of dissolved oxygen of at least from 0.1-0.3 mg/L to function properly. So, it is important to maintain about 2 mg/L of D.O. in the activated sludge so that the bacteria that are contained in the floc can get oxygen. If the DO is less than 2 mg/L, the bugs on the outside of the floc use the DO before it can get to the center of the floc. If this happens, the bugs in the center may die causing the floc to break up.
The Effects of Mixing
Mixing is required to bring organisms, oxygen, and nutrients together, and to remove metabolic waste products. If there is not enough mixing, proper treatment will not take place because of lack of contact between the bugs, their food and oxygen. If too much mixing is provided, it can cause break up of floc or formation of unstable floc particles.

The Effects of pH
The enzymes which regulate many of the biochemical reaction in bacteria are very pH dependent. The optimum pH should be between 7.0 and 7.5 for the proper activated sludge microorganisms to dominate.
The Effects of Temperature
Biochemical reactions are very temperature dependent. Lower temperatures cause such reactions to be much slower. Thus, more bugs are required to do the same job during the winter than in the summer.
The Effects of Nutrients
Microorganisms require certain nutrients for growth. The basic nutrients of abundance in normal raw sewage are carbon (C), nitrogen (N), phosphorus (P), with the ratio of C:N:P ratio approximately equal to 100:10:1. In addition to C, N, and P, trace amounts of sodium (Na), Potassium (K), magnesium (Mg), iron (Fe), and many others are required. In normal municipal sewage, most of these nutrients are provided.
Most problems with nutrient deficiency occur when there is a lot of industrial wastes present. When proper nutrients are not available, the metabolism fails and a kind of bacterial fat (slime) will begin to accumulate around the cell. The cell slows down in activity because it cannot produce enough enzymes and because needed nutrients cannot penetrate the slime layer as they should. The sludge will not settle and BOD removal slows down.
Protozoa & Rotifers
The presence of particular types of protozoans is related to effluent quality and plant performance. Protozoans play secondary but important role in purification of aerobic wastewater.
The protozoans in the activated sludge treatment process fall into four major classes: amoebae, flagellates, and ciliates (free-swimming, crawling, and stalked).
• Amoebae
Amoebae are the most primitive, single-celled protozoans. They move by false feet. They are frequently present in raw influent, and their presence is short in the aeration basin. Amoebae can only multiply when there is an abundance of nutrients in the aeration tank. They move very slowly and it is difficult for them to compete for the limited amount of food available. They are only dominant in the aeration basin for a short time.
Amoebae feed on small organic particulates. When amoebae are present in large numbers in the aeration basin this usually indicates that there has been some sort of shock loading to the plant (there must be a lot of food available). Their presence may

also indicate that there is a low D.O. environment in the aeration basin, because they can tolerate very low amounts of D.O.
• Flagellates
Most flagellates absorb dissolved nutrients. The appear soon after amoebae begin to disappear and while there is still high concentrations of soluble food. Flagellates and bacteria both feed on organic nutrients in the sewage so as the nutrient level declines they have difficulty out-competing the bacteria for soluble food so, their numbers begin to decrease.
If large amounts of flagellates are present in the later stages of the activated sludge development this usually indicates that the wastewater still contains a large amount of soluble organic nutrients.
• Ciliates
Ciliates feed on bacteria, not on dissolved organics. While bacteria and flagellates compete for dissolved nutrients, ciliates compete with other ciliates and rotifers for bacteria. The presence of ciliates indicate a good sludge, because they dominate after the floc has been formed and after most of the organic nutrients have been removed.
o Free-swimming ciliates - These ciliates appear as flagellates begin to disappear. As the bacterial population increases, a lot of dispersed bacteria is available for feeding and as a lightly dispersed floc appears, free-swimming ciliates begin to dominate and feed on the increased numbers of bacteria.
o Crawling ciliates - As floc particles enlarge and stabilize, crawling ciliates graze on floc particles. Crawling ciliates out compete free-swimming ciliates for food because they can find food within the floc.
o Stalked ciliates - Stalked ciliates appear in the mature sludge. Within the mature sludge the crawling and stalked ciliates compete for dominance.
Factors Influencing Protozoa
Temperature
Most protozoans can survive and reproduce in a temperature range at which activated sludge processes are carried out. They grow best in ambient temperatures (15-25 oC).
pH
Protozoans are more sensitive to pH than floc-forming bacteria. They have an optimum pH range of 7.2 - 7.4 and a tolerance range of 6.0 - 8.0.
Dissolved Oxygen
Like bacteria, protozoan must have oxygen to survive. Thus lack of DO will severely limit both the kind and number of protozoans.

Nutrition
Most municipal wastewater treatment plants, however dilute, contains sufficient nutrients to support most of the protozoan associated with wastewater.
Rotifers
Rotifers are rarely found in large numbers in wastewater treatment processes. The principal role of rotifers is the removal of bacteria and the development of floc. Rotifers contribute to the removal of effluent turbidity by removing non-flocculated bacteria. Mucous secreted by rotifers at either the mouth opening or the foot aids in floc formation. Rotifers require a longer time to become established in the treatment process. Rotifers indicate increasing stabilization of organic wastes.
Introduction to Filament Identification
Filament Identification
In order to identify many of the following filament characteristics, the mixed liquor must be examined under 100X using immersion oil. It is difficult to see many of these characteristics under lower magnifications.
Filament Shape and Length
Filaments may be long, short, smoothly curved, coiled, irregularly bent, straight, or bundled.
Individual Cell Shape
Filamentous bacteria are made up of a chain of cells. The shape of the individual cells is a characteristic that can help us to identify the different filamentous bacterial types. Cell shape may be round, square, rectangular, oval, or discoid.
Cell Septa
The cell septa is the "line" which separates each individual cell which makes up the bacterial filament.
The septa are clearly seen in some filaments and is very difficult to see in others. Some septa are "indented" and some are not. Indentations and the ability to clearly see the cell septa are other characteristics which can help us to identify the different filamentous bacteria.
Motility
Motility is the ability of an organism to produce motion or to move.
Beggiatoa spp is only one filamentous bacterium found in activated sludge that is motile.

Intercellular Granules
Some filaments store by-products as intercellular granules (mostly sulfur granules).
Sulfur granules can be seen very clearly under phase contrast and are found usually in septic wastes. Sulfur granules are commonly found in Beggiatoa, Thiothrix and type 021N.
Branching
Branching may be "true" or "false". If a filament has true branching the intercellular fluids will flow freely throughout all the branches of the filament. Intercellular fluids cannot flow through false branches. In false branching the filament are simply attached to each other simulating a branch.
There are only two filaments which exhibit branching; one has true branching and the other false. Nocardia spp has true branching and Sphaerotilus natans exhibits false branching.
Sheath
The cells of some filamentous organisms are contained in a tight fitting sheath. The easiest way to detect a sheath is to look for "missing spaces" between the cells.
Some filaments which have a sheath are Haliscomenobactor hydrosis, Sphaerotilus natans, type 1701, type 0041, and type 0675.
Attached Growth
Some filaments have bacterial cells attached along the side, perpendicular to the filament.
There are three filaments on which this commonly occurs. Type 0041, type 0675, and type 1701.
Process Control
Microscopic examinations of activated sludge can help to assess the condition of the biomass in an aeration basin and the settleability of the sludge. It can also aid in the identification of filamentous bacteria that may cause problems in wastewater treatment plants.
Additional technical assistance with wastewater treatment plant operations is available from the DNR. Contact Jack Saltes in Madison at (608) 264-8954. For additional help from the DNR, you might also try the Laboratory Certification Home Page at http://dnr.wi.gov/org/es/science/lc/.
Floc Particles: Sizes and Shapes
When floc particles first develop in the activated sludge process, that is, at a relatively young sludge age, the particles are small and spherical. Because filamentous organism do not develop or elongate at relatively young sludge ages, the floc-forming bacteria can only "stick" or flocculate to each other in order to withstand shearing action.
Bacterial flocculation and the absence of filamentous organisms result in spherical floc particles.
As the sludge age increases and the short filamentous organism within the floc particles began to elongate, the floc forming bacteria now flocculate along the lengths of the filamentous organisms.
These organism provide increased resistance to shearing action and permit a significant increase in the number of floc-forming bacteria in the floc particles. The presence of long filamentous organisms results in a change in the size and shape of floc particles.
The floc particles increase in size to medium and large and change from spherical to irregular.
Factors Interrupting Floc Formation
• Young sludge age (< 3 days) • Toxicity (heavy metals etc.) • Slug discharge • Lack of active and abundant ciliated protozoan population • Excessive shearing • Excessive surfactant

Dispersed Growth
Dispersed growth is a population of bacteria that is suspended in the liquid portion of the mixed liquor. These bacteria are still growing rapidly and have not begin to flocculate. Most dispersed growth is bacterial.
Only a little dispersed growth should be present in a properly operating activated sludge process.
Ciliated protozoa play an important role in the removal of dispersed growth. Dispersed growth is also removed from the bulk medium by its adsorption to the surface of floc particles.
A significant amount of dispersed growth is present at the start-up of an activated sludge process. A lot of food is available, and the bacteria are very active and are multiplying rapidly. The presence of significant or excessive dispersed growth within the mixed liquor can also be due to the interruption of proper floc formation.
For more information on the interruption of floc formation see, Floc Particles, Sizes & Shapes.
Slime Bulking
Often in industrial and municipal activated sludge processes a nutrient deficiency may occur. The nutrients that are usually deficient in these processes are either nitrogen or phosphorus. This deficiency results in the production of nutrient deficient floc particles, loss of settleability, and, possibly billowy white or greasy gray foam on the surface of the aeration tank.
During a nutrient deficiency, the bacteria within the floc particles remove soluble BOD from the wastewater. However, when nitrogen or phosphorus is deficient, the soluble BOD is not degraded but it is stored within the floc particles as an exocellular polymer-like material. This slimy material interferes with settling and may cause foam upon aeration.
Operational Considerations
The solution usually involves addition of the limiting nutrient, such as ammonia to provide nitrogen, or phosphoric acid to provide phosphorus. There is usually enough nutrient if the ammonia plus nitrate in filtered (0.45 um) effluent is greater than 1 mg/L and the soluble orthophosphate is greater than 0.5 mg/L. However, in cases where easily degradable, soluble BOD is available, higher N and P concentrations may be necessary.

Toxicity
Toxicity assessment is one of the most valuable applications of microscopic observation of microorganisms in activate sludge. The higher life forms, particularly the ciliates and the rotifers, are generally the first to be impacted by toxic materials and may serve in essence as an in-plant biomonitoring test for toxicants or other adverse stresses.
The first noticeable sign of toxicity or stress is usually the slowing or stopping of cilia movement for these organisms and small flagellates and ciliates begin to predominate. This is an indication of the break up of the floc and an over abundance of free bacteria used by these organism as a food source.
Indications of toxicity upset include:
• Loss of the higher life forms in the activated sludge (these are the most toxic sensitive microbial components).
• A dispersed activated sludge biomass with poor floc formation and pin floc. • Unusually low oxygen use, caused by poor biomass growth. • Poor BOD removal.
What can you expect to see under the microscope if toxic conditions exist?
• There will be a sudden increase in flagellates. This is sometimes called a flagellate "bloom".
• The of protozoa and higher life forms will begin to die off • Break-up of floc, sometimes accompanied by foaming • Loss of BOD removal • Filamentous bulking upon process recovery. Filamentous bacteria are very often
the first to recover after a toxic upset.
Toxic wastes generally do not favor filaments directly (except in the case of H2S), rather upset conditions allow filaments to grow.
Microscopic examination of activated sludge can diagnose toxicity, however, this is usually "after the fact". A better method of toxicity detection is the use of oxygen uptake rate testing to detect toxicity early and to find the source.
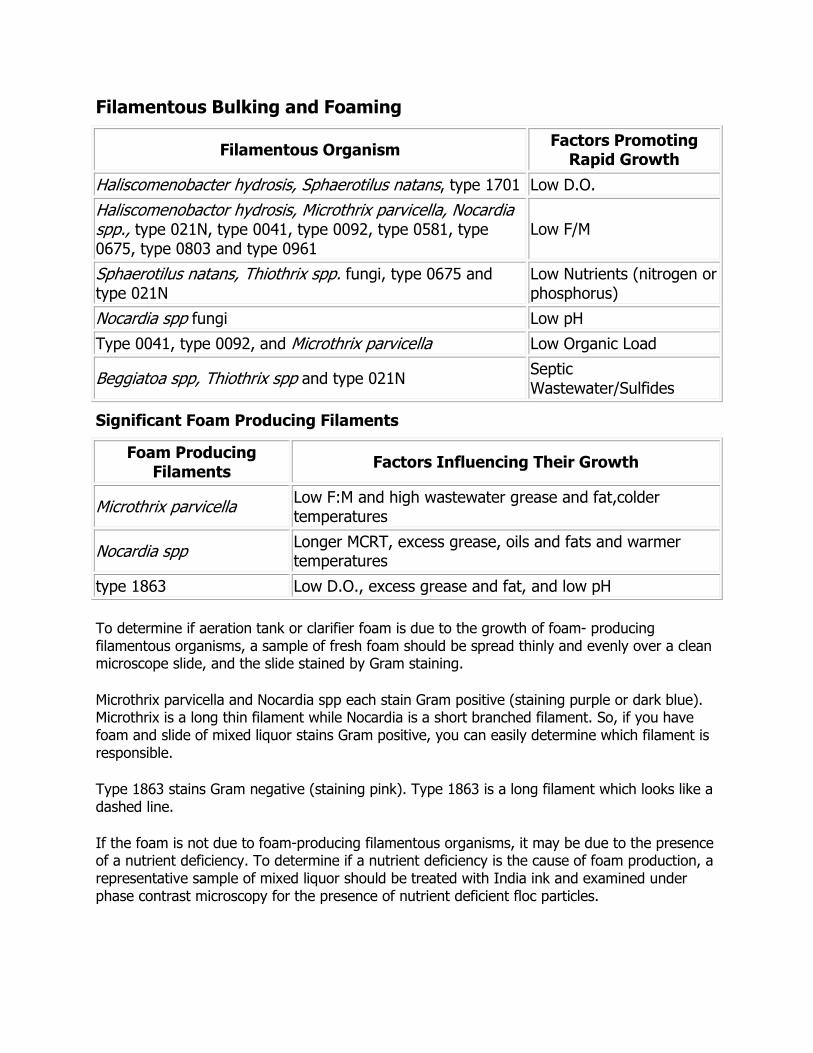
Filamentous Bulking and Foaming
Filamentous Organism Factors Promoting Rapid Growth
Haliscomenobacter hydrosis, Sphaerotilus natans, type 1701 Low D.O.
Haliscomenobactor hydrosis, Microthrix parvicella, Nocardia spp., type 021N, type 0041, type 0092, type 0581, type 0675, type 0803 and type 0961
Low F/M
Sphaerotilus natans, Thiothrix spp. fungi, type 0675 and type 021N
Low Nutrients (nitrogen or phosphorus)
Nocardia spp fungi Low pH
Type 0041, type 0092, and Microthrix parvicella Low Organic Load
Beggiatoa spp, Thiothrix spp and type 021N Septic Wastewater/Sulfides
Significant Foam Producing Filaments
Foam Producing Filaments
Factors Influencing Their Growth
Microthrix parvicella Low F:M and high wastewater grease and fat,colder temperatures
Nocardia spp Longer MCRT, excess grease, oils and fats and warmer temperatures
type 1863 Low D.O., excess grease and fat, and low pH
To determine if aeration tank or clarifier foam is due to the growth of foam- producing filamentous organisms, a sample of fresh foam should be spread thinly and evenly over a clean microscope slide, and the slide stained by Gram staining.
Microthrix parvicella and Nocardia spp each stain Gram positive (staining purple or dark blue). Microthrix is a long thin filament while Nocardia is a short branched filament. So, if you have foam and slide of mixed liquor stains Gram positive, you can easily determine which filament is responsible.
Type 1863 stains Gram negative (staining pink). Type 1863 is a long filament which looks like a dashed line.
If the foam is not due to foam-producing filamentous organisms, it may be due to the presence of a nutrient deficiency. To determine if a nutrient deficiency is the cause of foam production, a representative sample of mixed liquor should be treated with India ink and examined under phase contrast microscopy for the presence of nutrient deficient floc particles.
1
Presented at the 20th Annual USEPA National Operator Trainers Conference Buffalo, NY, June 8, 2003.
ACTIVATED SLUDGE MICROBIOLOGY PROBLEMS AND THEIR CONTROL Michael Richard, Ph.D. Sear-Brown Fort Collins, CO
CONTENTS I. Introduction II. Microbiology Problems and Their Causes
1. Poor Floc Formation, Pin Floc and Dispersed Growth Problems 2. Toxicity 3. Nitrification and Denitrification Problems 4. Nutrient Deficiency and Polysaccharide Bulking and Foaming 5. Zoogloeal Bulking and Foaming 6. Filamentous Bulking 7. Filamentous Foaming
III. Practical Control Methods for Filamentous Bulking and Foaming
1. Short Term Control Methods
a. Sludge Juggling b. Polymer Addition c. Chlorination
2. Long Term Control Methods
a. Low Dissolved Oxygen Problems b. Wastewater Septicity and Organic Acids c. Low F/M Conditions and Selectors d. Nutrient Deficiency e. Foaming Control
IV. Summary V. References and Additional Information

2
INTRODUCTION Many problems can develop in activated sludge operation that adversely affect effluent quality with origins in the engineering, hydraulic and microbiological components of the process. The real "heart" of the activated sludge system is the development and maintenance of a mixed microbial culture (activated sludge) that treats wastewater and which can be managed. One definition of a wastewater treatment plant operator is a "bug farmer", one who controls the aeration basin environment to favor good microbiology. This paper will discuss the types of microbiological problems that can occur in activated sludge operation. These include dispersed (non-settleable) growth, pin floc problems, zoogloeal bulking and foaming, polysaccharide ("slime") bulking and foaming, nitrification and denitrification problems, toxicity, and filamentous bulking and foaming. The best approach to troubleshooting the activated sludge process is based on microscopic examination and oxygen uptake rate (OUR) testing to determine the basic cause of the problem or upset and whether it is microbiological in nature. These methods are easy, fast and inexpensive compared to other approaches, and are generally understandable and accepted. MICROBIOLOGY PROBLEMS AND THEIR CAUSES Poor Floc Formation, Pin Floc and Dispersed Growth Problems Basic floc formation, required for activated sludge operation due to the use of gravity clarifiers, is due to a growth form of many species of natural bacteria. Floc-forming species share the characteristic of the formation of an extracellular polysaccharide ("slime") layer, also termed a glycocalyx. This material, which consists of polysaccharide, protein and sometimes cellulose fibrils, "cements" the bacteria together to form a floc. Floc formation occurs at lower growth rates and at lower nutrient levels, essentially starvation or stationary growth conditions. Floc-forming species may grow in a dispersed and non-settleable form if the growth rate is too fast. This latter condition, termed dispersed growth, occurs rarely in domestic waste activated sludge operation but occurs often in industrial waste treatment, generally due to high organic loading (high food to microorganism ratio (F/M) conditions). Here, no flocs develop and biomass settling does not occur, resulting in a very turbid effluent. The correct remedial action for a dispersed growth problem is a reduction in the F/M of the system, usually done by raising the MLSS concentration. Dispersed growth problems often occur after a toxicity or hydraulic washout event when the activated sludge biomass is low and high F/M conditions prevail. Small, weak flocs can be formed in activated sludge that are easily sheared and subject to hydraulic surge flotation in the final clarifier leading to a turbid effluent. These small flocs, termed pin floc, consist only of floc-forming bacteria without a filament backbone and usually
3
are <50um in diameter. Pin floc occurs most commonly at starvation conditions -- a very low F/M and long sludge age. Chronic toxicity can also cause a pin floc condition. Free floating filaments can, at times, cause a dispersed growth problem. Here, the cause is filament-specific and is the same as for filamentous bulking (discussed below). Toxicity Toxic shocks can be a severe problem in activated sludge operation. In a recent study, toxicity upset was experienced by approximately 10% of 25 Colorado activated sludge plants examined during one year. Toxicity problems were found to be a larger problem in small communities compared to larger cities, due to the lack of dilution of toxic releases in small systems. Examples of toxicity events were the washing of cement or lime trucks to a manhole, dumping of congealed diesel fuel to the sewer system, and overload of small systems with septage (which contains a high amount of organic acids and sulfides which can be toxic). Sulfide toxicity to activated sludge is more common than currently recognized. Sulfide may originate from outside the activated sludge system, from septic influent wastewater or from septage disposal, or it may originate "in-house", from anaerobic digester flows or from aeration basins or primary or final clarifiers with sludge build-up and anaerobic conditions. Hydrogen sulfide toxicity is highly pH dependent, due to the H2S form being the toxic agent and not HS-. The pKa for H2S is 7.0, indicating higher toxicity at a pH of 7 or less when H2S is predominant, and less toxicity as the pH increases above pH 7 and H2S dissociates. One mg/L of H2S reduces the activated sludge OUR by 50% at pH 7, and the H2S dose to give a 50% OUR reduction increases to 100 mg/L at pH values above pH 8. It is advised to add lime or other alkaline agent to the aeration basin to raise the pH to 7.5 or above if sulfide toxicity is occurring. Toxicity can be diagnosed microscopically, often in the following sequence: 1. an initial flagellate "bloom"; 2. subsequent complete die-off of protozoa and other higher life forms;
3. biomass deflocculation, often accompanied by foaming; 4. loss of BOD removal; and 5. filamentous bulking upon process recovery.
Toxic wastes generally do not favor filaments directly (except in the case of H2S); rather, upset conditions allow filaments to proliferate. For example, bulking by Sphaerotilus natans frequently follows a toxic upset due to a high F/M condition. Here the "true" F/M value may be many-fold that calculated based on total biomass present, due to low viability of the biomass. While microscopic observations can diagnose toxicity after the fact, a better method is use of the OUR test to detect toxicity early.

4
The OUR of an activated sludge fed increasing amounts of a nontoxic waste will initially rise with increasing waste additions to the test bottle, followed by no further increase in OUR with even higher waste additions. In contrast, the OUR of an activated sludge fed a toxic waste may increase initially with increasing waste strength, but will decrease rather dramatically at waste additions above a toxicity threshold value. A useful definition of microbial "death" is when the fed OUR is less than the basal endogenous OUR. The OUR test is simple (all that is required is as a BOD bottle and a dissolved oxygen probe) and usually takes less than two hours to perform. The normal OUR of the activated sludge must be known before hand, so run this test periodically to know what is normal for your plant. Nitrification and Denitrification Problems Nitrification can create problems in activated sludge operation. Many plants experience an upset condition with dispersed growth and filamentous bulking every spring when warmer temperatures induce nitrification. Some plants experience a loss of chlorine disinfection during nitrification onset, due to a transient period (weeks) of nitrite build-up. Nitrite has a significant chlorine demand (one part nitrite consumes one part chlorine) while ammonia and nitrate do not. A large problem in some plants is a low pH (to as low as pH = 6) caused by extensive nitrification and low wastewater alkalinity. This often causes pin floc and high effluent turbidity. Some plants reduce aeration to reduce nitrification or add soda ash, lime or magnesium hydroxide as a source of alkalinity if this becomes a problem. The use of lower dissolved oxygen concentration (1.0 mg/L or less) to control nitrification is not without the risk of inducing filamentous bulking by low dissolved oxygen filaments. Another problem caused by nitrification is denitrification. Here, bacteria common in the activated sludge floc respire using nitrate in place of free oxygen when it is lacking and release nitrogen gas as a by-product. This gas is only slightly soluble in water and small nitrogen gas bubbles form in the activated sludge and cause sludge blanket flotation in the final clarifier. An indication of the occurrence of denitrification can be obtained by holding the sludge in the settling test jar for several hours. If the sludge rises ("pops") within 2 hours or less, denitrification problems may be occurring. Denitrification problems are more prevalent during the warmer times of the year and can be more severe if a filamentous sludge is present, due to more extensive entrapment of the nitrogen gas bubbles by a filamentous sludge. Control of denitrification is either by control of nitrification (reduced sludge age or reduced aeration); or by reducing denitrification by removing the sludge faster from the final clarifier (increased RAS rates) or by increasing the dissolved oxygen concentration in the final clarifier. This can be done by increasing the aeration basin dissolved oxygen concentration especially at the clarifier end of the aeration basin. One method useful in severe cases is the addition of hydrogen peroxide as an oxygen source directly to the center well of the final clarifier. Nitrification and denitrification problems can be particularly troublesome in industrial waste systems where ammonia is supplemented. Here, inorganic nitrogen (ammonia or nitrate) must be

5
present in the aeration basin at all times to allow proper treatment and to avoid filamentous or slime bulking but must be kept below approximately 5 mg/L to avoid nitrification-denitrification problems (low pH and floating sludge). The common practice of batch addition of nutrients to the aeration basin often leads to denitrification problems due to periods of high nitrate concentration (above 5 mg/L). A number of industries, particularly papermills, have experienced a frothy, floating sludge in the aeration basin. This can lead to a significant amount of the sludge inventory in the foam, compromising process control. This problem occurs in systems with a high front-end organic loading and a long hydraulic detention time (2 days or more). Nitrification and denitrification occur at the back end of the system due to endogenous conditions there and the release of ammonia from the biomass. Nitrification and denitrification often occur together within the floc, with no finding of free nitrate when examined. Nutrient Deficiency and Polysaccharide Bulking and Foaming Nitrogen and phosphorus can be growth limiting if not present in sufficient amounts in the influent wastewater, a problem with industrial wastes and not domestic wastes. In general, a BOD5:N:P weight ratio in the wastewater of 100:5:1 is needed for complete BOD removal. Other nutrients such as iron or sulfur have been reported as limiting to activated sludge, but this is not common. Extracellular polysaccharide is produced by all activated sludge bacteria and is, in part, responsible for floc formation. Overproduction of this polysaccharide can occur at nutrient deficiency (and also oxygen deficiency or high F/M) which builds up in the sludge (it is poorly degraded) and leads to poor sludge settling, termed "slime bulking", and to problems in sludge dewatering. Normal activated sludge contains from 10 to 20% polysaccharide on a dry weight basis with the higher polysaccharide content occurring at younger sludge ages. Sludges with polysaccharide content above 20% may have settling and dewatering problems (values to 90% have been observed with some nutrient deficient industrial waste sludges). Signs of nutrient deficiency include: filamentous bulking; a viscous activated sludge that exhibits significant exopolysaccharide ("slime") when "stained" with India ink; and foam on the aeration basin that contains polysaccharide (which has surface active properties). One check for nutrient deficiency is to be sure that some ammonia or nitrate and ortho-phosphate remain in the effluent at all times. The recommended effluent total inorganic nitrogen (ammonia plus nitrate) and ortho-phosphorus concentrations are 1-2 mg/L to ensure sufficient nutrients. Note that total Kjeldahl nitrogen and total phosphorus are not used, as these may contain organically-bound nutrients, not rapidly biologically available ("bug bodies").
6
Zoogloea Bulking and Foaming A special case related to slime bulking is zoogleal bulking. Here, fingered zoogloea proliferate in activated sludge to the extent that sludge settling is hindered. Zoogloea overgrowth also causes reduced sludge dewatering. The responsible organism is Zoogloea ramigera, the "classical" floc-former. Here, large masses of this dendritic floc-former may physically interfere in sludge settling and compaction similar to filamentous bulking. Zoogloea occur at high F/M conditions and when specific organic acids and alcohols are high in amount due to septicity or low oxygen conditions. Note that the sludge polysaccharide values as measured by the anthrone test are normal (10-20%) even when zoogloea are high in amount, due to the particular types of biopolymers formed by these bacteria (amino-sugars that don't react in the anthrone polysaccharide test). The anthrone test is a good way to separate a zoogloea overgrowth problem from a low nutrient polysaccharide problem. Filamentous Bulking Filamentous bulking and foaming are common and serious problems in activated sludge operation, affecting most activated sludge plants at one time or another. Filamentous bulking is the number one cause of effluent noncompliance today in the U.S. An understanding of filamentous bulking and foaming, the causative filaments and their causes and control, has steadily increased over the past 20 years since Eikelboom and van Buijsen published their filament identification system in 1981 (Eikelboom and van Buijsen, 1981). This approach to filament identification has been updated and modified by Jenkins et al. (1993, 2003) and has become used worldwide. Once the causative filaments could be identified, at least to a recognized type, their causes could be determined and control measures appropriate to each filament found. A bulking sludge is defined as one that settles and compacts slowly. An operational definition often used is a sludge with a sludge volume index (SVI) of >150 ml/g. However, each plant has a specific SVI value where sludge builds up in the final clarifier and is lost to the final effluent, which can vary from a SVI <100 ml/g to >300 ml/g, depending on the size and performance of the final clarifier(s) and hydraulic considerations. Thus, a bulking sludge may or may not lead to a bulking problem, depending on the specific treatment plant's ability to contain the sludge within the clarifier. A certain amount of filamentous bacteria can be beneficial to the activated sludge process. A lack of filamentous bacteria can lead to small, easily sheared flocs (pin-floc) that settle well but leave behind a turbid effluent. Filaments serve as a "backbone" to floc structure, allowing the formation of larger, stronger flocs. The presence of some filaments also serves to catch and hold small particles during sludge settling, yielding a lower turbidity effluent. It is only when filaments grow in large amounts (approximately 107 um filaments per gram of activated sludge) that hindrance in sludge settling and compaction occurs. In concept, bulking can be envisioned as

7
the physical effects of the filaments on the close approach and compaction of the activated sludge flocs. Depending on the type of filament involved, two forms of interference in sludge settling occur: (1) interfloc-bridging - where the filaments extend from the floc surface and physically hold the floc particles apart; and (2) open-floc structure - where the filaments grow mostly within the floc and the floc grows around and attached to the filaments. Here, the floc becomes large, irregularly-shaped, and contains substantial internal voids. The untrained observer often overlooks this latter type of bulking. A bulking sludge can result in the loss of sludge inventory to the effluent, causing environmental damage and effluent violations. In severe cases, loss of the sludge inventory can lead to a loss of the plant's treatment capacity and failure of the process. Additionally, disinfection of the treated wastewater can become compromised by the excess solids present during bulking. In less severe cases, bulking leads to excessive return sludge recycle rates and problems in waste activated sludge disposal. Many problems in waste sludge thickening are really filamentous bulking problems. The true incidence of bulking in the U.S. is unknown but has been estimated to affect at least 60% of plants, either continuously or intermittently. Recent work in Colorado suggests that at least 90% of activated sludge plants experience a bulking episode at least once during the year. Bulking may be one of the main reasons why approximately 50% of U.S. activated sludge plants don't consistently meet their effluent discharge standards. Early microbiological investigations into filamentous organisms found in activated sludge were hampered by a lack of knowledge concerning the types of filaments that may occur. Usually, Sphaerotilus natans was diagnosed, often without adequate identification. However, it is now known that approximately 25 different filamentous bacteria commonly occur in activated sludge and each may lead to operational problems. D.H. Eikelboom in Holland (Water Research 9:365, 1975) provided a rational basis to "identify" the different filamentous bacteria found in activated sludge. This identification system is based on filament characteristics as viewed under phase contrast microscopy for live samples (in situ) and two simple staining reactions: the Gram and Neisser stain. Each filament can be "classified" using a four-digit code, avoiding the earlier problems of lack of specific scientific names. This is important as many of the filaments found in activated sludge have not been isolated in pure culture and hence their identity remains unknown. As these filaments are isolated and properly named (a current research thrust), generic names replace the four digit number code. Hence, the current list of filaments is a hybrid between numbers and genus names. Currently there are 24 recognized filaments (or groups of related filaments in some cases) that cause activated sludge bulking or foaming. These are given in Table 1.

8
Table 1. Recognized Filaments That Cause Activated Sludge Bulking or Foaming Sphaerotilus natans Microthrix parvicella* type 1701 Nocardia spp.** Haliscomenobacter hydrossis Nostocoida limcola I, II & III type 021N type 0961 Thiothrix I and II type 0581 Beggiatoa spp. type 0092 type 0914 type 0411 type 0041 type 1863** type 0675 fungi type 1851 actinomycetes type 0803 ------------------------------------------------------------------------------------------------ * this filament causes both bulking and foaming. ** these filaments cause foaming only. Causes for almost all of the different filaments are now known (there is always a need to improve this information). Filament causes have been determined using three separate approaches. First, a number of filaments have been isolated in pure culture and their competitive growth abilities examined in laboratory studies. Many of these studies are summarized by Jenkins et al. (1993; 2003). This approach has been successful for S. natans, type 1701, Haliscomenobacter hydrossis, type 021N, Thiothrix I and II, and Microthrix parvicella. Second, the author has microscopically examined and identified the filaments in over 10,000 activated sludge samples over the past 20 years. This extensive database has been analyzed for positive and negative statistical associations between the different filaments. This has resulted in a number of positive associations between filaments of known and unknown causes, establishing a probable cause for the filament of unknown cause. Alternately, a filament of unknown cause may be negatively associated with a filament of known cause, indicating that these filaments do not share a common cause. Third, practical experience at trial and error successful control methods in plants with a bulking or foaming problem has shown the cause for some filaments not found in the above approaches. CAUSES OF FILAMENTS A summary of the conditions that cause filament growth and the filaments associated with each of these conditions is given in Table 2. There are six environments or growth conditions that cause the overgrowth of filaments in activated sludge. Four of these occur in municipal wastewater systems while all six occur in industrial wastewater systems, with two specific only
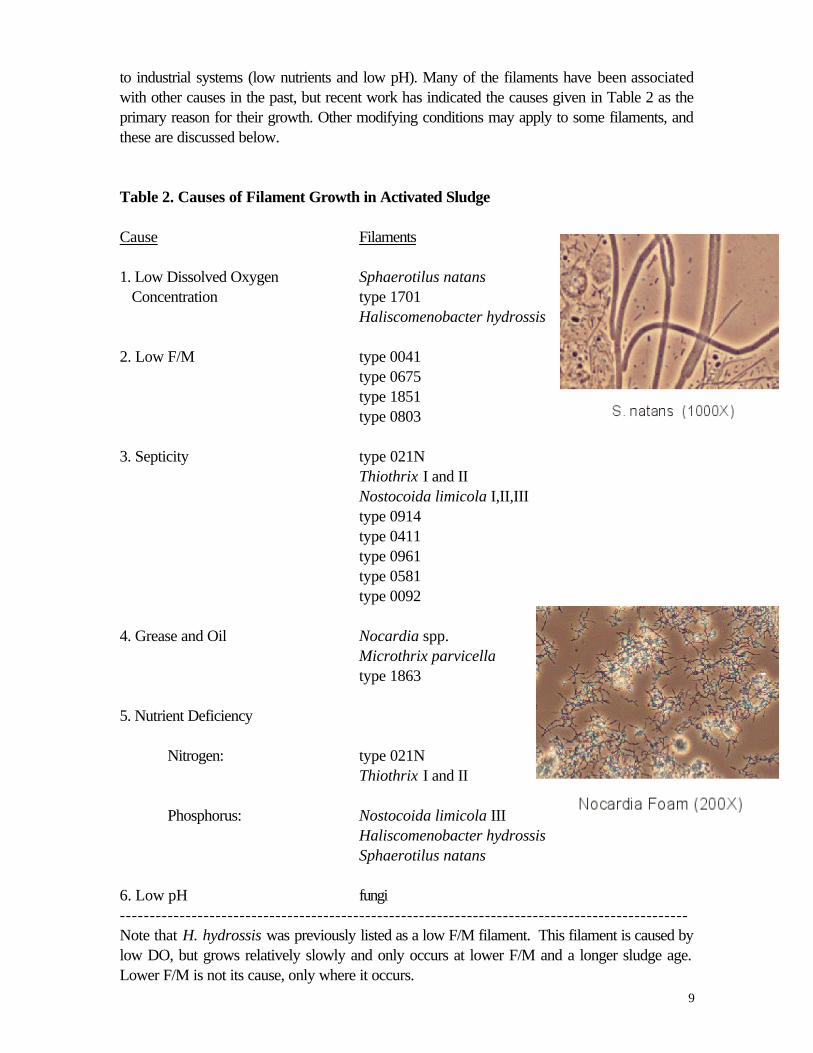
9
to industrial systems (low nutrients and low pH). Many of the filaments have been associated with other causes in the past, but recent work has indicated the causes given in Table 2 as the primary reason for their growth. Other modifying conditions may apply to some filaments, and these are discussed below. Table 2. Causes of Filament Growth in Activated Sludge Cause Filaments 1. Low Dissolved Oxygen Sphaerotilus natans Concentration type 1701 Haliscomenobacter hydrossis 2. Low F/M type 0041 type 0675 type 1851 type 0803 3. Septicity type 021N Thiothrix I and II Nostocoida limicola I,II,III type 0914 type 0411 type 0961 type 0581 type 0092 4. Grease and Oil Nocardia spp. Microthrix parvicella type 1863 5. Nutrient Deficiency Nitrogen: type 021N Thiothrix I and II Phosphorus: Nostocoida limicola III Haliscomenobacter hydrossis Sphaerotilus natans 6. Low pH fungi ----------------------------------------------------------------------------------------------- Note that H. hydrossis was previously listed as a low F/M filament. This filament is caused by low DO, but grows relatively slowly and only occurs at lower F/M and a longer sludge age. Lower F/M is not its cause, only where it occurs.

10
Six specific causes of filament growth and bulking are currently recognized (see Table 2). The information in Table 2 is now used in reverse to the way that it was developed -- from the identification of the most significant filaments present in a bulking sludge, the "cause" for such growth can be determined. Note that some filaments have more than one cause as shown in Table 2. The combination of conditions listed may favor bulking by a particular filament more so than any single condition. It is important to perform filament identification early in a bulking episode to identify the causative filament. Once bulking continues for some time, process upset can lead to the proliferation of other filament types (secondary filaments) which can confuse diagnosis of the real cause. Today, many activated sludge plants regularly monitor the occurrence and abundance of filaments in their sludge, which has become an important process control tool. This often leads to "heading off" a bulking episode before it becomes serious. Since the microbial population in activated sludge changes slowly in most cases, generally requiring 2-3 sludge ages to radically change, this microscopic observation needs to be performed only at weekly intervals. However, during a period of bulking onset or during application of remedial actions such as chlorination, daily observation of the activated sludge is warranted. Filamentous Foaming A brief review of activated sludge foams and their causes is given in Table 3. Use of microscopic examination can readily diagnose most of these, particularly when filaments are involved. Table 3. Description and Causes of Activated Sludge Foams Foam Description Cause(s) thin, white to grey foam low cell residence time or "young" sludge
(startup foam) white, frothy, billowing foam once common due to nonbiodegradable
detergents (now uncommon) pumice-like, grey foam (ashing)
excessive fines recycle from other processes (e.g. anaerobic digesters)
thick sludge blanket on the final clarifier(s) denitrification
thick, pasty or slimy, greyish foam (industrial systems only)
nutrient-deficient foam; foam consists of polysaccharide material released from the floc
thick, brown, stable foam enriched in filaments
filament-induced foaming, caused by Nocardia, Microthrix or type 1863
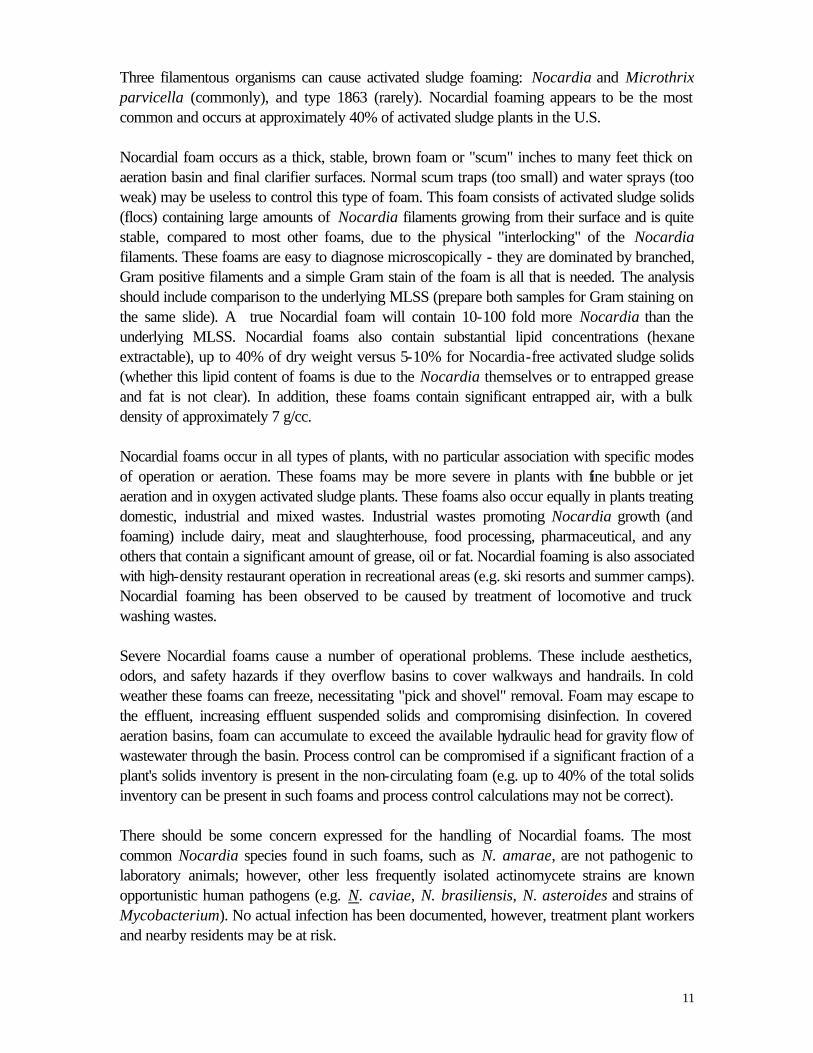
11
Three filamentous organisms can cause activated sludge foaming: Nocardia and Microthrix parvicella (commonly), and type 1863 (rarely). Nocardial foaming appears to be the most common and occurs at approximately 40% of activated sludge plants in the U.S. Nocardial foam occurs as a thick, stable, brown foam or "scum" inches to many feet thick on aeration basin and final clarifier surfaces. Normal scum traps (too small) and water sprays (too weak) may be useless to control this type of foam. This foam consists of activated sludge solids (flocs) containing large amounts of Nocardia filaments growing from their surface and is quite stable, compared to most other foams, due to the physical "interlocking" of the Nocardia filaments. These foams are easy to diagnose microscopically - they are dominated by branched, Gram positive filaments and a simple Gram stain of the foam is all that is needed. The analysis should include comparison to the underlying MLSS (prepare both samples for Gram staining on the same slide). A true Nocardial foam will contain 10-100 fold more Nocardia than the underlying MLSS. Nocardial foams also contain substantial lipid concentrations (hexane extractable), up to 40% of dry weight versus 5-10% for Nocardia-free activated sludge solids (whether this lipid content of foams is due to the Nocardia themselves or to entrapped grease and fat is not clear). In addition, these foams contain significant entrapped air, with a bulk density of approximately 7 g/cc. Nocardial foams occur in all types of plants, with no particular association with specific modes of operation or aeration. These foams may be more severe in plants with fine bubble or jet aeration and in oxygen activated sludge plants. These foams also occur equally in plants treating domestic, industrial and mixed wastes. Industrial wastes promoting Nocardia growth (and foaming) include dairy, meat and slaughterhouse, food processing, pharmaceutical, and any others that contain a significant amount of grease, oil or fat. Nocardial foaming is also associated with high-density restaurant operation in recreational areas (e.g. ski resorts and summer camps). Nocardial foaming has been observed to be caused by treatment of locomotive and truck washing wastes. Severe Nocardial foams cause a number of operational problems. These include aesthetics, odors, and safety hazards if they overflow basins to cover walkways and handrails. In cold weather these foams can freeze, necessitating "pick and shovel" removal. Foam may escape to the effluent, increasing effluent suspended solids and compromising disinfection. In covered aeration basins, foam can accumulate to exceed the available hydraulic head for gravity flow of wastewater through the basin. Process control can be compromised if a significant fraction of a plant's solids inventory is present in the non-circulating foam (e.g. up to 40% of the total solids inventory can be present in such foams and process control calculations may not be correct). There should be some concern expressed for the handling of Nocardial foams. The most common Nocardia species found in such foams, such as N. amarae, are not pathogenic to laboratory animals; however, other less frequently isolated actinomycete strains are known opportunistic human pathogens (e.g. N. caviae, N. brasiliensis, N. asteroides and strains of Mycobacterium). No actual infection has been documented, however, treatment plant workers and nearby residents may be at risk.
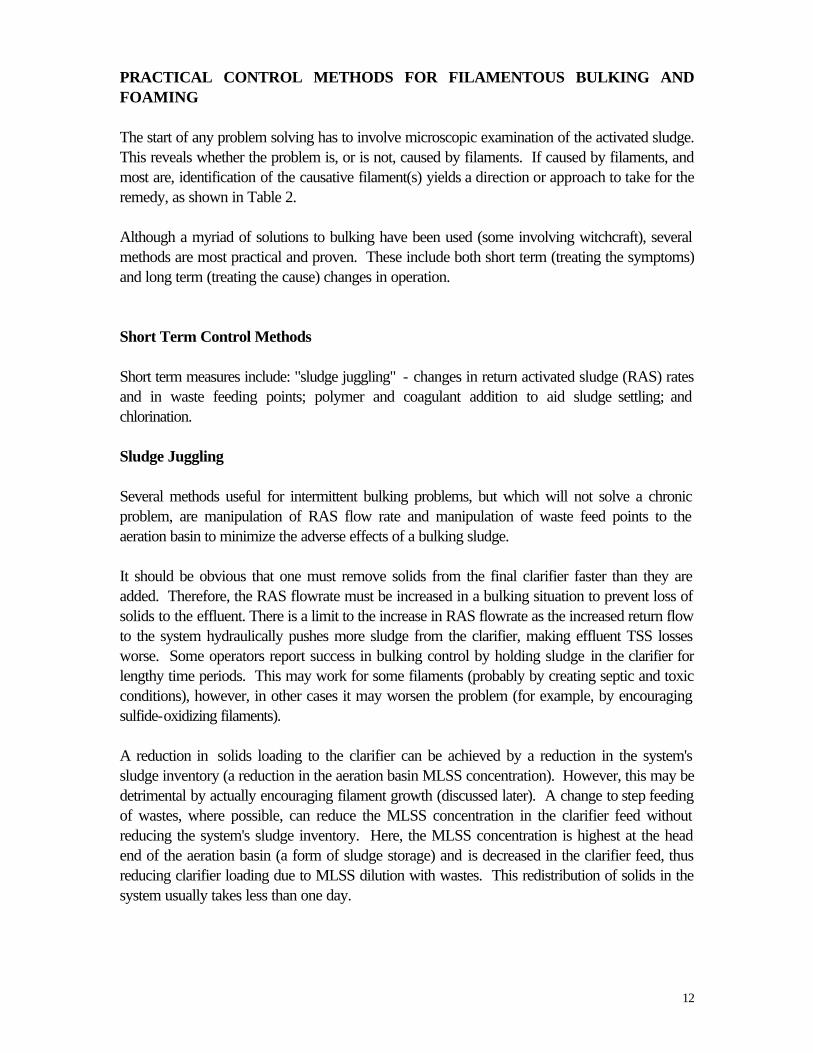
12
PRACTICAL CONTROL METHODS FOR FILAMENTOUS BULKING AND FOAMING The start of any problem solving has to involve microscopic examination of the activated sludge. This reveals whether the problem is, or is not, caused by filaments. If caused by filaments, and most are, identification of the causative filament(s) yields a direction or approach to take for the remedy, as shown in Table 2. Although a myriad of solutions to bulking have been used (some involving witchcraft), several methods are most practical and proven. These include both short term (treating the symptoms) and long term (treating the cause) changes in operation. Short Term Control Methods Short term measures include: "sludge juggling" - changes in return activated sludge (RAS) rates and in waste feeding points; polymer and coagulant addition to aid sludge settling; and chlorination. Sludge Juggling Several methods useful for intermittent bulking problems, but which will not solve a chronic problem, are manipulation of RAS flow rate and manipulation of waste feed points to the aeration basin to minimize the adverse effects of a bulking sludge. It should be obvious that one must remove solids from the final clarifier faster than they are added. Therefore, the RAS flowrate must be increased in a bulking situation to prevent loss of solids to the effluent. There is a limit to the increase in RAS flowrate as the increased return flow to the system hydraulically pushes more sludge from the clarifier, making effluent TSS losses worse. Some operators report success in bulking control by holding sludge in the clarifier for lengthy time periods. This may work for some filaments (probably by creating septic and toxic conditions), however, in other cases it may worsen the problem (for example, by encouraging sulfide-oxidizing filaments). A reduction in solids loading to the clarifier can be achieved by a reduction in the system's sludge inventory (a reduction in the aeration basin MLSS concentration). However, this may be detrimental by actually encouraging filament growth (discussed later). A change to step feeding of wastes, where possible, can reduce the MLSS concentration in the clarifier feed without reducing the system's sludge inventory. Here, the MLSS concentration is highest at the head end of the aeration basin (a form of sludge storage) and is decreased in the clarifier feed, thus reducing clarifier loading due to MLSS dilution with wastes. This redistribution of solids in the system usually takes less than one day.

13
Polymer and Coagulant Addition There exist several methods of chemical addition to enhance activated sludge settling. Most used are synthetic, high molecular weight, anionic polymers alone or in combination with cationic polymers that serve to overcome the physical effects of filaments on sludge settling. These are usually added to the MLSS as it leaves the aeration basin or to the secondary clarifier center well. Use of polymer does not significantly increase waste sludge production but can be quite expensive, up to $450. per million gallons treated (obviously this is only used if absolutely necessary). A polymer supply company should be consulted for advice on selection of a polymer and its dosage (the chemical composition of most polymers is a trade secret). Jar testing should be performed to determine the type of polymer needed and its dosage, which is quite plant specific. Further, this jar testing needs to be repeated often, as the needed polymer and its dosage can change, particularly if the filament type(s) change. In some instances, inorganic coagulants/precipitants such as lime or ferric chloride can be beneficial. These produce a voluminous precipitate that sweeps down the activated sludge, improving settling. Sludge production may be significantly increased if these are used. The weighting action of inert biological solids has also been used to aid sludge settling in activated sludge modifications such as the Hatfield or Kraus processes that recirculate anaerobic digester contents through the aeration basin. Some papermills intentionally release fiber or clay to the wastewater system to help sludge settling during a bulking episode. Chlorination Two toxicants, chlorine and hydrogen peroxide, have been used successfully to control filamentous organisms and stop a bulking episode. Chlorine is most widely used as it is inexpensive and available on-site at most plants, and only this will be discussed here. Chlorination for bulking control is widespread, used by more than 50% of plants. The goal of chlorination is to expose the activated sludge to sufficient chlorine to damage filaments extending from the floc surface while leaving organisms within the floc largely untouched. Filamentous and floc-forming bacteria do not appear to significantly differ in their chlorine susceptibility. Chlorine dosage is adjusted such that its concentration is lethal at the floc surface but is sublethal within the floc, due to chlorine consumption as it penetrates into the floc. This is analogous to "peeling an orange" and removing the filaments attached to its surface. It should be pointed out that chlorination is not a cure-all for all activated sludge microbiological problems. Chlorination will actually make problems worse if the problem is non-filamentous, e.g. slime bulking or poor floc development. Chlorine can be applied from a chlorinator using chlorine gas feed or as a liquid hypochlorite. A separate chlorinator should be dedicated to bulking control and an independent rotameter and sampling point in this chlorine line is needed. The chlorine addition point is of most importance and should be at a point where the sludge is concentrated, raw wastes are at a minimum, and at
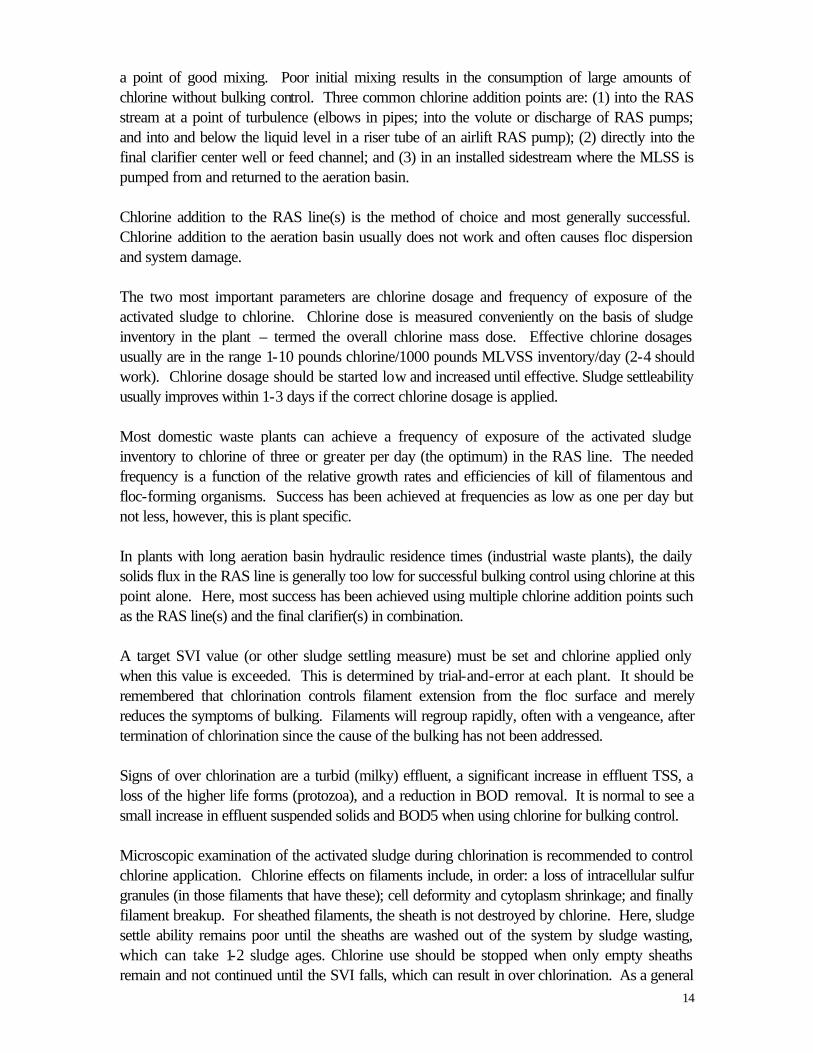
14
a point of good mixing. Poor initial mixing results in the consumption of large amounts of chlorine without bulking control. Three common chlorine addition points are: (1) into the RAS stream at a point of turbulence (elbows in pipes; into the volute or discharge of RAS pumps; and into and below the liquid level in a riser tube of an airlift RAS pump); (2) directly into the final clarifier center well or feed channel; and (3) in an installed sidestream where the MLSS is pumped from and returned to the aeration basin. Chlorine addition to the RAS line(s) is the method of choice and most generally successful. Chlorine addition to the aeration basin usually does not work and often causes floc dispersion and system damage. The two most important parameters are chlorine dosage and frequency of exposure of the activated sludge to chlorine. Chlorine dose is measured conveniently on the basis of sludge inventory in the plant – termed the overall chlorine mass dose. Effective chlorine dosages usually are in the range 1-10 pounds chlorine/1000 pounds MLVSS inventory/day (2-4 should work). Chlorine dosage should be started low and increased until effective. Sludge settleability usually improves within 1-3 days if the correct chlorine dosage is applied. Most domestic waste plants can achieve a frequency of exposure of the activated sludge inventory to chlorine of three or greater per day (the optimum) in the RAS line. The needed frequency is a function of the relative growth rates and efficiencies of kill of filamentous and floc-forming organisms. Success has been achieved at frequencies as low as one per day but not less, however, this is plant specific. In plants with long aeration basin hydraulic residence times (industrial waste plants), the daily solids flux in the RAS line is generally too low for successful bulking control using chlorine at this point alone. Here, most success has been achieved using multiple chlorine addition points such as the RAS line(s) and the final clarifier(s) in combination. A target SVI value (or other sludge settling measure) must be set and chlorine applied only when this value is exceeded. This is determined by trial-and-error at each plant. It should be remembered that chlorination controls filament extension from the floc surface and merely reduces the symptoms of bulking. Filaments will regroup rapidly, often with a vengeance, after termination of chlorination since the cause of the bulking has not been addressed. Signs of over chlorination are a turbid (milky) effluent, a significant increase in effluent TSS, a loss of the higher life forms (protozoa), and a reduction in BOD removal. It is normal to see a small increase in effluent suspended solids and BOD5 when using chlorine for bulking control. Microscopic examination of the activated sludge during chlorination is recommended to control chlorine application. Chlorine effects on filaments include, in order: a loss of intracellular sulfur granules (in those filaments that have these); cell deformity and cytoplasm shrinkage; and finally filament breakup. For sheathed filaments, the sheath is not destroyed by chlorine. Here, sludge settle ability remains poor until the sheaths are washed out of the system by sludge wasting, which can take 1-2 sludge ages. Chlorine use should be stopped when only empty sheaths remain and not continued until the SVI falls, which can result in over chlorination. As a general

15
observation, chlorination should be stopped when about 70% of the cells are damaged or missing in a filament. One argument to chlorine use in bulking control is the possibility of the production of chlorination by-products. This is unlikely since the chlorine is short-lived in activated sludge (minutes) and applied at a low dosage (lower than used in effluent disinfection). Chlorine cannot be used if waste constituents react with chlorine to form by-products such as petrol-chemical or phenol wastes. Long Term Control Methods Long term measures include activities such as: control of influent waste septicity (organic acids and H2S); nutrient additions (industrial waste systems only); changes in aeration; and changes in biomass concentration or changes in waste feeding pattern. These control measures will be expanded upon below. In addition, control of foaming problems will be addressed at the end of this paper. Low Dissolved Oxygen Problems In general, the rate of BOD removal is near maximum at 1.0 mg/L dissolved oxygen (DO) concentration, while the rate of nitrification is near maximum at 2.0 mg/L DO. However, the actual DO concentration within the biological flocs is less than that measured in the bulk solution around the flocs, due to oxygen use as it penetrates into the flocs. Low aeration basin DO leads to bulking by several filaments: S. natans, type 1701 and H. hydrossis. The DO concentration needed to control these filaments is not a constant, rather, is a function of the organic loading rate (F/M) of the system (Palm et al., 1980). At F/M values of about 0.5 or less, a DO concentration of 2.0 mg/L usually controls these filaments. However, at higher F/M values a DO value of greater than 2.0 mg/L may be needed. This is due to the need to keep the floc interiors aerobic, and this is more difficult at higher F/M values where the OUR of the sludge is high. The DO concentration in the bulk solution around the flocs has to be high enough to maintain an aerobic floc interior. Since oxygen moves into the floc by diffusion, its bulk concentration needs to be high enough to reach the floc centers before becoming depleted. A bulk solution DO concentration of 4.0 mg/L or more has been needed to prevent these filaments in some industrial wastewater systems operated at high F/M values of >0.5. Note that raising the MLSS concentration causes a reduction in the system F/M and OUR, and this change can alleviate oxygen limitation within the flocs and control the low DO filaments. Low DO filaments have been eliminated from many systems by an increase in the MLSS concentration.

16
Control of low DO bulking is by raising the aeration basin DO concentration, if possible, or by raising the aeration basin MLSS concentration to decrease the F/M (both should be done concurrently). Note that this action is opposite to what intuition directs -- to reduce the MLSS concentration, since less biomass needs less oxygen (wrong! - the F/M is actually increased at lower MLSS concentration). An increase in the RAS rate may also be beneficial, as this brings biomass back to the aeration basin where it helps lower the F/M. A common experience is that it takes a higher aeration basin DO concentration to "cure" low DO bulking than to prevent it in the first place. Often, a short term bulking control option is used, most often chlorination, to control this bulking problem. Wastewater Septicity and Organic Acids Septicity is the term used to describe the condition where the wastewater becomes anaerobic and anaerobic bacteria ferment organic materials to organic acids such as acetic, propionic, butyric and valeric acids. Sulfate reducing bacteria also convert sulfate to hydrogen sulfide at this condition. A septic wastewater thus contains a relatively high amount of organic acids and hydrogen sulfide. A number of filaments grow on organic acids and some hydrogen sulfide (type 021N, Thiothrix I and II, type 0914 and Beggiatoa). Observation of these filaments with intracellular sulfur granules is a tip-off of a septicity problem and high hydrogen sulfide concentration. An organic acid concentration of >100 mg/L and a sulfide concentration of >1-2 mg/L usually causes an overgrowth of these bacteria. Septicity can occur ahead of the plant, in the collection system, or can occur in the treatment plant. Common locations of septicity in a collection system include lift stations, force mains and long, stagnant lines. Influent septicity is usually indicated by odors (sulfide or "rotten egg" smell), a dark color to the wastewater, and corrosion. High amounts of organic acids and sulfides also occur in septage. These filaments may occur due to a high loading of septage. Some industrial wastewaters also contain a high amount of organic acids, such as wastewater from pickling and textile dyeing operations. Septicity can also occur in the treatment plant. Common locations of septicity include poorly aerated or poorly mixed equalization basins; septic primary clarifiers; poorly mixed aeration basins; septic final clarifiers; and septic sludge processing side-stream returns. A common cause of septicity is the use of a primary clarifier as a sludge thickening tank or return of waste activated sludge to a primary clarifier. Septicity can be tested for by analyzing the various basin influents and effluents for their organic acid content, using the distillation and pH titration method in Standard Methods (the same test as used for anaerobic digester operation). An organic acid concentration >100 mg/L is high and would account for the growth of these filaments. Hydrogen sulfide can also be tested for
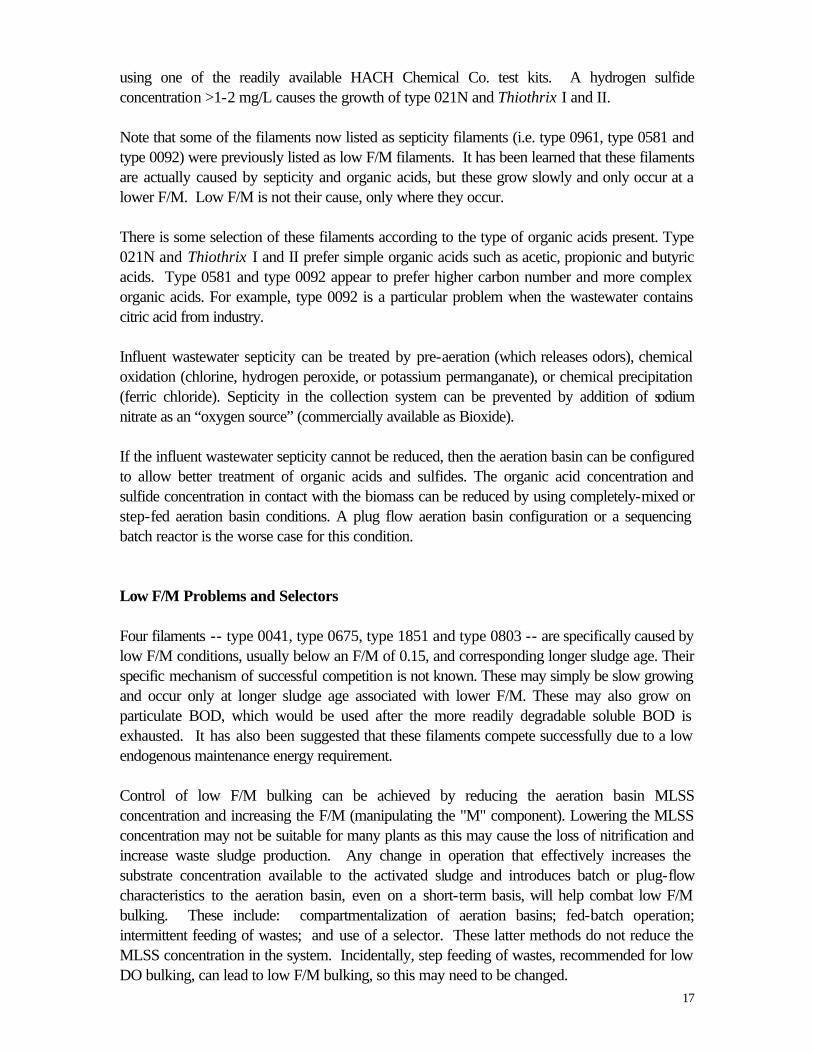
17
using one of the readily available HACH Chemical Co. test kits. A hydrogen sulfide concentration >1-2 mg/L causes the growth of type 021N and Thiothrix I and II. Note that some of the filaments now listed as septicity filaments (i.e. type 0961, type 0581 and type 0092) were previously listed as low F/M filaments. It has been learned that these filaments are actually caused by septicity and organic acids, but these grow slowly and only occur at a lower F/M. Low F/M is not their cause, only where they occur. There is some selection of these filaments according to the type of organic acids present. Type 021N and Thiothrix I and II prefer simple organic acids such as acetic, propionic and butyric acids. Type 0581 and type 0092 appear to prefer higher carbon number and more complex organic acids. For example, type 0092 is a particular problem when the wastewater contains citric acid from industry. Influent wastewater septicity can be treated by pre-aeration (which releases odors), chemical oxidation (chlorine, hydrogen peroxide, or potassium permanganate), or chemical precipitation (ferric chloride). Septicity in the collection system can be prevented by addition of sodium nitrate as an “oxygen source” (commercially available as Bioxide). If the influent wastewater septicity cannot be reduced, then the aeration basin can be configured to allow better treatment of organic acids and sulfides. The organic acid concentration and sulfide concentration in contact with the biomass can be reduced by using completely-mixed or step-fed aeration basin conditions. A plug flow aeration basin configuration or a sequencing batch reactor is the worse case for this condition. Low F/M Problems and Selectors Four filaments -- type 0041, type 0675, type 1851 and type 0803 -- are specifically caused by low F/M conditions, usually below an F/M of 0.15, and corresponding longer sludge age. Their specific mechanism of successful competition is not known. These may simply be slow growing and occur only at longer sludge age associated with lower F/M. These may also grow on particulate BOD, which would be used after the more readily degradable soluble BOD is exhausted. It has also been suggested that these filaments compete successfully due to a low endogenous maintenance energy requirement. Control of low F/M bulking can be achieved by reducing the aeration basin MLSS concentration and increasing the F/M (manipulating the "M" component). Lowering the MLSS concentration may not be suitable for many plants as this may cause the loss of nitrification and increase waste sludge production. Any change in operation that effectively increases the substrate concentration available to the activated sludge and introduces batch or plug-flow characteristics to the aeration basin, even on a short-term basis, will help combat low F/M bulking. These include: compartmentalization of aeration basins; fed-batch operation; intermittent feeding of wastes; and use of a selector. These latter methods do not reduce the MLSS concentration in the system. Incidentally, step feeding of wastes, recommended for low DO bulking, can lead to low F/M bulking, so this may need to be changed.
18
Filamentous bulking by the low F/M filaments is most common in completely-mixed aeration basin systems at low aeration basin substrate (BOD) concentration. Intermittently-fed and plug-flow systems are more resistant to this type of bulking. This observation has lead to the use of selectors where the RAS and the influent wastewater mix for a short time prior to the main aeration basin. A selector is a mixing basin or channel where RAS and influent wastes mix prior to the aeration basin. Selector design is empirical at this time. Successful examples involve a 15-30 minute contact time of the RAS and influent waste; are aerated; and achieve at least an 80% removal of soluble BOD5 through the selector. Several newer designs are either operated anoxic (no free oxygen but nitrate present) or anaerobic, however, these are too new to state their general usefulness. Design and operation of selectors for filament control is beyond the scope of this paper, and the interested reader is directed to Jenkins et al. (1993, 2003) for further information. A selector can be too large or too small in size to properly function. The goal is to provide a short term, high substrate condition which favors certain floc-formers but which discourages filaments. These floc-formers appear to rapidly store BOD as cellular storage products in the selector, which they use later for growth in the main aeration basin (they pack their own "lunch bags" in the selector). If the selector is too large, the substrate concentration achieved may not be high enough to encourage these special floc-formers and discourage filaments. If too small, insufficient time may be available for substrate uptake and storage. Also, a selector that is too small may cause the floc-formers to shunt carbonaceous substrate to exocellular polymer that can increase the SVI of the sludge ("slime bulking") and pose problems in waste sludge dewatering. The best approach is to try several selector sizes, using a larger basin or channel with movable baffles or exit gates. Selectors are specific tools to combat low F/M filaments and are not needed by all plants. There have been many instances of inappropriate selector use where they actually made the problem worse, for example, where bulking was caused by low DO, nutrient deficiency or septicity. Nutrient Deficiency Nitrogen and phosphorus can be growth limiting if not present in sufficient amounts in influent wastewater, a problem with industrial wastes and not domestic wastes. In general, a BOD5:N:P weight ratio in the wastewater of 100:5:1 is needed for complete BOD removal. Other nutrients such as iron or sulfur have been reported as limiting to activated sludge, but this is not common. Signs of nutrient deficiency include: filamentous bulking by several specific filaments (see Table 2); a viscous activated sludge which exhibits significant polysaccharide ("slime") when "stained" with India ink; and foam on the aeration basin which contains a high amount of polysaccharide (which has surface active properties). One check for nutrient deficiency is to be sure that at
19
least 1.0 mg/L total inorganic nitrogen (TIN = ammonia plus nitrite plus nitrate) and 0.5 - 1.0 mg/L ortho-phosphorus (soluble phosphorus) remain in the effluent at all times. The best location to test for nutrient residuals is the feed from the aeration basin to the final clarifier(s). Sometimes nutrients are released from the sludge at endogenous conditions in the final clarifier(s), falsely elevating the effluent nutrient concentrations. If needed, nutrients should be dosed to the incoming wastewater or the aeration basin. Nitrogen sources include: anhydrous ammonia, urea, and ammonium salts ((NH4)2SO4, NH4Cl or NH4NO3). Both ammonia and nitrate are nitrogen sources for growth. Phosphorus sources include: H3PO4, Na2PO4 and (NH4)2PO4 (among others). In systems treating mixed domestic and industrial wastes, only total inorganic nitrogen (TIN) and soluble ortho-phosphorus should be used to calculate nutrient availability. Organically combined nitrogen and phosphorus (Kjeldahl nitrogen and total phosphorus) may not be hydrolyzed fast enough by the microorganisms in the activated sludge to keep pace with BOD use. Also, the nutrient addition rate should match the influent BOD strength as much as possible, as short term BOD spikes can cause an aeration basin to become nutrient limited for short time periods (which can cause bulking) even though the 24-hour average BOD:N:P ratio is satisfactory. Foaming Control Three filaments cause foaming: Nocardia, M. parvicella and type 1863. All of these filaments grow on grease and oil, and these can become a problem when grease and oil are high in amount in the influent wastewater. Systems that lack primary clarification (the main grease and oil removal mechanism) appear to suffer more foaming problems. Communities with enforced grease and fat ordinances appear to suffer less from foaming problems. Also, disposal of septage, which contains substantial grease and oil content, to small activated sludge systems has been associated with foaming problems. Note that Nocardia here is used as a group name rather than a specific species. Recent work has shown that a number of actinomycetes can cause foaming and include Nocardia amarae, N. pinensis, N. rhodochrus and other Nocardia-like species. These are often collectively referred to as the Nocardioforms, or the foam-causing actinomycetes. Nocardia and M. parvicella also occur at a longer sludge age. The sludge age at which these filaments can be controlled is a function of the wastewater temperature, being lower at higher temperature. Nocardia appears to be favored at higher aeration basin temperatures and M. parvicella at lower aeration basin temperatures. Nocardia can usually be controlled by a sludge age below 6-8 days and M. parvicella at a sludge age below 8-10 days at moderate wastewater temperatures. However, many plants have had to reduce the sludge age to less than 2 days for Nocardia control, and this may be inconsistent with other process goals, such as nitrification or sludge handling capability.
20
A third factor in the growth of Nocardia and M. parvicella is septicity or low oxygen conditions. Note that the combination of grease and oil, longer sludge age, and septicity or low oxygen conditions is needed for these filaments to overgrow the system and cause foaming. In this regard, Nocardia and M. parvicella can be considered “low DO filaments”, although low DO per sec doesn’t cause them without the other two factors. Nocardia and M. parvicella appear to grow better on unsaturated fatty acids in comparison to saturated fatty acids. A change in the US diet from saturated to unsaturated fatty acids is one reason why foaming by these bacteria is more prevalent today than it was 20-30 years ago. Also, anaerobic bacteria break down fatty acids by first modifying them to an unsaturated form. This may be why septicity is one of the causes for these bacteria, providing them with a source of unsaturated fatty acids. Type 1863 differs in growing at a low sludge age, usually less than 3-4 days. It indicates a high amount of grease and oil and a young sludge condition. Many type 1863 foaming episodes have been caused by a reduction in primary clarification when units were removed from service for repair or cleaning and grease and oil concentration increased in the aeration system. Control of Nocardia and M. parvicvella foaming is difficult. Chemical antifoam agents have not proven generally effective, probably because these act on chemical surfactants and not on a solids-stabilized foam. Many plants reduce aeration to control foaming, but process performance may suffer if oxygen becomes limiting. Further, low oxygen-induced bulking may occur when this is done. Physical control of foams is most widely practiced using enlarged surface scum traps and forceful water sprays (often containing 50 mg/L chlorine). Many foams reach problem levels because they build up on these surfaces and are not removed. Foam should be removed entirely from the system and not recycled back into the plant, for example, into the headworks. Foam disposal into aerobic or anaerobic digesters can result in foaming there, so this should be avoided. Return sludge chlorination has not eliminated Nocardia, although it often helps, due to Nocardia's growth mostly within the activated sludge flocs where it isn't readily contacted by chlorine. Also, much of the Nocardia may be present on the aeration basin surface and this doesn’t go through the RAS line to see chlorine. RAS chlorination is more useful for foams caused by M. parvicella. Many anaerobic digester foaming incidents may be attributed to treatment of Nocardia-containing waste activated sludge. A nationwide survey in 1981 by the American Society of Civil Engineers revealed that as many as half of the anaerobic digesters in use had experienced foaming at one time or another. It was recently reported that 54% of 26 California activated sludge plants surveyed had recently experienced anaerobic digester foaming (Van Niekerk et al.,JWPCF 59:249, 1987). Here, it is important to remember that Nocardia cells float, dead or alive, due to their hydrophobic cell surface. Even though Nocardia are strict aerobes, their cells are readily floated and cause foaming even under anaerobic conditions.
21
Nocardia and M. parvicella are controlled by addressing all three causative factors above. A reduction in the grease and oil content of the wastewater is needed, either through source control or improved operation of the primary clarifier (if present) to better remove grease and oil. These filaments are usually controlled by a reduction in the system sludge age as given above. Septicity, if present, needs to be controlled, and the aeration basin DO concentration should be raised. Note that higher aeration causes more foam formation, due to the physical action of more air present. Many operators reduce aeration when foaming occurs to reduce the foam, but this only causes more filament growth in the long term. SUMMARY Most activated sludge upsets and loss of process control are caused by one of several microbiological problems which include poor floc formation, pin floc, dispersed growth, filamentous and slime bulking, filamentous foaming, zoogloeal bulking, nitrification and denitrification problems and toxicity. Use of the microscopic examination and the OUR test are invaluable tools in troubleshooting the activated sludge process. Once the cause of the problem or upset is known, specific remedies appropriate for the problem can be used. Short term control methods such as chlorination are often used to quickly stop a bulking problem. However, the best approach is to investigate the long-term control methods suitable for the problem that is occurring to achieve trouble free operation. REFERENCES AND ADDITIONAL INFORMATION Eikelboom, D.H and van Buijsen, H.J.J., Microscopic Sludge Investigation Manual, TNO Res. Inst. for Env. Hygiene, Delft, The Netherlands, 1981. Jenkins, D., M. G. Richard and G.T. Daigger, Manual on the Causes and Control of Activated Sludge Bulking and Foaming, 2nd Ed., Lewis Publishers, Boca Raton, FL, 1993; 3rd Ed., 2003. Activated Sludge Microbiology, M.G. Richard, Water Environment Federation, Alexandria, VA, 1989. Palm, J.C., D. Jenkins and D.S. Parker, Relationship Between Organic Loading, Dissolved Oxygen Concentration and Sludge Settleability in the Completely-Mixed Activated Sludge Process, J. Water Poll. Control Fed. 52:2484, 1980. Walker, I. and M. Davis, The Relationship Between Viability and Respiration Rate in the Activated Sludge Process, Water Research: 575, 1977.
APPENDIX E
NUTRIENT DEFICIENCY CALCULATIONS
(Source: WEF Manual of Practice OM-9)

A nutrient deficiency will sometimes cause a filamentous bulking problem. The following example
shows how to find out if there is a nutrient deficiency, and how to calculate the amount of nutrients
to add to correct the problem. Once the chemical feed rate (in lb/day) is determined, the chemical
must be fed into the secondary influent, preferably in proportion to the flow. The chemical feed
equipment must be set to feed the calculated amount of nutrient during the 24-hour period.
Example A. Calculate the amount of nutrients to add to correct a nutrient deficiency.
Given: Secondary influent BOD5 = 170mg/L
Secondary influent TKN = 4.5 mg/L
Secondary influent P = 1.0 mg/L Secondary
influent Fe = 0.5 mg/L
Suggested ratio by weight, BOD5/N = 100/5 = 20
Suggested ratio by weight, BOD5/P = 100/1 = 100
Suggested ratio by weight, BOD5/Fe = 100/0.5 := 200
Average daily plant flow, Q = 7.5 mgd
Ammonia/nitrogen atomic weight ratio, NH3/N =17/14 = 1.2
Trisodium phosphate/phosphorus atomic weight ratio, Na3PO4/P = 164/31 = 5.3
Ferric chloride/iron atomic weight ratio, FeCl/Fe = 162.5/56 = 2.9
Solution
Step 1. Calculate the amount of nutrients needed to achieve the suggested ratios.
Nutrient needed, mg/L = Secondary influent BOD5, mg/L
Suggested weight ratio, BOD5/nutrient
N needed, mg/L = BOD5 mg/L
Suggested ratio, BOD/N
= 170/20
= 8.5 mg/L
P needed, mg/L = BOD5 mg/L
Suggested ratio, BOD/P
= 170/100
= 1.7mg/L
Fe needed, mg/L = BOD5 mg/L
Suggested ratio, BOD/Fe
= 170/200
= 0.85 mg/L

Step 2. Calculate the difference between the nutrients available and the nutrients needed. If this answer is
zero or a negative number, there is no shortage and no nutrients need be added.
Nutrient shortage, mg/L = (Nutrient needed, mg/L) - (Nutrient available, mg/L)
N shortage, mg/L = (N, needed mg/L) - (TKN available, mg/L)
= 8.5-4.5
= 4.0mg/L
P shortage, mg/L = (P needed, mg/L) - (P available, mg/L)
= 1.7 -1.0
= 0.7 mg/L
Fe shortage, mg/L = (Fe needed, mg/L) ~ (Fe available, mg/L)
= 0.85 - 0.5
= 0.35 mg/L
Step 3. Calculate the weight of nutrients that need to be added.
Nutrient to add lb/day = (Shortage, mg/L)(Q, mgd)(8.34 lb/gal)
N to add, Ib/day = (N shortage, mg/L)(Q, mgd)(8.34 .1b/gal)
= (4)(7.5)(8.34)
= 250 Ib/day
P to add, Ib/day = (P shortage, mg/L)((Q, mgd)(8.341b/gal)
= (0.7)(7.5)(8.34)
= 43.8 Ib/day
Fe to add, lb/day = (Fe shortage, mg/L)(Q, mgd)(8.341b/gal)
= (0.35)(7.5)(8.34)
= 21.9lb/day

Step 4. Calculate the weight of the commercial chemical to be added per day to supply the needed
nutrients.
Chemical, lb/day = (Nutrient to add, Ib/day)(Atomic wt ratio) (1 00%)
For anhydrous ammonia commercial grade solution 80% concentration
Anhydrous ammonia, Ib/day = (N to add, Ib/day)(I.2 NH3/N)(80% concentration)
= (250)(1.2)(100) 100
= 375lb/day
For trisodium phosphate, commercial grade solution 75% concentration
Trisodium phosphate, lb/day = (P to add, lb/day)(5.3 Na3P04/P)(100%)
Na3P04 concentration %
= (43.8)(5.3)(100)
75
= 310 Ib/day
For ferric chloride commercial grade solution 39% concentration
Ferric chloride, Ib/day = (Fe to add lb/day)(2.9 FeCl/Fe)(100%)
FeCl concentration %
= (21.9)(2.9)000)
39
= 163 lb/day

APPENDIX F
Return Chlorination (Bulking) Calculations
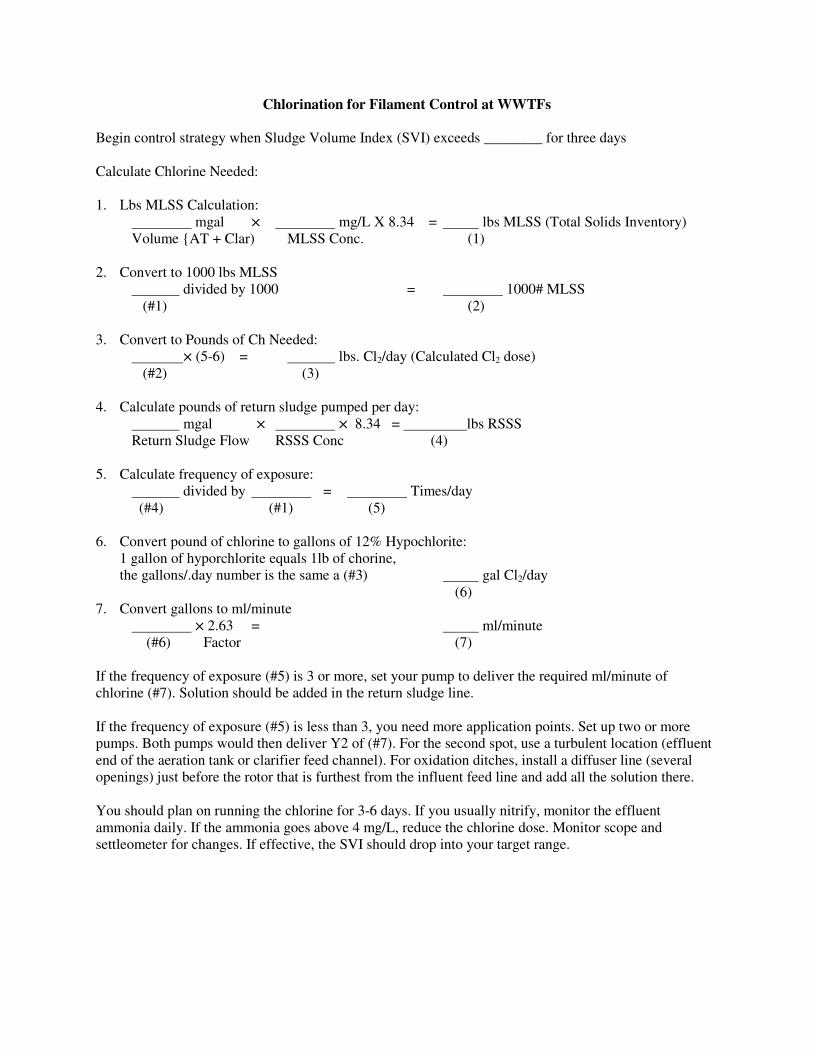
Chlorination for Filament Control at WWTFs
Begin control strategy when Sludge Volume Index (SVI) exceeds ________ for three days
Calculate Chlorine Needed:
1. Lbs MLSS Calculation:
mgal × mg/L X 8.34 = lbs MLSS (Total Solids Inventory)
Volume {AT + Clar) MLSS Conc. (1)
2. Convert to 1000 lbs MLSS
divided by 1000 = 1000# MLSS
(#1) (2)
3. Convert to Pounds of Ch Needed:
× (5-6) = lbs. Cl2/day (Calculated Cl2 dose)
(#2) (3)
4. Calculate pounds of return sludge pumped per day:
mgal × × 8.34 = lbs RSSS
Return Sludge Flow RSSS Conc (4)
5. Calculate frequency of exposure:
divided by = Times/day
(#4) (#1) (5)
6. Convert pound of chlorine to gallons of 12% Hypochlorite:
1 gallon of hyporchlorite equals 1lb of chorine,
the gallons/.day number is the same a (#3) gal Cl2/day
(6)
7. Convert gallons to ml/minute
× 2.63 = ml/minute
(#6) Factor (7)
If the frequency of exposure (#5) is 3 or more, set your pump to deliver the required ml/minute of
chlorine (#7). Solution should be added in the return sludge line.
If the frequency of exposure (#5) is less than 3, you need more application points. Set up two or more
pumps. Both pumps would then deliver Y2 of (#7). For the second spot, use a turbulent location (effluent
end of the aeration tank or clarifier feed channel). For oxidation ditches, install a diffuser line (several
openings) just before the rotor that is furthest from the influent feed line and add all the solution there.
You should plan on running the chlorine for 3-6 days. If you usually nitrify, monitor the effluent
ammonia daily. If the ammonia goes above 4 mg/L, reduce the chlorine dose. Monitor scope and
settleometer for changes. If effective, the SVI should drop into your target range.

Appendix G
Settleability Test Procedures

Settleability Test Procedures
The settleability test is an approximation of how sludge settles in the clarifier. You should always use a 2
Liter Mallory Settleometer or equal. Do NOT use a graduated cylinder for the settleability test (even if
Standard Methods says to. A 1-gallon wide-mouth mayonnaise jar with a graduation decal is OK in a
pinch
Equipment
A 2-liter Mallory Settleometer with a wide, plastic stirrer
A laboratory clock
A pipette with a suction bulb
Procedure
1. Collect the sample near aeration tank effluent weirs.
2. Collect a sample from each aeration tank.
3. Run settling tests immediately after collecting the sample
4. Pour fresh well-mixed sample to the line at the top of the settleometer
5. Gently mix with wide paddle and stop current
6. Start timer for 5 minutes
Don’t Leave! Observe the Settling
– The first 5 minutes are critical
– Observe the floc characteristics, channeling
– Observe the supernatant quality
– Record your observations in log or settling test bench sheet
– Continue with readings every 5 minutes for the first 30 minutes, then every 10 minutes until
60.
• Read again in 2 hours
– further compaction?
– floating sludge?
• Leave on bench and check after 4 hours
– Do you observe floating sludge?
– Rise in 0.5-1.0 hour indicates significant nitrification/denitrification
– No rise in four hours means little nitrification/denitrification
7. Record results in log or on bench sheet
• Graph readings, settled sludge volume, ssv in ml, versus time, in minutes
• Locate “knee of curve” to determine the theoretical optimum settling time

Sludge Volume Index (SVI)
The Sludge Volume Index indicates the relative settleability of the sludge. The SVI is defined as the
Volume, in milliliters, occupied by gram of sludge
The SVI is a relative number, but it is useful as index for a given facility. Many factors affect the
“accuracy” of the SVI test. You should not compare plants with it because a “good” range for one
facility may be very poor for another facility: “Good” SVI readings can be 80 - 300+, depending on
plant (clarifiers). We do not recommend calculating RAS Flow using SVI
L/mg
g/mg30
MLSS
000,1SSVSVI
×
=
Some prefer svi60 , use ssv60 in calculation
Diluted Settleability
Diluted settleability can be used to differentiate between filamentous or slime bulking and a “glutted”
(too many solids) condition
Make a dilution of 50% MLSS, 50% unchlorinated clarifier effluent and fill a 2-liter Settleometer
with some of the diluted sample. Fill another 2-liter Settleometer with 100% mixed liquor.
If the diluted sample settles significantly better than full sample there are too many solids in system.
If the settleability of the diluted sample is about the same as the settleability of the undiluted sample,
filamentous or slime bulking is probably occurring.
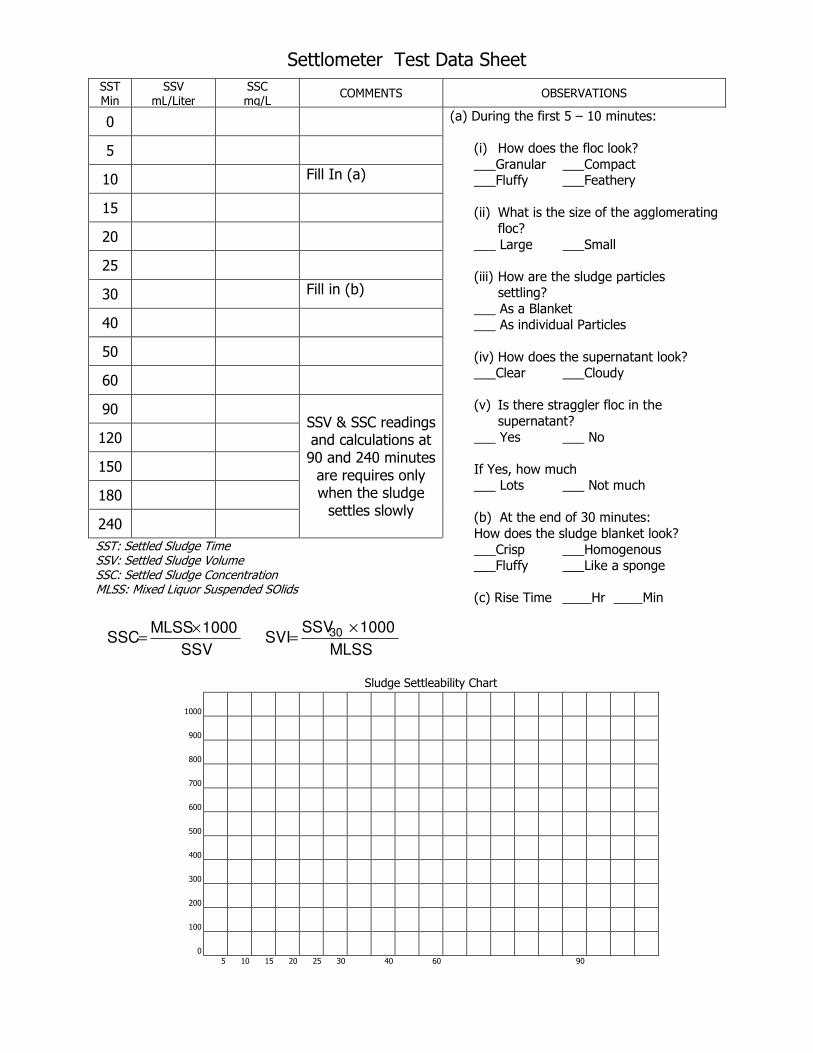
Settlometer Test Data Sheet
SST Min
SSV mL/Liter
SSC mg/L
COMMENTS OBSERVATIONS
0
5
10 Fill In (a)
15
20
25
30 Fill in (b)
40
50
60
90
120
150
180
240
SSV & SSC readings and calculations at 90 and 240 minutes are requires only when the sludge settles slowly
SST: Settled Sludge Time SSV: Settled Sludge Volume SSC: Settled Sludge Concentration MLSS: Mixed Liquor Suspended SOlids
(a) During the first 5 – 10 minutes:
(i) How does the floc look?
___Granular ___Compact ___Fluffy ___Feathery
(ii) What is the size of the agglomerating
floc?
___ Large ___Small
(iii) How are the sludge particles settling?
___ As a Blanket ___ As individual Particles
(iv) How does the supernatant look? ___Clear ___Cloudy
(v) Is there straggler floc in the
supernatant?
___ Yes ___ No
If Yes, how much ___ Lots ___ Not much
(b) At the end of 30 minutes:
How does the sludge blanket look?
___Crisp ___Homogenous ___Fluffy ___Like a sponge
(c) Rise Time ____Hr ____Min
Sludge Settleability Chart
1000
900
800
700
600
500
400
300
200
100
0
5 10 15 20 25 30 40 60 90
SSV
1000MLSSSSC
×=
MLSS
1000SSVSVI 30 ×
=

APPENDIX H
OUR TEST PROCEDURES
(Source Ronald Schuyler, P.E.)
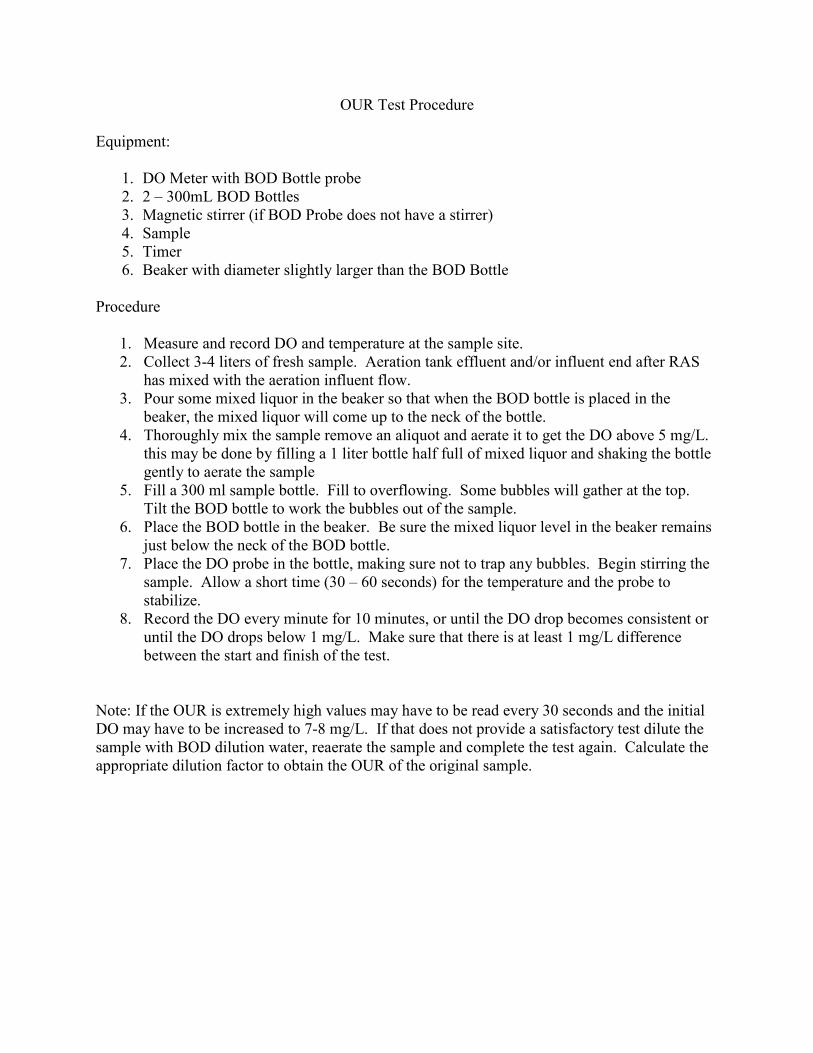
OUR Test Procedure
Equipment:
1. DO Meter with BOD Bottle probe
2. 2 – 300mL BOD Bottles
3. Magnetic stirrer (if BOD Probe does not have a stirrer)
4. Sample
5. Timer
6. Beaker with diameter slightly larger than the BOD Bottle
Procedure
1. Measure and record DO and temperature at the sample site.
2. Collect 3-4 liters of fresh sample. Aeration tank effluent and/or influent end after RAS
has mixed with the aeration influent flow.
3. Pour some mixed liquor in the beaker so that when the BOD bottle is placed in the
beaker, the mixed liquor will come up to the neck of the bottle.
4. Thoroughly mix the sample remove an aliquot and aerate it to get the DO above 5 mg/L.
this may be done by filling a 1 liter bottle half full of mixed liquor and shaking the bottle
gently to aerate the sample
5. Fill a 300 ml sample bottle. Fill to overflowing. Some bubbles will gather at the top.
Tilt the BOD bottle to work the bubbles out of the sample.
6. Place the BOD bottle in the beaker. Be sure the mixed liquor level in the beaker remains
just below the neck of the BOD bottle.
7. Place the DO probe in the bottle, making sure not to trap any bubbles. Begin stirring the
sample. Allow a short time (30 – 60 seconds) for the temperature and the probe to
stabilize.
8. Record the DO every minute for 10 minutes, or until the DO drop becomes consistent or
until the DO drops below 1 mg/L. Make sure that there is at least 1 mg/L difference
between the start and finish of the test.
Note: If the OUR is extremely high values may have to be read every 30 seconds and the initial
DO may have to be increased to 7-8 mg/L. If that does not provide a satisfactory test dilute the
sample with BOD dilution water, reaerate the sample and complete the test again. Calculate the
appropriate dilution factor to obtain the OUR of the original sample.

OUR calculation
1. Graph the results by plotting DO (in mg/L) on the vertical axis and time (in minutes) on
the horizontal axis.
2. Graph the line of best fit of the data. The line should be nearly straight. If there are data
at the beginning and/or end of the test that are significantly different from the straight
line, disregard that data. The straight line represents the actual microorganism activity.
3. Determine the slope of the line. Pick the points at the beginning and end of the straight
line portion. Divide the change in DO between those two points by the change in
minutes between those two points.
4. OUR = ∆DO/∆Time = mg/L/min if the time is in minutes
5. Multiply by 60 min/hr to get the results in mg O2/L/hr
SOUR calculations and Interpretation
Required Information
OUR of the sample
MLSS or MLVSS of the same sample
Calculation
SOUR = OUR mg/L/hr × 1000 mg/g
MLVSS, mg/L
Interpretation
Modification SOUR Range
Conventional Activated Sludge 8-20 mg O2/hr/g VSS
Step Aeration 8-20 mg O2/hr/g VSS
Extended Aeration 3-12 O2/hr/g VSS
Contact Stabilization 15-30/5-15 O2/hr/g VSS
Aerobic Digestion <2 O2/hr/g VSS
Values outside these ranges are not necessarily a problem since your plant may work will at a
higher or lower SOUR. However, they would normally mean that one should begin looking for
potential problems.
The fed and unfed tests use the simple OUR test on simulated sludges. A “fake” activated sludge
is developed to simulate conditions at the influent end of the aeration tank. It is a “fake” tests
because of the difficulty of collecting a truly mixed sample at that point. Since the results of the
tests must relate to each other, the unfed test uses the same organisms for a “fake” test to
simulate the conditions at the effluent end of the aeration tank. The unfed test indicates how
active the microorganisms area at rest (endogenous respiration conditions) while the fed test
shows the microorganism activity after feeding.

The fed test mixes the correct amount of influent with an amount of return activated sludge to
simulate the MLSS concentration in the aeration tank. The unfed test mixes unchlorinated final
effluent with the RAS to achieve the same MLSS concentration. The normal OUR test is then
done on each sample. The correct volume of RAS in mL is calculated by:
mL of RAS = MLSS in Aeration Tank × 300 mL
MLSS of RAS
Once the two tests have been completed, a ratio of the fed to unfed OUR is calculated. If the
ratio is less than 1.0, there is probably some toxic material in the influent, because the bugs in the
fed sample should be using oxygen at a higher rate than the bugs in the unfed sample. A value of
1.0 to 2.0 is found with very dilute influent samples or waste that contains slowly degradable
materials. A ratio of 2.0 to 5.0 is normal for domestic wastewater, while a ration of greater then
5.0 indicates extremely high loading.
Fed/Unfed Ratios for Domestic Watsewater
<1.0 � Toxic effect
1.0 – 2.0 � Dilute load or hard to stabilize material
2.0 – 5.0 � Normal
>5.0 � Very high organic load for the MLSS available
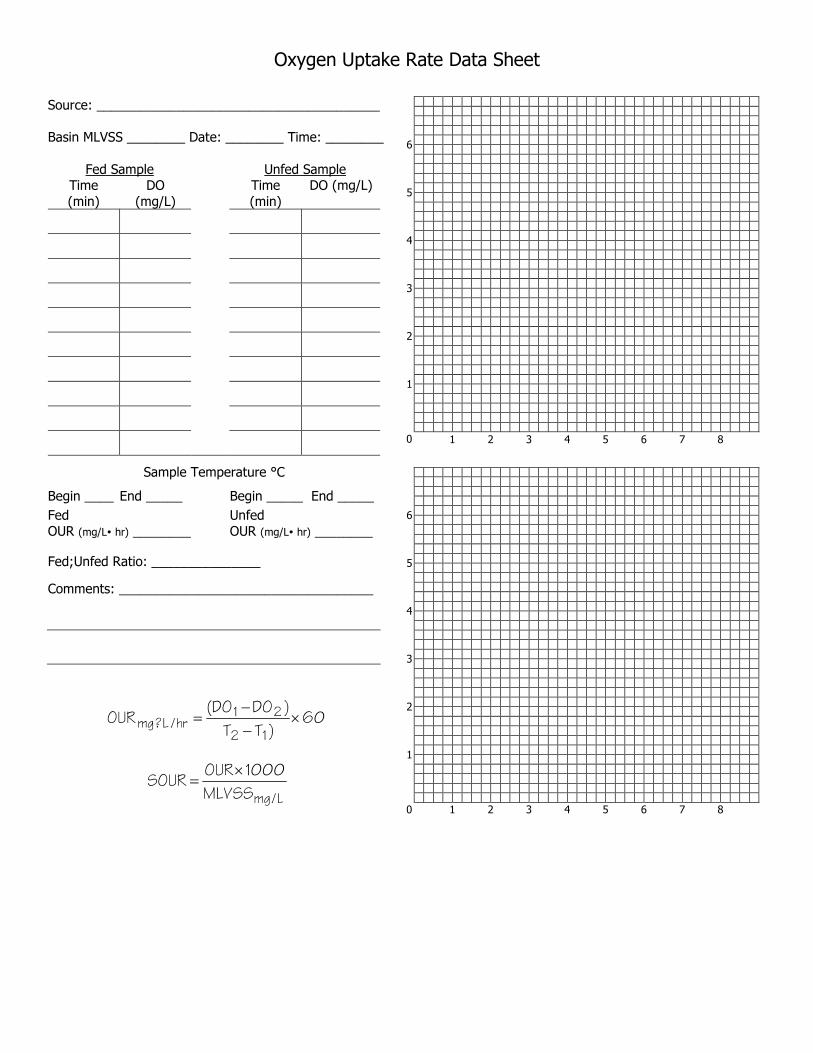
Oxygen Uptake Rate Data Sheet
6
5
4
3
2
1
0 1 2 3 4 5 6 7 8
Source: _______________________________________
Basin MLVSS ________ Date: ________ Time: ________
Fed Sample Unfed Sample Time
(min)
DO
(mg/L)
Time
(min)
DO (mg/L)
Sample Temperature °C
Begin ____ End _____ Begin _____ End _____
Fed OUR (mg/L� hr) ________
Unfed OUR (mg/L� hr) ________
Fed;Unfed Ratio: _______________
Comments: ___________________________________
6
5
4
3
2
1
0 1 2 3 4 5 6 7 8
60)TT
)DODO(OUR
12
21hr/L?mg ×
−
−=
L/mgMLVSS
1000OURSOUR
×=

APPENDIX I
MICROSCOPIC TEST PROCEDURES

Procedures for Microscopic Examination
Use a sample of mixed liquor from the aeration basin for microscopic examination as part of the routine daily lab tests.
1. Take an eye dropper full of mixed liquor!rom the aeration basin, place one drop
onto a slide, place a cover slip on the top of the drop. Take care to exclude air bubbles.
2. Using 100x power (10x eyepiece plus the 10x objective) on the microscope, start the field Of view on one edge of the slide and note on the worksheet the number of different microorganisms listed that are in view.
3. Proceed across the slide with a new field of view each time on the edge of the preceding one. Repeat this ten times, then add up the total numbers on the worksheet and record the relative predominance.
4. When counting stalked ciliates, count each single stalk as one; Therefore a dump of stalks could be counted as being ten or more stalked ciliates.
5. When counting' filaments, add the number of times a filament crosses over an imaginary vertical line drawn through the field of view. Refer to the diagram at the bottom of the' page for an example.
6. After viewing the ten areas that were counted and recorded, view -the whole slide and note any additional information that you feel is important.
Filament Counting Technique
Count = 2 + 5 + 5 + 2 + etc.
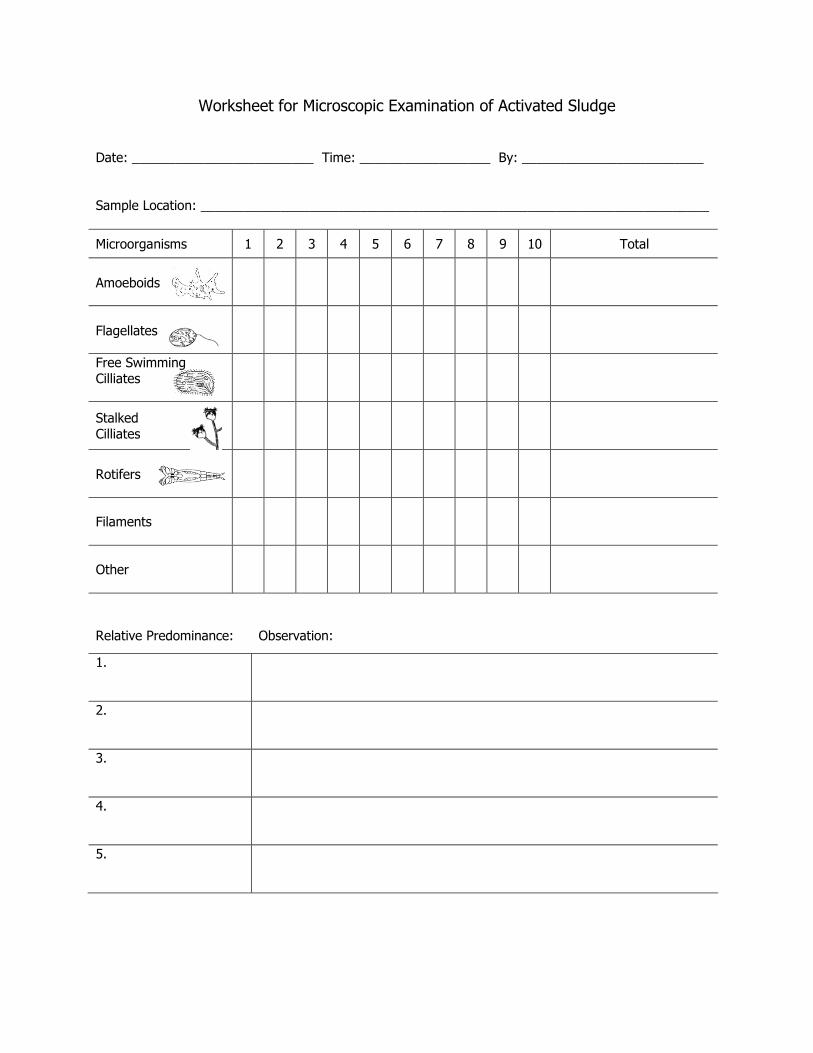
Worksheet for Microscopic Examination of Activated Sludge
Date: _________________________ Time: __________________ By: _________________________
Sample Location: ______________________________________________________________________
Microorganisms 1 2 3 4 5 6 7 8 9 10 Total
Amoeboids
Flagellates
Free Swimming Cilliates
Stalked Cilliates
Rotifers
Filaments
Other
Relative Predominance: Observation:
1.
2.
3.
4.
5.

MICROSCOPIC EXAM

APPENDIX J
ACTIVATED SLUDGE OBSERVATIONS

Activated Sludge Observations
MON TUE WED THU FRI SAT SUN
Aeration Tank
Color of the Sludge
Color of Foam
Characteristics of
Foam
Odor
Comments
Final Clarifiers
Color
Clarity
Appearance
Bulking
Solids Washout
Clumping
Ashing
Straggler Floc
Pin Floc
Comments

APPENDIX K
ORP Ranges (mV)

ORP Ranges (mV)

\
APPENDIX L
CORE TAKER PROCEDURES


APPENDIX M
MCRT RELATIONSHIP TO F/M
(Source – Bill Olver, P.E.)

MCRT RELATIONSHIP TO F:M RATIO

APPENDIX N
FINAL CLARIFIER SOLIDS FLUX
(Source: Bill Olver, P.E.)

FINAL CLARIFIER SOLIDS FLUX IS OFTEN THE
CAUSE OF POOR PROCESS PERFORMANCE
• MAXIMUM SOLIDS FLUX FOR TYPICAL MUNCICPAL MLSS:
- AT AVERAGE DAILY FLOWS – 24 LBS/DAY/SF
- AT PEAK HOURLY FLOWS – 48 LBS/DAY/SF
(SF) AREA CLARIFIER
8.34MLSSFLOW) RASFLOW (INFLUENT FLUX SOLIDS
(SF) AREA CLARIFIER
(LBS/DAY CLARIFIER TO APPLIED SOLIDS FLUX SOLIDS
mg?LMGD ××+
=
=

APPENDIX O
Troubleshooting Charts
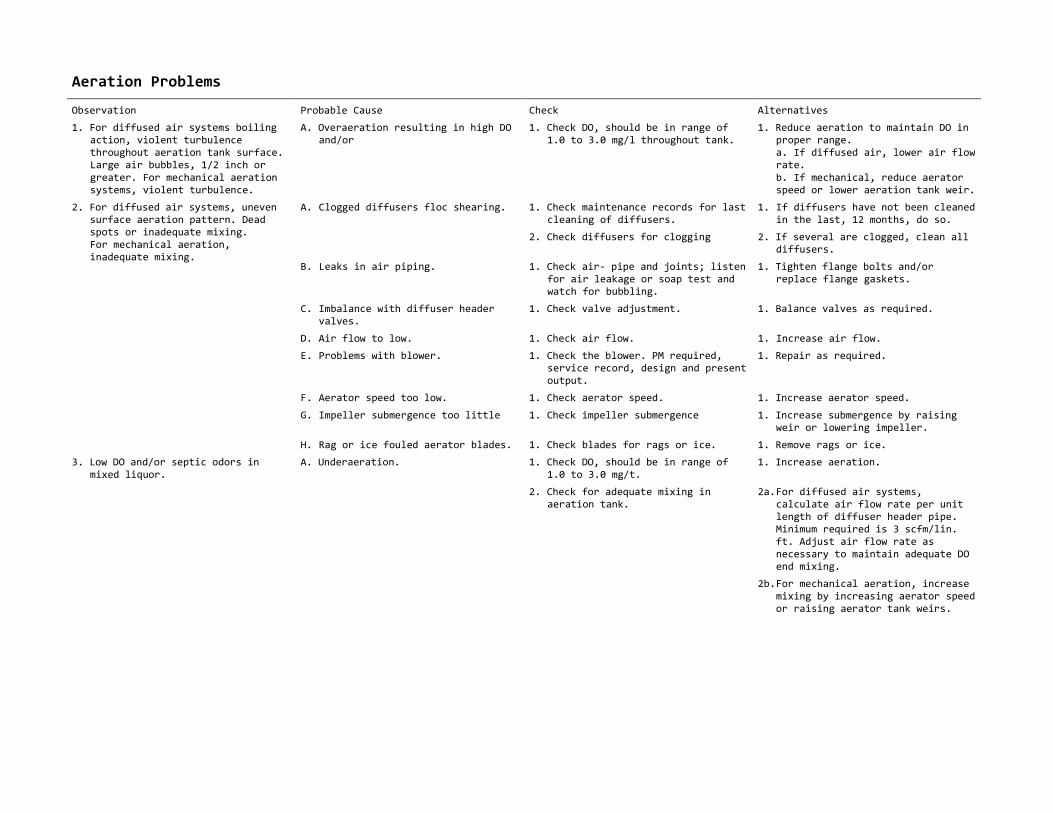
Aeration Problems
Observation Probable Cause Check Alternatives
1. For diffused air systems boiling action, violent turbulence throughout aeration tank surface. Large air bubbles, 1/2 inch or
greater. For mechanical aeration systems, violent turbulence.
A. Overaeration resulting in high DO and/or
1. Check DO, should be in range of 1.0 to 3.0 mg/l throughout tank.
1. Reduce aeration to maintain DO in proper range.
a. If diffused air, lower air flow rate.
b. If mechanical, reduce aerator speed or lower aeration tank weir.
1. Check maintenance records for last cleaning of diffusers.
1. If diffusers have not been cleaned in the last, 12 months, do so.
A. Clogged diffusers floc shearing. 2. Check diffusers for clogging 2. If several are clogged, clean all
diffusers.
B. Leaks in air piping. 1. Check air- pipe and joints; listen for air leakage or soap test and watch for bubbling.
1. Tighten flange bolts and/or replace flange gaskets.
C. Imbalance with diffuser header valves.
1. Check valve adjustment. 1. Balance valves as required.
D. Air flow to low. 1. Check air flow. 1. Increase air flow.
E. Problems with blower. 1. Check the blower. PM required, service record, design and present output.
1. Repair as required.
F. Aerator speed too low. 1. Check aerator speed. 1. Increase aerator speed.
G. Impeller submergence too little 1. Check impeller submergence 1. Increase submergence by raising weir or lowering impeller.
2. For diffused air systems, uneven surface aeration pattern. Dead spots or inadequate mixing.
For mechanical aeration, inadequate mixing.
H. Rag or ice fouled aerator blades. 1. Check blades for rags or ice. 1. Remove rags or ice.
1. Check DO, should be in range of 1.0 to 3.0 mg/t.
1. Increase aeration. 3. Low DO and/or septic odors in mixed liquor.
A. Underaeration.
2. Check for adequate mixing in aeration tank.
2a. For diffused air systems, calculate air flow rate per unit length of diffuser header pipe. Minimum required is 3 scfm/lin. ft. Adjust air flow rate as necessary to maintain adequate DO end mixing.
2b. For mechanical aeration, increase mixing by increasing aerator speed or raising aerator tank weirs.
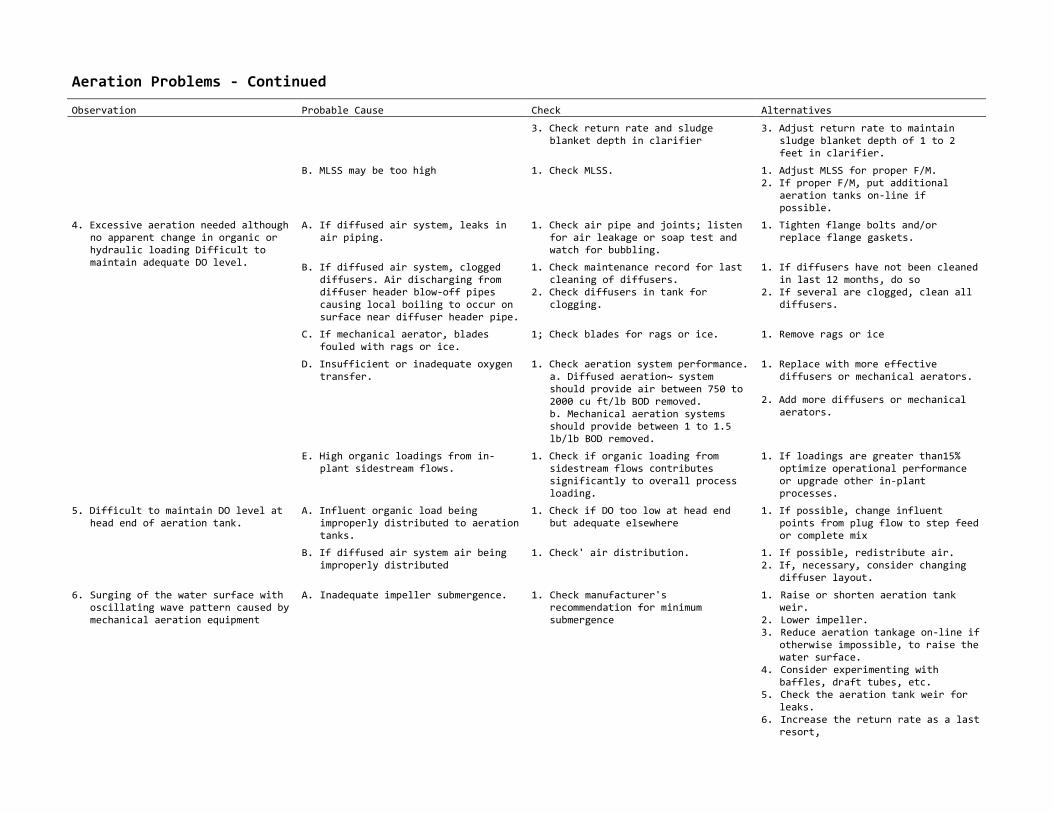
Aeration Problems - Continued
Observation Probable Cause Check Alternatives
3. Check return rate and sludge blanket depth in clarifier
3. Adjust return rate to maintain sludge blanket depth of 1 to 2 feet in clarifier.
B. MLSS may be too high 1. Check MLSS. 1. Adjust MLSS for proper F/M. 2. If proper F/M, put additional
aeration tanks on-line if possible.
A. If diffused air system, leaks in air piping.
1. Check air pipe and joints; listen for air leakage or soap test and watch for bubbling.
1. Tighten flange bolts and/or replace flange gaskets.
B. If diffused air system, clogged diffusers. Air discharging from diffuser header blow-off pipes causing local boiling to occur on surface near diffuser header pipe.
1. Check maintenance record for last cleaning of diffusers.
2. Check diffusers in tank for clogging.
1. If diffusers have not been cleaned in last 12 months, do so
2. If several are clogged, clean all diffusers.
C. If mechanical aerator, blades fouled with rags or ice.
1; Check blades for rags or ice. 1. Remove rags or ice
1. Replace with more effective diffusers or mechanical aerators.
D. Insufficient or inadequate oxygen transfer.
1. Check aeration system performance. a. Diffused aeration~ system should provide air between 750 to 2000 cu ft/lb BOD removed.
b. Mechanical aeration systems should provide between 1 to 1.5 lb/lb BOD removed.
2. Add more diffusers or mechanical aerators.
4. Excessive aeration needed although no apparent change in organic or hydraulic loading Difficult to maintain adequate DO level.
E. High organic loadings from in-plant sidestream flows.
1. Check if organic loading from sidestream flows contributes significantly to overall process loading.
1. If loadings are greater than15% optimize operational performance or upgrade other in-plant processes.
A. Influent organic load being improperly distributed to aeration tanks.
1. Check if DO too low at head end but adequate elsewhere
1. If possible, change influent points from plug flow to step feed or complete mix
5. Difficult to maintain DO level at head end of aeration tank.
B. If diffused air system air being improperly distributed
1. Check' air distribution. 1. If possible, redistribute air. 2. If, necessary, consider changing
diffuser layout.
6. Surging of the water surface with oscillating wave pattern caused by mechanical aeration equipment
A. Inadequate impeller submergence. 1. Check manufacturer's recommendation for minimum submergence
1. Raise or shorten aeration tank weir.
2. Lower impeller. 3. Reduce aeration tankage on-line if
otherwise impossible, to raise the water surface.
4. Consider experimenting with baffles, draft tubes, etc.
5. Check the aeration tank weir for leaks.
6. Increase the return rate as a last resort,
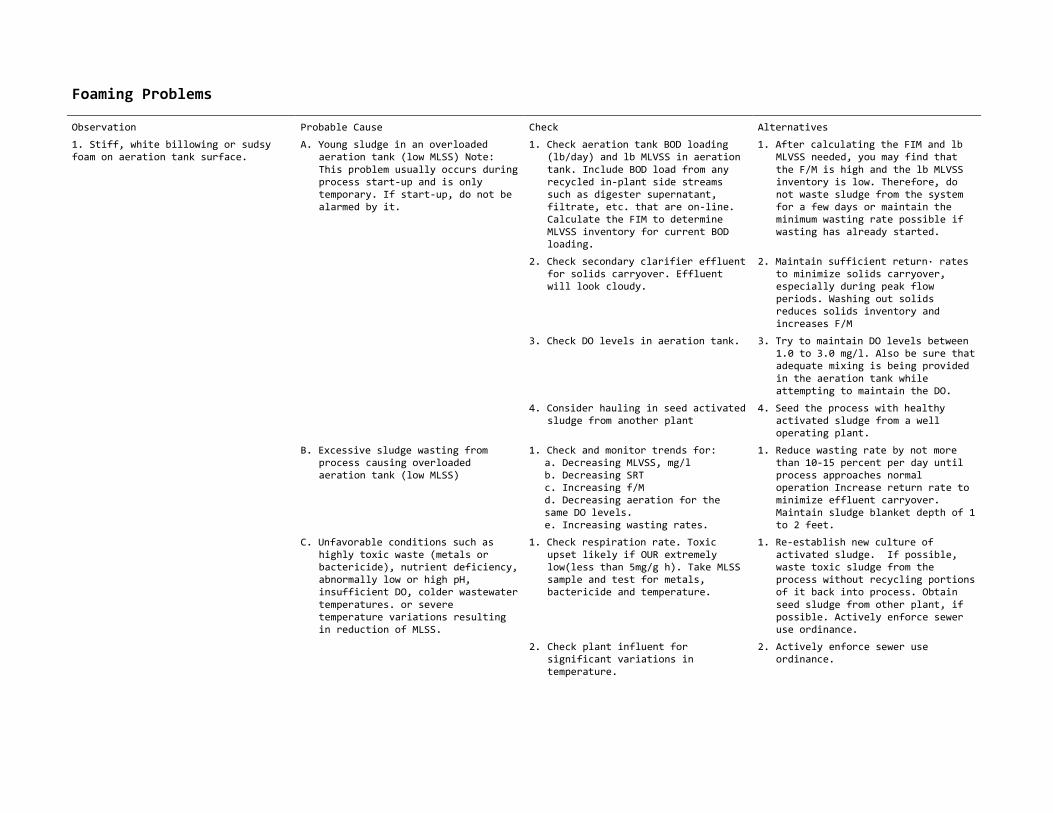
Foaming Problems
Observation Probable Cause Check Alternatives
1. Stiff, white billowing or sudsy foam on aeration tank surface.
A. Young sludge in an overloaded aeration tank (low MLSS) Note:
This problem usually occurs during process start-up and is only temporary. If start-up, do not be alarmed by it.
1. Check aeration tank BOD loading (lb/day) and lb MLVSS in aeration
tank. Include BOD load from any recycled in-plant side streams such as digester supernatant, filtrate, etc. that are on-line. Calculate the FIM to determine MLVSS inventory for current BOD loading.
1. After calculating the FIM and lb MLVSS needed, you may find that
the F/M is high and the lb MLVSS inventory is low. Therefore, do not waste sludge from the system for a few days or maintain the minimum wasting rate possible if wasting has already started.
2. Check secondary clarifier effluent for solids carryover. Effluent will look cloudy.
2. Maintain sufficient return· rates to minimize solids carryover, especially during peak flow periods. Washing out solids reduces solids inventory and increases F/M
3. Check DO levels in aeration tank. 3. Try to maintain DO levels between 1.0 to 3.0 mg/l. Also be sure that adequate mixing is being provided
in the aeration tank while attempting to maintain the DO.
4. Consider hauling in seed activated sludge from another plant
4. Seed the process with healthy activated sludge from a well operating plant.
B. Excessive sludge wasting from process causing overloaded aeration tank (low MLSS)
1. Check and monitor trends for: a. Decreasing MLVSS, mg/l b. Decreasing SRT c. Increasing f/M d. Decreasing aeration for the
same DO levels. e. Increasing wasting rates.
1. Reduce wasting rate by not more than 10-15 percent per day until process approaches normal operation Increase return rate to minimize effluent carryover. Maintain sludge blanket depth of 1 to 2 feet.
C. Unfavorable conditions such as highly toxic waste (metals or bactericide), nutrient deficiency, abnormally low or high pH, insufficient DO, colder wastewater
temperatures. or severe temperature variations resulting in reduction of MLSS.
1. Check respiration rate. Toxic upset likely if OUR extremely low(less than 5mg/g h). Take MLSS sample and test for metals, bactericide and temperature.
1. Re-establish new culture of activated sludge. If possible, waste toxic sludge from the process without recycling portions of it back into process. Obtain
seed sludge from other plant, if possible. Actively enforce sewer use ordinance.
2. Check plant influent for significant variations in temperature.
2. Actively enforce sewer use ordinance.

Foaming Problems - Continued
Observation Probable Cause Check Alternatives
D. Unintentional loss of biomass such as hydraulic washout of solids from secondary clarifier reducing MLSS and causing aerat i on' tank
overload.
1. Check surface overflow rate in secondary clarifier.
1. Refer to solids washout observation No.1 and clumping/rising sludge cause 1A.
E. Improper influent wastewater and/or RAS flow distribution causing overloading and thereby foaming.
1. Check and monitor secondary influent and return rates to each aeration' tank. Differences may cause significant differences in MLSS concentrations.
1. Modify distribution facilities as necessary to equalize influent wastewater and return rates. MLSS and RAS concentrations and DOs between multiple tanks should be reasonably consistent.
2. Shiny. dark brown foam on aeration tank surface.
A. Aeration tank approaching underloaded (low f/M) conditions due to insufficient sludge wasting
1. Check and monitor trends for: a. Increasing MLVSS, mg/l. b. Increasing SRT. c. Decreasing f/M. d: Increasing aeration for the same
DO level. e. Decreasing WAS rates. f. Increasing temperatures.
1. Increase wasting rate by not more than 10 - 15 percent per day until process approaches normal operations and a modest amount of light tan foam is observed on aeration tank surface
2. Check and monitor secondary
influent and return rate to each aeration tank. Imbalance may be overloading one tank.
2. Equalize influent and return rates
to each aeration tank.
3. Thick, scummy dark brown foam on aeration tank surface.
A. Aeration tank is critically underLoaded (f/M too low) due to improper wasting program.
1. Check and monitor trends for: a. Increasing MLVSS, mg/l. b. Increasing SRT. c. Decreasing f/M. d: Increasing aeration for the same
DO level. e. Decreasing WAS rates. f. Increasing temperatures.
1. Increase wasting rate by not more than 10 - 15 percent per day until process approaches normal operations and a' modest, amount of light tan foam is observed on aeration tank surface.
1. Check and monitor secondary influent and return rate to each aeration tank. Imbalance may be underloading one tank.
1. Equalize influent and return rates to each aeration tank.
B. Scum entering aeration tanks. 1. Check: a. Secondary influent for oil &
grease. b. Primary scum collection system.
la. Enforce sewer use b. Improve primary scum
capture.ordinance.
4. Greasy, dark tan foam that is strong and carries over to the clarifier.
A. filamentous organism (Nocardia or Microthrix).
1. Check results of microscopic exam of mixed liquor
1. Refer to Bulking observation No. 2

Foaming Problems - Continued
Observation Probable Cause Check Alternatives
5. Dark-brown, almost blackish sudsy foam on aeration tank surface. Mixed liquor color is very dark brown
almost black. Septic or sour odor from aeration tank.
A. Anaerobic conditions in aeration tank.
1. Refer to aeration problems.
B. Industrial waste containing dyes or ink:
1. Check sources of industrial waste. 1. Enforce sewer use ordinance.
6. Modest amount of fresh light tan foam.
A. Not a problem. Usually a sign of a well operated process good
.
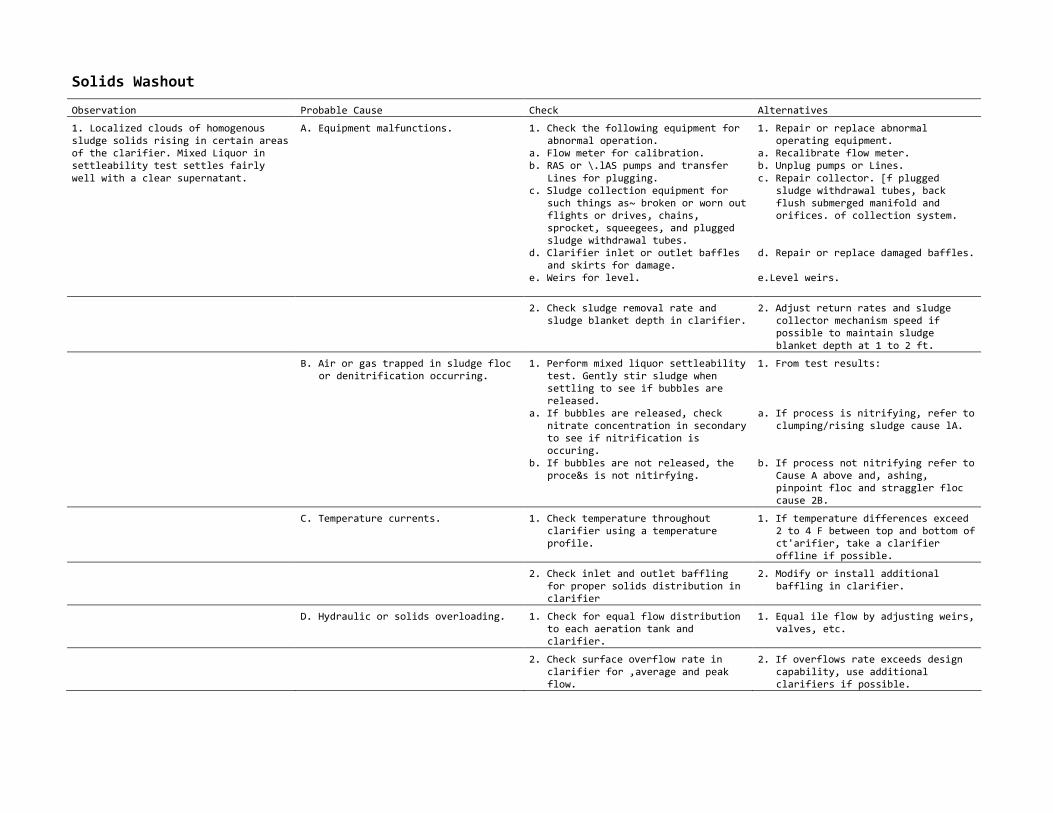
Solids Washout
Observation Probable Cause Check Alternatives
1. Localized clouds of homogenous sludge solids rising in certain areas of the clarifier. Mixed Liquor in settleability test settles fairly
well with a clear supernatant.
A. Equipment malfunctions. 1. Check the following equipment for abnormal operation.
a. Flow meter for calibration. b. RAS or \.lAS pumps and transfer
Lines for plugging. c. Sludge collection equipment for
such things as~ broken or worn out flights or drives, chains, sprocket, squeegees, and plugged sludge withdrawal tubes.
d. Clarifier inlet or outlet baffles and skirts for damage.
e. Weirs for level.
1. Repair or replace abnormal operating equipment.
a. Recalibrate flow meter. b. Unplug pumps or Lines.
c. Repair collector. [f plugged sludge withdrawal tubes, back flush submerged manifold and orifices. of collection system.
d. Repair or replace damaged baffles. e.Level weirs.
2. Check sludge removal rate and sludge blanket depth in clarifier.
2. Adjust return rates and sludge collector mechanism speed if possible to maintain sludge
blanket depth at 1 to 2 ft.
B. Air or gas trapped in sludge floc or denitrification occurring.
1. Perform mixed liquor settleability test. Gently stir sludge when settling to see if bubbles are released.
a. If bubbles are released, check nitrate concentration in secondary to see if nitrification is occuring.
b. If bubbles are not released, the proce&s is not nitirfying.
1. From test results: a. If process is nitrifying, refer to
clumping/rising sludge cause lA. b. If process not nitrifying refer to
Cause A above and, ashing, pinpoint floc and straggler floc cause 2B.
C. Temperature currents. 1. Check temperature throughout clarifier using a temperature profile.
1. If temperature differences exceed 2 to 4 F between top and bottom of ct'arifier, take a clarifier offline if possible.
2. Check inlet and outlet baffling for proper solids distribution in clarifier
2. Modify or install additional baffling in clarifier.
D. Hydraulic or solids overloading. 1. Check for equal flow distribution to each aeration tank and clarifier.
1. Equal ile flow by adjusting weirs, valves, etc.
2. Check surface overflow rate in clarifier for ,average and peak flow.
2. If overflows rate exceeds design capability, use additional clarifiers if possible.

Solids Washout - Continued
Observation Probable Cause Check Alternatives
3. Check clarifier solids loading. 3.' If solids loading is too high: ut another clarifier on-Line, if possible; put another aeration tank on-line, if possible, lower
MLSS for the, same F/M or waste sludge.
4. Check ISV, and calculate minimum return.
4a. Make step feed change, if possible, or increase wasting rate' if not b. Increase return if indicated.
5. Check clarifier sludge blanket. 5. If solids loading are OK but blanket is too high, increase return rate and, if possible, move feed towards contact stabilization to transfer solids from clarifier to aeration tank. Increase wasting if SRT is too high.
6. Check the area around the clarifier for excessive wind
6. Provide a wind screen if clarifier is large.
7. Check process mode. 7. If possible, change process
operation to sludge reaeration or contact stabilization mode.
8. Check results of jar test. 8. Add polymer or alum as a temporary measure.
9. Check for excessive inflow/infiltration.
9. Set up an I/I reduction program.
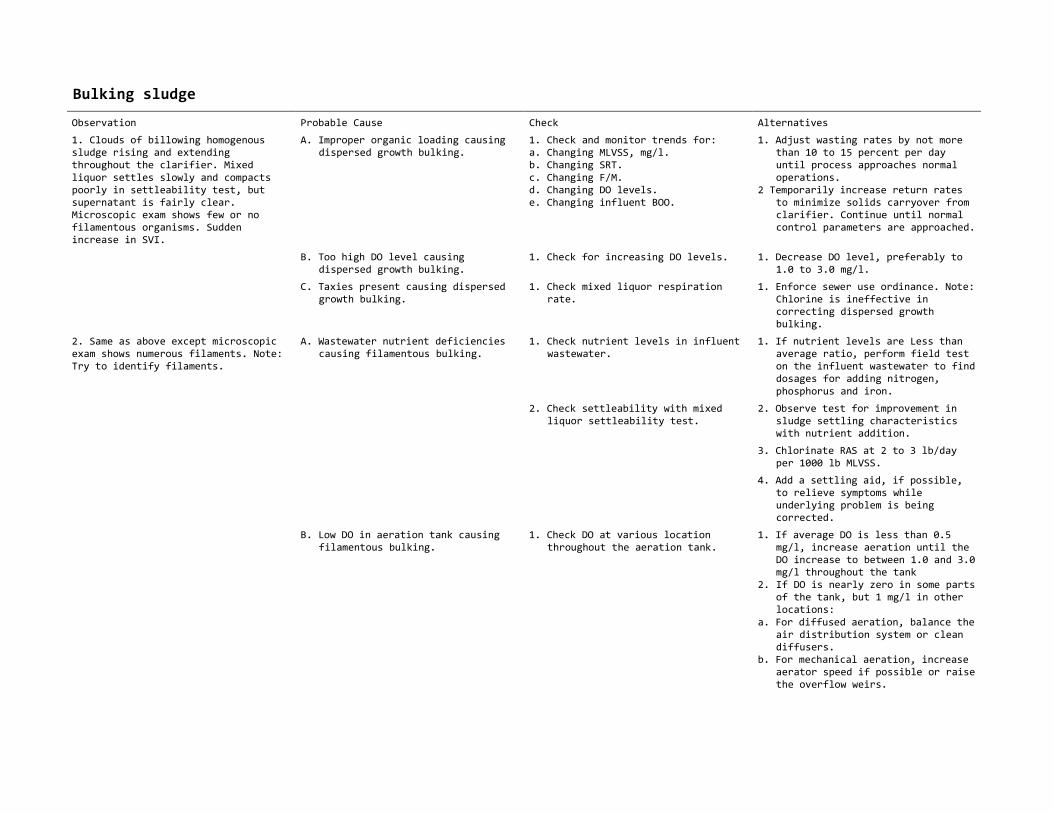
Bulking sludge
Observation Probable Cause Check Alternatives
1. Clouds of billowing homogenous sludge rising and extending throughout the clarifier. Mixed
liquor settles slowly and compacts poorly in settleability test, but supernatant is fairly clear. Microscopic exam shows few or no filamentous organisms. Sudden increase in SVI.
A. Improper organic loading causing dispersed growth bulking.
1. Check and monitor trends for: a. Changing MLVSS, mg/l. b. Changing SRT.
c. Changing F/M. d. Changing DO levels. e. Changing influent BOO.
1. Adjust wasting rates by not more than 10 to 15 percent per day until process approaches normal
operations. 2 Temporarily increase return rates
to minimize solids carryover from clarifier. Continue until normal control parameters are approached.
B. Too high DO level causing dispersed growth bulking.
1. Check for increasing DO levels. 1. Decrease DO level, preferably to 1.0 to 3.0 mg/l.
C. Taxies present causing dispersed growth bulking.
1. Check mixed liquor respiration rate.
1. Enforce sewer use ordinance. Note: Chlorine is ineffective in correcting dispersed growth bulking.
2. Same as above except microscopic exam shows numerous filaments. Note: Try to identify filaments.
A. Wastewater nutrient deficiencies causing filamentous bulking.
1. Check nutrient levels in influent wastewater.
1. If nutrient levels are Less than average ratio, perform field test on the influent wastewater to find dosages for adding nitrogen,
phosphorus and iron.
2. Check settleability with mixed liquor settleability test.
2. Observe test for improvement in sludge settling characteristics with nutrient addition.
3. Chlorinate RAS at 2 to 3 lb/day per 1000 lb MLVSS.
4. Add a settling aid, if possible, to relieve symptoms while underlying problem is being corrected.
B. Low DO in aeration tank causing filamentous bulking.
1. Check DO at various location throughout the aeration tank.
1. If average DO is less than 0.5 mg/l, increase aeration until the DO increase to between 1.0 and 3.0 mg/l throughout the tank
2. If DO is nearly zero in some parts of the tank, but 1 mg/l in other locations:
a. For diffused aeration, balance the air distribution system or clean diffusers.
b. For mechanical aeration, increase aerator speed if possible or raise the overflow weirs.
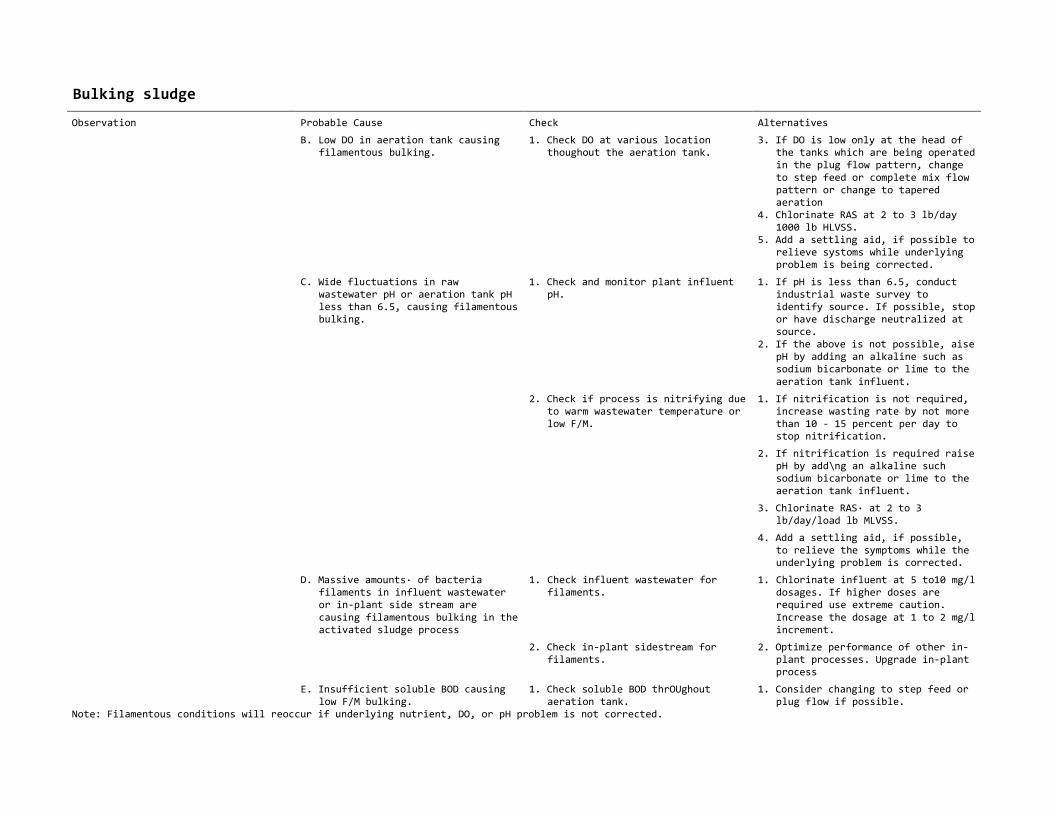
Bulking sludge
Observation Probable Cause Check Alternatives
B. Low DO in aeration tank causing filamentous bulking.
1. Check DO at various location thoughout the aeration tank.
3. If DO is low only at the head of the tanks which are being operated in the plug flow pattern, change
to step feed or complete mix flow pattern or change to tapered aeration
4. Chlorinate RAS at 2 to 3 lb/day 1000 lb HLVSS.
5. Add a settling aid, if possible to relieve systoms while underlying problem is being corrected.
C. Wide fluctuations in raw wastewater pH or aeration tank pH less than 6.5, causing filamentous bulking.
1. Check and monitor plant influent pH.
1. If pH is less than 6.5, conduct industrial waste survey to identify source. If possible, stop or have discharge neutralized at source.
2. If the above is not possible, aise pH by adding an alkaline such as sodium bicarbonate or lime to the
aeration tank influent.
2. Check if process is nitrifying due to warm wastewater temperature or low F/M.
1. If nitrification is not required, increase wasting rate by not more than 10 - 15 percent per day to stop nitrification.
2. If nitrification is required raise pH by add\ng an alkaline such sodium bicarbonate or lime to the aeration tank influent.
3. Chlorinate RAS· at 2 to 3 lb/day/load lb MLVSS.
4. Add a settling aid, if possible, to relieve the symptoms while the underlying problem is corrected.
D. Massive amounts· of bacteria filaments in influent wastewater or in-plant side stream are
causing filamentous bulking in the activated sludge process
1. Check influent wastewater for filaments.
1. Chlorinate influent at 5 to10 mg/l dosages. If higher doses are required use extreme caution.
Increase the dosage at 1 to 2 mg/l increment.
2. Check in-plant sidestream for filaments.
2. Optimize performance of other in-plant processes. Upgrade in-plant process
E. Insufficient soluble BOD causing low F/M bulking.
1. Check soluble BOD thrOUghout aeration tank.
1. Consider changing to step feed or plug flow if possible.
Note: Filamentous conditions will reoccur if underlying nutrient, DO, or pH problem is not corrected.

Clumping/Rising sludge
Observation Probable Cause Check Alternatives
1. Sludge clumps (from size of a golf ball to as large as a basketball rising and dispersing on clarifier surface. Bubbles noticed on clarifier
surface. Mixed liquor in settleability test settles fairly well. However, a portion of, or all of the settled sludge rises to the surface within two hours after the test started
A. Denitrification in clarifier. 1. Check for in crease in secondary effluent nitrate level.
1. If nitrification is not required, gradually increase wasting rate to reduce or eliminate nitrification. If nitrification is required,
reduce to allowable minimum.
2. Check for increasing SRT and decreasing f/M
2a. Gradually increase wasting rates to keep process within proper SRT and F/M, especially during hot weather when SRT should be decreased.
b. Decrease wasting rates to be sure nitrification is complete and soluble BOD is low.
3. Check DO levels in the aeration tank.
3. Increase DO to provide oxygen throughout sludge blanket.
4. Check return rates and sludge blanket depth in clarifier.
4. Increase RAS rate to maintain sludge blanket level of 1 to 2 feet in clarifier.
5. Check clarifier for proper mechanical operation.
5. Clean suction tubes if plugged.
6. Check and evaluate number of clarifiers required on-line.
6. Reduce the number of clarifiers on-line to shorten the detention time.
B. Septicity occuring in clarifier. 1. Refer to aeration problem observation No.3.
2. See 3 and 4 above. 3. Check for mechanical problems in
clarifier such as; a. Broken or warped wooden flights. b. Clogged sludge withdrawal tubes.
3. Perform needed maintenance. a. Repair or replace damaged flights. b. Jet tubes with air or water.
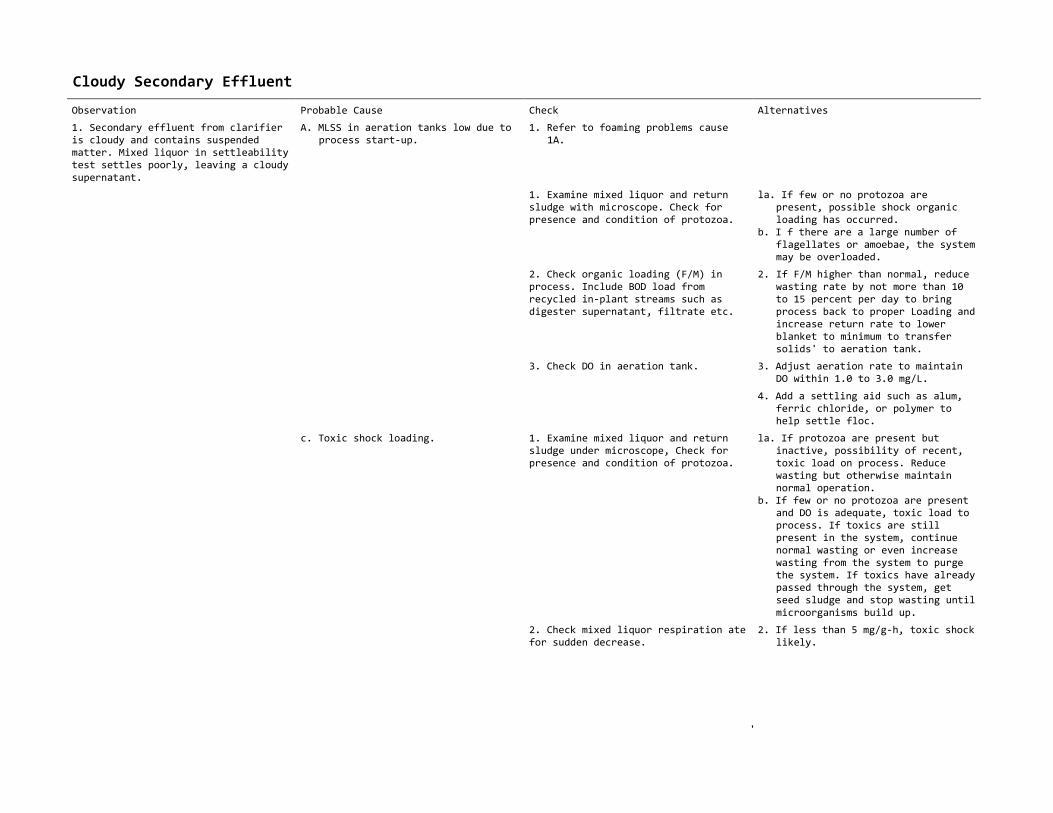
Cloudy Secondary Effluent
Observation Probable Cause Check Alternatives
1. Secondary effluent from clarifier is cloudy and contains suspended matter. Mixed liquor in settleability test settles poorly, leaving a cloudy
supernatant.
A. MLSS in aeration tanks low due to process start-up.
1. Refer to foaming problems cause 1A.
1. Examine mixed liquor and return sludge with microscope. Check for presence and condition of protozoa.
la. If few or no protozoa are present, possible shock organic loading has occurred.
b. I f there are a large number of flagellates or amoebae, the system may be overloaded.
2. Check organic loading (F/M) in process. Include BOD load from recycled in-plant streams such as digester supernatant, filtrate etc.
2. If F/M higher than normal, reduce wasting rate by not more than 10 to 15 percent per day to bring process back to proper Loading and increase return rate to lower blanket to minimum to transfer solids' to aeration tank.
3. Check DO in aeration tank. 3. Adjust aeration rate to maintain DO within 1.0 to 3.0 mg/L.
4. Add a settling aid such as alum, ferric chloride, or polymer to help settle floc.
c. Toxic shock loading. 1. Examine mixed liquor and return sludge under microscope, Check for presence and condition of protozoa.
la. If protozoa are present but inactive, possibility of recent, toxic load on process. Reduce wasting but otherwise maintain normal operation.
b. If few or no protozoa are present and DO is adequate, toxic load to process. If toxics are still present in the system, continue normal wasting or even increase wasting from the system to purge the system. If toxics have already passed through the system, get seed sludge and stop wasting until
microorganisms build up.
2. Check mixed liquor respiration ate for sudden decrease.
2. If less than 5 mg/g-h, toxic shock likely.
'
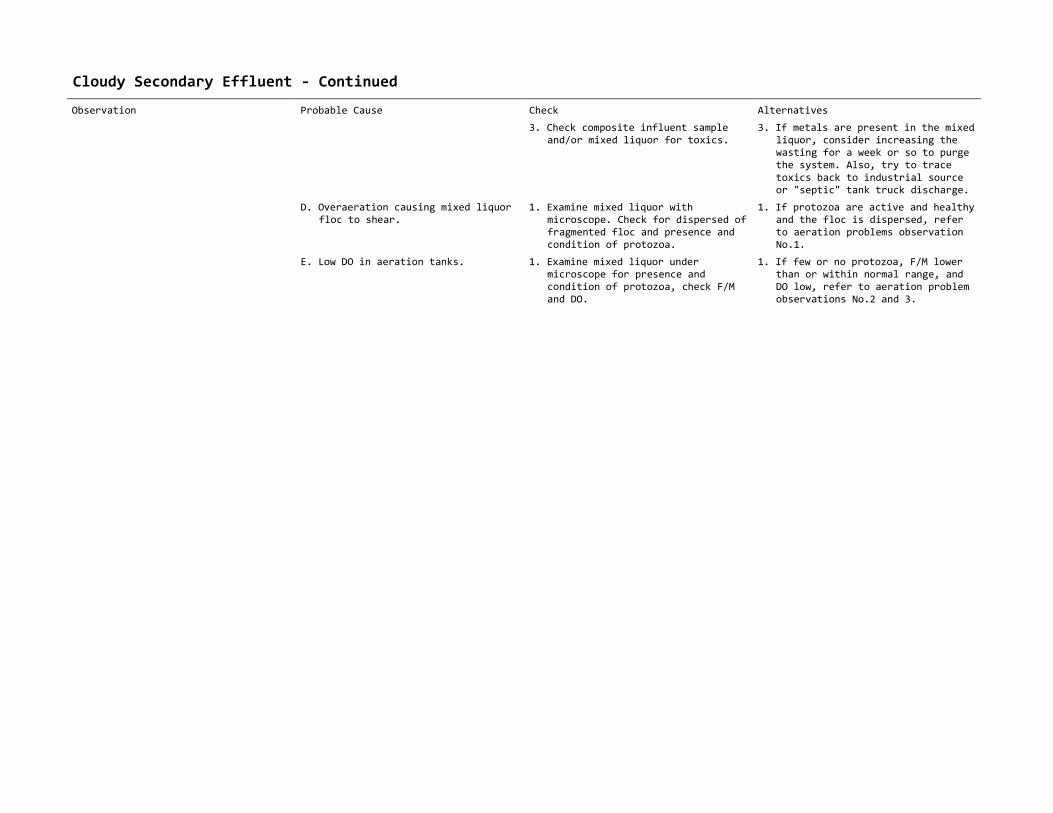
Cloudy Secondary Effluent - Continued
Observation Probable Cause Check Alternatives
3. Check composite influent sample and/or mixed liquor for toxics.
3. If metals are present in the mixed liquor, consider increasing the wasting for a week or so to purge the system. Also, try to trace
toxics back to industrial source or "septic" tank truck discharge.
D. Overaeration causing mixed liquor floc to shear.
1. Examine mixed liquor with microscope. Check for dispersed of fragmented floc and presence and condition of protozoa.
1. If protozoa are active and healthy and the floc is dispersed, refer to aeration problems observation No.1.
E. Low DO in aeration tanks. 1. Examine mixed liquor under microscope for presence and condition of protozoa, check F/M and DO.
1. If few or no protozoa, F/M lower than or within normal range, and DO low, refer to aeration problem observations No.2 and 3.

Ashing, pinpoint floc, and straggler floc
Observation Probable Cause Check Alternatives
1 Fine dispersed floc (about the size of a pinhead) extending throughout the clarifier with little islands of
sludge accumulated on the surface and discharging over the weirs. Mixed liquor in settleability test settles fairly well. Sludge is dense at bottom with fine particles of floc suspended in fairLy clear supernatant (pinpoint floc).
A. Aeration tank approach underloaded conditions (low F/M) because of old sludge.
1. Check and monitor trends for: a. Increasing MLVSS, mg/l. b. Increasing SRT.
c. Decreasing F/M. d. Increasing aeration for the same
DO Levels. e. Decreasing wasting. f. Decreasing organic load (BOD or
COD) in secondary influent.
1. Increase wasting rates by not more than 10 to 15 percent per day to bring back ·to optimum control. If
nitrification is required, avoid wasting too much.
2. Check for proper aeration and mixing in aeration tank.
2. Refer to aeration problems.
3. Add a settling aid such as alum, ferric chloride or polymer if possible to help settLe fLoc.
2. Small particles of ash-Like material floating on surface of clarifier and in mixed liquor settleability test(ashing).
A. Beginning of denitrification. 1. Check settleability. Stir floating floc on surface of 30"min settleability test.
1. If floating floc releases bubbles and settles, see clumping/rising sludge cause 1A.
2. If it does not settle, see causes
Band C below.
B. Excessive amounts of grease in mixed liquor.
1. Check grease analysis of MLSS, and check scum baffles and scum removal system in primary tank.
1. If the grease content exceeds5% by weight of the MLSS, repair or replace scum baffles, as needed or improve operation of scum removal.
2. Check grease content in raw wastewater.
2. If grease content is excessive, conduct industrial waste survey and enforce sewer use ordinance.
C. F/M extremely low and beyond extended aeration range (less than 0.05)
1. Check and monitor trends for: a. Increasing MLVSS, mg/l. b. Increasing SRT. c. Decreasing F/M. d. Increasing aeration for the same
DO levels. e. Decreasing wasting rates. f. Decreasing organic load (BOD or
COD) in secondary influent.
1. If ashing is significant enough to impact effluent quality by increasing effluent suspended solids, increase the wasting by not more than10 to 15 percent per day to raise the F/M and lower the SRT.
2. Check mixed Liquor settleability. 2. If sludge settles very quickly, leaving particles in suspension and effluent quality is decreasing, increase wasting as in 2.C.1 above.
3. Check for small thin amounts of scum on clarifier surface.
3. If present, and if effluent quality is decreasing, increase wasting as In 2. C. 1. above.

Ashing, pinpoint floc, and straggler floc
Observation Probable Cause Check Alternatives
3. Small light fluffy sludge particles rising to clarifier surface. Mixed liquor in
settleability test settles slowly, leaving straggler in supernatant (straggler floc).
A. Overloaded aeration tank (high F/M) resulting in a young low density sludge.
1. Check and monitor trends for: a. Decreasing MLVSS, mg/L b. Decreasing SRT.
c. Increasing F/M. d. Decreasing aeration for the DO.
1. Decrease wasting rates by not more than 10 to 15 percent per day.
2. Check wasting schedule. 2. If batch wasting, avoid wasting at the time of day when the BOD load is increasing.
3. Check to see if organic loading from sidestream flows contributes Significantly to overall process loading.
3. Include BOD load from side stream in F/M calculations
APPENDIX P
TROUBLESHOOTING ACTIVATED SLUDGE PROCESSES
(Source: Ronald Schuyler, P.E.)
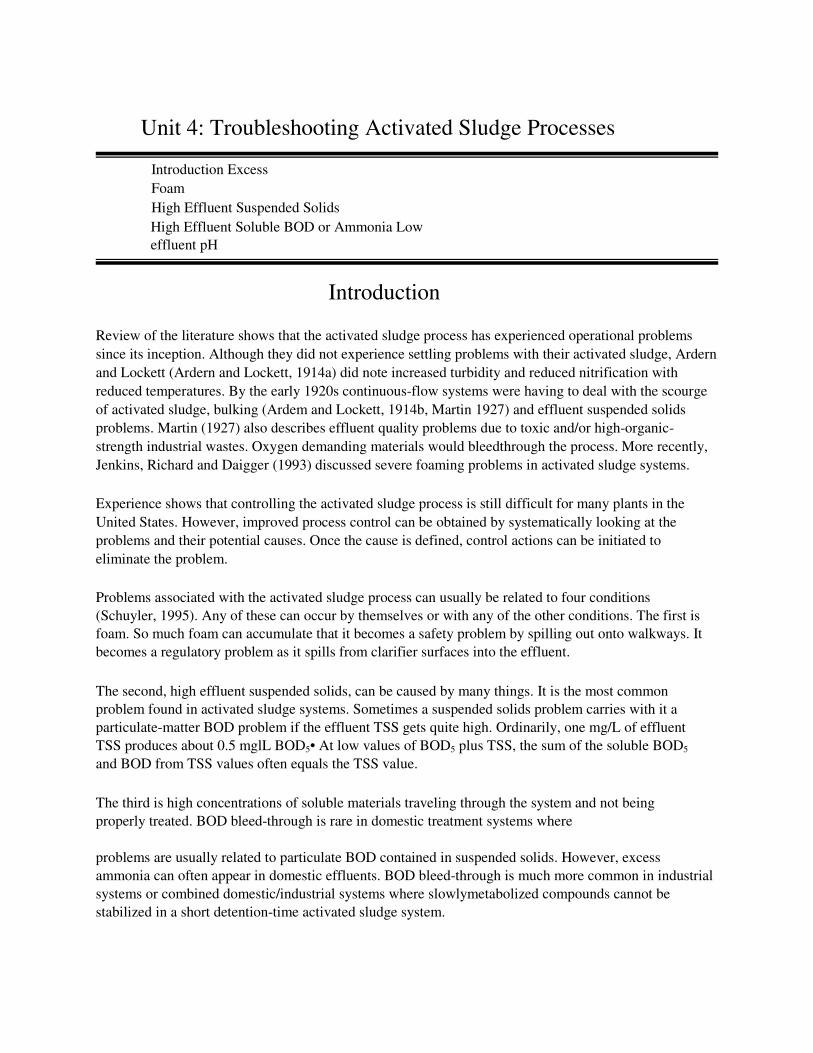
Unit 4: Troubleshooting Activated Sludge Processes
Introduction Excess
Foam
High Effluent Suspended Solids
High Effluent Soluble BOD or Ammonia Low
effluent pH
Introduction
Review of the literature shows that the activated sludge process has experienced operational problems
since its inception. Although they did not experience settling problems with their activated sludge, Ardern
and Lockett (Ardern and Lockett, 1914a) did note increased turbidity and reduced nitrification with
reduced temperatures. By the early 1920s continuous-flow systems were having to deal with the scourge
of activated sludge, bulking (Ardem and Lockett, 1914b, Martin 1927) and effluent suspended solids
problems. Martin (1927) also describes effluent quality problems due to toxic and/or high-organic-
strength industrial wastes. Oxygen demanding materials would bleedthrough the process. More recently,
Jenkins, Richard and Daigger (1993) discussed severe foaming problems in activated sludge systems.
Experience shows that controlling the activated sludge process is still difficult for many plants in the
United States. However, improved process control can be obtained by systematically looking at the
problems and their potential causes. Once the cause is defined, control actions can be initiated to
eliminate the problem.
Problems associated with the activated sludge process can usually be related to four conditions
(Schuyler, 1995). Any of these can occur by themselves or with any of the other conditions. The first is
foam. So much foam can accumulate that it becomes a safety problem by spilling out onto walkways. It
becomes a regulatory problem as it spills from clarifier surfaces into the effluent.
The second, high effluent suspended solids, can be caused by many things. It is the most common
problem found in activated sludge systems. Sometimes a suspended solids problem carries with it a
particulate-matter BOD problem if the effluent TSS gets quite high. Ordinarily, one mg/L of effluent
TSS produces about 0.5 mglL BOD5• At low values of BOD5 plus TSS, the sum of the soluble BOD5
and BOD from TSS values often equals the TSS value.
The third is high concentrations of soluble materials traveling through the system and not being
properly treated. BOD bleed-through is rare in domestic treatment systems where
problems are usually related to particulate BOD contained in suspended solids. However, excess
ammonia can often appear in domestic effluents. BOD bleed-through is much more common in industrial
systems or combined domestic/industrial systems where slowlymetabolized compounds cannot be
stabilized in a short detention-time activated sludge system.

The fourth general problem relates to low effluent pH. It is found most often in geographical areas
with naturally low-alkalinity water supplies where extended aeration and/or nitrification processes are
used. It is usually fairly easy to control. However, the problem can also be caused by low influent pH
and control may be more difficult.
Schuyler (1995) has identified 32 different conditions for one of these four effluent problems to exist.
These are shown in the following two-page troubleshooting guide. There are probably many other
situations, but these represent the vast majority of the significant problems. The following discussion
addresses each of those 32 conditions and the process control changes that should be made to eliminate
the problem. While using this chart, it must be remembered that elimination of one problem may allow
another problem to show up. Further, one condition may overshadow another such that the second
condition cannot be observed until the first is eliminated. Finally, it is difficult to precisely defme
control actions relative to specific numbers, such as an MCRT of 5 days or a return rate of 25 percent of
Q. Therefore, most control actions are discussed relative to the direction iliat change is needed. For
instance, for condition 23, the control action is to decrease wasting and return. The actual amount
depends on actual conditions and cannot be specified here. A plastic laminated wall chart is available
from Rothberg, Tamburini, & Winsor, Inc.
Excess Foam
Conditions 1 through 5 relate to excess foam in the system (Jenkins, et al., 1993). When considering
foam problems the question must be asked, "Is the amount of foam that exists a problem?" If it is not a
problem, the situation may be better left unresolved. Many people observe foam and consider it a
problem when it is not. For instance, a dark leathery Nocardia foam may look bad on an aeration tank
but may not be affecting effluent quality. However, the situation may arise where someone's boss or the
public thinks it's a problem; then it becomes the operator's problem.
Condition 1- Pumice-Like Foam
This type of foam often appears gray but if one looks closely, they observe that the foam has a large
number of dark specks. This foam is usually due to solids returned from sludge processing. It may be
due to poor solids capture from a belt press or a centrifuge or from digester supernatant return that
contains excess solids. The key to improvement of this condition is to improve the solids capture in
the sludge processing scheme.
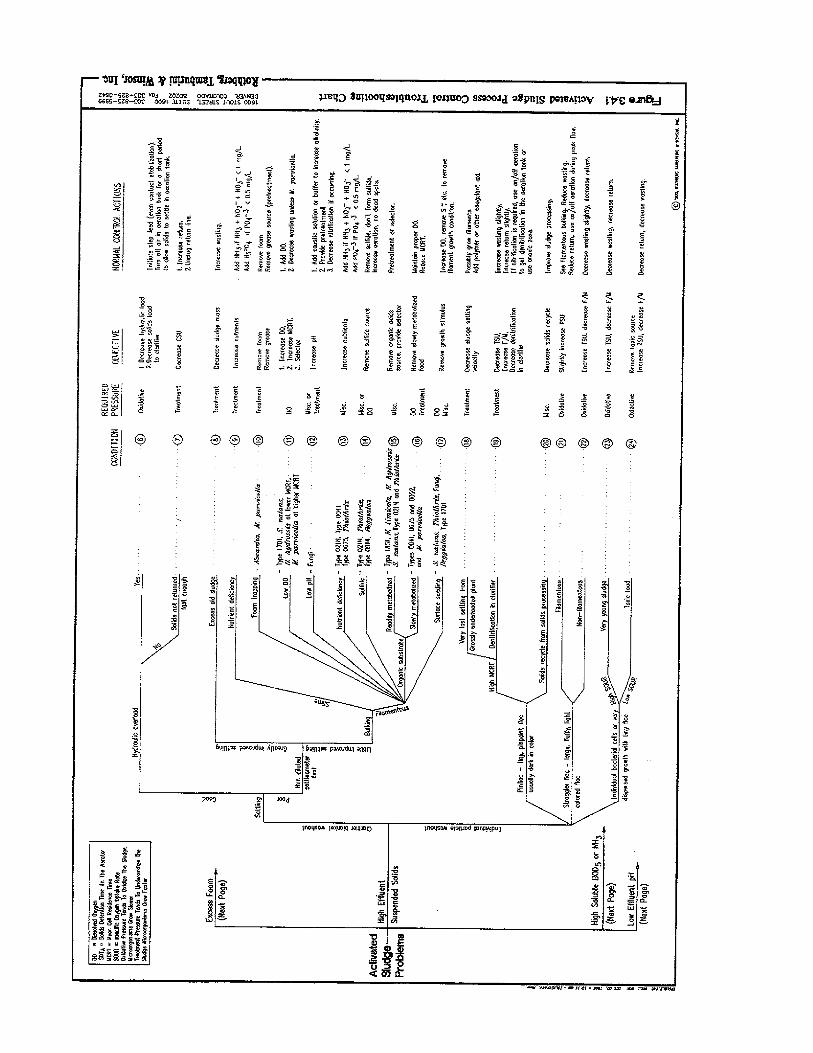


Condition 2 - Slimy Foam
A grayish slimy foam that is very thick is commonly caused by nutrient deficiencies. It is often
noted with a slime bulking condition. Those deficiencies may be either nitrogen or phosphorus.
The solution usually involves addition of the limiting nutrient, such as ammonia to provide
nitrogen, or phosphoric acid to provide phosphorus. There is usually enough nutrient if the
ammonia plus nitrate in filtered (0.45 µm) effluent is greater than 1 mg/L and the soluble
orthophosphate is greater than 0.5 mg/L (Jenkins, et al., 1993). However, in certain cases where
easily degradable, soluble BOD is available, higher N and P concentrations may be necessary.
Condition 3 - Dark Brown, Thick, Scummy Foam
Old sludge conditions usually cause a dark brown, thick, scummy foam. It is usually caused by
the growth of Nocardia or Microthrix parvicella, both of which grow at the high MCRT/low
F/M condition associated with old sludge. A treatment pressure is required to decrease the total
sludge units in the system. Thus, one must increase wasting and try to remove foam from the
system. Once Nocardia has started to grow profusely, it is difficult to eliminate through
increased wasting. Therefore, removal of foam from the system becomes more important.
Foaming due to M. parvicella appears to occur more during colder temperature conditions while
Nocardia can bloom profusely under higher temperature conditions. Both also appear to like oils
and grease in their diets.
Conditions 4 and 5 - White Billowy Foam
White billowy foam is caused by high concentrations of surfactants such as detergents. It is not
nearly the problem today that it was before biodegradable detergents were used. Condition 4
occurs at start-up of a system where a young sludge exists due to low mixed liquor suspended
solids concentrations. In this condition there are just not enough solids present to break the
surface tension of the surfactant bubbles that form. Thus, billowy white foam can accumulate on
the aeration tank and can even be blown around by the wind. The condition is usually short-lived
since at start-up the operator is usually applying oxidative pressure by increasing the total sludge
units in the system. If the condition occurs due to previous excessive wasting, the solution is still
to decrease wasting and increase the total sludge units in the system.
Condition 5 is found when there are higher concentrations of suspended solids. The cause is
usually a very high surfactant load such as may be found when certain industrial processes are
cleaned. Although there is a higher suspended solids concentration, it is still not high enough to
break the surface tension of the surfactant bubbles. Again, an oxidative pressure is required to
increase the total sludge units by decreased wasting and it is also worthwhile to increase the
solids detention time in the aerator by decreasing the return flow rate.
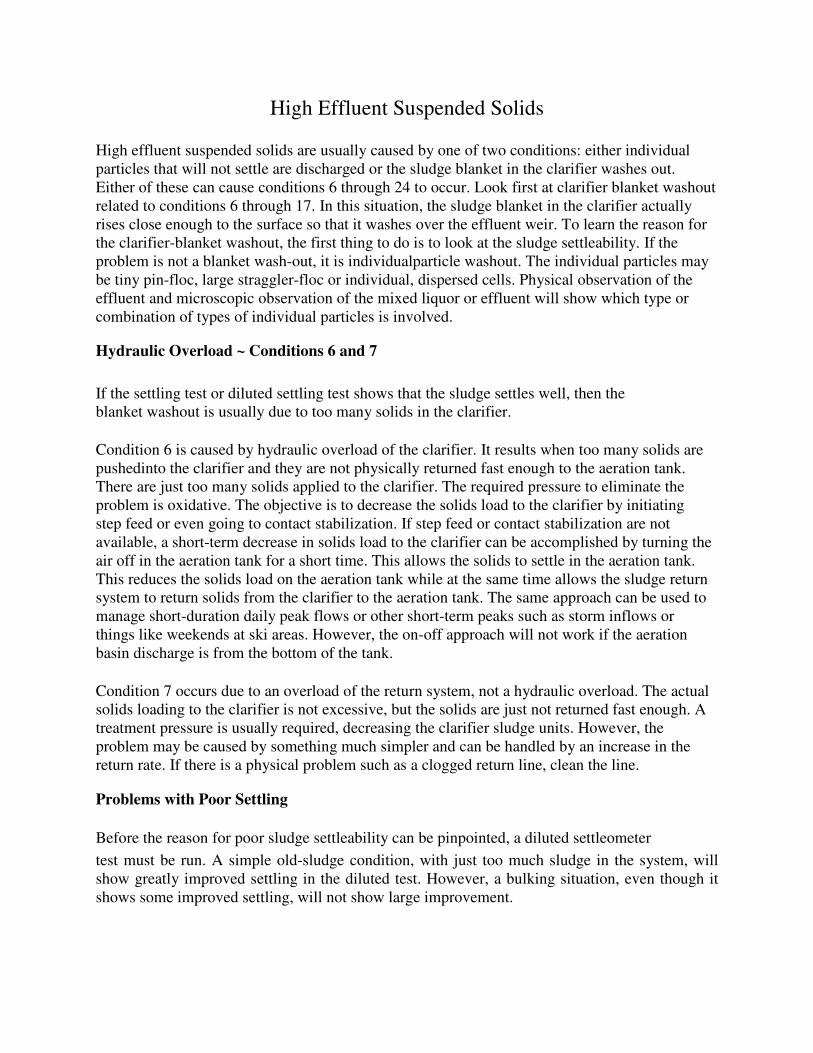
High Effluent Suspended Solids
High effluent suspended solids are usually caused by one of two conditions: either individual
particles that will not settle are discharged or the sludge blanket in the clarifier washes out.
Either of these can cause conditions 6 through 24 to occur. Look first at clarifier blanket washout
related to conditions 6 through 17. In this situation, the sludge blanket in the clarifier actually
rises close enough to the surface so that it washes over the effluent weir. To learn the reason for
the clarifier-blanket washout, the first thing to do is to look at the sludge settleability. If the
problem is not a blanket wash-out, it is individualparticle washout. The individual particles may
be tiny pin-floc, large straggler-floc or individual, dispersed cells. Physical observation of the
effluent and microscopic observation of the mixed liquor or effluent will show which type or
combination of types of individual particles is involved.
Hydraulic Overload ~ Conditions 6 and 7
If the settling test or diluted settling test shows that the sludge settles well, then the
blanket washout is usually due to too many solids in the clarifier.
Condition 6 is caused by hydraulic overload of the clarifier. It results when too many solids are
pushedinto the clarifier and they are not physically returned fast enough to the aeration tank.
There are just too many solids applied to the clarifier. The required pressure to eliminate the
problem is oxidative. The objective is to decrease the solids load to the clarifier by initiating
step feed or even going to contact stabilization. If step feed or contact stabilization are not
available, a short-term decrease in solids load to the clarifier can be accomplished by turning the
air off in the aeration tank for a short time. This allows the solids to settle in the aeration tank.
This reduces the solids load on the aeration tank while at the same time allows the sludge return
system to return solids from the clarifier to the aeration tank. The same approach can be used to
manage short-duration daily peak flows or other short-term peaks such as storm inflows or
things like weekends at ski areas. However, the on-off approach will not work if the aeration
basin discharge is from the bottom of the tank.
Condition 7 occurs due to an overload of the return system, not a hydraulic overload. The actual
solids loading to the clarifier is not excessive, but the solids are just not returned fast enough. A
treatment pressure is usually required, decreasing the clarifier sludge units. However, the
problem may be caused by something much simpler and can be handled by an increase in the
return rate. If there is a physical problem such as a clogged return line, clean the line.
Problems with Poor Settling
Before the reason for poor sludge settleability can be pinpointed, a diluted settleometer
test must be run. A simple old-sludge condition, with just too much sludge in the system, will
show greatly improved settling in the diluted test. However, a bulking situation, even though it
shows some improved settling, will not show large improvement.
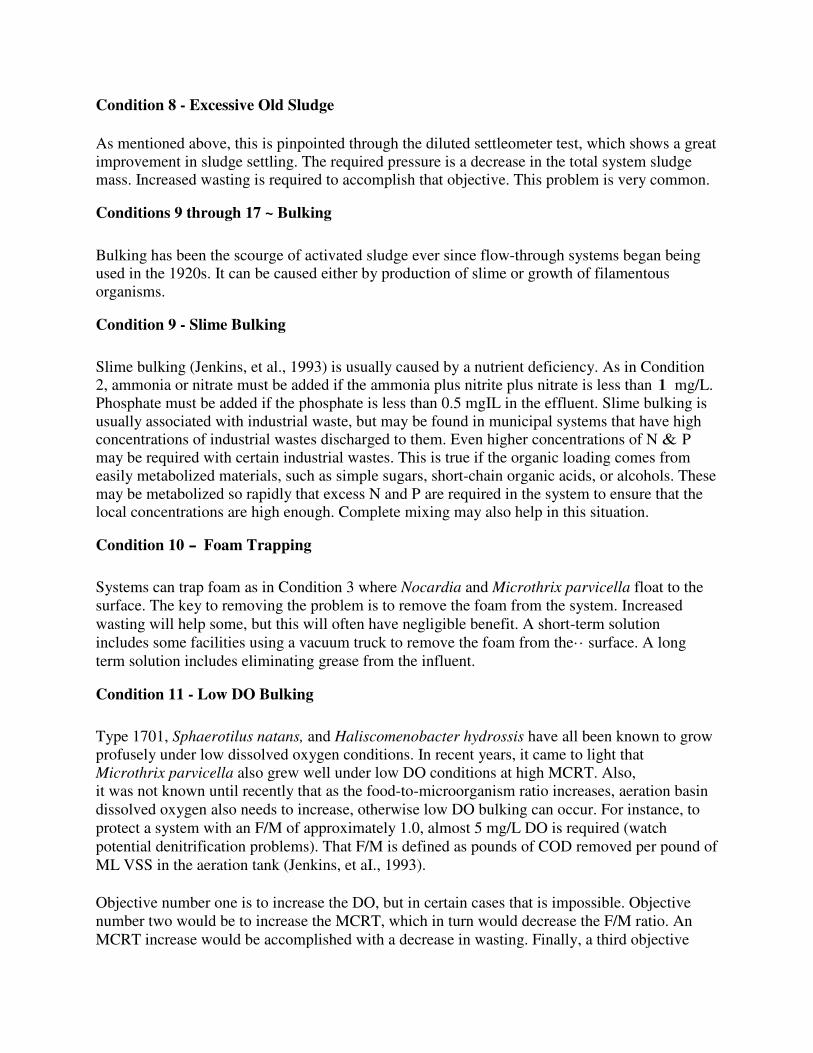
Condition 8 - Excessive Old Sludge
As mentioned above, this is pinpointed through the diluted settleometer test, which shows a great
improvement in sludge settling. The required pressure is a decrease in the total system sludge mass. Increased wasting is required to accomplish that objective. This problem is very common.
Conditions 9 through 17 ~ Bulking
Bulking has been the scourge of activated sludge ever since flow-through systems began being used in the 1920s. It can be caused either by production of slime or growth of filamentous
organisms.
Condition 9 - Slime Bulking
Slime bulking (Jenkins, et al., 1993) is usually caused by a nutrient deficiency. As in Condition 2, ammonia or nitrate must be added if the ammonia plus nitrite plus nitrate is less than 1 mg/L.
Phosphate must be added if the phosphate is less than 0.5 mgIL in the effluent. Slime bulking is
usually associated with industrial waste, but may be found in municipal systems that have high concentrations of industrial wastes discharged to them. Even higher concentrations of N & P
may be required with certain industrial wastes. This is true if the organic loading comes from
easily metabolized materials, such as simple sugars, short-chain organic acids, or alcohols. These
may be metabolized so rapidly that excess N and P are required in the system to ensure that the local concentrations are high enough. Complete mixing may also help in this situation.
Condition 10 - Foam Trapping
Systems can trap foam as in Condition 3 where Nocardia and Microthrix parvicella float to the
surface. The key to removing the problem is to remove the foam from the system. Increased
wasting will help some, but this will often have negligible benefit. A short-term solution
includes some facilities using a vacuum truck to remove the foam from the· · surface. A long
term solution includes eliminating grease from the influent.
Condition 11 - Low DO Bulking
Type 1701, Sphaerotilus natans, and Haliscomenobacter hydrossis have all been known to grow
profusely under low dissolved oxygen conditions. In recent years, it came to light that
Microthrix parvicella also grew well under low DO conditions at high MCRT. Also,
it was not known until recently that as the food-to-microorganism ratio increases, aeration basin
dissolved oxygen also needs to increase, otherwise low DO bulking can occur. For instance, to
protect a system with an F/M of approximately 1.0, almost 5 mg/L DO is required (watch
potential denitrification problems). That F/M is defined as pounds of COD removed per pound of
ML VSS in the aeration tank (Jenkins, et aI., 1993).
Objective number one is to increase the DO, but in certain cases that is impossible. Objective
number two would be to increase the MCRT, which in turn would decrease the F/M ratio. An
MCRT increase would be accomplished with a decrease in wasting. Finally, a third objective
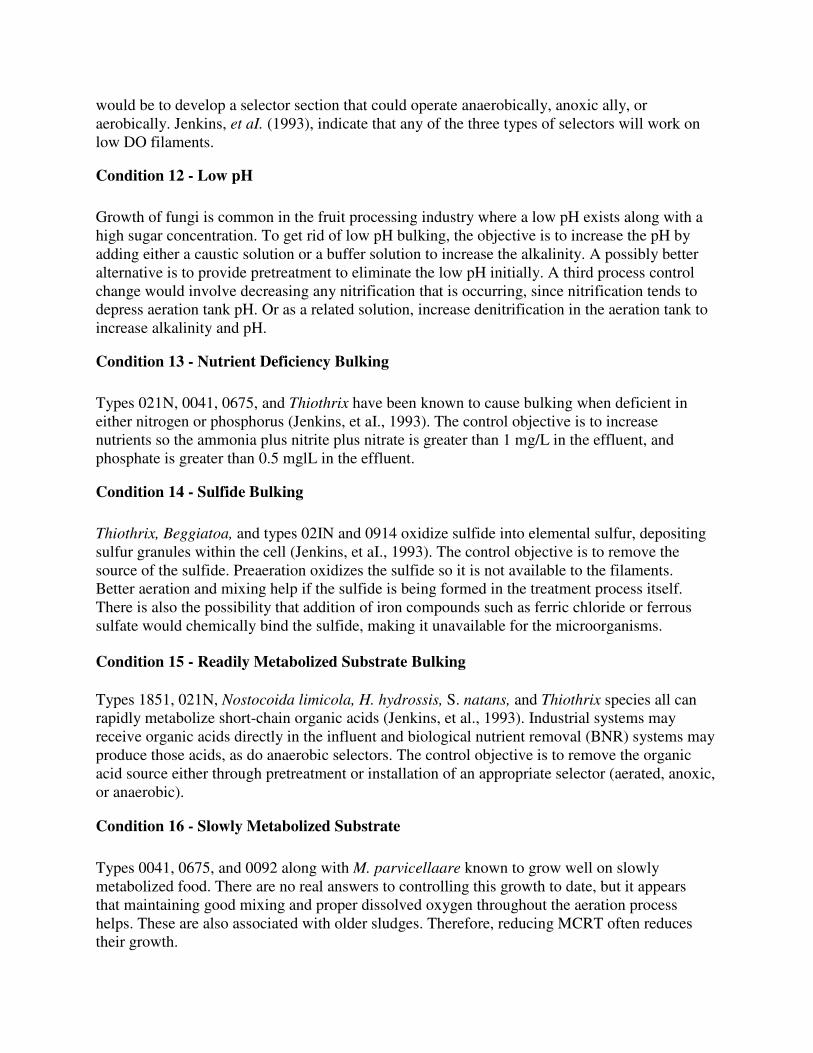
would be to develop a selector section that could operate anaerobically, anoxic ally, or
aerobically. Jenkins, et aI. (1993), indicate that any of the three types of selectors will work on
low DO filaments.
Condition 12 - Low pH
Growth of fungi is common in the fruit processing industry where a low pH exists along with a
high sugar concentration. To get rid of low pH bulking, the objective is to increase the pH by
adding either a caustic solution or a buffer solution to increase the alkalinity. A possibly better
alternative is to provide pretreatment to eliminate the low pH initially. A third process control
change would involve decreasing any nitrification that is occurring, since nitrification tends to
depress aeration tank pH. Or as a related solution, increase denitrification in the aeration tank to
increase alkalinity and pH.
Condition 13 - Nutrient Deficiency Bulking
Types 021N, 0041, 0675, and Thiothrix have been known to cause bulking when deficient in
either nitrogen or phosphorus (Jenkins, et aI., 1993). The control objective is to increase
nutrients so the ammonia plus nitrite plus nitrate is greater than 1 mg/L in the effluent, and
phosphate is greater than 0.5 mglL in the effluent.
Condition 14 - Sulfide Bulking
Thiothrix, Beggiatoa, and types 02IN and 0914 oxidize sulfide into elemental sulfur, depositing
sulfur granules within the cell (Jenkins, et aI., 1993). The control objective is to remove the
source of the sulfide. Preaeration oxidizes the sulfide so it is not available to the filaments.
Better aeration and mixing help if the sulfide is being formed in the treatment process itself.
There is also the possibility that addition of iron compounds such as ferric chloride or ferrous
sulfate would chemically bind the sulfide, making it unavailable for the microorganisms.
Condition 15 - Readily Metabolized Substrate Bulking
Types 1851, 021N, Nostocoida limicola, H. hydrossis, S. natans, and Thiothrix species all can
rapidly metabolize short-chain organic acids (Jenkins, et al., 1993). Industrial systems may
receive organic acids directly in the influent and biological nutrient removal (BNR) systems may
produce those acids, as do anaerobic selectors. The control objective is to remove the organic
acid source either through pretreatment or installation of an appropriate selector (aerated, anoxic,
or anaerobic).
Condition 16 - Slowly Metabolized Substrate
Types 0041, 0675, and 0092 along with M. parvicellaare known to grow well on slowly
metabolized food. There are no real answers to controlling this growth to date, but it appears
that maintaining good mixing and proper dissolved oxygen throughout the aeration process
helps. These are also associated with older sludges. Therefore, reducing MCRT often reduces
their growth.

Condition 17 - Surface Seeding
Organisms such as Sphaerotilus natans, Thiothrix, Beggiatoa, fungi, and type 1701 can grow
on upstream surfaces such as pipes or attached growth pretreatment systems. As these
organisms slough off, they provide a large population of filaments for the aeration tank. If the
environment in the aeration tank is not conducive to growth of these filaments, they will die out
without proliferating. However, if they find a suitable environment in the aeration tank, they
will proliferate accordingly. Therefore, the answer to control is to make sure that the aeration
system provides enough DO, removes sulfide, or does whatever else is necessary to remove
good filament growth conditions in the aeration tank.
Conditions 18, 19, and 20 - Pin-floc
Pin-floc is tiny, usually dark, pinpoint-sized floc associated with very old sludge. Three
different problems, specifically numbers 18, 19, and 20, are associated with pin-floc.
Condition 18. Pin-floc is often found in situations where the treatment plant is grossly
underloaded and the mixed liquor suspended solids cannot be reduced any further than the
present value. If it is reduced, the concentration gets so low that effective settling is impossible.
Normally, one would try to reduce the MCRT, but this requires wasting and a reduced MLSS
and it seldom works in this case. It may be worth trying to grow some filaments, such as low
DO filaments, that would slow the settling and improve the capture of solids. Maintaining a DO
between 0.1 and 0.5 in the aeration tank will usually allow low DO filaments to grow. Be
careful!
Condition 19. Pin-floc is also associated with denitrification in the clarifier. Bacteria convert the
nitrate to nitrogen gas and the resulting bubbles buoy floc particles to the surface. Ashing or
clumping is often seen. A treatment pressure is required by reducing the total sludge units in the
system. A slight increase in wasting usually eliminates the problem, however increased returns
may also be required. If an increased return rate is used, be sure the other process demands, e.g.,
SDT A are met. Too-high return rates are very common. The use of on/off aeration or an anoxic
zone in the aeration tank may also be helpful. It allows the denitrification to occur in the aeration
tank where it is not a problem rather than in the clarifier where it is a problem.
Condition 20. Pin-floc also occurs in systems where solids are unintentionally being returned
from solids processing. Excessive solids in anaerobic or aerobic digester supernatant or improper solids capture from sludge dewatering systems can all cause excessive loads of tiny
sludge particles that will show up as pin-floc. They mayor may not be associated with
denitrification, so one has to be careful to decide which is causing the problem.

Conditions 21 and 22 - Straggler Floc
Straggler floc is large, light colored, very fluffy floc that mayor may not be filamentous. Microscopic observation will quickly show if it is filamentous or nonfilamentous. The effects
of straggler floc are made worse by poor clarifier design and by high influent or return flows.
Reducing return rates often helps.
Condition 21. All of the filamentous growth conditions, Conditions 11 through 17, can cause
fIlamentous straggler floc development and the control actions associated with those should be
followed. With severe cases during peak flows, try on/off aeration or step-feed. If that does not
work, clarifier modification may be required.
Condition 22. NonfIlamentous straggler floc may be observed where changes in organic loading have caused certain floes to grow very quickly. An oxidative pressure is needed, which
increases the total sludge units and decreases the food-to-microorganism ratio. Thus, a slight
decrease in wasting and a slight decrease in returns often solves the problem.
Conditions 23 and 24 - Dispersed Growth
Dispersed growth is growth of individual bacterial cells or very tiny floc. The specific
oxygen uptake rate (SOUR) will help identify the cause for the dispersed growth.
Condition 23. Very fast growth conditions, such as those seen at start-up can exhibit
dispersed growth. It is shown by extremely high SOURs. An oxidative pressure is required
that increases the total sludge units and decreases the F/M ratio. Again, as in
Condition 22, a decrease in wasting and a decrease in return will usually help the condition.
Condition 24. A toxic load can also cause dispersed growth. This case is shown by a very low
OUR or SOUR Once the toxic load has passed, an oxidative pressure is needed to increase the
total sludge units and decrease the food-to-microorganism ratio. Thus, a decrease in wasting and
decrease in return is appropriate. Remember, excessive cWorination of return sludge for bulking
control can cause dispersion of cells.
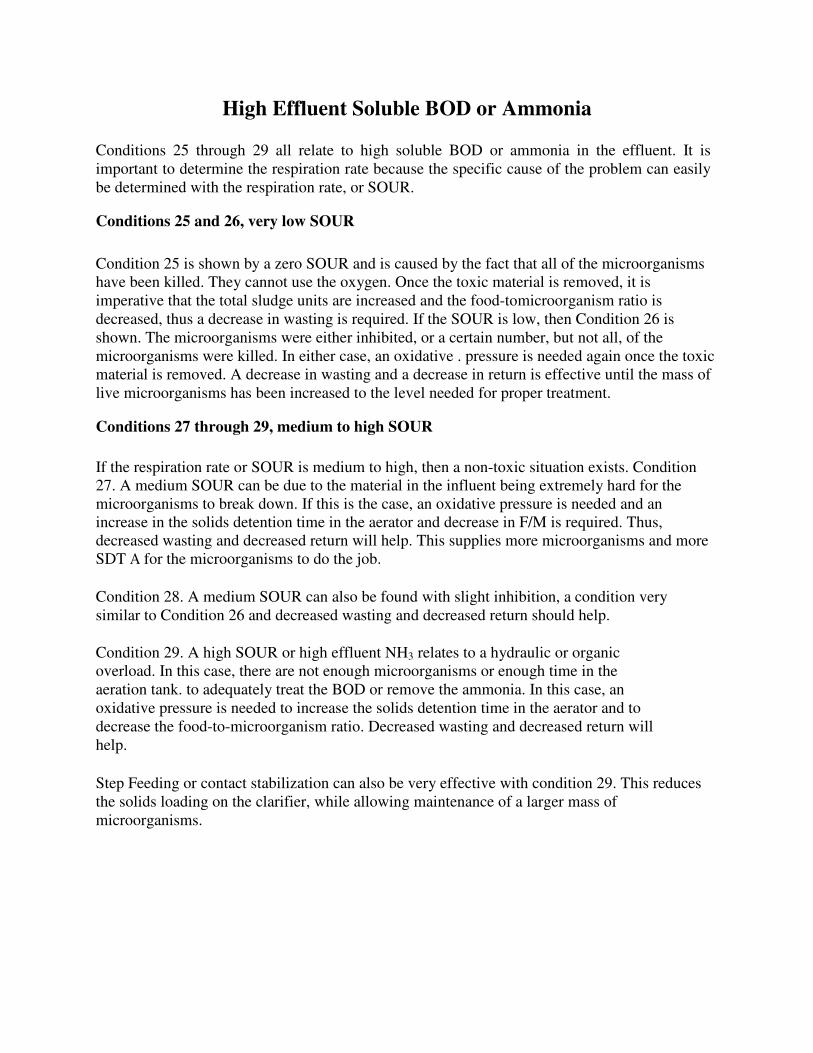
High Effluent Soluble BOD or Ammonia
Conditions 25 through 29 all relate to high soluble BOD or ammonia in the effluent. It is
important to determine the respiration rate because the specific cause of the problem can easily
be determined with the respiration rate, or SOUR.
Conditions 25 and 26, very low SOUR
Condition 25 is shown by a zero SOUR and is caused by the fact that all of the microorganisms
have been killed. They cannot use the oxygen. Once the toxic material is removed, it is
imperative that the total sludge units are increased and the food-tomicroorganism ratio is
decreased, thus a decrease in wasting is required. If the SOUR is low, then Condition 26 is
shown. The microorganisms were either inhibited, or a certain number, but not all, of the
microorganisms were killed. In either case, an oxidative . pressure is needed again once the toxic
material is removed. A decrease in wasting and a decrease in return is effective until the mass of
live microorganisms has been increased to the level needed for proper treatment.
Conditions 27 through 29, medium to high SOUR
If the respiration rate or SOUR is medium to high, then a non-toxic situation exists. Condition
27. A medium SOUR can be due to the material in the influent being extremely hard for the
microorganisms to break down. If this is the case, an oxidative pressure is needed and an
increase in the solids detention time in the aerator and decrease in F/M is required. Thus,
decreased wasting and decreased return will help. This supplies more microorganisms and more
SDT A for the microorganisms to do the job.
Condition 28. A medium SOUR can also be found with slight inhibition, a condition very
similar to Condition 26 and decreased wasting and decreased return should help.
Condition 29. A high SOUR or high effluent NH3 relates to a hydraulic or organic
overload. In this case, there are not enough microorganisms or enough time in the
aeration tank. to adequately treat the BOD or remove the ammonia. In this case, an
oxidative pressure is needed to increase the solids detention time in the aerator and to
decrease the food-to-microorganism ratio. Decreased wasting and decreased return will
help.
Step Feeding or contact stabilization can also be very effective with condition 29. This reduces
the solids loading on the clarifier, while allowing maintenance of a larger mass of
microorganisms.

Low Effluent pH
The last general condition that requires consideration is low effluent pH, conditions 30-32. It is
usually caused by one of two reasons, low influent pH or low alkalinity water with nitrification.
Either can cause regulatory noncompliance.
Condition 30. If the influent pH is low (acidic), there is a good chance that the condition will go
through the plant and show-up in the effluent. Chemical addition to raise the pH is the immediate
solution. Lime, soda ash, or sodium bicarbonate are normally used for pH adjustment. However,
the ultimate solution is to eliminate the low pH source from the collection system by enforcing
pretreatment requirements. An industrial system may have to live with pH adjustment.
Condition 31. If the influent pH is satisfactory, then the low effluent pH is usually caused by
nitrification in combination with low natural alkalinity in the wastewater. If ammonia removal is
required, then nitrification must continue. Use of on/off aeration or provision for an anoxic zone
often returns enough alkalinity to satisfactorily raise the pH. However, if neither of these is
possible, then pH adjustment similar to Condition 30 may be required.
Condition 32. With satisfactory influent pH near 7.0 and nitrification not required, the MCRT or
DO can often be reduced enough to inhibit nitrification. With no nitrification, there is no
alkalinity reduction through the aeration process and the pH remains stable. However, in
systems that naturally nitrify, such as extended aeration, a solution for Condition 31 may have
to be applied, if MCRT and DO control cannot provide a solution.
References
Ardem, E. and W. T. Lockett. 1914a. Experiments on the oxidation of sewage without the aid
of filters. J. Soc. 01 Chemical Industry (England), 33:523-539.
Ardem, E. and W. T. Lockett. 1914b. The oxidation of sewage without the aid of filters.
Part II. J. Soc. of Chern Industry (England), 33: 1122-1124.
Martin, A. J. 1927. The Activated Sludge Process. MacDonald and Evans, London.
Jenkins, D., M. G. Richard and G. T. Daigger. 1993. Manual on the Causes and Control of
Activated Sludge Bulking and Foaming. Lewis Publishers, Inc., Chelsea, MI.
Schuyler, R.G. 1995. Activated Sludge Process Control Troubleshooting Chart.
Rothberg, Tamburini and Winsor, Inc., 1600 Stout Street, Suite 1800, Denver, CO 80202-3126.

APPENDIX Q
Calculations of Target MCRT for Nitrification
(Source: Sterns & Wheeler for New York Department of Conservation)
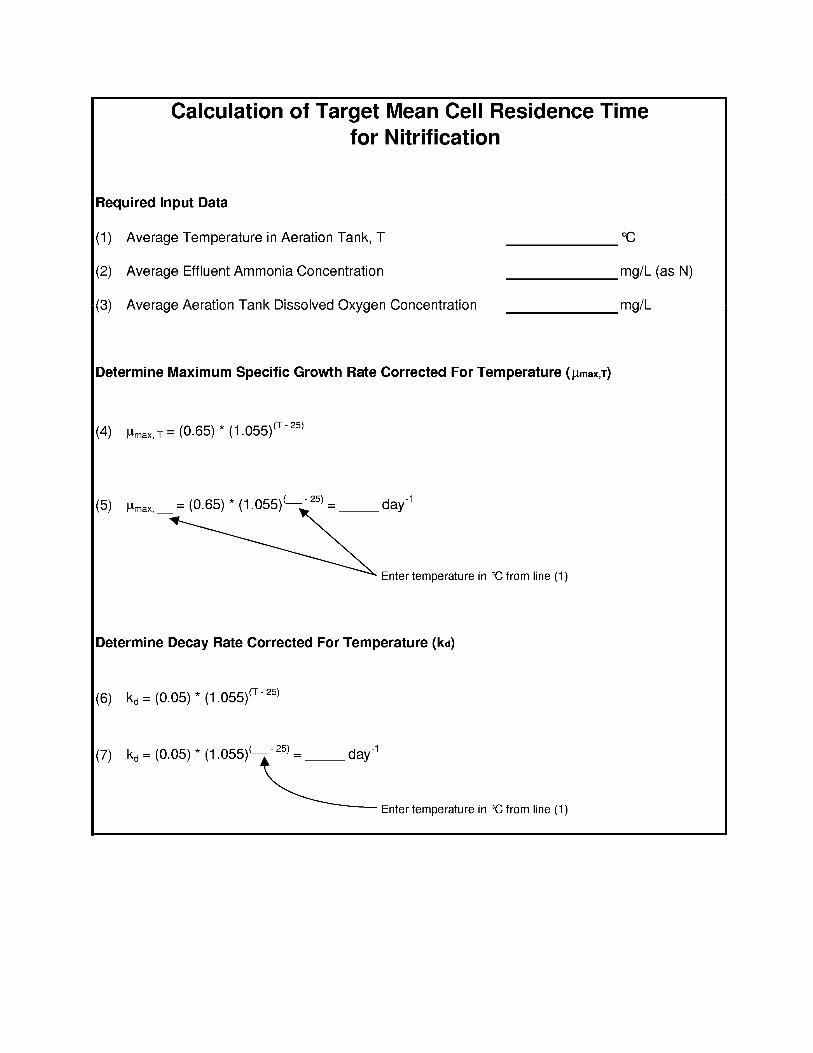

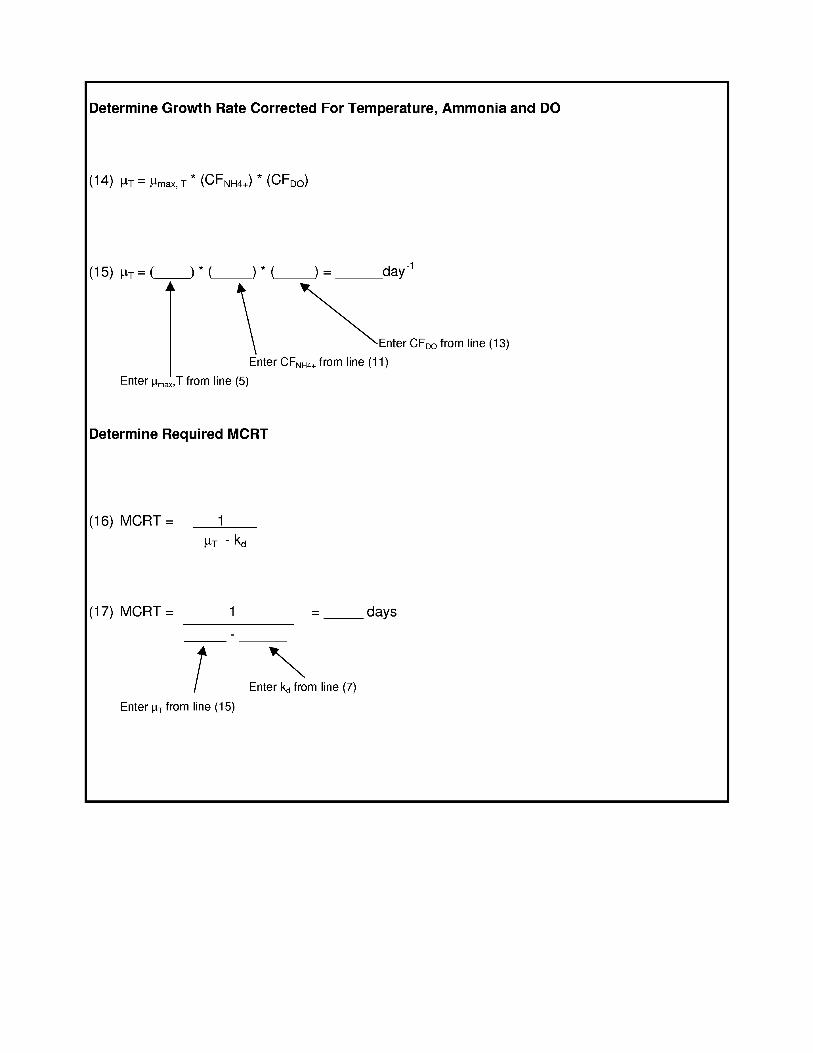

APPENDIX R
PROCESS CONTROL CALCULATIONS

PROCESS CONTROL CALCULATIONS
Return Activated Sludge (RAS) Rate
Method A - Settleability
Where:
Qr = RAS (return activated sludge) Flow Rate in MGD
Q = Flow through the plant in MGD
MLSS = Mixed Liquor Suspended Solids in mg/L
SVI = Sludge Volume Index
Method B – Secondary Clarifier Mass Balance
Where:
Qr = RAS (return activated sludge) Flow Rate in MGD
Q = Flow through the plant in MGD
MLSS = Mixed Liquor Suspended Solids in mg/L
RASSS = Return Activated Sludge Suspended Solids in mg/L
Method C – Aeration Tank Mass Balance
Where:
Qr = RAS (return activated sludge) Flow Rate in MGD
Q = Flow through the plant in MGD
MLSS = Mixed Liquor Suspended Solids in mg/L
RASSS = Return Activated Sludge Suspended Solids in mg/L
1. The basic control strategy is: 1) maintain an optimal distribution of solids between the aeration tank
and the clarifier (solids belong in the aeration tank); 2) return the solids to the aeration tank quickly
(avoid anaerobic conditions); and, 3) optimize the sludge concentration (thickly).
2. Return sludge flow rate changes should be made whenever: 1) the average daily flow changes; or, 2)
the sludge settling characteristics change.
3. Return sludge flow rate changes should be limited to ± 15% - 25% per day
4. System response to RAS flow changes is somewhat rapid. Normally, the system responds within ½
the aeration detention time.
L/mg
L/mgMGDr
MLSSSVI
000,000,1
MLSSQQ
−
×
=
L/mg
L/mg
L/mg
L/mg
r
RASSS
MLSS1
RASSS
MLSS
Q
−
=
L/mgl/mg
L/mgMGDr
MLSSRASSS
MLSSQQ
−
×
=

Waste Activated Sludge (WAS) Rate
Constant MLSS
Where:
QW = Waste sludge flow in pounds
MLSS = Mixed Liquor Suspended Solids in mg/L
VA = Aeration tank volume
Constant F:M Ratio
Where:
QW = Waste sludge flow in pounds
MLVSS = Mixed Liquor Volatile Suspended Solids in mg/L
F:M = Food to Microorganism Ratio = Influent BOD in pounds
MLVSS in pounds
Constant Sludge Retention Time (SRT)
Where:
QW = Waste sludge flow in pounds
MLSS = Mixed Liquor Suspended Solids in mg/L
VA = Aeration tank volume
ESS = Effluent Suspended Solids
1. Waste sludge control has two goals: 1) to remove tha excess accumulation of sludge in the system;
and, 2) to maintain the good sludge quality.
2. System response to waste activated sludge changes are normally slow; usually from 1 to 2 SRTs.
3. Waste sludge changes should be limited to ± 15% per day.
)34.8()V()etMLSSargTSActualLMLS(Q AW ××−=
M:etFargT
BODSActualLMLSMLVSSinQ inf
W −=
34.8QESSSRTetargT
34.8Va)MLSS(QW ××−
××=

APPENDIX S
Wet Weather Operating Plan Guidelines

A wet weather operating plan is intended to provide operators with a guide to minimize the discharge of pollutants
during wet weather and to protect their facilities from upset.
A. Key Elements. Every wet weather operating plan should contain the following key elements:
• Goals of the Plan. The goals section will define the overall objectives of the wet weather operating plan with
respect to protecting water quality and plant performance.
• Critical Components. The plan should list the critical components of the collection and treatment system that
significantly impact wet weather performance. For each critical component, specific objectives should be
defined.
• Operating Guidelines. For each critical component, the plan will contain step by step guidance for operation,
maintenance, and management procedures to be followed before, during and after a wet weather event.
• List of Contacts. The plan should contain a list of important contacts that may be of assistance during wet
weather events.
1. Goals of the Plan. The goals of the plan should define the water quality objectives of the collection and
treatment system. For most systems with combined sewer overflows, operating decisions made during wet
weather events can affect how much flow is treated at the wastewater treatment plant and how much flow is
bypassed through CSOs. Difficult decisions must be made rapidly. These decisions may affect water quality in
the receiving water at the CSOs, water quality in the receiving water at the plant, and performance of the plant
during and after the wet weather event. Well defined goals for receiving water quality will help guide the
development of operating guidelines for the plant and help guide decision making during wet weather events. It
may be necessary to obtain advice from the Maine DEP in setting water quality priorities.
2. Critical Components. The critical components are processes in the collection system (such as CSO regulators
or pumping stations) or the treatment plant (such as bar screens or aeration tanks) which can significantly affect
treatment of wet weather flow (or can be significantly affected by wet weather flow). The list of critical
components is unique to each facility. One plant’s critical components may not be critical at another facility.
The Wet Weather Operating Plan is not intended as a substitute for the plant’s operation and maintenance
manual. Components that have no bearing on wet weather operations will not be listed. As an example, a
collection system may include multiple wastewater pumping stations, but not all stations may le listed as critical
components. Unlisted stations might serve a new portion of the sewer system that has no combined sewers and
little I/I. Though regular operation and maintenance procedures are essential at an pumping stations, no special
procedures may be needed at these stations during wet weather.
Any major unit process in the collection system or the wastewater treatment plant that is handling wet weather
flows should be included on the list of critical components. Even if the process does not normally present
special problems during wet weather it should be included on the list if it is handling wet weather flows. In
addition, auxiliary processes that are impacted by wet weather flows should be included. If, for example,
special provisions for sludge handling must be made during wet weather, a sludge thickening, stabilization or
dewatering processes might be included on the list of critical components.
3. Operating Guidelines. Operating Guidelines should be developed for each critical component identified in the
collection system and treatment plant. For each component, tasks should be listed for completion before, during
and after a wet weather event. Task descriptions should be brief and specific. The wet weather operating plan
is intended to serve as a quick reference during a wet weather event. This is not the place for a detailed
description of the theory behind a treatment process. The description must be specific enough, however, to
describe exactly what needs to be accomplished. For example, “Check water level in influent channel” may not
be specific enough. But, “Check water level in influent channel. Open feed gate to second bar screen if water
level is above 3-foot mark on staff gauge” provides specific direction based upon a required observation.
4. List of Contacts. Develop a list of contacts who can provide advice or assistance during a wet weather event.
The list should include supervisors, and other involved public officials, equipment representatives and service
organizations, local and state regulatory agencies, utilities, and emergency contacts such as fire department,
police department and ambulance.
5. Plan Development. The operation and maintenance staff who actually run the facility should develop the wet
weather operating plan. If outside assistance is obtained for plan development, the plant staff should have a
significant role in providing input, guidance, and review of the operating plan. The key steps in plan
development are as follows:
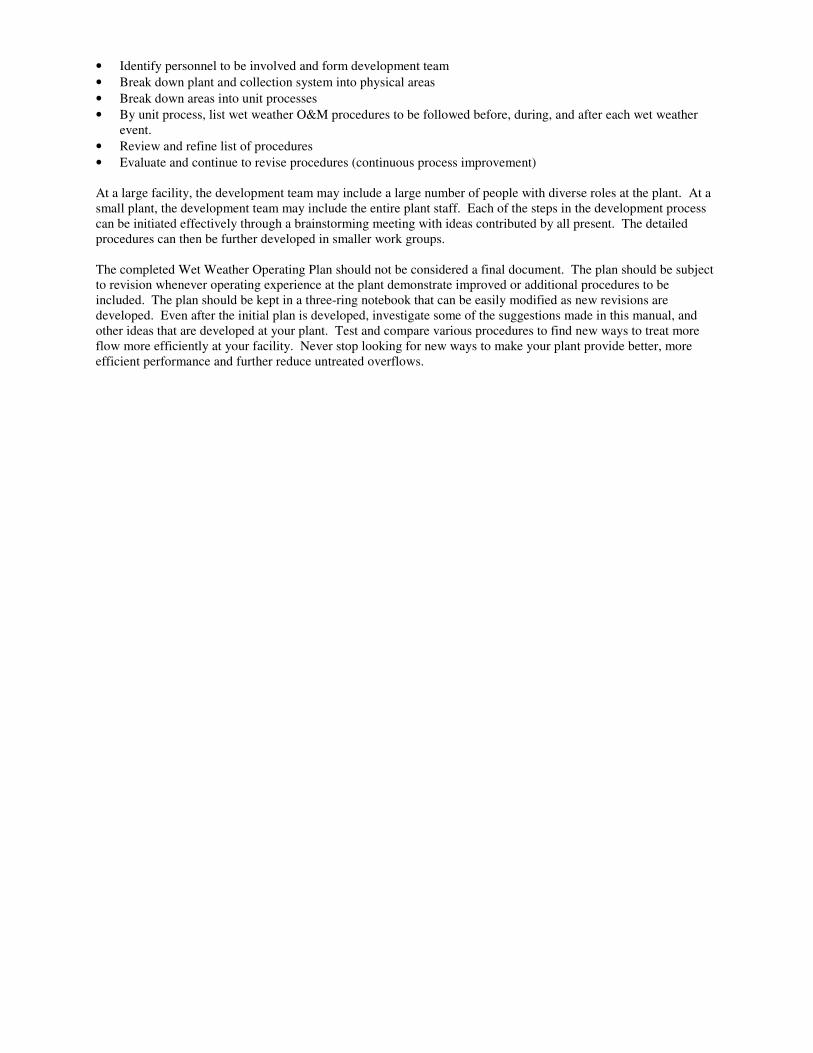
• Identify personnel to be involved and form development team
• Break down plant and collection system into physical areas
• Break down areas into unit processes
• By unit process, list wet weather O&M procedures to be followed before, during, and after each wet weather
event.
• Review and refine list of procedures
• Evaluate and continue to revise procedures (continuous process improvement)
At a large facility, the development team may include a large number of people with diverse roles at the plant. At a
small plant, the development team may include the entire plant staff. Each of the steps in the development process
can be initiated effectively through a brainstorming meeting with ideas contributed by all present. The detailed
procedures can then be further developed in smaller work groups.
The completed Wet Weather Operating Plan should not be considered a final document. The plan should be subject
to revision whenever operating experience at the plant demonstrate improved or additional procedures to be
included. The plan should be kept in a three-ring notebook that can be easily modified as new revisions are
developed. Even after the initial plan is developed, investigate some of the suggestions made in this manual, and
other ideas that are developed at your plant. Test and compare various procedures to find new ways to treat more
flow more efficiently at your facility. Never stop looking for new ways to make your plant provide better, more
efficient performance and further reduce untreated overflows.

APPENDIX T
Sample Manual of Operations

Albertville Municipal
Wastewater Treatment Plant
Manual of Operations
Albertville, Maine
prepared by the
Albertville Wastewater Treatment Plant
and
Maine DEP
September, 2010

____________________________________________________________________________________ Albertville Wastewater Treatment Plant Page 1 Manual Of Operations – September 2010
TABLE OF CONTENTS
Page
Introduction ........................................................................................... 1
Statistical Process Control ..................................................................... 2
Waste Activated Sludge Flow Rate ........................................................ 4
MLSS
MLVSS
F:M
SRT (Sludge Age)
Sludge Quality ........................................................................................ 7
Microscopic Examination
SVI
Oxygen Uptake Rates
Aeration Basin and Clarifier Observations
Recycle Sludge Flow Rates ................................................................... 10
Secondary Clarifier Sludge Blankets Depths
Recycle Secondary Solids
Aeration and Dissolved Oxygen ............................................................ 12
Recycle Solids Chlorination ................................................................... 13
____________________________________________________________________________________ Albertville Wastewater Treatment Plant Page 2 Manual Of Operations – September 2010
INTRODUCTION
Activated sludge is a biological wastewater treatment process that brings together wastewater and
a mixture of microorganisms under aerobic conditions.
The objective of activated sludge is to:
• Convert non-settleable, biodegradable materials to settleable solids and to produce a clarified
effluent low in total suspended solids (TSS) and biochemical oxygen demand (BOD).
This objective is fundamentally accomplished by:
• reducing the organic materials using a complex biological community in the presence of
oxygen and converting them to new cell mass, carbon dioxide and energy; and,
• producing solids that flocculate and are capable of settling in the clarifier.
It is the wastewater treatment plant operator’s responsibility to control the treatment process by
maintaining proper operating conditions so that the process meets effluent objectives in a
cost-effective manner.
In the activated sludge process, there are three basic controls:
- waste sludge mass;
- return sludge mass; and,
- dissolved oxygen.
There are many factors used as a basis for control of these variables. One of the first is knowing
how much sludge is in the system, where the sludge is, how long it has been there, and how fast
it is moving from one place to another.
1. pounds = concentration × volume × conversion factor, or
pounds = mg/L × million of gallons × 8.34 lb/gal
2. Total Sludge, lbs = Aerator Sludge, lbs + Clarifier Sludge, lbs
3. Mean Cell Residence Time = Total Sludge, lbs/Waste Sludge, lbs, where
Waste Sludge = Effluent TSS, lbs + Waste Sludge, lbs
4. Solids detention time in the clarifier = (clarifier sludge, lbs/return sludge, lbs/d) ×24 hrs/day
5. Solids detention time in the aerator = (Aerator Sludge, lbs/(Q + RSF) × MLSS) × 24 hrs/day
The purpose of this manual is to provide additional guidance to the wastewater treatment plant
staff in order for them to make proper adjustment of the operational controls. Proper adjustment
of operational controls leads to maintaining the proper "growth pressures" (or control variables).
These guidelines will need to be used with operator judgment and updated as the process changes
and new experience is gained over time.

____________________________________________________________________________________ Albertville Wastewater Treatment Plant Page 3 Manual Of Operations – September 2010
STATISTICAL PROCESS CONTROL
Statistical Process Control is the name given to a system of process control that uses statistical
analysis of operating data to set control limits for certain operating parameters such as MLSS or
MCRT. If the operator can maintain the parameters within the control limits, a good quality
effluent can be produced. The basic statistical process control techniques should always be
tempered and enhanced by good operator judgment. Statistical process control can be used to
analyze the process so that appropriate actions may be taken to achieve and maintain a state of
control and to improve the overall capability of the process. Control charts are the primary
statistical process control tool used by operators.
A control chart is a graph showing plotted values of some control parameter and one or two
control limits. It is used to determine if a process is in control, and to provide information to
adjust operational controls.
A control limit, for the purpose of this guidance manual, is a line on a control chart used to
establish the maximum or minimum range of a control variable.
Statistical control is the condition describing a process from which all special causes of variation
have been eliminated. Special causes result in points on a control chart outside of the control
limits.
The information illustrated by the control charts can be used by the staff to make operational
control adjustments. The staff may make control adjustments of the operational controls to meet
established control variable targets. The staff should consider trends and remember not to "over
adjust" operational controls. The staff should attempt to always stay within the established
control limits. There are four operational controls for this facility:
1. Wasting
2. Recycle Sludge Flow
3. Aeration Rate
4. Recycle Chlorination

____________________________________________________________________________________ Albertville Wastewater Treatment Plant Page 4 Manual Of Operations – September 2010
WASTE ACTIVATED SLUDGE FLOW RATE
Background:
Sludge wasting is one of the most important operational controls. Sludge wasting controls the
following:
1 Effluent quality
2. The F:M ratio, the Sludge Age (MCRT or SRT), and the mixed liquor concentration (MLSS).
3. The oxygen consumption
4. The nutrients required
5. Aeration basin foaming
6. Mixed liquor settleability
Objectives for waste activated sludge flow rate control:
•••• Adjust the waste activated sludge flow rate to maintain a balance between the aeration basin
solids and the incoming organic loading (BOD).
• Produce solids that flocculate and settle properly.
Monitoring:
MLSS: Mixed Liquor Suspended Solids (MLSS) is the concentration of solids in the aeration
basin as determined by standard total suspended solids laboratory analysis. The solids consist
mostly of microorganisms; inert suspended matter and non-biodegradable suspended matter.
The target for aeration basin MLSS concentration is:
Target: 2,800 mg/L (summer)
Target: 3,500 (winter)
Upper Control Limit: 3,800 mg/L
Lower Control Limit: 2,400 mg/L
MLVSS: Mixed Liquor Volatile Suspended Solids (MLVSS) is the volatile or organic portion of
the mixed liquor suspended solids, determined by the standard volatile suspended solids
laboratory analysis.
The target for aeration basin MLVSS concentration is:
Target: 2,300 mg/L (summer)
Target: 2,800 mg/L (winter)
Upper Control Limit: 3,200 mg/L
Lower Control Limit: 2,000 mg/L

____________________________________________________________________________________ Albertville Wastewater Treatment Plant Page 5 Manual Of Operations – September 2010
Solids Retention Time (SRT): A mathematical determination of the length of time activated
sludge microorganisms spend in the aeration basin, expressed in days and calculated as:
(0.37 MG)(MLSS, mg/L)(8.34 lb/gal)
SRT = ------------------------------------
WAS, lbs/day + EFF, lbs/day
where, WAS is the waste activated sludge in pounds per day (concentration, mg/L)(WAS flow
rate, mgd)(8.34) EFF is the effluent TSS in pounds per day (TSS, mg/L)(Effluent flow rate,
mgd)(8.34)
The target for the solids retention time is:
Target: 12 days (summer)
Target: 14 days (winter)
Upper Control Limit: 18 days
Lower Control Limit: 8 days
Food to Microorganism Ratio (F:M): A mathematical calculation of the mass of food, measured
as BOD, divided by the mass of biological solids under aeration or MLVSS.
(BOD, mg/L)(FLOW, mgd)(8.34)
F:M = ----------------------------------
(0.37 MG)(MLVSS, mg/L)(8.34)
where, BOD is the primary effluent BOD concentration and MLVSS is the aeration tank mixed
liquor volatile suspended solids concentration
The target for the F:M ratio is:
Target: 0.14 (winter)
Target: 0.12 (summer)
Upper Control Limit: 0.17
Lower Control Limit: 0.09
Operational Relationship
WAS Rate
Change
F:M Ratio MLSS SRT
Increase WAS Increases Decreases Decreases Decrease WAS Decreases Increases Increases
____________________________________________________________________________________ Albertville Wastewater Treatment Plant Page 6 Manual Of Operations – September 2010
The F:M Ratio compares the mass per day of food, measured as lbs. of BOD removed by
the process with the pounds of microorganisms (measured as MLVSS) available to
metabolize the food. The F:M Ratio increases as the SRT get shorter. The F:M Ratio
decreases as the SRT gets longer.
Control Procedure:
Using information from the MLSS, MLVSS, SRT and F:M control charts, in combination with
sludge quality information, the staff should adjust the wasting rate based on the targets and
overall process status. Trends should be noted and knowledge of upcoming events should be
used. The sludge wasting rate should not be changed more than ten to fifteen percent in one day.
Wait one week or until observations and tests reveal a trend before making another change in the
wasting rate.
1. Sample and analyze the mixed liquor to determine the MLSS concentration 3 times per week
and the MLVSS concentration 1 time per week.
2. Calculate the SRT and F:M ratio.
3. Calculate the waste sludge required based on the following equation:
Average pounds under aeration for the pervious week = Waste sludge, pounds
target SRT
4. Evaluate the process based on sludge quality (microscopic, SVI, observations).
5. Determine the process status.
6. Plot the results of the MLSS, SRT, and F:M on control charts.
7. Evaluate the need to increase or decrease the waste activated sludge rate.
a. Are the control variables (MLSS, SRT, and F:M) above or below targets?
b. What is the process status based on sludge quality?
c. Is there a trend upwards or downwards in the primary effluent BOD?
d. Is there an anticipated increase or decrease in the primary effluent BOD?
e. Are the control variables (MLSS, SRT, and F:M) within the range defined by the upper and
lower control limits?
8. Do not make extreme changes in the waste activated sludge rate.
Note: Changes in waste rates will take 10 to 20 days to stabilize.

____________________________________________________________________________________ Albertville Wastewater Treatment Plant Page 7 Manual Of Operations – September 2010
SLUDGE QUALITY
Background:
The overall behavior of the biological solids is referred to as "sludge quality". Using the sludge
quality method means that the operator studies the aeration basin, mixed liquor solids and
secondary clarifiers for informative physical characteristics that help identify sludge quality and
process status. The inferences of these physical findings are used to supplement the results of
other process control variables, i.e., MLSS and F:M ratio, to make control variable adjustments.
Objectives for sludge quality:
•••• Produce a mixed liquor that will form a strong floc and settles fairly rapidly as contrasted to a
mixed liquor that settles very fast or very slow.
•••• Normally has a light brown color mixed liquor with a tan foam.
•••• Produce a mixed liquor that is active throughout the basin and stable at the end of the process
as measured by the oxygen uptake rates.
Monitoring:
Microscopic Examination:
The operator should examine a wet mount slide to observe indicator organisms and determine the
abundance of filaments on a weekly basis.
Relative Number of Microorganisms vs. Sludge Quality
The target for filament observation is:
Target: b some
Upper Control Limit: c common
Lower Control Limit: a few
Reference: D. Jenkins, M. G. Richard, and G.T. Daigger, Manual on the Causes and Control of
Activated Sludge Bulking and Foaming, 1986 (see Figure 13, page 35).
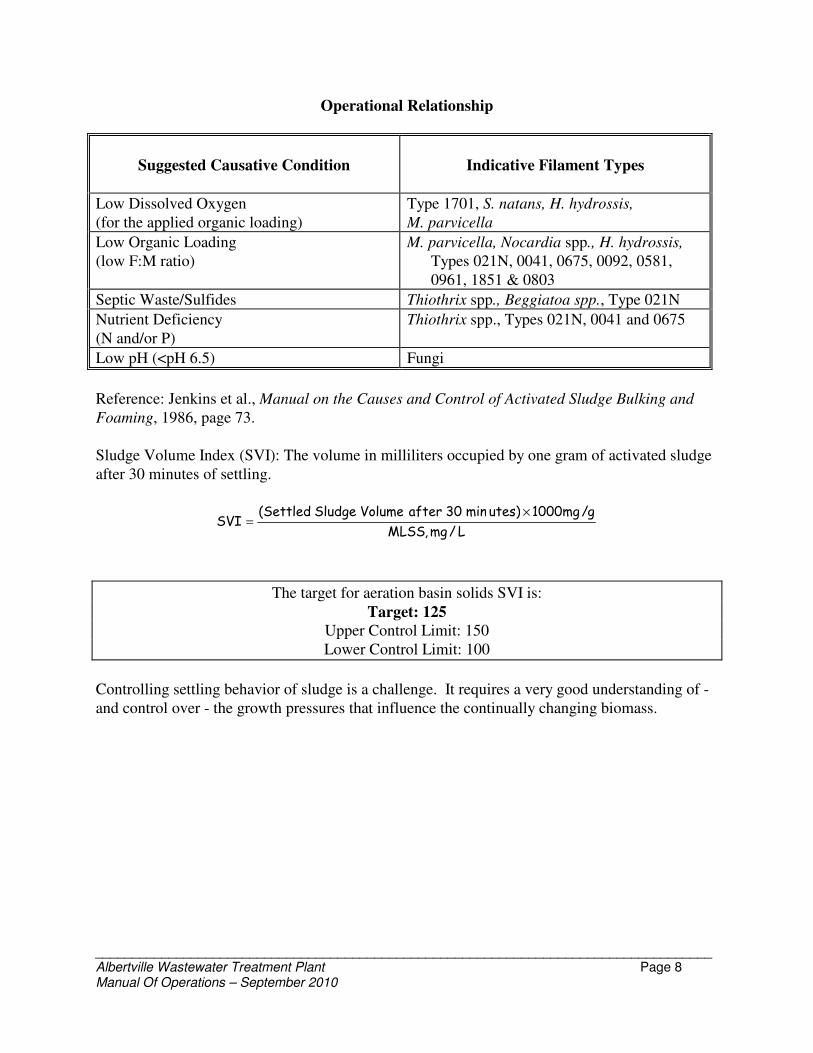
____________________________________________________________________________________ Albertville Wastewater Treatment Plant Page 8 Manual Of Operations – September 2010
Operational Relationship
Suggested Causative Condition
Indicative Filament Types
Low Dissolved Oxygen
(for the applied organic loading)
Type 1701, S. natans, H. hydrossis,
M. parvicella
Low Organic Loading
(low F:M ratio)
M. parvicella, Nocardia spp., H. hydrossis,
Types 021N, 0041, 0675, 0092, 0581,
0961, 1851 & 0803
Septic Waste/Sulfides Thiothrix spp., Beggiatoa spp., Type 021N
Nutrient Deficiency
(N and/or P)
Thiothrix spp., Types 021N, 0041 and 0675
Low pH (<pH 6.5) Fungi
Reference: Jenkins et al., Manual on the Causes and Control of Activated Sludge Bulking and
Foaming, 1986, page 73.
Sludge Volume Index (SVI): The volume in milliliters occupied by one gram of activated sludge
after 30 minutes of settling.
L/mg,MLSS
g/mg1000)utesmin30afterVolumeSludgeSettled(SVI
×
=
The target for aeration basin solids SVI is:
Target: 125
Upper Control Limit: 150
Lower Control Limit: 100
Controlling settling behavior of sludge is a challenge. It requires a very good understanding of -
and control over - the growth pressures that influence the continually changing biomass.

____________________________________________________________________________________ Albertville Wastewater Treatment Plant Page 9 Manual Of Operations – September 2010
Oxygen Uptake Rates:
The Oxygen Uptake Rate (OUR) test is a test procedure that determines the rate at which oxygen
is removed from the mixed liquor by the activated sludge biomass. It is expressed as mg/L/hr
oxygen uptake. The procedure is found in Standard Methods for the Examination of Water and
Wastewater. The Specific Oxygen Uptake Rate or Respiration Rate relates OUR to biomass
activity. This term gives the operator information related to the condition of the biomass. The
unit expression is mg O2/hr/gram of volatile suspended solids. It indicates an activity level
because the rate relates to oxygen removed by a given amount of microbial mass as measured by
VSS.
The target for aeration basin effluent end OUR is:
Target: 9 mg/L O2/hr/gram MLVSS
Upper Control Limit: 12 mg/L O2/hr/gram MLVSS
Lower Control Limit: 6 mg/L O2/hr/gram MLVSS
Activated sludge with an extremely high activity level (a young sludge) or extremely low activity
level (old sludge) usually does not exhibit good flocculating characteristics. It is the flocculation
that determines the way the sludge settles in the secondary clarifier.
Aeration Basin and Clarifier Observations:
The operator should note the following aeration basin observations:
•••• Spray patterns
•••• Turbulence
•••• Color
•••• Foam
The operator should make the following secondary clarifier observations:
•••• Clarity
• Bulking
• Washout
• Clumping/Ashing
• Straggler Floc
• Pin Floc
• Secondary Clarifier Effluent Turbidity:
____________________________________________________________________________________ Albertville Wastewater Treatment Plant Page 10 Manual Of Operations – September 2010
RECYCLE SLUDGE FLOW RATE:
Background:
Objectives for recycle sludge flow rate control:
• Adjust the recycle sludge flow rate to maintain a balance of solids between the secondary
clarifiers and the aeration basin.
• Adjust the recycle sludge flow rate to obtain the maximum recycle solids concentration while
preventing sludge septicity from developing.
Monitoring:
Mass balance flow rate:
where,
Q = Influent flow, mgd
Qr = Recycle flow, mgd
MLSS = Aeration basin mixed liquor suspended solids concentration, mg/L
Depth of Blanket (DOB): The distance from the clarifier water surface to the top of the sludge
blanket. When subtracted from the total clarifier depth, this is the equal to the blanket thickness
(BLT).
The target for the blanket thickness is:
Target: 1.5 feet
Upper Control Limit 2.5 feet
Lower Control Limit 0.5 feet
Recycle secondary solids concentration:
The target for the recycle secondary solids concentration is:
Target: 7,500 mg/L
Upper Control Limit 10,000 mg/L
Lower Control Limit 5,000 mg/L
L/mgL/mg
MGDL/mgr MLSSRASSS
)Q()MLSS(Q
−
×
=
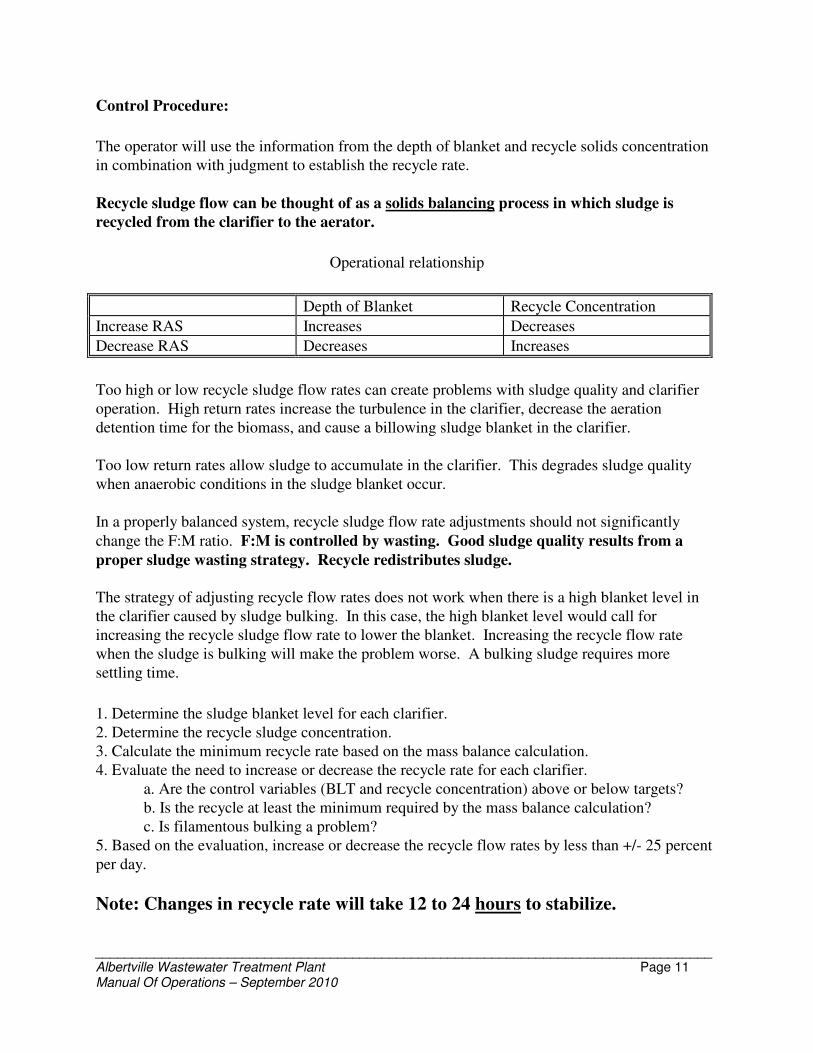
____________________________________________________________________________________ Albertville Wastewater Treatment Plant Page 11 Manual Of Operations – September 2010
Control Procedure:
The operator will use the information from the depth of blanket and recycle solids concentration
in combination with judgment to establish the recycle rate.
Recycle sludge flow can be thought of as a solids balancing process in which sludge is
recycled from the clarifier to the aerator.
Operational relationship
Depth of Blanket Recycle Concentration
Increase RAS Increases Decreases
Decrease RAS Decreases Increases
Too high or low recycle sludge flow rates can create problems with sludge quality and clarifier
operation. High return rates increase the turbulence in the clarifier, decrease the aeration
detention time for the biomass, and cause a billowing sludge blanket in the clarifier.
Too low return rates allow sludge to accumulate in the clarifier. This degrades sludge quality
when anaerobic conditions in the sludge blanket occur.
In a properly balanced system, recycle sludge flow rate adjustments should not significantly
change the F:M ratio. F:M is controlled by wasting. Good sludge quality results from a
proper sludge wasting strategy. Recycle redistributes sludge.
The strategy of adjusting recycle flow rates does not work when there is a high blanket level in
the clarifier caused by sludge bulking. In this case, the high blanket level would call for
increasing the recycle sludge flow rate to lower the blanket. Increasing the recycle flow rate
when the sludge is bulking will make the problem worse. A bulking sludge requires more
settling time.
1. Determine the sludge blanket level for each clarifier.
2. Determine the recycle sludge concentration.
3. Calculate the minimum recycle rate based on the mass balance calculation.
4. Evaluate the need to increase or decrease the recycle rate for each clarifier.
a. Are the control variables (BLT and recycle concentration) above or below targets?
b. Is the recycle at least the minimum required by the mass balance calculation?
c. Is filamentous bulking a problem?
5. Based on the evaluation, increase or decrease the recycle flow rates by less than +/- 25 percent
per day.
Note: Changes in recycle rate will take 12 to 24 hours to stabilize.

____________________________________________________________________________________ Albertville Wastewater Treatment Plant Page 12 Manual Of Operations – September 2010
AERATION AND DISSOLVED OXYGEN:
Background:
Oxygen is required by the microorganisms to satisfy the oxygen demand exerted by BOD
conversion and endogenous respiration. The contents of the aeration basin must also be
sufficiently mixed to keep the mixed liquor solids in suspension and to uniformly mix the solids
with the wastewater. In addition, oxygen must be dissolved in the liquid to maintain D.O. at the
center of the floc and result in a residual D.O. concentration that doesn't promote excessive
filamentous bacteria.
Objectives for oxygen addition are:
• Provide oxygen in proportion to the organic (BOD) loading for proper biological metabolism.
- If necessary, provide adequate oxygen for metabolism of nitrogen compounds
• Provide sufficient mixing.
• Optimize oxygen feed rates through D.O. aeration basin residual monitoring and
management.
Monitoring:
Dissolved oxygen: The amount of oxygen dissolved in the aeration basin liquid, expressed in
mg/L.
The target for aeration basin dissolved oxygen (D.O.) residual is:
Target: 1.0 mg/L
Upper Control Limit 2.0 mg/L
Lower Control Limit 0.5 mg/L
Dissolved oxygen is monitored at the effluent end of each basin before it discharges over the
weir.
Control Procedure:
1. When the D.O. exceeds 3.5 mg/L, shut the aerators at the effluent end off.
2. The weirs are adjustable (with some difficulty) to either increase or decrease the aerator
submergence.

____________________________________________________________________________________ Albertville Wastewater Treatment Plant Page 13 Manual Of Operations – September 2010
RECYCLE SOLIDS CHLORINATION
Background:
Recycle solids chlorination is a short-term measure in response to filamentous bulking. Other
short-term measures include:
•••• "sludge juggling"
• polymer addition to the secondary clarifiers
Long-term measures to correct chronic filamentous bulking include:
•••• aeration basin pH control
• control of influent waste septicity
• nutrient addition
• changes in aeration rate
• changes in biomass concentration
• changes in waste feeding patterns
Objectives for recycle sludge chlorination:
•••• Expose activated sludge to sufficient chlorine to damage filaments extending from the floc
surface while leaving organisms within the floc largely untouched.
The chlorine dosage is adjusted such that its concentration is lethal at the floc surface but is
sublethal within the floc.
Monitoring:
SVI:
The target SVI to begin recycle solids chlorination is:
SVI = 135 (5 day moving average)
The target SVI to end recycle solids chlorination is:
SVI = 135

____________________________________________________________________________________ Albertville Wastewater Treatment Plant Page 14 Manual Of Operations – September 2010
Microscopic examination:
The target for filament observation is:
Target: 2 some
Upper Control Limit: 3 common
Lower Control Limit: 1 few
Reference: D. Jenkins, M. G. Richard, and G.T. Daigger, Manual on the Causes and Control of
Activated Sludge Bulking and Foaming.
Chlorine effects on filaments include, in order:
•••• a loss of intracellular sulfur granules
• cell deformity and cytoplasm shrinkage
• finally filament breakup and lysis
Control Procedure:
Chlorine dosage should be started low and increased until effective. Sludge settleability usually
improves within 1-3 days if an adequate chlorine dosage is applied.
1. SVI: _________
2. Filamentous Bacteria Amount: ___________
(Enter: Few, Some, Common, Very Common, Abundant, or Excessive)
3. Enter chlorine dosage: ____________ lbs Cl2/1,000 lbs MLVSS in aeration
(Enter: Few or Some = 0, Common = 4; Very Common = 6; Abundant = 8; Excessive = 10)
4. Enter MLSS concentration: __________ mg/L
5. Enter the most recent MLVSS analysis: __________ % MLVSS
6. Calculate the pounds of MLVSS:
0.37 MG × 8.34 × _____________ (MLSS, mg/L) × _____ % MLVSS = __________
7. Calculate chorination rate:
____________ lbs MLVSS X 1/1000 × ______ Cl2 Dosage = ____ lb Cl2/ 1000 lb MLVSS/day
8. Round off result of #7 to nearest lb: ______ lb Cl2/day

____________________________________________________________________________________ Albertville Wastewater Treatment Plant Page 15 Manual Of Operations – September 2010
9. Determine gallons of Sodium Hypocholrite required to deliver dosage calculated in #8.
where: Z = 0.44 for 5.25% NaOCl (common Chlorox bleach)
Z = 0.83 for 10.0% NaOCl
Z = 1.0 for 12.5% NaOCl
Z = 1.25 for 15.0% NaOCl
10. Set chlorination and record time of adjustment
11. Observe filaments and note SVI
12. Dosage should not exceed 10 lb Cl2/day per 1000 lb MLVSS.
day/gal________gal/CLavailablepoundsZ
day/Cl poundsNaOCl gallons
2
2==
APPENDIX U
Microbiology for Wastewater Treatment Plant Operators
Excerpted from a series of articles by Donald Albert, P.E.
in the Maine DEP O&M News

MICROBIOLOGY FOR WASTEWATER TREATMENT PLANT OPERATORS
Microorganisms including bacteria, protozoa and some multi-celled organisms do most of the work in a
conventional secondary wastewater treatment plant. We commonly lump all the types of microbes
together and call them "bugs". This series of articles will look at how the bugs grow and reproduce and at
the factors which affect their growth and reproduction. Understanding how bugs work and what affects
their growth and reproduction can help operators make their treatment plants run more efficiently and
solve problems which may happen in the future.
All aerobic organisms (including humans) need three things for life: water, air, and food. To obtain
energy for life, aerobic organotrophs (including human cells) require organic food and oxygen for
controlled combustion of that food. These organisms (including human cells) must be bathed in water to
function. Slightly more than 70 percent of the human body is water and approximately 80·percent of a
microorganism is water.
Some organisms can live either with or without free oxygen. Facultative bacteria can, when free oxygen
is not available, use oxygen from nitrate (N03). Conditions where free oxygen is not available, but where
oxygen is available from chemical compounds are called anoxic conditions. When free oxygen and
combined oxygen in the form of nitrate is gone, anaerobic conditions exist. Sulfate compounds are used
in anaerobic conditions. Some bacteria can live only in anaerobic conditions. Anaerobic sludge digesters
use anaerobic bacteria to convert organic matter to methane gas. Most treatment plants use a combination
of aerobic and mostly· facultative bacteria in the treatment process.
Protozoa are also commonly found in wastewater treatment systems. Protozoa are microscopic animals
that are strictly aerobic. Protozoa commonly eat bacteria and smaller protozoa. Different protozoa will
thrive under different conditions. Some are more efficient at gathering food and will out-compete less
efficient species. The relative proportions of protozoa types are highly dependent on the sludge age.
Human activities generate wastewater from households, business buildings and industrial facilities. As
clean water is used by these activities, it accumulates various organic and inorganic chemicals and carries
it away from the human populations. Aerobic decay of the organic matter in the water can result in
localized oxygen depletion. Secondary biological wastewater treatment plants duplicate the natural use of
organic matter by providing a good environment for the bugs to grow and reproduce under controlled
conditions. The bugs remove the organic matter and thereby control the depletion of oxygen in the
receiving waters. Biological wastewater treatment plants are artificial systems that are inserted into the
natural cycles that sustain the food and air in our el1vironment.
There are two characteristics of organic matter that are important to wastewater treatment plant operators.
First, organic matter contains the element carbon which is an important part of the living cell. Second,
organic matter burns (combustible) and releases energy during combustion. For example, if you place a
piece of wood (organic matter) in a wood stove (reactor), open the damper (oxygen) and light the stove, it
will bum and release energy as heat. More heat is released as you add more wood or open the damper.
Heat is released as the chemical bonds that hold the various elements together are broken. These chemical
bonds involve the sharing of electrons by the various elements (i.e., carbon, hydrogen, oxygen) in the
compound
.
When we speak of biological “burning” (or oxidation), it is not the change in heat energy, but the use of
available energy stored in chemical compounds for growth and reproduction by the organisms that is
important. Burning is a chemical oxidation and reduction reaction. Oxidation is defined as the addition of
oxygen to a compound, the removal of hydrogen from a compound and the loss of an electron; reduction
is the converse of oxidation. Oxidation and reduction must occur at the same time. The electron donor-
acceptor relationship characterizes the oxidation-reduction reaction.
For example, as wood bums, the chemical reaction looks like this:
Organic matter + 02 ---------------------> C02 + H20 + ash + heat
(wood) (oxygen) (carbon dioxide) (water)
As the chemical bonds that hold wood together are broken, oxygen accepts electrons from the· hydrogen
in the wood and forms water. Carbon dioxide, ash or inert materials are left and heat is released. Without
oxygen there is no electron acceptor and the reaction does not occur.
Aerobic organisms have four basic nutritional requirements: a carbon source, an energy source, and an
electron donor and electron acceptor. Carbon is used to build new cells, energy is used for growth and
reproduction, the electron donor and elector acceptor allows for the release of energy.
During biological oxidation of organic compounds by aerobic heterotrophic bacteria, organic matter is the
source of energy and carbon, the electron acceptor is oxygen, the electron donor is hydrogen in the
organic matter, and the by-pre ducts are water and carbon dioxide. As shown below, if oxygen is not
available, the reaction does not occur.
enzyme
COHNS + 02 ----------------> C02 + H20 + energy
organic bacteria
matter
Just as in the example of buming wood, as organic matter increases, more energy is released and more
oxygen is required. In addition, a spark is needed to start the reaction. Bringing organic matter together
with oxygen does not cause combustion. In the case of biological combustion, the "spark" comes from
enzymes. Without them, the reaction cannot take place. Enzymes are specific water soluble proteins that
are active within a small temperature range. This is why wastewater treatment bacteria must become
acclimated to specific types of waste before they are able to break it down. Environmental conditions
greatly influence the function of enzymes.
Now that we have discussed oxidation of organic matter as the way that bacteria obtain and store energy
for growth and reproduction. Synthesis is the term used to describe the process in which new bacteria
cells are generated. New bacteria cells are made up of carbon, hydrogen, nitrogen, oxygen, phosphorus,
and other trace elements. As individual· microorganisms grow and reach maximum cell size, the cell
divides into two new cells. These two new cells grow and in turn divide. This type of reproduction is
called binary fission. Under optimum conditions, bacterial cells may divide every 20 to 30 minutes. This
rapid rate of reproduction is called logarithmic growth. When microorganisms find themselves in an
abundance of food, reproduction occurs at logarithmic rate. The log growth phase continues until food is
depleted. As more food is used up, the reproduction rate slows down. This period of decreasing rate of
growth is called declining growth phase. The synthesis reaction is shown below:
COHNS + 02 + N + P ---------> CSH7N02P + C02 + H20 + non-degradable
new cells
As bacteria cells grow, they store energy and materials necessary to generate new cells. During synthesis
organic matter (carbon), hydrogen, oxygen, nitrogen (ammonia), and phosphorus (ortho-phosphate) are
needed to build new cells. In addition, sulfur, sodium, potassium, calcium, magnesium, iron,
molybdenum, cobalt, manganese, zinc and copper are required in lesser amounts. Without these nutrients

new cells can not develop. The nutrient availability and balance also establish a competitive advantage for
some microbial communities, particularly when nutrients are limited. Experience at wastewater treatment
plants shows that nitrogen and phosphorus must be available at the same time and in proportion to the
BODS loading. As a general rule, for each 100 mg/L of BOD, the microorganisms need 5 mg/L nitrogen
and 1 mg/L phosphorus,
As long as adequate organic matter, air, and nutrients are available, bacteria will continue to grow and
reproduce. Once the organic matter is depleted, endogenous respiration begins. During endogenous
respiration, cells begin to use their own internal cell matter as the source of energy to sustain life.
CSH7NO2P + O2 --------> CO2 + H2O + non-degradable cell residue
We noted that when the source of food is depleted, the microorganisms stop growing at a logarithmic rate.
Ideally, this is the growth where the bugs in a wastewater treatment plant should be. All the organic
matter has been taken up by the bugs but they have not yet begun to die-off. The food (F) to
microorganism (M) ratio (F:M) relates the amount of food available relative to the mass of
microorganisms. The operator can use the F:M ratio to control the growth rate of the bugs in the system. >
Thus, F:M is an important factor which operators can use to control the biological treatment system.
In addition to organic matter, wastewater contains inorganic compounds such as ammonia-No Certain
bacteria are capable of burning ammonia to release energy for growth and reproduction. These bacteria,
called nitrifying bacteria, use ammonia-N as its source of energy and carbonate alkalinity as the carbon
source. During nitrification the electron acceptor is oxygen, the electron donor is hydrogen in ammonia-N
and the by-products are nitrite, nitrate, water and hydrogen Ions.
Nitrification is a two-step aerobic process. In the first step, ammonia is oxidized to nitrite by
Nitrosomonas.
NH4+ + 3/2 O2 -----> 2H+ + H2O + NO2-
During the second step, nitrite is oxidized in nitrate by Nitrobacter. N02- + 1/202 ----> N03-
The overall energy reaction is:
NH4+ + 2O2 -----> NO2- + 2H
+ + H2O
During the synthesis reactions,
13NH4+ + 15CO2 10NO2- + 3C5H7NO2 + 23H
+ + 4H2O
Nitrosomonas
10NO2- + 5CO2 + NH4
+ +2H2O 10NO3
- + C5H7NO2 + H+
Nitrobacter
When the energy and synthesis reactions are combined,
1.0 NH4+ + 1.89O2 + 0.085CO2 0.00161C5H7NO2 + 0.952 H2O + 0.984NO3- + 1.98H
+
The total oxygen required is 4.57 pounds oxygen per pound of ammonia-N. By comparison, each pound
of BOD removed requires about 1.3 pounds of oxygen. The total alkalinity required is 7.14 pounds
alkalinity as CaC03 per pound of ammonia-N. Thus, full nitrification requires both oxygen and alkalinity
to be readily available.
As discussed above, synthesis and nitrification. Biological denitrification involves the microbial reduction

of nitrate to nitrite, and ultimately nitrite to nitrogen gas. Unlike nitrification, a relatively broad group of
bacteria can accomplish denitrification. Denitrifiers are found in most natural environments, including
municipal wastewaters and sludges. Denitrifiers are facultative organisms: they can use either oxygen or
nitrate as their terminal electron acceptor. In the process of denitrification, nitrate and nitrite act as
electron acceptors in the respiratory electron transport chain in the same manner as oxygen. This
transport chain is the fundamental mechanism by which cells generate energy. By using nitrate in place of
oxygen the bacteria generate less energy. Similarly, more energy is generated using nitrate than sulfate.
Control systems exist within bacteria that ensure the most efficient form of energy generation is utilized.
Thus if oxygen is present, it will be used before nitrate, and if oxygen is not present, nitrate will be used
before sulfate. Denitrifiers are able to switch from oxygen to nitrate. They do this by generating the
enzymes required for denitrification. Between 2 and 3 hours is typically required for the bacteria to switch
from an aerobic to an anoxic environment.
Control of denitrification occurs at the level of enzyme activity. Oxygen will inhibit the activity of the
denitrifying enzymes. The oxygen concentration at which denitrification stops has been reported to be 0.2
mg/L in pure cultures. In activated sludge the reported values are 0.3 to 1.5 mg/L.
Organic compounds serve as organic substrate (i.e., as carbon and electron donor) for denitrification.
Bicarbonate alkalinity is produced during denitrification. The theoretical production is 3.57 mg alkalinity
as CaC03 produced per mg of nitrate reduced to nitrogen gas.
Thus far, we have been discussing the basic metabolic needs of the individual organisms. The term
metabolic needs is used to define all the diverse reactions by which a cell processes food material to
obtain energy and the compounds from which new cell components are made. We must now look at the
diverse microbial population of the wastewater treatment system as a whole. Such systems rely on a
population of many types of bugs to remove the organic and inorganic pollutants from the wastewater. As
the nutritional and physical characteristics of the system change, conditions will favor certain types of
bugs over others. These physical and nutritional conditions select the organisms best adapted to the
environment. Further knowledge of the nutritional and physical factors affecting microbial growth is
necessary to know what types of organisms may be expected to predominate in various environments.
Kinetics is a term use to define the rate and amount of microbial growth. The kinetics of a system are
related to the amount of food, oxygen and nutrients available to the system. Kinetics also depends on
temperature, pH, mixing, MCRT, and hydraulic detention time in the aerator and clarifier. We have
already discussed food, oxygen, and nutrients. Now we will talk about the physical parameters.
Temperature is one of the most important physical factors in the selection of species. Most organisms
grow within a range of 30°- 40°C. The optimum is generally closer to the maximum than to the
minimum. Growth at the minimum temperature is very slow and increases rapidly with increasing
temperature, reaching a maximum at the optimum temperature and falling abruptly. For most
microorganisms the growth rate increases two-fold for each IO°C rise in temperature. On the basis of
their optimal growth temperatures, microorganisms are classified as psychrophile, mesophiles or
thermophiles. Most microbial species are mesophilic, growing best between 20° and 45°C. Psychrophiles
have optimum temperatures below 20° C, whereas thermophiles grow best above 45° C.
Another physical factor that, like temperature, influences the growth rate and limits growth is pH. In
general, most bacteria have pH optima near neutral and minimum and maximum near 5 and 9. Most fungi
prefer an acid environment and have minimum pH between 1 and 3 with an optimum pH near 5. Most
protozoa are able to grow in the range 5 to 8, with an optimum pH near 7.

The degree and vigor of mixing can exert profound effects on the selection of species and the behavior of
the species. Mixing tends to prevent localized differences in temperature, nutrients, dissolved oxygen, and
pH. Mixing also impacts the solids separation process.
In an activated sludge plant, new biomass is produced as BOD is removed. This is called sludge yield. For
every pound of BOD removed about 0.5- 1.0 pound of biomass is produced. Mixed liquor suspended
solids (MLSS) results from the development of accumulation of biomass. "Building up" suggest that
biomass can accumulate as it is produced. Biomass increases when the wasting rate is less than the growth
rate. A drop in biomass occurs when sludge wasting exceeds the rate of new sludge growth .. As the
number of microorganisms increases, the amount of food available to each organism decreases, and
consequently, the rate of microbial reproduction decreases. Microbial reproduction varies with the
availability, type and concentration of BOD.
Now that we have discussed biological denitrification and physical and nutritional conditions that
encourage the growth of certain organisms. Sludge age significantly affects the "community composition"
within the mixed liquor. For any species to survive, its growth rate must be greater than its washout rate.
“Washout rate" implies that cells are lost from the inventory, and this occurs in at least three ways: 1)
sludge wasting, 2) effluent TSS, and 3) death.
Many terms are used to describe the concept of sludge age. Mean Cell Residence Time (MCRT) is among
the most popular. MCRT refers to how long the average cell remains in a secondary system before being
removed. Secondary clarifier inventory is included, along with effluent suspended solids, in the MCRT
calculation.
The hydraulic detention time is the amount of time the wastewater is retained in each individual unit
reactors. Hydraulic detention times vary depending on the type of system. Suspended growth systems are
normally categorized into three types: conventional activated sludge, with a detention time of 4-6 hours;
extended aeration, with a detention time of about 24hours; and, contact stabilization, with an initial
contact time of less about 30 minutes and a stabilization time of about 8 hours. Systems operating with
detention times outside these detention times typically do not operate efficiently.
There are several different types of environmental shocks that will disrupt the operation of a wastewater
treatment plant. A qualitative shock is a change in the nature of the energy (food) and carbon source in the
influent. A quantitative shock also relates to the carbon and energy source, but involves a change in the
concentration rather than the type of compounds. A hydraulic shock involves a change in the inflow rate
to the treatment plant. A pH shock may have considerable effect on metabolism and on selection of
species. A toxic shock is the introduction of toxic materials, organic or inorganic, into the influent.
Whether an organism will grow and the extent to which it will thrive is determined by the law of the
minimum. According to this law the growth of an organism is limited by the amount of that one of its
requirements which is present in minimum quantity relative to the overall requirements of the organism.
The factor that controls growth in one situation may be food, or it may be phosphorus or nitrogen.
Natural selection of certain organisms and the establishment of competitive advantages are related to
metabolic or kinetic factors. The type of food (organic or inorganic) will determine what types of
microorganisms will thrive. The level of oxygen will determine whether aerobes or anaerobes will
survive. The lack of a nutrient may allow certain filamentous bacteria to out complete other organisms for
essential cell macro nutrients. The presence of sulfur may promote the growth of thiothrix, beggiatoa, and
type 021 N. Fungus requires lower pH in order to function. The ratio of food to microorganism
determines whether floc formers are generated or low F:M filaments such as M parvicella, H. hydrosis,
Nocardia, types 021N, 0041,0675,0092,0581, 0961, and 0803 will dominate.
It is very important for wastewater treatment plant operators understand "growth pressures" so that
metabolic and kinetic factors can be controlled to promote proper treatment. The most common variables
that operators should understand and control include:
• BOD5 and Nitrogen (type and amount of food)
• D.O. (dissolved oxygen)
• Mean Cell Residence Time (MCRT)
• F/M ratio (food to microorganism ratio) .
• Temperature
• pH
• Nutrients (N & P)
• Toxins
• Hydraulics (detention time)
• Return Sludge Flow Rate
Many problems at waste treatment plants are related to a kinetic or metabolic factor(s). Grayish slimy
foam is usually caused by nutrient deficiencies. Nocardia or Microthrix parvicella, grow at high MCRT.
Most filamentous bulking problems are caused by a nutrient or DO deficiency, low pH, sulfide, or high
MCRT. Pin floc is normally caused by high MCRT. Straggler floc is usually caused by low MCRT. A
toxic load can cause dispersed growth.
One way to control unwanted bugs is to change the operation of the plant to bring about a "selector
effect”. A selector effect results from differences between floc forming and filamentous organisms. Floc-
formers have a higher growth rate which provides a kinetic advantage at high substrate concentrations.
Floc-formers have the ability to quickly take up and store substrate which can starve the filaments.
Selectors can also make use of metabolic differences. Anoxic selectors make use of floc-formers ability to
respire under anoxic conditions when dissolved oxygen is lacking but nitrate is present. Anaerobic
selectors make use of floc-formers ability to attain energy through anaerobic fermentation or cleavage of
high phosphate bonds.
Selector effects can be created by adding tanks to the process, by baffling or otherwise isolating a portion
of one tank to achieve anoxic or anaerobic conditions or by operating in an on-off aeration, mode which
promotes anoxic conditions during part of the treatment cycle. If you are considering the use of a selector
to improve the treatment efficiency or to solve a filamentous bulking or other problem at your plant, you
should first try to identify the root cause of the problem. Then you can decide if a selector will solve that
problem or if another treatment pressure may give you better results.
I hope these articles encourage you to learn more about the microbiology of wastewater treatment.

APPENDIX V
Alkalinity as a Process Control Indicator

ALKALINITY AS A PROCESS CONTROL INDICATOR
Alkalinity can be used to indicate the rate of biological activity in wastewater treatment plants.
Aerobic reactions correspond to an alkalinity decrease, while anoxic and anaerobic reactions
correspond to an alkalinity increase. Measuring and controlling alkalinity at certain points within
the treatment plant can provide biological control.
Alkalinity Defined
The alkalinity of water is a measure of its capacity to neutralize acids. It also refers to the
buffering capacity, or capacity to resist a change in pH. Bicarbonates represent the major form of
alkalinity in wastewater. Alkalinity is measured by titration and is reported in terms of equivalent
calcium carbonate (CaCO3). It is common practice to express alkalinity measured to a certain pH.
Phenolphthalein alkalinity is measured by titration to a pH of 8.3. Total alkalinity is measured by
titration to a pH of 4.5.
Biological Processes Reviewed
In wastewater treatment, the three forms of oxygen available to bacteria are dissolved oxygen
(02), nitrate ions (N03-), and sulfate ions (SO2
-). Aerobic metabolism uses dissolved oxygen,
bacteria1s most preferred oxygen source, to convert food to energy. A class of aerobic bacteria,
nitrifiers, uses ammonia (NH3) for food instead of carbon-based organic compounds. This type of
aerobic metabolism that uses dissolved oxygen to convert ammonia to nitrate is referred to as
nitrification. Nitrifiers are the dominant bacteria after most of the organic food supply has been
consumed. When dissolved oxygen is depleted, the next most efficient source of oxygen is
nitrate. Denitrification, or anoxic metabolism, occurs when bacteria use nitrate as the oxygen
source. Under anoxic conditions, the nitrate ion is converted to nitrogen gas while the bacteria
convert food to energy. Anaerobic metabolism occurs when dissolved oxygen arid nitrate are no
longer present and bacteria must obtain oxygen from sulfate. In this process the sulfate is
converted to hydrogen sulfide and other sulfur compounds.
Alkalinity in Biological Reactions
Alkalinity can be used as an indicator of biological activity. Depending on conditions, each of the
biological reactions will occur and change alkalinity at a certain and predictable rate. Measuring
this rate of change will indicate the rate of biological reactions and allow for their control.
Each type of metabolism - aerobic, anoxic and anaerobic -has a direct relationship to the
bicarbonate concentration. Thus, when bacteria consume or produce compounds such as nitrate or
ammonia there is a corresponding change in bicarbonate concentration.
Aerobic metabolism, in general, and nitrification, in particular, will decrease alkalinity by the
following reaction:
Nitrification (Aerobic)
NH4+ + 2O2 + 2HCO3 - ---> NO3 - + 2CO2 + 3H2O
Note that two bicarbonates are consumed for every ammonia that is converted to nitrate. For
every part per million (ppm) of converted ammonia, alkalinity decreases by 7.14 ppm.
Anoxic metabolism, where nitrate is converted to nitrogen-gas, increases alkalinity by the
following reaction:
Denitrification (Anoxic)
5/23 C5H7O2N + NO3- ---> HCO3- + 14/23 N2 + 2/23 CO2 + 6/23 H2O
Here, one bicarbonate is produced for every nitrate converted to nitrogen-gas. Alkalinity
increases by 3.57 ppm for every ppm of nitrate converted.
Anaerobic metabolism also increases alkalinity as shown by the following reaction:
Sulfate Reduction (Anaerobic)
C5H7O2N + 5/2 SO42- + 3 H2O ---> 5 HCO3
- + NH3 + 5/2 H2S
Alkalinity increases 17.86 ppm for every ppm of ammonia-N produced. Because this rate of
change is so much greater for anaerobic conditions than for anoxic conditions alkalinity can be
used to distinguish between the two. Thus, "septic" conditions can be avoided.
Alkalinity as a Process Control Indicator
Monitoring alkalinity within the treatment process can provide for the control of biological
activity through adjustments to blower output, waste activated sludge rates and recycle rates.
The number and placement of sampling points are determined by the plant's size and processes
design. A typical sampling layout might include the following sites:
Primary Clarifier Influent
Primary Clarifier Effluent
Aeration Basin Influent
Aeration Basin Effluent
Secondary Clarifier Effluent
Digester(s)
In primary clarifiers, solids are physically separated, thus biological activity and, by extension,
alkalinity change is not expected. Increase in alkalinity indicates anoxic or anaerobic conditions
in the sludge blanket. This could result in decreased removal efficiencies and increased organic
and ammonia loading to the rest of the system. The remedy to this problem is to increase sludge
removal- rates to decrease solids detention time in the sludge blanket.
The same principle applies to secondary clarifiers as with primary clarifiers. Significant
alkalinity increase indicates the onset of anoxic denitrification. The remedy to this problem is to
increase recycle sludge rates to decrease the solids detention time in the sludge blanket.
Comparing alkalinity in the aeration basin influent and effluent allows for optimized organic and
allll1lonia removal (via nitrification). Insufficient alkalinity loss indicates poor ammonia removal
and possibly turbid effluent. Increasing the air supply incrementally will help increase the
nitrification rate. Significant nitrification may result in excessive alkalinity loss. This could result
in lowered buffering capacity for the system and final effluent pH violations. Nitrification may
also result in rising or denitrifying sludge in the secondary clarifier. Decreasing the air supply
and/or increasing the waste activated sludge rate (to decrease the solid retention time) will help
remedy this problem.
Alkalinity decreases as bacteria aerobically metabolize organics. In an aerobic digester, sustained
aeration may decrease alkalinity below the system1s buffering capacity and cause the pH to drop
low enough to limit biological activity. Consequently, poor settling and decreased volatile solids
reduction may occur. The operator should establish high and low alkalinity “set-points” to
maintain optimum digester efficiency. The aerobic digester should be aerated until alkalinity
decreases to the low set-point. The operator should turn the air off to establish an anoxic cycle
and avoid low pH levels. The dissolved oxygen will be depleted and nitrate will be used as the
oxygen source during which alkalinity will correspondingly increase. The aeration is resumed
when alkalinity reaches the high set-point to avoid septicity.
(Adapted from the February 1994 Operations Forum by Fred Dillon - Falmouth WPCF and Don
Albert- MeDEP)

APPENDIX W
Seeded Biochemical Oxygen Demand
Using Seeded Dilution Water
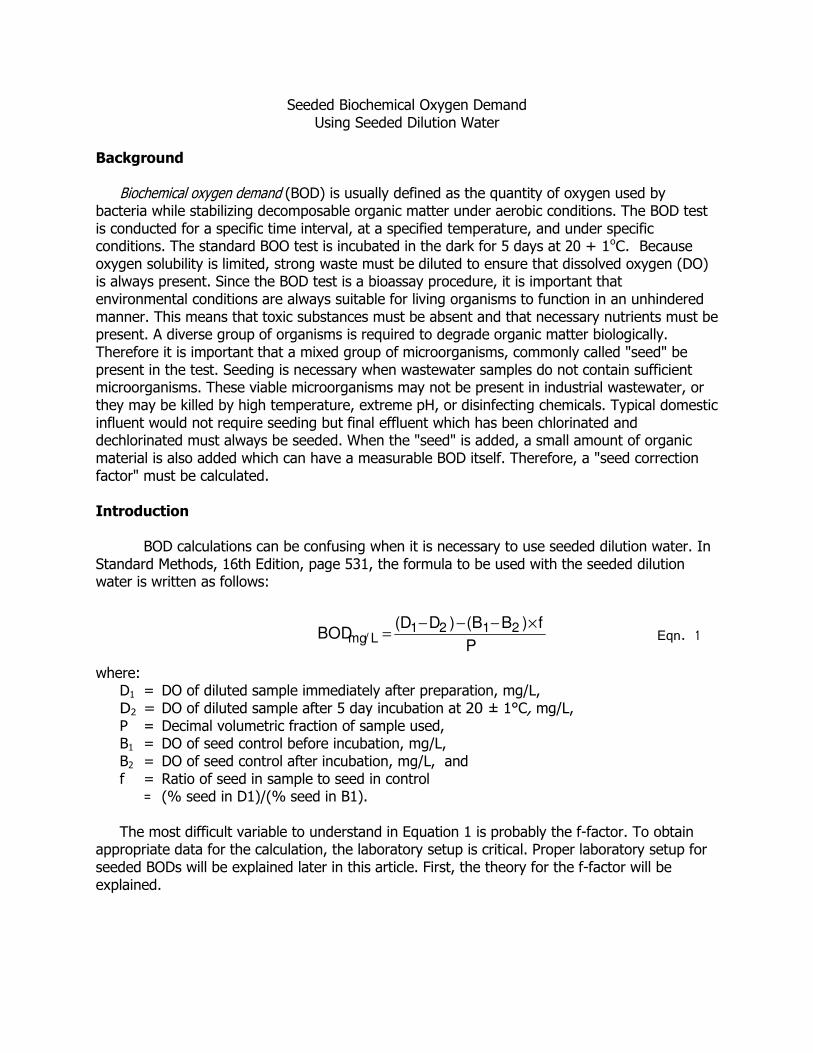
Seeded Biochemical Oxygen Demand Using Seeded Dilution Water
Background
Biochemical oxygen demand (BOD) is usually defined as the quantity of oxygen used by bacteria while stabilizing decomposable organic matter under aerobic conditions. The BOD test is conducted for a specific time interval, at a specified temperature, and under specific conditions. The standard BOO test is incubated in the dark for 5 days at 20 + 1oC. Because oxygen solubility is limited, strong waste must be diluted to ensure that dissolved oxygen (DO) is always present. Since the BOD test is a bioassay procedure, it is important that environmental conditions are always suitable for living organisms to function in an unhindered manner. This means that toxic substances must be absent and that necessary nutrients must be present. A diverse group of organisms is required to degrade organic matter biologically. Therefore it is important that a mixed group of microorganisms, commonly called "seed" be present in the test. Seeding is necessary when wastewater samples do not contain sufficient microorganisms. These viable microorganisms may not be present in industrial wastewater, or they may be killed by high temperature, extreme pH, or disinfecting chemicals. Typical domestic influent would not require seeding but final effluent which has been chlorinated and dechlorinated must always be seeded. When the "seed" is added, a small amount of organic material is also added which can have a measurable BOD itself. Therefore, a "seed correction factor" must be calculated. Introduction
BOD calculations can be confusing when it is necessary to use seeded dilution water. In
Standard Methods, 16th Edition, page 531, the formula to be used with the seeded dilution water is written as follows:
Eqn. 1
where:
D1 = DO of diluted sample immediately after preparation, mg/L, D2 = DO of diluted sample after 5 day incubation at 20 ± 1°C, mg/L, P = Decimal volumetric fraction of sample used, B1 = DO of seed control before incubation, mg/L, B2 = DO of seed control after incubation, mg/L, and f = Ratio of seed in sample to seed in control = (% seed in D1)/(% seed in B1).
The most difficult variable to understand in Equation 1 is probably the f-factor. To obtain
appropriate data for the calculation, the laboratory setup is critical. Proper laboratory setup for seeded BODs will be explained later in this article. First, the theory for the f-factor will be explained.
P
f)BB()DD(BOD 2121
L/mg×−−−
=
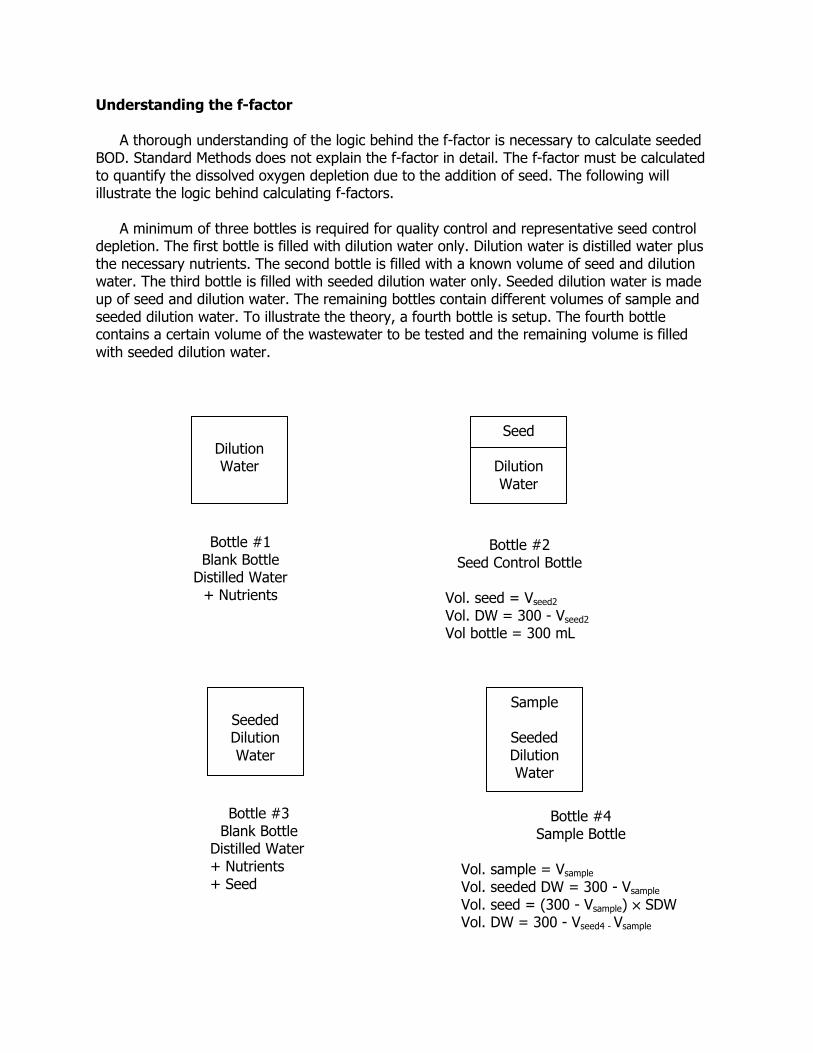
Understanding the f-factor A thorough understanding of the logic behind the f-factor is necessary to calculate seeded
BOD. Standard Methods does not explain the f-factor in detail. The f-factor must be calculated to quantify the dissolved oxygen depletion due to the addition of seed. The following will illustrate the logic behind calculating f-factors.
A minimum of three bottles is required for quality control and representative seed control
depletion. The first bottle is filled with dilution water only. Dilution water is distilled water plus the necessary nutrients. The second bottle is filled with a known volume of seed and dilution water. The third bottle is filled with seeded dilution water only. Seeded dilution water is made up of seed and dilution water. The remaining bottles contain different volumes of sample and seeded dilution water. To illustrate the theory, a fourth bottle is setup. The fourth bottle contains a certain volume of the wastewater to be tested and the remaining volume is filled with seeded dilution water.
Dilution Water
Seed
Dilution
Water
Bottle #1 Blank Bottle
Distilled Water + Nutrients
Bottle #2 Seed Control Bottle
Vol. seed = Vseed2
Vol. DW = 300 - Vseed2
Vol bottle = 300 mL
Seeded Dilution
Water
Sample
Seeded Dilution Water
Bottle #3 Blank Bottle
Distilled Water + Nutrients + Seed
Bottle #4 Sample Bottle
Vol. sample = Vsample Vol. seeded DW = 300 - Vsample
Vol. seed = (300 - Vsample) × SDW Vol. DW = 300 - Vseed4 - Vsample

For the f-factor calculation, only bottle #2 and bottle #4 are needed. The other two bottles are quality control checks and they will be explained later. Standard Methods defines the f-factor as shown in the equation below.
Eqn. 2
Using the variables in this example, the expression becomes:
Eqn. 3
If the total volume of Bottle #4 (300 mls) equals the total volume of Bottle #2 (300 mls), then
Eqn. 4
Eqn. 5
The seed concentration in dilution water is the volume of seed per unit volume of dilution water. Vseed2 is the volume of seed pipetted into the seed control bottle. The seed should be added to the dilution water rather than pipetting directly into the BOD bottles. Seed distribution is better and pipetting errors are reduced when seed is added to the dilution water. This is the proper technique.
By using Equation 5, the f-factor can calculated. After substituting the calculated f-factor
into Equation 1, the BOD of a particular sample can be calculated from the lab data.
Laboratory procedure Proper laboratory setup is critical in order to obtain valid data. The proper procedure for
seeded BOD analysis is explained in detail in this section. It is ideal to bring the sample temperature to 20oC. By placing the water tight sampling
containers into a water bath, the sample can be warmed or cooled quickly. Dilution water is prepared in the same manner as for unseeded BOD analysis. Sufficient
distilled water must be at 20 ±loC and aerated. Sometimes the distilled water is stored in the BOD incubator for 24 hours to standardize the
temperature. Do not add the nutrients before storing the distilled water. Add the nutrients prior to setting up BOD samples. Be sure to allow sufficient time for the nutrients to dissolve. Swirl the container for mixing. The mixture is now called standard dilution water. Fill Bottle #1 with this dilution water completely. This is called the blank and is used to provide quality assurance for this analysis.
#2 bottlre of volume totalV
#4 bottlre of volume totalV
fseed2
seed4
=
bottle control seed the in seed of ratio
bottle sample the in seed of ratio f =
seed2
seed4
V
V f =
seed2
sample
V
)waterdilutioninionconcentratseed()V - (300 f
×
=
The second bottle is prepared by filling the BOD bottle with standard dilution water to approximately halfway first. Pipette a known volume of seed into the BOD bottle and then fill the bottle with dilution water. In this example, five milliliters of seed are pipetted into the bottle. This is called the seed control bottle.
After the first two bottles are set up, seed is added to the dilution water. Three milliliters of
seed per liter of dilution water is the ratio used for this example. Swirl the mixture gently making sure not to over agitate the mixture. Swirling will prevent further aeration and avoid over-saturating the seeded dilution water with dissolved oxygen. Bottle #3 is completely filled with this seeded dilution water.
Seed can be obtained from several locations within the wastewater treatment facility.
Settled domestic influent and secondary clarifier effluent are two of the most popular sources of seed. Also artificial seed can be purchased from some laboratory supply houses. The preferred seed is effluent from a biological treatment plant treating the waste. If the choice of seed is the influent domestic wastewater, allow the seed to settle for at least 1 hour but no more than 36 hours at 20°C. Consistent settling time is ideal in this case.
Dechlorinate the samples to neutralize the chlorine residual, if necessary,. at this point.
Dechlorination can be accomplished by adding sodium sulfite (Na2S03), or a dechlorinating tablet purchased from supply houses can be utilized. The volume of sodium sulfite required must be determined by titrating with 0.025N Na2S03 to the starch-iodine end point. The temperature of the samples should now be about 20oC. Samples which are alkaline or acidic must be neutralized to a pH of 6.5 to 7.5 with a solution of sulfuric acid or sodium hydroxide.
The next step in the BOD setup process is to estimate the BOD of the sample. As a guide,
typical domestic influent wastewater has a BOD of about 200 to 300 mg/L. Secondary wastewater treatment effluent has a BOD of about 5 to 50 mglL. For most wastewater analysis, three sample dilutions are setup for each sample to be tested. For the influent sample, typically 3, 6, and 9 milliliters of sample into a 300 milliliter BOD bottle should provide sufficient range. Referring to the Table 1 on the next page, this influent setup covers a BOD range from 70 to 560 mg/L. As for the effluent sample, 24, 50, and 100 milliliter sample are chosen. This volume selection covers a BOD range from 6 to 70 mg/L.
After you have chosen the dilutions to setup, fill the remaining BOD bottles allocated for receiving samples to about a quarter of the total volume with seeded dilution water. These BOD bottles are ready to receive wastewater samples. Before the samples are transferred to their respective BOD bottles, each sample must be thoroughly mixed. It is important to mix the sample bottle by shaking vigorously (not only stirred) before pipetting any sample from the sample bottle to the BOD bottle to ensure homogeneous transfer of sample. The BOD bottles are then filled up with the seeded dilution water. After measuring initial DO, the BOD bottles are then sealed with glass stoppers, water sealed, and capped with plastic covers before incubation. Make sure that there are no air bubbles trapped in the BOD bottles. Top off with dilution water, if necessary, to eliminate air bubbles.

Table 1
Expected BOD Range
Sample added to 300-ml bottle
Min. (mgjL) Max. (mgjL)
3 210 560
6 105 280
9 70 187
12 53 140
15 42 112
18 35 94
21 30 80
24 26 70
27 24 62
30 21 56
50 12 42
75 8 22
100 6 21
150 4 12
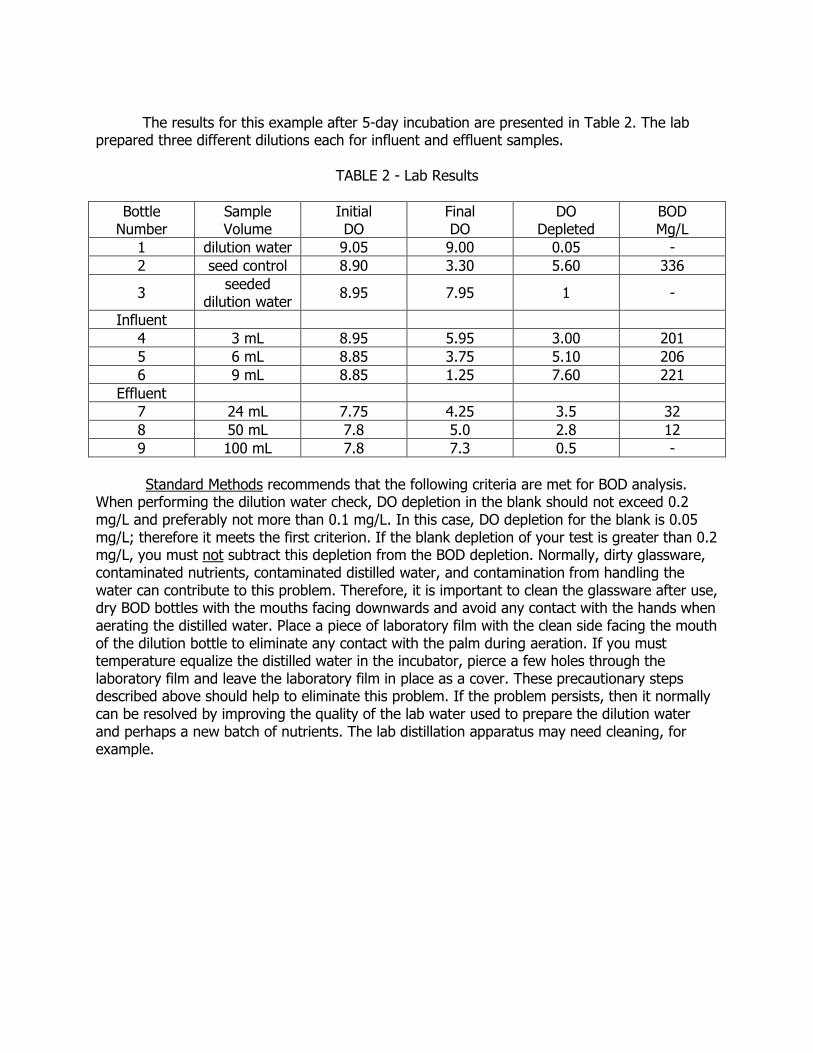
The results for this example after 5-day incubation are presented in Table 2. The lab
prepared three different dilutions each for influent and effluent samples.
TABLE 2 - Lab Results
Bottle Number
Sample Volume
Initial DO
Final DO
DO Depleted
BOD Mg/L
1 dilution water 9.05 9.00 0.05 -
2 seed control 8.90 3.30 5.60 336
3 seeded
dilution water 8.95 7.95 1 -
Influent
4 3 mL 8.95 5.95 3.00 201
5 6 mL 8.85 3.75 5.10 206
6 9 mL 8.85 1.25 7.60 221
Effluent
7 24 mL 7.75 4.25 3.5 32
8 50 mL 7.8 5.0 2.8 12
9 100 mL 7.8 7.3 0.5 -
Standard Methods recommends that the following criteria are met for BOD analysis.
When performing the dilution water check, DO depletion in the blank should not exceed 0.2 mg/L and preferably not more than 0.1 mg/L. In this case, DO depletion for the blank is 0.05 mg/L; therefore it meets the first criterion. If the blank depletion of your test is greater than 0.2 mg/L, you must not subtract this depletion from the BOD depletion. Normally, dirty glassware, contaminated nutrients, contaminated distilled water, and contamination from handling the water can contribute to this problem. Therefore, it is important to clean the glassware after use, dry BOD bottles with the mouths facing downwards and avoid any contact with the hands when aerating the distilled water. Place a piece of laboratory film with the clean side facing the mouth of the dilution bottle to eliminate any contact with the palm during aeration. If you must temperature equalize the distilled water in the incubator, pierce a few holes through the laboratory film and leave the laboratory film in place as a cover. These precautionary steps described above should help to eliminate this problem. If the problem persists, then it normally can be resolved by improving the quality of the lab water used to prepare the dilution water and perhaps a new batch of nutrients. The lab distillation apparatus may need cleaning, for example.

The seeded dilution water has depleted 1 mg/L of oxygen. This indicates good seed source.
This depletion needs to be accounted for in the BOD calculations. Standard Methods recommends that the seeded dilution water depletion should be between 0.6 mg/L and 1.0 mg/L. If there is no depletion after S-day incubation, then the seed could be bad or the seed volume must be increased until the criterion is met.
The DO depletion in the seed control should be at least 2 mg/L and must have 1 mg/L
residual after the 5-day incubation. If the seed control depletes all of the DO, then the seed is excellent but the volume of seed pipetted into the BOD bottle has to be reduced. In this example, Bottle #2 depleted 5.6 mg/L of dissolved oxygen and had 3.3 mg/L of DO residual after 5 days of incubation. Therefore, it satisfies this criterion.
Moving along in the table, you will notice that the initial DO concentrations for the influent
dilutions are approximately the same. Another observation is that the water is not super-saturated with oxygen. At 20°C, the solubility of oxygen in water at atmospheric pressure is about 9.1 mg/L. Therefore, you can use this as a guide for initial DO concentration and take care not to exceed this concentration.
The next consideration is checking for at least 2 mg/L of DO depletion and a DO residual of
at least 1 mg/L after 5-day incubation. Bottle #9 did not meet both requirements as it has only 0.5 mg/L of DO residual. The remaining bottles did meet these two criteria. Any bottles that do not have 2 mg/l depletion and 1 mg/L residual after 5-day incubation should be deleted from BOD calculations.
Now we can calculate the BOD for each sample dilution. First we have to determine the f-
factor for each valid test using Equation 5. The bottle volume and seed concentration in the seed control are shown for purposes of clarity only.
f4 = (300-3) (3/1000) / (300) (5/300) = 0.1782 f5 = (300-6) (3/1000) / (300) (5/300) = 0.1764 f6 = (300-9) (3/1000) / (300) (5/300) = 0.1746 f7 = (300-24) (3/1000) / (300) (5/300) = 0.1656 f8 = (300-50) (3/1000) / (300) (5/300) = 0.15 The BOD for each valid dilution can now be determined using Equation 1. BOD4 = (8.95-S.95) - (8.90-3.30) (0.1782) / (3/300) = 200 mg/L BOD5 = (8.85-3.75) - (8.90-3.30) (0.1764) / (6/300) = 206 mg/L BOD6 = (8.85-1.25) - (8.90-3.30) (0.1746) / (9/300) = 221 mg/L BOD7 = (7.75-4.25) - (8.90-3.30) (0.1656) / (24/300) = 32 mg/L BOD8 = (7.80-5.00) - (8.90-3.30) (0.1500) / (5O/300) = 12 mg/L
Effluent BOD shows a decreasing trend as the sample volume increases. This indicates
toxicity in the sample. If this type of decreasing trend occurs consistently in your BOD testing, then the source of possible toxicity must be identified. In this example, the toxic substance could be from an in-plant source because influent BOD testing does not show a decreasing trend as sample volumes increase.
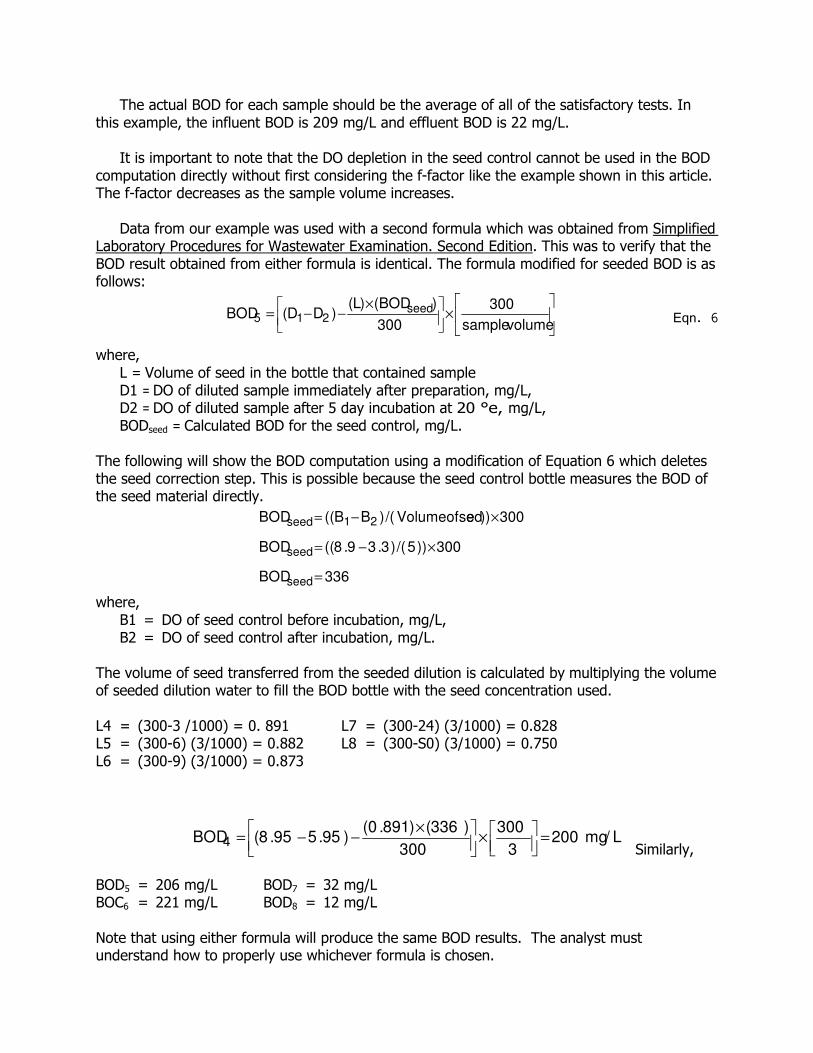
The actual BOD for each sample should be the average of all of the satisfactory tests. In this example, the influent BOD is 209 mg/L and effluent BOD is 22 mg/L.
It is important to note that the DO depletion in the seed control cannot be used in the BOD
computation directly without first considering the f-factor like the example shown in this article. The f-factor decreases as the sample volume increases.
Data from our example was used with a second formula which was obtained from Simplified
Laboratory Procedures for Wastewater Examination. Second Edition. This was to verify that the BOD result obtained from either formula is identical. The formula modified for seeded BOD is as follows:
Eqn. 6
where,
L = Volume of seed in the bottle that contained sample D1 = DO of diluted sample immediately after preparation, mg/L, D2 = DO of diluted sample after 5 day incubation at 20 °e, mg/L, BODseed = Calculated BOD for the seed control, mg/L.
The following will show the BOD computation using a modification of Equation 6 which deletes the seed correction step. This is possible because the seed control bottle measures the BOD of the seed material directly.
where, B1 = DO of seed control before incubation, mg/L, B2 = DO of seed control after incubation, mg/L.
The volume of seed transferred from the seeded dilution is calculated by multiplying the volume of seeded dilution water to fill the BOD bottle with the seed concentration used. L4 = (300-3 /1000) = 0. 891 L5 = (300-6) (3/1000) = 0.882 L6 = (300-9) (3/1000) = 0.873
L7 = (300-24) (3/1000) = 0.828 L8 = (300-S0) (3/1000) = 0.750
Similarly,
BOD5 = 206 mg/L BOC6 = 221 mg/L
BOD7 = 32 mg/L BOD8 = 12 mg/L
Note that using either formula will produce the same BOD results. The analyst must understand how to properly use whichever formula is chosen.
×
×
−−=
volumesample
300
300
)BOD()L()DD(BOD seed
215
336BOD
300))5/()3.39.8((BOD
300))edVolumeofse/()BB((BOD
seed
seed
21seed
=
×−=
×−=
L/mg2003
300
300
)336()891.0()95.595.8(BOD4 =
×
×−−=

Glucose-Glutamic Acid BOD quality check
This is a check on possible toxicants and seed source reliability. For example, distilled water could be contaminated by copper and the seed could be relatively inactive. These factors can often yield lower BOD results. Therefore, by measuring BOD on pure organic compounds, dilution water quality, seed reliability and analytical technique can be checked.
This test is done using standard BOD equipment. The only additional items are the
chemicals. For each test, dissolve 150 milligrams of glucose and 150 milligrams of glutamic acid into 500 milliliters of distilled water in a one liter volumetric flask. Add sufficient distilled water to make exactly one liter of solution. Seal the flask with laboratory film and mix the solution by tipping a few times. Make sure all of the chemicals are dissolved.
Partially fill a BOD bottle with seeded dilution water. Add 6 milliliters of the glucose-glutamic
acid solution from the one liter flask to the BOD bottle. Then complete filling the BOD bottle with seeded dilution water. Take an initial DO reading of this bottle and incubate for 5 days at 20 ±1°C. Take another DO reading after 5 days. The BOD for the glucose-glutamic acid standard can then be determined.
This 2 percent glucose-glutamic acid solution should yield a BOD of 200 ± 37 mg/L. If the
BOD does not fall within this range, find the possible source of errors, correct the problems, and try the test again. It should deplete at least 2 mg/L of dissolved oxygen and leave at least 1 mg/L dissolved oxygen residual after 5-day incubation. Remember to take the seed depletion into account when calculating the glucose-glutamic acid BOO. This means that the factor must be determined first and then the BOD.
Never attempt to store the glucose-glutamic acid solution for the next test. Always a make
up new batch of solution for every test. The glucose-glutamic acid check should be done according to a schedule adopted as part of the facility’s laboratory QA/QC plan.