achieving maximum productivity with db2 sql performance ... · achieving maximum productivity with...
TRANSCRIPT
1
Achieving Maximum Productivity
With DB2 SQL Performance Analyzer
A White Paper on
SQL PA Version 3.1
*
Frank J. Ingrassia
March, 2006
2
Topical Index Introduction
- What’s new in SQL PA Version 3 Release 1 5 Section 1. Using the SQL PA Facilities
Batch Operations - Bulk processing 6 - DBRM scans 7 - QLIMIT file 7 - Finding hidden production problems 8
TSO/ISPF - “What If?” analysis 10 - Fine tuning SQL 12 - Predicate Analysis 15 - Application and SQL development 17 - Capacity Planning 19 TSO or Batch? 19 QMF - Governor Intercept before execution 19 - Catch Heavy Hitters and rewrite 20 Stored Procedures - DB2 or WLM-controlled? 20 - COBOL example reads parms from file 20 - PL/I example passes parms in list 22 - Source code and JCL to create your own 22 - Use for Governing, policing and screening queries 23 Interfacing with other IBM Data Management Tools - Path Checker 23 - Admin Tool 23 - Query Monitor 23 - Web Query 24 - ISPF Edit or Browse 24 - Other SQL PA copies via DRDA 24
Section 2. Setting the SQL PA Parameters Batch
- ANLCNTL and ANLPARM files 24 TSO - Target Host library and Change Parameters panel 25 QMF - built into ANLGOV1 25 Stored Procedures
3
- pass list to ANLPROCC & ANLPROCR in a host variable 25
ANLCNTL Describe the Hardware/Software environment with configuration parameters - MIPRATE, ENGINES, SRMCONS, LPARENG 26 - SUBSYST, ESASORT, ESACOMP, DYNAMIC, SETPLAN, ANLKEYS 27 - BUFFERS, BUFF08K, BUFF16K, BUFF32K, SORTBUF 27 - DATASHR, DSGROUP 28 Setting the typical cost limits for SQL statements - CPUTIME, ELAPSED, IOCALLS, COSTING, COSTQUN 28 Computing the monetary cost for charge back - CPUCOST, IOSCOST, TIMCOST, MONEYIS, CURRSYM 28 ANLPARM Setting the user parameters for a run time environment - VERSION, CONNECT, DEGREES, REFRESH 28 - STORAGE, BUFFHIT, HPOOLRD 29 - NEWSTOR, NEWSEEK, NEWROTA, NEWXFER 29 Setting the operational aspects - VIADRDA, DBRMKEY, USEPLAN, RETCODE, QUALIFY, DELIMIT 29 Setting the reporting preferences - REPORTS, SHOWALT, PRECISE, ADVISOR 30 - PROCESS, NLSCODE, COMMENT 31
Section 3. SQL PA Concepts Modeling an SQL Statement
- Path Lengths 32 - Components of cost 32 - Access Path selection 32 - Catalog’s view of reality 33 - Mapping access paths into the real world 33 Filter Factors - Default values for predicates 33 - Non-uniform distributions 34 - ANDing and ORing predicates 34 - Composite (final) filter factor 35 Translating relative cost into real world cost 35 - PRECISE NO (full costing of SQL) 35 - PRECISE YES (Optimizer CPU only) 35 - PRECISE ALL (Optimizer and SQL PA) 35
4
Section 4. Validation Comparing estimates to actuals
- CPU Time 35 - ANLKEYS – what does it do? 36 - Overall Elapsed Time 36 - I/O Estimates 36 Summarizing Validation 37 Why the differences? 37 Impact of parameters on the cost model 37 Influencing the SQL PA cost algorithm 39 - Optimize for n Rows 39 - Fetch First n Rows 39
Section 5. Hints and Tips for Maximum Productivity Use realistic catalog statistics 39 - Using ANLSTAT to migrate PROD to TEST 40 - Setting the key stats used by Optimizer & SQL PA 40 Use realistic configuration parameters 41 Using the SQL PA reports 41 Summary 42
Section 6. Quick Install Notes
Installation reminders 42 Groups that might be involved 43
References
Trademarks 43
Bibliography 43
5
Introduction This paper has been provided to help users become immediately productive when deploying the DB2 SQL Performance Analyzer for z/OS. The product features and methodology described herein are for current SQL PA Version 3 Release 1, which supports DB2 Versions 7 and 8. It is assumed that the reader is already familiar with the basic concepts and facilities of SQL PA, which can be obtained by reading the DB2 SQL Performance Analyzer for z/OS User’s Guide, publication number SC18-9824, which is available for downloading from the IBM web page via the url link: http://www.ibm.com/software/data/db2imstools/db2tools/db2sqlpa.html
What’s New in Version 3, Release1? There are a number of enhancements built on top of the code that comprised the Version 2 Release 2 edition. That release provided a set of completely redesigned and rewritten programs to accommodate the new dimensions of DB2 Version 8 (longer names, larger statements, etc.) while still retaining the flexibility to operate in several DB2 environments. The following is a summary of the technical changes to DB2 SQL Performance Analyzer for z/OS, Version 3, Release 1 (product ID 5697-I04):
• The integration of the Easy Explain function (EEE) is extended to include fully interactive TSO ISPF support, providing seamless movement between SQL Performance Analyzer and EEE under TSO. SQL Performance Analyzer V3 adds EEE's programming language source files and other input sources to SQL Performance Analyzer's input capabilities by the automatic creation and transfer of selected SQL statements (TOPA=ALL) from any input source, including "SQL= statement". Easy Explain can now store SQL in the user's EEEPATH table, along with source SQL statements in the accompanying ANLEEE.SQL file, for later comparison with the new plans, using SQL Performance Analyzer's Compare Old and New Plans function. All of these facilities are now available under TSO, as well as batch.
• New user-modifiable thresholds for the Advisor are now available, to allow the user to set high
water marks, triggers, and other controls for Advisor warning messages. Users can now set access path warning flags for any tablespace scan, any nonmatching index scan, or any partitioned scans that read all the partitions. In addition, users can set the number of data pages to be read for tablespace scans, and index leaf pages to be read for both matching and nonmatching index scans, before triggering a warning message. The thresholds for the number of tables in a join, the number of elements in an IN (list), and the number of updated indexes are among the other user-specified thresholds available. Users may selectively turn off certain SQL Advisor messages or choose to have only the message IDs and not the text displayed.
• Improvements to the TSO ISPF interface now allows the use of partitioned data set (PDS)
members as both input and output report targets, including definition of new members and ISPF member list processing. The consistency guidelines for ISPF have been fully implemented with Version 3, adding such features as field-level help, dynamic trace enabling for diagnostics, and many other usability enhancements. The panels have been redesigned for better use and flow, and new options on the main panel now include Retro Explain, Compare Old and New Plans, and jumps to Easy Explain and the Help Tutorial. Users can also display all of the parameter sets: User, System, and Threshold, modify any set, and define output reports from the main panel, as well as defining and editing input data sets.
6
• Statistics migration improvements include the ability to expand the collection of objects under a wide-ranging filter of database, tablespace, and table names, all with wildcarding capabilities, defined by the new FINDALL parameters. Now users may specify partial names at the database, tablespace, and/or table levels in a single run, and search broadly for catalog statistics collection. The limit on the number of objects to be collected has been raised substantially and commit points are now inserted between each table's catalog updates in the output to facilitate restart. The "From" DB2 subsystem may be defined via parameters that allow the statistics migration program to choose the access SQL that will perform best (use indexes) against the catalog for that release.
• Internal program changes include additional enhancements and improvements to many cost
algorithms and path lengths, designed to keep the estimates for overall costs within reasonable accuracy. By employing more lower case and including some reformatting of the input SQL, this version also provides better readability in the output reports.
• Many marketing requirements have been implemented in this release. Marketing requirements
addressed here include several ISPF enhancements, enabling statistics collection at multiple levels, user-modifiable thresholds, message controls, exception reporting, Easy Explain integration under TSO, and others.
• Program naming conventions continue to reflect the release level, so that multiple versions of
SQL PA can operate on the same system, as necessary. For Version 3, the naming conventions are: - ANLPGM31 - TSO and batch processing for V6, V7 and V8 compatible - ANLPGM3N - TSO and batch processing for V8 NFM only - ANLQMF31 - QMF Interface processing - ANLCAT31 - Catalog Statistics collection - ANLPRC3C - Stored Procedure for CAF (DB2 address space) - ANLPRC3R - Stored Procedure for RRSAF (WLM address space) - ANLSTP3C - PLI sample program using CAF method - ANLSTP3R - PLI sample program using RRSAF method - ANLSTC3C - COBOL sample program using CAF method - ANLSTC3R - COBOL sample program using RRSAF method
PTF3101 enhancements The first PTF for V3R1 will be loaded with enhancements that will bring additional features into the product, such as “What IF?” capabilities under TSO, where the user will be able to temporarily (or permanently) modify the key optimizer catalog statistics while evaluating a set of SQL. A facility to create new indexes will also be available. In addition, wholesale migration of the key catalog statistics extracted and applied by the ANLCAT31 program will be manageable under TSO, so that the user may create any environment for the evaluation of their SQL, and then restore the Test catalog back to its original state when the analysis is complete. The stored procedures can optionally return Explain plan records and catalog data, and the sample programs will show you how to do it. These are a few of the highlights for PTF3101.
7
Section 1. Using the SQL PA Facilities
Batch Operations - Bulk processing When programs are created to run under DB2, they are submitted to the Bind process, which creates a set of control blocks called Data Base Request Modules, or DBRMs. These modules are stored in a library and can be the subject of a rebind, if the module moves to another subsystem, or if the program is changed. The contents of the DBRMs include the SQL statements to be processed, and SQL PA can read through these DBRM modules, finding and evaluating all the executable SQL statements that it encounters. The resulting reports, particularly the QLIMIT report, are useful in immediately locating the heavy hitter SQL statements, that is, the SQL that is likely to consume the most resources per execution. SQL PA can process a single DBRM, or an entire library of DBRM members and extract, evaluate and estimate a cost for each executable SQL statement (Select, Insert, Update and Delete). By processing a large number of DBRM members and/or SQL statements in bulk, the user can quickly whittle things down to the few SQL statements that are likely to consume the most resources, and therefore find the most likely candidates for query tuning. This is an excellent first step in scanning production DBRMs while looking for potential problem SQL statements, before they become acute.
Batch Operations - DBRM scans The DBRMKEY parameter can be used to select a group of member names from a single Partitioned Data Set (PDS) containing multiple DBRMs, as they are commonly stored. The key recognizes the asterisk (*) as representative of all characters, while the percent sign (%) holds the place of a single character position, and it also makes the key sensitive to exact length dimensions. For example: DBRMKEY ANL* selects all members of a DBRM library which start with the characters
“ANL” DBRMKEY A%%BC selects only members which have names 5 characters long, where the
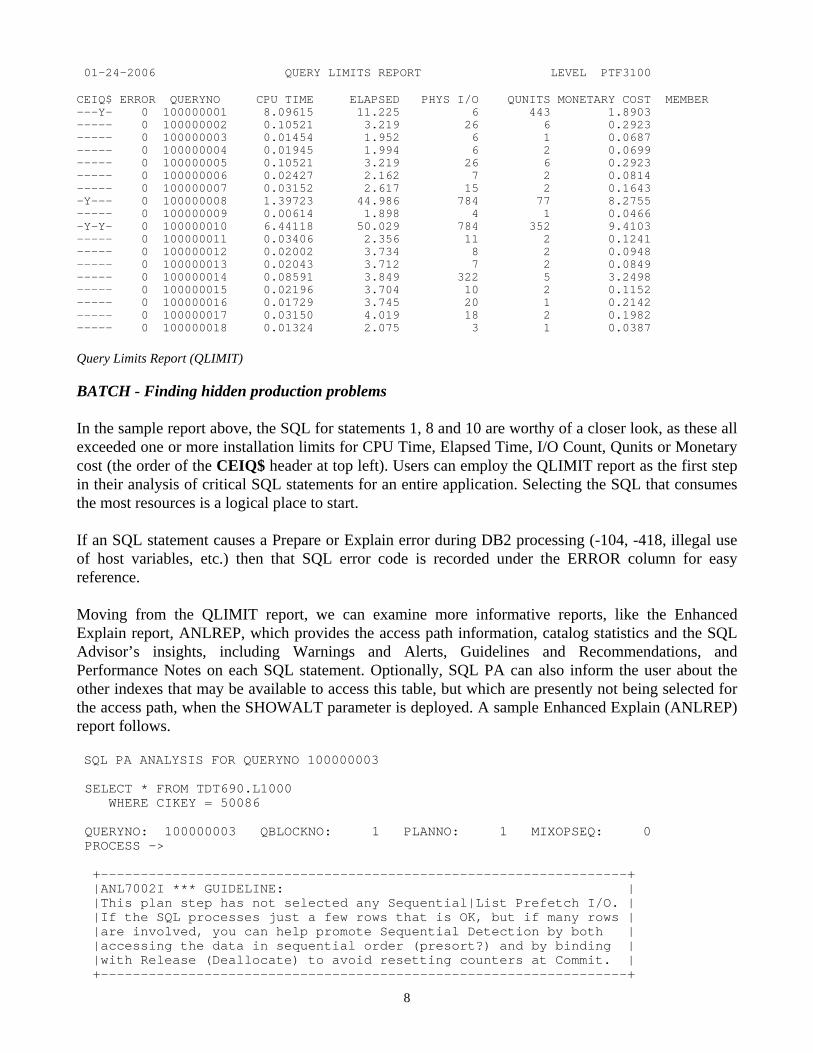
first character is “A”, and the fourth and fifth characters are “BC”. In the second example, member names such as AFXBC and ARRBC would be selected, but AXXBCD would not, because the filter does not specify a sixth character position. To collect member AXXBCD, the DBRMKEY should be specified as A%%BC*, that is, allow anything to follow the “C” in the fifth position. The filter can also be blank or *, in which case the entire library is processed. A significantly increased maximum of 2,730 member names can now be processed by SQL PA in a single run. BATCH - QLIMIT file The Query Limits (QLIMIT) file is an excellent place to start looking for those long running queries. The report is presented as a one line summary for each SQL statement evaluated. The statements from DBRMs are listed in query number order, assigned by DB2 according to the program statement numbers where the SQL was found. When the input is from a DBRM or the Path Checker interface, the Member name is also listed. Now it is easy to tie back to the module and find the location of the SQL that needs some work. The SQL statement’s cost information is displayed in QLIMIT. CPU Time, Elapsed Time, I/O Count, Qunits ™ (query service units), and monetary costs (in the currency of your choice) are all presented in a final tally, along with warning flags set for any of those costs which overrun the installation-supplied limits for each category. Consider the sample report below. 17:17:25.527 SQL PERFORMANCE ANALYZER VERSION 3.1.0
8
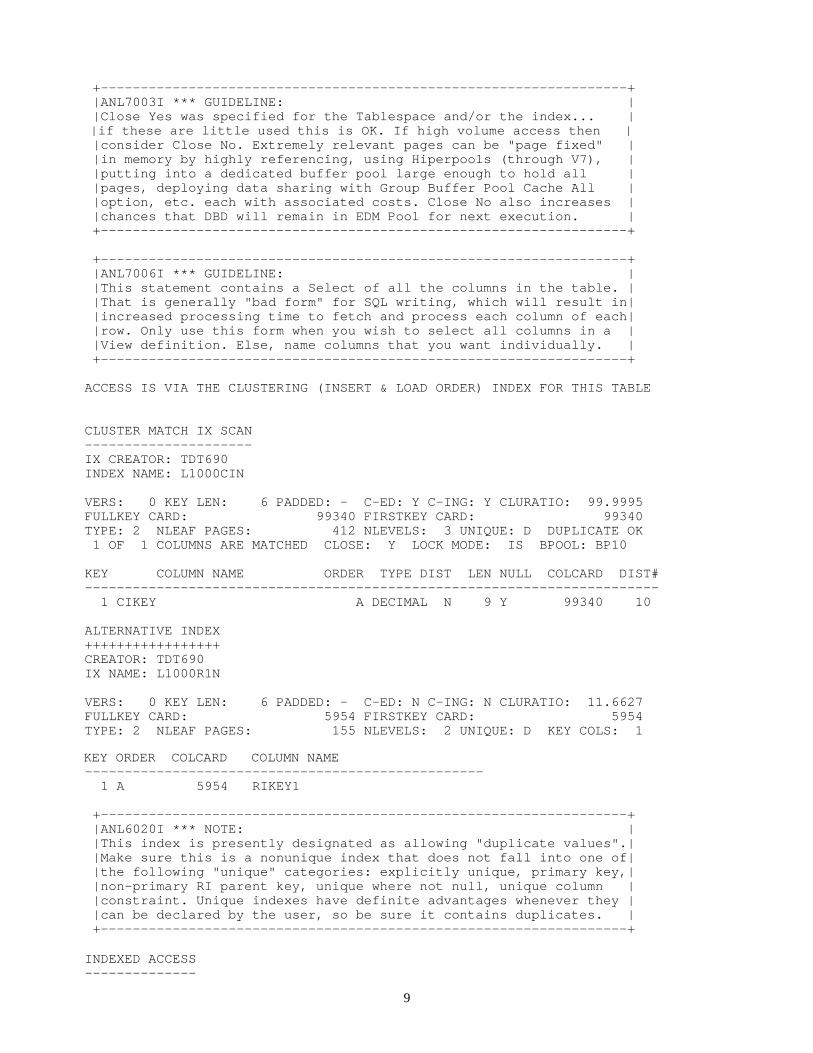
01-24-2006 QUERY LIMITS REPORT LEVEL PTF3100 CEIQ$ ERROR QUERYNO CPU TIME ELAPSED PHYS I/O QUNITS MONETARY COST MEMBER ---Y- 0 100000001 8.09615 11.225 6 443 1.8903 ----- 0 100000002 0.10521 3.219 26 6 0.2923 ----- 0 100000003 0.01454 1.952 6 1 0.0687 ----- 0 100000004 0.01945 1.994 6 2 0.0699 ----- 0 100000005 0.10521 3.219 26 6 0.2923 ----- 0 100000006 0.02427 2.162 7 2 0.0814 ----- 0 100000007 0.03152 2.617 15 2 0.1643 -Y--- 0 100000008 1.39723 44.986 784 77 8.2755 ----- 0 100000009 0.00614 1.898 4 1 0.0466 -Y-Y- 0 100000010 6.44118 50.029 784 352 9.4103 ----- 0 100000011 0.03406 2.356 11 2 0.1241 ----- 0 100000012 0.02002 3.734 8 2 0.0948 ----- 0 100000013 0.02043 3.712 7 2 0.0849 ----- 0 100000014 0.08591 3.849 322 5 3.2498 ----- 0 100000015 0.02196 3.704 10 2 0.1152 ----- 0 100000016 0.01729 3.745 20 1 0.2142 ----- 0 100000017 0.03150 4.019 18 2 0.1982 ----- 0 100000018 0.01324 2.075 3 1 0.0387 Query Limits Report (QLIMIT) BATCH - Finding hidden production problems In the sample report above, the SQL for statements 1, 8 and 10 are worthy of a closer look, as these all exceeded one or more installation limits for CPU Time, Elapsed Time, I/O Count, Qunits or Monetary cost (the order of the CEIQ$ header at top left). Users can employ the QLIMIT report as the first step in their analysis of critical SQL statements for an entire application. Selecting the SQL that consumes the most resources is a logical place to start. If an SQL statement causes a Prepare or Explain error during DB2 processing (-104, -418, illegal use of host variables, etc.) then that SQL error code is recorded under the ERROR column for easy reference. Moving from the QLIMIT report, we can examine more informative reports, like the Enhanced Explain report, ANLREP, which provides the access path information, catalog statistics and the SQL Advisor’s insights, including Warnings and Alerts, Guidelines and Recommendations, and Performance Notes on each SQL statement. Optionally, SQL PA can also inform the user about the other indexes that may be available to access this table, but which are presently not being selected for the access path, when the SHOWALT parameter is deployed. A sample Enhanced Explain (ANLREP) report follows. SQL PA ANALYSIS FOR QUERYNO 100000003 SELECT * FROM TDT690.L1000 WHERE CIKEY = 50086 QUERYNO: 100000003 QBLOCKNO: 1 PLANNO: 1 MIXOPSEQ: 0 PROCESS -> +------------------------------------------------------------------+ |ANL7002I *** GUIDELINE: | |This plan step has not selected any Sequential|List Prefetch I/O. | |If the SQL processes just a few rows that is OK, but if many rows | |are involved, you can help promote Sequential Detection by both | |accessing the data in sequential order (presort?) and by binding | |with Release (Deallocate) to avoid resetting counters at Commit. | +------------------------------------------------------------------+
9
+------------------------------------------------------------------+ |ANL7003I *** GUIDELINE: | |Close Yes was specified for the Tablespace and/or the index... | |if these are little used this is OK. If high volume access then | |consider Close No. Extremely relevant pages can be "page fixed" | |in memory by highly referencing, using Hiperpools (through V7), | |putting into a dedicated buffer pool large enough to hold all | |pages, deploying data sharing with Group Buffer Pool Cache All | |option, etc. each with associated costs. Close No also increases | |chances that DBD will remain in EDM Pool for next execution. | +------------------------------------------------------------------+ +------------------------------------------------------------------+ |ANL7006I *** GUIDELINE: | |This statement contains a Select of all the columns in the table. | |That is generally "bad form" for SQL writing, which will result in| |increased processing time to fetch and process each column of each| |row. Only use this form when you wish to select all columns in a | |View definition. Else, name columns that you want individually. | +------------------------------------------------------------------+ ACCESS IS VIA THE CLUSTERING (INSERT & LOAD ORDER) INDEX FOR THIS TABLE CLUSTER MATCH IX SCAN --------------------- IX CREATOR: TDT690 INDEX NAME: L1000CIN VERS: 0 KEY LEN: 6 PADDED: - C-ED: Y C-ING: Y CLURATIO: 99.9995 FULLKEY CARD: 99340 FIRSTKEY CARD: 99340 TYPE: 2 NLEAF PAGES: 412 NLEVELS: 3 UNIQUE: D DUPLICATE OK 1 OF 1 COLUMNS ARE MATCHED CLOSE: Y LOCK MODE: IS BPOOL: BP10 KEY COLUMN NAME ORDER TYPE DIST LEN NULL COLCARD DIST# ------------------------------------------------------------------------ 1 CIKEY A DECIMAL N 9 Y 99340 10 ALTERNATIVE INDEX +++++++++++++++++ CREATOR: TDT690 IX NAME: L1000R1N VERS: 0 KEY LEN: 6 PADDED: - C-ED: N C-ING: N CLURATIO: 11.6627 FULLKEY CARD: 5954 FIRSTKEY CARD: 5954 TYPE: 2 NLEAF PAGES: 155 NLEVELS: 2 UNIQUE: D KEY COLS: 1 KEY ORDER COLCARD COLUMN NAME -------------------------------------------------- 1 A 5954 RIKEY1 +------------------------------------------------------------------+ |ANL6020I *** NOTE: | |This index is presently designated as allowing "duplicate values".| |Make sure this is a nonunique index that does not fall into one of| |the following "unique" categories: explicitly unique, primary key,| |non-primary RI parent key, unique where not null, unique column | |constraint. Unique indexes have definite advantages whenever they | |can be declared by the user, so be sure it contains duplicates. | +------------------------------------------------------------------+ INDEXED ACCESS --------------
10
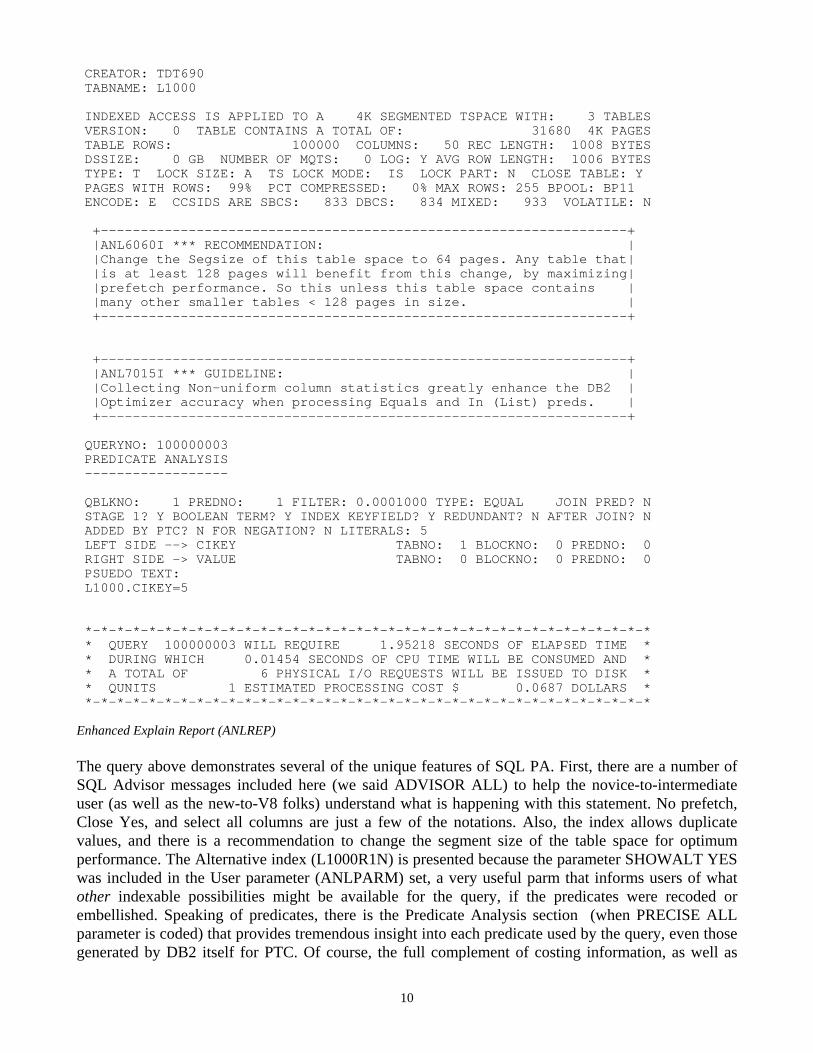
CREATOR: TDT690 TABNAME: L1000 INDEXED ACCESS IS APPLIED TO A 4K SEGMENTED TSPACE WITH: 3 TABLES VERSION: 0 TABLE CONTAINS A TOTAL OF: 31680 4K PAGES TABLE ROWS: 100000 COLUMNS: 50 REC LENGTH: 1008 BYTES DSSIZE: 0 GB NUMBER OF MQTS: 0 LOG: Y AVG ROW LENGTH: 1006 BYTES TYPE: T LOCK SIZE: A TS LOCK MODE: IS LOCK PART: N CLOSE TABLE: Y PAGES WITH ROWS: 99% PCT COMPRESSED: 0% MAX ROWS: 255 BPOOL: BP11 ENCODE: E CCSIDS ARE SBCS: 833 DBCS: 834 MIXED: 933 VOLATILE: N +------------------------------------------------------------------+ |ANL6060I *** RECOMMENDATION: | |Change the Segsize of this table space to 64 pages. Any table that| |is at least 128 pages will benefit from this change, by maximizing| |prefetch performance. So this unless this table space contains | |many other smaller tables < 128 pages in size. | +------------------------------------------------------------------+ +------------------------------------------------------------------+ |ANL7015I *** GUIDELINE: | |Collecting Non-uniform column statistics greatly enhance the DB2 | |Optimizer accuracy when processing Equals and In (List) preds. | +------------------------------------------------------------------+ QUERYNO: 100000003 PREDICATE ANALYSIS ------------------ QBLKNO: 1 PREDNO: 1 FILTER: 0.0001000 TYPE: EQUAL JOIN PRED? N STAGE 1? Y BOOLEAN TERM? Y INDEX KEYFIELD? Y REDUNDANT? N AFTER JOIN? N ADDED BY PTC? N FOR NEGATION? N LITERALS: 5 LEFT SIDE --> CIKEY TABNO: 1 BLOCKNO: 0 PREDNO: 0 RIGHT SIDE -> VALUE TABNO: 0 BLOCKNO: 0 PREDNO: 0 PSUEDO TEXT: L1000.CIKEY=5 *-*-*-*-*-*-*-*-*-*-*-*-*-*-*-*-*-*-*-*-*-*-*-*-*-*-*-*-*-*-*-*-*-*-*-* * QUERY 100000003 WILL REQUIRE 1.95218 SECONDS OF ELAPSED TIME * * DURING WHICH 0.01454 SECONDS OF CPU TIME WILL BE CONSUMED AND * * A TOTAL OF 6 PHYSICAL I/O REQUESTS WILL BE ISSUED TO DISK * * QUNITS 1 ESTIMATED PROCESSING COST $ 0.0687 DOLLARS * *-*-*-*-*-*-*-*-*-*-*-*-*-*-*-*-*-*-*-*-*-*-*-*-*-*-*-*-*-*-*-*-*-*-*-* Enhanced Explain Report (ANLREP) The query above demonstrates several of the unique features of SQL PA. First, there are a number of SQL Advisor messages included here (we said ADVISOR ALL) to help the novice-to-intermediate user (as well as the new-to-V8 folks) understand what is happening with this statement. No prefetch, Close Yes, and select all columns are just a few of the notations. Also, the index allows duplicate values, and there is a recommendation to change the segment size of the table space for optimum performance. The Alternative index (L1000R1N) is presented because the parameter SHOWALT YES was included in the User parameter (ANLPARM) set, a very useful parm that informs users of what other indexable possibilities might be available for the query, if the predicates were recoded or embellished. Speaking of predicates, there is the Predicate Analysis section (when PRECISE ALL parameter is coded) that provides tremendous insight into each predicate used by the query, even those generated by DB2 itself for PTC. Of course, the full complement of costing information, as well as
11
other SQL Advisor guidelines, the pertinent catalog statistics, and other notations (‘access via the clustering index’) are also included in this comprehensive report.
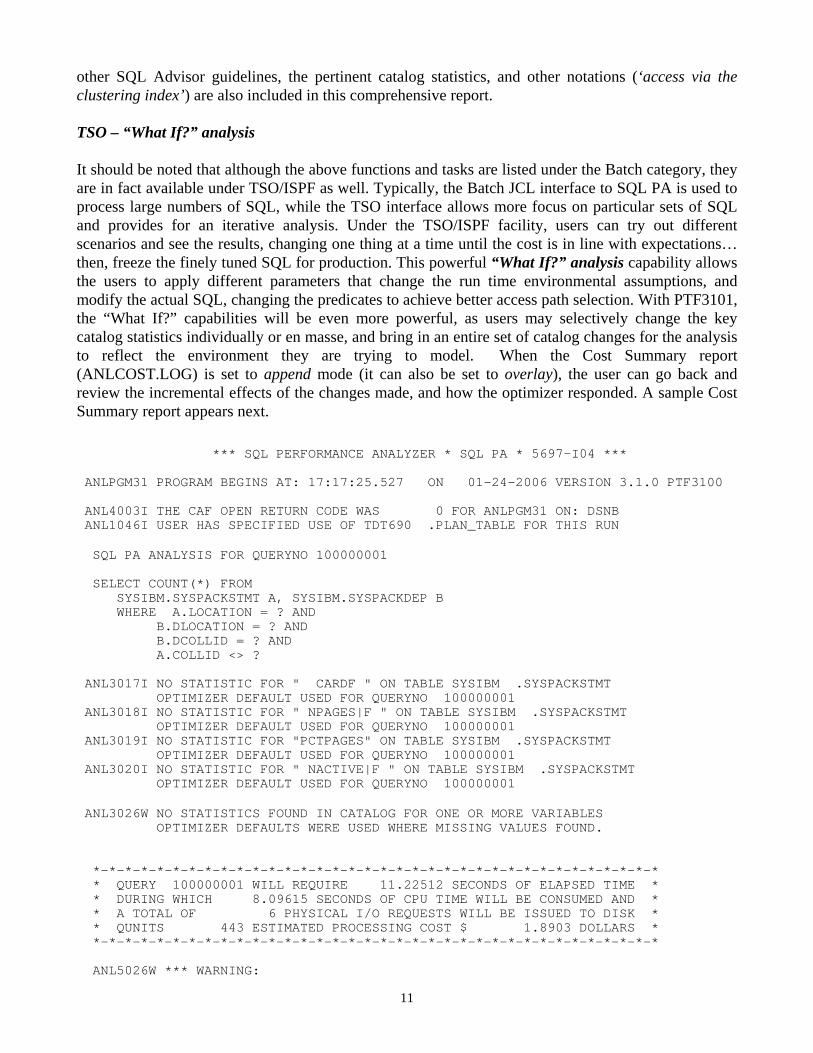
TSO – “What If?” analysis It should be noted that although the above functions and tasks are listed under the Batch category, they are in fact available under TSO/ISPF as well. Typically, the Batch JCL interface to SQL PA is used to process large numbers of SQL, while the TSO interface allows more focus on particular sets of SQL and provides for an iterative analysis. Under the TSO/ISPF facility, users can try out different scenarios and see the results, changing one thing at a time until the cost is in line with expectations… then, freeze the finely tuned SQL for production. This powerful “What If?” analysis capability allows the users to apply different parameters that change the run time environmental assumptions, and modify the actual SQL, changing the predicates to achieve better access path selection. With PTF3101, the “What If?” capabilities will be even more powerful, as users may selectively change the key catalog statistics individually or en masse, and bring in an entire set of catalog changes for the analysis to reflect the environment they are trying to model. When the Cost Summary report (ANLCOST.LOG) is set to append mode (it can also be set to overlay), the user can go back and review the incremental effects of the changes made, and how the optimizer responded. A sample Cost Summary report appears next. *** SQL PERFORMANCE ANALYZER * SQL PA * 5697-I04 *** ANLPGM31 PROGRAM BEGINS AT: 17:17:25.527 ON 01-24-2006 VERSION 3.1.0 PTF3100 ANL4003I THE CAF OPEN RETURN CODE WAS 0 FOR ANLPGM31 ON: DSNB ANL1046I USER HAS SPECIFIED USE OF TDT690 .PLAN_TABLE FOR THIS RUN SQL PA ANALYSIS FOR QUERYNO 100000001 SELECT COUNT(*) FROM SYSIBM.SYSPACKSTMT A, SYSIBM.SYSPACKDEP B WHERE A.LOCATION = ? AND B.DLOCATION = ? AND B.DCOLLID = ? AND A.COLLID <> ? ANL3017I NO STATISTIC FOR " CARDF " ON TABLE SYSIBM .SYSPACKSTMT OPTIMIZER DEFAULT USED FOR QUERYNO 100000001 ANL3018I NO STATISTIC FOR " NPAGES|F " ON TABLE SYSIBM .SYSPACKSTMT OPTIMIZER DEFAULT USED FOR QUERYNO 100000001 ANL3019I NO STATISTIC FOR "PCTPAGES" ON TABLE SYSIBM .SYSPACKSTMT OPTIMIZER DEFAULT USED FOR QUERYNO 100000001 ANL3020I NO STATISTIC FOR " NACTIVE|F " ON TABLE SYSIBM .SYSPACKSTMT OPTIMIZER DEFAULT USED FOR QUERYNO 100000001 ANL3026W NO STATISTICS FOUND IN CATALOG FOR ONE OR MORE VARIABLES OPTIMIZER DEFAULTS WERE USED WHERE MISSING VALUES FOUND. *-*-*-*-*-*-*-*-*-*-*-*-*-*-*-*-*-*-*-*-*-*-*-*-*-*-*-*-*-*-*-*-*-*-*-* * QUERY 100000001 WILL REQUIRE 11.22512 SECONDS OF ELAPSED TIME * * DURING WHICH 8.09615 SECONDS OF CPU TIME WILL BE CONSUMED AND * * A TOTAL OF 6 PHYSICAL I/O REQUESTS WILL BE ISSUED TO DISK * * QUNITS 443 ESTIMATED PROCESSING COST $ 1.8903 DOLLARS * *-*-*-*-*-*-*-*-*-*-*-*-*-*-*-*-*-*-*-*-*-*-*-*-*-*-*-*-*-*-*-*-*-*-*-* ANL5026W *** WARNING:
12
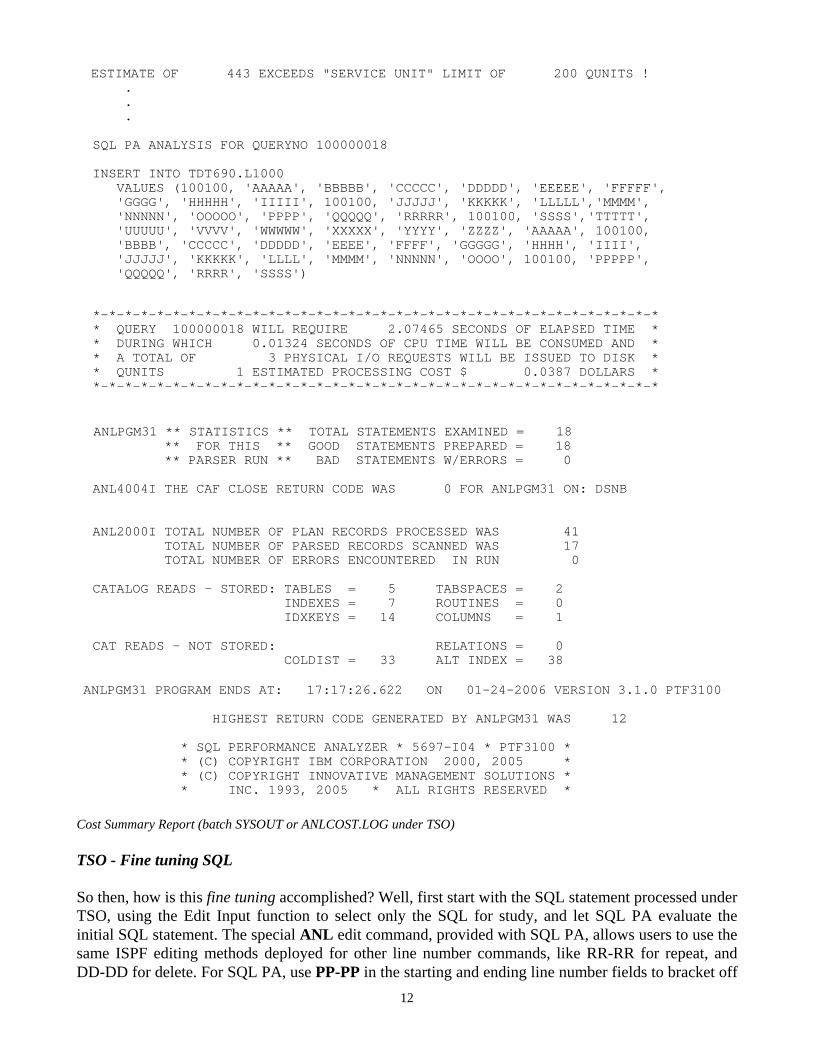
ESTIMATE OF 443 EXCEEDS "SERVICE UNIT" LIMIT OF 200 QUNITS ! . . . SQL PA ANALYSIS FOR QUERYNO 100000018 INSERT INTO TDT690.L1000 VALUES (100100, 'AAAAA', 'BBBBB', 'CCCCC', 'DDDDD', 'EEEEE', 'FFFFF', 'GGGG', 'HHHHH', 'IIIII', 100100, 'JJJJJ', 'KKKKK', 'LLLLL','MMMM', 'NNNNN', 'OOOOO', 'PPPP', 'QQQQQ', 'RRRRR', 100100, 'SSSS','TTTTT', 'UUUUU', 'VVVV', 'WWWWW', 'XXXXX', 'YYYY', 'ZZZZ', 'AAAAA', 100100, 'BBBB', 'CCCCC', 'DDDDD', 'EEEE', 'FFFF', 'GGGGG', 'HHHH', 'IIII', 'JJJJJ', 'KKKKK', 'LLLL', 'MMMM', 'NNNNN', 'OOOO', 100100, 'PPPPP', 'QQQQQ', 'RRRR', 'SSSS') *-*-*-*-*-*-*-*-*-*-*-*-*-*-*-*-*-*-*-*-*-*-*-*-*-*-*-*-*-*-*-*-*-*-*-* * QUERY 100000018 WILL REQUIRE 2.07465 SECONDS OF ELAPSED TIME * * DURING WHICH 0.01324 SECONDS OF CPU TIME WILL BE CONSUMED AND * * A TOTAL OF 3 PHYSICAL I/O REQUESTS WILL BE ISSUED TO DISK * * QUNITS 1 ESTIMATED PROCESSING COST $ 0.0387 DOLLARS * *-*-*-*-*-*-*-*-*-*-*-*-*-*-*-*-*-*-*-*-*-*-*-*-*-*-*-*-*-*-*-*-*-*-*-* ANLPGM31 ** STATISTICS ** TOTAL STATEMENTS EXAMINED = 18 ** FOR THIS ** GOOD STATEMENTS PREPARED = 18 ** PARSER RUN ** BAD STATEMENTS W/ERRORS = 0 ANL4004I THE CAF CLOSE RETURN CODE WAS 0 FOR ANLPGM31 ON: DSNB ANL2000I TOTAL NUMBER OF PLAN RECORDS PROCESSED WAS 41 TOTAL NUMBER OF PARSED RECORDS SCANNED WAS 17 TOTAL NUMBER OF ERRORS ENCOUNTERED IN RUN 0 CATALOG READS - STORED: TABLES = 5 TABSPACES = 2 INDEXES = 7 ROUTINES = 0 IDXKEYS = 14 COLUMNS = 1 CAT READS - NOT STORED: RELATIONS = 0 COLDIST = 33 ALT INDEX = 38 ANLPGM31 PROGRAM ENDS AT: 17:17:26.622 ON 01-24-2006 VERSION 3.1.0 PTF3100 HIGHEST RETURN CODE GENERATED BY ANLPGM31 WAS 12 * SQL PERFORMANCE ANALYZER * 5697-I04 * PTF3100 * * (C) COPYRIGHT IBM CORPORATION 2000, 2005 * * (C) COPYRIGHT INNOVATIVE MANAGEMENT SOLUTIONS * * INC. 1993, 2005 * ALL RIGHTS RESERVED * Cost Summary Report (batch SYSOUT or ANLCOST.LOG under TSO) TSO - Fine tuning SQL So then, how is this fine tuning accomplished? Well, first start with the SQL statement processed under TSO, using the Edit Input function to select only the SQL for study, and let SQL PA evaluate the initial SQL statement. The special ANL edit command, provided with SQL PA, allows users to use the same ISPF editing methods deployed for other line number commands, like RR-RR for repeat, and DD-DD for delete. For SQL PA, use PP-PP in the starting and ending line number fields to bracket off
13
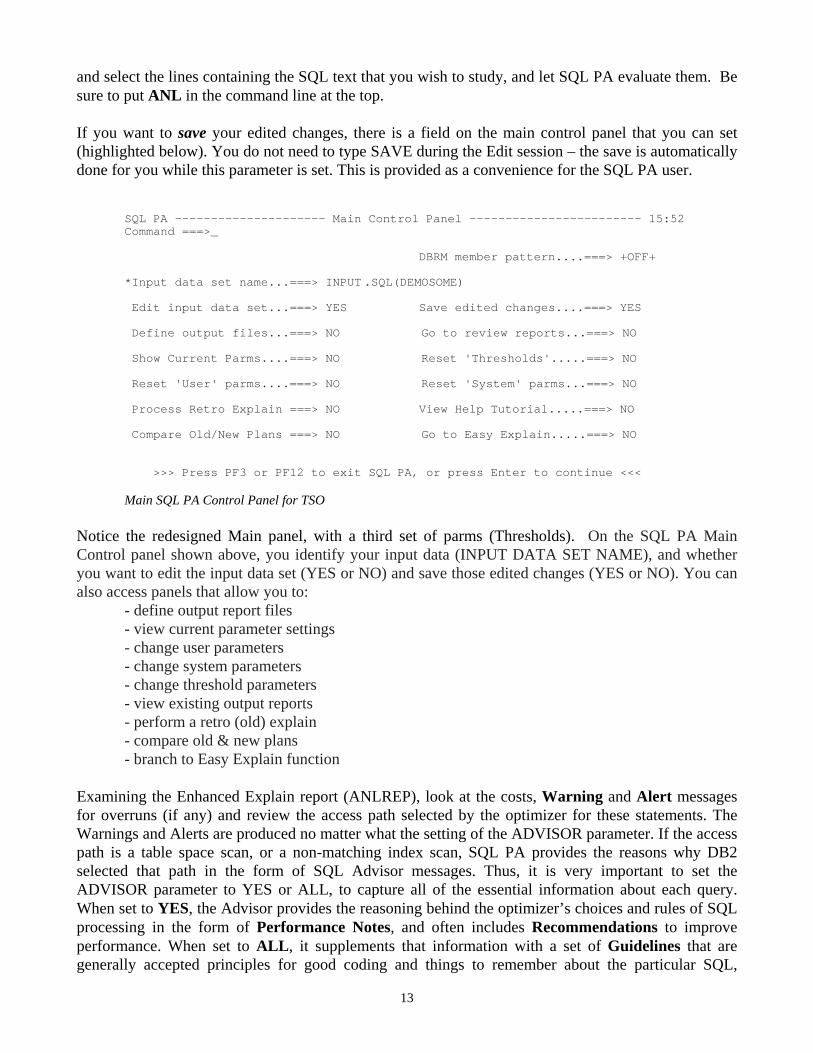
and select the lines containing the SQL text that you wish to study, and let SQL PA evaluate them. Be sure to put ANL in the command line at the top. If you want to save your edited changes, there is a field on the main control panel that you can set (highlighted below). You do not need to type SAVE during the Edit session – the save is automatically done for you while this parameter is set. This is provided as a convenience for the SQL PA user.
SQL PA --------------------- Main Control Panel ------------------------ 15:52 Command ===>_ DBRM member pattern....===> +OFF+ *Input data set name...===> INPUT .SQL(DEMOSOME) Edit input data set...===> YES Save edited changes....===> YES Define output files...===> NO Go to review reports...===> NO Show Current Parms....===> NO Reset 'Thresholds'.....===> NO Reset 'User' parms....===> NO Reset 'System' parms...===> NO Process Retro Explain ===> NO View Help Tutorial.....===> NO Compare Old/New Plans ===> NO Go to Easy Explain.....===> NO >>> Press PF3 or PF12 to exit SQL PA, or press Enter to continue <<< Main SQL PA Control Panel for TSO
Notice the redesigned Main panel, with a third set of parms (Thresholds). On the SQL PA Main Control panel shown above, you identify your input data (INPUT DATA SET NAME), and whether you want to edit the input data set (YES or NO) and save those edited changes (YES or NO). You can also access panels that allow you to:
- define output report files - view current parameter settings - change user parameters - change system parameters - change threshold parameters - view existing output reports - perform a retro (old) explain - compare old & new plans - branch to Easy Explain function
Examining the Enhanced Explain report (ANLREP), look at the costs, Warning and Alert messages for overruns (if any) and review the access path selected by the optimizer for these statements. The Warnings and Alerts are produced no matter what the setting of the ADVISOR parameter. If the access path is a table space scan, or a non-matching index scan, SQL PA provides the reasons why DB2 selected that path in the form of SQL Advisor messages. Thus, it is very important to set the ADVISOR parameter to YES or ALL, to capture all of the essential information about each query. When set to YES, the Advisor provides the reasoning behind the optimizer’s choices and rules of SQL processing in the form of Performance Notes, and often includes Recommendations to improve performance. When set to ALL, it supplements that information with a set of Guidelines that are generally accepted principles for good coding and things to remember about the particular SQL,
14
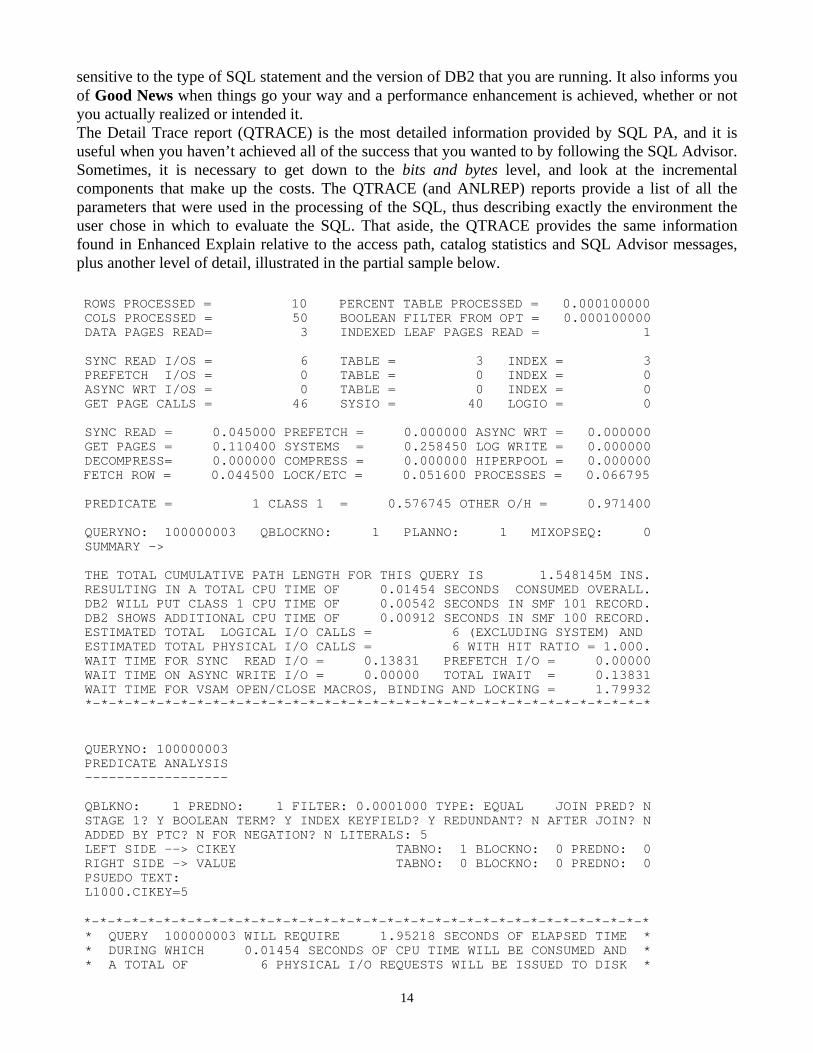
sensitive to the type of SQL statement and the version of DB2 that you are running. It also informs you of Good News when things go your way and a performance enhancement is achieved, whether or not you actually realized or intended it. The Detail Trace report (QTRACE) is the most detailed information provided by SQL PA, and it is useful when you haven’t achieved all of the success that you wanted to by following the SQL Advisor. Sometimes, it is necessary to get down to the bits and bytes level, and look at the incremental components that make up the costs. The QTRACE (and ANLREP) reports provide a list of all the parameters that were used in the processing of the SQL, thus describing exactly the environment the user chose in which to evaluate the SQL. That aside, the QTRACE provides the same information found in Enhanced Explain relative to the access path, catalog statistics and SQL Advisor messages, plus another level of detail, illustrated in the partial sample below. ROWS PROCESSED = 10 PERCENT TABLE PROCESSED = 0.000100000 COLS PROCESSED = 50 BOOLEAN FILTER FROM OPT = 0.000100000 DATA PAGES READ= 3 INDEXED LEAF PAGES READ = 1 SYNC READ I/OS = 6 TABLE = 3 INDEX = 3 PREFETCH I/OS = 0 TABLE = 0 INDEX = 0 ASYNC WRT I/OS = 0 TABLE = 0 INDEX = 0 GET PAGE CALLS = 46 SYSIO = 40 LOGIO = 0 SYNC READ = 0.045000 PREFETCH = 0.000000 ASYNC WRT = 0.000000 GET PAGES = 0.110400 SYSTEMS = 0.258450 LOG WRITE = 0.000000 DECOMPRESS= 0.000000 COMPRESS = 0.000000 HIPERPOOL = 0.000000 FETCH ROW = 0.044500 LOCK/ETC = 0.051600 PROCESSES = 0.066795 PREDICATE = 1 CLASS 1 = 0.576745 OTHER O/H = 0.971400 QUERYNO: 100000003 QBLOCKNO: 1 PLANNO: 1 MIXOPSEQ: 0 SUMMARY -> THE TOTAL CUMULATIVE PATH LENGTH FOR THIS QUERY IS 1.548145M INS. RESULTING IN A TOTAL CPU TIME OF 0.01454 SECONDS CONSUMED OVERALL. DB2 WILL PUT CLASS 1 CPU TIME OF 0.00542 SECONDS IN SMF 101 RECORD. DB2 SHOWS ADDITIONAL CPU TIME OF 0.00912 SECONDS IN SMF 100 RECORD. ESTIMATED TOTAL LOGICAL I/O CALLS = 6 (EXCLUDING SYSTEM) AND ESTIMATED TOTAL PHYSICAL I/O CALLS = 6 WITH HIT RATIO = 1.000. WAIT TIME FOR SYNC READ I/O = 0.13831 PREFETCH I/O = 0.00000 WAIT TIME ON ASYNC WRITE I/O = 0.00000 TOTAL IWAIT = 0.13831 WAIT TIME FOR VSAM OPEN/CLOSE MACROS, BINDING AND LOCKING = 1.79932 *-*-*-*-*-*-*-*-*-*-*-*-*-*-*-*-*-*-*-*-*-*-*-*-*-*-*-*-*-*-*-*-*-*-*-* QUERYNO: 100000003 PREDICATE ANALYSIS ------------------ QBLKNO: 1 PREDNO: 1 FILTER: 0.0001000 TYPE: EQUAL JOIN PRED? N STAGE 1? Y BOOLEAN TERM? Y INDEX KEYFIELD? Y REDUNDANT? N AFTER JOIN? N ADDED BY PTC? N FOR NEGATION? N LITERALS: 5 LEFT SIDE --> CIKEY TABNO: 1 BLOCKNO: 0 PREDNO: 0 RIGHT SIDE -> VALUE TABNO: 0 BLOCKNO: 0 PREDNO: 0 PSUEDO TEXT: L1000.CIKEY=5 *-*-*-*-*-*-*-*-*-*-*-*-*-*-*-*-*-*-*-*-*-*-*-*-*-*-*-*-*-*-*-*-*-*-*-* * QUERY 100000003 WILL REQUIRE 1.95218 SECONDS OF ELAPSED TIME * * DURING WHICH 0.01454 SECONDS OF CPU TIME WILL BE CONSUMED AND * * A TOTAL OF 6 PHYSICAL I/O REQUESTS WILL BE ISSUED TO DISK *
15
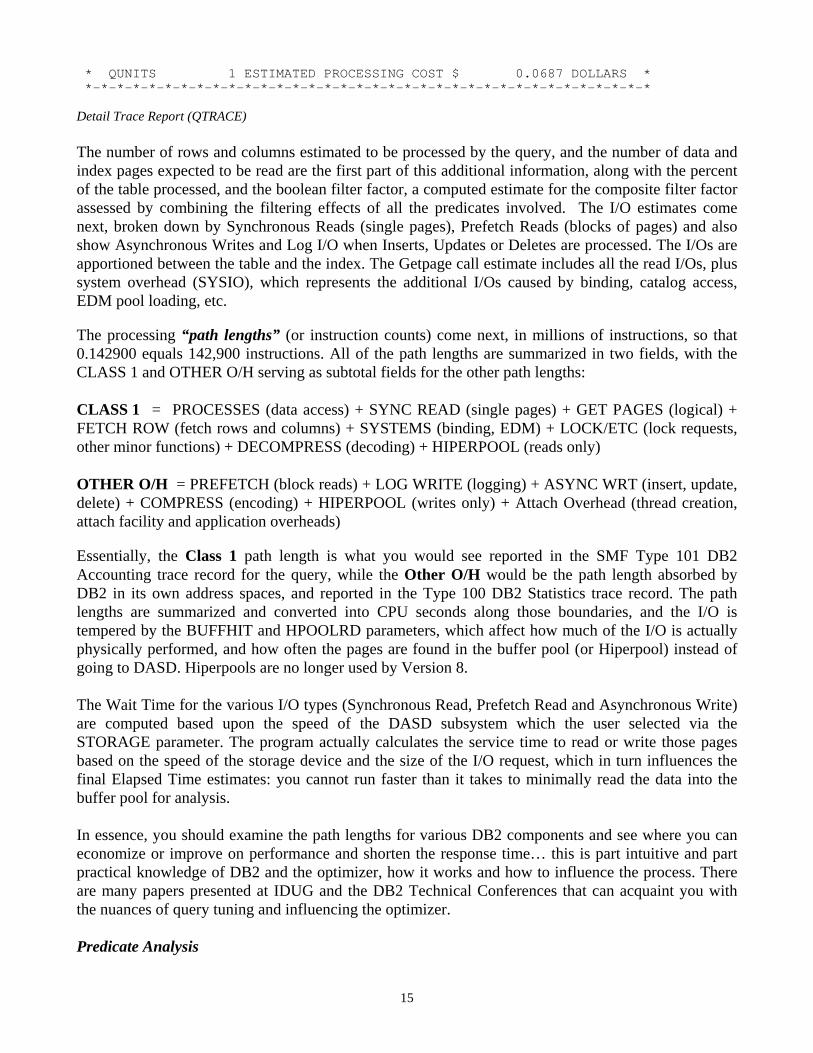
* QUNITS 1 ESTIMATED PROCESSING COST $ 0.0687 DOLLARS * *-*-*-*-*-*-*-*-*-*-*-*-*-*-*-*-*-*-*-*-*-*-*-*-*-*-*-*-*-*-*-*-*-*-*-* Detail Trace Report (QTRACE) The number of rows and columns estimated to be processed by the query, and the number of data and index pages expected to be read are the first part of this additional information, along with the percent of the table processed, and the boolean filter factor, a computed estimate for the composite filter factor assessed by combining the filtering effects of all the predicates involved. The I/O estimates come next, broken down by Synchronous Reads (single pages), Prefetch Reads (blocks of pages) and also show Asynchronous Writes and Log I/O when Inserts, Updates or Deletes are processed. The I/Os are apportioned between the table and the index. The Getpage call estimate includes all the read I/Os, plus system overhead (SYSIO), which represents the additional I/Os caused by binding, catalog access, EDM pool loading, etc. The processing “path lengths” (or instruction counts) come next, in millions of instructions, so that 0.142900 equals 142,900 instructions. All of the path lengths are summarized in two fields, with the CLASS 1 and OTHER O/H serving as subtotal fields for the other path lengths: CLASS 1 = PROCESSES (data access) + SYNC READ (single pages) + GET PAGES (logical) + FETCH ROW (fetch rows and columns) + SYSTEMS (binding, EDM) + LOCK/ETC (lock requests, other minor functions) + DECOMPRESS (decoding) + HIPERPOOL (reads only) OTHER O/H = PREFETCH (block reads) + LOG WRITE (logging) + ASYNC WRT (insert, update, delete) + COMPRESS (encoding) + HIPERPOOL (writes only) + Attach Overhead (thread creation, attach facility and application overheads) Essentially, the Class 1 path length is what you would see reported in the SMF Type 101 DB2 Accounting trace record for the query, while the Other O/H would be the path length absorbed by DB2 in its own address spaces, and reported in the Type 100 DB2 Statistics trace record. The path lengths are summarized and converted into CPU seconds along those boundaries, and the I/O is tempered by the BUFFHIT and HPOOLRD parameters, which affect how much of the I/O is actually physically performed, and how often the pages are found in the buffer pool (or Hiperpool) instead of going to DASD. Hiperpools are no longer used by Version 8. The Wait Time for the various I/O types (Synchronous Read, Prefetch Read and Asynchronous Write) are computed based upon the speed of the DASD subsystem which the user selected via the STORAGE parameter. The program actually calculates the service time to read or write those pages based on the speed of the storage device and the size of the I/O request, which in turn influences the final Elapsed Time estimates: you cannot run faster than it takes to minimally read the data into the buffer pool for analysis. In essence, you should examine the path lengths for various DB2 components and see where you can economize or improve on performance and shorten the response time… this is part intuitive and part practical knowledge of DB2 and the optimizer, how it works and how to influence the process. There are many papers presented at IDUG and the DB2 Technical Conferences that can acquaint you with the nuances of query tuning and influencing the optimizer. Predicate Analysis
16
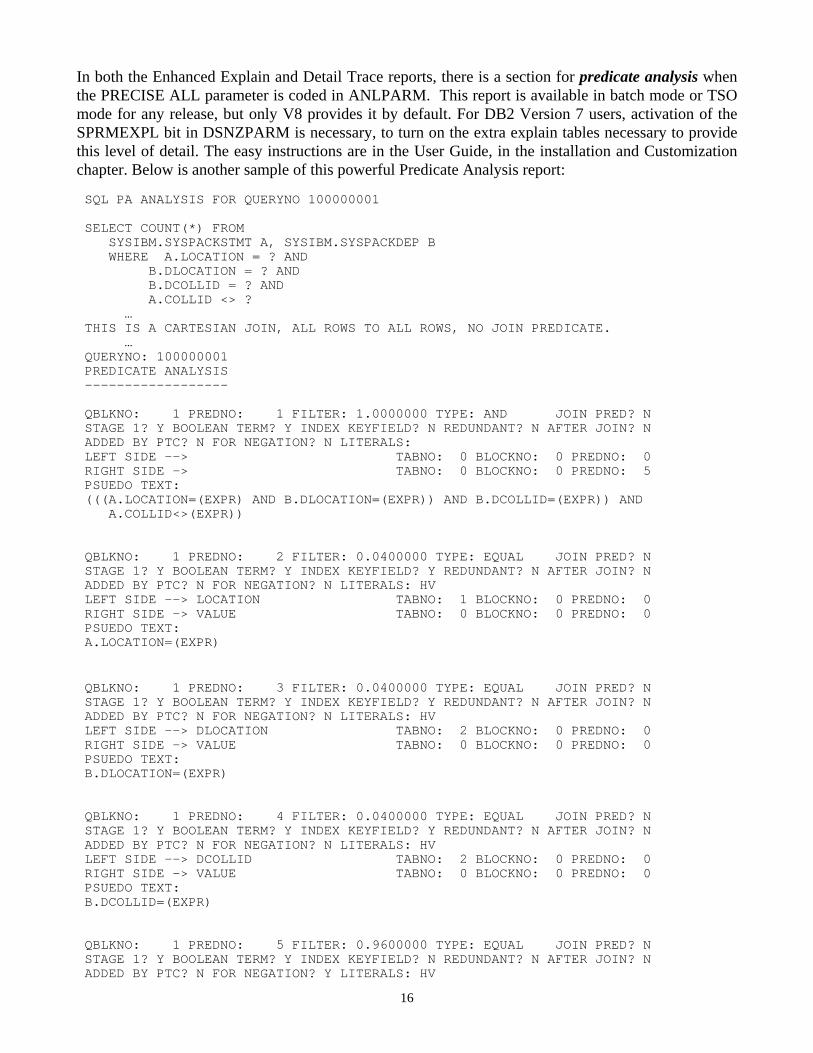
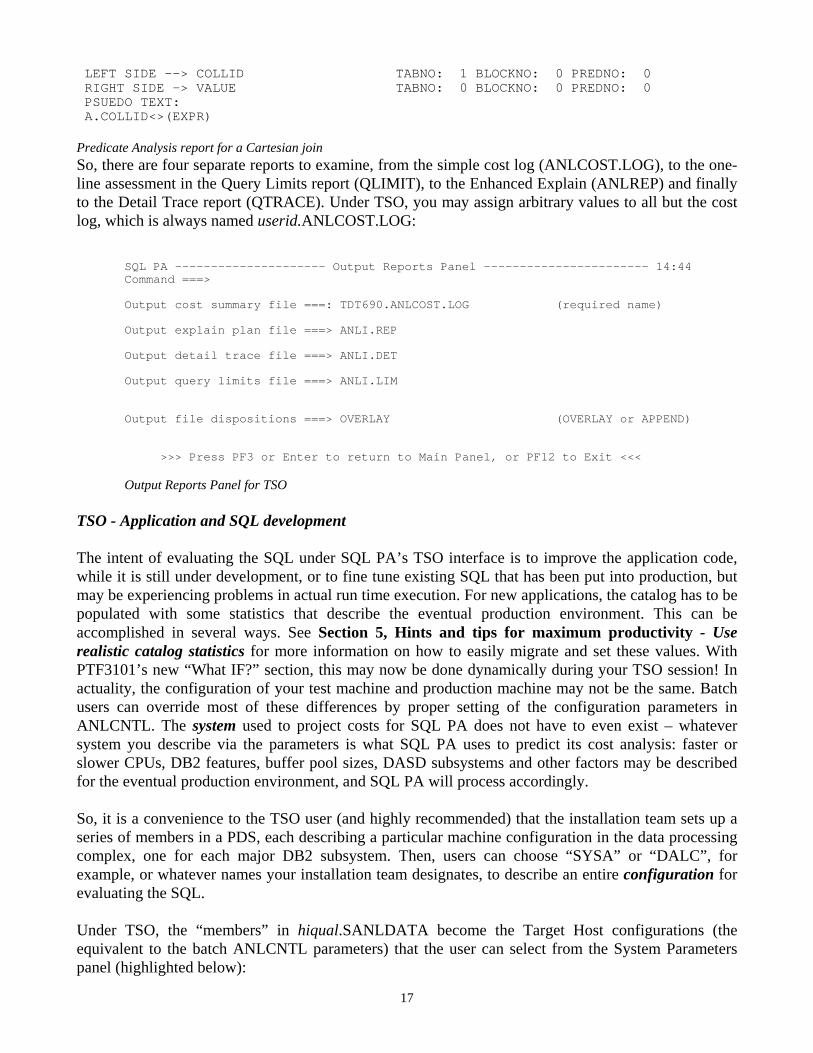
In both the Enhanced Explain and Detail Trace reports, there is a section for predicate analysis when the PRECISE ALL parameter is coded in ANLPARM. This report is available in batch mode or TSO mode for any release, but only V8 provides it by default. For DB2 Version 7 users, activation of the SPRMEXPL bit in DSNZPARM is necessary, to turn on the extra explain tables necessary to provide this level of detail. The easy instructions are in the User Guide, in the installation and Customization chapter. Below is another sample of this powerful Predicate Analysis report: SQL PA ANALYSIS FOR QUERYNO 100000001 SELECT COUNT(*) FROM SYSIBM.SYSPACKSTMT A, SYSIBM.SYSPACKDEP B WHERE A.LOCATION = ? AND B.DLOCATION = ? AND B.DCOLLID = ? AND A.COLLID <> ? … THIS IS A CARTESIAN JOIN, ALL ROWS TO ALL ROWS, NO JOIN PREDICATE. … QUERYNO: 100000001 PREDICATE ANALYSIS ------------------ QBLKNO: 1 PREDNO: 1 FILTER: 1.0000000 TYPE: AND JOIN PRED? N STAGE 1? Y BOOLEAN TERM? Y INDEX KEYFIELD? N REDUNDANT? N AFTER JOIN? N ADDED BY PTC? N FOR NEGATION? N LITERALS: LEFT SIDE --> TABNO: 0 BLOCKNO: 0 PREDNO: 0 RIGHT SIDE -> TABNO: 0 BLOCKNO: 0 PREDNO: 5 PSUEDO TEXT: (((A.LOCATION=(EXPR) AND B.DLOCATION=(EXPR)) AND B.DCOLLID=(EXPR)) AND A.COLLID<>(EXPR)) QBLKNO: 1 PREDNO: 2 FILTER: 0.0400000 TYPE: EQUAL JOIN PRED? N STAGE 1? Y BOOLEAN TERM? Y INDEX KEYFIELD? Y REDUNDANT? N AFTER JOIN? N ADDED BY PTC? N FOR NEGATION? N LITERALS: HV LEFT SIDE --> LOCATION TABNO: 1 BLOCKNO: 0 PREDNO: 0 RIGHT SIDE -> VALUE TABNO: 0 BLOCKNO: 0 PREDNO: 0 PSUEDO TEXT: A.LOCATION=(EXPR) QBLKNO: 1 PREDNO: 3 FILTER: 0.0400000 TYPE: EQUAL JOIN PRED? N STAGE 1? Y BOOLEAN TERM? Y INDEX KEYFIELD? Y REDUNDANT? N AFTER JOIN? N ADDED BY PTC? N FOR NEGATION? N LITERALS: HV LEFT SIDE --> DLOCATION TABNO: 2 BLOCKNO: 0 PREDNO: 0 RIGHT SIDE -> VALUE TABNO: 0 BLOCKNO: 0 PREDNO: 0 PSUEDO TEXT: B.DLOCATION=(EXPR) QBLKNO: 1 PREDNO: 4 FILTER: 0.0400000 TYPE: EQUAL JOIN PRED? N STAGE 1? Y BOOLEAN TERM? Y INDEX KEYFIELD? Y REDUNDANT? N AFTER JOIN? N ADDED BY PTC? N FOR NEGATION? N LITERALS: HV LEFT SIDE --> DCOLLID TABNO: 2 BLOCKNO: 0 PREDNO: 0 RIGHT SIDE -> VALUE TABNO: 0 BLOCKNO: 0 PREDNO: 0 PSUEDO TEXT: B.DCOLLID=(EXPR) QBLKNO: 1 PREDNO: 5 FILTER: 0.9600000 TYPE: EQUAL JOIN PRED? N STAGE 1? Y BOOLEAN TERM? Y INDEX KEYFIELD? N REDUNDANT? N AFTER JOIN? N ADDED BY PTC? N FOR NEGATION? Y LITERALS: HV
17
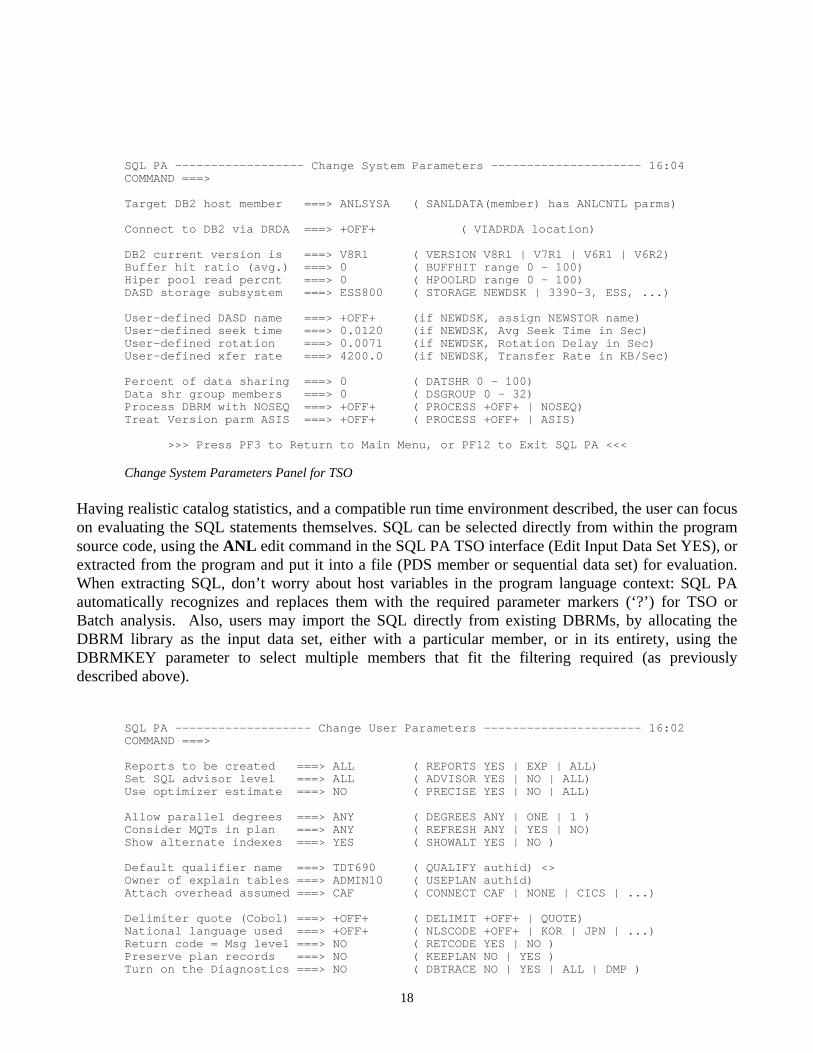
LEFT SIDE --> COLLID TABNO: 1 BLOCKNO: 0 PREDNO: 0 RIGHT SIDE -> VALUE TABNO: 0 BLOCKNO: 0 PREDNO: 0 PSUEDO TEXT: A.COLLID<>(EXPR) Predicate Analysis report for a Cartesian join So, there are four separate reports to examine, from the simple cost log (ANLCOST.LOG), to the one-line assessment in the Query Limits report (QLIMIT), to the Enhanced Explain (ANLREP) and finally to the Detail Trace report (QTRACE). Under TSO, you may assign arbitrary values to all but the cost log, which is always named userid.ANLCOST.LOG:
SQL PA --------------------- Output Reports Panel ----------------------- 14:44 Command ===> Output cost summary file ===: TDT690.ANLCOST.LOG (required name) Output explain plan file ===> ANLI.REP Output detail trace file ===> ANLI.DET Output query limits file ===> ANLI.LIM Output file dispositions ===> OVERLAY (OVERLAY or APPEND) >>> Press PF3 or Enter to return to Main Panel, or PF12 to Exit <<< Output Reports Panel for TSO
TSO - Application and SQL development The intent of evaluating the SQL under SQL PA’s TSO interface is to improve the application code, while it is still under development, or to fine tune existing SQL that has been put into production, but may be experiencing problems in actual run time execution. For new applications, the catalog has to be populated with some statistics that describe the eventual production environment. This can be accomplished in several ways. See Section 5, Hints and tips for maximum productivity - Use realistic catalog statistics for more information on how to easily migrate and set these values. With PTF3101’s new “What IF?” section, this may now be done dynamically during your TSO session! In actuality, the configuration of your test machine and production machine may not be the same. Batch users can override most of these differences by proper setting of the configuration parameters in ANLCNTL. The system used to project costs for SQL PA does not have to even exist – whatever system you describe via the parameters is what SQL PA uses to predict its cost analysis: faster or slower CPUs, DB2 features, buffer pool sizes, DASD subsystems and other factors may be described for the eventual production environment, and SQL PA will process accordingly. So, it is a convenience to the TSO user (and highly recommended) that the installation team sets up a series of members in a PDS, each describing a particular machine configuration in the data processing complex, one for each major DB2 subsystem. Then, users can choose “SYSA” or “DALC”, for example, or whatever names your installation team designates, to describe an entire configuration for evaluating the SQL. Under TSO, the “members” in hiqual.SANLDATA become the Target Host configurations (the equivalent to the batch ANLCNTL parameters) that the user can select from the System Parameters panel (highlighted below):
18
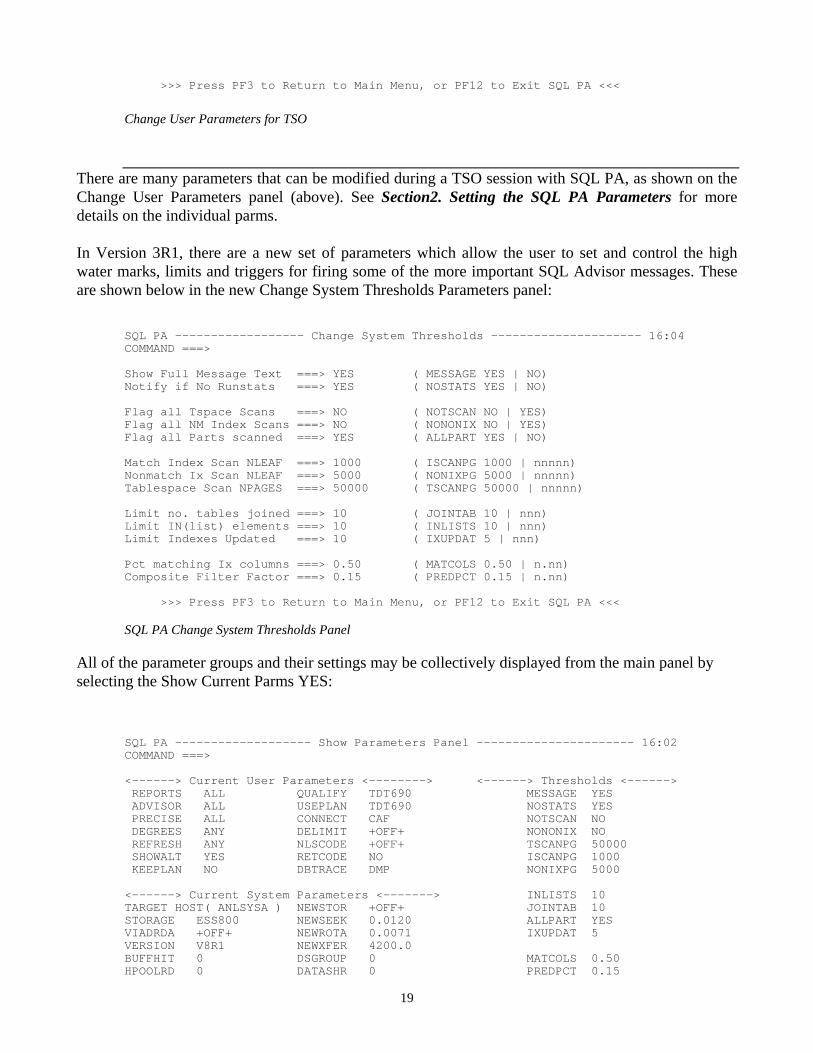
SQL PA ------------------ Change System Parameters --------------------- 16:04 COMMAND ===> Target DB2 host member ===> ANLSYSA ( SANLDATA(member) has ANLCNTL parms) Connect to DB2 via DRDA ===> +OFF+ ( VIADRDA location) DB2 current version is ===> V8R1 ( VERSION V8R1 | V7R1 | V6R1 | V6R2) Buffer hit ratio (avg.) ===> 0 ( BUFFHIT range 0 - 100) Hiper pool read percnt ===> 0 ( HPOOLRD range 0 - 100) DASD storage subsystem ===> ESS800 ( STORAGE NEWDSK | 3390-3, ESS, ...) User-defined DASD name ===> +OFF+ (if NEWDSK, assign NEWSTOR name) User-defined seek time ===> 0.0120 (if NEWDSK, Avg Seek Time in Sec) User-defined rotation ===> 0.0071 (if NEWDSK, Rotation Delay in Sec) User-defined xfer rate ===> 4200.0 (if NEWDSK, Transfer Rate in KB/Sec) Percent of data sharing ===> 0 ( DATSHR 0 - 100) Data shr group members ===> 0 ( DSGROUP 0 - 32) Process DBRM with NOSEQ ===> +OFF+ ( PROCESS +OFF+ | NOSEQ) Treat Version parm ASIS ===> +OFF+ ( PROCESS +OFF+ | ASIS) >>> Press PF3 to Return to Main Menu, or PF12 to Exit SQL PA <<< Change System Parameters Panel for TSO
Having realistic catalog statistics, and a compatible run time environment described, the user can focus on evaluating the SQL statements themselves. SQL can be selected directly from within the program source code, using the ANL edit command in the SQL PA TSO interface (Edit Input Data Set YES), or extracted from the program and put it into a file (PDS member or sequential data set) for evaluation. When extracting SQL, don’t worry about host variables in the program language context: SQL PA automatically recognizes and replaces them with the required parameter markers (‘?’) for TSO or Batch analysis. Also, users may import the SQL directly from existing DBRMs, by allocating the DBRM library as the input data set, either with a particular member, or in its entirety, using the DBRMKEY parameter to select multiple members that fit the filtering required (as previously described above).
SQL PA ------------------- Change User Parameters ---------------------- 16:02 COMMAND ===> Reports to be created ===> ALL ( REPORTS YES | EXP | ALL) Set SQL advisor level ===> ALL ( ADVISOR YES | NO | ALL) Use optimizer estimate ===> NO ( PRECISE YES | NO | ALL) Allow parallel degrees ===> ANY ( DEGREES ANY | ONE | 1 ) Consider MQTs in plan ===> ANY ( REFRESH ANY | YES | NO) Show alternate indexes ===> YES ( SHOWALT YES | NO ) Default qualifier name ===> TDT690 ( QUALIFY authid) <> Owner of explain tables ===> ADMIN10 ( USEPLAN authid) Attach overhead assumed ===> CAF ( CONNECT CAF | NONE | CICS | ...) Delimiter quote (Cobol) ===> +OFF+ ( DELIMIT +OFF+ | QUOTE) National language used ===> +OFF+ ( NLSCODE +OFF+ | KOR | JPN | ...) Return code = Msg level ===> NO ( RETCODE YES | NO ) Preserve plan records ===> NO ( KEEPLAN NO | YES ) Turn on the Diagnostics ===> NO ( DBTRACE NO | YES | ALL | DMP )
19
>>> Press PF3 to Return to Main Menu, or PF12 to Exit SQL PA <<<
Change User Parameters for TSO
There are many parameters that can be modified during a TSO session with SQL PA, as shown on the Change User Parameters panel (above). See Section2. Setting the SQL PA Parameters for more details on the individual parms. In Version 3R1, there are a new set of parameters which allow the user to set and control the high water marks, limits and triggers for firing some of the more important SQL Advisor messages. These are shown below in the new Change System Thresholds Parameters panel:
SQL PA ------------------ Change System Thresholds --------------------- 16:04 COMMAND ===> Show Full Message Text ===> YES ( MESSAGE YES | NO) Notify if No Runstats ===> YES ( NOSTATS YES | NO) Flag all Tspace Scans ===> NO ( NOTSCAN NO | YES) Flag all NM Index Scans ===> NO ( NONONIX NO | YES) Flag all Parts scanned ===> YES ( ALLPART YES | NO) Match Index Scan NLEAF ===> 1000 ( ISCANPG 1000 | nnnnn) Nonmatch Ix Scan NLEAF ===> 5000 ( NONIXPG 5000 | nnnnn) Tablespace Scan NPAGES ===> 50000 ( TSCANPG 50000 | nnnnn) Limit no. tables joined ===> 10 ( JOINTAB 10 | nnn) Limit IN(list) elements ===> 10 ( INLISTS 10 | nnn) Limit Indexes Updated ===> 10 ( IXUPDAT 5 | nnn) Pct matching Ix columns ===> 0.50 ( MATCOLS 0.50 | n.nn) Composite Filter Factor ===> 0.15 ( PREDPCT 0.15 | n.nn) >>> Press PF3 to Return to Main Menu, or PF12 to Exit SQL PA <<< SQL PA Change System Thresholds Panel
All of the parameter groups and their settings may be collectively displayed from the main panel by selecting the Show Current Parms YES:
SQL PA ------------------- Show Parameters Panel ---------------------- 16:02 COMMAND ===> <------> Current User Parameters <--------> <------> Thresholds <------> REPORTS ALL QUALIFY TDT690 MESSAGE YES ADVISOR ALL USEPLAN TDT690 NOSTATS YES PRECISE ALL CONNECT CAF NOTSCAN NO DEGREES ANY DELIMIT +OFF+ NONONIX NO REFRESH ANY NLSCODE +OFF+ TSCANPG 50000 SHOWALT YES RETCODE NO ISCANPG 1000 KEEPLAN NO DBTRACE DMP NONIXPG 5000 <------> Current System Parameters <-------> INLISTS 10 TARGET HOST( ANLSYSA ) NEWSTOR +OFF+ JOINTAB 10 STORAGE ESS800 NEWSEEK 0.0120 ALLPART YES VIADRDA +OFF+ NEWROTA 0.0071 IXUPDAT 5 VERSION V8R1 NEWXFER 4200.0 BUFFHIT 0 DSGROUP 0 MATCOLS 0.50 HPOOLRD 0 DATASHR 0 PREDPCT 0.15
20
PROCESS +OFF+ (ASIS) PROCESS +OFF+ (NOSEQ) >>> Press PF3 or PF12 to return to main panel for any changes <<< SQL PA Show Parameters Panel
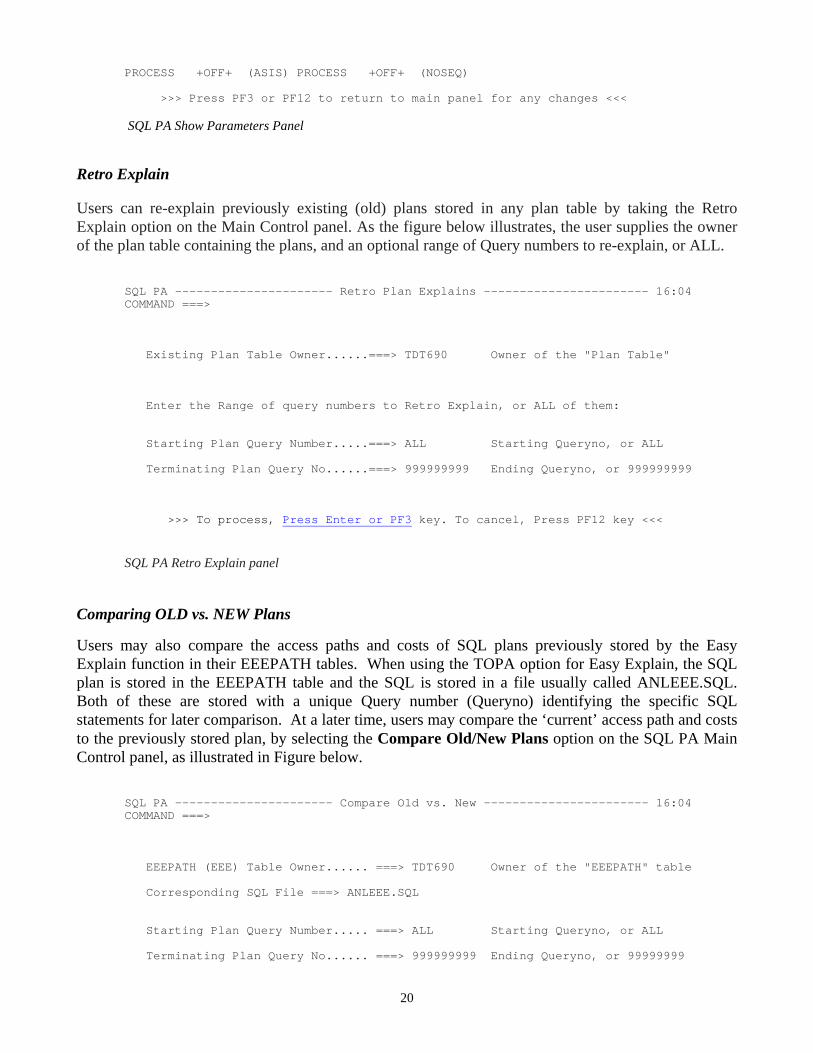
Retro Explain Users can re-explain previously existing (old) plans stored in any plan table by taking the Retro Explain option on the Main Control panel. As the figure below illustrates, the user supplies the owner of the plan table containing the plans, and an optional range of Query numbers to re-explain, or ALL.
SQL PA ---------------------- Retro Plan Explains ----------------------- 16:04 COMMAND ===> Existing Plan Table Owner......===> TDT690 Owner of the "Plan Table" Enter the Range of query numbers to Retro Explain, or ALL of them: Starting Plan Query Number.....===> ALL Starting Queryno, or ALL Terminating Plan Query No......===> 999999999 Ending Queryno, or 999999999 >>> To process, Press Enter or PF3 key. To cancel, Press PF12 key <<< SQL PA Retro Explain panel
Comparing OLD vs. NEW Plans
Users may also compare the access paths and costs of SQL plans previously stored by the Easy Explain function in their EEEPATH tables. When using the TOPA option for Easy Explain, the SQL plan is stored in the EEEPATH table and the SQL is stored in a file usually called ANLEEE.SQL. Both of these are stored with a unique Query number (Queryno) identifying the specific SQL statements for later comparison. At a later time, users may compare the ‘current’ access path and costs to the previously stored plan, by selecting the Compare Old/New Plans option on the SQL PA Main Control panel, as illustrated in Figure below.
SQL PA ---------------------- Compare Old vs. New ----------------------- 16:04 COMMAND ===> EEEPATH (EEE) Table Owner...... ===> TDT690 Owner of the "EEEPATH" table Corresponding SQL File ===> ANLEEE.SQL Starting Plan Query Number..... ===> ALL Starting Queryno, or ALL Terminating Plan Query No...... ===> 999999999 Ending Queryno, or 99999999
21
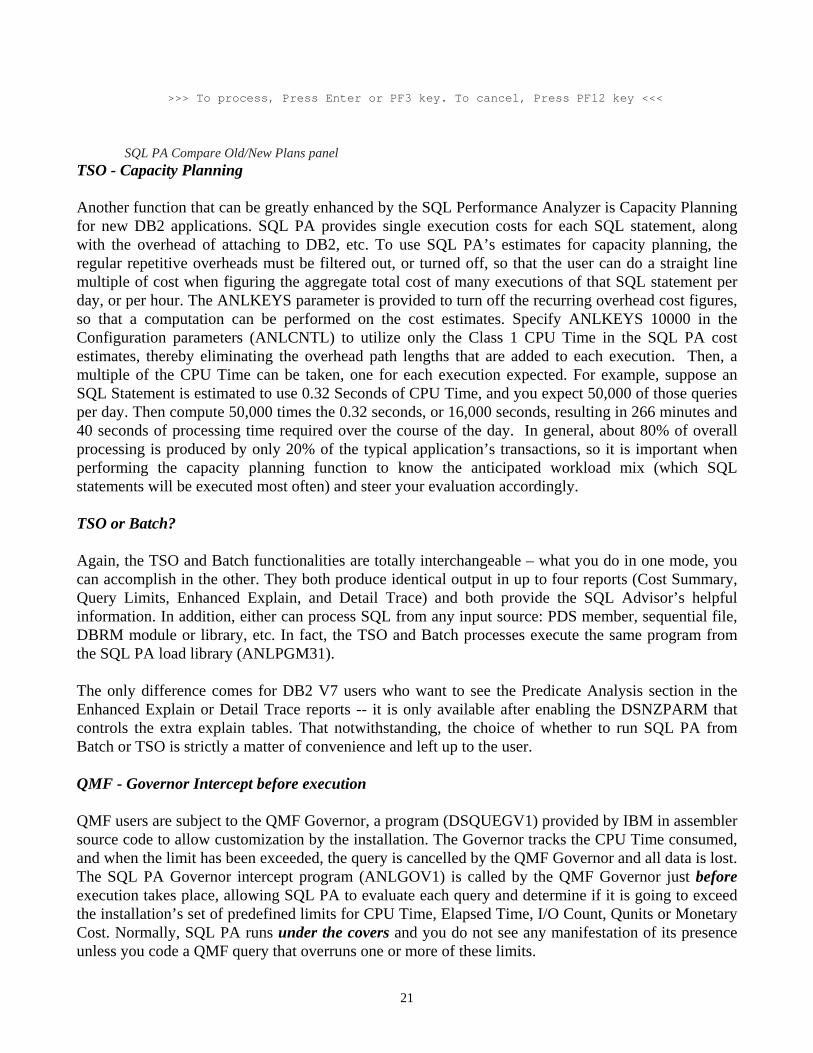
>>> To process, Press Enter or PF3 key. To cancel, Press PF12 key <<< SQL PA Compare Old/New Plans panel
TSO - Capacity Planning Another function that can be greatly enhanced by the SQL Performance Analyzer is Capacity Planning for new DB2 applications. SQL PA provides single execution costs for each SQL statement, along with the overhead of attaching to DB2, etc. To use SQL PA’s estimates for capacity planning, the regular repetitive overheads must be filtered out, or turned off, so that the user can do a straight line multiple of cost when figuring the aggregate total cost of many executions of that SQL statement per day, or per hour. The ANLKEYS parameter is provided to turn off the recurring overhead cost figures, so that a computation can be performed on the cost estimates. Specify ANLKEYS 10000 in the Configuration parameters (ANLCNTL) to utilize only the Class 1 CPU Time in the SQL PA cost estimates, thereby eliminating the overhead path lengths that are added to each execution. Then, a multiple of the CPU Time can be taken, one for each execution expected. For example, suppose an SQL Statement is estimated to use 0.32 Seconds of CPU Time, and you expect 50,000 of those queries per day. Then compute 50,000 times the 0.32 seconds, or 16,000 seconds, resulting in 266 minutes and 40 seconds of processing time required over the course of the day. In general, about 80% of overall processing is produced by only 20% of the typical application’s transactions, so it is important when performing the capacity planning function to know the anticipated workload mix (which SQL statements will be executed most often) and steer your evaluation accordingly. TSO or Batch? Again, the TSO and Batch functionalities are totally interchangeable – what you do in one mode, you can accomplish in the other. They both produce identical output in up to four reports (Cost Summary, Query Limits, Enhanced Explain, and Detail Trace) and both provide the SQL Advisor’s helpful information. In addition, either can process SQL from any input source: PDS member, sequential file, DBRM module or library, etc. In fact, the TSO and Batch processes execute the same program from the SQL PA load library (ANLPGM31). The only difference comes for DB2 V7 users who want to see the Predicate Analysis section in the Enhanced Explain or Detail Trace reports -- it is only available after enabling the DSNZPARM that controls the extra explain tables. That notwithstanding, the choice of whether to run SQL PA from Batch or TSO is strictly a matter of convenience and left up to the user. QMF - Governor Intercept before execution QMF users are subject to the QMF Governor, a program (DSQUEGV1) provided by IBM in assembler source code to allow customization by the installation. The Governor tracks the CPU Time consumed, and when the limit has been exceeded, the query is cancelled by the QMF Governor and all data is lost. The SQL PA Governor intercept program (ANLGOV1) is called by the QMF Governor just before execution takes place, allowing SQL PA to evaluate each query and determine if it is going to exceed the installation’s set of predefined limits for CPU Time, Elapsed Time, I/O Count, Qunits or Monetary Cost. Normally, SQL PA runs under the covers and you do not see any manifestation of its presence unless you code a QMF query that overruns one or more of these limits.
22
QMF - Catch Heavy Hitters and rewrite Then, SQL PA presents the user with an opportunity to cancel the query, before execution starts, on the probability that the query will eventually be killed off by the QMF Governor anyway. Why waste the time and the resources? If you elect to cancel the query, SQL PA will do the cancellation for you, and you will get a notification message (‘Your query has been cancelled by the SQL PA Governor Exit’). Else, you can still opt to run the query, and hope that it escapes cancellation by the QMF Governor. The main concept for the SQL PA QMF Governor Intercept is to save those resources that would otherwise be squandered when the query is ultimately cancelled by the QMF Governor. Note that the Resource Limit Facility (RLF) is yet another governor of online queries and works in concert with the QMF Governor. It too, may arise from time to time to limit the amount of CPU Time spent in DB2 address spaces: when the time is up, the query is cancelled in mid-flight, and the partial results are lost. Stored Procedures – DB2 or WLM-Controlled? This release of SQL PA contains both DB2 and WLM-controlled stored procedures, so choice of implementation is largely left to the installation, except that V8 which prefers the newer WLM address spaces. ANLPRC3C is the familiar DB2-controlled stored procedure (formerly ANLPROCC), which runs in the DSNSPAS address space and uses the Call Attach Facility (CAF) to access DB2. ANLPRC3R is the Workload Manager controlled stored procedure (formerly ANLPROCR), which runs under MVS control in the WLMSPAS address space, and uses the Remote Recovery Services Attach Facility (RRSAF). Both programs are identical, and just differ in their appropriate stored procedure protocol.
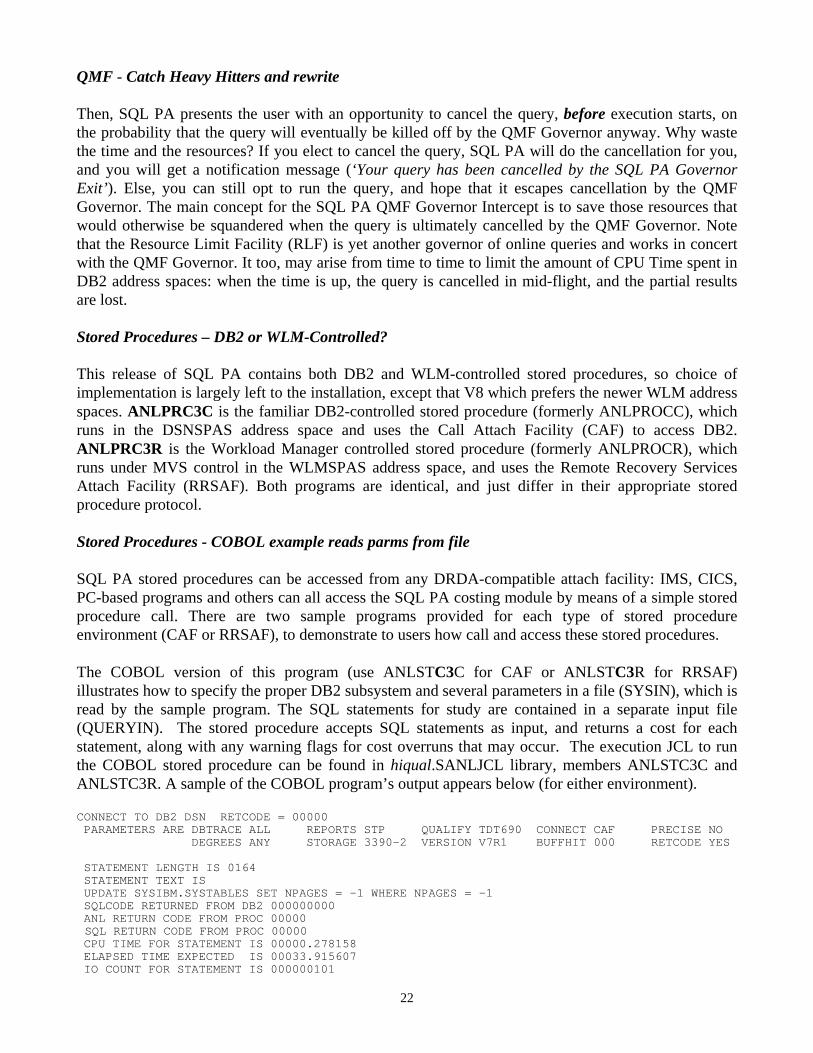
Stored Procedures - COBOL example reads parms from file SQL PA stored procedures can be accessed from any DRDA-compatible attach facility: IMS, CICS, PC-based programs and others can all access the SQL PA costing module by means of a simple stored procedure call. There are two sample programs provided for each type of stored procedure environment (CAF or RRSAF), to demonstrate to users how call and access these stored procedures. The COBOL version of this program (use ANLSTC3C for CAF or ANLSTC3R for RRSAF) illustrates how to specify the proper DB2 subsystem and several parameters in a file (SYSIN), which is read by the sample program. The SQL statements for study are contained in a separate input file (QUERYIN). The stored procedure accepts SQL statements as input, and returns a cost for each statement, along with any warning flags for cost overruns that may occur. The execution JCL to run the COBOL stored procedure can be found in hiqual.SANLJCL library, members ANLSTC3C and ANLSTC3R. A sample of the COBOL program’s output appears below (for either environment). CONNECT TO DB2 DSN RETCODE = 00000 PARAMETERS ARE DBTRACE ALL REPORTS STP QUALIFY TDT690 CONNECT CAF PRECISE NO DEGREES ANY STORAGE 3390-2 VERSION V7R1 BUFFHIT 000 RETCODE YES STATEMENT LENGTH IS 0164 STATEMENT TEXT IS UPDATE SYSIBM.SYSTABLES SET NPAGES = -1 WHERE NPAGES = -1 SQLCODE RETURNED FROM DB2 000000000 ANL RETURN CODE FROM PROC 00000 SQL RETURN CODE FROM PROC 00000 CPU TIME FOR STATEMENT IS 00000.278158 ELAPSED TIME EXPECTED IS 00033.915607 IO COUNT FOR STATEMENT IS 000000101
23
QUNITS (SERVICE UNITS) IS 000000016 MONETARY COST VALUED AT $ 00001.166023 WARNING FLAGS (CEIQ$) ARE ----- ---------------------------------------------- Sample output for ANLSTC3C and ANLSTC3R (COB)
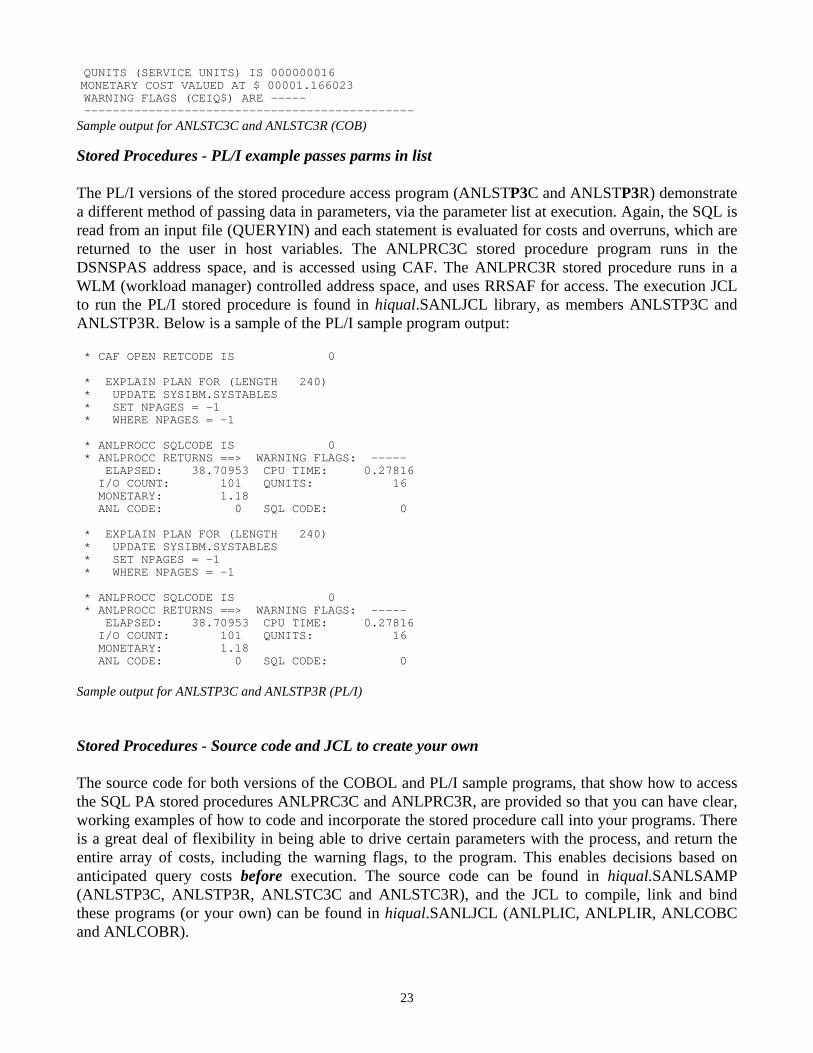
Stored Procedures - PL/I example passes parms in list The PL/I versions of the stored procedure access program (ANLSTP3C and ANLSTP3R) demonstrate a different method of passing data in parameters, via the parameter list at execution. Again, the SQL is read from an input file (QUERYIN) and each statement is evaluated for costs and overruns, which are returned to the user in host variables. The ANLPRC3C stored procedure program runs in the DSNSPAS address space, and is accessed using CAF. The ANLPRC3R stored procedure runs in a WLM (workload manager) controlled address space, and uses RRSAF for access. The execution JCL to run the PL/I stored procedure is found in hiqual.SANLJCL library, as members ANLSTP3C and ANLSTP3R. Below is a sample of the PL/I sample program output: * CAF OPEN RETCODE IS 0 * EXPLAIN PLAN FOR (LENGTH 240) * UPDATE SYSIBM.SYSTABLES * SET NPAGES = -1 * WHERE NPAGES = -1 * ANLPROCC SQLCODE IS 0 * ANLPROCC RETURNS ==> WARNING FLAGS: ----- ELAPSED: 38.70953 CPU TIME: 0.27816 I/O COUNT: 101 QUNITS: 16 MONETARY: 1.18 ANL CODE: 0 SQL CODE: 0 * EXPLAIN PLAN FOR (LENGTH 240) * UPDATE SYSIBM.SYSTABLES * SET NPAGES = -1 * WHERE NPAGES = -1 * ANLPROCC SQLCODE IS 0 * ANLPROCC RETURNS ==> WARNING FLAGS: ----- ELAPSED: 38.70953 CPU TIME: 0.27816 I/O COUNT: 101 QUNITS: 16 MONETARY: 1.18 ANL CODE: 0 SQL CODE: 0 Sample output for ANLSTP3C and ANLSTP3R (PL/I) Stored Procedures - Source code and JCL to create your own The source code for both versions of the COBOL and PL/I sample programs, that show how to access the SQL PA stored procedures ANLPRC3C and ANLPRC3R, are provided so that you can have clear, working examples of how to code and incorporate the stored procedure call into your programs. There is a great deal of flexibility in being able to drive certain parameters with the process, and return the entire array of costs, including the warning flags, to the program. This enables decisions based on anticipated query costs before execution. The source code can be found in hiqual.SANLSAMP (ANLSTP3C, ANLSTP3R, ANLSTC3C and ANLSTC3R), and the JCL to compile, link and bind these programs (or your own) can be found in hiqual.SANLJCL (ANLPLIC, ANLPLIR, ANLCOBC and ANLCOBR).
24
Stored Procedures - Use for Governing, policing and screening queries With the stored procedure interface, you can literally build your own governing into applications. This is especially useful for application programs that allow dynamic SQL, screen scrapers that build queries on the fly – based on user input, or ad hoc reporting requests, to name just a few situations where this level of control may be useful. You can even use it to provide feedback to online users, sending an approximate Wait Time to Completion message back to the screen, while their queries are being processed. You can also implement an ‘Ask the User’ approach: “This query is expected to take 20 minutes, do you want to proceed or cancel the request?” Actually, you can do a lot with the capability of pre-assessing the costs of queries, from rudimentary governing to more sophisticated interactions with the user. Interfacing with other IBM Data Management Tools - Path Checker The interface to Path Checker is accomplished in Batch, by adding the SQL PA JCL to the existing run of Path Checker, and accepting the Path Checker’s DBRM as input to the process. Path Checker and SQL PA have interfaced such that Path Checker will pass only the SQL statements that have met certain screening requirements (change in access path, etc.) to SQL PA for further analysis. SQL PA will then read the specially formatted output of Path Checker and process the SQL found, carrying the reason for Path Checker’s interest in the statements. The Path Checker program is CKPPTHCK and the JCL to execute it, along with SQL PA, is included in the User’s Guide, Appendix D. The Path Checker ANLOUT data set becomes the ANLIN input to SQL PA. Interfacing with other IBM Data Management Tools - Admin Tool The DB2 Admin Tool can invoke SQL PA from the TSO/ISPF launch pad, a special panel in Admin that holds interface points for a variety of DB2 tools, or it can be invoked as a command, during the editing of a set of SQL statements, for instance, using the SPA line command (see ISPF Edit or Browse below). Adding SQL PA to the Admin Launch Pad is performed by executing a REXX exec included with SQL PA (ANLADBI), which calls the SQL PA interface CLIST ANLIAD. Again, the details of inclusion are in the User’s Guide, Appendix D. Interfacing with other IBM Data Management Tools - Query Monitor The DB2 Query Monitor runs as a TSO/ISPF application, and provides monitoring of DB2 subsystems and SQL execution in real time. While an application is under study, users can select the SQL statements being processed and invoke SQL PA directly to evaluate those statements and provide a cost analysis, obtain Advisor warnings and recommendations, etc., by seamlessly connecting to SQL PA under TSO/ISPF. When processing is complete, the user returns to Query Monitor. The ANLIQM CLIST is the interface point to Query Monitor, and the details are in the User’s Guide, Appendix D. Interfacing with other IBM Data Management Tools - Web Query The DB2 Web Query tool enables web-based activity, including the building and evaluation of SQL statements in a workstation or handheld environment. When contemplating SQL that will run on the mainframe, it may be useful to call upon SQL PA and get a feel for the cost of the SQL under development. Web Query has an automatic interface built in that enables a call to the SQL PA stored procedure, which returns the costs, plus warning flags, to the user. The Web Query user can enable the interface by setting the Query Analyze option, as documented in the User’s Guide, Appendix D.
25
Interfacing with other IBM Data Management Tools - ISPF Edit or Browse While writing programs in various programming languages like COBOL or PL/I, users can jump into SQL PA even from an EDIT or BROWSE session under the normal TSO/ISPF interface. To facilitate this, the special SPA edit command has been provided, which operates similarly to the ANL edit command that users normally employ when editing input data sets under SQL PA’s interface. The difference in the edit command SPA is that it will create a temporary environment to run SQL PA under TSO/ISPF, and put the SQL you selected with the PP-PP line number commands into a file called ANLTEMP.SQL, which is transient and will not be saved. However, during the time that you are evaluating under SQL PA, you can modify the SQL and fine tune it to whatever works best for that particular statement. Then, upon exiting SQL PA, you are put back into the ISPF Edit or Browse screen (but not into editing or browsing the file) where you came from originally. This provides a quick way to jump in and out of SQL PA during your program development activities. Under TSO, the SPA clist command is defined as an alias for ANLSPA, and it requires SPATSO, an alias for ANLSPATS clist. Interfacing with other IBM Data Management Tools - Other SQL PA copies via DRDA Let’s not forget the fact that SQL PA can run on any system, and can employ DRDA connectivity to start processing on one machine, connect to another and run the SQL there under SQL PA, using that system’s catalog, etc., and return the answers back to the originating machine for reporting. In order to use SQL PA remotely, it must be installed and bound on each machine in the network where you wish to run. The Bind instructions for ANLPGM31 include an extended package list which enables the plan at the remote locations, but no other special requirements are necessary. Any location name stored in SYSIBM.LOCATIONS is eligible to connect using the VIADRDA parameter, as long as SQL PA is installed there. Section 2. Setting the SQL PA Parameters Batch - ANLCNTL and ANLPARM files There are two separate parameter files used with SQL PA, and the separation is intentional. The ANLCNTL parameters are meant to describe the hardware/software configuration, DB2 installation and other system-oriented details that seldom change and are not generally known by the casual user. On the other hand, the ANLPARM parameters are used to control execution, select options and reporting levels, and dictate a few processing options that are within the knowledge and domain of the individual user. ANLPARM is also home to the new Threshold parameters,Generally, the installation team will create and store the ANLCNTL parms in a library, one set for each individual DB2 Subsystem that you might use as a framework for your analysis. So there might be five or ten different sets of ANLCNTL parms, each describing a unique system for processing your SQL. These might include Test, Production or even hypothetical systems that have not yet been installed, and contain features that may or may not actually be present on the machinery, like hiperpools, hardware assisted sort and data compression, and others. The parameters are described in the sections below. Users can make copies of the hiqual.SANLPARM members ANLCNTL and ANLPARM, customizing the parameters to suit their operational needs. The install team may also provide a PDS library of
26
ANLCNTL parameters that describe the various machine configurations, or direct users to copy members from hiqual.SANLDATA for TSO (see below). TSO - Target Host library and Change Parameters panel The ANLCNTL parameters for TSO/ISPF operation are contained in a special PDS library called hiqual.SANLDATA, whose members are selected by the user on the Change System Parameters panel as the entry labelled Target DB2 Host Member. This entry corresponds to the member name in this PDS that holds the ANLCNTL parameters that describe the system you wish to process your SQL against. When the installation team sets up the entries for each different DB2 subsystem, the configuration parms that describe that system should be stored both here and in the hiqual.SANPARM library, so that they can be accessed by the user community. The user-oriented ANLPARM parameters are entered on the Change User Parameters panel, and allow the user to change settings between evaluations. Users might choose to vary the Buffer Hit Ratio, or change the Attach Method or DASD Subsystem, or select different levels of reporting or advice, etc. All parameter changes are done from this panel. Also, the new Change System Thresholds panel allows users to modify the thresholds for many of the Advisor settings. The latest settings of all the parameters are always displayable by choosing the Show Current Parms option on the Main Control panel, so that users can see how the current values are set for all three parameter sets. QMF - built into ANLGOV1 When processing under QMF, however, a different approach is used. The primary purpose of SQL PA interaction with QMF is to find queries that will run too long before they begin execution, and give the user an opportunity to cancel them. To do this, SQL PA intercepts and evaluates the cost of each query sent through the QMF system, running in the background, which requires fast and efficient processing with a minimal impact on performance. Therefore, all of the file I/O is eliminated and everything is done internally or in memory, to keep SQL PA’s QMF component running at optimum speed. Instead of reading parameters from a file with each evaluation, the parameters which describe the configuration and the QMF user’s limits are hard-coded into the interface program, ANLGOV1. This program is provided in source code, so the installation team can set all the parameters that describe this particular system. Since the QMF subsystem is running on a specific machine, its exact configuration can be described, and the limits set for the QMF user will determine when warning notes are issued, and the opportunity to cancel is presented. There is no need to vary the configuration parms here to describe hypothetical situations – you want to describe exactly the machine where QMF is running. The ANLGOV1 program links into the IBM QMF Governor program (DSQUEGV1), which normally executes from a QMF Load library or an Exit library. This library may be allocated as file ISPLLIB in your CLIST or REXX execs, and that allows you to create multiple copies of the QMF Governor exit program (DSQUEGV1), each with perhaps different limits. Thus, various classes of QMF users can be controlled with different levels of high water marks for CPU Time, Elapsed Time, I/O Calls, Query Units (Qunits) or Monetary values before the Warning messages for cost overruns are presented. Stored Procedures - pass list to ANLPRC3C and ANLPRC3R in a host variable The ANLCNTL parameters describing the system are copied into a standalone file and allocated to the DB2 stored procedures address space (DSNSPAS) or the WLM-controlled address space (WLMSPAS)
27
during installation. That set of parameters describes the actual system configuration where the stored procedure (ANLPRC3C or ANLPRC3R) is running. The user parms (ANLPARM) are set in a host variable by the user and passed as one of the parameters during the call to the SQL PA stored procedure. The sample programs ANLSTP3C, ANLSTC3C, ANLSTP3R and ANLSTC3R (described earlier) illustrate how to set these parms internally, pass them to the procedure, read them from a file, etc. The user may send up to 15 different parameters to the stored procedure, to specify the DASD subsystem, DB2 release level, buffer hit ratio, etc. The stored procedure’s main focus is to return the costs of each SQL statement evaluated, including warning flags for overruns, and the DB2 and program return codes. At present, it does not return any Advice, or explain or catalog information that is provided by the TSO or Batch interfaces, so there is no need to set the ADVISOR parm. REPORTS STP is the normal setting for the stored procedures and the parameter list appears as the third parameter in the stored procedure call for either DB2 or WLM environments. ANLCNTL Parameters The installation team will set ANLCNTL parameters that describe the Hardware/Software environment with Configuration Parameters as follows: MIPRATE, ENGINES, SRMCONS, LPARENG These first four parameters are used to set the CPU processing rate of the computer system. MIPS is an acronym for Millions of Instructions Per Second and the MIPRATE of a computer describes how many millions of instructions can be processed by the machine. It has long been a gauge of processing power, and although the MIPS rate varies by workload mix and other factors, vendors generally regard it as one measure of CPU performance. The MIPRATE describes the total processing power of a machine, but today’s machines can have several CPU ENGINES (4, 6, 10, 12, etc.) and each of those engines operates at a set level (millions of instructions per second), the aggregate of which is the total MIPRATE. Sometimes, a physical machine is split into several logical partitions (LPARs), to form separate systems that can process work independently. A large z/900 2064-110 machine, with 10 engines, might be split into 3 logical machines, with 4, 4 and 2 engines respectively. The LPARENG parm tells SQL PA how many of the CPU engines are operating on this particular LPAR. Suppose that you were setting up parameters to describe a four engine LPAR carved from the 2064-110 model called SYSA. You would then set the parms as follows: MIPRATE 2016.000 The total MIPS for z/900 2064-110 ENGINES 10.000 There are 10 CPU engines on the model 110 LPARENG 4.000 Four of these engines form “SYSA” SRMCONS 9334.09 The SRM constant for this machine The last parm, SRMCONS, is a measure of how many service units each CPU engine can provide per SRM Second. The MVS System Resource Manager apportions service among all the users, and this number is a measurement of how much service a CPU engine can provide. It too, like the MIPS, is an important and consistent measurement of overall CPU performance, and can be obtained through a methodology outlined in Appendix B of the Installation Guide, or from vendor CPU publications and performance ratings.
28
The SRMCONS parm is only used when the MIPRATE and ENGINES parameters are not available, or set to zero. It is generally a bit more conservative in estimating processing power, but can be very handy in basing projections on systems that are LPAR’ed in weighted distributions, or where figures on LPAR machines are not readily available, as truer indications of actual performance. SUBSYST, ESASORT, ESACOMP, DYNAMIC, SETPLAN, ANLKEYS The DB2 subsystem name (default DSN ) is of paramount importance when describing the system that you are going to run against – SQL PA will issue the Call Attach Facility OPEN macro to connect to the DB2 subsystem named here. Thus, SUBSYST should hold the actual name of the subsystem that you are using for SQL PA processing. The ESACOMP and ESASORT parameters specify whether this machine has the hardware-assisted data compression and sort features installed. These system-dependent features make DB2 sorting and data compression run much faster, as there is firmware imbedded that allows speedier processing than traditional software emulation. SQL PA will take this into account with reduced path length for these operations. Incidentally, the path length is an estimated instruction count, literally the number of instructions that DB2 will have to execute to complete processing of the SQL, which can run into the millions of instructions. When mapped against a MIPRATE (millions of instructions per second) for a CPU engine, we can estimate the actual CPU seconds necessary to process the SQL. The DYNAMIC parm describes whether Dynamic Statement Cache is being used on this system, and it will influence the path length of Preparing dynamic SQL, presuming that the statement is cached and therefore much of the Prepare path length will be eliminated. SETPLAN allows users to specify a high level qualifier for a specific PLAN_TABLE and other explain tables (DSN_STATEMNT_TABLE, e.g.) to be used with SQL PA processing. Normally, SQL PA is installed with a set of reusable generic tables under secondary authids ANLUSER1–n, which are shared by all users. The generics eliminate the need for each user to have a separate set of tables, but also require the establishment of secondary authids for universal access. Some installations bypass this step, and let users employ their own Explain tables, or use those under a different secondary authid. This parameter either allows or disallows the capability for users to specify their own high level qualifier for the PLAN_TABLE, the DSN_STATEMENT_TABLE and other explain tables to be used by SQL PA. The ANLKEYS parm has been previously described already, under TSO - Capacity Planning, and is also part of the ANLCNTL parameters. BUFFERS, BUFF08K, BUFF16K, BUFF32K, SORTBUF The first four parameters describe the size of the typical 4K, 8K, 16K and 32K buffer pools to be used by the application’s SQL, and the Sort parameter describes the size of the sort work buffer pool. In general, prefetch I/O into the buffer pools is done in a set number of pages, which can vary by the size of the pool. For the 4K buffer pools, those DB2 settings are as follows for a Prefetch I/O: DB2 will prefetch only 8 pages per prefetch if the buffer pool is 1-223 4K pages in size; it will prefetch 16 pages per call if the pool is 224-999 4K pages, and 32 pages will be prefetched if the 4K pool is 1000 or more pages in size. SQL PA uses these values for all the pool sizes (including sort work) to determine how many pages will be supported per prefetch I/O call, and therefore how many prefetch calls are necessary to read in all the pages required.
29
DATASHR, DSGROUP These two parameters simply adjust the CPU figures for the overhead of running in a data sharing environment. DATASHR specifies the percentage of your workload that participates in data sharing, on average, while DSGROUP tells the number of members in the data sharing group. If data sharing is not part of your environment, set them both to zero. The installation team will also set the typical cost limits for SQL statements, which set the high water marks for the WARNING messages when overruns occur: CPUTIME, ELAPSED, IOCALLS, COSTING, COSTQUN The CPUTIME and ELAPSED time are set in seconds, so a value of 120 indicates 120 seconds, or 2 minutes. The IOCALLS are for total I/Os issued, including both synchronous and prefetch reads. The COSTING is a monetary value related to the charge back figures below. It can be used to represent the cost in Dollars, Euros, or whatever currency you choose, normally a decimal value (now four decimal places in Version 2). The COSTQUN for Query Units (Qunits) sets a limit for these pseudo-service unit values, normally an integer value. All of these parameters, when exceeded, will cause Warning messages for CPU, Elapsed, I/O, Qunits and Monetary Cost overruns to be produced by SQL PA. The CPU, Elapsed Time, I/O and Qunits values operate independently. When PRECISE YES is chosen (and the estimates are provided by the DB2 optimizer) only the CPU and Service Units (CPUTIME and COSTQUN) limits are flagged by SQL PA, since these are the only two values provided by the optimizer.
In evaluating the COSTING limit above, SQL PA takes the following parameters into account when computing the Monetary Cost, which also can be used to forecast charge back values: CPUCOST, IOSCOST, TIMCOST, MONEYIS, CURRSYM The CPUCOST is the monetary value assigned to one hour of CPU Time, which is illustrated in the sample parameters at $500.00 per hour. The IOSCOST is based on I/O counts, and represents the cost of issuing 1000 I/O calls, including writes for Insert, Update and Delete, charged $10.00 per thousand in the sample. The TIMCOST is Elapsed Time, representing one hour of elapsed time, or fraction thereof, set at $10.00 per hour in the sample. Users may leave some of these parameters out of the cost computation by setting them to zero. The national currency can be specified by the MONEYIS parm (the name of the currency – DOLLARS, EUROS, POUNDS, etc.) and the symbol used for national currency, if available, by the CURRSYM ($ is common). ANLPARM Parameters
There are several parameters that allow the user to set the run time environment: VERSION, CONNECT, DEGREES, REFRESH, SUBVERS VERSION specifies which version of DB2 the SQL will run against. While you can specify a version other than the current (i.e., choosing V8R1 while running on V7R1) the exposure is that the access path might change when evaluated under the optimizer of that other release and, therefore, the answer
30
may not be accurate in practice. Also, this release of SQL PA will automatically detect and correct the VERSION parm, if it is incorrectly set. Now, if you want to intentionally process under a different release, set the PROCESS ASIS parameter, too (see below). Valid versions are V8R1 (any mode), V7R1, V6R1 and V6R2 (representing the refresh release of V6). The CONNECT parm indicates which attach facility will be used to connect to DB2 when the application is actually run – this might be a flavor of IMS, or CICS, DSN or CAF or something else. DEGRESS ANY allows the optimizer to consider parallelism during the Prepare of the SQL statements, while a value of ONE does not. Unless you are specifically trying to discourage parallelism, this value should always be set to ANY. REFRESH applies only to V8 New Function Mode (NFM) and allows the optimizer to consider materialized query tables (MQTs) as access paths. The SUBVERS parm identifies which DB2 release you are currently processing on, and selects appropriate catalog access SQL for that version of DB2, primed for optimal performance. With different lengths for many of the catalog variables in V8, the V7 host variables that contain them must be tailored to V7 sizes, or the optimizer will reject indexed access and cause performance delays. STORAGE, BUFFHIT, HPOOLRD The STORAGE parameter sets the type of DASD storage subsystem that will be employed on the system when the SQL is operational. The DASD might be disks, like the 3390-2 or 3390-3, or it might be solid state or high speed storage subsystems, like EMC, STK, RAMAC, or the ESS subsystem, where models ESSE20, ESSF20, ESS800 and ESS80T (turbo) are supported by this parameter. The choice of the storage subsystem has a dramatic effect on Elapsed Time estimates, since the I/O estimated are modeled against the speed of the DASD devices. The BUFFHIT parm allows users to say what percentage of their pages will be found in the buffer pools, so that SQL PA will assume that disk I/O is not necessary for those pages. This can be a powerful device in achieving the correct estimate of response time. For those users who also deploy hiperpools in expanded storage, the hiperpool hit ratio can be specified using the HPOOLRD parameter. Thus, for all the I/O estimated, some percentage of pages will be found in the buffer pool, perhaps others in the hiperpool, and the remaining I/O must go to the disk storage subsystem. Zero values for BUFFHIT and HPOOLRD will make every I/O a physical I/O, and all requests will be modeled as if they went to the DASD subsystem. Hiperpools do not exist in V8, and the parameter is ignored for that DB2 release. NEWSTOR, NEWSEEK, NEWROTA, NEWXFER The list of supported STORAGE devices and subsystems can be found in Appendix C of the Installation Guide, or under the TSO/ISPF interface within the product’s Help Tutorial. Sometimes, between releases of SQL PA, a new device type may be announced that you wish to represent. In these cases, use the NEWSTOR parm to set the name of this new device, and NEWSEEK, NEWROTA and NEWXFER to specify the average Seek Time (in seconds), Rotational Delay (one half of the time its takes for a disk revolution in seconds, or zero if solid state) and the Transfer Rate in kilobytes per second. When using this approach, set STORAGE NEWDSK and then set up your disk subsystem with these parameters. Some parameters help set the operational aspects of the SQL PA run, allowing users to choose where and how to process SQL, how to handle missing information, and more:
31
VIADRDA, DBRMKEY, USEPLAN, RETCODE, QUALIFY, DELIMIT The VIADRDA parm allows you to connect to another DB2 subsystem and run SQL PA remotely. Suppose that you are signed on to test SYSA, but the SQL you want to evaluate is actually going to run on production SYSB. To do this, set the VIADRDA to the location name for SYSB and run your job on SYSA. SQL PA will set up a DRDA connection to the location specified, and run the entire set of SQL over there, using SYSB’s catalog and SYSB’s optimizer. The results will return to SYSA, where it originated. The DBRMKEY parameter is used when you want to evaluate many members of a DBRM library in a single run, instead of one at a time. The key is a filter for the names of the members in the DBRM PDS, and up to 200 of these members can be processed in a single SQL PA run. Then, the QLIMIT report can be examined, and the SQL which has been flagged for excessive cost can be evaluated more closely and studied in detail. The wild card characters are the asterisk (*), representing a number of character positions, and the percent sign (%), representing a single position. The member names will appear in the output reports, so that each SQL statement can be precisely located within the programs. The USEPLAN parm specifies the authid that owns a PLAN_TABLE and possibly other explain tables (DSN_STATEMENT_ TABLE, e.g.) to use as alternatives to the generic tables normally installed with SQL PA. The SETPLAN parm in ANLCNTL allows or denies users the ability to employ the USEPLAN parm. Either your own authid can be used here, or a valid secondary authid which owns these tables can be employed. In this release, if a user does not have the appropriate PLAN_TABLE, or is missing any of the other explain tables that might be required by the processing requests (PRECISE parm will drive this), then SQL PA will automatically generate the missing explain tables for the duration of the execution. The tables will be generated to be complimentary to the release of DB2 specified in the VERSION parameter, yet another reason to code that parameter correctly. The QUALIFY parameter allows users to specify the name of a high level qualifier to put in front of any unqualified table names. SQL PA will perform the substitution automatically. However, when this parameter is left blank, that is a special indication that Synonyms are in use and SQL PA should not do the substitution, since synonyms are local to the user. When the synonym situation occurs, the user has to own a PLAN_TABLE, because SQL PA cannot change the Current SQLID to one of the generics or secondaries, since processing under those authids DB2 will not recognize the synonym (local use only). In V8 NFM, long qualifiers, table and index names are possible, up to 128 characters in all. The QUALIFY parameter may specify a long name for use as the ‘owner’ of a table being evaluated. RETCODE changes the normal return codes for the ANLPGM31 and other SQL PA programs into levels reflecting the warning and error messages produced by the SQL Advisor and cost overruns. Some users automate the process and rely on checking the program return codes to decide if a further look at the detail is warranted. DELIMIT QUOTE is a special parameter used to process COBOL-generated SQL that uses the quotation marks (“) instead of single quotes (‘) to delimit literal strings (COL = “value”). If your system normally recognizes the apostrophe or single quote as the default delimiter, the use of quotation marks will cause an SQL error code –206 during the Prepare. This error can be easily circumvented by
32
employing this parm, which will convert the quotation marks to single quotes before Preparing the SQL. Other SQL is unaffected. Finally, there are some parameters which control the setting of reporting preferences, and the amount of information produced by the program: REPORTS, SHOWALT, PRECISE, ADVISOR The REPORTS parm indicates which reports should be produced: YES (or ONE or LOG) will produce only the Cost Summary report, while a value of EXP (or TWO or REP) will produce the Enhanced Explain report, and ALL (or TRE or DET) will also create the Detailed Trace report. The QLIMIT report is always produced. If the user wants to know which other indexes are available for access, even though the optimizer chose not to employ them, the SHOWALT parameter can be very revealing. It provides the key statistics on these indexes and their keys, to give users food for thought about alternatives to try by influencing the optimizer in new directions with modified predicates, etc. The PRECISE parm selects a costing method for the run: NO (the default) uses standard computations, with path lengths drawn from independent benchmarks of DB2 releases, and factors in all of the overhead associated with running the SQL, including attach connections, writing out to the log and disk records for insert, update and delete, etc. A value of YES will use the CPU Time and Service Unit estimates from the optimizer found in the DSN_STATEMNT_TABLE, ignoring the other overheads and I/O, and focus the costs based just on the CPU Time alone. A value of ALL will cause additional optimizer data to materialize, like the predicate analysis reports, and will employ the composite predicate filter factor and query cardinality estimates from the optimizer’s own calculations, mapped against SQL PA’s real world cost algorithms based on the catalog table and index sizes. The ADVISOR level specifies how much advice the user wants included in the Enhanced Explain and Detailed Trace reports. A value of NO (the default) just gives the critical Warnings and Alerts, while a value of YES will add Performance Notes and Recommendations for improving your SQL. A value of ALL will produce Guidelines as well as Good News, excellent for training those new to DB2 coding as it informs and educates the user with context and release sensitive information. PROCESS, NLSCODE, COMMENT PROCESS ASIS will turn off the program’s automatic DB2 version recognition capability. If the user has coded a VERSION parm indicating a DB2 release that is different than the actual version under which the program is running, the VERSION parameter is reset automatically to the actual version and the message ANL2021W is generated. If the user wants SQL PA to process the Version parm ASIS, regardless of the actual version (computing certain costs based on a particular DB2 release level) then the PROCESS ASIS parm can be coded, which turns off auto-version recognition. Some DBRM modules are created or modified by third party software products, and sometimes these modifications can combine several packages or plans into one module, or create DBRMs with statement sequence numbers out of sequential order. SQL PA expects the statement numbers in DBRMs to always be sequential (as the prepared and explained plans are ordered by Queryno) and will generate ANL2003E Synchronization Errors when this is not the case. Specify PROCESS NOSEQ to indicate that the DBRM contains statement numbers that are not sequential. When coded, PROCESS
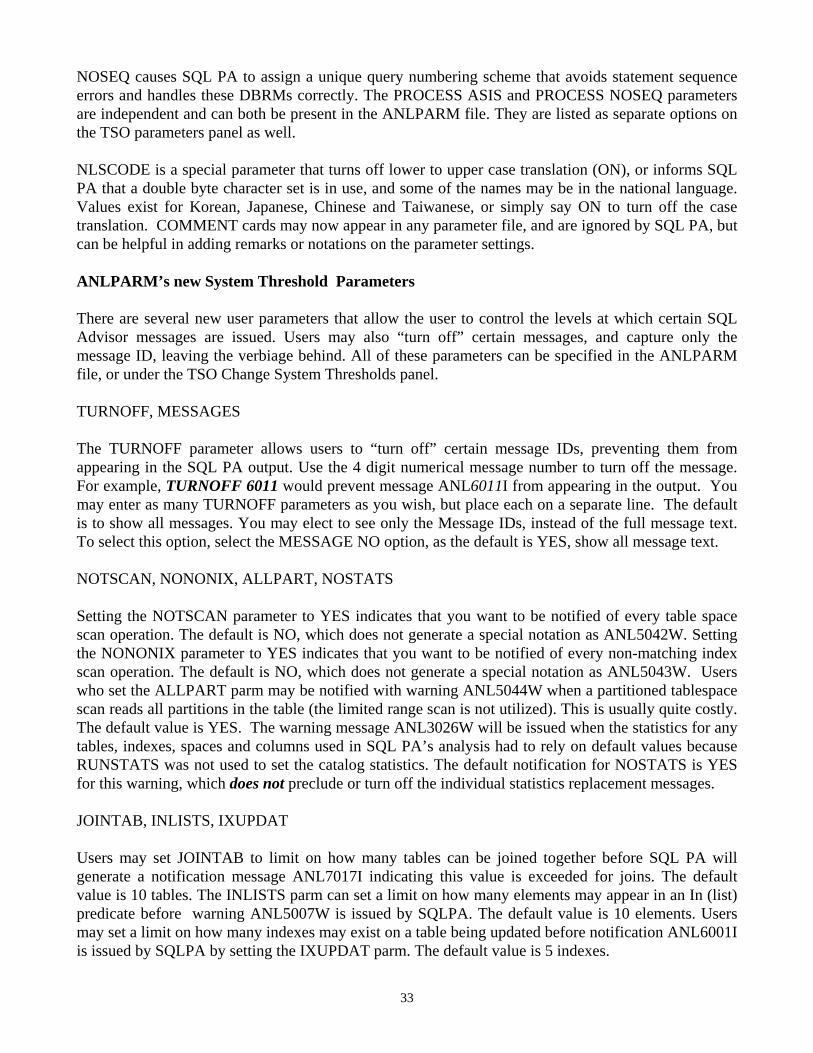
33
NOSEQ causes SQL PA to assign a unique query numbering scheme that avoids statement sequence errors and handles these DBRMs correctly. The PROCESS ASIS and PROCESS NOSEQ parameters are independent and can both be present in the ANLPARM file. They are listed as separate options on the TSO parameters panel as well. NLSCODE is a special parameter that turns off lower to upper case translation (ON), or informs SQL PA that a double byte character set is in use, and some of the names may be in the national language. Values exist for Korean, Japanese, Chinese and Taiwanese, or simply say ON to turn off the case translation. COMMENT cards may now appear in any parameter file, and are ignored by SQL PA, but can be helpful in adding remarks or notations on the parameter settings. ANLPARM’s new System Threshold Parameters
There are several new user parameters that allow the user to control the levels at which certain SQL Advisor messages are issued. Users may also “turn off” certain messages, and capture only the message ID, leaving the verbiage behind. All of these parameters can be specified in the ANLPARM file, or under the TSO Change System Thresholds panel. TURNOFF, MESSAGES The TURNOFF parameter allows users to “turn off” certain message IDs, preventing them from appearing in the SQL PA output. Use the 4 digit numerical message number to turn off the message. For example, TURNOFF 6011 would prevent message ANL6011I from appearing in the output. You may enter as many TURNOFF parameters as you wish, but place each on a separate line. The default is to show all messages. You may elect to see only the Message IDs, instead of the full message text. To select this option, select the MESSAGE NO option, as the default is YES, show all message text. NOTSCAN, NONONIX, ALLPART, NOSTATS Setting the NOTSCAN parameter to YES indicates that you want to be notified of every table space scan operation. The default is NO, which does not generate a special notation as ANL5042W. Setting the NONONIX parameter to YES indicates that you want to be notified of every non-matching index scan operation. The default is NO, which does not generate a special notation as ANL5043W. Users who set the ALLPART parm may be notified with warning ANL5044W when a partitioned tablespace scan reads all partitions in the table (the limited range scan is not utilized). This is usually quite costly. The default value is YES. The warning message ANL3026W will be issued when the statistics for any tables, indexes, spaces and columns used in SQL PA’s analysis had to rely on default values because RUNSTATS was not used to set the catalog statistics. The default notification for NOSTATS is YES for this warning, which does not preclude or turn off the individual statistics replacement messages. JOINTAB, INLISTS, IXUPDAT Users may set JOINTAB to limit on how many tables can be joined together before SQL PA will generate a notification message ANL7017I indicating this value is exceeded for joins. The default value is 10 tables. The INLISTS parm can set a limit on how many elements may appear in an In (list) predicate before warning ANL5007W is issued by SQLPA. The default value is 10 elements. Users may set a limit on how many indexes may exist on a table being updated before notification ANL6001I is issued by SQLPA by setting the IXUPDAT parm. The default value is 5 indexes.
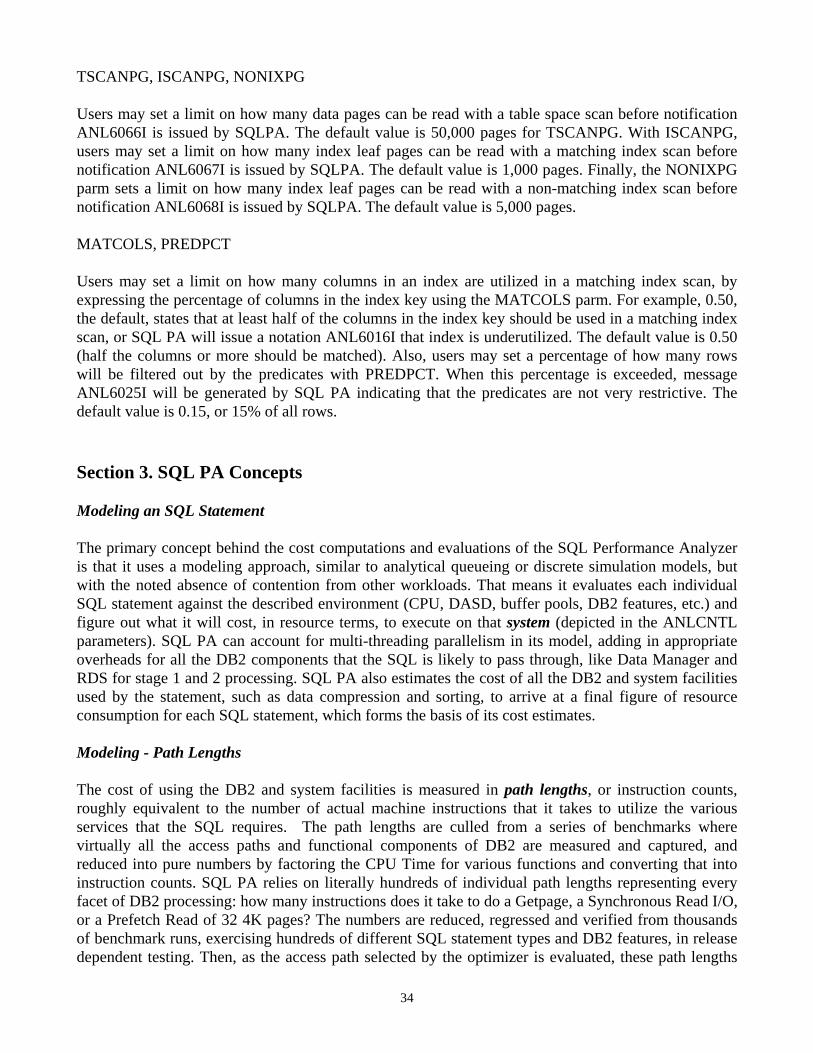
34
TSCANPG, ISCANPG, NONIXPG Users may set a limit on how many data pages can be read with a table space scan before notification ANL6066I is issued by SQLPA. The default value is 50,000 pages for TSCANPG. With ISCANPG, users may set a limit on how many index leaf pages can be read with a matching index scan before notification ANL6067I is issued by SQLPA. The default value is 1,000 pages. Finally, the NONIXPG parm sets a limit on how many index leaf pages can be read with a non-matching index scan before notification ANL6068I is issued by SQLPA. The default value is 5,000 pages. MATCOLS, PREDPCT Users may set a limit on how many columns in an index are utilized in a matching index scan, by expressing the percentage of columns in the index key using the MATCOLS parm. For example, 0.50, the default, states that at least half of the columns in the index key should be used in a matching index scan, or SQL PA will issue a notation ANL6016I that index is underutilized. The default value is 0.50 (half the columns or more should be matched). Also, users may set a percentage of how many rows will be filtered out by the predicates with PREDPCT. When this percentage is exceeded, message ANL6025I will be generated by SQL PA indicating that the predicates are not very restrictive. The default value is 0.15, or 15% of all rows. Section 3. SQL PA Concepts Modeling an SQL Statement The primary concept behind the cost computations and evaluations of the SQL Performance Analyzer is that it uses a modeling approach, similar to analytical queueing or discrete simulation models, but with the noted absence of contention from other workloads. That means it evaluates each individual SQL statement against the described environment (CPU, DASD, buffer pools, DB2 features, etc.) and figure out what it will cost, in resource terms, to execute on that system (depicted in the ANLCNTL parameters). SQL PA can account for multi-threading parallelism in its model, adding in appropriate overheads for all the DB2 components that the SQL is likely to pass through, like Data Manager and RDS for stage 1 and 2 processing. SQL PA also estimates the cost of all the DB2 and system facilities used by the statement, such as data compression and sorting, to arrive at a final figure of resource consumption for each SQL statement, which forms the basis of its cost estimates. Modeling - Path Lengths The cost of using the DB2 and system facilities is measured in path lengths, or instruction counts, roughly equivalent to the number of actual machine instructions that it takes to utilize the various services that the SQL requires. The path lengths are culled from a series of benchmarks where virtually all the access paths and functional components of DB2 are measured and captured, and reduced into pure numbers by factoring the CPU Time for various functions and converting that into instruction counts. SQL PA relies on literally hundreds of individual path lengths representing every facet of DB2 processing: how many instructions does it take to do a Getpage, a Synchronous Read I/O, or a Prefetch Read of 32 4K pages? The numbers are reduced, regressed and verified from thousands of benchmark runs, exercising hundreds of different SQL statement types and DB2 features, in release dependent testing. Then, as the access path selected by the optimizer is evaluated, these path lengths
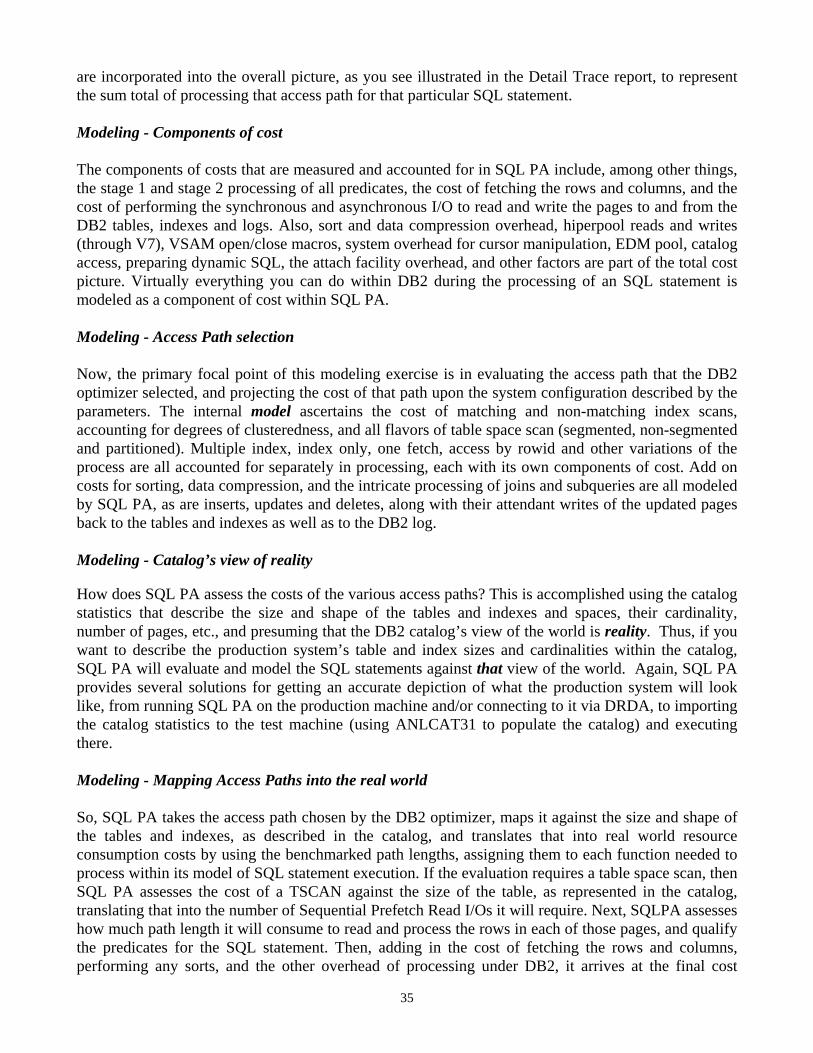
35
are incorporated into the overall picture, as you see illustrated in the Detail Trace report, to represent the sum total of processing that access path for that particular SQL statement. Modeling - Components of cost The components of costs that are measured and accounted for in SQL PA include, among other things, the stage 1 and stage 2 processing of all predicates, the cost of fetching the rows and columns, and the cost of performing the synchronous and asynchronous I/O to read and write the pages to and from the DB2 tables, indexes and logs. Also, sort and data compression overhead, hiperpool reads and writes (through V7), VSAM open/close macros, system overhead for cursor manipulation, EDM pool, catalog access, preparing dynamic SQL, the attach facility overhead, and other factors are part of the total cost picture. Virtually everything you can do within DB2 during the processing of an SQL statement is modeled as a component of cost within SQL PA. Modeling - Access Path selection Now, the primary focal point of this modeling exercise is in evaluating the access path that the DB2 optimizer selected, and projecting the cost of that path upon the system configuration described by the parameters. The internal model ascertains the cost of matching and non-matching index scans, accounting for degrees of clusteredness, and all flavors of table space scan (segmented, non-segmented and partitioned). Multiple index, index only, one fetch, access by rowid and other variations of the process are all accounted for separately in processing, each with its own components of cost. Add on costs for sorting, data compression, and the intricate processing of joins and subqueries are all modeled by SQL PA, as are inserts, updates and deletes, along with their attendant writes of the updated pages back to the tables and indexes as well as to the DB2 log. Modeling - Catalog’s view of reality How does SQL PA assess the costs of the various access paths? This is accomplished using the catalog statistics that describe the size and shape of the tables and indexes and spaces, their cardinality, number of pages, etc., and presuming that the DB2 catalog’s view of the world is reality. Thus, if you want to describe the production system’s table and index sizes and cardinalities within the catalog, SQL PA will evaluate and model the SQL statements against that view of the world. Again, SQL PA provides several solutions for getting an accurate depiction of what the production system will look like, from running SQL PA on the production machine and/or connecting to it via DRDA, to importing the catalog statistics to the test machine (using ANLCAT31 to populate the catalog) and executing there. Modeling - Mapping Access Paths into the real world So, SQL PA takes the access path chosen by the DB2 optimizer, maps it against the size and shape of the tables and indexes, as described in the catalog, and translates that into real world resource consumption costs by using the benchmarked path lengths, assigning them to each function needed to process within its model of SQL statement execution. If the evaluation requires a table space scan, then SQL PA assesses the cost of a TSCAN against the size of the table, as represented in the catalog, translating that into the number of Sequential Prefetch Read I/Os it will require. Next, SQLPA assesses how much path length it will consume to read and process the rows in each of those pages, and qualify the predicates for the SQL statement. Then, adding in the cost of fetching the rows and columns, performing any sorts, and the other overhead of processing under DB2, it arrives at the final cost
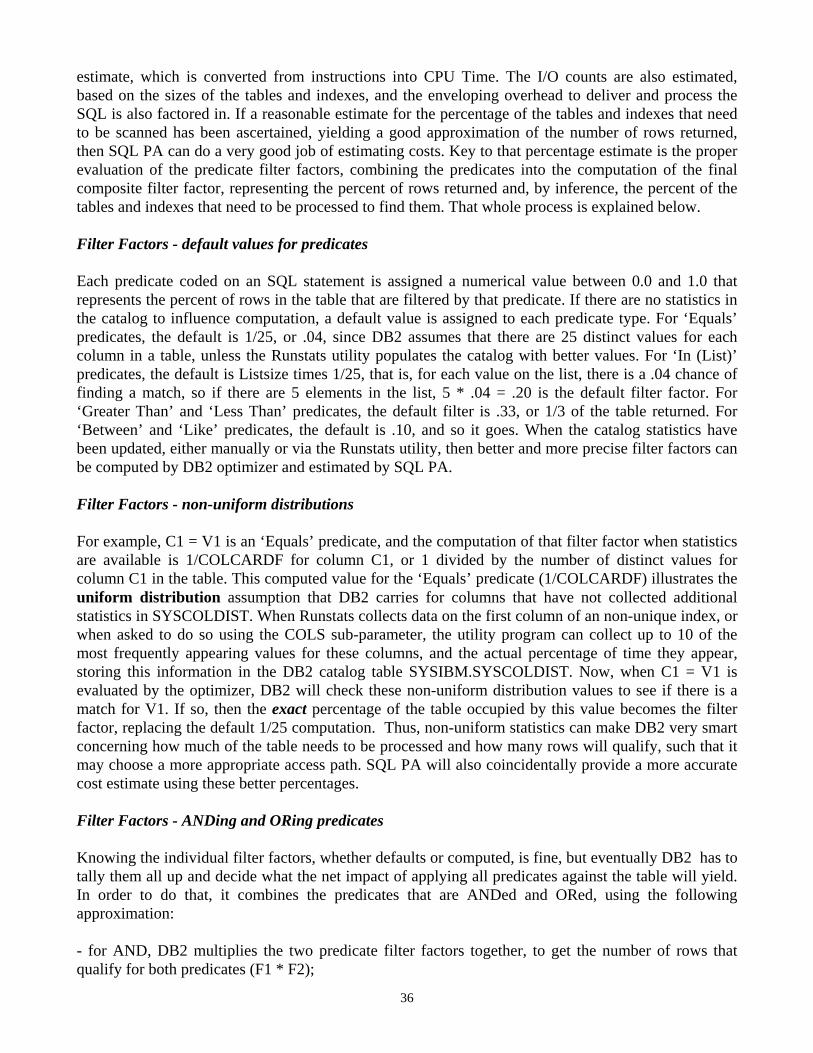
36
estimate, which is converted from instructions into CPU Time. The I/O counts are also estimated, based on the sizes of the tables and indexes, and the enveloping overhead to deliver and process the SQL is also factored in. If a reasonable estimate for the percentage of the tables and indexes that need to be scanned has been ascertained, yielding a good approximation of the number of rows returned, then SQL PA can do a very good job of estimating costs. Key to that percentage estimate is the proper evaluation of the predicate filter factors, combining the predicates into the computation of the final composite filter factor, representing the percent of rows returned and, by inference, the percent of the tables and indexes that need to be processed to find them. That whole process is explained below.
Filter Factors - default values for predicates Each predicate coded on an SQL statement is assigned a numerical value between 0.0 and 1.0 that represents the percent of rows in the table that are filtered by that predicate. If there are no statistics in the catalog to influence computation, a default value is assigned to each predicate type. For ‘Equals’ predicates, the default is 1/25, or .04, since DB2 assumes that there are 25 distinct values for each column in a table, unless the Runstats utility populates the catalog with better values. For ‘In (List)’ predicates, the default is Listsize times 1/25, that is, for each value on the list, there is a .04 chance of finding a match, so if there are 5 elements in the list, 5 * .04 = .20 is the default filter factor. For ‘Greater Than’ and ‘Less Than’ predicates, the default filter is .33, or 1/3 of the table returned. For ‘Between’ and ‘Like’ predicates, the default is .10, and so it goes. When the catalog statistics have been updated, either manually or via the Runstats utility, then better and more precise filter factors can be computed by DB2 optimizer and estimated by SQL PA. Filter Factors - non-uniform distributions For example, C1 = V1 is an ‘Equals’ predicate, and the computation of that filter factor when statistics are available is 1/COLCARDF for column C1, or 1 divided by the number of distinct values for column C1 in the table. This computed value for the ‘Equals’ predicate (1/COLCARDF) illustrates the uniform distribution assumption that DB2 carries for columns that have not collected additional statistics in SYSCOLDIST. When Runstats collects data on the first column of an non-unique index, or when asked to do so using the COLS sub-parameter, the utility program can collect up to 10 of the most frequently appearing values for these columns, and the actual percentage of time they appear, storing this information in the DB2 catalog table SYSIBM.SYSCOLDIST. Now, when C1 = V1 is evaluated by the optimizer, DB2 will check these non-uniform distribution values to see if there is a match for V1. If so, then the exact percentage of the table occupied by this value becomes the filter factor, replacing the default 1/25 computation. Thus, non-uniform statistics can make DB2 very smart concerning how much of the table needs to be processed and how many rows will qualify, such that it may choose a more appropriate access path. SQL PA will also coincidentally provide a more accurate cost estimate using these better percentages. Filter Factors - ANDing and ORing predicates Knowing the individual filter factors, whether defaults or computed, is fine, but eventually DB2 has to tally them all up and decide what the net impact of applying all predicates against the table will yield. In order to do that, it combines the predicates that are ANDed and ORed, using the following approximation: - for AND, DB2 multiplies the two predicate filter factors together, to get the number of rows that qualify for both predicates (F1 * F2);
37
- for OR, DB2 adds the two predicate filter factors together, to get the number of rows that qualify for either one predicate or the other, and then subtracts out the duplicates, by subtracting the product that was just computed above for ANDing ( (F1 + F2) – (F1 * F2) ) . Generally, DB2 processes Stage 1 before Stage 2 predicates, performs ANDs before ORs and respects the parentheses to order the predicates, which otherwise have a specific pecking order for evaluation. The matching indexable predicates come first (left to right), followed by the Stage 1 predicates which can be screened against the resulting index rid list. Next, the data pages are read and the Stage 1 predicates are applied in specific order (Equals, In (list), Is Null, range predicates, etc.), followed by the Stage 2 predicates. Filter Factors - composite (final) filter factor Doing this for all predicates in the proper order DB2 ultimately arrives at the final composite filter factor, representing the cumulative effect of all the predicates in the query. That percentage of the total table can be used to figure how many pages are read, how many rows are returned, etc. and form the basis for SQL PA’s cost estimates. The more accurate your catalog statistics are, the better the DB2 optimizer and SQL PA will be able to assess the proper SQL costs.
Translating relative cost into real world cost The DB2 optimizer is a relative cost optimizer, dealing in units called Timerons, which are part CPU path length (normalized), part I/O count (liberalized), part overhead for functions like sorting and compression, etc. The relative cost estimator produces a single relative number to represent overall cost. It is not directly translatable into real world costs or resource consumption, like CPU Time, or the number of I/Os. SQL PA’s job is to take the relative cost estimate of the optimizer and turn it into a real world cost estimate, complete with CPU Time, Elapsed Time, I/O, Query Service Units (Qunits) and the Monetary equivalent of using those resources. PRECISE NO (full costing of SQL) The PRECISE parameter, when set to NO (the default), will use the full benchmarked path length repertoire of SQL PA to assess all the resource consumption costs (CPU, Elapsed, I/O, Qunits) and the charge back monetary cost, in all the components we have described above. PRECISE YES (Optimizer CPU only) When PRECISE is set to YES, then SQL PA will employ the DB2 optimizer’s CPU and Service Unit estimates only in the cost assessment. In this case, some overhead processing may be missing, as DB2 just estimates the cost of the actual data access portion of the processing. These values are culled from the DSN_STATEMNT_TABLE written by the optimizer during Explain. Sometimes, these estimates may be incomplete, as Triggers, default catalog statistics, Referential Integrity and other influences may be left unaccounted for. PRECISE ALL (Optimizer and SQL PA)
38
When PRECISE is set to ALL, then SQL PA will employ the DB2 optimizer’s estimates for query cardinality (the number of rows expected) and the actual computed composite filter factor, which includes PTC, non-uniform distributions, etc. to arrive at a very precise estimate of the likely costs, when mapping the access paths against the sizes of the tables and indexes. This is as close as it gets. Section 4. Validation Comparing estimates to actuals - CPU Time When comparing SQL PA’s estimates to the real world measurements, the best and most consistent gauge would be CPU Time. Looking at the CPU Time accumulated for each query in the DB2 PM report, or using an online mechanism like Query Monitor, the actual CPU Time can be gathered for the SQL Statements under study. This can be compared to the estimated CPU Time provided by SQL PA, which should be in the same ballpark most of the time. There are reasons why SQL PA and the actual times differ, and this is mostly concentrated around two main issues: the presence (and correctness) of catalog statistics at the column, table and index level, and the type of predicates used in the query, some of which require the use of default filter factors, regardless of statistics. Thus, better and more reliable estimations are provided by the SQL PA when accurate, up-to-date statistics are available to describe the components used in the query. ANLKEYS – what does it do? This parameter is only used for Capacity Planning, and its primary use is to allow users to roll up a multiple of the individual cost estimates for SQL statements, by eliminating the repetitive overhead path length that is included with each estimate. If you wanted to evaluate 10,000 executions of a single SQL statement within an application, you don’t want to count the DB2 Call Attach and thread management path length 10,000 times – rather, count it once by specifying ANLKEYS 02000 in the ANLCNTL set of parameters. This parm eliminates certain recurring overheads so that the CPU estimates can be rolled up by straight multiplication. Another occasional value for ANLKEYS is 10000, which causes SQL PA to display only the part of the CPU Time normally attributed to the user, dropping the CPU charges usually absorbed by DB2 in its own address spaces. This may be significant for Insert, Update and Delete, where SQL PA will assess the costs of writing the records back to the DASD subsystem, even though the user can terminate the connection before the actual writing takes place (it is usually scheduled at checkpoint time, flushing the buffer pools of the updated pages). That could have some impact on the overall CPU estimates seen when matching back to validate against actual data (Class 1 CPU Time). Overall Elapsed Time The Elapsed Time estimate is really a best guess as to how long the SQL statement will take to run, and it is primarily based upon the minimum time it should take to perform the I/O, plus the CPU processing, as well as the time for any ancillary functions, like preparing dynamic SQL, opening closed tables, etc. The Elapsed Time can be best controlled or influenced by the choice of DASD Subsystem and the BUFFHIT parameter, which specifies how much of the I/O will be physically read from disk, and how much will be logical I/O, done with pages found in the buffer pool. Of course, terminal delays, contention for system resources and other interference are not part of the computation, as SQL PA has no way to assess that likelihood.
39
I/O Estimates The I/O estimation in SQL PA is based upon the sizes of the tables and indexes to be accessed by the SQL statement, and the composite filter factor computed, which yields a percentage of the objects to be read. Thus, if the filter factor indicates that 12% of the rows will be returned from a table, it assumes that 12% of the table (and index, if selected) will be read by DB2, and figures out how many I/O requests that will translate into, along with the type of I/O (prefetch or synchronous read). These, along with the Prepare catalog accesses for EDM pool loading and possible dynamic SQL preparation, yield the total logical I/O count, or Getpage estimate. Using the buffer hit ratio supplied by the BUFFHIT parameter, SQL PA then can estimate what percentage of these logical I/O will be physically read from disk. A similar process takes place for asynchronous writes caused by Inserts, Updates and Deletes. Since the buffer hit ratio is best estimated by observation, and can vary wildly based upon the current buffer pool contention and other factors (close yes/no, etc.) the best way to gauge I/O is to compare the Getpage estimate with the actual Getpage count from the measured data. While the physical I/O count may vary, the logical I/O count (i.e., the total number of pages scanned) should remain relatively constant between executions (Getpages). Summarizing validation For comparison purposes with the actual measured execution of SQL statements, it is best to compare CPU Times and use the Getpage count for I/O. The basic settings (without ANLKEYS) should be close enough for most evaluations, unless you are feeding a capacity planning model. The Elapsed Time, while interesting, is very difficult to hit on the mark without the attendant delays and contention, and the Physical I/O estimate similarly is subject to buffer pool contention, I/O subsystem delays and general unpredictability.
Why are there differences? When modeling the performance of the SQL statements upon the proposed configuration, SQL PA must rely on the catalog statistics to describe both the size of the tables and indexes, and the cardinality of the columns employed. The predicate type also dictates how the statistics may be used to compute the filtering effects of the predicate when applied to the table. Some predicate types do not allow for any variation (arithmetic expressions, e.g.) and force the optimizer to always take a default filter factor, instead of computing a value. Other predicates are influenced by the presence or absence of non-uniform distribution statistics (Equals or In (list), e.g.), which can have a dramatic impact on the final filter factor computation. Where accurate catalog statistics are present, SQL PA can do a very precise job of estimating the real costs, particularly the CPU Time. When predicates are used that force a standard default filter factor, or when no (or inaccurate) catalog statistics are available to influence the filter’s computation, the results will veer off accordingly. Impact of parameters on the cost model
40
There are a number of parameters that influence the cost model used to predict performance. Each can have a beneficial effect on accuracy when understood and set to its proper value, reflecting the actual configuration of the hardware, software and database: VERSION selects which set of path lengths are used for the DB2 functionality, which vary by release. It also affects which SQL Advisor messages are chosen (version-sensitive). CONNECT imposes overhead charges for thread management, attach facility and application logic, and will differ for each attach facility selected. STORAGE provides the service times for the I/O mapped against the DASD subsystem selected. This has a dramatic impact on Elapsed Time estimates, as the I/O service times are computed using these values. BUFFHIT governs the logical-to-physical I/O buffer hit ratio, specifically how much I/O is physically done to DASD vs. resolved in memory (in the buffer pool). Higher BUFFHIT values result in lower Elapsed Times (less I/O delay) and less path length, as SQL PA does not issue the I/O instructions. HPOOLRD adjusts the I/O found in the hiperpool, if used. Of the physical I/O that goes to DASD, a portion may be models as found in the hiperpool, rather than the disk subsystem, and the path length will be adjusted accordingly (ignored in V8). DEGREES enables the optimizer to consider parallelism to process the SQL statement. This may seem obvious, but it is often overlooked in optimizing the query. REFRESH allows V8 NFM queries to consider MQTs as access paths, in addition to the base tables. NEWSTOR, NEWSEEK, NEWROTA and NEWXFER allow the definition of alternate or new DASD configurations, not included in the standard set of known storage subsystems. These will redefine the cost of I/O, and are handy between releases when new DASD is announced. MIPRATE, ENGINES and LPARENG set the processor speed and the total number of engines for the entire computer complex. LPARENG shows the portion dedicated to this particular DB2 subsystem, which may be a weighted proportional share. When used together, the three parameters compute the precise number of instructions each CPU engine can process per second. SRMCONS can be used instead of the three parameters above to estimate the same instructions per second value for the CPU engines. It is generally a bit more conservative than vendor claims. ESACOMP and ESASORT indicate that hardware contains special features that improve the data compression and sort processing, lowering the path length and I/O requirements. BUFFERS, BUFF08K, BUFF16K, BUFF32K and SORTBUF all describe the size of the various DB2 buffer pools for different page sizes, used to determine how many pages per prefetch I/O can be used in the cost model. CPUCOST, IOSCOST and TIMCOST establish the basis for the monetary cost estimates provided by the product. If ‘Precise Yes’ is used, then only the CPUCOST is relevant.
41
DATASHR and DSGROUP apply additional overhead and logic to the processing, representing the impact of data sharing on the SQL statements. DYNAMIC affects the overhead for preparing dynamic SQL statements. If set to Yes, this overhead is considerably reduced, as the prepared statement will likely be found in the EDM pool already. PRECISE YES indicates that the DB2 optimizer’s CPU and Service Unit estimates are to determine the cost of the SQL, while NO says to provide the full evaluation, including I/O and Elapsed Time, plus the overhead for asynchronous writes and logging, etc. A value of ALL provides the same full evaluation, using better estimates for query cardinality and composite filter factors obtained from the optimizer directly. ANLKEYS alters some of the cost estimates, omitting certain path lengths from the final computation. VIADRDA will use the optimizer and catalog statistics of the targeted location’s DB2 subsystem, which may produce different results than the local subsystem. As you can see, the cost model can be influenced greatly by the parameter settings, so it is important to accurately portray the hardware/software configuration of the system that you wish to evaluate the SQL upon, and also to maintain a good understanding of the anticipated run time application environment. Influencing the SQL PA cost algorithm Aside from the parameter settings and catalog statistics generation and modification, there are still a few other things that the user can do to influence the SQL PA cost model, mainly by including user directives in the SQL statement itself. SQL PA and the optimizer are sensitive to the values coded by the user in anticipating the number of rows returned, done in mainly two SQL clauses: ‘Optimize for n Rows’ and ‘Fetch First n Rows’. SQL PA will interpret the values literally, making the assumption that the user knows best, and that in fact these SQL queries will return the number of rows anticipated, working backwards to compute a compatible filter factor. This final filter factor then dictates the cost model processing overhead, replacing what would have been computed from the catalog statistics and predicates. Optimize for n Rows Indicates that the optimizer should figure the access path based on the statement returning ‘n’ rows. If ‘n’ is a low value, this might alter the access path, preclude the use of prefetch I/O, and cause other decisions designed to get a quick answer for a small results set. SQL PA will use the value of ‘n’ to determine the number of rows returned, working back to compute the composite filter factor necessary to produce ‘n’ rows in the result, and thus affecting the percentage of table and index pages necessary to achieve that result. If the query actually fetches more than ‘n’ rows, the results will be off by that variance. Fetch First n Rows
42
This parameter actually limits the final answer set to ‘n’ rows only, so the user will not have the ability to fetch the entire answer set, even if there are more rows that qualify. So, this is a more final directive to the optimizer, which will compute the best access path to return ‘n’ rows. SQL PA will also take this into account and work back to a compatible filter factor when computing its estimates. Section 5. Hints and Tips for Maximum Productivity
Use realistic catalog statistics Since the optimizer’s view of the world relies on the catalog statistics to describe the size and shape of DB2 tables and indexes, and the cardinality of columns and index keys, it cannot be overstated that this is the single most important factor in achieving accuracy with SQL PA (or any other predictive tool). SQL PA will take the access path from the optimizer, already based upon the catalog statistics, and translate that into real world costs, using the same catalog statistics to project the access path onto the estimated number of pages, etc. Users can run SQL PA on production systems, where the catalog stats are already up-to-date, or migrate statistics to the test machine for further analysis, either via manual data entry, the TSO “What IF?” interface in PTF3101 or by using the ANLCAT31 migration program provided with the SQL PA product.
Using ANLCAT31 to migrate PROD to TEST ANLCAT31 is a program designed to collect all the catalog statistics that the optimizer uses for access path selection. It is not a complete catalog migration tool – rather, it concentrates on the updateable and insertable stats describing size and cardinality that the optimizer uses to pick the right path. ANLCAT31 collects table, table space and index data at a minimum, which comprise the basic set of updateable statistics for the test catalog. It also may collect statistics at the column level, non-uniform distributions and partition-level statistics, the last three options set via control parameters. If everything is requested, ANLCAT31 will create the SQL statements to Update and/or Insert all of the catalog statistics used by the optimizer to makes its access path decisions. The ANLCAT31 program runs on the production system and creates an output file, which can then be ported to the test system for execution against the test catalog. ANLCAT31 requires that the basic test tables and indexes exist (you must build the rudimentary entries) so that the updates will be correctly applied. Indexes can be created with DEFER YES to avoid building the full index entries. There is also a facility under TSO with PTF3101 applied to manage this collection and apply the statistics. Further documentation on ANLCAT31 program, and it’s collection parameters, is available in the User’s Guide. Setting the key stats used by Optimizer & SQL PA The following columns are used by SQL PA for its cost analysis, with those in italics migratable by the ANLCAT31 program, for update in the SYSIBM tables: SYSIBM.SYSTABLESPACE: NACTIVE, NACTIVEF, ENCODING_SCHEME, TYPE, PARTITIONS, PGSIZE, NTABLES, SEGSIZE, CLOSERULE, LOCKPART, MAXROWS, LOCKRULE SYSIBM.SYSTABLES:
43
TYPE, COLCOUNT, RECLENGTH, CARDF, NPAGES, NPAGESF, PCTPAGES, PCTROWCOMP, PARENTS, CHILDREN, KEYCOLUMNS
SYSIBM.SYSINDEXES:
INDEXTYPE, PIECESIZE, UNIQUERULE, COLCOUNT, CLOSERULE, NLEAF, FIRSTKEYCARDF, FULLKEYCARDF, NLEVELS, PGSIZE, CLUSTERING, CLUSTERED, CLUSTERRATIO, CLUSTERRATIOF, IOFACTOR
In addition, the ANLCAT31 program can optionally insert records to SYSIBM.SYSCOLUMNS and SYSIBM.SYSCOLDIST for column cardinality and non-uniform distributions, and populate the partition-level catalog tables as well: SYSIBM.INDEXSTATS, SYSIBM.SYSTABSTATS, SYSIBM. SYSCOLSTATS and SYSIBM.SYSCOLDISTSTATS.
The user must have authority to update the system catalog tables, usually SYSADM or similar. Otherwise, SQLCODE –551 will be issued to those without sufficient authority to update the SYSIBM catalog tables.
Use realistic configuration parameters Set up the ANLCNTL parameters to accurately describe actual Hardware and Software environment that you wish to use to evaluate your SQL. If the configuration is wrong, then the entire answer set will be skewed noticeably. The install team usually sets up these parameters for the user community, so it is generally not necessary to know every detail, just to choose the right description of your DB2 subsystem. Don’t over or underutilize the Buffer Hit Ratios with BUFFHIT and HPOOLRD (in V7) parameters. While you might think that you know exactly what percentage of pages are found in the buffer pool by looking at a recent execution of the SQL, these can vary from execution to execution, depending upon who else is using the buffer pool at that instant. These parameters can impact Elapsed Time as well as physical I/O estimates, so try to stay conservative. Use an average DASD Subsystem for the STORAGE parm. Sometimes there is a great mix of DASD types in the shop, and users get confused as to which one to select for the cost model. Choose the DASD subsystem upon which the majority of your tables and indexes are stored… again, that is the best course for a conservative estimate. It does not benefit the user to assume that everything is found in the buffer pool, nor always stored on cached or solid state disk with rapid service times, unless these assumptions are true in day to day operations. Finally, correctly select the overheads for Attach Facility, etc., as these provide an envelope around the processing of each transaction. If you are running a Batch job using IKJEFT01 and the DSN command processor, then state the parm as CONNECT DSN. If you are running from a PC choose DRDA as your attach method, and when executing from DB2I under TSO, SPUFI is the proper choice. Setting the parameters to describe a realistic run time environment is essential to obtaining accurate results from the product.
Using the SQL PA reports
44
The QLIMIT report should be the first stop in your analysis of any set of SQL statements, as it provides a concise one line summary for each statement, complete with all the cost factors (CPU, I/O, Elapsed, Qunits and Monetary) and the warning flags for cost overruns. This will point you quickly to the heavy hitter SQL that consume the most resources and might most benefit from tuning. Then, examine the ANLREP report to view the enhanced explain information along with any SQL Advisor messages, to provide further insight as to what is causing the heavy usage, and what to do about it. It is important to understand the access path chosen by DB2, review the alternatives not currently selected (via the SHOWALT parm), and decide if further work is warranted. The catalog statistics are also included here to illustrate the size and scope of data access. The SYSOUT (in batch) or ANLCOST.LOG (in TSO) should also be scanned for important messages, including missing catalog statistics, bad SQL that could not be processed by the program (and why), and summarizations for each SQL statement. Lastly, the QTRACE report can optionally be examined when the SQL requires considerably deeper analysis to determine the improvements, delving into the incremental components of cost that went into SQL PA’s estimated resource consumption. This report can pinpoint where most of the time is being spent, so you can focus on these areas for improvement. Summary Once the product is properly installed, and the parameters set to accurately portray the DB2 environments, the users can devote the majority of their time to selecting SQL statements for analysis, and contemplating current performance and future enhancements. Consider the Advisor’s comments and recommendations, and review alternative access path strategies to improve general performance where warranted. SQL PA can be a helpful, every day companion to the DB2 application developer as well as the Data Base Administrator. All SQL statements should be reviewed by SQL PA and performance confirmed prior to entering into production use. Section 6. Quick Install Checklist Installation Reminders
1. Choose a high level qualifier for all product datasets; tailor your Clists accordingly. 2. SQL Performance Analyzer uses explain tables for its Prepare/Explain process. Will users be
using their own explain tables or do you wish to use generic explain tables that everyone can share? The generics require DSN3@ATH mods, while users can deploy their own using the SETPLAN and USEPLAN parms.
3. Is your DB2 environment STOGROUP-managed? There are alternate definitions for VSAM or STOGROUPs in the ANLMAKE and ANLMAKE8 SQL files. Also note there is a difference when setting up V8 (larger fields in Plan_Table).
4. Do you wish to be able to invoke SQL Performance Analyzer from within a TSO edit or browse session? Check for the alias SPA in your Clist library.
5. Would you like the tool to interface with QMF? Install the few lines of code into the QMF Governor that calls SQL PA.
6. Do you want to be able to invoke SQL Performance Analyzer for in-house programs, via a stored procedure? Are you using DB2 or WLM stored procedures? Both are supported.
45
7. Do you want to see predicate analysis in V7? Enable the DSNZPARM SPRMEXPL bit to activate the extra explain information.
Groups that might be involved - SMP/E Install Group (responsible for creating the datasets that are needed by all IBM tools) - DB2 System Programmers If generic explain tables will be used, it may be necessary to modify two DB2 user exits (DSN3@ATH and DSN3@SGN), which are in the Assembler language. [Install Step 2] Else, use SETPLAN and USEPLAN to allow users to specify their own plan_tables [Step 2 alternate] - DB2 Database Administrators SQL Performance Analyzer uses its own database, which always needs to be created (REGISTRY). If the installation site is not STOGROUP-managed, then you will need to run an IDCAMS to define space for the datasets that will be used by the new database. [Install Step 3] SQL Performance Analyzer provides DB2 and WLM stored procedures that can be called from any program which will allow your user-developed applications to estimate query costs before they are executed. These require tailoring of the DB2 or WLM address spaces, allocation of a separate load library, an ANLCNTL parameters file and SYSPRINT, and creating the procedures for DB2 (ANLPRC3C and/or ANLPRC3R). [Install Step 8] SQL Performance Analyzer has plans and packages that will need to be bound. [Install Step 9] If you want to execute remotely via DRDA, then SQL PA must be installed on the other subsystems, with special bind parameters [Install Step 9] - TSO/ISPF Administrators This tool will require someone to customize Panel and Clist members to incorporate the tool into your existing environment. [Install Step 4] - QMF Administrators This tool can interface with QMF if desired but will require a modification to the QMF Governor exit (DSQUEGV1), which is in the Assembler language. [Install Step 6] Trademarks The following are trademarks or service marks of the IBM Corporation: DB2, CICS, DRDA, IBM, MVS, OS/390, z/OS QUNITS is a trademark of Innovative Management Solutions, Inc. (IMSI)