accumulation of soil organic carbon during natural restoration of desertified grassland in china’s...
TRANSCRIPT
J Arid Land
doi: 10.1007/s40333-014-0045-1
jal.xjegi.com; www.springer.com/40333
Accumulation of soil organic carbon during natural restoration of desertified grassland in China’s Horqin Sandy Land
YuQiang LI1, XueYong ZHAO1, FengXia ZHANG2, Tala AWADA3, ShaoKun WANG1, HaLin ZHAO1, TongHui ZHANG1, YuLin LI1
1 Cold and Arid Regions Environmental and Engineering Research Institute, Chinese Academy of Sciences, Lanzhou 730000, China; 2 School of Environmental and Municipal Engineering, Lanzhou Jiaotong University, Lanzhou 730070, China; 3 School of Natural Resources, University of Nebraska, Lincoln NE 68583, USA
Abstract: China’s Horqin Sandy Land, a formerly lush grassland, has experienced extensive desertification that caused considerable carbon (C) losses from the plant-soil system. Natural restoration through grazing exclusion is a widely suggested option to sequester C and to restore degraded land. In a desertified grassland, we investigated the C accumulation in the total and light fractions of the soil organic matter from 2005 to 2013 during natural resto-ration. To a depth of 20 cm, the light fraction organic carbon (LFOC) storage increased by 221 g C/m2 (84%) and the total soil organic carbon (SOC) storage increased by 435 g C/m2 (55%). The light fraction dry matter content rep-resented a small proportion of the total soil mass (ranging from 0.74% in 2005 to 1.39% in 2013), but the proportion of total SOC storage accounted for by LFOC was remarkable (ranging from 33% to 40%). The C sequestration av-eraged 28 g C/(m2
•a) for LFOC and 54 g C/(m2•a) for total SOC. The total SOC was strongly and significantly posi-
tively linearly related to the light fraction dry matter content and the proportions of fine sand and silt+clay. The light fraction organic matter played a major role in total SOC sequestration. Our results suggest that grazing exclusion can restore desertified grassland and has a high potential for sequestering SOC in the semiarid Horqin Sandy Land.
Keywords: carbon storage; carbon sequestration; soil light fraction; restoration; grazing exclusion
Citation: YuQiang LI, XueYong ZHAO, FengXia ZHANG, Tala AWADA, ShaoKun WANG, HaLin ZHAO, TongHui ZHANG, YuLin LI. 2014. Ac-cumulation of soil organic carbon during natural restoration of desertified grassland in China’s Horqin Sandy Land. Journal of Arid Land, doi: 10.1007/s40333-014-0045-1.
Measurable global warming is being caused by in-creased emissions of four types of anthropogenic greenhouse gases (GHGs): carbon dioxide (CO2), methane (CH4), nitrous oxide (N2O) and halocarbons. CO2 is the most important GHG and its annual emis-sions increased from 21 Gt in 1970 to 38 Gt in 2004, an increase of 81% in less than 35 years (IPCC, 2007). Soils play a particularly important role in the atmos-pheric CO2 budget (Raich and Potter, 1995). Soil con-tains approximately 2,344 Gt of organic C globally to a depth of 3 m and is the largest pool of terrestrial organic C in the biosphere (Jobbágy and Jackson, 2000). Thus,
proportionally small changes in the soil organic car-bon (SOC) storage could significantly affect the at-mospheric CO2 concentration (Raich and Potter, 1995; Stockmann et al., 2013). For example, a decrease of just 10% in total SOC would be equivalent to 30 years of anthropogenic emissions (Kirschbaum, 2000). The patterns and controls of SOC storage are therefore critical for our understanding of the biosphere, given the importance of SOC for ecosystem processes and the feedbacks between this pool and the atmospheric composition and the rate of climate change (Jobbágy and Jackson, 2000).
Corresponding author: Yuqiang LI (E-mail: [email protected]; [email protected]) Received 2014-07-23; revised 2014-10-15; accepted 2014-11-03 © Xinjiang Institute of Ecology and Geography, Chinese Academy of Sciences, Science Press and Springer-Verlag Berlin Heidelberg 2014

JOURNAL OF ARID LAND
Carbon sequestration implies both natural and de-liberate processes by which CO2 is either removed from the atmosphere or diverted from emission sources and stored securely in long-lived pools so that it is not immediately re-emitted (Lal, 2004a; Sundquist et al., 2008). Thus, soil C sequestration means increasing SOC and soil inorganic carbon (SIC) stocks through judicious land use and recommended management practices (Lal, 2004a). Soil C sequestration is a win-win strategy because it is capable of restoring degraded soils, enhancing biomass production, puri-fying surface and ground waters, and offsetting emissions of CO2 due to combustion of fossil fuels (Lal, 2004b).
Drylands cover about 45% of the terrestrial globe and are home to approximately one billion people (Nosetto et al., 2006; Verón et al., 2006). Most of these fragile ecosystems have undergone degradation, particularly desertification, due to environmental and anthropogenic pressures, and have lost significant amounts of C (FAO, 2004; Helldén and Tottrup, 2008). For example, the total historic loss of C from the plant–soil continuum due to desertification of dry-lands has been estimated to be 19 to 29 Gt (Lal, 2001). Therefore, the potential for sequestering C through the rehabilitation of drylands is substantial because of their vast area together with their widespread degrada-tion (FAO, 2004), even if the amount of C sequestered per unit area is initially small (Malagnoux, 2007). In drylands, grazing exclusion is one of the most widely suggested options to sequester C and to restore de-graded land (Nosetto et al., 2006). One of the principal advantages of this approach is that it primarily de-pends on natural processes rather than on potentially expensive artificial measures.
Physical fractionation of the soil emphasizes the roles of soil minerals and soil structure in the turnover of SOC, and relates more directly to in situ SOC dy-namics than the classical wet chemical SOC fractions (Post and Kwon, 2000). Density fractionation (typi-cally using a solution at a density of 1.6 to 2.0 g/cm3) separates soil into low- and high-density fractions that are referred to, respectively, as the light fraction (LF) and heavy fraction (HF) (Christensen, 1992; Sollins et al., 1999; Swanston et al., 2002). The LF is described as a plant-like and less stable fraction with a high C concentration and a low ash concentration (Swanston
et al., 2002), and has a relatively short turnover time in the soil (Gregorich et al., 1996). For this reason, the LF pool is generally considered to be more sensitive than the total soil organic matter (SOM) and HF pools, and has therefore been suggested as an early indicator of land use- or management-induced changes in soil quality (Haynes, 2000; Six et al., 2002; Soon et al., 2007; Sequeira et al., 2011), although some research-ers have suggested that the LF pool did not always decompose more rapidly than the HF pool (Swanston et al., 2005; Crow et al., 2007).
China’s Horqin Sandy Land (42°41–45°45N,
118°35–123°30E; Fig. 1), which is also called the “Horqin Sandy Grassland”, was formerly a lush grassland with sparsely scattered woody species and was an important pastoral region of Inner Mongolia. However, desertification has occurred since the 1950s, primarily due to a combination of the fragile ecology with inappropriate human activities such as wide-spread grazing, intensive cultivation over large areas, firewood harvesting and excessive groundwater with-drawal (Zhu, 1985; Zuo et al., 2014). As a result, the area of desertified land in the Horqin Sandy Land ex-panded rapidly from the late 1950s to the mid-1970s, increasing by a total of 9,084 km2 (Wu, 2005). The amount of organic C lost during this process at the 20th century is estimated to be 101.6 Mt from the soil and 5.91 Mt from the vegetation (Zhou et al., 2008).
Space-for-time substitution (SFT) is one of the most commonly encountered techniques in ecology and in-volves extrapolating a temporal trend from a series of samples with different ages (Pickett, 1989). In the Horqin Sandy Land, previous studies used the SFT approach to estimate the C loss in grassland and farmland ecosystems (Li et al., 2006; Zhou et al., 2008; Zhao et al., 2009), and found that improved carbon sequestration in the soil or the plant–soil system of desertified areas can be achieved through the establishment of grazing enclo-sures (Chen et al., 2012; Li et al., 2012b) and through afforestation with trees and shrubs (Su and Zhao, 2003; Huang et al., 2012; Li et al., 2013).
During our previous research, however, we found that adopting the SFT technique led to high uncertain-ties in assessing the response of C content to deserti-fication or its reversal. For example, we carried out a research over large areas to investigate the SOC ac-cumulation after afforestation of mobile dunes, which
YuQiang LI et al.: Accumulation of soil organic carbon during natural restoration of desertified grassland in China’s Horqin Sandy Land
served as the control (Li et al., 2014). We found that the ability of afforestation to increase SOC could be overestimated. The problem was that some sites were incorrectly classified as mobile dunes before affore-station began; these “false” sand dunes may have been grassland or other land-use types with a relatively high SOC before they were shallowly buried by mo-bile sands transported from other sites (to a depth of 10 to 20 cm) and subsequently underwent afforesta-tion. Although these sites could legitimately be classi-fied as mobile dunes, they had a much greater SOC than real mobile dunes at depths below the sand cover. Thus, the C sequestration rate in soils that originated as “false” dunes and that were converted into tree or shrub plantations would be overestimated compared with values in the soils of true sand dunes. For this reason, accurately detecting changes in SOC due to changes in land use and management practices re-quires an approach in which soil samples are collected periodically from the same plots.
The objectives of the present study are (1) to inves-tigate the improvement of soil texture and accumula-tion of C in the total and light fractions of SOM, and (2) to demonstrate the role of the light fraction in total SOC sequestration, during the natural restoration process (i.e. establishing enclosures) at a desertified grassland site.
1 Materials and methods
1.1 Study area
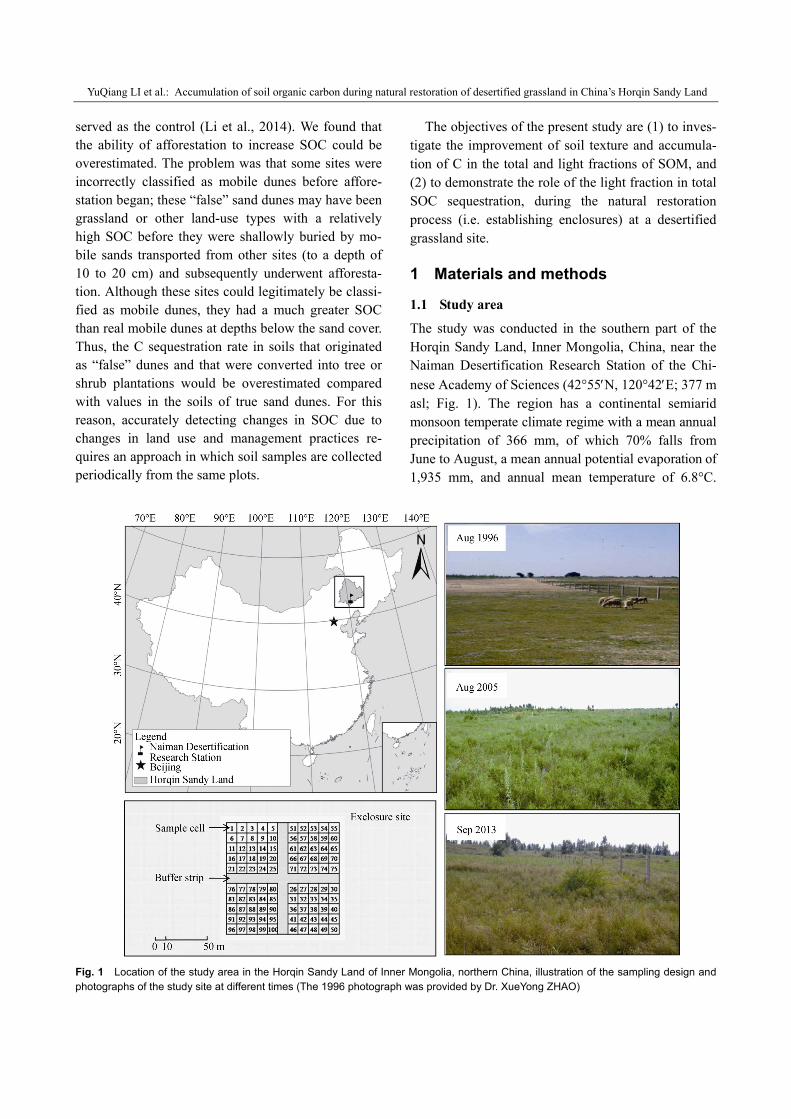
The study was conducted in the southern part of the Horqin Sandy Land, Inner Mongolia, China, near the Naiman Desertification Research Station of the Chi-
nese Academy of Sciences (42°55N, 120°42E; 377 m asl; Fig. 1). The region has a continental semiarid monsoon temperate climate regime with a mean annual precipitation of 366 mm, of which 70% falls from June to August, a mean annual potential evaporation of 1,935 mm, and annual mean temperature of 6.8°C.
Fig. 1 Location of the study area in the Horqin Sandy Land of Inner Mongolia, northern China, illustration of the sampling design and photographs of the study site at different times (The 1996 photograph was provided by Dr. XueYong ZHAO)
JOURNAL OF ARID LAND
Monthly mean temperature ranges from the minimum of –13.2°C in January to the maximum of 23.5°C in July. The mean wind speed is 4.3 m/s, with occa-
sional occurrences of gales with wind speeds ≧20
m/s in winter and spring, when the vegetation cover is lowest and the soil is driest (Zhao et al., 2005; Li et al., 2013).
The study site (Fig. 1) was formerly open and flat natural grassland. The sustainable grazing intensity was estimated at 2 to 3 sheep units per hectare (Zhao et al., 2005). However, this site had experienced mod-erate degradation based on the classification criteria for the degree of desertification during the early 1990s as a result of long-term continuous grazing at a mean intensity of 4.5 sheep units per hectare (Zhu and Chen, 1994), combined with increasing air temperature and decreasing rainfall in the region (Zhao et al., 1999; Zhang, 2010).
The soil’s parent materials are alluvial and aeolian sediments. The soil is a sandy loam, and we classified it as a Eutric Regosol of sandy origin according to the soil classification system of Food and Agriculture Or-ganization of the United Nations (FAO, 2006). The soil is characterized by a loose, single-grain structure. This type of soil is therefore susceptible to damage caused by grazing animals and wind erosion.
1.2 Experimental design and soil sampling
Restoration of the site was initiated in the autumn of 1996 by establishing a fenced with an area of 4.5 hm2 (300 m×150 m) that excluded grazing and allowed the vegetation to recover naturally. Nine years later (2005), the Naiman Desertification Research Station imple-mented a project for long-term monitoring of the dy-namic evolution of the vegetation and soil. To do so, we established four 50 m×50 m plots within this en-closure, and separated these plots by 10-m-wide buffer strips (Fig. 1). Each plot was divided into twenty-five 10 m×10 m cells for sampling and investigation, with a total of 100 cells across all four plots. Each cell was identified using a concrete piling at each of its four corners.
In August 2005, soil samples were collected from each of the 100 cells. After carefully removing the large surface plant debris by hand, soil samples were randomly collected at 30 points within each cell using a soil auger (2.5-cm in diameter) from two layers: 0 to
10 and 10 to 20 cm. The soil collected in a given layer from these points was mixed to provide a single com-posite soil sample for that layer. Therefore, we ob-tained a total of 200 composite samples (2 soil lay-ers×100 cells). Preparation of the soil samples fol-lowed the guidelines in International Organization for Standardization (ISO, 1994). Soil samples were air-dried and hand-sieved through a 2-mm mesh to remove roots and other large debris, and were then sealed in polyethylene bottles and kept in the dark at room temperature until analysis.
Vegetation and soil characteristics at the site have been studied since 2005. The current dominant species are the perennial grasses and forbs Pennisetum cen-trasiaticum, Phragmites communis, Leymus secalinus, and Melissitus ruthenicus, and the biennial forb Ar-temisia scoparia, as well as the annual grasses Chloris virgata and Setaria viridis. The average vegetation cover is more than 70%. The aboveground live bio-mass measured in August was lowest in 2008, with a value of 73 g/m2, and highest in 2011, with a value of 246 g/m2. For regular monitoring of the soil properties, six cells were randomly selected for sampling in Au-gust of each year, using sampling without repetition (i.e. excluding the previously sampled cells during the next sampling), which is a form of SFT sampling. Compared to the values at the 0–10 and 10–20 cm layers that were measured in 2005, SOC increased by 6% and decreased by 23% in 2006, decreased by 9% and 25% in 2007, decreased by 13% and increased by 20% in 2008, increased by 48% and decreased by 7% in 2009, decreased by 2% and increased by 24% in 2010, decreased by 5% and increased by 82% in 2011, and increased by 11% and decreased by 9% in 2012, respectively.
It is evident that this erratic trend compromised our sampling design, because the study site did not have homogeneous soil properties prior to the grazing ex-clusion. Therefore, we adjusted the experimental de-sign to avoid the effects of this spatial heterogeneity: First, we used the background soil samples collected in 2005 as our baseline. Next, we collected soil sam-ples from all 100 cells in 2013. In the present study, we collected soil samples in August 2013 from 0 to 10 and 10 to 20 cm, as described above, for a total of 200 composite samples. We selected three additional sam-pling points (replicates) in each cell and used a
YuQiang LI et al.: Accumulation of soil organic carbon during natural restoration of desertified grassland in China’s Horqin Sandy Land
stainless-steel cylinder (100 cm3 in volume) to obtain intact soil cores for the determination of soil bulk density. The same person (that is, the first author) was in charge of the sampling in both 2005 and 2013.
1.3 Laboratory analyses
Pretreatment of the soil samples collected in 2013 was the same as that used in 2005. Combined with the back-ground soil samples collected in 2005, we analyzed a total of 400 soil samples in the present study. A portion of each soil sample was ground to pass through a 0.25-mm mesh for determination of SOC. The remaining portion was stored at room temperature for determination of the LF content and the particle size distribution.
A subsample of the air-dried soil was weighed and dried at 105°C for 24 h to determine the gravimetric water content. Soil particle sizes were analyzed by the wet sieving method using sodium hexametaphosphate as the dispersing agent (ISO, 1998). Each soil sample was separated into three fractions using nested sieves with openings of 2, 0.1 and 0.05 mm: coarse sand (2–0.1 mm), fine sand (0.1–0.05 mm), and silt+clay (<0.05 mm). SOC was determined using the Walkley– Black dichromate oxidation procedure (Nelson and Sommers, 1982).
The LF organic matter was extracted from soil us-ing the procedure described by Murage et al. (2007), which we also used in our previous work (Li et al., 2012a). In brief, an air-dried bulk soil sample of around 20 g was weighed into a 100-mL centrifuge tube, followed by the addition of 80 mL of aqueous NaI solution at a density of 1.8 g/cm3. This density can give the maximum yield of particulate matter in a sandy loam soil (Sohi et al., 2001). The solution was then swirled by hand for 30 s, and the content was dispersed using a probe-type sonic disrupter (BILON88- IIL, BILON Co. Ltd., Chengdu, China) for 1 min. After sedimentation for 30 min, the solution was centrifuged at 8,000g for 30 min. The samples were then allowed to settle overnight. The suspended LF material was suctioned onto a Whatman No. 1 fil-ter paper, and washed thoroughly with 5 aliquots of 0.01 M CaCl2 and 10 aliquots of distilled deionized water. The LF was dried at 55°C for 16 h, then weighed to the nearest 0.0001 g and ground using an agate mortar and pestle. The LF dry matter content was expressed as a percentage of the total soil mass.
We combined the LF materials from randomly se-lected groups of 10 cells to determine a single value for the light fraction organic carbon (LFOC) concentration for each soil layer. In summary, we obtained 200 values of the LF dry matter content and 20 values of the LFOC concentration for both soil layers in a given year. The LFOC concentration was determined using the same procedure that we used for the bulk soil.
1.4 Data analyses
The total SOC storage in the soil (SOC storage, g/m2 to a depth of 20 cm) and in the light fraction (LFOC stor-age, g/m2 to a depth of 20 cm) were calculated using the following equations:
2
1
storage 10,Si i ii
SOC C BD H
(1)
1
O storage /10.i
n
i i i ii
LF C F DM C BD H
LF (2)
Where Csi is the total SOC (g/kg) in layer i (where i=1 for 0–10 cm and 2 for 10–20 cm), BDi is the soil bulk density (g/cm3) in that layer, Hi is the soil layer’s thickness (10 cm), DMi is the LF dry matter content as a proportion of the total soil mass (%), and CLFi is the LFOC concentration (g/kg dry LF).
With respect to the soil bulk density (BD), the mean values±standard deviation determined from six cells in 2005 were 1.47±0.03 and 1.52±0.05 g/cm3, respec-tively, in the top and bottom layers; the corresponding values obtained from same six cells in 2013 were 1.31±0.06 and 1.47±0.06 g/cm3. However, the com-bined mean values for the 100 cells in 2013 were 1.32±0.06 and 1.47±0.06 g/cm3. Therefore, we as-sumed that the mean BD from the six cells could be used to represent the mean value for the whole 100 cells in our calculations of the SOC and LFOC storage in 2005. That is, we used a mean BD of 1.47 g/cm3 for 0–10 cm and 1.52 g/cm3 for 10–20 cm to calculate the storage in 2005, but used the values of 1.32 g/cm3 for 0–10 cm and 1.47 g/cm3 for 10–20 cm in 2013. Given that the soil BD decreased with time, we also esti-mated the storage per unit area per equivalent soil mass. However, the patterns in the results did not dif-
fer significantly (P≧0.05) from the patterns based on
the results per unit area by volume (data not shown). All data are expressed as mean±SD. The measured
variables and the resultant carbon storage were ana-
JOURNAL OF ARID LAND
lyzed using paired-sample t-tests to identify signifi-cant differences between the treatments. We described the relationships between SOC and the other variables using linear regression models. The statistical analysis was performed using version 13.5 of the SPSS soft-ware (SPSS, Chicago, IL, USA).
2 Results
2.1 Soil particle size distribution
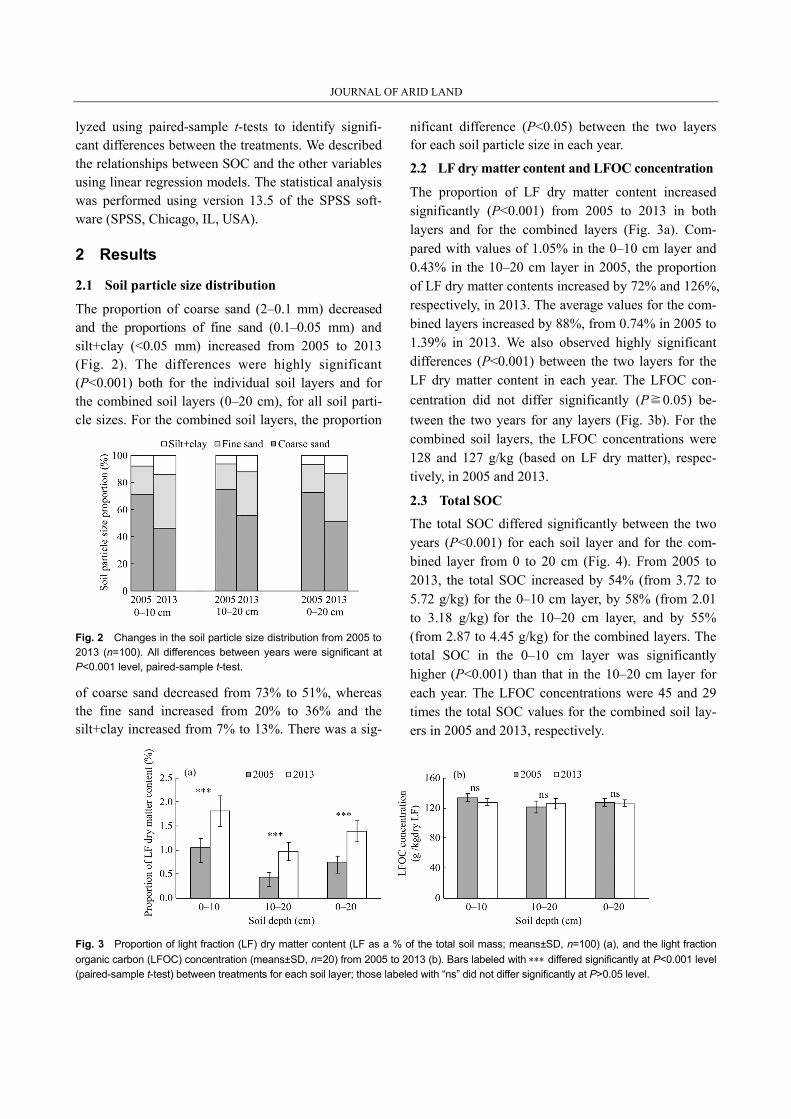
The proportion of coarse sand (2–0.1 mm) decreased and the proportions of fine sand (0.1–0.05 mm) and silt+clay (<0.05 mm) increased from 2005 to 2013 (Fig. 2). The differences were highly significant (P<0.001) both for the individual soil layers and for the combined soil layers (0–20 cm), for all soil parti-cle sizes. For the combined soil layers, the proportion
Fig. 2 Changes in the soil particle size distribution from 2005 to 2013 (n=100). All differences between years were significant at P<0.001 level, paired-sample t-test.
of coarse sand decreased from 73% to 51%, whereas the fine sand increased from 20% to 36% and the silt+clay increased from 7% to 13%. There was a sig-
nificant difference (P<0.05) between the two layers for each soil particle size in each year.
2.2 LF dry matter content and LFOC concentration
The proportion of LF dry matter content increased significantly (P<0.001) from 2005 to 2013 in both layers and for the combined layers (Fig. 3a). Com-pared with values of 1.05% in the 0–10 cm layer and 0.43% in the 10–20 cm layer in 2005, the proportion of LF dry matter contents increased by 72% and 126%, respectively, in 2013. The average values for the com-bined layers increased by 88%, from 0.74% in 2005 to 1.39% in 2013. We also observed highly significant differences (P<0.001) between the two layers for the LF dry matter content in each year. The LFOC con-
centration did not differ significantly (P≧0.05) be-
tween the two years for any layers (Fig. 3b). For the combined soil layers, the LFOC concentrations were 128 and 127 g/kg (based on LF dry matter), respec-tively, in 2005 and 2013.
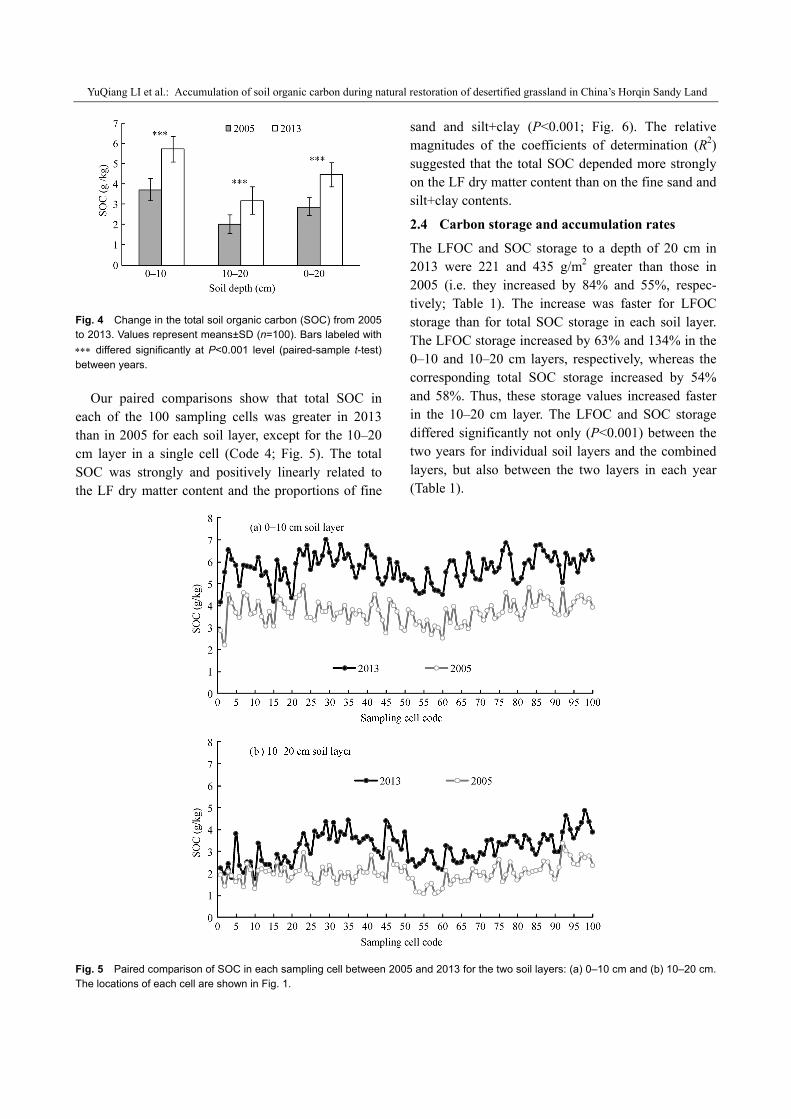
2.3 Total SOC
The total SOC differed significantly between the two years (P<0.001) for each soil layer and for the com-bined layer from 0 to 20 cm (Fig. 4). From 2005 to 2013, the total SOC increased by 54% (from 3.72 to 5.72 g/kg) for the 0–10 cm layer, by 58% (from 2.01 to 3.18 g/kg) for the 10–20 cm layer, and by 55% (from 2.87 to 4.45 g/kg) for the combined layers. The total SOC in the 0–10 cm layer was significantly higher (P<0.001) than that in the 10–20 cm layer for each year. The LFOC concentrations were 45 and 29 times the total SOC values for the combined soil lay-ers in 2005 and 2013, respectively.
Fig. 3 Proportion of light fraction (LF) dry matter content (LF as a % of the total soil mass; means±SD, n=100) (a), and the light fraction
organic carbon (LFOC) concentration (means±SD, n=20) from 2005 to 2013 (b). Bars labeled with differed significantly at P<0.001 level (paired-sample t-test) between treatments for each soil layer; those labeled with “ns” did not differ significantly at P>0.05 level.
YuQiang LI et al.: Accumulation of soil organic carbon during natural restoration of desertified grassland in China’s Horqin Sandy Land
Fig. 4 Change in the total soil organic carbon (SOC) from 2005 to 2013. Values represent means±SD (n=100). Bars labeled with
differed significantly at P<0.001 level (paired-sample t-test) between years.
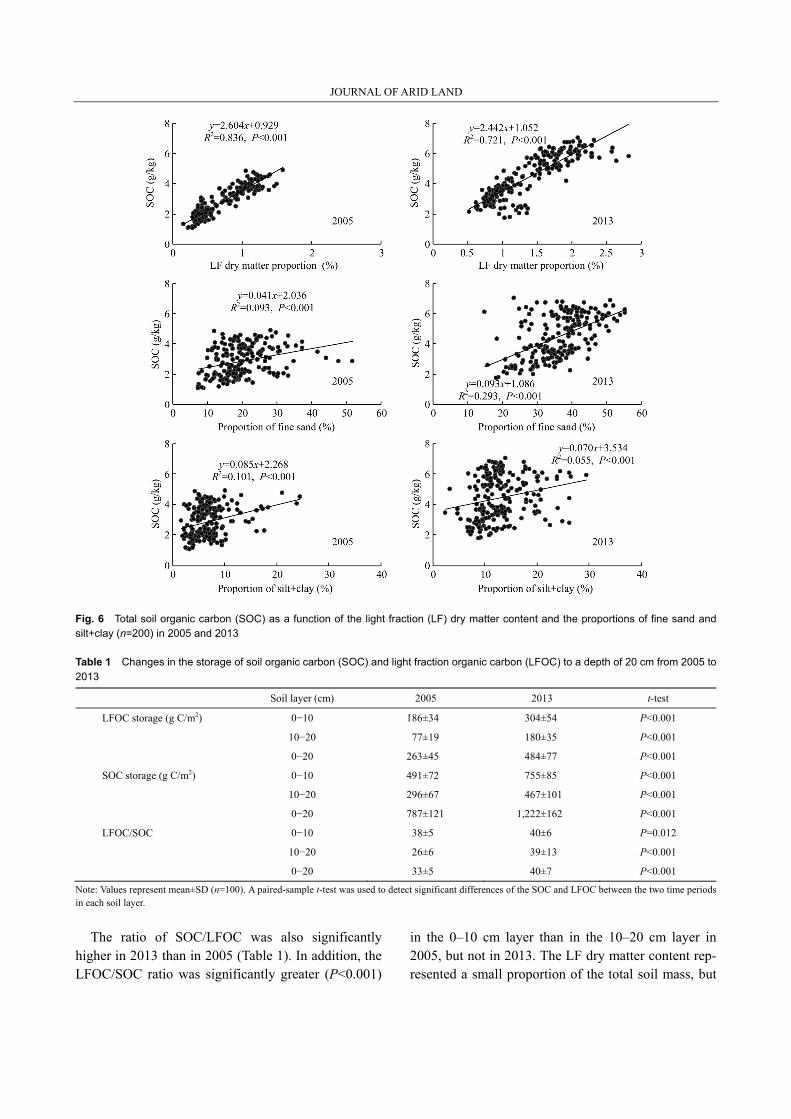
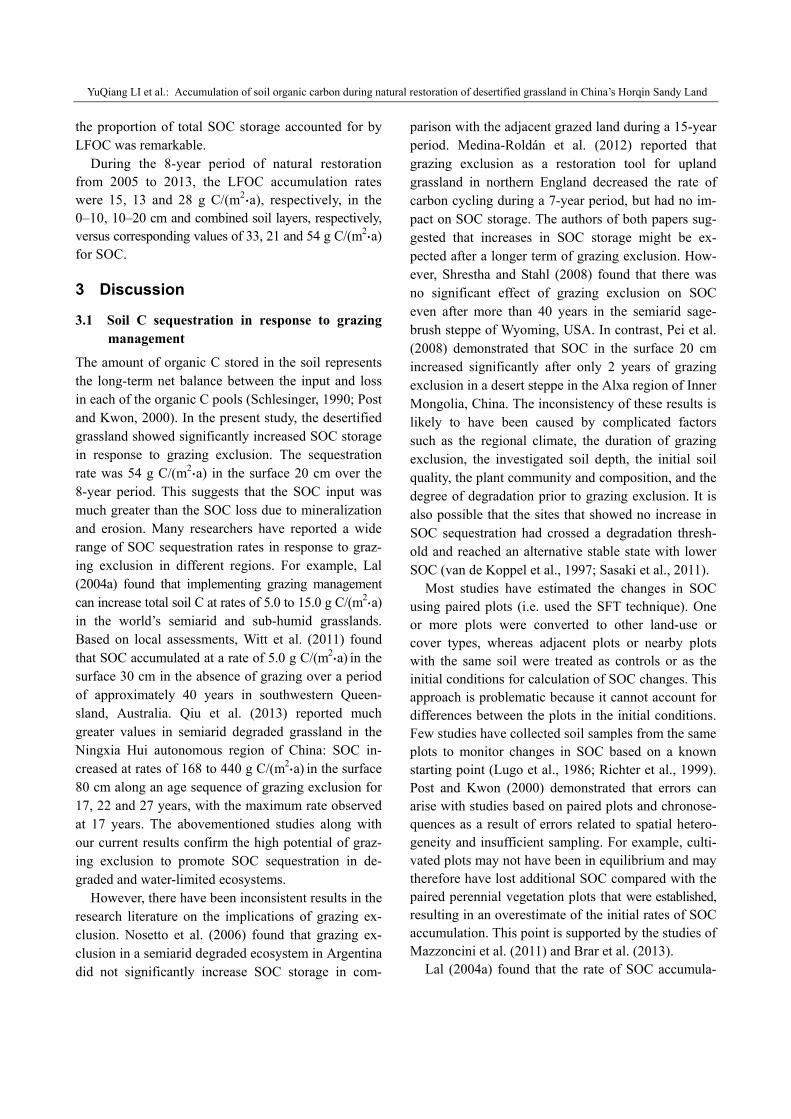
Our paired comparisons show that total SOC in each of the 100 sampling cells was greater in 2013 than in 2005 for each soil layer, except for the 10–20 cm layer in a single cell (Code 4; Fig. 5). The total SOC was strongly and positively linearly related to the LF dry matter content and the proportions of fine
sand and silt+clay (P<0.001; Fig. 6). The relative magnitudes of the coefficients of determination (R2) suggested that the total SOC depended more strongly on the LF dry matter content than on the fine sand and silt+clay contents.
2.4 Carbon storage and accumulation rates
The LFOC and SOC storage to a depth of 20 cm in 2013 were 221 and 435 g/m2 greater than those in 2005 (i.e. they increased by 84% and 55%, respec-tively; Table 1). The increase was faster for LFOC storage than for total SOC storage in each soil layer. The LFOC storage increased by 63% and 134% in the 0–10 and 10–20 cm layers, respectively, whereas the corresponding total SOC storage increased by 54% and 58%. Thus, these storage values increased faster in the 10–20 cm layer. The LFOC and SOC storage differed significantly not only (P<0.001) between the two years for individual soil layers and the combined layers, but also between the two layers in each year (Table 1).
Fig. 5 Paired comparison of SOC in each sampling cell between 2005 and 2013 for the two soil layers: (a) 0–10 cm and (b) 10–20 cm. The locations of each cell are shown in Fig. 1.
JOURNAL OF ARID LAND
Fig. 6 Total soil organic carbon (SOC) as a function of the light fraction (LF) dry matter content and the proportions of fine sand and silt+clay (n=200) in 2005 and 2013
Table 1 Changes in the storage of soil organic carbon (SOC) and light fraction organic carbon (LFOC) to a depth of 20 cm from 2005 to 2013
Soil layer (cm) 2005 2013 t-test
LFOC storage (g C/m2) 0−10 186±34 304±54 P<0.001
10−20 77±19 180±35 P<0.001
0−20 263±45 484±77 P<0.001
SOC storage (g C/m2) 0−10 491±72 755±85 P<0.001
10−20 296±67 467±101 P<0.001
0−20 787±121 1,222±162 P<0.001
LFOC/SOC 0−10 38±5 40±6 P=0.012
10−20 26±6 39±13 P<0.001
0−20 33±5 40±7 P<0.001
Note: Values represent mean±SD (n=100). A paired-sample t-test was used to detect significant differences of the SOC and LFOC between the two time periods in each soil layer.
The ratio of SOC/LFOC was also significantly
higher in 2013 than in 2005 (Table 1). In addition, the LFOC/SOC ratio was significantly greater (P<0.001)
in the 0–10 cm layer than in the 10–20 cm layer in 2005, but not in 2013. The LF dry matter content rep-resented a small proportion of the total soil mass, but
YuQiang LI et al.: Accumulation of soil organic carbon during natural restoration of desertified grassland in China’s Horqin Sandy Land
the proportion of total SOC storage accounted for by LFOC was remarkable.
During the 8-year period of natural restoration from 2005 to 2013, the LFOC accumulation rates were 15, 13 and 28 g C/(m2
•a), respectively, in the 0–10, 10–20 cm and combined soil layers, respectively, versus corresponding values of 33, 21 and 54 g C/(m2
•a) for SOC.
3 Discussion
3.1 Soil C sequestration in response to grazing management
The amount of organic C stored in the soil represents the long-term net balance between the input and loss in each of the organic C pools (Schlesinger, 1990; Post and Kwon, 2000). In the present study, the desertified grassland showed significantly increased SOC storage in response to grazing exclusion. The sequestration rate was 54 g C/(m2
•a) in the surface 20 cm over the 8-year period. This suggests that the SOC input was much greater than the SOC loss due to mineralization and erosion. Many researchers have reported a wide range of SOC sequestration rates in response to graz-ing exclusion in different regions. For example, Lal (2004a) found that implementing grazing management can increase total soil C at rates of 5.0 to 15.0 g C/(m2
•a) in the world’s semiarid and sub-humid grasslands. Based on local assessments, Witt et al. (2011) found that SOC accumulated at a rate of 5.0 g C/(m2
•a) in the
surface 30 cm in the absence of grazing over a period of approximately 40 years in southwestern Queen-sland, Australia. Qiu et al. (2013) reported much greater values in semiarid degraded grassland in the Ningxia Hui autonomous region of China: SOC in-creased at rates of 168 to 440 g C/(m2
•a) in the surface 80 cm along an age sequence of grazing exclusion for 17, 22 and 27 years, with the maximum rate observed at 17 years. The abovementioned studies along with our current results confirm the high potential of graz-ing exclusion to promote SOC sequestration in de-graded and water-limited ecosystems.
However, there have been inconsistent results in the research literature on the implications of grazing ex-clusion. Nosetto et al. (2006) found that grazing ex-clusion in a semiarid degraded ecosystem in Argentina did not significantly increase SOC storage in com-
parison with the adjacent grazed land during a 15-year period. Medina-Roldán et al. (2012) reported that grazing exclusion as a restoration tool for upland grassland in northern England decreased the rate of carbon cycling during a 7-year period, but had no im-pact on SOC storage. The authors of both papers sug-gested that increases in SOC storage might be ex-pected after a longer term of grazing exclusion. How-ever, Shrestha and Stahl (2008) found that there was no significant effect of grazing exclusion on SOC even after more than 40 years in the semiarid sage-brush steppe of Wyoming, USA. In contrast, Pei et al. (2008) demonstrated that SOC in the surface 20 cm increased significantly after only 2 years of grazing exclusion in a desert steppe in the Alxa region of Inner Mongolia, China. The inconsistency of these results is likely to have been caused by complicated factors such as the regional climate, the duration of grazing exclusion, the investigated soil depth, the initial soil quality, the plant community and composition, and the degree of degradation prior to grazing exclusion. It is also possible that the sites that showed no increase in SOC sequestration had crossed a degradation thresh-old and reached an alternative stable state with lower SOC (van de Koppel et al., 1997; Sasaki et al., 2011).
Most studies have estimated the changes in SOC using paired plots (i.e. used the SFT technique). One or more plots were converted to other land-use or cover types, whereas adjacent plots or nearby plots with the same soil were treated as controls or as the initial conditions for calculation of SOC changes. This approach is problematic because it cannot account for differences between the plots in the initial conditions. Few studies have collected soil samples from the same plots to monitor changes in SOC based on a known starting point (Lugo et al., 1986; Richter et al., 1999). Post and Kwon (2000) demonstrated that errors can arise with studies based on paired plots and chronose-quences as a result of errors related to spatial hetero-geneity and insufficient sampling. For example, culti-vated plots may not have been in equilibrium and may therefore have lost additional SOC compared with the paired perennial vegetation plots that were established, resulting in an overestimate of the initial rates of SOC accumulation. This point is supported by the studies of Mazzoncini et al. (2011) and Brar et al. (2013).
Lal (2004a) found that the rate of SOC accumula-
JOURNAL OF ARID LAND
tion generally follows a sigmoid curve, in which it attains its maximum 5 to 20 years after the land-use change and the adoption of recommended manage-ment practices, and this trend continues until SOC reaches a new equilibrium, when the carbon loss through mineralization balances the carbon addition due to litter inputs. For example, Qiu et al. (2013) documented that grasslands in northern China sub-jected to 20-year grazing exclusion exhibited stable productivity, soil respiration and SOC storage. How-ever, some sites have shown constant rates of SOC accumulation even over a period of 80 years since cultivation was halted (Post and Kwon, 2000). In the present study, the grazing exclusion was initiated in 1996, only 9 years before the start of our data collec-tion. Unfortunately, we cannot obtain data on SOC at that time and we therefore lack sufficient information to determine the rate of increase in SOC storage be-tween 1996 and 2005. Thus, we cannot state whether this rate has reached its maximum.
3.2 The role of the LF organic matter in SOC se-questration
The results reported by Robles and Burke (1998), Haynes (2000) and Soon et al. (2007) have demon-strated that LFOC is a sensitive indicator of C storage and responds sensitively to land-use changes and management practices; in contrast, longer time periods are required to detect pronounced changes in total SOC. In the present study, we found that both LFOC and SOC storage increased significantly in the indi-vidual soil layers (0–10 and 10–20 cm) and in the combined layers over an 8-year period (Table 1). This means that LFOC was not the only early indicator of changes in total SOC storage due to grazing exclusion in this case study. However, the strong linear relation-ship between LF dry matter content and SOC (Fig. 6) and the faster increase in LFOC than in total SOC storage demonstrated that LF organic matter played a major role in SOC sequestration.
Previous studies showed a greater loss of fine soil particles under continued tillage of cropland (Six et al., 1998) and under livestock disturbance in a grazed area as a result of increased erosion (Brejda, 1997); the erosion, being a selective process, preferentially re-moves the LF organic matter because of its low den-sity (Lal, 2009). Therefore, the increase in LF organic matter is associated with an increase in the proportion
of fine soil particles after the cessation of cultivation and the adoption of grazing exclusion (Brejda, 1997; Grandy et al., 2009). That is, the change in total SOC is correlated with both the LF and the soil’s fine parti-cles. This is supported by our present results, in which the proportions of the fine sand and silt+clay fractions increased significantly in response to grazing exclu-sion (Fig. 2).
In addition, the proportion of coarse sand in the soil decreased significantly following grazing exclusion in the present study. This change probably occurred be-cause (1) the content of fine particles such as silt and clay increased as a result of biological interactions between plants and the soil (e.g. weathering of the soil particles by root exudates) and (2) the increased aboveground biomass increased the vegetation’s abil-ity to trap windblown fine particles, which would in-crease the proportion of fine particles in the surface soil and would thereby decrease the proportion of coarse sand (Wasson and Nanninga 1986; Li et al., 2003). It should be noted that the initial soil particle size distribution and texture are intrinsic characteris-tics of the soil, and the change in the absolute amount of coarse sand should therefore be insignificant during a short-term study.
The LF dry matter accounted for a small proportion of the total soil mass, but represented a relatively high proportion of the total SOC pool. This is because the LF is characterized by much higher carbon content than that of the whole soil. The results from some studies have indicated that the proportion of LF dry matter based on total soil mass ranged from 0.08% to 16.4% for a range of ecosystems (Boone, 1994; Parker et al., 2002; Soon et al., 2007; Laik et al., 2009), whereas the proportion of total SOC storage ac-counted for by LFOC ranged up to 63%. In our pre-vious study (Li et al., 2012a), the LF dry matter con-tent accounted for 0.05% and 1.52% of the total soil mass to a depth of 15 cm in active sand dunes (the control) and 35-year old pine plantations, respectively. The corresponding LFOC concentrations were 84 and 124 g/kg (based on LF dry matter) and the corre-sponding proportions of total SOC storage accounted for by LFOC were 15% and 50%. In the present study, the proportion of LF dry matter ranged from 0.74% to 1.39%, the LFOC concentrations ranged from 127 to 128 g/kg, and the ratio of LFOC storage to total SOC
YuQiang LI et al.: Accumulation of soil organic carbon during natural restoration of desertified grassland in China’s Horqin Sandy Land
storage to a depth of 20 cm increased from 33% in 2005 to 40% in 2013.
LF materials show apparent vertical variation (Spycher et al., 1983). This was also evident in the present study because the 0–10 cm layer had signifi-cantly greater LF dry matter content than the deeper layer. The climate regime, ecosystem type, tillage practices, residue quality and root system distribution probably affect the level of LF and may explain the observed differences in the LF dry matter content and the LFOC concentration (Six et al., 1998).
4 Conclusions
The Horqin Sandy Land of northern China is a seri-ously desertified region with a fragile ecology. The implementation of grazing exclusion in grassland that has experienced desertification increased organic car-bon accumulation in both the total and LF factions of the soil organic matter. Changes in total SOC were strongly related to the LF organic matter and the pro-portions of fine (fine sand and silt+clay) soil particles. The LFOC storage increased faster than the total SOC storage during the 8-year period of natural restoration. The two soil layers also differed in the allocation pat-terns for LFOC and total SOC. In general, the surface soil layer accumulated more carbon than the deeper layer. For exploring the mechanism of carbon seques-tration in the total soil organic matter and in its frac-tions, more comprehensive studies will be conducted over a longer period at the study site.
Acknowledgements
This research was supported by the National Natural Science Foundation of China (41271007, 31170413) and the National Science and Technology Support Program of China (2011BAC07B02).
References
Boone R D. 1994. Light fraction soil organic matter: origin and contri-
bution to net nitrogen mineralization. Soil Biology & Biochemistry,
26: 1459–1468.
Brar B S, Singh K, Dheri G S, et al. 2013. Carbon sequestration and soil
carbon pools in a rice–wheat cropping system: effect of long-term
use of inorganic fertilizers and organic manure. Soil & Tillage Re-
search, 128: 30–36.
Brejda J J. 1997. Soil changes following 18 years of protection from
grazing in Arizona chaparral. The Southwestern Naturalist, 42:
478–487.
Chen Y P, Li Y Q, Zhao X Y, et al. 2012. Effects of grazing exclusion on
soil properties and on ecosystem carbon and nitrogen storage in a
sandy rangeland of Inner Mongolia, Northern China. Environmental
Management, 50: 622–632.
Christensen B T. 1992. Physical fractionation of soil and organic matter
in primary particle size and density separates. Advances in Soil
Science, 20: 1–90.
Crow S E, Swanston C W, Lajtha K, et al. 2007. Density fractionation of
forest soils: methodological questions and interpretation of incuba-
tion results and turnover time in an ecosystem context. Biogeo-
chemistry, 85: 69–90.
FAO (Food and Agriculture Organization of the United Nations). 2004.
Carbon Sequestration in Dryland soils. World Soil Resources Report
102. FAO, Rome, Italy.
FAO (Food and Agriculture Organization of the United Nations). 2006.
FAO/IUSS Working Group WRB, World reference base for soil re-
sources 2006. World Soil Resources Reports 103. FAO, Rome, Italy.
Grandy A S, Strickland M S, Lauber C L, et al. 2009. The influence of
microbial communities, management, and soil texture on soil organic
matter chemistry. Geoderma, 150: 278–286.
Gregorich E G, Liang B C, Ellert B H, et al. 1996. Fertilization effects on
soil organic matter turnover and corn residue C storage. Soil Science
Society of America Journal, 60: 472–476.
Haynes R J. 2000. Labile organic matter as an indicator of organic matter
quality in arable and pastoral soils in New Zealand. Soil Biology &
Biochemistry, 32: 211–219.
Helldén U, Tottrup C. 2008. Regional desertification: a global synthesis.
Global and Planetary Change, 64: 169–176.
Huang G, Zhao X Y, Li Y Q, et al. 2012. Restoration of shrub commu-
nities elevates organic carbon in arid soils of northwestern China.
Soil Biology & Biochemistry, 47: 123–132.
IPCC (Intergovernmental Panel on Climate Change). 2007. Climate
Change 2007: Synthesis Report. Contribution of Working Groups I,
II and III to the Fourth Assessment Report of the Intergovernmental
Panel on Climate Change. Geneva: IPCC.
ISO (International Organization for Standardization). 1994. Soil Qual-
ity—Pretreatment of Samples for Physico-chemical Analysis. Ge-
neva: ISO.
ISO (International Organization for Standardization). 1998. Soil Qual-
ity—Determination of Particle Size Distribution in Mineral Soil
Material—Method by Sieving and Sedimentation. Geneva: ISO.
Jobbágy E G, Jackson R B. 2000. The vertical distribution of soil organic
carbon and its relation to climate and vegetation. Ecological Appli-
cations, 10: 423–436.
Kirschbaum M U F. 2000. Will changes in soil organic carbon act as a
positive or negative feedback on global warming? Biogeochemistry,
48: 21–51.
Laik R, Kumar K, Das D K, et al. 2009. Labile soil organic matter pools
in a calciorthent after 18 years of afforestation by different planta-
tions. Applied Soil Ecology, 42: 71–78.
Lal R. 2001. Potential of desertification control to sequester carbon and
mitigate the greenhouse effect. Climatic Change, 51: 35–72.
Lal R. 2004a. Soil carbon sequestration impacts on global climate

JOURNAL OF ARID LAND
change and food security. Science, 304: 1623–1627.
Lal R. 2004b. Soil carbon sequestration to mitigate climate change.
Geoderma, 123: 1–22.
Lal R. 2009. Sequestering carbon in soils of arid ecosystems. Land
Degradation & Development, 20: 441–454.
Li F R, Zhang H, Zhang T H, et al. 2003. Variations of sand transporta-
tion rates in sandy grasslands along a desertification gradient in
northern China. Catena, 53: 255–272.
Li Y Q, Zhao H L, Zhao X Y, et al. 2006. Biomass energy, carbon and
nitrogen stores in different habitats along a desertification gradient in
the semiarid Horqin Sandy Land. Arid Land Research and Man-
agement, 20: 43–60.
Li Y Q, Awada T, Zhou X H, et al. 2012a. Mongolian pine plantations
improve soil physico-chemical properties and enhance soil carbon
and nitrogen capacities in semiarid sandy land. Applied Soil Ecology,
56: 1–9.
Li Y Q, Zhou X H, Brandle J R, et al. 2012b. Temporal progress in
improving carbon and nitrogen storage by grazing exclosure practice
in a degraded land area of China’s Horqin Sandy Grassland. Agri-
culture, Ecosystems & Environment, 159: 55–61.
Li Y Q, Brandle J, Awada T, et al. 2013. Accumulation of carbon and
nitrogen in the plant–soil system after afforestation of active sand
dunes in China's Horqin Sandy Land. Agriculture, Ecosystems &
Environment, 177: 75–84.
Li Y Q, Han J J, Wang S K, et al. 2014. Soil organic carbon and total
nitrogen storage under different land uses in the Naiman Banner, a
semiarid degraded region of northern China. Canadian Journal of
Soil Science, 94: 9–20.
Lugo A E, Sanchez M J, Brown S. 1986. Land use and organic carbon
content of some subtropical soils. Plant and Soil, 96: 185–197.
Malagnoux M. 2007. Arid Land Forests of the World: Global Environ-
mental Perspectives. [2014-05-12]. ftp://ftp.fao.org/docrep/fao/010/
ah836e/ah836e00. pdf.
Mazzoncini M, Sapkota T B, Bàrberi P, et al. 2011. Long-term effect of
tillage, nitrogen fertilization and cover crops on soil organic carbon
and total nitrogen content. Soil & Tillage Research, 114: 165–174.
Medina-Roldán E, Paz-Ferreiro J, Bardgett R D. 2012. Grazing exclu-
sion affects soil and plant communities, but has no impact on soil
carbon storage in an upland grassland. Agriculture, Ecosystems &
Environment, 149: 118–123.
Murage E W, Voroney P, Beyaert R P. 2007. Turnover of carbon in the
free light fraction with and without charcoal as determined using the 13C natural abundance method. Geoderma, 138: 133–143.
Nelson D W, Sommers L E. 1982. Total carbon, organic carbon and
organic matter. In: Page A L, Miller R H, Keeney D R. Methods of
Soil Analysis. Part 2, 2nd ed. Madison: American Society of
Agronomy, 539–577.
Nosetto M D, Jobbágy E G, Paruelo J M. 2006. Carbon sequestration in
semiarid rangelands: comparison of Pinus ponderosa plantations and
grazing exclusion in NW Patagonia. Journal of Arid Environments,
67: 142–156.
Parker J L, Fernandez I J, Rustad L E, et al. 2002. Soil organic matter
fractions in experimental forested water sheds. Water Air and Soil
Pollution, 138: 101–121.
Pei S F, Fu H, Wan C G. 2008. Changes in soil properties and vegetation
following exclosure and grazing in degraded Alxa desert steppe of
Inner Mongolia, China. Agriculture, Ecosystems & Environment,
124: 33–39.
Pickett S T A. 1989. Space-for-time substitution as an alternative to
long-term studies. In: Likens G E. Long-Term Studies in Ecology:
Approaches and Alternatives. New York: Springer-Verlag , 110–135.
Post W M, Kwon K C. 2000. Soil carbon sequestration and land-use
change: processes and potential. Global Change Biology, 6: 317–328.
Qiu L, Wei X, Zhang X, et al. 2013. Ecosystem carbon and nitrogen
accumulation after grazing exclusion in semiarid grassland. PLoS
One, 8: e55433.
Raich J W, Potter C S. 1995. Global patterns of carbon dioxide emissions
from soils. Global Biogeochemical Cycles, 9: 23–36.
Richter D D, Markewitz D, Trumbore S E, et al. 1999. Rapid accumu-
lation and turnover of soil carbon in a re-establishing forest. Nature,
400: 56–58.
Robles M D, Burke I C. 1998. Soil organic matter recovery on Conser-
vation Reserve Program fields in Southeastern Wyoming. Soil Sci-
ence Society of America Journal, 62: 725–730.
Sasaki T, Okubo S, Okayasu T, et al. 2011. Indicator species and func-
tional groups as predictors of proximity to ecological thresholds in
Mongolian rangelands. Plant Ecology, 212: 327–342.
Schlesinger W H. 1990. Evidence from chronosequence studies for a
low carbon-storage potential of soils. Nature, 348: 232–234.
Sequeira C H, Alley M M, Jones B P. 2011. Evaluation of potentially
labile soil organic carbon and nitrogen fractionation procedures. Soil
Biology & Biochemistry, 43: 438–444.
Shrestha G, Stahl P D. 2008. Carbon accumulation and storage in
semi-arid sagebrush steppe: effects of long-term grazing exclusion.
Agriculture, Ecosystems & Environment, 125: 173–181.
Six J, Elliott E T, Paustian K, et al. 1998. Aggregation and soil organic
matter accumulation in cultivated and native grassland soils. Soil
Science Society of America Journal, 62: 1367–1377.
Six J, Callewaert P, Lenders S, et al. 2002. Measuring and understanding
carbon storage in afforested soils by physical fractionation. Soil
Science Society of America Journal, 66: 1981–1987.
Sohi P S, Nathalie M, Arah J R M, et al. 2001. A procedure for isolating
soil organic matter fractions suitable for modeling. Soil Science So-
ciety of America Journal, 65: 1121–1128.
Sollins P, Glassman C, Paul E A, et al. 1999. Soil carbon and nitrogen:
pools and fractions. In: Robertson G P, Bledsoe C S, Coleman D C, et
al. Standard Soil Methods for Long-Term Ecological Research. New
York: Oxford University Press, 89–105.
Soon Y K, Arshad M A, Haq A, et al. 2007. The influence of 12 years of
tillage and crop rotation on total and labile organic carbon in a sandy
loam soil. Soil & Tillage Research, 95: 38–46.
Spycher G, Sollins P, Rose S. 1983. Carbon and nitrogen in the light
fraction of forest soil: vertical distribution and seasonal patterns. Soil
Science, 135: 79–87.
Stockmann U, Adams M A, Crawford J W, et al. 2013. The knowns,
known unknowns and unknowns of sequestration of soil organic
carbon. Agriculture, Ecosystems & Environment, 164: 80–99.
Su Y Z, Zhao H L. 2003. Soil properties and plant species in an age
YuQiang LI et al.: Accumulation of soil organic carbon during natural restoration of desertified grassland in China’s Horqin Sandy Land
sequence of Caragana microphylla plantations in the Horqin Sandy
Land, north China. Ecological Engineering, 20: 223–235.
Sundquist E T, Burruss R C, Faulkner S P, et al. 2008. Carbon Seques-
tration to Mitigate Climate Change. Reston: US Geological Survey,
2008–3097.
Swanston C, Caldwell B A, Homann P S, et al. 2002. Carbon dynamics
during a long-term incubation of separate and recombined density
fractions from seven forest soils. Soil Biology & Biochemistry, 34:
1121–1130.
Swanston C W, Torn M S, Hanson P J, et al. 2005. Initial characterization
of processes of soil C stabilization using forest stand-level radio-
carbon enrichment. Geoderma, 128: 52–62.
van de Koppel J, Rietkerk M, Weissing F J. 1997. Catastrophic vegeta-
tion shifts and soil degradation in terrestrial grazing systems. Trends
in Ecology & Evolution, 12: 352–356.
Verón S R, Paruelo J M, Oesterheld M. 2006. Assessing desertification.
Journal of Arid Environments, 66: 751–763.
Wasson R J, Nanninga P M. 1986. Estimating wind transport of sand on
vegetated surfaces. Earth Surface Processes and Landforms, 11:
505–514.
Witt G B, Noël M V, Bird M I, et al. 2011. Carbon sequestration and
biodiversity restoration potential of semi-arid mulga lands of Aus-
tralia interpreted from long-term grazing enclosures. Agriculture,
Ecosystems & Environment, 141: 108–118.
Wu W. 2005. Study on dynamic evolvement of modern sandy deserti-
fication land in Horqin Sandy Land. Beijing: Ocean Press. (in Chi-
nese)
Zhang G Y. 2010. Analysis on temperature and precipitation nearly 10
years and over the years in Naiman Banner. Journal of Inner Mon-
golia University for Nationalities, 25: 517–518. (in Chinese)
Zhao H L, Zhang T H, Chang X L. 1999. Cluster analysis on change
laws of the vegetation under different grazing intensities in
Horqin sandy pasture. Journal of Desert Research, 19(S1):
40–44. (in Chinese)
Zhao H L, Zhao X Y, Zhou R L, et al. 2005. Desertification processes
due to heavy grazing in sandy rangeland, Inner Mongolia. Journal of
Arid Environments, 62: 309–319.
Zhao H L, He Y H, Zhou R L, et al. 2009. Effects of desertification on
soil organic C and N content in sandy farmland and grassland of
Inner Mongolia. Catena, 77: 187–191.
Zhou R L, Li Y Q, Zhao H L, et al. 2008. Desertification effects on C and
N content of sandy soils under grassland in Horqin, northern China.
Geoderma, 145: 370–375.
Zhu Z D. 1985. Present status and development trend of desertification
in northern China. Journal of Desert Research, 5(3): 3–11. (in Chi-
nese)
Zhu Z D, Chen G T. 1994. Sandy Desertification in China: Status and
Trends. Beijing: Science Press. (in Chinese)
Zuo X A, Wang S K, Zhao X Y, et al. 2014. Scale dependence of plant
species richness and vegetation-environment relationship along a
gradient of dune stabilization in Horqin Sandy Land, Northern China.
Journal of Arid Land, 6(3): 334–342.