accounting profitability and takeover likelihood …...1 accounting profitability and takeover...
TRANSCRIPT
1
Accounting Profitability and Takeover Likelihood
Ashiq Ali [email protected]
The University of Texas at Dallas 800 W Campbell Rd, Richardson, TX 75080
Todd Kravet
[email protected] University of Connecticut
2100 Hillside Road, Unit 1041A, Storrs, CT 06268
Bin Li [email protected]
The University of Texas at Dallas 800 W Campbell Rd, Richardson, TX 75080
This Draft: January 2016
Abstract: We examine the association between accounting profitability and takeover likelihood of a firm. We show that the takeover likelihood is negatively associated with negative industry-adjusted ROA, and is positively associated with positive industry- adjusted ROA. This result suggests that among firms with below industry average profitability, acquirers can unlock more value in firms with poorer performance through efficient management (Palepu 1986). This result also suggests that among firms with above industry average profitability, those with higher accounting profitability are more likely to be acquired, and we argue that it is in part due to managerial opportunism. Consistent with this explanation, the positive association is more (less) pronounced when the benefits (costs) of acquisition to acquirers’ management is greater, and the acquirers’ stock price reaction to the announcement of acquisition is negatively associated with targets’ positive industry-adjusted ROA.
2
Accounting Profitability and Takeover Likelihood
1. Introduction
This paper examines how accounting profitability of a firm is associated with its
acquisition likelihood. Prior research argues that poorer performing firms are more likely
to be acquired, because acquirers can unlock value through efficient management by
taking such actions as increasing monitoring, replacing management, and restructuring
operations (Palepu 1986). Even though several prior studies have examined the
association between accounting profitability and takeover probability, evidence on the
predicted negative relation is inconclusive (e.g., Palepu 1986; Berger and Ofek 1996;
Billett and Xue 2007; Cremers, Nair, and John 2009). We argue that among firms
performing well, which we operationalize as above industry average profitability, those
with higher accounting profitability are more likely to be taken over, because the
acquisitions are motivated by managerial opportunism. Accordingly, we predict that
takeover likelihood is negatively associated with negative industry-adjusted ROA and is
positively associated with positive industry-adjusted ROA. We empirically examine this
prediction and further test whether the positive association is more pronounced when
acquiring managers’ incentives to behave opportunistically are greater.
Why would managers making opportunistic acquisitions prefer targets with higher
accounting profitability? Harford and Li (2007) and Grinstein and Hribar (2004) show
that CEOs’ pay and wealth increases after acquisitions, even if the acquisitions are value
destroying. It is because the value of new grants after an acquisition is greater than the
adverse effects on CEOs’ pre-acquisition equity portfolio. In addition, Harford and
Schonlau (2013) show that the likelihood of becoming directors in other firms increases
3
for CEOs who undertake acquisitions, because of their acquisition related experience,
even if the acquisitions are value destroying. Opportunistic managers’ preference for
targets with higher accounting profitability is consistent with their desire to reduce the
risk of losing their job by ensuring the long run survival of the combined entity,
especially since such acquisitions tend to be value destroying. Evidence in prior studies
support the above argument that firms with higher accounting profitability, specifically
higher industry-adjusted ROA, have lower management turnover, and this association is
incremental to the effect of stock returns on management turnover (Farrell and Whidbee
2003; DeFond and Park 1999). Another reason why opportunistic managers prefer targets
with higher accounting profitability is because it may help meet certain accounting based
benchmarks, such as analysts’ expectation of earnings or previous period’s earnings (e.g.,
Burgstahler and Dichev 1997; Matsumoto 2002; Skinner and Sloan 2002; Donelson et al.
2013).
For the sample period 1990 to 2013, we find a non-linear association between
accounting profitability and takeover likelihood, consistent with our prediction.
Specifically, we observe a negative association between takeover likelihood and negative
industry-adjusted ROA, consistent with the inefficient management hypothesis (Palepu
1986). Additionally, we observe a positive association between takeover likelihood and
positive industry-adjusted ROA, which we argue is driven at least in part by acquiring
firm managers’ opportunism. We provide several additional results that suggest that the
positive association is more pronounced when acquiring firms’ managers have greater
incentive to behave opportunistically.
4
First, we find that the positive association between takeover likelihood and
positive industry-adjusted ROA is more pronounced when acquiring managers are more
likely to benefit from reporting higher accounting profitability; specifically, when the
acquirers are public as against private firms (Klassen 1997; Beatty et al. 2002), when the
time from the acquisition announcement to completion is short1, when the acquirers
report a relatively long string of earnings increases in the periods preceding the
acquisition (Barth et al. 1999; Myers et al. 2007), when acquirers have a higher valuation
premium, measured as PE ratio (Jensen 2005; Chu et al. 2015), and when acquirers are
close to meeting or beating certain earnings benchmarks (Burgstahler and Dichev 1997;
Roychowdhury 2006).
We also find that the positive association between takeover likelihood and
positive industry-adjusted ROA is more pronounced when it is less costly for managers to
make opportunistic acquisitions. The positive association is greater when the acquirers
have a high level of free cash flows and limited growth opportunities, no blockholders,
lower board independence, and healthier financial condition (higher Z-score), so they are
can more likely withstand the destruction in its value that may result from the
opportunistic acquisition.
Finally, we show that acquirers’ stock returns on acquisition announcement date
are significantly lower for acquisitions of targets with positive industry-adjusted ROA
than of targets with negative industry-adjusted ROA, Furthermore, among targets with
positive industry-adjusted ROA, these returns are significantly lower for acquisition of
1 The incentive to quickly complete acquisitions is presumably because on realizing that a shortfall in profitability for the current or the subsequent period is likely to happen, management’s incentive would be to acquire a profitable target as quickly as possible. Furthermore, a quicker completion time results in a decrease in the time available for due diligence.
5
targets with higher positive industry-adjusted ROA. This result suggests that acquiring
firms’ managers sacrifice greater firm value when they acquire targets with higher
accounting profitability, consistent with the notion that such acquisitions are motivated to
a greater extent by the self-interests of the acquirers’ management, and they would
therefore be willing to overpay more for targets with higher accounting profitability.
Collectively, our results support the notion that the positive association between positive
industry-adjusted ROA and takeover likelihood is at least in part driven by managerial
opportunism.
Our study makes the following contributions to the literature. Many important
studies on corporate control use accounting profitability as an explanatory variable in the
takeover likelihood model (see, e.g., Berger and Ofek 1996; Billet 1996; Billet and Xue
2007; Bodnaruk, Massa, and Simonov 2009; Cremer, Nair, and John 2009; and Ivashina,
Nair, Saunders, Massoud, and Stover 2009). Palepu (1986) argues that firms with more
inefficient management are more likely to become takeover targets. He proposed
accounting profitability as a proxy for management efficiency, but obtained an
insignificant coefficient on the variable. Subsequent papers that use accounting
profitability as an explanatory variable in the takeover likelihood models, generally
justify its inclusion by referring to Palepu’s paper. These papers also find that the
coefficients on the accounting profitability variable are generally insignificant, and in a
few cases when they are significant, the signs of the coefficients are mixed. The frequent
use of the accounting profitability variable in prior studies and the lack of conclusive
evidence on its relation with takeover likelihood underscore the importance of examining
this issue. We show that negative industry-adjusted profitability is negatively associated
6
with takeover likelihood. This negative association is consistent with the inefficient
management hypothesis put forward by Palepu (1986). We also provide an explanation
for why prior studies do not find the presumed negative association between accounting
profitability and takeover likelihood. These studies do not specify the non-linearity in the
relation between accounting profitability and takeover likelihood. Specifically, the
association is negative only when industry-adjusted profitability is negative, and it is
positive when industry-adjusted profitability is positive.
Our study also contributes to the literature on the role of managerial opportunism
in merger and acquisition activities. Prior work generally focuses on the characteristics of
the acquiring firms when studying takeover that are motivated by managerial
opportunism. They find that acquirer characteristics such as poor corporate governance,
high-free cash flow, and managerial overconfidence can facilitate managerial
opportunism in acquisition decisions (e.g., Morck et al. 1990; Malmendier and Tate 2008;
Masulis et al. 2007; Chen et al. 2007). There is limited examination of the characteristics
of target firms that facilitates managerial opportunism in acquisitions (Harford et al.
2012). We argue and show that targets with higher accounting profitability are more
likely to be associated with acquisitions motivated by managerial opportunism.
Specifically, our results suggest that the positive association between positive industry-
adjusted ROA and takeover probability is greater when the acquiring firms’ managers
have more opportunistic incentives; meanwhile, we do not observe this type of sensitivity
for the negative relation between takeover likelihood and negative industry-adjusted
ROA. We further show that acquisitions are more detrimental to the acquirers’
shareholders when the targets’ industry-adjusted ROA is higher. These results suggest

7
that acquiring managers end up destroying greater value of their firms upon the
acquisitions of targets with higher accounting profitability, further supporting managerial
opportunism as a reason for the positive relation between positive accounting profitability
and acquisition likelihood.
The remainder of the paper is organized as follows. Section 2 discusses prior
literature and develops the hypotheses. Section 3 and 4 present our research design and
empirical results, and Section 5 concludes.
2. Literature review and hypothesis development 2.1. Inefficient management hypothesis
Prior literature argues that takeover is an important mechanism in capital markets
to replace (and deter) firms that are operating inefficiently (e.g., Jensen 1986). Marris
(1963) and Manne (1965) argue that the failure to optimize operations creates a takeover
opportunity where an acquirer can replace inefficient managers with efficient ones. This
argument suggests that firms with lower accounting profitability are more likely to be
acquired (Palepu 1986). Prior studies, however, find that accounting profitability
measures are generally insignificant when included as independent variables in the
takeover probability models, and in a few cases when they are significant, the signs of the
coefficients are inconsistent.
2.2. Managerial opportunism hypothesis
Prior literature finds that agency conflicts affect acquisition decisions, because
they are large discretionary investments where the effect of the misalignment of
incentives between managers and shareholders of acquiring firms is potentially large (e.g.,
8
Jensen 1986; Morck et al. 1990; Lang et al. 1991; Harford 1999; Grinstein and Hribar
2004; Masulis et al. 2007; Harford and Li 2007; Fich et al. 2014). These studies argue
that the managerial benefits from acquiring create strong incentives to make acquisitions
even if they are not in the interest of shareholders. Furthermore, value-destroying
acquisitions are more likely when acquirers have greater free cash flow and low growth
opportunities (Jensen 1986; Lang et al. 1991; Harford 1999), and when acquirers have
poorer corporate governance and more entrenched managers (Masulis et al. 2007; Chen
et al. 2007).
Chang (1998), Fuller et al. (2002) and Harford et al. (2012) extend the literature
on managerial opportunism by investigating target characteristics related to value-
destroying acquisitions and find that private targets acquired with stock create value for
acquirers because they create a monitoring blockholder. We extend this literature by
examining the role of another target characteristic, the accounting profitability, in
suboptimal acquisitions motivated by managerial opportunism.
Managers have strong incentives to make acquisitions, even when they are value
destroying, because acquisitions increase their compensation, increase their likelihood of
becoming directors on other firms’ boards, and facilitate empire-building (Jensen 1986,
Grinstein and Hribar 2004; Harford and Li 2007; Harford and Schonlau 2013; Fich et al.
2014). Harford and Li (2007) and Fich et al. (2014) argue that CEOs compensation is
favorably affected from making acquisitions even when they are value destroying,
because the value of the flow of new stock grants after an acquisition exceeds the
negative impact on CEOs’ pre-acquisition portfolio from negative stock returns
associated with the acquisition. Harford and Schonlau (2013) argue that even value
9
destroying acquisitions increase CEOs’ likelihood of becoming directors because of their
acquisition related experience. These studies suggest that there are strong incentives to
make opportunistic acquisitions. We argue that managers making opportunistic
acquisitions have a greater preference to acquire targets with higher accounting
profitability because it can reduce the likelihood of post-acquisition management
turnover. The higher the accounting profitability of the target, the better the likelihood of
the survival of the combined entity and hence the lower the employment risk. Consistent
with this argument, Farrell and Whidbee (2003) and DeFond and Park (1999) show that
management turnover is negatively associated with industry-adjusted ROA and this
association is incremental to stock returns.2
A second argument for why firms with higher accounting profitability are more
likely to be acquired for opportunistic reasons is that managers have incentives to
manipulate earnings (e.g., Burgstahler and Dichev 1997; Matsumoto 2002; Skinner and
Sloan 2002; Donelson et al. 2013). Prior research shows that managers take a variety of
real actions for the purpose of earnings manipulation, such as cutting R&D and
advertising expenses, overproducing inventory, and providing sales incentives (e.g.,
Penman and Zhang 2002; Roychowdhury 2006; Cohen et al. 2008; Cohen and Zarowin
2010). We argue that firms also use acquisitions to manipulate earnings. In general, the
greater the reported profitability of a firm, the more attractive it would be as a target for
2 Desai et al. (2006) find that ROA is negatively associated with turnover and this association is incremental to stock returns. In addition, Bens et al. (2011) find that acquiring managers are more likely to misstate post-acquisition financial statements when making value-destroying acquisitions (negative stock returns), consistent with our argument that post-acquisition accounting profitability is important to managers making opportunistic acquisitions.
10
acquirers seeking to show an increase in their reported profitability.3 Using acquisitions
for opportunistic reasons is plausible, given that prior studies have argued that managers
make acquisitions for empire building and for compensation purposes (Jensen 1986;
Grinstein and Hribar 2004; Harford and Li 2007; Fich et al. 2014). Anecdotal evidence
also suggests firms use acquisitions to meet their earnings benchmarks. General Electric’s
North American Chief of Retailer Financial Services stated that they “may hunt for
acquisitions if his division might miss its annual earnings target” (Smith et al. 1994).
The above arguments suggest that poorly performing firms are likely to be
acquired to enhance efficiency and the well performing firms are likely to be acquired for
opportunistic reasons. We use the industry average accounting profitability as the cutoff
for classifying firms as poorly or well performing. It is a common practice in the
corporate control literature to use variables adjusted for industry averages (Dietrich and
Sorensen 1984; Bruner 2004; Cremer et al. 2009; Chen et al. 2014). For the poorly
performing firms, we predict that the likelihood of acquisition is negatively associated
with the industry-adjusted accounting profitability because the scope of creating value by
improving management efficiency is likely to be greater in poorer performing firms. For
the well performing firms, we predict that the likelihood of acquisition is positively
associated with the industry-adjusted accounting profitability, because the more
profitable firms are more attractive as acquisition targets for opportunistic managers. We
therefore propose:
3 A firm with higher accounting profitability need not always lead to a greater increase in the acquirer’s accounting profitability. This is because the profitability of the combined entity is also affected by the target’s assets marked up from book value to fair value, which leads to additional expenses as well as an increase in the asset base. We expect that the presence of this factor will bias against finding results consistent with our predictions.
11
H1. Negative industry-adjusted accounting profitability is negatively associated with the takeover likelihood and positive industry-adjusted accounting profitability is positively associated with the takeover likelihood.
To further examine whether the positive association between the positive
industry-adjusted accounting profitability and takeover likelihood is driven by managerial
opportunism, we propose several additional hypotheses. In general, these hypotheses
state that this positive association is more pronounced when acquiring firms’ managers
have greater incentive to behave opportunistically. Specifically, their incentives would be
greater when their benefits from such acquisitions are larger and the costs of making such
acquisitions are smaller.
2.3 Factors affecting managerial benefits from acquisition of firms reporting higher profitability
We examine four different factors that are likely to affect the extent to which
managers of acquiring firms benefit from reporting higher reported profitability. First,
prior research argues that managers have strong capital market incentives to report higher
accounting profits (Levitt 1998; Subramanyam 1996; Barth et al. 1999; Skinner and
Sloan 2002). Prior research also shows that capital market pressure to manage reported
profitability is greater for public firms than for private firms (Klassen 1997; Ke et al.
1999; Beatty et al. 2002; Givoly et al. 2010). Furthermore, owners of private firms are
expected to be less likely to rely on earnings-based performance measures in monitoring
and compensating managers (Ke et al. 1999; Beatty et al. 2002). Thus, compared to
private acquirers, public acquirers are more likely to acquire targets for reporting
favorable accounting profitability.
12
H2a. The proposed positive association between positive industry-adjusted accounting profitability and takeover likelihood is more pronounced for acquisitions by public companies than by private companies.
Second, if acquirers use acquisitions to report higher accounting profitability for
the current period, then the time interval between the beginning of transaction
negotiations and the deal completion should be relatively short. For an acquisition to
affect the acquirers’ accounting profitability in the fiscal period of the acquisition
negotiations, the transaction must be completed in that fiscal period, resulting in a
quicker completion time. Moreover, managers making an opportunistic acquisition have
an incentive to shorten the completion time in order to reduce due diligence so that the
board of directors does not learn unfavorable information that can terminate the
acquisitions.
H2b. The proposed positive association between positive industry-adjusted accounting profitability and takeover likelihood is more pronounced for acquisitions for which the time between the acquisition announcement and its completion date is relatively short.
Third, Barth et al. (1999) and Kasznik and McNichols (2002) find that firms with
patterns of increasing accounting earnings have higher price-earnings multiples than
other firms, and the price-earnings multiples decrease substantially when reported
profitability decreases after a long string of increases. Therefore, managers have
incentives to maintain patterns of increasing earnings, and prior research finds that firms
manage earnings to maintain the increasing pattern (e.g., Myers et al. 2007; Beatty et al.
2002). We predict that acquirers with a pattern of increasing accounting earnings in prior
years are more likely to acquire targets with higher accounting profitability.
H2c. The proposed positive association between positive industry-adjusted accounting profitability and takeover likelihood is more pronounced for acquisitions by companies with a pattern of increase in accounting earnings over prior years than by companies without such a pattern.
13
Fourth, managers with overvalued equity are more likely to make opportunistic
acquisitions (Fu et al. 2013). They would have an incentive to show high accounting
profitability in order to maintain their own equity value (Jensen 2005; Chu et al. 2015).
Thus, acquirers with a higher valuation premium are more likely to acquire targets with
higher accounting profitability.
H2d. The proposed positive association between positive industry-adjusted accounting profitability and takeover likelihood is more pronounced for acquisitions by companies with high price to earnings ratios. Finally, firms have incentives to meet or beat earnings benchmarks (e.g.,
Burgstahler and Dichev 1997; Roychowdhury 2006; Donelson et al. 2013), so firms that
meet or just beat earnings benchmarks are more likely to have managed earnings.
Acquirers making opportunistic acquisitions would avoid missing post-acquisition
earnings benchmarks to reduce scrutiny of their acquisition decision. Thus, we argue that
acquirers that meet or just beat earnings benchmarks in the year of the acquisition are
more likely to have acquired targets with higher accounting profitability.
H2e. The proposed positive association between positive industry-adjusted accounting profitability and takeover likelihood is more pronounced for acquisitions by companies that meet or just beat earnings benchmarks than by other companies. 2.4 Factors affecting costs to managers related to opportunistic acquisition
We examine several factors that are likely to affect the costs incurred by
managers when making opportunistic acquisitions. The smaller these costs, the more
likely managers would make opportunistic acquisitions, and hence more pronounced will
be the association between accounting profitability of a firm and the likelihood of its
acquisition.
14
First, Jensen (1986) argues that firms generating free cash flow but having poor
investment opportunities are likely to invest free cash flow rather than pay dividends or
repurchase shares. Lang et al. (1991) and Harford (1999) find that firms with low Tobin’s
Q and high free cash flow make acquisitions motivated by managerial opportunism,
consistent with Jensen’s (1986) arguments. Thus, we predict that if acquirers are subject
to greater agency costs of free cash flow, it would be less costly for its mangers to make
opportunistic acquisitions.
H3a. The proposed positive association between positive industry-adjusted accounting profitability and takeover likelihood is more pronounced for acquisitions by companies that are subject to greater agency costs of free cash flows.
Second, prior research finds that managers of firms with greater ownership by
institutional investors are less likely to behave opportunistically, presumably due to
stronger monitoring (McConnell and Servaes 1990; Dechow et al. 1996; Bushee 1998;
Roychowdhury 2006; Chen et al. 2007; Zang 2012). Thus, we predict that it would be
more costly for managers of acquiring firms with blockholders to make opportunistic
acquisitions.
H3b. The proposed positive association between positive industry-adjusted accounting profitability and takeover likelihood is more pronounced for acquisitions by companies without blockholders than by companies with blockholders.
Third, greater board independence is also shown to be associated with more
value-enhancing acquisitions (Byrd and Hickman 1992) and less earnings management
(Dechow et al. 1996; Klein 2002). These results suggest that the better monitoring by
boards that are more independent would make it more costly for managers to make
acquisitions motivated by managerial opportunism.
15
H3c. The proposed positive association between positive industry-adjusted accounting profitability and takeover likelihood is more pronounced for acquisitions by companies with less independent board of directors.
Acquisitions motivated by managerial opportunism can severely affect the
survivability of acquiring firms that are already in financial distress, because they have
fewer resources that can be redirected from best use (Zang 2012). The survival risk of the
firm can in turn adversely affect the employment risk of the managers. We therefore
predict the following:
H3d. The proposed positive association between positive industry-adjusted accounting profitability and takeover likelihood is more pronounced for acquisitions by companies that are less financially distressed.
2.5 Acquirer’s stock price reaction to the announcement of acquisition
We argue that acquiring firms’ managers would sacrifice greater firm value when
they acquire targets with higher accounting profitability. This is because the acquisitions
are likely to be motivated to a greater extent by the self-interests of the acquirers’
management, who would be willing to overpay more for targets with higher accounting
profitability.
H4. Among acquisitions of targets with positive industry-adjusted ROA, acquirers’ stock returns at the announcements of the acquisition deals are significantly lower when the targets have more positive industry-adjusted ROA.
3. Research methodology
16
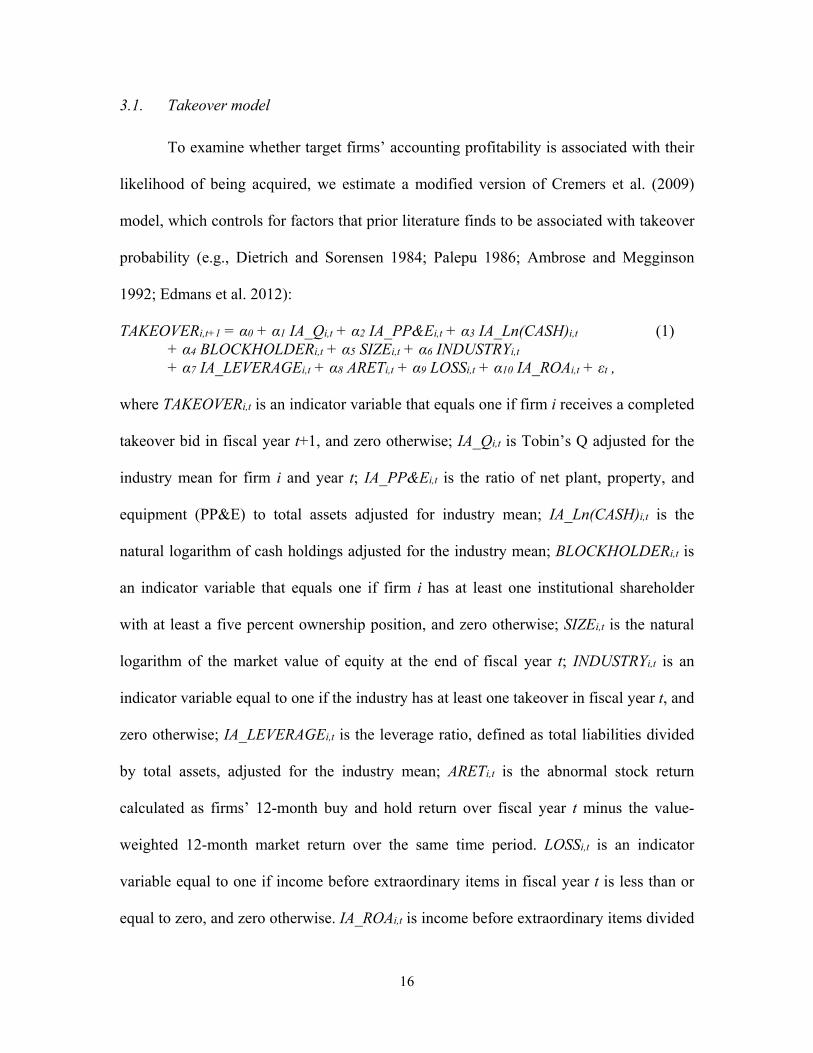
3.1. Takeover model
To examine whether target firms’ accounting profitability is associated with their
likelihood of being acquired, we estimate a modified version of Cremers et al. (2009)
model, which controls for factors that prior literature finds to be associated with takeover
probability (e.g., Dietrich and Sorensen 1984; Palepu 1986; Ambrose and Megginson
1992; Edmans et al. 2012):
TAKEOVERi,t+1 = α0 + α1 IA_Qi,t + α2 IA_PP&Ei,t + α3 IA_Ln(CASH)i,t + α4 BLOCKHOLDERi,t + α5 SIZEi,t + α6 INDUSTRYi,t + α7 IA_LEVERAGEi,t + α8 ARETi,t + α9 LOSSi,t + α10 IA_ROAi,t + εt ,
(1)
where TAKEOVERi,t is an indicator variable that equals one if firm i receives a completed
takeover bid in fiscal year t+1, and zero otherwise; IA_Qi,t is Tobin’s Q adjusted for the
industry mean for firm i and year t; IA_PP&Ei,t is the ratio of net plant, property, and
equipment (PP&E) to total assets adjusted for industry mean; IA_Ln(CASH)i,t is the
natural logarithm of cash holdings adjusted for the industry mean; BLOCKHOLDERi,t is
an indicator variable that equals one if firm i has at least one institutional shareholder
with at least a five percent ownership position, and zero otherwise; SIZEi,t is the natural
logarithm of the market value of equity at the end of fiscal year t; INDUSTRYi,t is an
indicator variable equal to one if the industry has at least one takeover in fiscal year t, and
zero otherwise; IA_LEVERAGEi,t is the leverage ratio, defined as total liabilities divided
by total assets, adjusted for the industry mean; ARETi,t is the abnormal stock return
calculated as firms’ 12-month buy and hold return over fiscal year t minus the value-
weighted 12-month market return over the same time period. LOSSi,t is an indicator
variable equal to one if income before extraordinary items in fiscal year t is less than or
equal to zero, and zero otherwise. IA_ROAi,t is income before extraordinary items divided
17
by average total assets, adjusted for the industry mean. Our analysis primarily focuses on
industry-adjusted ROA because a target firm’s peers are potential alternative targets for
the acquirer, and the selection of target firms involves an in-depth comparison of peer
firms (Bruner 2004; Pearl and Rosenbaum 2009; Chen et al. 2014). Consistent with this
notion, it is common in the mergers and acquisitions literature to do industry adjustments
when analyzing takeover decisions. All industry-adjusted variables are calculated by
subtracting the industry mean where industries are defined by Fama-French 49 industry
classifications (Fama and French 1997). All continuous variables are winsorized at the 1st
and 99th percentiles, and details of variable definitions are provided in the Appendix.
Since we have opposite predictions for the relations between accounting
profitability and the likelihood of takeover for firms whose ROA is above the industry
average and whose ROA is below the industry average, we modify Eq. (1) in two ways.
We expect a positive correlation between TAKEOVERi,t+1 and IA_ROAi,t (α10 > 0) for
firm-years with IA_ROAi,t ≥ 0 and a negative correlation between TAKEOVERi,t+1 and
IA_ROAi,t (α10 < 0) for firm-years with IA_ROAi,t < 0. First, we include an interaction
term, IA_ROAi,t × BELOW_IA_ROAi,t, to differentiate when firms’ ROA is above or
below the industry average. BELOW_IA_ROAi,t is equal to one if IA_ROAi,t is less than or
equal to zero, and zero otherwise. The coefficient on IA_ROAi,t captures the association
with takeover probability when ROA is above the industry average and we expect the
coefficient to be positive. The coefficient on IA_ROAi,t × BELOW_IA_ROAi,t captures the
difference in the association with takeover probability when ROA is above and below the
industry average and we expect the coefficient to be negative. Second, we estimate Eq. (1)
18
separately for firm-years with IA_ROAi,t ≥ 0 and with IA_ROAi,t < 0 with the expectation
that the coefficient on IA_ROAi,t is positive and negative, respectively.
3.2. Sample selection
Our initial sample consists of all firm-years for the period 1990 to 2012 on the
Compustat annual file with the necessary data available to calculate our variables. We
identify firms that are acquired from 1991 to 2013 using the Securities Data Corporation
(SDC) M&A database. We consider a transaction to be an acquisition when a majority of
the target firm is acquired, which SDC classifies as acquisitions of assets (AA),
acquisitions of majority interest (AM), and mergers (M). Stock return data are obtained
from the CRSP stock files. Our sample begins at 1990 because SDC coverage in the
1980’s is not as complete as in the later periods. We exclude financial firms (SIC codes
6000 through 6999) because they have a different regulatory structure than other firms.
Our final sample consists of 78,073 firm-year observations of which there are 3,533
takeovers.
Table 1, Panel A presents the descriptive statistics of our main variables. The
mean value of TAKEOVER indicates that on average firms face a 4.5 percent
unconditional takeover probability. The variables adjusted by industry have mean values
close to zero by construction. The remaining variables mean and median values appear to
be consistent with prior research. Panel B presents the descriptive statistics for takeover
and non-takeover firms separately and tests whether the mean and median values are
significantly different between the two groups. Takeover firms have significantly lower
industry-adjusted ROA than non-takeover firms. Therefore, the univariate statistics are
consistent with the inefficient management hypothesis that firms with poorer
19
performance are more likely to be acquired. The differences in control variables are
consistent with our expectations. Panel C presents the Spearman and Pearson correlation
coefficients for the variables in our model. IA_ROA is significantly negatively correlated
(Spearman and Pearson) with TAKEOVER, which is also consistent with the inefficient
management hypothesis. We examine this association further in our takeover probability
model.
4. Empirical results
4.1. Test of the piecewise linear relation between accounting profitability and
takeover probability (H1)
Table 2 presents the results from estimating the takeover probability model. The
main independent variable of interest is industry-adjusted ROA, IA_ROA. The results on
control variables are consistent with prior research (Dietrich and Sorensen 1984; Palepu
1986; Ambrose and Megginson 1992; Cremers et al. 2009; Cai and Tian 2009; Edmans et
al. 2012). The negative coefficient on IA_Q is consistent with more highly valued firms
being less likely to be acquired (Cremers et al. 2009; Edmans et al. 2012). The negative
coefficient on IA_PP&E is consistent with it being costlier to merge firms with fixed
assets than intangible assets (Cai and Tan 2009; Ali and Kravet 2014). We find that the
presence of blockholders is positively associated with takeover (Cremers et al. 2009;
Edmans et al. 2012), consistent with the superior monitoring ability of blockholders
(Shleifer and Vishny 1986). The significantly negative coefficient on firm size is
consistent with greater transaction costs to acquiring larger firms (Palepu 1986; Cremers
et al. 2009). Firms are more likely to be acquired if there was at least one acquisition in
their industry in the prior year (Cremers et al 2009). Consistent with prior research
20
(Cremers et al. 2009; Ali and Kravet 2014), we also find that IA_LEVERAGE is
positively associated with takeover probability consistent with distressed firms becoming
takeover targets because their excessive leverage limits their access to financing.4 Finally,
the coefficient on LOSS is positive and significant, suggesting that loss firms are more
likely to be takeover targets, consistent with the efficient management hypothesis.
The coefficient on IA_ROA in column 1 is 0.080 and not significant at
conventional levels, consistent with the results of prior research. In column 2, we modify
equation 1 to test for non-linearity in the association between TAKEOVER and IA_ROA
by including IA_ROA × BELOW_IA_ROA and BELOW_IA_ROA in the model. The
coefficient on IA_ROA is significantly positive and the coefficient on IA_ROA ×
BELOW_IA_ROA is significantly negative, indicating a non-linear association between
takeover probability and accounting profitability. The coefficient on IA_ROA + IA_ROA
× BELOW_IA_ROA is also significantly negative, indicating that IA_ROA is negatively
associated with takeover probability when ROA is below the industry average.
In columns 3 and 4, we estimate Eq. (1) for observations where BELOW_IA_ROA
is equal to zero and one, respectively. When firms’ ROA is greater than their industry
average ROA (column 3), there is a significantly positive association between IA_ROA
and takeover probability. To illustrate the economic significance of these results, we
report next to each coefficient the change in probability of a takeover due to a one
standard deviation increase in each independent variable (from 0 to 1 for indicator
variables), holding all other variables at their mean value. In column 3, a standard
4 The coefficient on ARET is not significant. However, when we measure abnormal stock returns over the past four-year period, as in Palepu (1986), we obtain a significantly negative coefficient. We use one-year abnormal returns in our models following the specification in recent studies. However, all our results are robust to using abnormal returns over the four-year period.
21
deviation increase in IA_ROA is associated with an increase in takeover probability of 0.8
percent, which is a 17.8 percent increase relative to the unconditional probability of
takeover (4.5 percent) in our sample. The two largest effects for the variables in our
model are 2.0 and -1.0 percent for BLOCKHOLDER and SIZE, respectively, suggesting
that IA_ROA has an economically significant association with takeover probability. When
firms’ ROA are less than their industry average ROA (column 4), there is a significantly
negative association between IA_ROA and takeover probability. When IA_ROA is
negative, a standard deviation decrease in IA_ROA is associated with an increase in
takeover probability of 0.4 percent, which is an 8.9 percent increase relative to the
unconditional probability. In sum, industry-adjusted ROA has a non-linear and
economically significant association with takeover probability.
The negative association between takeover probability and negative industry-
adjusted ROA is consistent with the efficient management hypothesis, in that there is
greater potential to unlock the value of a poorer performing firm through efficient
management.5 We argue that the positive association between takeover probability and
positive industry-adjusted ROA reported in Table 2 is due to managerial opportunism. To
support this argument, we conduct several cross-sectional tests to see whether this
positive association is more pronounced when acquiring managers’ incentives to make
opportunistic acquisitions of targets with higher accounting profitability are greater. We
consider scenarios where the greater incentives are due to greater personal benefits to
5 As noted earlier, the coefficient on LOSS is positive and significant, in all the models, suggesting that loss firms are more likely to be takeover targets, consistent with the efficient management hypothesis. Negative industry-adjusted ROA is also related to the takeover likelihood, presumably because this variable captures the magnitude of poor performance and thus the amount of improvement that is likely through efficient management.
22
managers from making the acquisitions or due to lower costs incurred by managers from
making the acquisitions.
4.2. Benefits from opportunistic acquisitions of profitable targets (hypothesis H2)
We expect that the positive association between takeover likelihood and positive
industry-adjusted ROA is more pronounced under situations when acquirers’ managers
are likely to benefit more from acquisitions of targets with higher accounting profitability.
We propose such situations to be the ones where acquirers are publicly held as against
privately held (H2a), complete the acquisition transaction quickly (H2b), have a long
pattern of earnings increases (H2c), have a high price to earnings ratio (H2d), and just
meet or beat earnings benchmarks (H2e).
To test hypotheses H2b through H2e we estimate a multinomial logistic model
and create a categorical dependent variable, TO_ACQ_BENEFIT, that is equal to one if a
firm receives a completed takeover bid in year t+1 by a publicly held acquirer with
greater benefits to making opportunistic acquisitions to report higher accounting
profitability (Acquirer_Short_Interval, Acquirer_String, Acquirer_High_PE, and
Acquirer_Suspect), equal to two if a firm receives a completed takeover bid in year t+1
by a publicly held acquirer with less benefits to making opportunistic acquisitions to
report higher accounting profitability (Acquirer_Long_Interval, Acquirer_No_String,
Acquirer_Low_PE, and Acquirer_Nonsuspect), equal to three if a firm receives a
completed takeover bid in year t+1 by a private acquirer or an acquirer where data is not
available to calculate the measure of costs to making opportunistic acquisitions to report
higher profitability (Private/Public Unknown), and zero if a firm is not acquired. We
23
discuss below each of the different measures we use for the benefits to making
opportunistic acquisitions to report higher accounting profitability.
4.2.1. Public versus private acquirers (H2a)
To test hypothesis H2a, we estimate a multinomial logistic model and create a
categorical dependent variable that is equal to one if the firm receives a completed
takeover bid in year t+1 by a public acquirer (Public_Acquirer), equal to two if the firm
receives a completed takeover bid in year t+1 by a private acquirer (Private_Acquirer),
and zero if the firm is not acquired. We expect that, the positive association between
takeover likelihood and positive industry-adjusted ROA is likely to be more pronounced
for public acquirers than for private acquirers. The results are presented in Table 3.
Column 1 and 2 present the coefficient estimates where the outcome is takeover by a
public acquirer and private acquirer, respectively. Column 1 shows a significant non-
linear association between accounting profitability and takeover probability by public
acquirers, similar to the results in Table 2. Interestingly, in column 2, the results on the
accounting profitability variables are opposite to that in column 1. Takeover probability
by private acquirers is negatively associated with positive industry-adjusted ROA, when
this association is positive for acquisitions by public companies. This result can
potentially be explained by targets with higher accounting profitability being less
attractive to private companies, because opportunistic managers of public acquirers are
willing to pay a premium for such firms. Furthermore, the coefficient on IA_ROA +
IA_ROA × BELOW_IA_ROA is significantly more negative in column 1 than column 2.
This result is consistent with the findings in prior literature that private acquirers prefer
24
mature targets with a stable cash flow stream (Jensen 1986; Bargeron et al. 2008; Eckbo
and Thorburn 2008). Bargeron et al. (2008) find that compared to public acquirers,
private acquirers are more likely to select targets with lower growth opportunities and
higher cash flow from operations. Target firms with lower earnings are likely to have
lower free cash flow and thus would be less attractive for private acquirers.6 Overall, the
results suggest that, compared to private acquirers, public acquirers are more likely to
select targets with higher accounting profitability, thus supporting the managerial
opportunism explanation for the positive association between acquisition likelihood and
positive industry-adjusted accounting profitability.
4.2.2. Acquisition completion time (H2b) We predict that the benefits to opportunistically using acquisitions to report
higher profitability are larger when acquisitions are completed faster. We measure
acquisition completion time as the time interval between the acquisition announcement
date and completion date. We consider this time interval as short when it is less than the
third quartile of the distribution in our sample (Acquirer_Short_Interval), and consider it
to be long when it is greater than the third quartile (Acquirer_Long_Interval).7
The results are presented in Table 4. We find that the positive association between
positive industry-adjusted accounting profitability and acquisition likelihood is more
pronounced for acquirers that complete the transaction more quickly. The coefficient on
IA_ROA is significantly positive in column 1 but insignificant in column 2 and the
6 Results for control variables are also consistent with this notion. Firms with more cash and without losses are also more likely to be acquired by private acquirers but not public acquirers. 7 In our sample, the third quartile is a 147 day difference between the acquisition announcement and completion date. Our findings do not change if we use the median value of 98 days.
25
difference in coefficients between column 1 and 2 is statistically significant. These results
are consistent with quick completion time facilitating acquisitions used to report higher
profitability and avoiding due diligence oversight.
4.2.3. Acquirers with patterns of increasing earnings (H2c)
We expect that the positive association between acquisition likelihood and
positive industry-adjusted accounting profitability is more pronounced for acquirers with
long strings of earnings increases than for acquirers without such a pattern. We examine
four, five, and six years of annual earnings increases, because Barth et al. (1999) show
that firms price-earnings multiples are affected favorably after a string of five annual
earnings increases. If a firm uses an acquisition to opportunistically influence investors’
perception that it has maintained a string of earnings increases, then the time to complete
the acquisition is likely to be short so that the shortfall in the forthcoming earnings of the
acquirer can be addressed. Accordingly, we define an acquirer as having a string of
earnings increases prior to an acquisition when they report a pattern of annual earnings
increases and where the time to completion is below the third quartile for our sample
(Acq_4yr_String, Acq_5yr_String, and Acq_6yr_String). Acquirers reporting at least one
annual earnings decrease in the period before the acquisition announcement are
considered not to have a pattern of earnings increases (Acq_No_4yr_String,
Acq_No_5yr_String, and Acq_No_6yr_String).
Table 5, Panel A presents a comparison of the percentage of acquirers with a
pattern of earnings increases for acquisitions where the target’s ROA are above and
below the industry average. There are 1,155, 1,092, and 1,033 acquisitions where data are
26
available to calculate acquirers’ earnings pattern over four, five, and six years,
respectively. We observe that the percentage of acquirers with patterns of four, five, and
six annual earnings increases is significantly higher when the targets’ earnings are above
the industry average than when they are below the industry average. This result is
consistent with firms making acquisitions of targets with higher ROA to maintain
patterns of earnings increases or firms avoiding acquisitions of targets with lower ROA to
maintain patterns of earnings increases.
Panel B presents the results from the multinomial logistic regressions. Columns 1
and 2 present the results based on four years of earnings increases. For brevity, hereafter
we do not present the coefficients for the probability of being acquired by a private
acquirer or public acquirer without the required data (Private/Public Unknown).8 In this
table, we also do not present coefficients for the control variables. In columns 1 and 2,
the coefficient on IA_ROA is significantly positive. This result indicates that firms with
higher accounting profitability are more likely to be acquired by acquirers with and
without four years of annual earnings increases. In column 3, the coefficient on IA_ROA
is significantly positive while the coefficient on IA_ROA in column 4 is insignificant.
This result indicates that the positive association between positive industry-adjusted
accounting profitability and takeover likelihood is more pronounced for acquirers with
five years of annual earnings increases but not for acquirers without five years of
earnings increases. We find the strongest results in columns 5 and 6 when examining
acquirers with six years of earnings increases. The coefficient on IA_ROA is significantly
positive in column 5 but is insignificant in column 6, and the difference in these
8 When examining the probability of takeover by private acquirers as a separate outcome in this test and those below we find similar results to those reported in Table 3.
27
coefficients is statistically significant. This result is consistent with acquirers with six
years of earnings increases making acquisitions of targets with higher accounting
profitability, presumably to maintain their patterns of earnings growth.
We also find that acquirers without a pattern of earnings increases (columns 2, 4,
and 6) are more likely to acquire targets reporting losses while acquirers with patterns of
earnings increases (columns 1, 3, and 5) are not more likely to acquire targets reporting
losses. This result is consistent with acquirers not reporting patterns of earnings increases
before acquisitions being less likely to make opportunistic acquisitions and therefore,
more likely to acquire loss firms.
In a supplemental untabulated analysis, we find that when targets’ ROA is above
(below) the industry average, there is a positive (no) association between targets’ ROA
before the acquisition completion date and acquirers’ post-acquisition ROA for the three
years subsequent to the acquisition completion. These results are consistent with target’s
ROA persisting in acquirers’ post-acquisition ROA when acquirers are expected to use
acquisitions to increase ROA and not persisting when acquirers are expected to use
acquisitions to restructuring targets so that low profitability does not persist.
4.2.4. Acquirers with high price to earnings ratios (H2d) We expect that the benefits to making acquisitions to report higher profitability
are greater when acquirers have a high valuation premium. Consistent with Chu et al.
(2015) we use the price to earnings ratio to measure valuation premium. We classify
acquirers’ valuation premium as high when their price to earnings ratio is above the
28
annual industry average (Acquirer_High_PE) and classify it as low when it is below
(Acquirer_Low_PE).
The results are presented in Table 6. We find that the positive association between
positive industry-adjusted accounting profitability and takeover likelihood is more
pronounced for acquirers with a higher valuation premium. The coefficient on IA_ROA is
significantly positive in column 1. Interestingly, the coefficient on IA_ROA in column 2
is significantly negative, indicating that firms with higher accounting profitability are less
likely to be acquired by acquirers with a low valuation premium. This result can
potentially be explained by targets with higher accounting profitability being more costly
to acquire, because high valuation acquirers are willing to pay a premium for such firms.
The coefficient on IA_ROA + IA_ROA × BELOW_IA_ROA is significantly more negative
in column 1 than column 2, which is consistent with low valuation acquirers being
inefficient and less likely to acquire inefficient targets based on the inefficient
management hypothesis.9 Overall, the results are consistent with high valuations creating
an incentive for acquirers to select targets with higher accounting profitability.
4.2.5. Acquirers suspected of managing earnings to meet or beat earnings benchmarks
in acquisition completion year (H2e) We expect that the benefits to making acquisitions to report higher profitability
are greater when the acquisitions help firms to meet or beat post-acquisition earnings
targets than when the acquisitions do not help firms meet or beat targets. We classify
acquirers as likely using the acquisition to meet or beat earnings targets when acquirers
reporting earnings in the acquisition completion year are suspect of being managed
(Acquirer_Suspect). We follow Cohen et al. (2008) to identify such “suspect” acquirers 9 The inefficient management hypothesis predicts that efficient firms acquire inefficient firms.
29
based on three benchmarks that firms typically have incentives to meet. First, we label an
acquirer as a “suspect” if in the 365-day period after the acquisition completion date it
reports net income before extraordinary items scaled by total assets lies in the interval [0,
0.005). Also, we identify an acquirer as a “suspect” if in the 365-day period after the
acquisition completion date the change in net income before extraordinary items scaled
by total assets lies in the interval [0, 0.005). For the final benchmark, we label an acquirer
as a “suspect” if in the 365-day period after the acquisition completion date analysts’
forecast error (FE) is one cent per share or less ($0.00 ≤ FE ≤ $0.01). We compute the FE
as the difference between actual earnings per share (EPS) and the consensus forecast,
which is the median of the forecasts announced in the 365-day period prior to the
acquisition completion date. We classify acquirers as nonsuspect when they report
earnings in the acquisition completion year that does not meet any of the above criteria
(Acquirer_Nonsuspect).
The results are presented in Table 7. We find that the positive association between
positive industry-adjusted accounting profitability and takeover likelihood is more
pronounced for acquirers with suspect earnings than those without suspect earnings. The
coefficient on IA_ROA is significantly positive in column 1 and 2. However, the
coefficient on IA_ROA is significantly higher in column 1 than column 2, indicating that
targets with higher profitability are more likely to have been acquired by acquirers
suspected of managing earnings than other acquirers. The coefficient on IA_ROA +
IA_ROA × BELOW_IA_ROA is not significantly different in columns 1 and 2. Overall,
the results are consistent with acquirers successfully managing earnings to meet or beat
earnings benchmarks by selecting targets with higher accounting profitability,
30
presumably because these targets enable the acquirers to meet or beat earnings
benchmarks.
4.3. Costs related to opportunistic acquisitions of profitable targets (H3)
We predict that the positive association between industry-adjusted accounting
profitability and takeover likelihood is likely to be less pronounced for acquirers
incurring greater costs in making opportunistic acquisitions. We identify acquirers
incurring lower costs as those that have high free cash flow and low growth opportunities
(H3a), have no blockholders (H3b), have less independent boards (H3c), and are less
financially distressed (H3d). To test hypotheses H3a through H3d, we estimate a
multinomial logistic model and create a categorical dependent variable, TO_ACQ_COST,
that is equal to one if a firm receives a completed takeover bid in year t+1 by a publicly-
held acquirer with lower costs to making opportunistic acquisitions
(Acquirer_HighFCF_LowQ, Acquirer_NoBlock, Acquirer_Brd_NoInd, and
Acquirer_High_Zscore), equal to two if a firm receives a completed takeover bid in year
t+1 by a publicly-held acquirer with higher costs to making opportunistic acquisitions
(Acquirer_Other, Acquirer_Block, Acquirer_Brd_Ind, and Acquirer_Low_Zscore), equal
to three if a firm receives a completed takeover bid in year t+1 by a privately-held
acquirer or an acquirer where data are not available to calculate the measures of costs
related to making opportunistic acquisitions (Private/Public Unknown), and zero if a firm
is not acquired. We discuss below each of the different measures we use for the costs to
making opportunistic acquisitions.
31
4.3.1. Acquirers with agency costs of free cash flow (H3a)
We expect that it is less costly for managers of acquirers with high free cash flow
and low growth opportunity to make opportunistic acquisitions than for managers of
other acquirers. Acquirers are classified as having high free cash flow and low growth
opportunity when their Tobin’s Q is below the annual industry average and free cash flow
is above the annual industry average (Acquirer_HighFCF_LowQ); all other public
acquirers are classified as having low-agency problem (Acquirer_Other).10 The results
are presented in Table 8. We find that the positive association between positive industry-
adjusted accounting profitability and takeover likelihood is more pronounced for
acquirers with high free cash flow and low growth opportunities than for other acquirers.
Specifically, the coefficient on IA_ROA is significantly positive and significantly higher
in column 1 than in column 2. The difference in the coefficients on IA_ROA + IA_ROA ×
BELOW_IA_ROA in column 1 and 2 is not significant.
4.3.2. Acquirers with blockholders (H3b)
We expect that it is less costly for managers of acquirers with no blockholders to
make opportunistic acquisitions than managers of acquirers with blockholders. We define
acquirers with blockholders as those with at least one institutional shareholder that have
at least a five percent ownership position (Acquirer_Block) and all other acquirers as
those without blockholders (Acquirer_NoBlock). The results are presented in Table 9. We
find that the positive association between positive industry-adjusted ROA and the
likelihood of acquisition is more pronounced for acquirers without blockholders than for
10 Free cash flow is calculated as cash flow from operations minus capital expenditures, scaled by beginning total assets.
32
acquirers with blockholders. Specifically, the coefficient on IA_ROA is significantly
positive and significantly higher in column 1 than in column 2. The difference in the
coefficients on IA_ROA + IA_ROA × BELOW_IA_ROA in column 1 and 2 is not
significant.
4.3.3. Acquirers with less independent boards (H3c)
We expect that it is more costly for managers of acquirers with more independent
boards to make opportunistic acquisitions than managers of acquirers with less
independent boards. We classify firms’ with the percentage of independent board
members below the annual industry average as having non-independent boards
(Acquirer_Brd_NoInd), and above the annual industry average as having independent
boards (Acquirer_Brd_Ind). The results are presented in Table 10. We find that the
positive association between positive industry-adjusted accounting profitability and
takeover likelihood is more pronounced for acquirers with less independent boards than
for acquirers with more independent boards. Specifically, the coefficient on IA_ROA is
significantly positive and significantly higher in column 1 than in column 2. The
difference in the coefficients on IA_ROA + IA_ROA × BELOW_IA_ROA in columns 1
and 2 is not significant.
4.3.4. Acquirers’ financial distress (H3d)
We expect that the costs to making opportunistic acquisitions are higher when
acquirers are in financial distress than when they are not in financial distress. We classify
firms with Altman Z-scores below the annual industry average as financially distressed
(Acquirer_Low_Zscore) and those above as financially healthy (Acquirer_High_Zscore).
33
The results are presented in Table 11. We find that the positive association between
positive industry-adjusted accounting profitability and takeover likelihood is more
pronounced for acquirers that are financially healthy than acquirers in financial distress
(i.e., higher costs to making opportunistic acquisitions). Specifically, the coefficient on
IA_ROA in column 1 is significantly positive and significantly higher than the coefficient
on IA_ROA in column 2. Furthermore, the coefficient on IA_ROA + IA_ROA ×
BELOW_IA_ROA is not significantly different between columns 1 and 2.
Overall, the results of tests of H3a to H3d are consistent with lower costs to
management of making opportunistic acquisitions increasing the positive association
between probability of takeover and positive industry-adjusted ROA. However, as
expected, these costs do not have a significant effect on the negative association between
acquisition likelihood and negative industry-adjusted ROA.
4.4. Acquirers’ Announcement Returns (H4)
Next, we examine the acquirers’ returns to acquisition announcements. This
analysis is limited to public acquirers where we can calculate announcement returns.
ACQ_SCAR is the acquirer’s five-day (-2, +2) cumulative abnormal return calculated
using the market model following prior studies (e.g., Masulis et al. 2007; Harford et al.
2012). Table 12, Panel A presents a univariate analysis of acquirers’ announcement
returns by whether the target has ROA above or below the industry mean. We find that
the mean acquirer announcement return for acquisitions of targets with ROA below the
industry average is -0.5% while it is -1.8% for acquisitions of targets with ROA above
the industry average. In Panel B, we perform a multivariable test of the association
between targets’ earnings and acquirers’ announcement returns. The dependent variable
34
is ACQ_SCAR. In column 1, our variable of interest is whether target’s earnings are
below the industry average (i.e., BELOW_IA_ROA = 1). In column 2, we group
observations based on targets’ earnings into four groups using a cutoff of 0.10 (-0.10) for
targets’ earnings above (below) the industry average. If firms’ IA_ROA is positive and is
above (below) 0.10, we set BIG_ABOVE_IA_ROA (SMALL_ABOVE_IA_ROA) equal to
one, and zero otherwise. If firms’ IA_ROA is negative and is above (below) -0.10 we set
SMALL_BELOW_IA_ROA (BIG_BELOW_IA_ROA) equal to one, and zero otherwise.
We also control for acquirers’ ROA (ACQ_ROA), acquirers’ Tobin’s Q (ACQ_Q),
acquirers’ size (ACQ_ln(MV)), relative transaction size (RELATIVE_SIZE), hostile bids
(HOSTILE), all cash bids (CASH), all stock bids (STOCK), and the number of bidders
(N_BIDS) (Travlos 1987; Fuller et al. 2002; Moeller et al. 2004; Dong et al. 2006; Chen
et al. 2007).
In column 1, the coefficient on BELOW_IA_ROA is 0.011 and significant at the
5% level, which indicates that acquirers’ announcement returns are significantly lower by
1.1% on average when targets earnings are above the industry average relative to when
earnings are below the industry average. In column 2, we include
D_BIG_ABOVE_IA_ROA, D_SMALL_BELOW_IA_ROA, and D_BIG_BELOW_IA_ROA,
so that the coefficient on each of these variables reflects the comparison with acquisitions
of targets with the lowest positive industry-adjusted ROA (i.e., where
D_SMALL_ABOVE_IA_ROA is equal to one). The estimated coefficient on
D_BIG_ABOVE_IA_ROA is significantly negative indicating among acquisitions of
targets with positive IA_ROA acquirers acquiring the more profitable targets experience
lower announcement returns. These results indicate that acquirers’ announcement returns
35
are significantly lower when they acquire targets with relatively higher accounting
profitability, suggesting that investors view acquiring targets with relatively higher
accounting profitability as more value decreasing. This is consistent with such
acquisitions being more likely to be motivated by managerial opportunism.
5. Conclusion In this paper, we examine the association between firms’ accounting profitability
and their likelihood of being acquired. We find a non-linear relation between industry-
adjusted ROA and takeover probability. Takeover probability is negatively associated
with negative industry-adjusted ROA and positively associated with positive industry-
adjusted ROA. The negative association is consistent with the argument that poorer
performing firms are more likely to be taken over because acquirers can unlock greater
value through efficient management. We further argue that the positive association is
consistent with the notion that firms with higher accounting profitability are more
attractive takeover targets when acquisitions are motivated by managerial opportunism.
A battery of tests is conducted to examine whether the positive relation between
takeover likelihood and positive industry-adjusted accounting profitability is due to
opportunistic acquisitions. We find that this positive relation is greater for acquirers that
benefit more from opportunistic acquisitions and for acquirers with lower costs of making
opportunistic acquisitions. We also show that among targets with positive industry-
adjusted ROA, the acquirers’ acquisition announcement returns are negatively associated
with the targets’ industry-adjusted accounting profitability. This result implies that
acquiring firms’ managers are more likely to overpay for targets when their personal
36
benefits from acquisition is greater. Overall, our results suggest that the greater
acquisition likelihood of targets with higher accounting profitability is driven by
acquiring managers’ opportunism. Furthermore, our findings contribute to the accounting
and finance literature by enhancing the understanding of how accounting profitability of a
firm is associated with its takeover probability.
37
References
Ali, A., and T. D. Kravet. 2014. The Effect of SFAS 141 and 142 on the Likelihood and the Form of Financing of Corporate Takeovers. Working Paper, University of Connecticut and University of Texas at Dallas.
Ambrose, B. W., and W. L. Megginson. 1992. The role of asset structure, ownership structure, and takeover defenses in determining acquisition likelihood. Journal of Financial and Quantitative Analysis 27(04): 575-589.
Bargeron, L. L., F. P. Schlingemann, R. M. Stulz, and C. J. Zutter. 2008. Why do private acquirers pay so little compared to public acquirers? Journal of Financial Economics 89(3): 375-390.
Barth, M. E., J. A. Elliott, and M. W. Finn. 1999. Market rewards associated with patterns of increasing earnings. Journal of Accounting Research 37(2): 387-413.
Beatty, A. L., B. Ke, and K. R. Petroni. 2002. Earnings management to avoid earnings declines across publicly and privately held banks. The Accounting Review 77(3): 547-570.
Bens, D., T. Goodman, and M. Neamtiu. 2011. Does investment-related pressure lead to misreporting? An analysis of reporting following M&A transactions. The Accounting Review 87(3): 839–865.
Berger, P. G., and E. Ofek. 1996. Bustup takeovers of value-destroying diversified firms. The Journal of Finance 51(4): 1175-1200.
Billett, M. T., and H. Xue. 2007. The takeover deterrent effect of open market share repurchases. The Journal of Finance 62(4): 1827-1850.
Bodnaruk, A., M. Massa, and A. Simonov. 2009. Investment banks as insiders and the market for corporate control. Review of Financial Studies 22(12): 4989-5026.
Bruner, R. F. 2004. Applied mergers & acquisitions. New Jersey: John Wiley & Sons.
Burgstahler, D., and I. Dichev. 1997. Earnings management to avoid earnings decreases and losses. Journal of Accounting and Economics 24(1): 99-126.
Bushee, B. J. 1998. The influence of institutional investors on myopic R&D investment behavior. Accounting Review: 305-333.
Byrd, J. W., and K. A. Hickman. 1992. Do outside directors monitor managers?: Evidence from tender offer bids. Journal of Financial Economics 32(2): 195-221.
38
Cai, Y., and X. Tian. 2009. Firm Locations and Takeover Likelihood. Working Paper, University of North Carolina and Indiana University.
Chang, S. 1998. Takeovers of privately held targets, methods of payment, and bidder returns. The Journal of Finance 53(2): 773-784.
Chen, C. W., D. W. Collins, T. D. Kravet and R. D. Mergenthaler. 2014. Financial Statement Comparability and the Efficiency of Acquisition Decisions. Working Paper, University of Connecticut and University of Iowa.
Chen, X., J. Harford, and K. Li. 2007. Monitoring: Which institutions matter? Journal of Financial Economics 86(2): 279-305.
Chu, J., P. Dechow, K.W. Hui, and A.Y. Wang. 2015. The valuation premium for a string of positive earnings surprises: The role of earnings manipulation. Working Paper, Hong Kong University of Science and Technology, University of California, Berkeley, and University of Cambridge.
Cohen, D. A., A. Dey, and T. Z. Lys. 2008. Real and accrual-based earnings management in the pre- and post-Sarbanes-Oxley periods. The Accounting Review 83(3): 757-787.
Cohen, D. A., and P. Zarowin. 2010. Accrual-based and real earnings management activities around seasoned equity offerings. Journal of Accounting and Economics 50(1): 2-19.
Cremers, K. J. M., V. B. Nair, and K. John. 2009. Takeovers and the cross-section of returns. The Review of Financial Studies 22(4): 1409-1445.
Dechow, P. M., R. G. Sloan, and A. P. Sweeney. 1996. Causes and consequences of earnings manipulation: An analysis of firms subject to enforcement actions by the SEC. Contemporary Accounting Research 13(1): 1-36.
DeFond, M. L., and C. W. Park. 1999. The effect of competition on CEO turnover. Journal of Accounting and Economics 27: 35-56.
Desai, H., C. E. Hogan, and M. S. Wilkins. 2006. The reputational penalty for aggressive accounting: Earnings restatements and management turnover. The Accounting Review 81(1): 83-112.
Dietrich, J. K., and E. Sorensen. 1984. An application of logit analysis to prediction of merger targets. Journal of Business Research 12(3): 393-402.
Donelson, D. C., J. M. McInnis, and R. D. Mergenthaler. 2013. Discontinuities and earnings management: Evidence from restatements related to securities litigation. Contemporary Accounting Research 30(1): 242-268.
39
Dong, M., D. Hirshleifer, S. Richardson, and S. H. Teoh. 2006. Does investor misvaluation drive the takeover market? The Journal of Finance 61(2): 725-762.
Eckbo, B. E., and K. S. Thorburn. 2008. Corporate restructuring: Breakups and LBO’s. In Handbook of empirical corporate finance: Empirical corporate Finance, ed. B. E. Eckbo. New York: Elsevier/North Holland.
Edmans, A., I. Goldstein, and W. Jiang. 2012. The real effects of financial markets: The impact of prices on takeovers. The Journal of Finance 67(3): 933-971.
Fama, E.F., French, K.R., 1997. Industry costs of equity. Journal of Financial Economics 43, 153-193.
Farrell, K. A., and D. A. Whidbee. 2003. Impact of firm performance expectations on CEO turnover and replacement decisions. Journal of Accounting and Economics 36: 165-196.
Fich, E. M., L. T. Starks, and A. S. Yore. 2014. CEO deal-making activities and compensation. Journal of Financial Economics, forthcoming.
Fu, F., L. Lin, and M. Officer. 2013. Acquisitions driven by stock overvaluation. Journal of Financial Economics 109 (1): 24-39.
Fuller, K., J. Netter, and M. Stegemoller. 2002. What do returns to acquiring firms tell us? Evidence from firms that make many acquisitions. The Journal of Finance 57(4): 1763-1793.
Givoly, D., C. K. Hayn, and S. P. Katz. 2010. Does public ownership of equity improve earnings quality? The Accounting Review 85(1): 195-225.
Grinstein, Y., and P. Hribar. 2004. CEO compensation and incentives: Evidence from M&A bonuses. Journal of Financial Economics 73(1): 119-143.
Harford, J. 1999. Corporate cash reserves and acquisitions. The Journal of Finance 54(6): 1969-1997.
Harford, J., M. Humphery-Jenner, and R. Powell. 2012. The sources of value destruction in acquisitions by entrenched managers. Journal of Financial Economics 106: 247-261.
Harford, J., and K. Li. 2007. Decoupling CEO wealth and firm performance: The case of acquiring CEOs. The Journal of Finance 62(2): 917-949.
Harford, J., and R. J. Schonlau. 2013. Does the director labor market offer ex post settling-up for CEOs? The case of acquisitions. Journal of Financial Economics 110: 18-36.
40
Ivashina, V., V.B. Nair, A. Saunders, N. Massoud, and R. Stover. 2009. Bank debt and corporate governance. Review of Financial Studies, 22(1): 41-77.
Jensen, M. C. 1986. Agency costs of free cash flow, corporate finance, and takeovers. The American Economic Review 76(2): 323-329.
Jensen, M. C. 2005. Agency costs of overvalued equity. Financial Management 34(1): 5-19.
Kasznik, R., and M.F. McNichols. 2002. Does meeting earnings expectations matter? Evidence from analyst forecast revisions and share prices. Journal of Accounting Research 40(3): 727-759.
Ke, B., K. Petroni, and A. Safieddine. 1999. Ownership concentration and sensitivity of executive pay to accounting performance measures: Evidence from publicly and privately held insurance companies. Journal of Accounting and Economics 28(2): 185-209.
Klassen, K. J. 1997. The impact of inside ownership concentration on the trade-off between financial and tax reporting. Accounting Review 72(3): 455-474.
Klein, A. 2002. Audit committee, board of director characteristics, and earnings management. Journal of Accounting and Economics 33(3): 375-400.
Lang, L. H., R. Stulz, and R. A. Walking. 1991. A test of the free cash flow hypothesis: The case of bidder returns. Journal of Financial Economics 29(2): 315-335.
Levitt, A. 1998. The numbers game. Speech delivered at the NYU Center for Law and Business, New York, NY, September 28.
Malmendier, U., and G. Tate. 2008. Who makes acquisitions? CEO overconfidence and the market’s reaction. Journal of Financial Economics 89: 20-43.
Manne, H. G. 1965. Mergers and the market for corporate control. The Journal of Political Economy 73: 110-120.
Marris, R. 1963. A model of the" managerial" enterprise. The Quarterly Journal of Economics 77: 185-209.
Masulis, R., C. Wang, and F. Xie. 2007. Corporate governance and acquirer returns. The Journal of Finance 62 (4): 1851-1889.
Matsumoto, D. A. 2002. Management's incentives to avoid negative earnings surprises. The Accounting Review 77(3): 483-514.
41
McConnell, J. J., and H. Servaes. 1990. Additional evidence on equity ownership and corporate value. Journal of Financial Economics 27: 595-612.
Moeller, S. B., F. P. Schlingemann, and R. M. Stulz. 2004. Firm size and the gains from acquisitions. Journal of Financial Economics 73(2): 201-228.
Morck, R., A. Shleifer, and R. Vishny. 1990. Do managerial objectives drive bad acquisitions? The Journal of Finance 45(1): 31–48.
Myers, J. N., L. A. Myers, and D. J. Skinner. 2007. Earnings momentum and earnings management. Journal of Accounting, Auditing & Finance 22(2): 249-284.
Palepu, K. G. 1986. Predicting takeover targets: A methodological and empirical analysis. Journal of Accounting and Economics 8(1): 3-35.
Pearl, J., and J. Rosenbaum. 2009. Investment banking: Valuation, leveraged buyouts, and mergers and acquisitions. New Jersey: John Wiley & Sons.
Penman, S. H., and X. Zhang. 2002. Accounting conservatism, the quality of earnings, and stock returns. The Accounting Review 77(2): 237-264.
Roychowdhury, S. 2006. Earnings management through real activities manipulation. Journal of Accounting and Economics 42(3): 335-370.
Shleifer, A., and R. W. Vishny. 1986. Large shareholders and corporate control. The Journal of Political Economy 94: 461-488.
Shleifer, A., and R. W. Vishny. 2003. Stock market driven acquisitions. Journal of Financial Economics 70(3): 295-311.
Skinner, D. J., and R. G. Sloan. 2002. Earnings surprises, growth expectations, and stock returns or don't let an earnings torpedo sink your portfolio. Review of Accounting Studies 7(2-3): 289-312.
Smith, R., S. Lipin, and A. K. Naj. 1994. Managing profits: How general electric damps fluctuations in its annual earnings - it offsets one-time gains with write-offs, times asset purchases and sales - accounting for the RCA deal. The Wall Street Journal (November 3).
Subramanyam, K. 1996. The pricing of discretionary accruals. Journal of Accounting and Economics 22(1): 249-281.
Travlos, N. G. 1987. Corporate takeover bids, methods of payment, and bidding firms' stock returns. The Journal of Finance 42(4): 943-963.

42
Zang, A. Y. 2012. Evidence on the trade-off between real activities manipulation and accrual-based earnings management. The Accounting Review 87(2): 675-703.
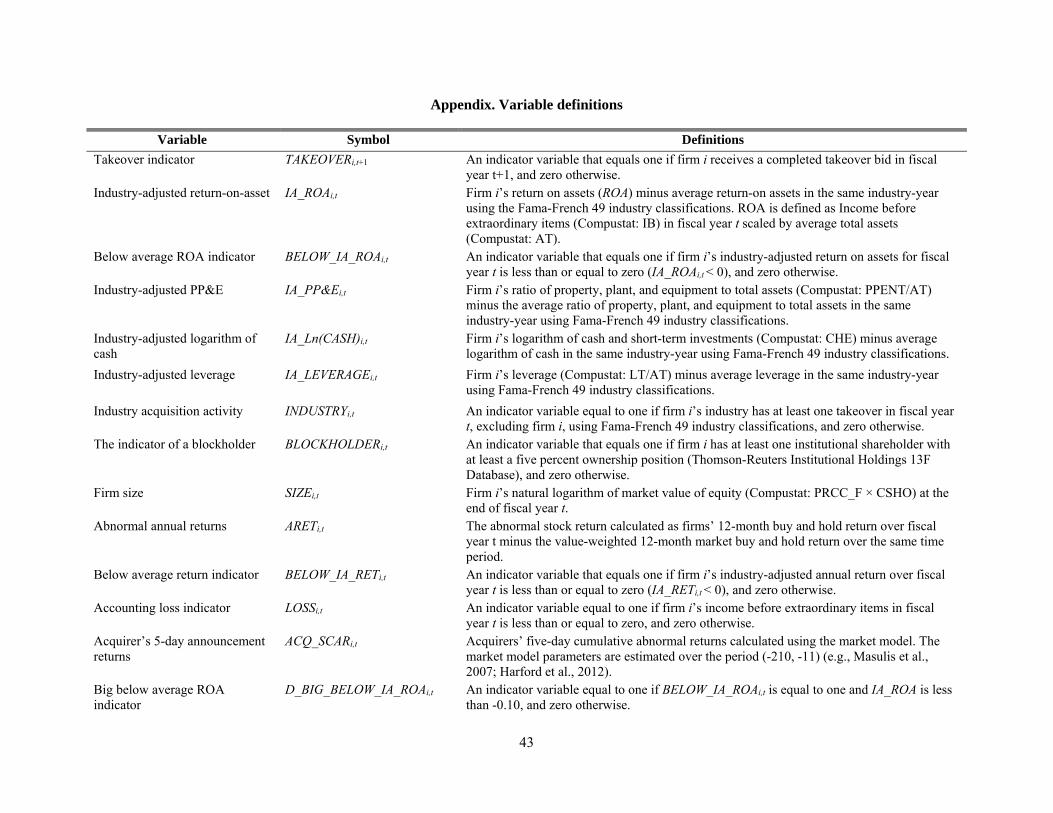
43
Appendix. Variable definitions
Variable Symbol Definitions Takeover indicator TAKEOVERi,t+1 An indicator variable that equals one if firm i receives a completed takeover bid in fiscal
year t+1, and zero otherwise. Industry-adjusted return-on-asset IA_ROAi,t Firm i’s return on assets (ROA) minus average return-on assets in the same industry-year
using the Fama-French 49 industry classifications. ROA is defined as Income before extraordinary items (Compustat: IB) in fiscal year t scaled by average total assets (Compustat: AT).
Below average ROA indicator BELOW_IA_ROAi,t An indicator variable that equals one if firm i’s industry-adjusted return on assets for fiscal year t is less than or equal to zero (IA_ROAi,t < 0), and zero otherwise.
Industry-adjusted PP&E IA_PP&Ei,t Firm i’s ratio of property, plant, and equipment to total assets (Compustat: PPENT/AT) minus the average ratio of property, plant, and equipment to total assets in the same industry-year using Fama-French 49 industry classifications.
Industry-adjusted logarithm of cash
IA_Ln(CASH)i,t Firm i’s logarithm of cash and short-term investments (Compustat: CHE) minus average logarithm of cash in the same industry-year using Fama-French 49 industry classifications.
Industry-adjusted leverage IA_LEVERAGEi,t Firm i’s leverage (Compustat: LT/AT) minus average leverage in the same industry-year using Fama-French 49 industry classifications.
Industry acquisition activity INDUSTRYi,t An indicator variable equal to one if firm i’s industry has at least one takeover in fiscal year t, excluding firm i, using Fama-French 49 industry classifications, and zero otherwise.
The indicator of a blockholder BLOCKHOLDERi,t An indicator variable that equals one if firm i has at least one institutional shareholder with at least a five percent ownership position (Thomson-Reuters Institutional Holdings 13F Database), and zero otherwise.
Firm size SIZEi,t Firm i’s natural logarithm of market value of equity (Compustat: PRCC_F × CSHO) at the end of fiscal year t.
Abnormal annual returns ARETi,t The abnormal stock return calculated as firms’ 12-month buy and hold return over fiscal year t minus the value-weighted 12-month market buy and hold return over the same time period.
Below average return indicator BELOW_IA_RETi,t An indicator variable that equals one if firm i’s industry-adjusted annual return over fiscal year t is less than or equal to zero (IA_RETi,t < 0), and zero otherwise.
Accounting loss indicator LOSSi,t An indicator variable equal to one if firm i’s income before extraordinary items in fiscal year t is less than or equal to zero, and zero otherwise.
Acquirer’s 5-day announcement returns
ACQ_SCARi,t Acquirers’ five-day cumulative abnormal returns calculated using the market model. The market model parameters are estimated over the period (-210, -11) (e.g., Masulis et al., 2007; Harford et al., 2012).
Big below average ROA indicator
D_BIG_BELOW_IA_ROAi,t An indicator variable equal to one if BELOW_IA_ROAi,t is equal to one and IA_ROA is less than -0.10, and zero otherwise.
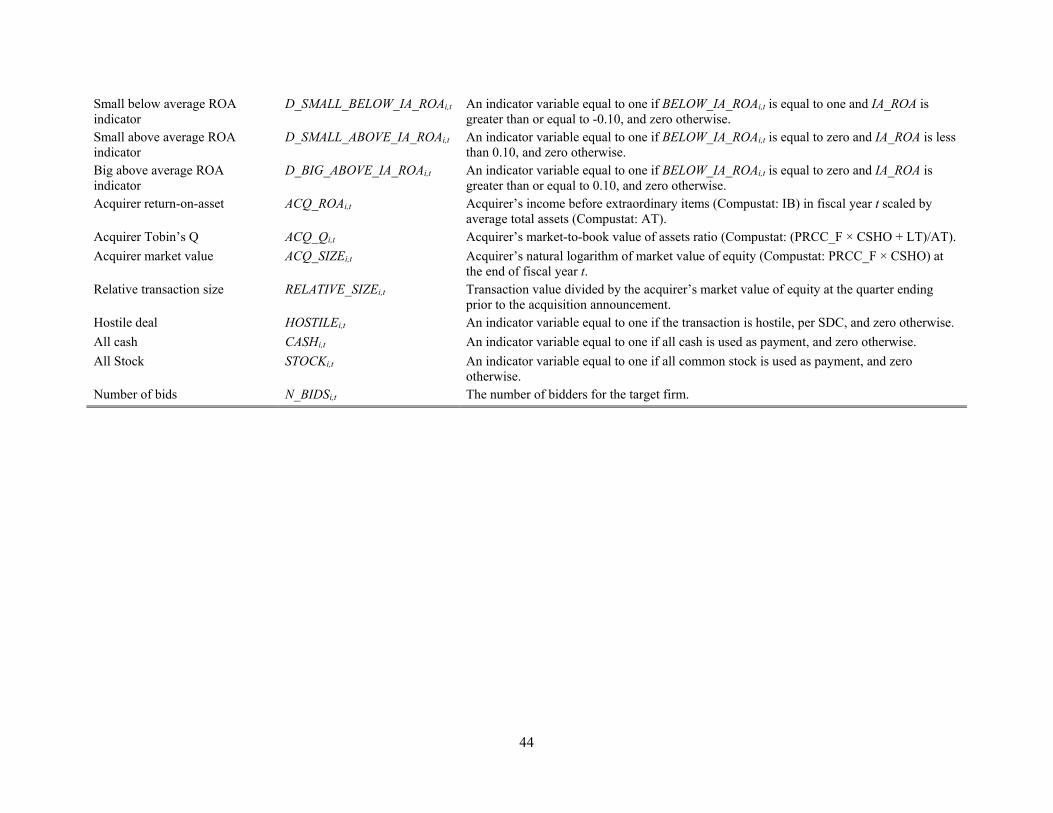
44
Small below average ROA indicator
D_SMALL_BELOW_IA_ROAi,t An indicator variable equal to one if BELOW_IA_ROAi,t is equal to one and IA_ROA is greater than or equal to -0.10, and zero otherwise.
Small above average ROA indicator
D_SMALL_ABOVE_IA_ROAi,t An indicator variable equal to one if BELOW_IA_ROAi,t is equal to zero and IA_ROA is less than 0.10, and zero otherwise.
Big above average ROA indicator
D_BIG_ABOVE_IA_ROAi,t An indicator variable equal to one if BELOW_IA_ROAi,t is equal to zero and IA_ROA is greater than or equal to 0.10, and zero otherwise.
Acquirer return-on-asset ACQ_ROAi,t Acquirer’s income before extraordinary items (Compustat: IB) in fiscal year t scaled by average total assets (Compustat: AT).
Acquirer Tobin’s Q ACQ_Qi,t Acquirer’s market-to-book value of assets ratio (Compustat: (PRCC_F × CSHO + LT)/AT). Acquirer market value ACQ_SIZEi,t Acquirer’s natural logarithm of market value of equity (Compustat: PRCC_F × CSHO) at
the end of fiscal year t. Relative transaction size RELATIVE_SIZEi,t Transaction value divided by the acquirer’s market value of equity at the quarter ending
prior to the acquisition announcement. Hostile deal HOSTILEi,t An indicator variable equal to one if the transaction is hostile, per SDC, and zero otherwise. All cash CASHi,t An indicator variable equal to one if all cash is used as payment, and zero otherwise. All Stock STOCKi,t An indicator variable equal to one if all common stock is used as payment, and zero
otherwise. Number of bids N_BIDSi,t The number of bidders for the target firm.
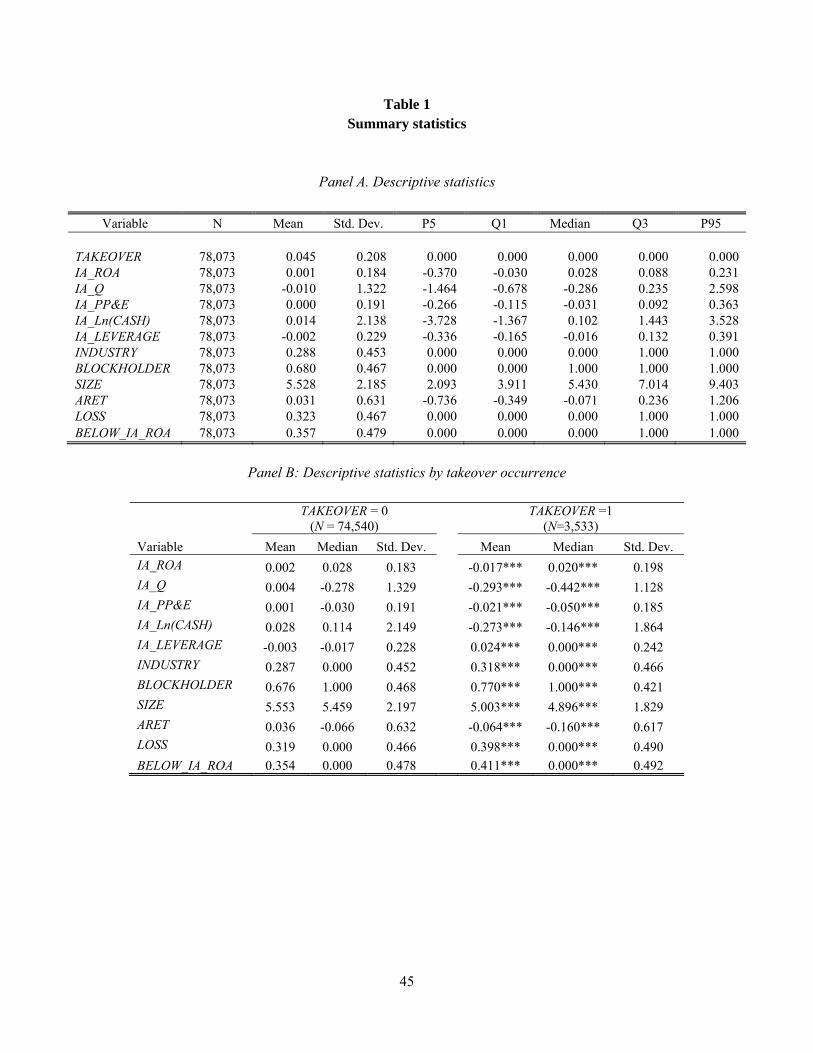
45
Table 1 Summary statistics
Panel A. Descriptive statistics
Variable N Mean Std. Dev. P5 Q1 Median Q3 P95
TAKEOVER 78,073 0.045 0.208 0.000 0.000 0.000 0.000 0.000 IA_ROA 78,073 0.001 0.184 -0.370 -0.030 0.028 0.088 0.231 IA_Q 78,073 -0.010 1.322 -1.464 -0.678 -0.286 0.235 2.598 IA_PP&E 78,073 0.000 0.191 -0.266 -0.115 -0.031 0.092 0.363 IA_Ln(CASH) 78,073 0.014 2.138 -3.728 -1.367 0.102 1.443 3.528 IA_LEVERAGE 78,073 -0.002 0.229 -0.336 -0.165 -0.016 0.132 0.391 INDUSTRY 78,073 0.288 0.453 0.000 0.000 0.000 1.000 1.000 BLOCKHOLDER 78,073 0.680 0.467 0.000 0.000 1.000 1.000 1.000 SIZE 78,073 5.528 2.185 2.093 3.911 5.430 7.014 9.403 ARET 78,073 0.031 0.631 -0.736 -0.349 -0.071 0.236 1.206 LOSS 78,073 0.323 0.467 0.000 0.000 0.000 1.000 1.000 BELOW_IA_ROA 78,073 0.357 0.479 0.000 0.000 0.000 1.000 1.000
Panel B: Descriptive statistics by takeover occurrence
TAKEOVER = 0
(N = 74,540) TAKEOVER =1
(N=3,533)
Variable Mean Median Std. Dev. Mean Median Std. Dev. IA_ROA 0.002 0.028 0.183 -0.017*** 0.020*** 0.198 IA_Q 0.004 -0.278 1.329 -0.293*** -0.442*** 1.128 IA_PP&E 0.001 -0.030 0.191 -0.021*** -0.050*** 0.185 IA_Ln(CASH) 0.028 0.114 2.149 -0.273*** -0.146*** 1.864 IA_LEVERAGE -0.003 -0.017 0.228 0.024*** 0.000*** 0.242 INDUSTRY 0.287 0.000 0.452 0.318*** 0.000*** 0.466 BLOCKHOLDER 0.676 1.000 0.468 0.770*** 1.000*** 0.421 SIZE 5.553 5.459 2.197 5.003*** 4.896*** 1.829 ARET 0.036 -0.066 0.632 -0.064*** -0.160*** 0.617 LOSS 0.319 0.000 0.466 0.398*** 0.000*** 0.490
BELOW_IA_ROA 0.354 0.000 0.478 0.411*** 0.000*** 0.492
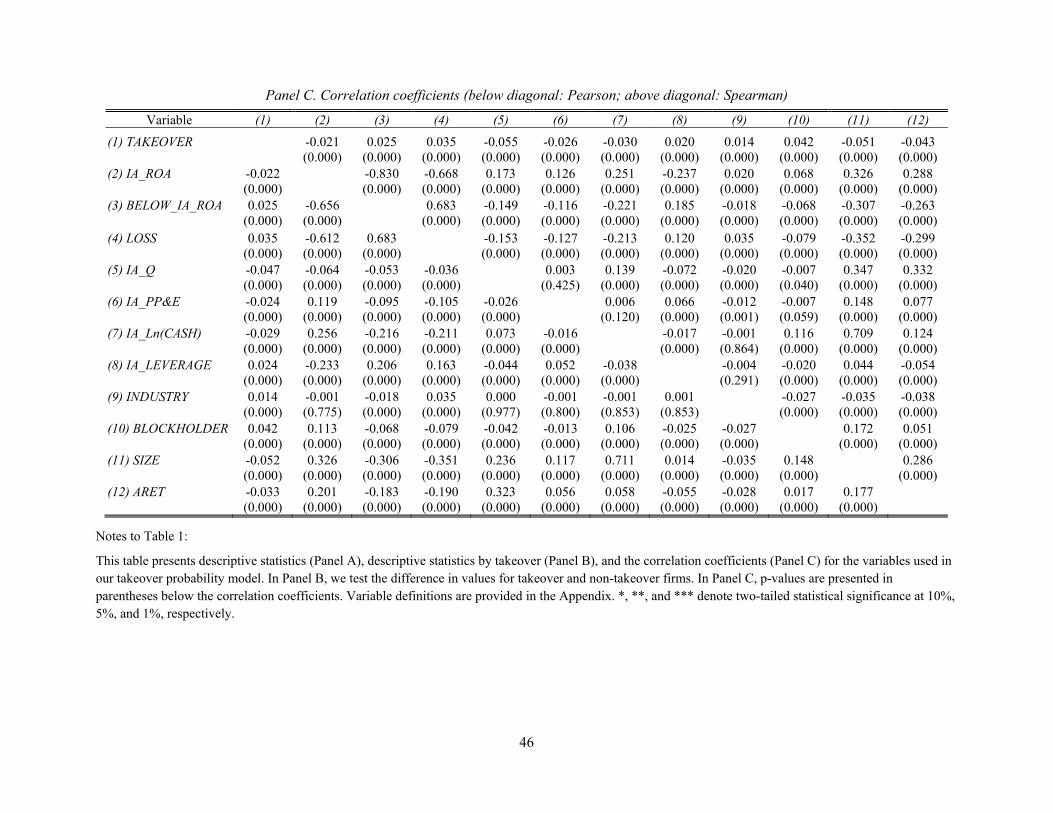
46
Panel C. Correlation coefficients (below diagonal: Pearson; above diagonal: Spearman)
Variable (1) (2) (3) (4) (5) (6) (7) (8) (9) (10) (11) (12)
(1) TAKEOVER -0.021 0.025 0.035 -0.055 -0.026 -0.030 0.020 0.014 0.042 -0.051 -0.043 (0.000) (0.000) (0.000) (0.000) (0.000) (0.000) (0.000) (0.000) (0.000) (0.000) (0.000)
(2) IA_ROA -0.022 -0.830 -0.668 0.173 0.126 0.251 -0.237 0.020 0.068 0.326 0.288 (0.000) (0.000) (0.000) (0.000) (0.000) (0.000) (0.000) (0.000) (0.000) (0.000) (0.000)
(3) BELOW_IA_ROA 0.025 -0.656 0.683 -0.149 -0.116 -0.221 0.185 -0.018 -0.068 -0.307 -0.263 (0.000) (0.000) (0.000) (0.000) (0.000) (0.000) (0.000) (0.000) (0.000) (0.000) (0.000)
(4) LOSS 0.035 -0.612 0.683 -0.153 -0.127 -0.213 0.120 0.035 -0.079 -0.352 -0.299 (0.000) (0.000) (0.000) (0.000) (0.000) (0.000) (0.000) (0.000) (0.000) (0.000) (0.000)
(5) IA_Q -0.047 -0.064 -0.053 -0.036 0.003 0.139 -0.072 -0.020 -0.007 0.347 0.332 (0.000) (0.000) (0.000) (0.000) (0.425) (0.000) (0.000) (0.000) (0.040) (0.000) (0.000)
(6) IA_PP&E -0.024 0.119 -0.095 -0.105 -0.026 0.006 0.066 -0.012 -0.007 0.148 0.077 (0.000) (0.000) (0.000) (0.000) (0.000) (0.120) (0.000) (0.001) (0.059) (0.000) (0.000)
(7) IA_Ln(CASH) -0.029 0.256 -0.216 -0.211 0.073 -0.016 -0.017 -0.001 0.116 0.709 0.124 (0.000) (0.000) (0.000) (0.000) (0.000) (0.000) (0.000) (0.864) (0.000) (0.000) (0.000)
(8) IA_LEVERAGE 0.024 -0.233 0.206 0.163 -0.044 0.052 -0.038 -0.004 -0.020 0.044 -0.054 (0.000) (0.000) (0.000) (0.000) (0.000) (0.000) (0.000) (0.291) (0.000) (0.000) (0.000)
(9) INDUSTRY 0.014 -0.001 -0.018 0.035 0.000 -0.001 -0.001 0.001 -0.027 -0.035 -0.038 (0.000) (0.775) (0.000) (0.000) (0.977) (0.800) (0.853) (0.853) (0.000) (0.000) (0.000)
(10) BLOCKHOLDER 0.042 0.113 -0.068 -0.079 -0.042 -0.013 0.106 -0.025 -0.027 0.172 0.051 (0.000) (0.000) (0.000) (0.000) (0.000) (0.000) (0.000) (0.000) (0.000) (0.000) (0.000)
(11) SIZE -0.052 0.326 -0.306 -0.351 0.236 0.117 0.711 0.014 -0.035 0.148 0.286 (0.000) (0.000) (0.000) (0.000) (0.000) (0.000) (0.000) (0.000) (0.000) (0.000) (0.000)
(12) ARET -0.033 0.201 -0.183 -0.190 0.323 0.056 0.058 -0.055 -0.028 0.017 0.177 (0.000) (0.000) (0.000) (0.000) (0.000) (0.000) (0.000) (0.000) (0.000) (0.000) (0.000)
Notes to Table 1:
This table presents descriptive statistics (Panel A), descriptive statistics by takeover (Panel B), and the correlation coefficients (Panel C) for the variables used in our takeover probability model. In Panel B, we test the difference in values for takeover and non-takeover firms. In Panel C, p-values are presented in parentheses below the correlation coefficients. Variable definitions are provided in the Appendix. *, **, and *** denote two-tailed statistical significance at 10%, 5%, and 1%, respectively.
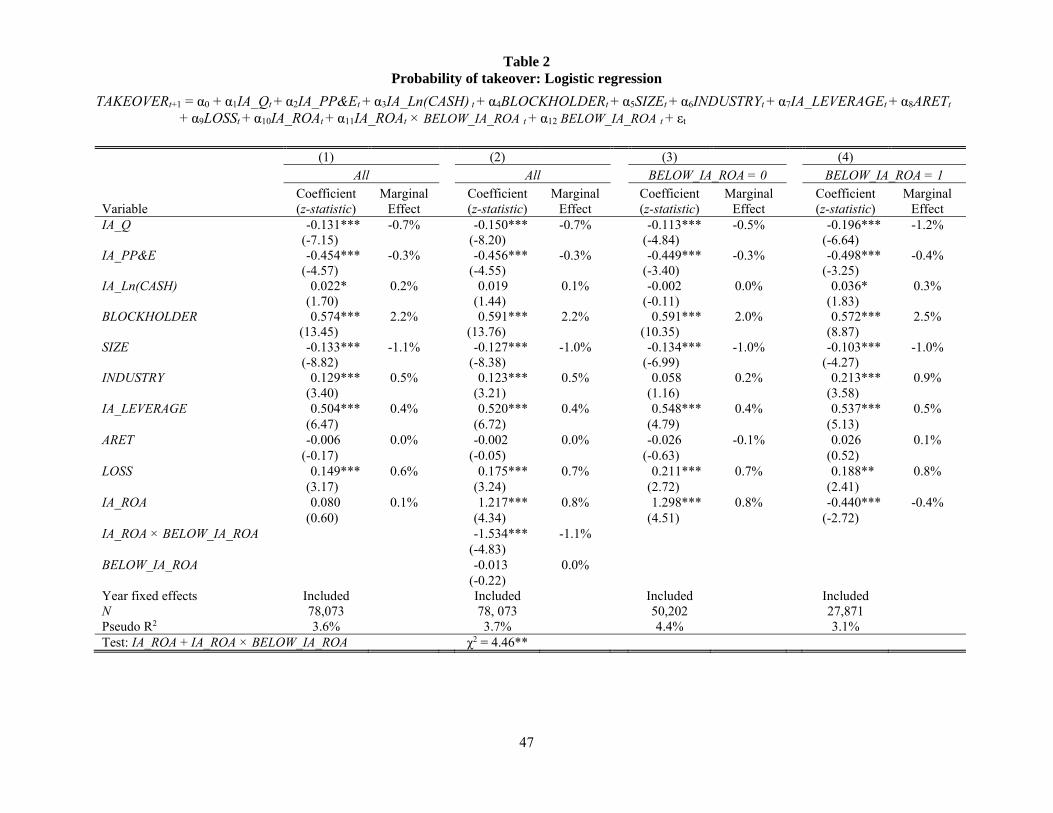
47
Table 2 Probability of takeover: Logistic regression
TAKEOVERt+1 = α0 + α1IA_Qt + α2IA_PP&Et + α3IA_Ln(CASH) t + α4BLOCKHOLDERt + α5SIZEt + α6INDUSTRYt + α7IA_LEVERAGEt + α8ARETt
+ α9LOSSt + α10IA_ROAt + α11IA_ROAt × BELOW_IA_ROA t + α12 BELOW_IA_ROA t + εt
Variable
(1) (2) (3) (4) All All BELOW_IA_ROA = 0 BELOW_IA_ROA = 1
Coefficient (z-statistic)
Marginal Effect
Coefficient (z-statistic)
Marginal Effect
Coefficient (z-statistic)
Marginal Effect
Coefficient (z-statistic)
Marginal Effect
IA_Q -0.131*** -0.7% -0.150*** -0.7% -0.113*** -0.5% -0.196*** -1.2% (-7.15) (-8.20) (-4.84) (-6.64)
IA_PP&E -0.454*** -0.3% -0.456*** -0.3% -0.449*** -0.3% -0.498*** -0.4% (-4.57) (-4.55) (-3.40) (-3.25)
IA_Ln(CASH) 0.022* 0.2% 0.019 0.1% -0.002 0.0% 0.036* 0.3% (1.70) (1.44) (-0.11) (1.83)
BLOCKHOLDER 0.574*** 2.2% 0.591*** 2.2% 0.591*** 2.0% 0.572*** 2.5% (13.45) (13.76) (10.35) (8.87)
SIZE -0.133*** -1.1% -0.127*** -1.0% -0.134*** -1.0% -0.103*** -1.0% (-8.82) (-8.38) (-6.99) (-4.27)
INDUSTRY 0.129*** 0.5% 0.123*** 0.5% 0.058 0.2% 0.213*** 0.9% (3.40) (3.21) (1.16) (3.58)
IA_LEVERAGE 0.504*** 0.4% 0.520*** 0.4% 0.548*** 0.4% 0.537*** 0.5% (6.47) (6.72) (4.79) (5.13)
ARET -0.006 0.0% -0.002 0.0% -0.026 -0.1% 0.026 0.1% (-0.17) (-0.05) (-0.63) (0.52)
LOSS 0.149*** 0.6% 0.175*** 0.7% 0.211*** 0.7% 0.188** 0.8% (3.17) (3.24) (2.72) (2.41)
IA_ROA 0.080 0.1% 1.217*** 0.8% 1.298*** 0.8% -0.440*** -0.4% (0.60) (4.34) (4.51) (-2.72)
IA_ROA × BELOW_IA_ROA -1.534*** -1.1% (-4.83)
BELOW_IA_ROA -0.013 0.0% (-0.22)
Year fixed effects Included Included Included Included N 78,073 78, 073 50,202 27,871 Pseudo R2 3.6% 3.7% 4.4% 3.1% Test: IA_ROA + IA_ROA × BELOW_IA_ROA χ2 = 4.46**
48
Notes to Table 2:
This table presents the test of the association between industry-adjusted ROA (IA_ROA) and probability of takeover. The sample includes all observations in Compustat with the required data available and excludes financial firms. The dependent variable is TAKEOVERi,t, an indicator variable equal to one if firm i receives a completed takeover bid in fiscal year t+1. Variable definitions are provided in the Appendix. We include year fixed effects. Standard errors used to calculate z-statistics, presented in parentheses, are White adjusted and clustered by firm and year. The marginal effects column presents change in the probability of takeover for a one standard deviation increase in the variable, or a change from 0 to 1 for an indicator variable, with all other independent variables taking the mean value. At the bottom of column 2 we present a test of whether the combined coefficient IA_ROA + IA_ROA × BELOW_IA_ROA is significant. *, **, and *** denote two-tailed statistical significance at 10%, 5%, and 1%, respectively.
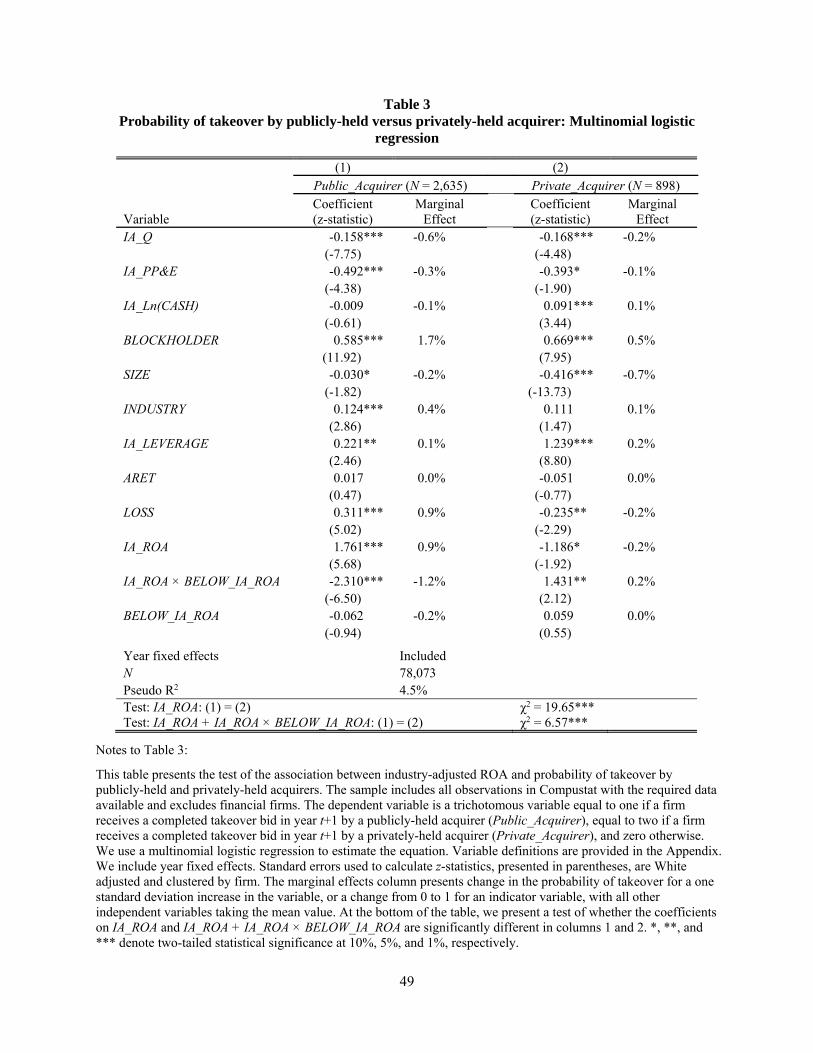
49
Table 3 Probability of takeover by publicly-held versus privately-held acquirer: Multinomial logistic
regression
Variable
(1) (2) Public_Acquirer (N = 2,635) Private_Acquirer (N = 898) Coefficient (z-statistic)
Marginal Effect
Coefficient (z-statistic)
Marginal Effect
IA_Q -0.158*** -0.6% -0.168*** -0.2% (-7.75) (-4.48)
IA_PP&E -0.492*** -0.3% -0.393* -0.1% (-4.38) (-1.90)
IA_Ln(CASH) -0.009 -0.1% 0.091*** 0.1% (-0.61) (3.44)
BLOCKHOLDER 0.585*** 1.7% 0.669*** 0.5% (11.92) (7.95)
SIZE -0.030* -0.2% -0.416*** -0.7% (-1.82) (-13.73)
INDUSTRY 0.124*** 0.4% 0.111 0.1% (2.86) (1.47)
IA_LEVERAGE 0.221** 0.1% 1.239*** 0.2% (2.46) (8.80)
ARET 0.017 0.0% -0.051 0.0% (0.47) (-0.77)
LOSS 0.311*** 0.9% -0.235** -0.2% (5.02) (-2.29)
IA_ROA 1.761*** 0.9% -1.186* -0.2% (5.68) (-1.92)
IA_ROA × BELOW_IA_ROA -2.310*** -1.2% 1.431** 0.2% (-6.50) (2.12)
BELOW_IA_ROA -0.062 -0.2% 0.059 0.0% (-0.94) (0.55)
Year fixed effects Included N 78,073 Pseudo R2 4.5% Test: IA_ROA: (1) = (2) χ2 = 19.65*** Test: IA_ROA + IA_ROA × BELOW_IA_ROA: (1) = (2) χ2 = 6.57***
Notes to Table 3:
This table presents the test of the association between industry-adjusted ROA and probability of takeover by publicly-held and privately-held acquirers. The sample includes all observations in Compustat with the required data available and excludes financial firms. The dependent variable is a trichotomous variable equal to one if a firm receives a completed takeover bid in year t+1 by a publicly-held acquirer (Public_Acquirer), equal to two if a firm receives a completed takeover bid in year t+1 by a privately-held acquirer (Private_Acquirer), and zero otherwise. We use a multinomial logistic regression to estimate the equation. Variable definitions are provided in the Appendix. We include year fixed effects. Standard errors used to calculate z-statistics, presented in parentheses, are White adjusted and clustered by firm. The marginal effects column presents change in the probability of takeover for a one standard deviation increase in the variable, or a change from 0 to 1 for an indicator variable, with all other independent variables taking the mean value. At the bottom of the table, we present a test of whether the coefficients on IA_ROA and IA_ROA + IA_ROA × BELOW_IA_ROA are significantly different in columns 1 and 2. *, **, and *** denote two-tailed statistical significance at 10%, 5%, and 1%, respectively.
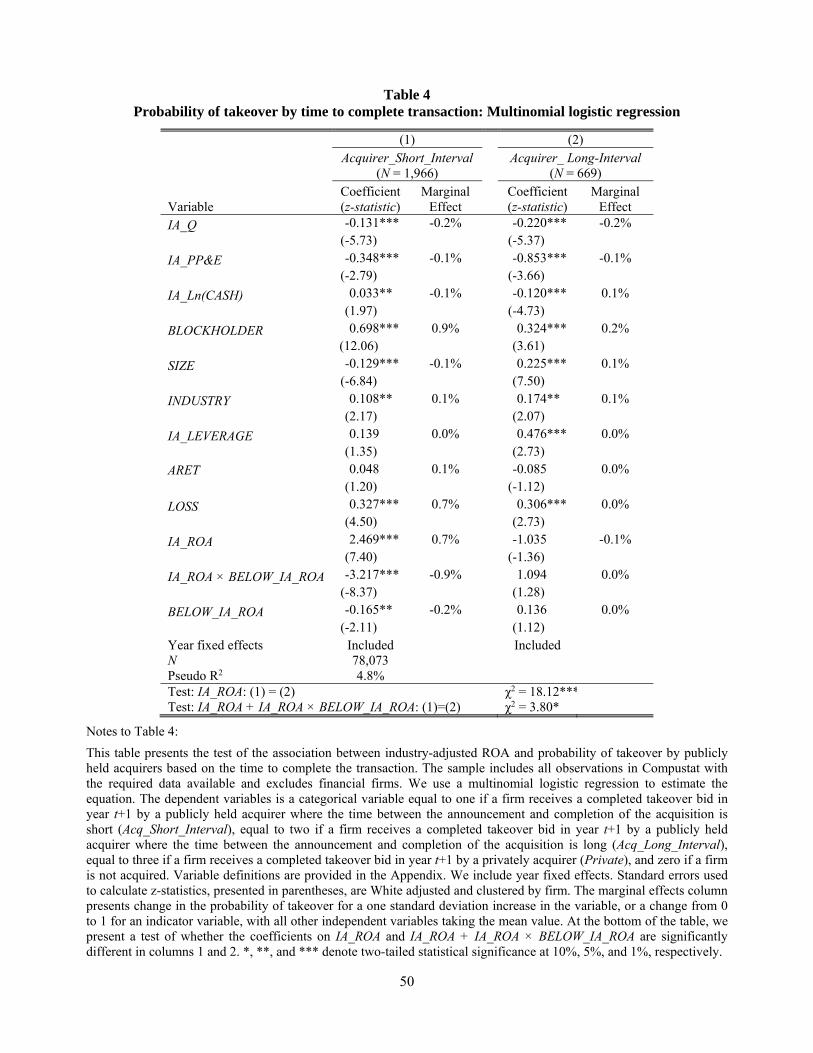
50
Table 4 Probability of takeover by time to complete transaction: Multinomial logistic regression
Variable
(1) (2) Acquirer_Short_Interval
(N = 1,966) Acquirer_ Long-Interval
(N = 669) Coefficient (z-statistic)
Marginal Effect
Coefficient (z-statistic)
Marginal Effect
IA_Q -0.131*** -0.2% -0.220*** -0.2% (-5.73) (-5.37)
IA_PP&E -0.348*** -0.1% -0.853*** -0.1% (-2.79) (-3.66)
IA_Ln(CASH) 0.033** -0.1% -0.120*** 0.1% (1.97) (-4.73)
BLOCKHOLDER 0.698*** 0.9% 0.324*** 0.2% (12.06) (3.61)
SIZE -0.129*** -0.1% 0.225*** 0.1% (-6.84) (7.50)
INDUSTRY 0.108** 0.1% 0.174** 0.1% (2.17) (2.07)
IA_LEVERAGE 0.139 0.0% 0.476*** 0.0% (1.35) (2.73)
ARET 0.048 0.1% -0.085 0.0% (1.20) (-1.12)
LOSS 0.327*** 0.7% 0.306*** 0.0% (4.50) (2.73)
IA_ROA 2.469*** 0.7% -1.035 -0.1% (7.40) (-1.36)
IA_ROA × BELOW_IA_ROA -3.217*** -0.9% 1.094 0.0% (-8.37) (1.28)
BELOW_IA_ROA -0.165** -0.2% 0.136 0.0% (-2.11) (1.12)
Year fixed effects Included Included N 78,073 Pseudo R2 4.8% Test: IA_ROA: (1) = (2) χ2 = 18.12*** Test: IA_ROA + IA_ROA × BELOW_IA_ROA: (1)=(2) χ2 = 3.80*
Notes to Table 4:
This table presents the test of the association between industry-adjusted ROA and probability of takeover by publicly held acquirers based on the time to complete the transaction. The sample includes all observations in Compustat with the required data available and excludes financial firms. We use a multinomial logistic regression to estimate the equation. The dependent variables is a categorical variable equal to one if a firm receives a completed takeover bid in year t+1 by a publicly held acquirer where the time between the announcement and completion of the acquisition is short (Acq_Short_Interval), equal to two if a firm receives a completed takeover bid in year t+1 by a publicly held acquirer where the time between the announcement and completion of the acquisition is long (Acq_Long_Interval), equal to three if a firm receives a completed takeover bid in year t+1 by a privately acquirer (Private), and zero if a firm is not acquired. Variable definitions are provided in the Appendix. We include year fixed effects. Standard errors used to calculate z-statistics, presented in parentheses, are White adjusted and clustered by firm. The marginal effects column presents change in the probability of takeover for a one standard deviation increase in the variable, or a change from 0 to 1 for an indicator variable, with all other independent variables taking the mean value. At the bottom of the table, we present a test of whether the coefficients on IA_ROA and IA_ROA + IA_ROA × BELOW_IA_ROA are significantly different in columns 1 and 2. *, **, and *** denote two-tailed statistical significance at 10%, 5%, and 1%, respectively.
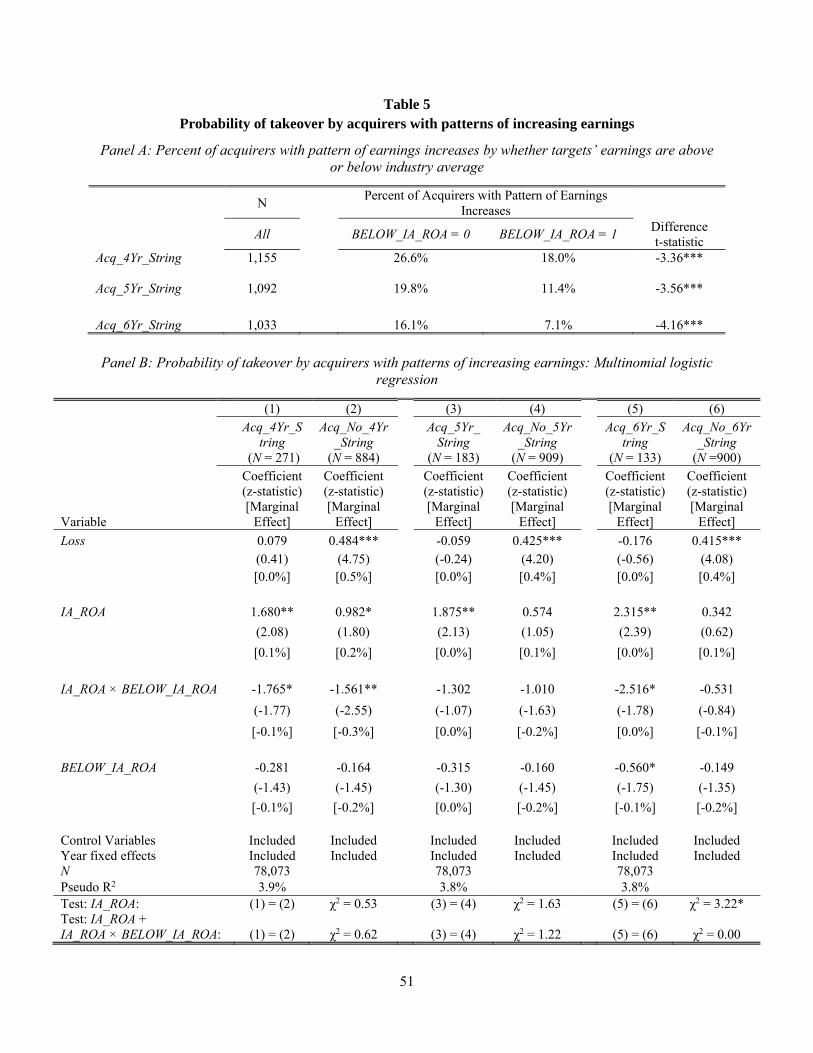
51
Table 5 Probability of takeover by acquirers with patterns of increasing earnings
Panel A: Percent of acquirers with pattern of earnings increases by whether targets’ earnings are above or below industry average
N Percent of Acquirers with Pattern of Earnings
Increases
All
BELOW_IA_ROA = 0 BELOW_IA_ROA = 1
Difference t-statistic
Acq_4Yr_String 1,155 26.6% 18.0% -3.36*** Acq_5Yr_String 1,092 19.8% 11.4% -3.56***
Acq_6Yr_String 1,033 16.1% 7.1% -4.16***
Panel B: Probability of takeover by acquirers with patterns of increasing earnings: Multinomial logistic
regression
Variable
(1) (2) (3) (4)
(5) (6)
Acq_4Yr_S
tring (N = 271)
Acq_No_4Yr_String
(N = 884)
Acq_5Yr_ String
(N = 183)
Acq_No_5Yr _String
(N = 909)
Acq_6Yr_String
(N = 133)
Acq_No_6Yr_String
(N =900)
Coefficient (z-statistic) [Marginal
Effect]
Coefficient (z-statistic) [Marginal
Effect]
Coefficient (z-statistic) [Marginal
Effect]
Coefficient (z-statistic) [Marginal
Effect]
Coefficient (z-statistic) [Marginal
Effect]
Coefficient (z-statistic) [Marginal
Effect]
Loss 0.079 0.484*** -0.059 0.425*** -0.176 0.415*** (0.41) (4.75) (-0.24) (4.20) (-0.56) (4.08) [0.0%] [0.5%] [0.0%] [0.4%] [0.0%] [0.4%]
IA_ROA 1.680** 0.982* 1.875** 0.574 2.315** 0.342
(2.08) (1.80) (2.13) (1.05) (2.39) (0.62)
[0.1%] [0.2%] [0.0%] [0.1%] [0.0%] [0.1%] IA_ROA × BELOW_IA_ROA -1.765* -1.561** -1.302 -1.010 -2.516* -0.531
(-1.77) (-2.55) (-1.07) (-1.63) (-1.78) (-0.84)
[-0.1%] [-0.3%] [0.0%] [-0.2%] [0.0%] [-0.1%] BELOW_IA_ROA -0.281 -0.164 -0.315 -0.160 -0.560* -0.149
(-1.43) (-1.45) (-1.30) (-1.45) (-1.75) (-1.35)
[-0.1%] [-0.2%] [0.0%] [-0.2%] [-0.1%] [-0.2%] Control Variables Included Included Included Included Included Included Year fixed effects Included Included Included Included Included Included N 78,073 78,073 78,073 Pseudo R2 3.9% 3.8% 3.8% Test: IA_ROA: (1) = (2) χ2 = 0.53 (3) = (4) χ2 = 1.63 (5) = (6) χ2 = 3.22* Test: IA_ROA + IA_ROA × BELOW_IA_ROA: (1) = (2) χ2 = 0.62 (3) = (4) χ2 = 1.22 (5) = (6) χ2 = 0.00
52
Notes to Table 5:
This table presents the test of the association between industry-adjusted ROA and probability of takeover by acquirers with patterns of earnings increases, acquirers without patterns of earnings increases, and privately held acquirers or acquirers without available data to calculate patterns of earnings. The sample includes all observations in Compustat with the required data available and excludes financial firms. Panel A presents a comparison of the percentage of acquirers with a pattern of annual earnings increases for four, five, and six years by whether the target firms’ earnings are above or below the industry-average. In Panel B, we use a multinomial logistic regression to estimate the equation and the dependent variable is a categorical variable equal to one if a firm receives a completed takeover bid in year t+1 by a publicly held acquirer with a pattern of annual earnings increases (ACQ_4YR_STRING, ACQ_5YR _STRING, and ACQ_6YR_STRING), equal to two if a firm receives a completed takeover bid in year t+1 by a publicly held acquirer without a pattern of earnings increases (ACQ_NO_4YR_STRING, ACQ_NO_5YR_STRING, and ACQ_NO_6YR_STRING), equal to three if a firm receives a completed takeover bid in year t+1 by an acquirer where data is not available to determine if there is a pattern of earnings increases (PRIVATE/UNKNOWN), and zero if a firm is not acquired. For brevity, we do not present results for estimating the probability of PRIVATE/UNKOWN and estimated coefficients for control variables. We include year fixed effects. Variable definitions are provided in the Appendix. Standard errors used to calculate z-statistics (t-statistics), presented in parentheses, are White adjusted and clustered by firm. The marginal effects in Panel B, presented in brackets, are the change in the probability of takeover for a one standard deviation increase in the variable, or a change from 0 to 1 for an indicator variable, with all other independent variables taking the mean value. At the bottom of the Panel B, we present a test of whether the coefficients on IA_ROA and IA_ROA + IA_ROA × BELOW_IA_ROA are significantly different between columns. *, **, and *** denote two-tailed statistical significance at 10%, 5%, and 1%, respectively.
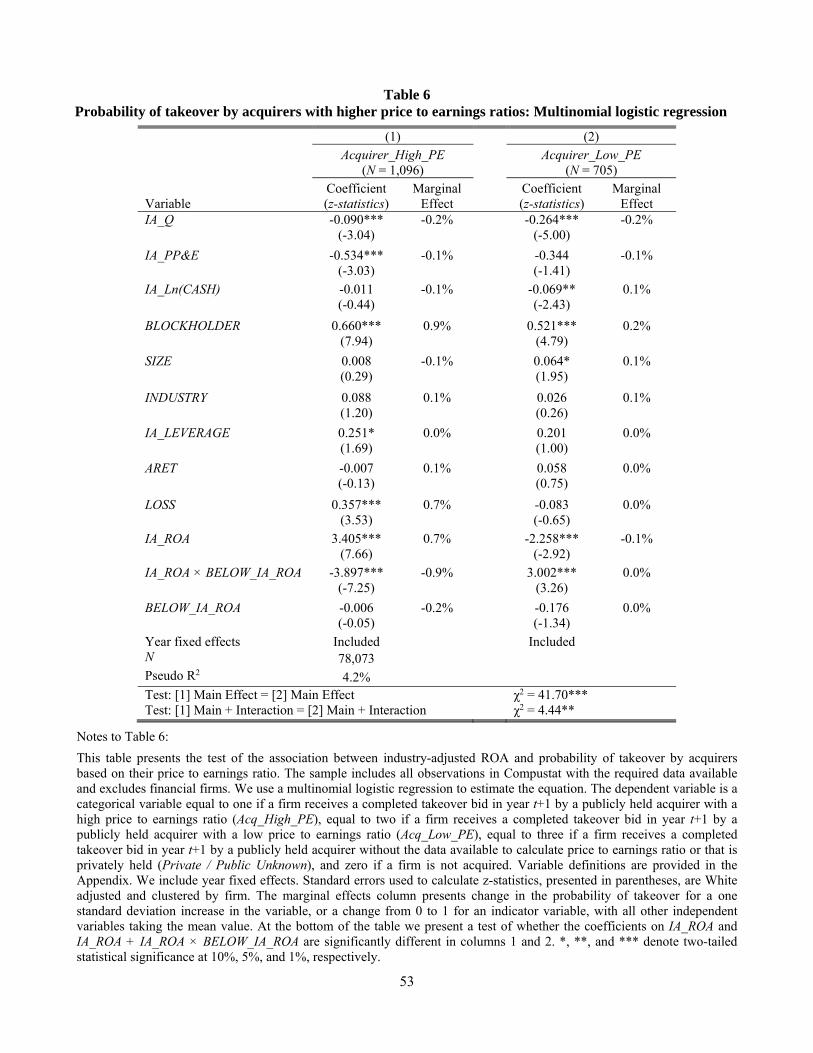
53
Table 6 Probability of takeover by acquirers with higher price to earnings ratios: Multinomial logistic regression
Variable
(1) (2) Acquirer_High_PE
(N = 1,096) Acquirer_Low_PE
(N = 705) Coefficient (z-statistics)
Marginal Effect
Coefficient (z-statistics)
Marginal Effect
IA_Q -0.090*** -0.2% -0.264*** -0.2% (-3.04) (-5.00)
IA_PP&E -0.534*** -0.1% -0.344 -0.1% (-3.03) (-1.41)
IA_Ln(CASH) -0.011 -0.1% -0.069** 0.1% (-0.44) (-2.43)
BLOCKHOLDER 0.660*** 0.9% 0.521*** 0.2% (7.94) (4.79)
SIZE 0.008 -0.1% 0.064* 0.1% (0.29) (1.95)
INDUSTRY 0.088 0.1% 0.026 0.1% (1.20) (0.26)
IA_LEVERAGE 0.251* 0.0% 0.201 0.0% (1.69) (1.00)
ARET -0.007 0.1% 0.058 0.0% (-0.13) (0.75)
LOSS 0.357*** 0.7% -0.083 0.0% (3.53) (-0.65)
IA_ROA 3.405*** 0.7% -2.258*** -0.1% (7.66) (-2.92)
IA_ROA × BELOW_IA_ROA -3.897*** -0.9% 3.002*** 0.0% (-7.25) (3.26)
BELOW_IA_ROA -0.006 -0.2% -0.176 0.0% (-0.05) (-1.34)
Year fixed effects Included Included N 78,073 Pseudo R2 4.2% Test: [1] Main Effect = [2] Main Effect χ2 = 41.70*** Test: [1] Main + Interaction = [2] Main + Interaction χ2 = 4.44**
Notes to Table 6:
This table presents the test of the association between industry-adjusted ROA and probability of takeover by acquirers based on their price to earnings ratio. The sample includes all observations in Compustat with the required data available and excludes financial firms. We use a multinomial logistic regression to estimate the equation. The dependent variable is a categorical variable equal to one if a firm receives a completed takeover bid in year t+1 by a publicly held acquirer with a high price to earnings ratio (Acq_High_PE), equal to two if a firm receives a completed takeover bid in year t+1 by a publicly held acquirer with a low price to earnings ratio (Acq_Low_PE), equal to three if a firm receives a completed takeover bid in year t+1 by a publicly held acquirer without the data available to calculate price to earnings ratio or that is privately held (Private / Public Unknown), and zero if a firm is not acquired. Variable definitions are provided in the Appendix. We include year fixed effects. Standard errors used to calculate z-statistics, presented in parentheses, are White adjusted and clustered by firm. The marginal effects column presents change in the probability of takeover for a one standard deviation increase in the variable, or a change from 0 to 1 for an indicator variable, with all other independent variables taking the mean value. At the bottom of the table we present a test of whether the coefficients on IA_ROA and IA_ROA + IA_ROA × BELOW_IA_ROA are significantly different in columns 1 and 2. *, **, and *** denote two-tailed statistical significance at 10%, 5%, and 1%, respectively.
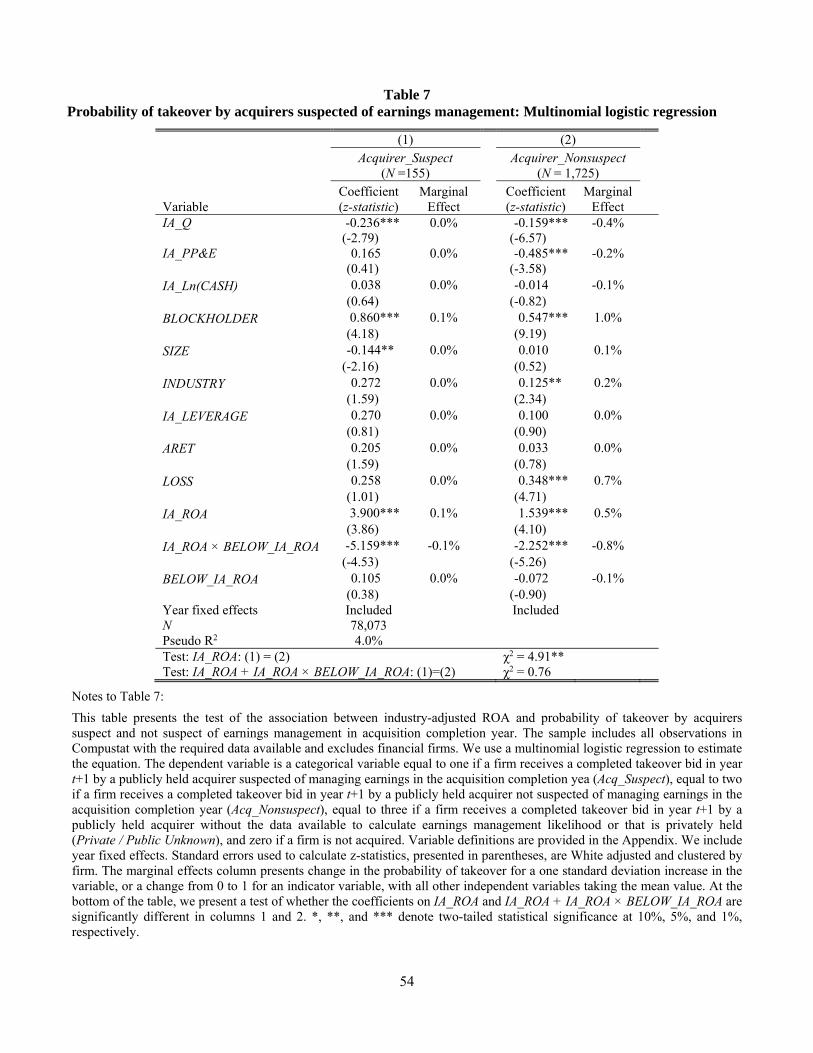
54
Table 7 Probability of takeover by acquirers suspected of earnings management: Multinomial logistic regression
Variable
(1) (2) Acquirer_Suspect
(N =155) Acquirer_Nonsuspect
(N = 1,725) Coefficient (z-statistic)
Marginal Effect
Coefficient (z-statistic)
Marginal Effect
IA_Q -0.236*** 0.0% -0.159*** -0.4% (-2.79) (-6.57)
IA_PP&E 0.165 0.0% -0.485*** -0.2% (0.41) (-3.58)
IA_Ln(CASH) 0.038 0.0% -0.014 -0.1% (0.64) (-0.82)
BLOCKHOLDER 0.860*** 0.1% 0.547*** 1.0% (4.18) (9.19)
SIZE -0.144** 0.0% 0.010 0.1% (-2.16) (0.52)
INDUSTRY 0.272 0.0% 0.125** 0.2% (1.59) (2.34)
IA_LEVERAGE 0.270 0.0% 0.100 0.0% (0.81) (0.90)
ARET 0.205 0.0% 0.033 0.0% (1.59) (0.78)
LOSS 0.258 0.0% 0.348*** 0.7% (1.01) (4.71)
IA_ROA 3.900*** 0.1% 1.539*** 0.5% (3.86) (4.10)
IA_ROA × BELOW_IA_ROA -5.159*** -0.1% -2.252*** -0.8% (-4.53) (-5.26)
BELOW_IA_ROA 0.105 0.0% -0.072 -0.1% (0.38) (-0.90)
Year fixed effects Included Included N 78,073 Pseudo R2 4.0% Test: IA_ROA: (1) = (2) χ2 = 4.91** Test: IA_ROA + IA_ROA × BELOW_IA_ROA: (1)=(2) χ2 = 0.76
Notes to Table 7:
This table presents the test of the association between industry-adjusted ROA and probability of takeover by acquirers suspect and not suspect of earnings management in acquisition completion year. The sample includes all observations in Compustat with the required data available and excludes financial firms. We use a multinomial logistic regression to estimate the equation. The dependent variable is a categorical variable equal to one if a firm receives a completed takeover bid in year t+1 by a publicly held acquirer suspected of managing earnings in the acquisition completion yea (Acq_Suspect), equal to two if a firm receives a completed takeover bid in year t+1 by a publicly held acquirer not suspected of managing earnings in the acquisition completion year (Acq_Nonsuspect), equal to three if a firm receives a completed takeover bid in year t+1 by a publicly held acquirer without the data available to calculate earnings management likelihood or that is privately held (Private / Public Unknown), and zero if a firm is not acquired. Variable definitions are provided in the Appendix. We include year fixed effects. Standard errors used to calculate z-statistics, presented in parentheses, are White adjusted and clustered by firm. The marginal effects column presents change in the probability of takeover for a one standard deviation increase in the variable, or a change from 0 to 1 for an indicator variable, with all other independent variables taking the mean value. At the bottom of the table, we present a test of whether the coefficients on IA_ROA and IA_ROA + IA_ROA × BELOW_IA_ROA are significantly different in columns 1 and 2. *, **, and *** denote two-tailed statistical significance at 10%, 5%, and 1%, respectively.
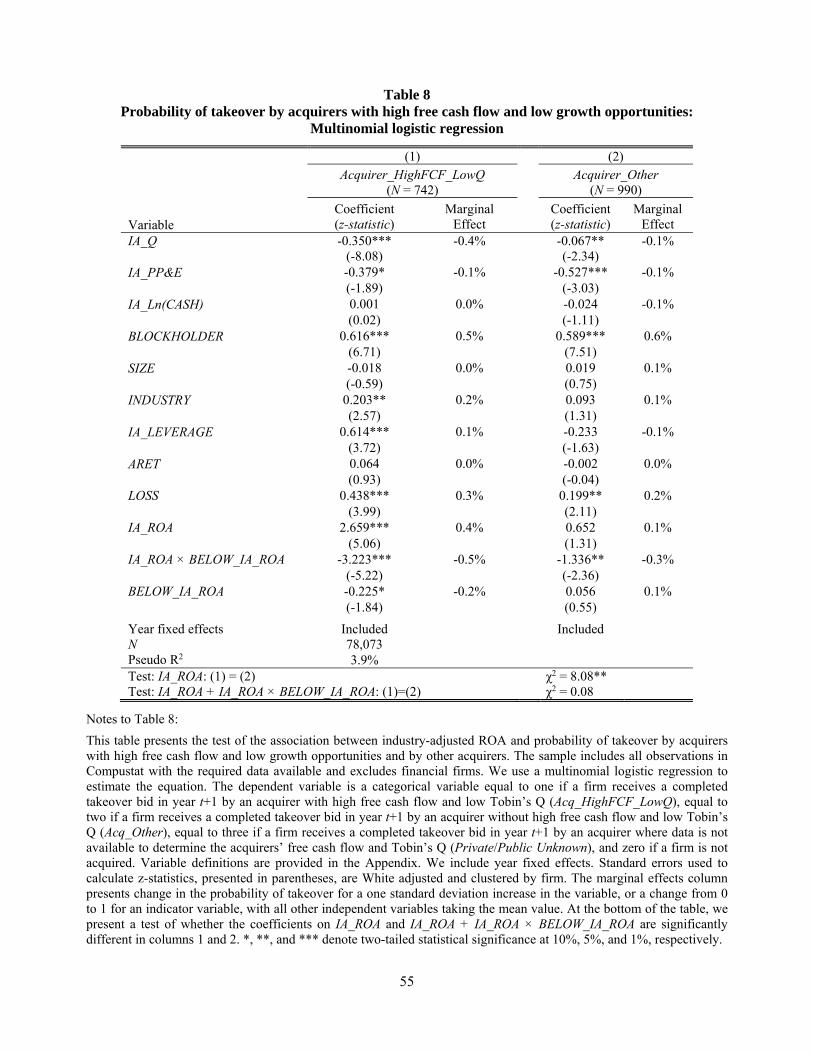
55
Table 8 Probability of takeover by acquirers with high free cash flow and low growth opportunities:
Multinomial logistic regression
Variable
(1) (2) Acquirer_HighFCF_LowQ
(N = 742) Acquirer_Other
(N = 990)
Coefficient (z-statistic)
Marginal Effect
Coefficient (z-statistic)
Marginal Effect
IA_Q -0.350*** -0.4% -0.067** -0.1% (-8.08) (-2.34)
IA_PP&E -0.379* -0.1% -0.527*** -0.1% (-1.89) (-3.03)
IA_Ln(CASH) 0.001 0.0% -0.024 -0.1% (0.02) (-1.11)
BLOCKHOLDER 0.616*** 0.5% 0.589*** 0.6% (6.71) (7.51)
SIZE -0.018 0.0% 0.019 0.1% (-0.59) (0.75)
INDUSTRY 0.203** 0.2% 0.093 0.1% (2.57) (1.31)
IA_LEVERAGE 0.614*** 0.1% -0.233 -0.1% (3.72) (-1.63)
ARET 0.064 0.0% -0.002 0.0% (0.93) (-0.04)
LOSS 0.438*** 0.3% 0.199** 0.2% (3.99) (2.11) IA_ROA 2.659*** 0.4% 0.652 0.1% (5.06) (1.31) IA_ROA × BELOW_IA_ROA -3.223*** -0.5% -1.336** -0.3% (-5.22) (-2.36) BELOW_IA_ROA -0.225* -0.2% 0.056 0.1% (-1.84) (0.55)
Year fixed effects Included Included N 78,073 Pseudo R2 3.9% Test: IA_ROA: (1) = (2) χ2 = 8.08** Test: IA_ROA + IA_ROA × BELOW_IA_ROA: (1)=(2) χ2 = 0.08
Notes to Table 8:
This table presents the test of the association between industry-adjusted ROA and probability of takeover by acquirers with high free cash flow and low growth opportunities and by other acquirers. The sample includes all observations in Compustat with the required data available and excludes financial firms. We use a multinomial logistic regression to estimate the equation. The dependent variable is a categorical variable equal to one if a firm receives a completed takeover bid in year t+1 by an acquirer with high free cash flow and low Tobin’s Q (Acq_HighFCF_LowQ), equal to two if a firm receives a completed takeover bid in year t+1 by an acquirer without high free cash flow and low Tobin’s Q (Acq_Other), equal to three if a firm receives a completed takeover bid in year t+1 by an acquirer where data is not available to determine the acquirers’ free cash flow and Tobin’s Q (Private/Public Unknown), and zero if a firm is not acquired. Variable definitions are provided in the Appendix. We include year fixed effects. Standard errors used to calculate z-statistics, presented in parentheses, are White adjusted and clustered by firm. The marginal effects column presents change in the probability of takeover for a one standard deviation increase in the variable, or a change from 0 to 1 for an indicator variable, with all other independent variables taking the mean value. At the bottom of the table, we present a test of whether the coefficients on IA_ROA and IA_ROA + IA_ROA × BELOW_IA_ROA are significantly different in columns 1 and 2. *, **, and *** denote two-tailed statistical significance at 10%, 5%, and 1%, respectively.

56
Table 9 Probability of takeover by acquirers with and without blockholders: Multinomial logistic
regression
Variable
(1) (2) Acquirer_NoBlock (N = 381) Acquirer_Block (N = 907)
Coefficient (z-statistic)
Marginal Effect
Coefficient (z-statistic)
Marginal Effect
IA_Q -0.181*** -0.1% -0.126*** -0.2% (-3.48) (-3.80)
IA_PP&E -0.439 0.0% -0.436** -0.1% (-1.55) (-2.55)
IA_Ln(CASH) -0.004 0.0% -0.009 0.0% (-0.12) (-0.41)
BLOCKHOLDER 0.556*** 0.2% 0.684*** 0.6% (4.41) (8.04)
SIZE 0.058 0.1% -0.074*** -0.1% (1.49) (-2.82)
INDUSTRY -0.022 0.0% 0.044 0.0% (-0.20) (0.60)
IA_LEVERAGE -0.209 0.0% 0.170 0.0% (-0.93) (1.18)
ARET -0.112 0.0% 0.015 0.0% (-1.17) (0.26)
LOSS 0.487*** 0.2% 0.291*** 0.3% (3.36) (2.92) IA_ROA 3.744*** 0.3% 1.378*** 0.2% (5.28) (2.76) IA_ROA × BELOW_IA_ROA -4.621*** -0.3% -1.643*** -0.3% (-5.76) (-2.83) BELOW_IA_ROA 0.114 0.0% -0.128 -0.1% (0.71) (-1.19)
Year fixed effects Included Included N 78,073 Pseudo R2 3.6% Test: IA_ROA: (1) = (2) χ2 = 7.67*** Test: IA_ROA + IA_ROA × BELOW_IA_ROA: (1)=(2) χ2 = 1.54
Notes to Table 9:
This table presents the test of the association between industry-adjusted ROA and probability of takeover by acquirers with and without institutional blockholders. The sample includes all observations in Compustat with the required data available and excludes financial firms. We use a multinomial logistic regression to estimate the equation. The dependent variable is a categorical variable equal to one if a firm receives a completed takeover bid in year t+1 by an acquirer without a blockholder (Acquirer_NoBlock), equal to two if a firm receives a completed takeover bid in year t+1 by an acquirer with a blockholder (Acquirer_Block), equal to three if a firm receives a completed takeover bid in year t+1 by an acquirer where data is not available to determine if the acquirer has a blockholder (Private/ Public Unknown), and zero if a firm is not acquired. Variable definitions are provided in the Appendix. We include year fixed effects. Standard errors used to calculate z-statistics, presented in parentheses, are White adjusted and clustered by firm. The marginal effects column presents change in the probability of takeover for a one standard deviation increase in the variable, or a change from 0 to 1 for an indicator variable, with all other independent variables taking the mean value. At the bottom of the table, we present a test of whether the coefficients on IA_ROA and IA_ROA + IA_ROA × BELOW_IA_ROA are significantly different in columns 1 and 2. *, **, and *** denote two-tailed statistical significance at 10%, 5%, and 1%, respectively.
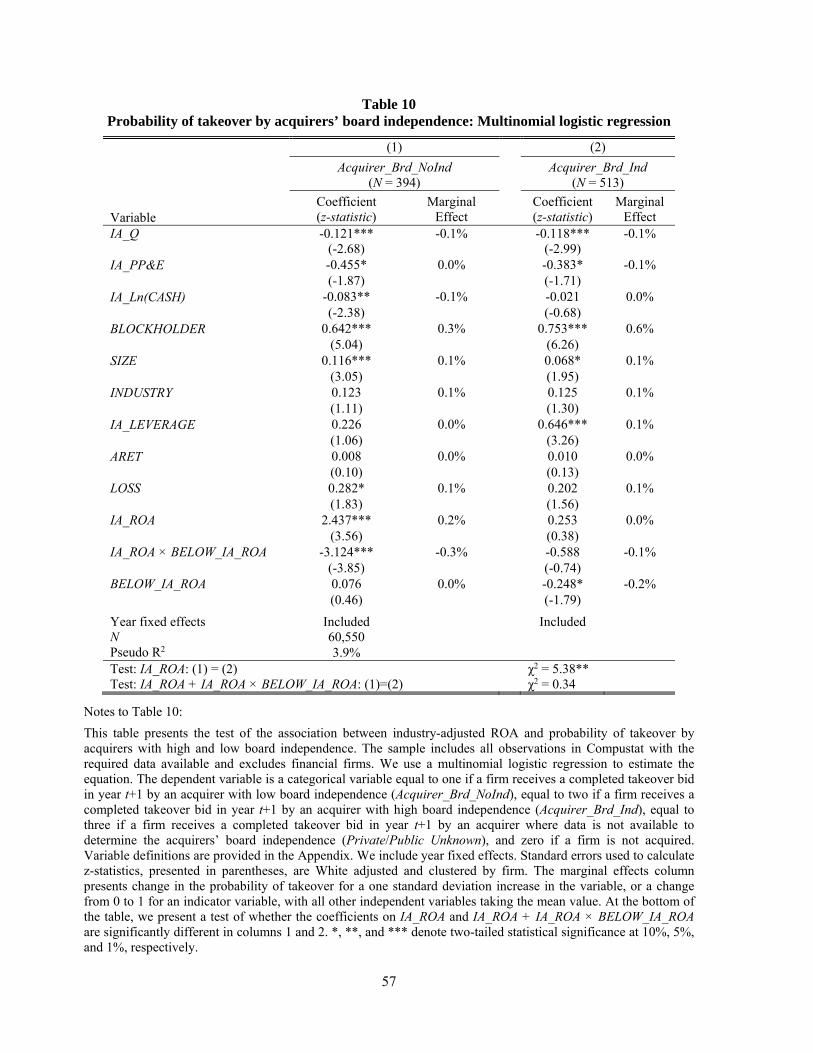
57
Table 10 Probability of takeover by acquirers’ board independence: Multinomial logistic regression
Variable
(1) (2)
Acquirer_Brd_NoInd (N = 394)
Acquirer_Brd_Ind (N = 513)
Coefficient (z-statistic)
Marginal Effect
Coefficient (z-statistic)
Marginal Effect
IA_Q -0.121*** -0.1% -0.118*** -0.1% (-2.68) (-2.99)
IA_PP&E -0.455* 0.0% -0.383* -0.1% (-1.87) (-1.71)
IA_Ln(CASH) -0.083** -0.1% -0.021 0.0% (-2.38) (-0.68)
BLOCKHOLDER 0.642*** 0.3% 0.753*** 0.6% (5.04) (6.26)
SIZE 0.116*** 0.1% 0.068* 0.1% (3.05) (1.95)
INDUSTRY 0.123 0.1% 0.125 0.1% (1.11) (1.30)
IA_LEVERAGE 0.226 0.0% 0.646*** 0.1% (1.06) (3.26)
ARET 0.008 0.0% 0.010 0.0% (0.10) (0.13)
LOSS 0.282* 0.1% 0.202 0.1% (1.83) (1.56) IA_ROA 2.437*** 0.2% 0.253 0.0% (3.56) (0.38) IA_ROA × BELOW_IA_ROA -3.124*** -0.3% -0.588 -0.1% (-3.85) (-0.74) BELOW_IA_ROA 0.076 0.0% -0.248* -0.2% (0.46) (-1.79)
Year fixed effects Included Included N 60,550 Pseudo R2 3.9% Test: IA_ROA: (1) = (2) χ2 = 5.38** Test: IA_ROA + IA_ROA × BELOW_IA_ROA: (1)=(2) χ2 = 0.34
Notes to Table 10:
This table presents the test of the association between industry-adjusted ROA and probability of takeover by acquirers with high and low board independence. The sample includes all observations in Compustat with the required data available and excludes financial firms. We use a multinomial logistic regression to estimate the equation. The dependent variable is a categorical variable equal to one if a firm receives a completed takeover bid in year t+1 by an acquirer with low board independence (Acquirer_Brd_NoInd), equal to two if a firm receives a completed takeover bid in year t+1 by an acquirer with high board independence (Acquirer_Brd_Ind), equal to three if a firm receives a completed takeover bid in year t+1 by an acquirer where data is not available to determine the acquirers’ board independence (Private/Public Unknown), and zero if a firm is not acquired. Variable definitions are provided in the Appendix. We include year fixed effects. Standard errors used to calculate z-statistics, presented in parentheses, are White adjusted and clustered by firm. The marginal effects column presents change in the probability of takeover for a one standard deviation increase in the variable, or a change from 0 to 1 for an indicator variable, with all other independent variables taking the mean value. At the bottom of the table, we present a test of whether the coefficients on IA_ROA and IA_ROA + IA_ROA × BELOW_IA_ROA are significantly different in columns 1 and 2. *, **, and *** denote two-tailed statistical significance at 10%, 5%, and 1%, respectively.
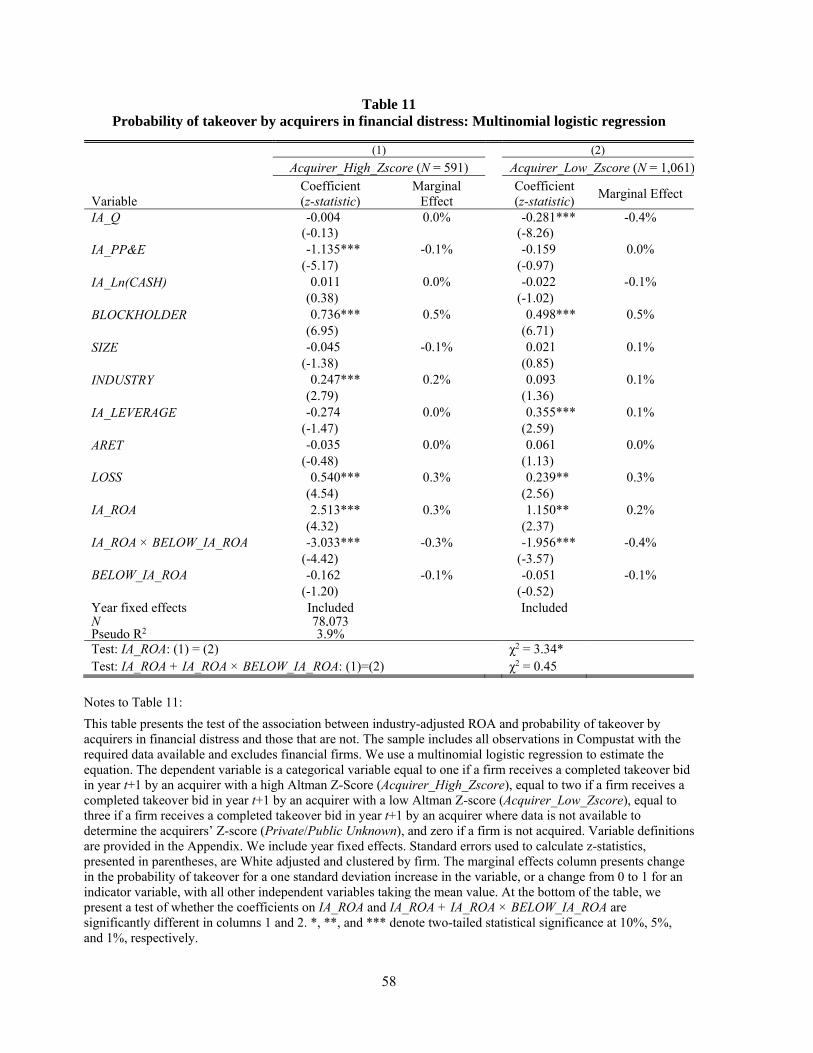
58
Table 11 Probability of takeover by acquirers in financial distress: Multinomial logistic regression
Variable
(1) (2)
Acquirer_High_Zscore (N = 591) Acquirer_Low_Zscore (N = 1,061)Coefficient (z-statistic)
Marginal Effect
Coefficient (z-statistic)
Marginal Effect
IA_Q -0.004 0.0% -0.281*** -0.4% (-0.13) (-8.26)
IA_PP&E -1.135*** -0.1% -0.159 0.0% (-5.17) (-0.97)
IA_Ln(CASH) 0.011 0.0% -0.022 -0.1% (0.38) (-1.02)
BLOCKHOLDER 0.736*** 0.5% 0.498*** 0.5% (6.95) (6.71)
SIZE -0.045 -0.1% 0.021 0.1% (-1.38) (0.85)
INDUSTRY 0.247*** 0.2% 0.093 0.1% (2.79) (1.36)
IA_LEVERAGE -0.274 0.0% 0.355*** 0.1% (-1.47) (2.59)
ARET -0.035 0.0% 0.061 0.0% (-0.48) (1.13)
LOSS 0.540*** 0.3% 0.239** 0.3% (4.54) (2.56) IA_ROA 2.513*** 0.3% 1.150** 0.2% (4.32) (2.37) IA_ROA × BELOW_IA_ROA -3.033*** -0.3% -1.956*** -0.4% (-4.42) (-3.57) BELOW_IA_ROA -0.162 -0.1% -0.051 -0.1% (-1.20) (-0.52) Year fixed effects Included Included N 78,073 Pseudo R2 3.9% Test: IA_ROA: (1) = (2) χ2 = 3.34* Test: IA_ROA + IA_ROA × BELOW_IA_ROA: (1)=(2) χ2 = 0.45
Notes to Table 11:
This table presents the test of the association between industry-adjusted ROA and probability of takeover by acquirers in financial distress and those that are not. The sample includes all observations in Compustat with the required data available and excludes financial firms. We use a multinomial logistic regression to estimate the equation. The dependent variable is a categorical variable equal to one if a firm receives a completed takeover bid in year t+1 by an acquirer with a high Altman Z-Score (Acquirer_High_Zscore), equal to two if a firm receives a completed takeover bid in year t+1 by an acquirer with a low Altman Z-score (Acquirer_Low_Zscore), equal to three if a firm receives a completed takeover bid in year t+1 by an acquirer where data is not available to determine the acquirers’ Z-score (Private/Public Unknown), and zero if a firm is not acquired. Variable definitions are provided in the Appendix. We include year fixed effects. Standard errors used to calculate z-statistics, presented in parentheses, are White adjusted and clustered by firm. The marginal effects column presents change in the probability of takeover for a one standard deviation increase in the variable, or a change from 0 to 1 for an indicator variable, with all other independent variables taking the mean value. At the bottom of the table, we present a test of whether the coefficients on IA_ROA and IA_ROA + IA_ROA × BELOW_IA_ROA are significantly different in columns 1 and 2. *, **, and *** denote two-tailed statistical significance at 10%, 5%, and 1%, respectively.
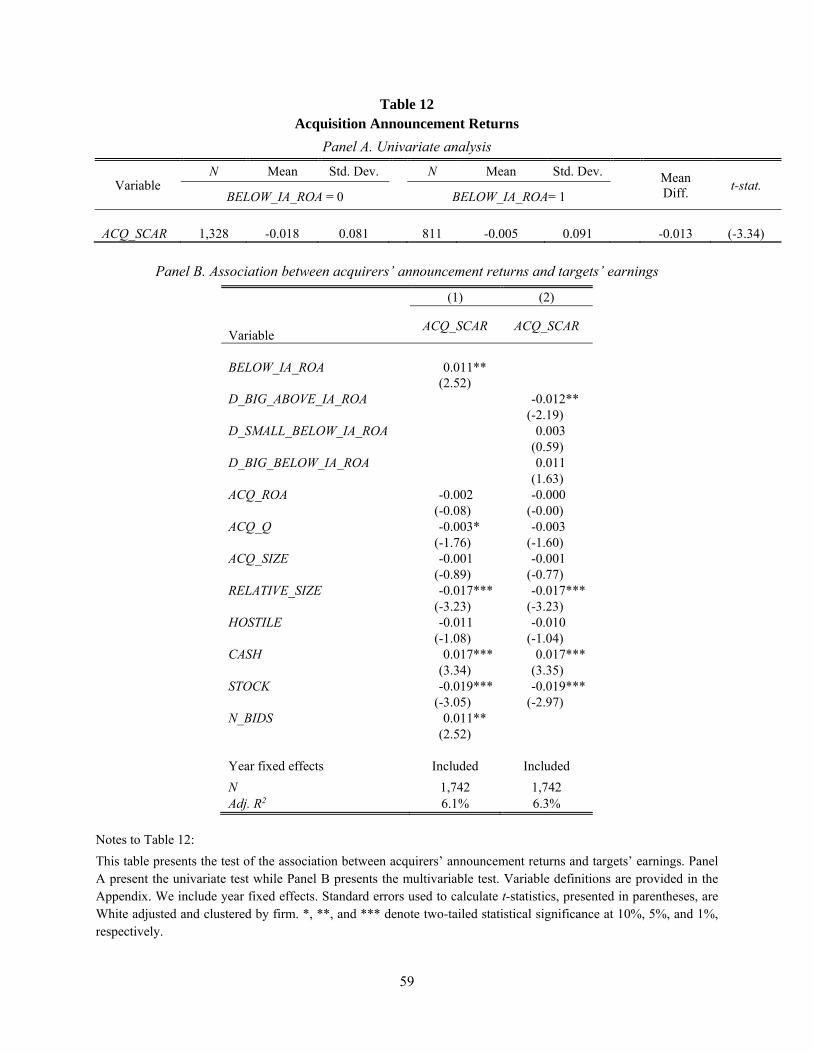
59
Table 12 Acquisition Announcement Returns
Panel A. Univariate analysis
Variable N Mean Std. Dev.
N Mean Std. Dev.
Mean Diff.
t-stat. BELOW_IA_ROA = 0 BELOW_IA_ROA= 1
ACQ_SCAR 1,328 -0.018 0.081 811 -0.005 0.091 -0.013 (-3.34)
Panel B. Association between acquirers’ announcement returns and targets’ earnings
Variable
(1) (2)
ACQ_SCAR ACQ_SCAR
BELOW_IA_ROA 0.011** (2.52)
D_BIG_ABOVE_IA_ROA -0.012** (-2.19)
D_SMALL_BELOW_IA_ROA 0.003 (0.59)
D_BIG_BELOW_IA_ROA 0.011 (1.63)
ACQ_ROA -0.002 -0.000 (-0.08) (-0.00)
ACQ_Q -0.003* -0.003 (-1.76) (-1.60)
ACQ_SIZE -0.001 -0.001 (-0.89) (-0.77)
RELATIVE_SIZE -0.017*** -0.017*** (-3.23) (-3.23)
HOSTILE -0.011 -0.010 (-1.08) (-1.04)
CASH 0.017*** 0.017*** (3.34) (3.35)
STOCK -0.019*** -0.019*** (-3.05) (-2.97)
N_BIDS 0.011** (2.52)
Year fixed effects Included Included
N 1,742 1,742 Adj. R2 6.1% 6.3%
Notes to Table 12:
This table presents the test of the association between acquirers’ announcement returns and targets’ earnings. Panel A present the univariate test while Panel B presents the multivariable test. Variable definitions are provided in the Appendix. We include year fixed effects. Standard errors used to calculate t-statistics, presented in parentheses, are White adjusted and clustered by firm. *, **, and *** denote two-tailed statistical significance at 10%, 5%, and 1%, respectively.