accessibility in cities: transport and urban … · accessibility in cities transport and urban...
TRANSCRIPT
WWW.NEWCLIMATEECONOMY.NET 1ACCESSIBILITY IN CITIES TRANSPORT AND URBAN FORM NOVEMBER 2014
1 INTRODUCTION 03
2 ACCESSIBILITY IN CITIES AND 04 IMPLICATIONS FOR CARBON EMISSIONS
3 ASSESSMENT 11
4 PATTERNS, TRENDS AND 19 TIPPING POINTS
5 ACCESSIBILITY THROUGH 32 COMPACT CITIES AND SUSTAINABLE TRANSPORT
6 CONCLUSIONS 40
BIBLIOGRAPHY 42
NOTES 59
CONTENTS Page
ACCESSIBILITY IN CITIES: TRANSPORT AND URBAN FORMLead Authors: Philipp Rode and Graham FloaterContributing Authors: Nikolas Thomopoulos, James Docherty, Peter Schwinger, Anjali Mahendra, Wanli FangLSE Cities Research Team: Bruno Friedel, Alexandra Gomes, Catarina Heeckt, Roxana Slavcheva
The New Climate Economy
The New Climate Economy (NCE) is the flagship project of the Global Commission on the Economy and Climate. It was established by seven countries, Colombia, Ethiopia, Indonesia, Norway, South Korea, Sweden and the United Kingdom, as an independent initiative to examine how countries can achieve economic growth while dealing with the risks posed by climate change. The NCE Cities Research Programme is led by LSE Cities at the London School of Economics. The programme includes a consortium of researchers from the Stockholm Environment Institute, the ESRC Centre for Climate Change Economics and Policy, the World Resources Institute, Victoria Transport Policy Institute, and Oxford Economics. The NCE Cities Research Programme is directed by Graham Floater and Philipp Rode.
ABSTRACTThis paper focusses on one central aspect of urban development: transport and urban form and how the two shape the provision of access to people, goods and services, and information in cities. The more efficient this access, the greater the economic benefits through economies of scale, agglomeration effects and networking advantages. This paper discusses how different urban accessibility pathways impact directly on other measures of human development and environmental sustainability. It also presents the enabling conditions for increasing accessibility and low-carbon mobility in cities. This paper is one of three papers by LSE Cities that form part of the cities research programme of the New Climate Economy (NCE) project for the Global Commission on the Economy and Climate. The two other contributing papers cover ‘Cities and the New Climate Economy: the Transformative Role of Global Urban Growth’ (NCE Paper 01) and ‘Steering Urban Growth: Governance, Policy and Finance’ (NCE Paper 02).
NCE Cities – Paper 03
ACCESSIBILITY IN CITIES TRANSPORT AND URBAN FORM WWW.NEWCLIMATEECONOMY.NET 2
Additional supportJiayan Liu, Todd Litman, Jerome Pourbaix, Philip Turner
Call for evidence respondents (institutions)Allianz; Atkins; C40 Cities; CDC Climat; Centre for Low Carbon Futures, Citibank; Cities Alliance; City of Stockholm; DFID; DFID South Asia; Energy Foundation for Chinese Cities; Greater London Authority; ICLEI; McKinsey; NYU Stern School of Business; OECD; Renault; Ricardo AEA; Rocky Mountain Institute; Siemens; Transport Studies Unit, University of Oxford; Tsinghua University; Urban Climate Change Research Network (ARC3); UITP; UK Centre for Cities; UN-Habitat; University College London; University of Leeds; Victoria Transport Policy Institute; WBCSD; World Bank; WWF.
Call for evidence respondents (individuals)Shlomo Angel, David Banister, Michael Batty, Flavia Carloni, Neil Dunse, Ludger Eltrop, Pete Erickson, Michael Erman, Caralampo Focas, Andrew Gouldson, Jean Grebert, Stephen Hammer, Klaus Heidinger, Johan Kuylenstierna, Carrie Lee, Todd Litman, Shagun Mehrotra, Pedro Miranda, Katrin Mueller, Malin Parmander, Martin Powell, Cynthia Rosenzweig, William Solecki, Thomas Telsnig, Sotirios Thanos, Heather Zeppel, Savvas Verdis, Marilu Valente.
Internal ReviewGeraldine Ang, Vijay Jagannathan, Robin King, Todd Litman, Virginie Marchal
AcknowledgementsNick Godfrey, Isher Judge Ahluwalia, Dimitri Zenghelis, Ian de Cruz, Daniele Viappiani, Jeremy Oppenheim, Ricky Burdett, Rachel Lewis
LSE CitiesLondon School of Economics and Political Science Houghton StreetLondon WC2A 2AE
www.lsecities.net
This paper should be referenced as Rode, P., Floater, G., Thomopoulos, N., Docherty, J., Schwinger, P., Mahendra, A., and Fang, W. (2014): Accessibility in Cities: Transport and Urban Form. NCE Cities Paper 03. LSE Cities. London School of Economics and Political Science.
DisclaimerThis paper builds on the LSE Cities research and publications including the Green Cities and Buildings chapters for UNEP’s Green Economy Report, P. Rode’s research on integrated planning, design and transport and research by the LSE’s Economics of Green Cities programme led by G. Floater, P. Rode and D. Zenghelis. This paper was submitted in July 2014.
While every effort has been made to ensure the accuracy of the material in this report, the authors and/or LSE Cities will not be liable for any loss or damage incurred through the use of this paper. © LSE Cities, London School of Economics and Political Science, 2014.
ACCESSIBILITY IN CITIES TRANSPORT AND URBAN FORM WWW.NEWCLIMATEECONOMY.NET 3
1 INTRODUCTION
Access to people, goods, services and information is the basis of economic development in cities. The better and more efficient this access, the greater the economic benefits through economies of scale, agglomeration effects and networking advantages. Cities with higher levels of agglomeration tend to have higher GDP per capita and higher levels of productivity. The way in which cities facilitate accessibility through their urban forms and transport systems also impacts directly on other measures of human development and well-being. Urban travel currently constitutes more than 60 per cent of all kilometres travelled globally (van Audenhove, Korniichuk et al. 2014) and, as a result, urban transport is currently the largest single source of global transport-related carbon emissions and the largest local source of urban air pollution.
This paper will present evidence first on how accessibility in cities is created through the co-dependence of urban form and transport systems and how this relates to urban carbon emissions. It will then compare key economic and social impacts of different urban accessibility pathways. The fourth section discusses contemporary patterns, trends and tipping points related to the shape of cities, urban mobility and technological innovation. Using this information, the final section presents the enabling conditions for increasing accessibility and low-carbon mobility in cities. This paper is primarily based on an extensive literature review and aims to assist a further re-framing of the urban transport debate by emphasising accessibility as the underlying objective of mobility and transport in cities. Above all, such a re-framing implies a far greater recognition of urban form characteristics such as land use, the distribution of densities and urban design, in addition to more conventional transport characteristics such as related infrastructure, service levels and travel speeds.
While this paper aims to present a balanced perspective on the latest state of the debate based on a comprehensive review of the literature, the evidence cited below is not exhaustive.
ACCESSIBILITY IN CITIES: TRANSPORT AND URBAN FORM
ACCESSIBILITY IN CITIES TRANSPORT AND URBAN FORM WWW.NEWCLIMATEECONOMY.NET 4
2 ACCESSIBILITY IN CITIES AND IMPLICATIONS FOR CARBON EMISSIONS
In any city, patterns of urban development are inseparable from the evolution of urban transport and mobility. Likewise, urban transport cannot be considered independently from urban form (Newman and Kenworthy 1989; ECOTEC 1993; Houghton 1995; Newman and Kenworthy 1996; Knoflacher, Rode et al. 2008; Dimitriou and Gakenheimer 2009; UN Habitat 2013). It is a combination of the two that facilitates accessibility1 within metropolitan regions and thus creates economies of scale, agglomeration effects and networking advantages. Recognition of this interrelationship between transport and urban form is particularly important at a time of unprecedented urban expansion. Some estimates suggest that globally, the total amount of urbanised land could triple between 2000 and 2030 (Seto, Güneralp et al. 2012) and urban kilometres travelled increase three-fold by 2050 (van Audenhove, Korniichuk et al. 2014). Such unprecedented change would bring with it enormous risks associated with locking in energy intense patterns of accessibility and urban form for decades to come (Ang and Marchal 2013).
2.1 URBAN ACCESSIBILITY PATHWAYS
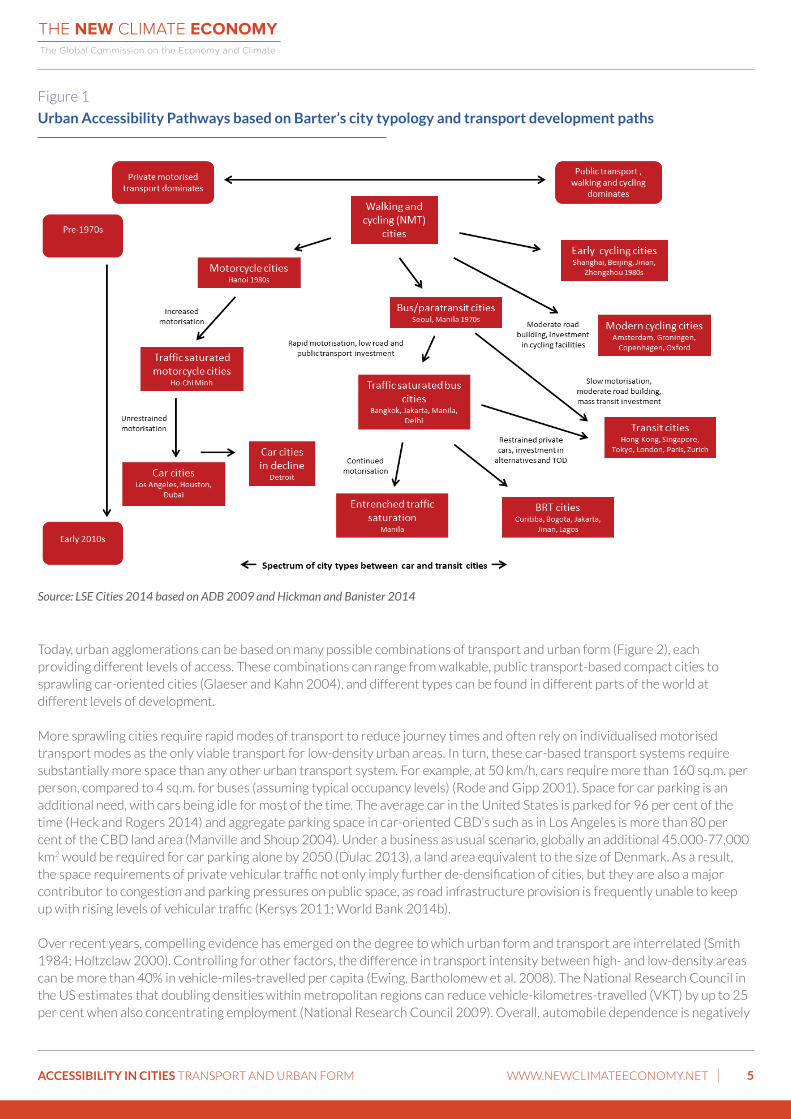
Each city has developed its own unique spatial structure and transport system to provide access to people, goods and information. Nonetheless, different principal development patterns have evolved with respect to the most common combinations of urban spatial structures and transport. Given the strong path dependency of these patterns, we call these ‘urban accessibility pathways’ (Figure 1). A defining characteristic of these pathways is the degree to which accessibility is based on the physical proximity between origins and destinations or on transport solutions which can overcome spatial separation, and the degree to which these solutions involve private or public motorised transport.
The first principle of achieving accessibility in cities is based on the physical concentration of people, services, economic activities and exchange. In that regard, the most defining characteristics include residential and workplace densities; the distribution of functions and degree of mixed use; the level of centralisation; and local level urban design. More compact and dense cities2 (also referred to as smart growth, see Appendix A for key features) are typical examples of facilitating agglomeration economies through greater proximity. Creating accessibility based on physical proximity implies a particular attention to planning, designing, building and managing the specific local condition at a human scale.
To a certain extent, physical proximity in cities can be substituted by increasing the speed of travel through the use of rapid, motorised modes of public and private transport. It is important to note, however, that even then the overarching objective remains the provision of access to opportunities rather than mobility or movement itself. Infrastructural features that define such ‘access by velocity’ include the surface coverage of roads, the quality of road and rail networks and other public transport infrastructure. In addition, transport operations and service quality determine transport-based access and typically include the service level of public transport and the availability of privately owned vehicles.
Over the last century, the mechanisation of transport and the associated reduction in mobility costs relative to incomes have allowed cities to de-densify and expand horizontally, resulting in the substitution of access by proximity with access by movement. Initially driven by the introduction of streetcars, metro and regional rail systems (Heinze and Kill 1991; Gayda, Haag et al. 2005; Knoflacher, Rode et al. 2008), this process reached a new and entirely different scale with the onset of mass motorisation and the widespread introduction of privately-owned cars (UK Ministry of Transport 1963; Bottles 1987; Cervero 1998).
Previously, transit systems allowed for horizontal expansion that both facilitated and required compact, dense urban development and continued to produce human-scale urban environments. Urban design had to acknowledge the fact that at some point in their journey, all public transport passengers remained pedestrians, navigating through public urban space. By contrast, the introduction of the motor car not only facilitated suburban development at far lower density levels, but also introduced a transport mode that needed significantly more space to operate than any other previous means of transport. In short, public transport requires urban density whilst car use requires space. In most cities, this has led to extraordinary tensions as a result of the inefficient use of scarce urban space by private vehicles. This provides a particular challenge for dense, developing cities where contemporary motorisation far outpaces the provision of road infrastructure or public transit alternatives.
ACCESSIBILITY IN CITIES TRANSPORT AND URBAN FORM WWW.NEWCLIMATEECONOMY.NET 5
Figure 1
Urban Accessibility Pathways based on Barter’s city typology and transport development paths
Source: LSE Cities 2014 based on ADB 2009 and Hickman and Banister 2014
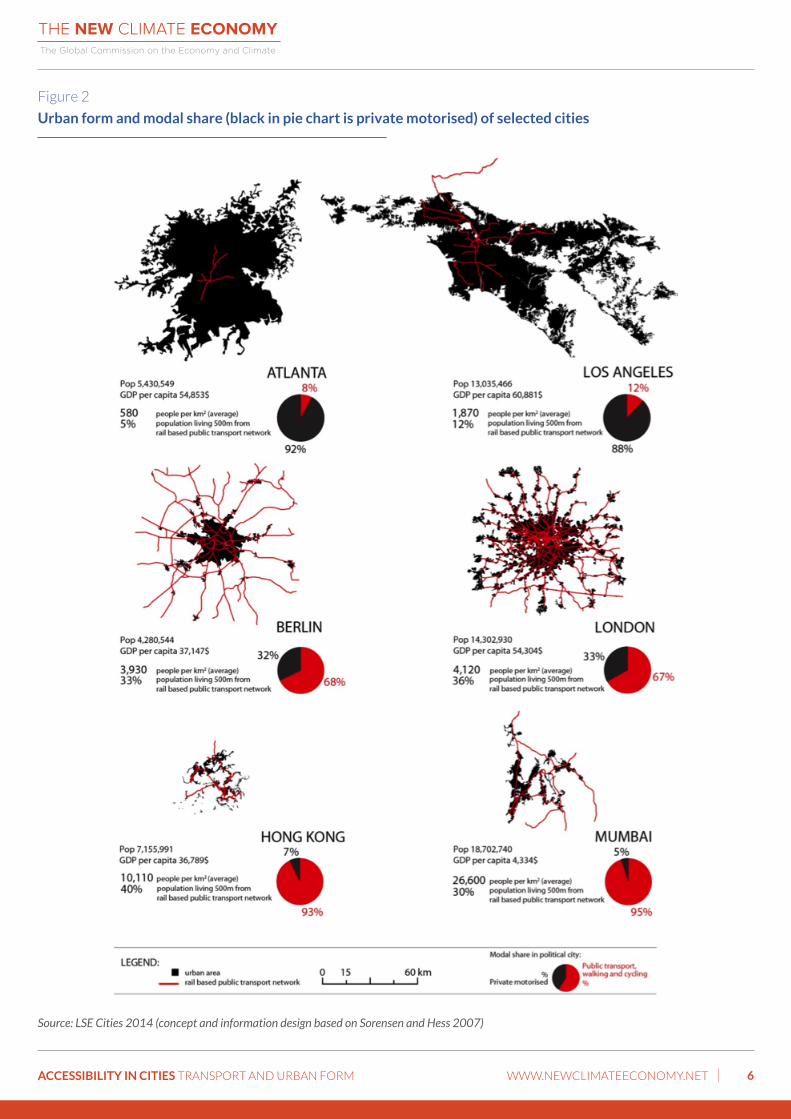
Today, urban agglomerations can be based on many possible combinations of transport and urban form (Figure 2), each providing different levels of access. These combinations can range from walkable, public transport-based compact cities to sprawling car-oriented cities (Glaeser and Kahn 2004), and different types can be found in different parts of the world at different levels of development.
More sprawling cities require rapid modes of transport to reduce journey times and often rely on individualised motorised transport modes as the only viable transport for low-density urban areas. In turn, these car-based transport systems require substantially more space than any other urban transport system. For example, at 50 km/h, cars require more than 160 sq.m. per person, compared to 4 sq.m. for buses (assuming typical occupancy levels) (Rode and Gipp 2001). Space for car parking is an additional need, with cars being idle for most of the time. The average car in the United States is parked for 96 per cent of the time (Heck and Rogers 2014) and aggregate parking space in car-oriented CBD’s such as in Los Angeles is more than 80 per cent of the CBD land area (Manville and Shoup 2004). Under a business as usual scenario, globally an additional 45,000-77,000 km2 would be required for car parking alone by 2050 (Dulac 2013), a land area equivalent to the size of Denmark. As a result, the space requirements of private vehicular traffic not only imply further de-densification of cities, but they are also a major contributor to congestion and parking pressures on public space, as road infrastructure provision is frequently unable to keep up with rising levels of vehicular traffic (Kersys 2011; World Bank 2014b).
Over recent years, compelling evidence has emerged on the degree to which urban form and transport are interrelated (Smith 1984; Holtzclaw 2000). Controlling for other factors, the difference in transport intensity between high- and low-density areas can be more than 40% in vehicle-miles-travelled per capita (Ewing, Bartholomew et al. 2008). The National Research Council in the US estimates that doubling densities within metropolitan regions can reduce vehicle-kilometres-travelled (VKT) by up to 25 per cent when also concentrating employment (National Research Council 2009). Overall, automobile dependence is negatively
ACCESSIBILITY IN CITIES TRANSPORT AND URBAN FORM WWW.NEWCLIMATEECONOMY.NET 6
Source: LSE Cities 2014 (concept and information design based on Sorensen and Hess 2007)
Figure 2
Urban form and modal share (black in pie chart is private motorised) of selected cities
ACCESSIBILITY IN CITIES TRANSPORT AND URBAN FORM WWW.NEWCLIMATEECONOMY.NET 7
associated with higher population and employment density (Zhang 2006). At the neighbourhood level, density, land-use mix and street design have a significant impact on the likelihood of walking (Ewing and Cervero 2010)3. Similarly, the impact of transport infrastructure on urban form is increasingly well understood. For US metropolitan regions, empirical estimates show that each new highway constructed through an urban core led to an 18 per cent decline in central city residents (Baum-Snow 2007). Recent research on the expansion of Chinese cities found that the combined effect of radial highways and ring roads was a relocation of around 25 per cent of central city residents to surrounding regions, whilst regional railways were found to have no such effect (Henderson 2010; Baum-Snow, Brandt et al. 2012).
A particular feature of the transport-urban form relationship is the time lag between spaces and flows: land-use and physical environments change at a far slower pace than activities and related movements (Medley, Wong et al. 2002). A second feature is the long design life of urban form and transport infrastructure, creating significant ‘lock-in’ effects. Some of these lock-in effects could be overcome by innovations in transport systems and technology, as discussed later in this paper. However, where urban form and transport infrastructure is too biased towards sprawling, automobile-dependent patterns of development, it can in turn lead to a change-inhibiting cultural and political equilibrium. It is for these reasons that dealing with urban transport or land-use planning in isolation from their interdependencies can easily lead to adverse effects and unintended consequences. Furthermore, urban transport is more complex than other transport sectors, not just because it involves the integration of different transport systems, but also because it co-produces accessibility jointly with spatial development.
2.2 Carbon emissions from the provision of access in cities
The co-dependence of urban transport systems with urban form also plays a central role in the global transition to a low-carbon economy (Hickman and Banister 2014). Around ten billion trips are made every day in urban areas around the world. Of these, a significant and increasing proportion is undertaken using high carbon and energy-intensive private motorised vehicles. About 80 per cent of the increase in global transport emissions since 1970 has been due to road vehicles (IPCC 2014b).
As a result, transport is one of the major sources of carbon emissions in cities. Overall, the transport sector produces around 23 percent of global energy-related CO
2 emissions, equivalent to 6.7 gigatonnes of CO
2 in 2010 (IPCC 2014b). While urban car
use is the single largest contributor to transport carbon emissions, freight transport - which accounts for up to 20 per cent of urban traffic and up to 50 per cent of urban transport GHG emissions - is often underrepresented (Savy 2012)4. In addition, life cycle analysis suggests that carbon emissions embedded in transport infrastructures are substantial5, typically adding another 63 per cent for on-road and 155 per cent for rail in addition to emissions from vehicle operations (Chester and Horvath 2009). Emissions are growing more rapidly in the transport sector than in any other sector and are projected to increase by 50 per cent by 2035 and almost double by 2050 under a business-as-usual scenario (Dulac 2013; IPCC 2014b).
Part of this growth is due to rapid urbanisation in emerging economies and developing countries. Although transport emissions per capita in developing countries are relatively low on an absolute basis compared to OECD countries, around 90 percent of the increase in global transport-related CO
2 emissions is expected to occur in developing countries, mostly from private vehicles
and freight (UNCSD 2012). Growth in embedded carbon emissions is another significant factor. If developing countries expand their infrastructure (transport and others) to current global average levels using currently available technologies, around 470 gigatonnes of cumulated CO
2 emissions would be emitted as a result of infrastructure material manufacturing (IPCC 2014a) - or
13 times the global emissions in 2012.6
Over the last decade, significant carbon emission growth was registered for emerging economy megacities. A World Bank study showed that urban transport energy use and carbon emissions were growing by between 4 and 6 percent a year in the 2000s in Beijing, Guangzhou, Shanghai and Xian (Darido, Torres-Montoya et al. 2009). Between 2005 and 2010, carbon emissions from transport in Shanghai even grew by 15 per cent annually, the highest growth rate of any sector (Li and Cao 2012). But even within the European Union – an already highly urbanised area with ambitious carbon reduction goals – transport-related CO
2
emissions increased by 36 per cent between 1990 and 2006, while other key sectors achieved modest reductions (European Commission 2007).
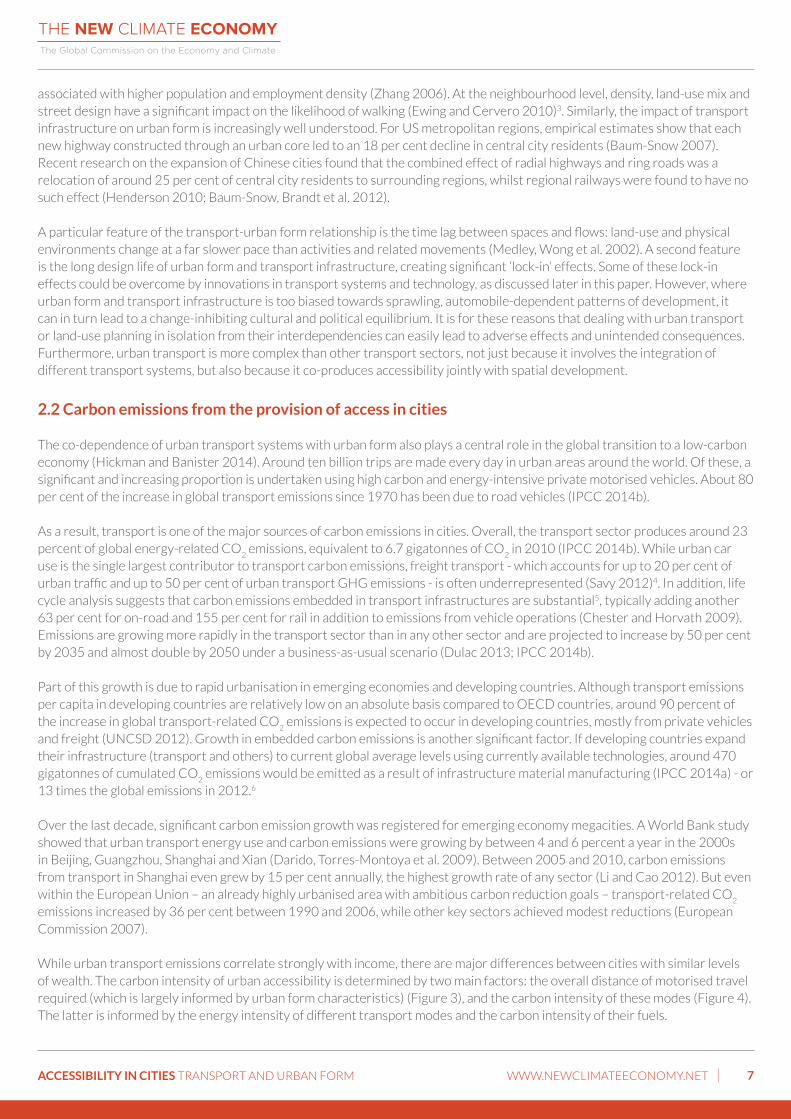
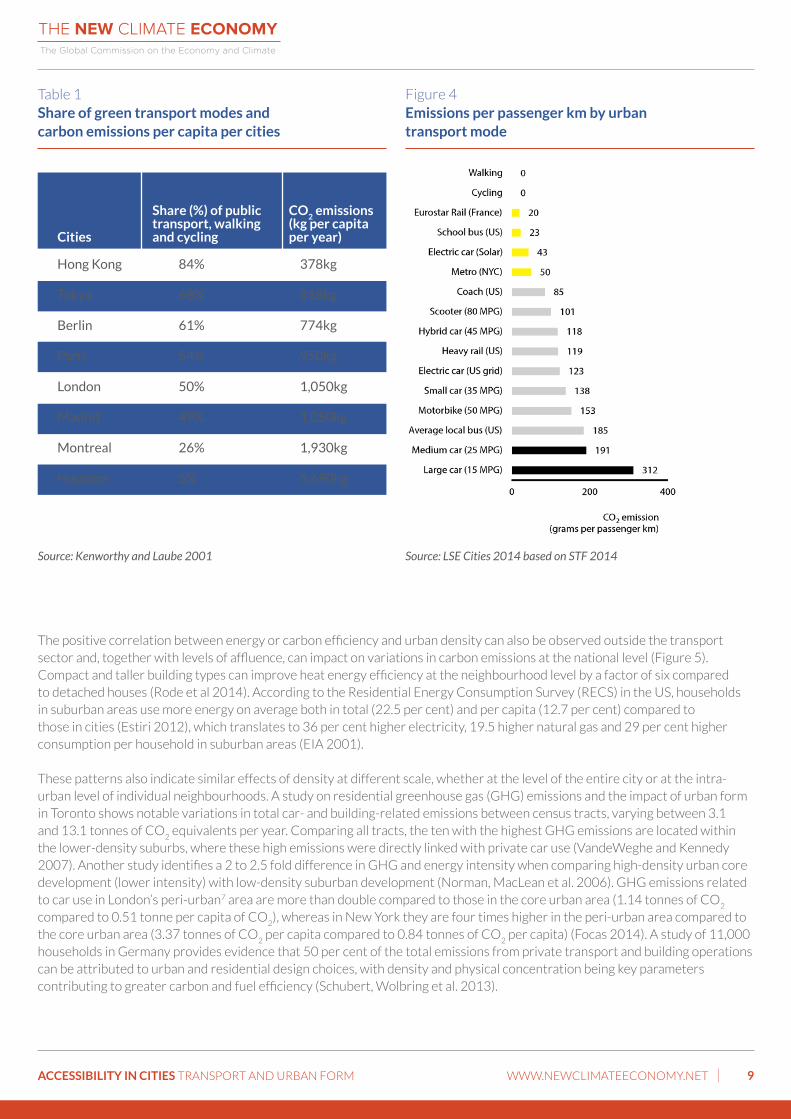
While urban transport emissions correlate strongly with income, there are major differences between cities with similar levels of wealth. The carbon intensity of urban accessibility is determined by two main factors: the overall distance of motorised travel required (which is largely informed by urban form characteristics) (Figure 3), and the carbon intensity of these modes (Figure 4). The latter is informed by the energy intensity of different transport modes and the carbon intensity of their fuels.
ACCESSIBILITY IN CITIES TRANSPORT AND URBAN FORM WWW.NEWCLIMATEECONOMY.NET 8
Figure 3 shows the well-known research findings linking urban form with transport energy use in larger cities across the world, which initially established a strong negative correlation between population density and annual gasoline consumption (Newman and Kenworthy 1989). Overall, more recent research has confirmed this relationship, when controlling for wealth, and they also apply for carbon emissions (OECD 2012a; Qin and Han 2013; UN Habitat 2013; IPCC 2014a). For example, at similar wealth levels, sprawling Atlanta produced six times more transport-related carbon emissions than relatively compact Barcelona (ATM, 2013; D’Onofrio 2014; LSE Cities 2014). This finding aligns with analysis conducted for 30 cities in China, which showed that compact cities have higher CO
2 efficiency, particularly as a result of supporting non-motorised transport (Liu, Chen et al. 2012).
The IPCC suggests that over the medium to long-term an urban accessibility pathway consisting of more public transport-oriented compact cities, combined with improved infrastructure for non-motorised transport, could reduce GHG intensities by 20 to 50 per cent compared to 2010 levels (IPCC 2014b).
Figure 3 Population density and transport energy use per capita for selected cities
URBAN DENSITY (persons/ha)
PER
CAPI
TA P
RIVA
TE P
ASSE
NGER
TRA
NSPO
RTEN
ERG
Y US
E (M
J pe
r ann
um)
120,000
100,000
80,000
60,000
40,000
20,000
00.0 50.0 100.0 150.0 200.0 250.0 300.0 350.0 400.0
Atlanta
Houston
DenverSan Francisco
San DiegoPhoenix
WashingtonLos Angeles
ChicagoNew YorkCalgary
Toronto
VancouverOttawaMontreal
PerthMelbourne
BrisbaneSydney
WellingtonOslo Frankfurt Brussels
HelsinkiCopenhagen
GlasgowBerne
Paris ViennaMilanAthens
AmsterdamBarcelona
London
Tunis
Dakar
TehranCairo
SapporoTokyo Osaka
BeijingGuangzhou Shanghai
Hong Kong
Singapore Bangkok
Jakarta Manila
Taipei/Seoul
Ho Chi Minh CityMumbaiChennaiBogota
KEY
U.S. Cities
Canadian Cities
Australian & New Zealand Cities
European Cities
Middle Eastern Cities
Japanese Cities
Chinese Cities
Asian Cities
Indian Cities
South American Cities
Source: Newman and Kenworthy 2015
The substantial impact on carbon emissions of modal choices in cities is illustrated by Figure 4, which shows the carbon emissions per passenger kilometre for different transport modes. As a result, the share of public transport, walking and cycling is a strong predictor of transport-related carbon emissions at broadly similar wealth levels (Table 1). While all motorised modes have a substantial technical potential to reduce carbon emissions per passenger kilometre - by between 30 to 50 percent compared to 2010 levels (IPCC 2014b) - actual reductions remain highly uncertain.
These relationships matter for the developmental choices which rapidly growing cities face today. A scenario study for US metropolitan areas in cities such as Atlanta and Phoenix suggests a reduction of 7 to 10 per cent in carbon emissions as a result of a 20 to 40 per cent reduction in vehicle-miles-travelled due to compact urban development (Ewing, Bartholomew et al. 2008). In the Indian city of Surat, estimates for annual carbon emissions resulting from a projected tenfold increase in the number of trips varies according to the mode choice and trip length - from 1.9 up to 9.5 million tonnes of CO
2. For Mumbai, the same study
suggests a range of 10.3 to 49 million tonnes (Rayle and Pai 2010).
ACCESSIBILITY IN CITIES TRANSPORT AND URBAN FORM WWW.NEWCLIMATEECONOMY.NET 9
Source: LSE Cities 2014 based on STF 2014 Source: Kenworthy and Laube 2001
Cities
Share (%) of public transport, walking and cycling
CO2 emissions
(kg per capita per year)
Hong Kong
Tokyo
Berlin
Paris
London
Madrid
Montreal
Houston
84%
68%
61%
54%
50%
49%
26%
5%
378kg
818kg
774kg
950kg
1,050kg
1,050kg
1,930kg
5,690kg
Table 1Share of green transport modes and carbon emissions per capita per cities
Figure 4Emissions per passenger km by urban transport mode
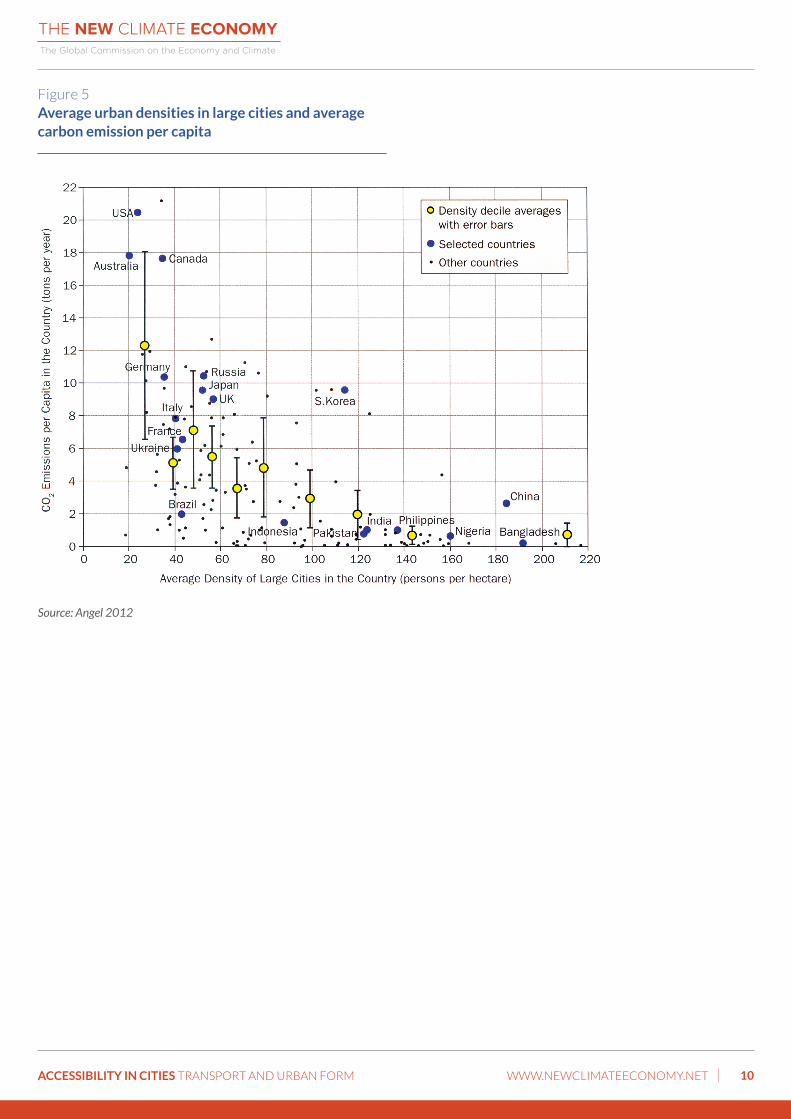
The positive correlation between energy or carbon efficiency and urban density can also be observed outside the transport sector and, together with levels of affluence, can impact on variations in carbon emissions at the national level (Figure 5). Compact and taller building types can improve heat energy efficiency at the neighbourhood level by a factor of six compared to detached houses (Rode et al 2014). According to the Residential Energy Consumption Survey (RECS) in the US, households in suburban areas use more energy on average both in total (22.5 per cent) and per capita (12.7 per cent) compared to those in cities (Estiri 2012), which translates to 36 per cent higher electricity, 19.5 higher natural gas and 29 per cent higher consumption per household in suburban areas (EIA 2001).
These patterns also indicate similar effects of density at different scale, whether at the level of the entire city or at the intra-urban level of individual neighbourhoods. A study on residential greenhouse gas (GHG) emissions and the impact of urban form in Toronto shows notable variations in total car- and building-related emissions between census tracts, varying between 3.1 and 13.1 tonnes of CO
2 equivalents per year. Comparing all tracts, the ten with the highest GHG emissions are located within
the lower-density suburbs, where these high emissions were directly linked with private car use (VandeWeghe and Kennedy 2007). Another study identifies a 2 to 2.5 fold difference in GHG and energy intensity when comparing high-density urban core development (lower intensity) with low-density suburban development (Norman, MacLean et al. 2006). GHG emissions related to car use in London’s peri-urban7 area are more than double compared to those in the core urban area (1.14 tonnes of CO
2
compared to 0.51 tonne per capita of CO2), whereas in New York they are four times higher in the peri-urban area compared to
the core urban area (3.37 tonnes of CO2 per capita compared to 0.84 tonnes of CO
2 per capita) (Focas 2014). A study of 11,000
households in Germany provides evidence that 50 per cent of the total emissions from private transport and building operations can be attributed to urban and residential design choices, with density and physical concentration being key parameters contributing to greater carbon and fuel efficiency (Schubert, Wolbring et al. 2013).
ACCESSIBILITY IN CITIES TRANSPORT AND URBAN FORM WWW.NEWCLIMATEECONOMY.NET 10
Figure 5Average urban densities in large cities and average carbon emission per capita
Source: Angel 2012
ACCESSIBILITY IN CITIES TRANSPORT AND URBAN FORM WWW.NEWCLIMATEECONOMY.NET 11
3 ASSESSMENT
This section presents an overview of the economic and social outcomes generated by the different transport urban-form configurations introduced above. The first sub-section will consider the direct economic impacts of different approaches to urban accessibility on urban infrastructure and operational costs, and on transport and associated industries. The second sub-section discusses the implications of different accessibility pathways on broader societal outcomes, including social equity and public health.
3.1 Infrastructure and operational costs
Urban accessibility pathways based on compact and public transport-oriented urban development deliver tangible direct economic benefits compared to sprawling automobile-dependent accessibility models. Developing at higher densities uses land more efficiently and capitalizes on economies of scale to reduce operational costs per unit of land.
The rapid urbanisation experienced in recent decades, particularly in the developing world, has placed a huge burden on public administrations to finance and build urban infrastructure including roads, transit systems, and utilities such as water, sewerage and electricity. The OECD has estimated that total global infrastructure investment needs (including reconstruction, upgrade and maintenance costs) could reach US$120 trillion by 2050, which translates to an average of US$3 trillion annually (OECD 2013b). Under a BAU scenario, India’s urban growth alone is projected to require almost 600 billion USD of investment by 2030, including 2.5 billion square metres of roads and 7,400 km of metros and subways – 20 times the capacity added in the past decade (MGI 2010). In China, McKinsey has similarly estimated that BAU urbanisation would require the construction of 5 billion square metres of roads by 2025 (MGI 2009).
While these estimates imply a massive (and growing) global infrastructure investment deficit (Airoldi, Chua et al. 2013), they also do not consider alternative, more cost-effective forms of urban development (Floater, Rode et al. 2014b) which actively prioritise compact urban growth, affordable mass transit and high levels of non-motorised transport use. Existing evidence suggests that key urban infrastructure (particularly linear and networked infrastructures such as streets, railways, water and sewage systems and other utilities) comes at considerably lower cost per unit at higher levels of urban density (Carruthers and Ulfarsson 2003).
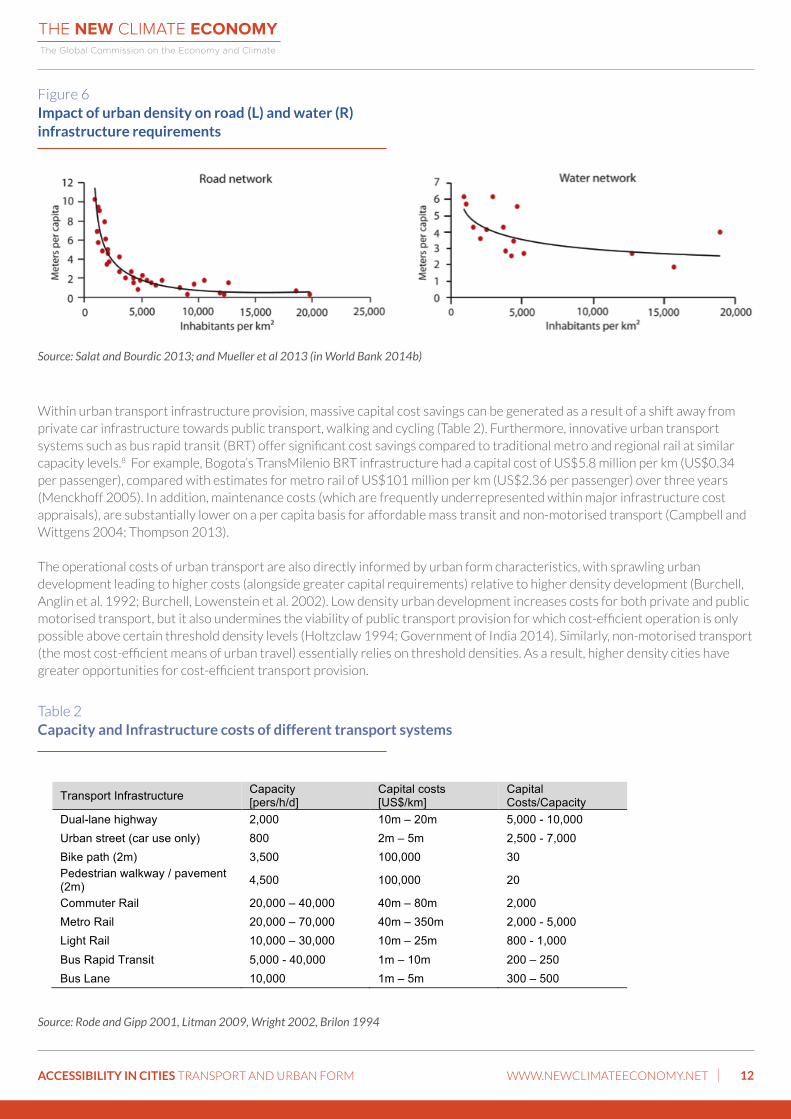
For example, the World Bank suggests that more compact city development in China could save up to US$1.4 trillion in infrastructure spending, equivalent to 15 percent of the country’s 2013 GDP (World Bank 2014b). In the case of developed countries such as the United States, direct cost savings for building road and utility infrastructure in smart growth developments relative to dispersed, car-dependent developments are estimated at between US$ 5,000 and US$75,000 per household unit (Litman 2014b). For the United States as a whole, smart growth was estimated to deliver a 9 per cent reduction in local road length and nearly 12 per cent reduction in road costs (equal to total savings of US$110 billion) as compared to sprawl (Burchell and Mukherji 2003). Recent analysis for Calgary (IBI Group 2009) estimates total cost savings of 33 per cent for denser development compared to a dispersed development scenario. Similarly, a recent study of Tianjin concluded that infrastructure cost savings as a result of compact and densely clustered urban development could reach 55 per cent compared with a dispersed scenario (Webster, Bertaud et al. 2010). Figure 6 illustrates the negative correlation between various infrastructures and urban density.
ACCESSIBILITY IN CITIES TRANSPORT AND URBAN FORM WWW.NEWCLIMATEECONOMY.NET 12
Source: Salat and Bourdic 2013; and Mueller et al 2013 (in World Bank 2014b)
Within urban transport infrastructure provision, massive capital cost savings can be generated as a result of a shift away from private car infrastructure towards public transport, walking and cycling (Table 2). Furthermore, innovative urban transport systems such as bus rapid transit (BRT) offer significant cost savings compared to traditional metro and regional rail at similar capacity levels.8 For example, Bogota’s TransMilenio BRT infrastructure had a capital cost of US$5.8 million per km (US$0.34 per passenger), compared with estimates for metro rail of US$101 million per km (US$2.36 per passenger) over three years (Menckhoff 2005). In addition, maintenance costs (which are frequently underrepresented within major infrastructure cost appraisals), are substantially lower on a per capita basis for affordable mass transit and non-motorised transport (Campbell and Wittgens 2004; Thompson 2013).
The operational costs of urban transport are also directly informed by urban form characteristics, with sprawling urban development leading to higher costs (alongside greater capital requirements) relative to higher density development (Burchell, Anglin et al. 1992; Burchell, Lowenstein et al. 2002). Low density urban development increases costs for both private and public motorised transport, but it also undermines the viability of public transport provision for which cost-efficient operation is only possible above certain threshold density levels (Holtzclaw 1994; Government of India 2014). Similarly, non-motorised transport (the most cost-efficient means of urban travel) essentially relies on threshold densities. As a result, higher density cities have greater opportunities for cost-efficient transport provision.
Table 2 Capacity and Infrastructure costs of different transport systems
Transport Infrastructure Capacity [pers/h/d]
Capital costs [US$/km]
Capital Costs/Capacity
Dual-lane highway 2,000 10m – 20m 5,000 - 10,000 Urban street (car use only) 800 2m – 5m 2,500 - 7,000 Bike path (2m) 3,500 100,000 30 Pedestrian walkway / pavement (2m) 4,500 100,000 20
Commuter Rail 20,000 – 40,000 40m – 80m 2,000 Metro Rail 20,000 – 70,000 40m – 350m 2,000 - 5,000 Light Rail 10,000 – 30,000 10m – 25m 800 - 1,000 Bus Rapid Transit 5,000 - 40,000 1m – 10m 200 – 250 Bus Lane 10,000 1m – 5m 300 – 500
Source: Rode and Gipp 2001, Litman 2009, Wright 2002, Brilon 1994
Figure 6Impact of urban density on road (L) and water (R) infrastructure requirements
ACCESSIBILITY IN CITIES TRANSPORT AND URBAN FORM WWW.NEWCLIMATEECONOMY.NET 13
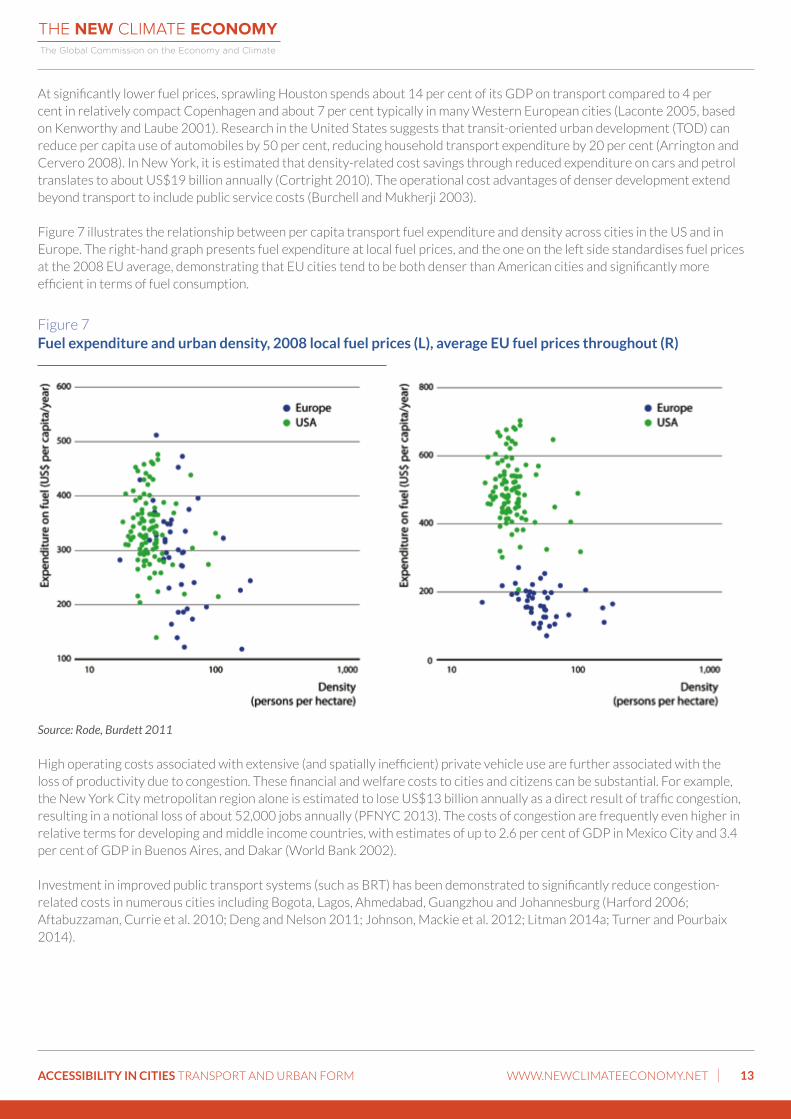
At significantly lower fuel prices, sprawling Houston spends about 14 per cent of its GDP on transport compared to 4 per cent in relatively compact Copenhagen and about 7 per cent typically in many Western European cities (Laconte 2005, based on Kenworthy and Laube 2001). Research in the United States suggests that transit-oriented urban development (TOD) can reduce per capita use of automobiles by 50 per cent, reducing household transport expenditure by 20 per cent (Arrington and Cervero 2008). In New York, it is estimated that density-related cost savings through reduced expenditure on cars and petrol translates to about US$19 billion annually (Cortright 2010). The operational cost advantages of denser development extend beyond transport to include public service costs (Burchell and Mukherji 2003).
Figure 7 illustrates the relationship between per capita transport fuel expenditure and density across cities in the US and in Europe. The right-hand graph presents fuel expenditure at local fuel prices, and the one on the left side standardises fuel prices at the 2008 EU average, demonstrating that EU cities tend to be both denser than American cities and significantly more efficient in terms of fuel consumption.
Figure 7Fuel expenditure and urban density, 2008 local fuel prices (L), average EU fuel prices throughout (R)
Source: Rode, Burdett 2011
High operating costs associated with extensive (and spatially inefficient) private vehicle use are further associated with the loss of productivity due to congestion. These financial and welfare costs to cities and citizens can be substantial. For example, the New York City metropolitan region alone is estimated to lose US$13 billion annually as a direct result of traffic congestion, resulting in a notional loss of about 52,000 jobs annually (PFNYC 2013). The costs of congestion are frequently even higher in relative terms for developing and middle income countries, with estimates of up to 2.6 per cent of GDP in Mexico City and 3.4 per cent of GDP in Buenos Aires, and Dakar (World Bank 2002).
Investment in improved public transport systems (such as BRT) has been demonstrated to significantly reduce congestion-related costs in numerous cities including Bogota, Lagos, Ahmedabad, Guangzhou and Johannesburg (Harford 2006; Aftabuzzaman, Currie et al. 2010; Deng and Nelson 2011; Johnson, Mackie et al. 2012; Litman 2014a; Turner and Pourbaix 2014).
ACCESSIBILITY IN CITIES TRANSPORT AND URBAN FORM WWW.NEWCLIMATEECONOMY.NET 14
3.2 Transport industry
Alongside infrastructure and operational costs, different urban accessibility pathways have important implications for the transport sector and associated industries. Transport-related activities represent a substantial percentage of total employment and value addition across both the developed and developing world. However, comparative studies of the employment intensity and domestic value addition of different modes of transport (and their distribution between the national and city levels) are frequently unavailable, and the macroeconomic effects of a given mode of transport provision differ greatly according to country context.
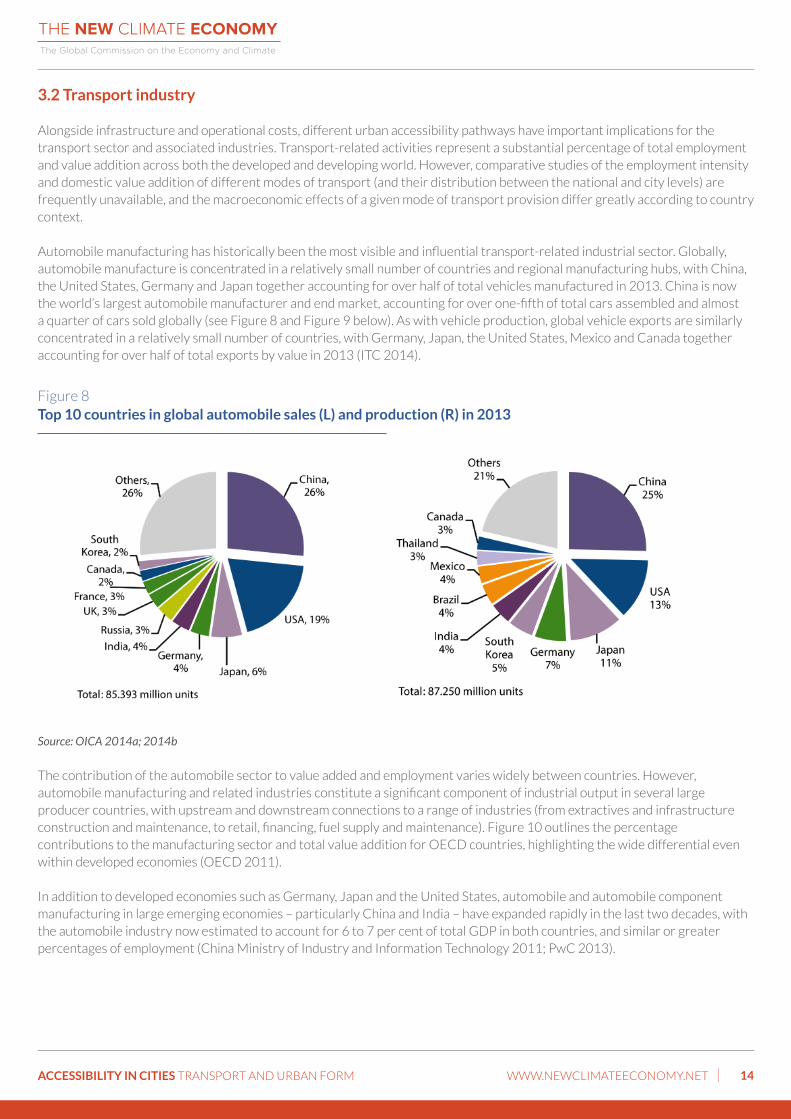
Automobile manufacturing has historically been the most visible and influential transport-related industrial sector. Globally, automobile manufacture is concentrated in a relatively small number of countries and regional manufacturing hubs, with China, the United States, Germany and Japan together accounting for over half of total vehicles manufactured in 2013. China is now the world’s largest automobile manufacturer and end market, accounting for over one-fifth of total cars assembled and almost a quarter of cars sold globally (see Figure 8 and Figure 9 below). As with vehicle production, global vehicle exports are similarly concentrated in a relatively small number of countries, with Germany, Japan, the United States, Mexico and Canada together accounting for over half of total exports by value in 2013 (ITC 2014).
Figure 8Top 10 countries in global automobile sales (L) and production (R) in 2013
Source: OICA 2014a; 2014b
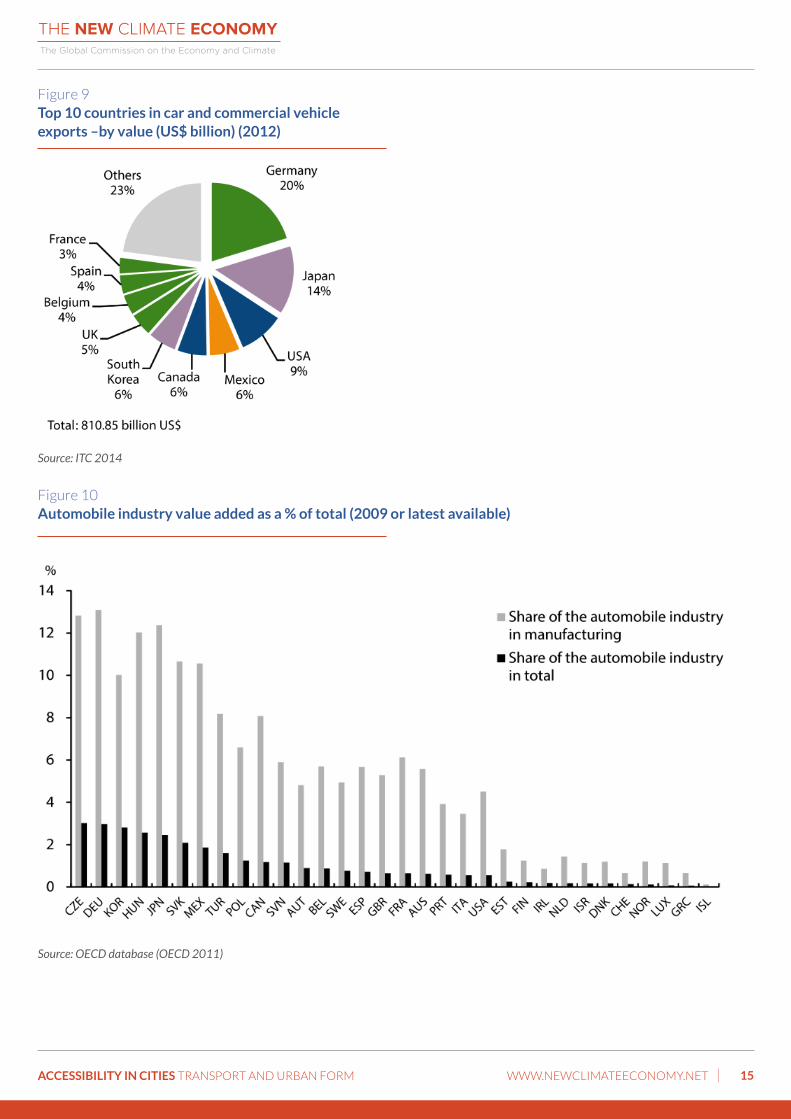
The contribution of the automobile sector to value added and employment varies widely between countries. However, automobile manufacturing and related industries constitute a significant component of industrial output in several large producer countries, with upstream and downstream connections to a range of industries (from extractives and infrastructure construction and maintenance, to retail, financing, fuel supply and maintenance). Figure 10 outlines the percentage contributions to the manufacturing sector and total value addition for OECD countries, highlighting the wide differential even within developed economies (OECD 2011).
In addition to developed economies such as Germany, Japan and the United States, automobile and automobile component manufacturing in large emerging economies – particularly China and India – have expanded rapidly in the last two decades, with the automobile industry now estimated to account for 6 to 7 per cent of total GDP in both countries, and similar or greater percentages of employment (China Ministry of Industry and Information Technology 2011; PwC 2013).
ACCESSIBILITY IN CITIES TRANSPORT AND URBAN FORM WWW.NEWCLIMATEECONOMY.NET 15
Figure 10Automobile industry value added as a % of total (2009 or latest available)
Figure 9Top 10 countries in car and commercial vehicle exports –by value (US$ billion) (2012)
Source: ITC 2014
Source: OECD database (OECD 2011)
ACCESSIBILITY IN CITIES TRANSPORT AND URBAN FORM WWW.NEWCLIMATEECONOMY.NET 16
Despite the status of the automobile industry in some economies, a recent study modelling the macroeconomic effects of policy measures to reduce traffic-related emissions of greenhouse gases, air pollutants and noise in Germany found significant positive net macroeconomic effects from reducing car use across a range of different policy packages. Measures to increase the modal share of walking and cycling were found to expand GDP, total employment and employment in transport by 1.11%, 1.37% and 4.14% respectively by 2030, while measures to promote increased local public transport use generated net increases of 1.56%, 1.76% and 5.29% respectively (Doll and Hartwig 2012).
Similarly, an assessment of the economic impact of increased public transport investment in the United States estimated that US$1 billion dollars of spending on public transportation generated over 36,000 jobs, $3.6 billion dollars of output and $1.8 billion dollars of Gross Domestic Product (GDP) annually in the short term, increasing to $3.5 billion dollars of net annual GDP generated by the 20th year (due to $1.7 billion of additional GDP generated as a result of cost savings) (Reno and Weisbrod 2009). In employment terms, the number of transit agency employees in the United States alone was estimated at 400,000 in 2008 (APTA 2010), and rail manufacturing is estimated to directly employ at least half a million people worldwide (Renner, Gardner et al. 2010).In comparative terms, several studies (Nelson, Anderson et al. 2009; Ekosgen 2010) have confirmed the economic benefits of increased investment in public transport modes relative to private motor vehicles. An analysis of US stimulus spending on transport investments across 50 states calculated that each US$1 billion of investment in public transit generated 4.2 million man hours of employment – 70% more than the 2.4 million man hours generated per US$1 billion investment in highway projects (SGA 2011).
These findings also extend to non-motorised transport. For example, an extensive evaluation of 58 existing transportation projects in the United States, using an input-output model to assess direct, indirect and induced employment, found that cycling projects and pedestrian-only projects delivered an estimated average of 11.4 jobs and 10 state-level jobs per US$1 million invested respectively (against an average of 7.8 jobs per US$1 million for road-only projects) (Garrett-Peltier 2011); and across 54 capital cities in Europe, North America and Central Asia, the WHO has estimated that an increase in cycling modal share to the levels of Copenhagen (26%) would generate approximately 76,000 jobs in direct activities alone (including bicycle repair, sale and design) (WHO 2014b).
3.3 Social equity, community cohesion and poverty reduction
Poverty reduction and the promotion of social equity continue to be key policy challenges in urban areas across the developed and the developing world. Growing income and wealth inequalities, particularly in rapidly urbanising developing countries, are exacerbated by the combined effects of urban sprawl, motorisation, and spatial segregation (OECD 2013b), with almost one quarter of the global urban population living in informal settlements (UN Habitat 2010)
Within both developed and developing countries there is a high level of correlation between the use of different transport modes and social class, with the poorer populations mainly (in the developed world) or almost entirely (in the developing world) reliant on public transport, non-motorised transport and walking. Household travel surveys in lower and middle-income cities including Delhi (Badami 2005) and Mumbai, India (Badami 2005; Baker, Basu et al. 2005), Nairobi, Kenya (Salon and Aligula 2012), Kampala, Uganda and Harare, Zimbabwe (Bryceson, Mbara et al. 2003), Cairo, Egypt and Surabaya, Indonesia (Kalthier 2002) all confirm that poorer groups rely on walking, cycling and (often informal) public transport. Lower-income households are also disproportionately affected by key negative externalities generated by transport, including road accidents, air pollution and project displacement (Vasconcellos 1997; Robinson 2003; Drabo 2013).
Community severance and barriers to sociability provide additional examples of the negative impacts of urban accessibility pathways which incentivise private vehicle use. In relation to transport, Bradbury, Tomlinson and Millington (2007) have identified three common types of ‘community severance’: first, physical barriers such as spatial structures limiting interaction or road traffic causing disruption; second, psychological barriers triggered by perceptions related to traffic noise or road safety; and third, long-term social impacts where communities are disrupted, creating a more sustained form of disconnectedness from certain people and areas close by. A decline in social relationships may not only have negative impacts on physical and mental health (Galea, Ahern et al. 2005; Berke, Gottlieb et al. 2007; Kim 2008; Mair, Roux et al. 2008; Sallis, Saelens et al. 2009; Yen, Michael et al. 2009; Duncan, Piras et al. 2013) but also on economic resilience and productivity (Putnam, Leonardi et al. 1994; Putnam 2004), particularly for the most disadvantaged (Litman 2006; O’Connor and Sauer 2006).
ACCESSIBILITY IN CITIES TRANSPORT AND URBAN FORM WWW.NEWCLIMATEECONOMY.NET 17
Dense, well-managed urban development and the provision of accessible, affordable public transport can therefore have a positive direct effect on the poor and other disadvantaged groups by increasing their ability to access goods, services, and economic opportunities (Murie and Musterd 2004; Banister 2011; Boschmann 2011; Sietchiping, Permezel et al. 2012; Foth, Manaugh et al. 2013), and by providing opportunities for participation in the supply of transport-related infrastructure and services (Santos, Behrendt et al. 2010). A recent comparative study for Mumbai, Istanbul and Sao Paulo emphasises the extent to which socially progressive accessibility in cities depends on compact, socially mixed urban development (Rode, Kandt et al. 2013).9 Despite this, national and city governments across both the developed and developing world currently provide disproportionate levels of investment and institutional support for private vehicle use relative to public and non-motorised transport (the latter two constituting both the predominant means of transport for the poor and the large majority of total journeys made by modal share).
In addition, the construction and maintenance of well-designed transport infrastructure can provide large-scale opportunities for the direct employment of the poor and generate high local and national multipliers, particularly where the use of labour-intensive techniques and locally available materials are prioritised. Public transport (in particular informal and para-transit and formal bus services) and non-motorised passenger and freight transport modes, such as cycle rickshaws and carts, also typically provide greater opportunities for participation in infrastructure and service provision per unit of expenditure than private vehicle use - for example, several million people are estimated to work in the cycle rickshaw industry in South Asia alone (Gallagher 1992; Wipperman and Sowula 2007). Across much of the developing world, however, the widespread promotion and adoption of inappropriately technology- and capital-intensive construction designs and methods (and associated transport modes) frequently limits participation by poorer populations.
3.4 Public health
Different urban accessibility pathways impact significantly across a range of dimensions of public health including road safety, air pollution and activity levels. Injuries and fatalities from road traffic accidents currently represent the single greatest impact on public health from road transport. In 2010, motorised road transport accidents were estimated to account for 1.3 million deaths per year – an increase of 46% over the previous two decades - and a further 78.2 million non-fatal injuries requiring medical care (Bhalla, Shotten et al. 2014). Global projections continue to show an upward trend in total deaths and injuries, with both predicted to double by 2030 (WHO 2013).
Of these, estimates suggest that nearly 50 per cent of fatal road accidents and 75 per cent of accidents leading to injuries take place in urban areas (World Bank 2002). While accident rates in many developed world cities have declined in recent decades, the trend in cities across most of the developing world is upwards, with over 90 per cent of fatal road accidents now estimated to occur in low- and middle-income countries) (WHO 2013). Of these, vulnerable road users (pedestrians, cyclists, as well as motorized two- or three-wheeler users) account for more than half of total fatalities (WHO 2013).Alongside the human cost, the economic impact of traffic accidents is also considerable: using WHO estimates for deaths and injuries, the global cost of traffic accidents for 2010 has been estimated at US$1,855 billion (or approximately 3% of global GDP), with low- and middle-income countries experiencing an even greater relative economic burden (at around 5% of GDP) (IRAP 2013).
In addition to road traffic accidents, air pollution from motorised transport in cities represents a large and increasing public health problem, particularly in the rapidly growing urban agglomerations of emerging economies. Outdoor air pollution, much of it generated by motorised transport (including suspended particulate matter, sulphur oxides, carbon monoxide, nitrogen oxides and ozone), contributes to a range of cardiovascular, pulmonary and respiratory diseases (McCubbin and Delucchi 1999; Medley, Wong et al. 2002; Smith, Jerrett et al. 2010; Zhang, Mauzerall et al. 2010), leading to an estimated 3.2 million deaths a year across the world (OECD 2014).
For 2010, the World Bank has estimated total deaths attributable to transport-related air pollution at a minimum of 184,000 a year, with the number of deaths increasing by over 10% in the previous two decades whereas a similar study by the International Council for Clean Transportation (ICCT) estimates mortality attributable to ambient particulate matter PM2.5 from motor vehicles at 230,000 deaths per year in 2005 (Bhalla, Shotten et al. 2014). Cities are particularly exposed to transport-related emissions because high numbers of vehicles emit at ground level in areas that are highly populated (World Bank 2002). The growth in vehicle-derived urban air pollution in some large emerging economy cities has been particularly rapid: the city of Bangalore, for example, experienced a 34 per cent increase in air pollutants on average between 2002 and 2010 (Alpert,
ACCESSIBILITY IN CITIES TRANSPORT AND URBAN FORM WWW.NEWCLIMATEECONOMY.NET 18
Shvainshtein et al. 2012), of which 41 per cent of particulate matter (PM10) and 67 per cent of NOx emissions were emitted by road vehicles (CPCB 2010). Across the world, only 160 million urban residents live in cities with clean air as defined by WHO standards (Grubler, Bai et al. 2012). As with road accidents, air pollution from transport also exacts a substantial economic cost: the OECD estimates that road transport accounted for approximately half of the total estimated annual cost of outdoor air pollution of US$1.7 trillion in 2010, in addition to representing a substantial percentage of the economic cost in China and India (US$1.4 trillion and US$500 billion respectively) (OECD 2014). A recent estimate suggested that the heavy haze in China in January 2013 alone caused US$3.7 billion in direct losses to society (Mu and Zhang 2013).
Along with road accidents and air pollution, the other key negative health-related outcome of increasing levels of motorisation is a reduction in total activity levels. Physical inactivity and its effect on the prevalence of non-communicable diseases – such as cardiovascular conditions, cancer and diabetes – is recognised as one of the leading causes of mortality worldwide, contributing to an estimated 3.2 million deaths annually (WHO 2014a). Increased use of motorised transport and reduced levels of outdoor activity due to traffic, air pollution and limited access to green spaces constitute a significant contributory factor to decreased activity levels, reducing the use of active transport modes such as walking and cycling and opportunities for physical exercise.
Although the relationship between different urban accessibility pathways and key transport externalities is complex, the negative impacts and high socio-economic costs of urban accessibility pathways that are based on sprawling, car-oriented cities are widely recognised (Newman and Kenworthy 1989; Black 1996; Litman 1999; Prud’homme and Lee 1999; Gilbert, Irwin et al. 2002; Bull, Armstrong et al. 2004; Bradbury, Tomlinson et al. 2007; Dora 2007; Webster, Bertaud et al. 2010; Fallah, Partridge et al. 2011; Litman 2011; Litman 2014b). Sprawling cities require rapid and more individualised modes of transport to maintain or reduce journey times, and statistical evidence suggests a clear correlation between vehicle mileage driven and accident rates (Litman 2012); for example, traffic and pedestrian fatalities in the 101 largest metro regions in the United States are directly related to the level of urban sprawl (Thompson 2013).
Sprawl (and its related effect on road traffic levels) is also an important predictor of air pollutant emissions and concentrations (Bereitschaft and Debbage 2013), with studies in the United States suggesting better air quality levels for mixed-use, compact cities compared to those with lower densities and functional segregation (Borrego, Martins et al. 2006); and elevated levels of key pollutants such as ozone in sprawling (as compared to compact) cities (Dulal, Brodnig et al. 2011). In addition, strong evidence exists regarding the positive impact of more compact, mixed-use cities on physical activity levels (Saelens, Sallis et al. 2003; Heath, Brownson et al. 2006; Sallis, Saelens et al. 2009). Higher density urban neighbourhoods and fine-grain street design are related and important predictors for the use of active travel modes such as walking and cycling (Zhang 2004; Khattak and Rodriguez 2005; Cervero, Sarmiento et al. 2009; Lin and Yang 2009; Lotfi and Koohsari 2011), with a recent study of US cities estimating the elasticity between walking and land-use mix alone at between 0.15 and 0.25 (Ewing and Cervero 2010).
In summary, the negative economic and social outcomes associated with sprawling, car-dependent urban accessibility pathways include adverse effects on health, wellbeing and social inclusion alongside high accessibility costs and congestion - all of which compromise economic competitiveness and produce diseconomies of agglomeration. In contrast, urban accessibility pathways that combine compact urban form with sustainable transport systems are able to reconcile a range of policy objectives, contributing to rising economic productivity, improved health and safety, and increased social equity whilst at the same time reducing carbon emissions.
ACCESSIBILITY IN CITIES TRANSPORT AND URBAN FORM WWW.NEWCLIMATEECONOMY.NET 19
4 PATTERNS, TRENDS AND TIPPING POINTS
Following the discussion of the economic and social effects of different urban accessibility pathways above, this section provides an overview of some of the key contemporary trends in urban accessibility and form. Three central elements - urban form, mobility behaviour and technological change - will be discussed separately, each constituting a major factor in determining the accessibility pathways in individual cities.
4.1 Urban form: ongoing urban sprawl or more compact urban development?
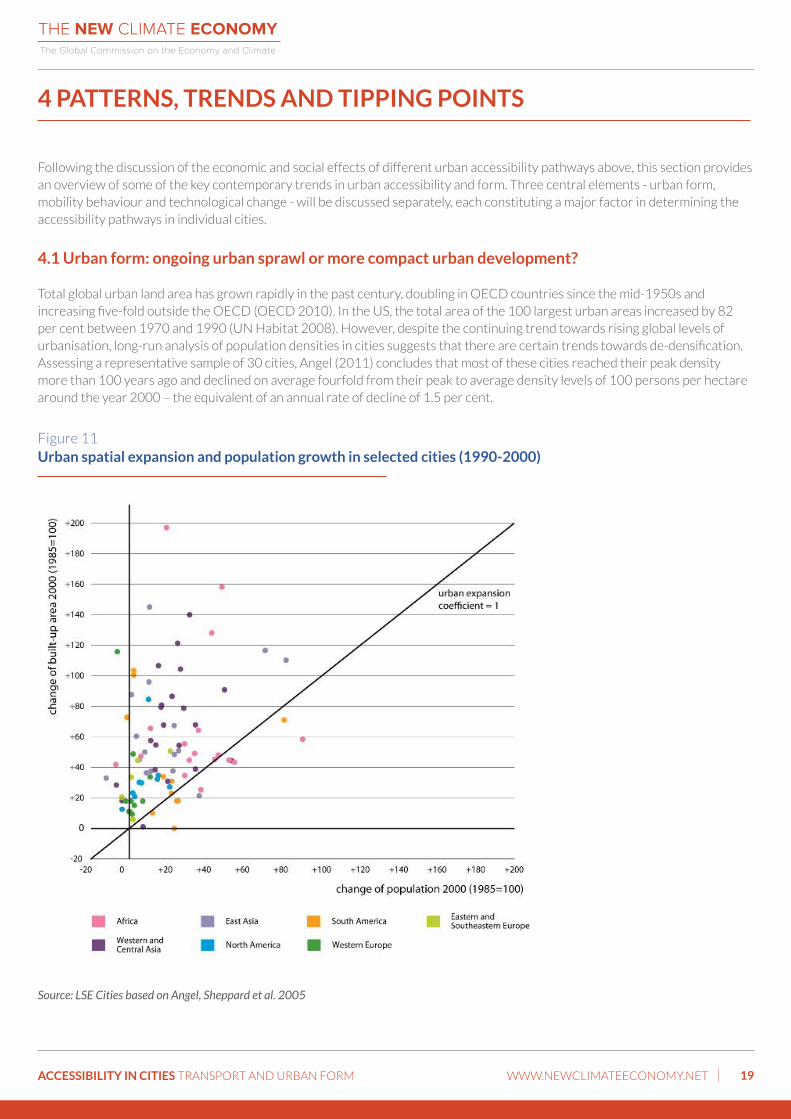
Total global urban land area has grown rapidly in the past century, doubling in OECD countries since the mid-1950s and increasing five-fold outside the OECD (OECD 2010). In the US, the total area of the 100 largest urban areas increased by 82 per cent between 1970 and 1990 (UN Habitat 2008). However, despite the continuing trend towards rising global levels of urbanisation, long-run analysis of population densities in cities suggests that there are certain trends towards de-densification.Assessing a representative sample of 30 cities, Angel (2011) concludes that most of these cities reached their peak density more than 100 years ago and declined on average fourfold from their peak to average density levels of 100 persons per hectare around the year 2000 – the equivalent of an annual rate of decline of 1.5 per cent.
Figure 11 Urban spatial expansion and population growth in selected cities (1990-2000)
Source: LSE Cities based on Angel, Sheppard et al. 2005
ACCESSIBILITY IN CITIES TRANSPORT AND URBAN FORM WWW.NEWCLIMATEECONOMY.NET 20
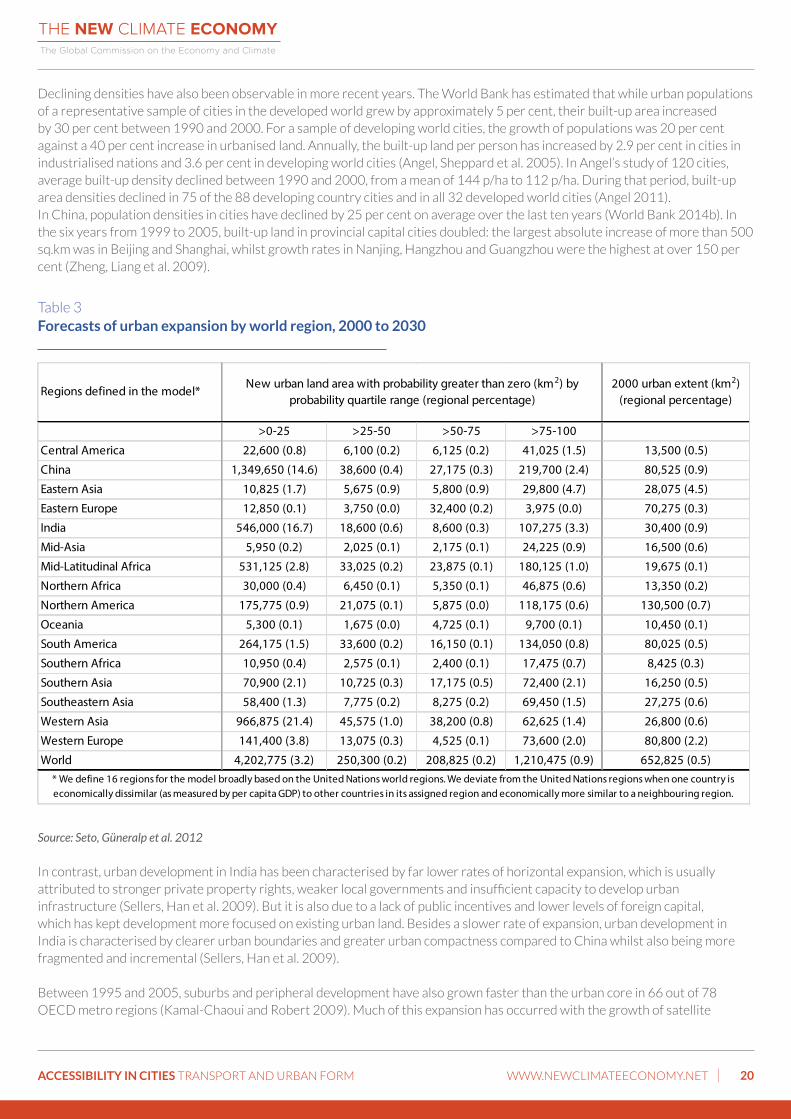
Declining densities have also been observable in more recent years. The World Bank has estimated that while urban populations of a representative sample of cities in the developed world grew by approximately 5 per cent, their built-up area increased by 30 per cent between 1990 and 2000. For a sample of developing world cities, the growth of populations was 20 per cent against a 40 per cent increase in urbanised land. Annually, the built-up land per person has increased by 2.9 per cent in cities in industrialised nations and 3.6 per cent in developing world cities (Angel, Sheppard et al. 2005). In Angel’s study of 120 cities, average built-up density declined between 1990 and 2000, from a mean of 144 p/ha to 112 p/ha. During that period, built-up area densities declined in 75 of the 88 developing country cities and in all 32 developed world cities (Angel 2011). In China, population densities in cities have declined by 25 per cent on average over the last ten years (World Bank 2014b). In the six years from 1999 to 2005, built-up land in provincial capital cities doubled: the largest absolute increase of more than 500 sq.km was in Beijing and Shanghai, whilst growth rates in Nanjing, Hangzhou and Guangzhou were the highest at over 150 per cent (Zheng, Liang et al. 2009).
Table 3Forecasts of urban expansion by world region, 2000 to 2030
Regions defined in the model*2000 urban extent (km2)
(regional percentage)
>0-25 >25-50 >50-75 >75-100
Central America 22,600 (0.8) 6,100 (0.2) 6,125 (0.2) 41,025 (1.5) 13,500 (0.5)
China 1,349,650 (14.6) 38,600 (0.4) 27,175 (0.3) 219,700 (2.4) 80,525 (0.9)
Eastern Asia 10,825 (1.7) 5,675 (0.9) 5,800 (0.9) 29,800 (4.7) 28,075 (4.5)
Eastern Europe 12,850 (0.1) 3,750 (0.0) 32,400 (0.2) 3,975 (0.0) 70,275 (0.3)
India 546,000 (16.7) 18,600 (0.6) 8,600 (0.3) 107,275 (3.3) 30,400 (0.9)
Mid-Asia 5,950 (0.2) 2,025 (0.1) 2,175 (0.1) 24,225 (0.9) 16,500 (0.6)
Mid-Latitudinal Africa 531,125 (2.8) 33,025 (0.2) 23,875 (0.1) 180,125 (1.0) 19,675 (0.1)
Northern Africa 30,000 (0.4) 6,450 (0.1) 5,350 (0.1) 46,875 (0.6) 13,350 (0.2)
Northern America 175,775 (0.9) 21,075 (0.1) 5,875 (0.0) 118,175 (0.6) 130,500 (0.7)
Oceania 5,300 (0.1) 1,675 (0.0) 4,725 (0.1) 9,700 (0.1) 10,450 (0.1)
South America 264,175 (1.5) 33,600 (0.2) 16,150 (0.1) 134,050 (0.8) 80,025 (0.5)
Southern Africa 10,950 (0.4) 2,575 (0.1) 2,400 (0.1) 17,475 (0.7) 8,425 (0.3)
Southern Asia 70,900 (2.1) 10,725 (0.3) 17,175 (0.5) 72,400 (2.1) 16,250 (0.5)
Southeastern Asia 58,400 (1.3) 7,775 (0.2) 8,275 (0.2) 69,450 (1.5) 27,275 (0.6)
Western Asia 966,875 (21.4) 45,575 (1.0) 38,200 (0.8) 62,625 (1.4) 26,800 (0.6)
Western Europe 141,400 (3.8) 13,075 (0.3) 4,525 (0.1) 73,600 (2.0) 80,800 (2.2)
World 4,202,775 (3.2) 250,300 (0.2) 208,825 (0.2) 1,210,475 (0.9) 652,825 (0.5)
New urban land area with probability greater than zero (km2) by probability quartile range (regional percentage)
* We define 16 regions for the model broadly based on the United Nations world regions. We deviate from the United Nations regions when one country is economically dissimilar (as measured by per capita GDP) to other countries in its assigned region and economically more similar to a neighbouring region.
Source: Seto, Güneralp et al. 2012
In contrast, urban development in India has been characterised by far lower rates of horizontal expansion, which is usually attributed to stronger private property rights, weaker local governments and insufficient capacity to develop urban infrastructure (Sellers, Han et al. 2009). But it is also due to a lack of public incentives and lower levels of foreign capital, which has kept development more focused on existing urban land. Besides a slower rate of expansion, urban development in India is characterised by clearer urban boundaries and greater urban compactness compared to China whilst also being more fragmented and incremental (Sellers, Han et al. 2009).
Between 1995 and 2005, suburbs and peripheral development have also grown faster than the urban core in 66 out of 78 OECD metro regions (Kamal-Chaoui and Robert 2009). Much of this expansion has occurred with the growth of satellite
ACCESSIBILITY IN CITIES TRANSPORT AND URBAN FORM WWW.NEWCLIMATEECONOMY.NET 21
or dormitory towns and suburban neighbourhoods, triggered by a preference for suburban lifestyles and a combination of global socio-economic forces, increasing affluence, prioritization of personal space over accessibility, cultural traditions, land speculation and land-use planning (EEA 2006; Chen, Jia et al. 2008; UN Habitat 2010). At the most generic level, it is of course the complex interplay of land, housing and transport costs with the introduction of cheap, mechanised transport that is the most relevant historic factor (Angel 2011).
On the basis of current trends, the world’s urban population could double in little more than 40 years but urban land in less than 20 years (Angel 2011). Some estimates (Table 3) suggest that, under a business as usual urban development scenario, the area of urbanised land will triple between 2000 and 2030 (Seto, Güneralp et al. 2012). The continuation of sprawl at the levels seen in China would require developing an area equivalent to the size of the Netherlands over the next decade and a tripling of urban land in China by 2030 (World Bank 2014b). In some countries, including China, urban sprawl is increasingly compromising food security and stretching municipal budgets (Chen 2007; World Bank 2014b).
Given the significant negative externalities of urban accessibility pathways characterised by sprawling and car-oriented urban agglomerations, many commentators cite major market failures as the cause of sprawl whilst recognising that these are extremely complex and interrelated. Among the most obvious are significant subsidies of related infrastructure and operations, as well as unpriced negative externalities ranging from congestion to health and environmental impacts (Wheaton 1998; Brueckner, Mills et al. 2001; Wu 2006).
Comprehensively planned urban sprawl is most characteristic in China but also common in Korea and Thailand. Here, a formal process of land acquisition or appropriation is complemented by state-led urban infrastructure development and service provision, for which costs are recovered from private real estate development. As a result, municipalities have a strong interest in developing additional land which generates new revenues (World Bank 2014a). Similar dynamics on the basis of property taxes have also incentivised suburbanisation in OECD country cities (Wheaton 1998; Brueckner, Mills et al. 2001; Brueckner and Kim 2003).
Demand-led sprawl is more characteristic of India, Indonesia and Vietnam. Here, private development occurs along transport corridors connecting cities, with the provision of broader urban infrastructure often lacking. As a result a form of ‘self-provisioning’ - often at significant cost - has become a dominant feature. In India, density regulations that keep inner city floor area ratios at extremely low levels is an additional driver for horizontal expansion (World Bank 2013).
At the same time, alternative urban development and accessibility pathways are beginning to emerge and re-densification is recorded in many European and some North American cities. Examples of well-planned compact cities include Copenhagen, Stockholm and Hong Kong, whereas other cities such as London, Brussels, Boston, Tokyo, Hamburg and Nagoya have re-densified and moved back towards more concentrated forms (Floater, Rode et al. 2013; Rode, Floater et al. 2013; Floater, Rode et al. 2014c). Since 2000, population growth in London has been concentrated within a 10 km radius of the city centre; and between 2004 and 2011, 53 per cent of all newly constructed floor area was located within walking distance (0-500 metres) of the nearest rail or underground station (Rode 2014). Even cities in China have already started to increase densities: population density in Beijing’s core has already increased by 50 per cent over the past decade (World Bank 2014b). This ‘return to the city’ has multiple socio-economic reasons, many of which are related to the agglomeration effects discussed above. In addition, changing demographics and family structures, greater participation of women in the labour market and related lifestyle changes have all been identified as significantly reducing the attraction of suburban living (Aguiléra, Wenglenski et al. 2009; Lovejoy, Handy et al. 2010; Rérat 2012).
Over the last decade investment in public transport, including BRT and rail systems, has also increased (IPCC 2014b), indicating a shift away from primarily investing in roads as was common in earlier decades (Owens 1995; Goodwin, Hass-Klau et al. 1998; Vigar 2001; Owens and Cowell 2011). Urban rail networks in China will total 3,000 km in system length in 2015 and double by 2020, representing over US$645 billion of investment (World Bank 2014b). Bogota, Guangzhou and Ahmedabad are examples of cities that have started to partially redirect their accessibility pathways, with the introduction of mass rapid transit systems.
ACCESSIBILITY IN CITIES TRANSPORT AND URBAN FORM WWW.NEWCLIMATEECONOMY.NET 22
4.2 Mobility behaviour: conventional motorisation or new urban mobility?
Cities today show a great variety of travel behaviour patterns – most notably mode choice and trip lengths. This is the case even among cities at similar levels of wealth, indicating that socio-economic factors are only one among several determining factors. This section will look in more detail at past, current and future trends of urban mobility and identifies new trends and emerging tipping points.
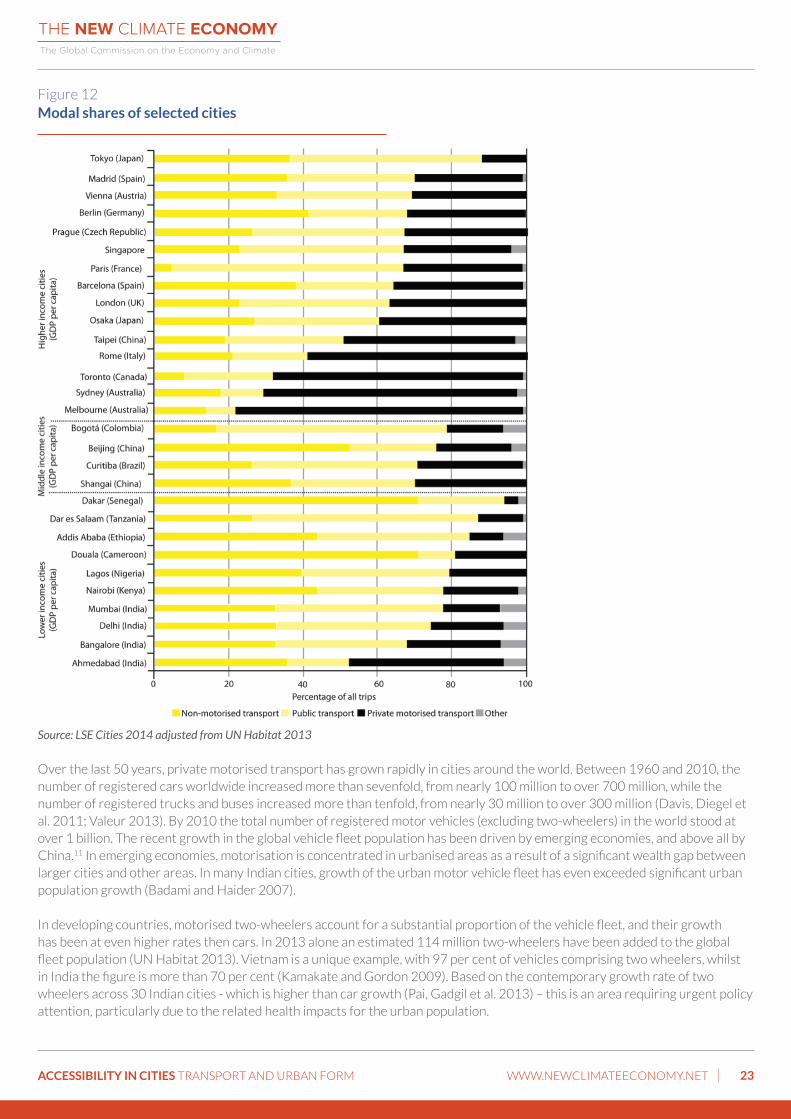
Three main categories of urban travel are usually differentiated: public, non-motorised transport and private motorised transport. Globally, public transport - commonly identified as the back-bone of urban transport - has surprisingly low shares in terms of actual mobility provision in cities. Estimates suggest that the mode share of all urban public transport trips worldwide was only 16% in 2005 (Pourbaix 2012). However, the role of public transport varies significantly between regions and individual cities (Figure 12), with public transport in Asian and some European cities accounting for up to 51 per cent of trips but fewer than 10 per cent of trips in car-orientated cities in the United States or the Gulf Region (UN Habitat 2013).
Non-Motorised Transport (NMT) remains the predominant mode of transportation in most African and Asian Cities, particularly in cities where incomes are low and the level of public transport is poor (UN Habitat 2013). However, as the figure below demonstrates, NMT also plays a major role in cities in developed countries if pedestrian-friendly environments are provided. Similarly, the share of private motorised travel varies enormously, even when comparing cities at similar wealth levels. More than 90 per cent of trips in some North American cities are by private vehicles, compared to less than 15 in Tokyo or Hong Kong. It is important to note that data on walking and cycling is often incomplete and as a result non-motorised travel tends to be under-represented in many cities.
These differences in contemporary urban mobility are largely determined by the urban accessibility pathways cities have chosen to follow, as discussed earlier. At the same time these pathways are not operating in isolation from broader global trends within and across different urban transport modes - most significantly the rapidly accelerating global levels of motorisation in the last five decades and a substantial shift away from non-motorised and public transport.
Over that period, the share of public transport in urban agglomerations has either been constant or declining in almost all cities in the world, despite substantial efforts to support its growth.10 Similarly, the share of NMT has mostly been declining, although walking and cycling still account for more than 70 per cent of trips in some African cities, more than 50 per cent in many Chinese cities and more than 33 per cent in most Indian cities (UN Habitat 2013). More recently cities in developed countries have seen a renaissance of NMT, with London, Berlin and Copenhagen prominent examples of this with NMT shares of around 30 per cent (see e.g. Floater, Rode et al. 2013).
ACCESSIBILITY IN CITIES TRANSPORT AND URBAN FORM WWW.NEWCLIMATEECONOMY.NET 23
Figure 12Modal shares of selected cities
Source: LSE Cities 2014 adjusted from UN Habitat 2013
Over the last 50 years, private motorised transport has grown rapidly in cities around the world. Between 1960 and 2010, the number of registered cars worldwide increased more than sevenfold, from nearly 100 million to over 700 million, while the number of registered trucks and buses increased more than tenfold, from nearly 30 million to over 300 million (Davis, Diegel et al. 2011; Valeur 2013). By 2010 the total number of registered motor vehicles (excluding two-wheelers) in the world stood at over 1 billion. The recent growth in the global vehicle fleet population has been driven by emerging economies, and above all by China.11 In emerging economies, motorisation is concentrated in urbanised areas as a result of a significant wealth gap between larger cities and other areas. In many Indian cities, growth of the urban motor vehicle fleet has even exceeded significant urban population growth (Badami and Haider 2007).
In developing countries, motorised two-wheelers account for a substantial proportion of the vehicle fleet, and their growth has been at even higher rates then cars. In 2013 alone an estimated 114 million two-wheelers have been added to the global fleet population (UN Habitat 2013). Vietnam is a unique example, with 97 per cent of vehicles comprising two wheelers, whilst in India the figure is more than 70 per cent (Kamakate and Gordon 2009). Based on the contemporary growth rate of two wheelers across 30 Indian cities - which is higher than car growth (Pai, Gadgil et al. 2013) – this is an area requiring urgent policy attention, particularly due to the related health impacts for the urban population.
ACCESSIBILITY IN CITIES TRANSPORT AND URBAN FORM WWW.NEWCLIMATEECONOMY.NET 24
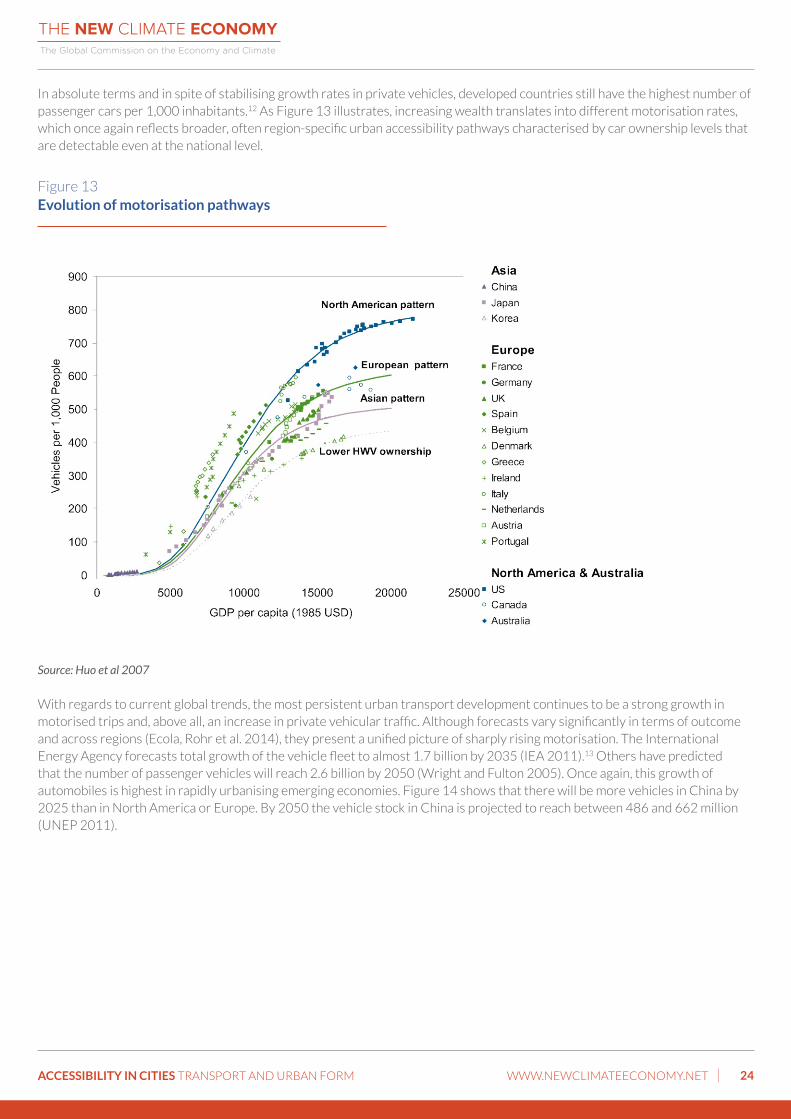
In absolute terms and in spite of stabilising growth rates in private vehicles, developed countries still have the highest number of passenger cars per 1,000 inhabitants.12 As Figure 13 illustrates, increasing wealth translates into different motorisation rates, which once again reflects broader, often region-specific urban accessibility pathways characterised by car ownership levels that are detectable even at the national level.
Figure 13 Evolution of motorisation pathways
Source: Huo et al 2007
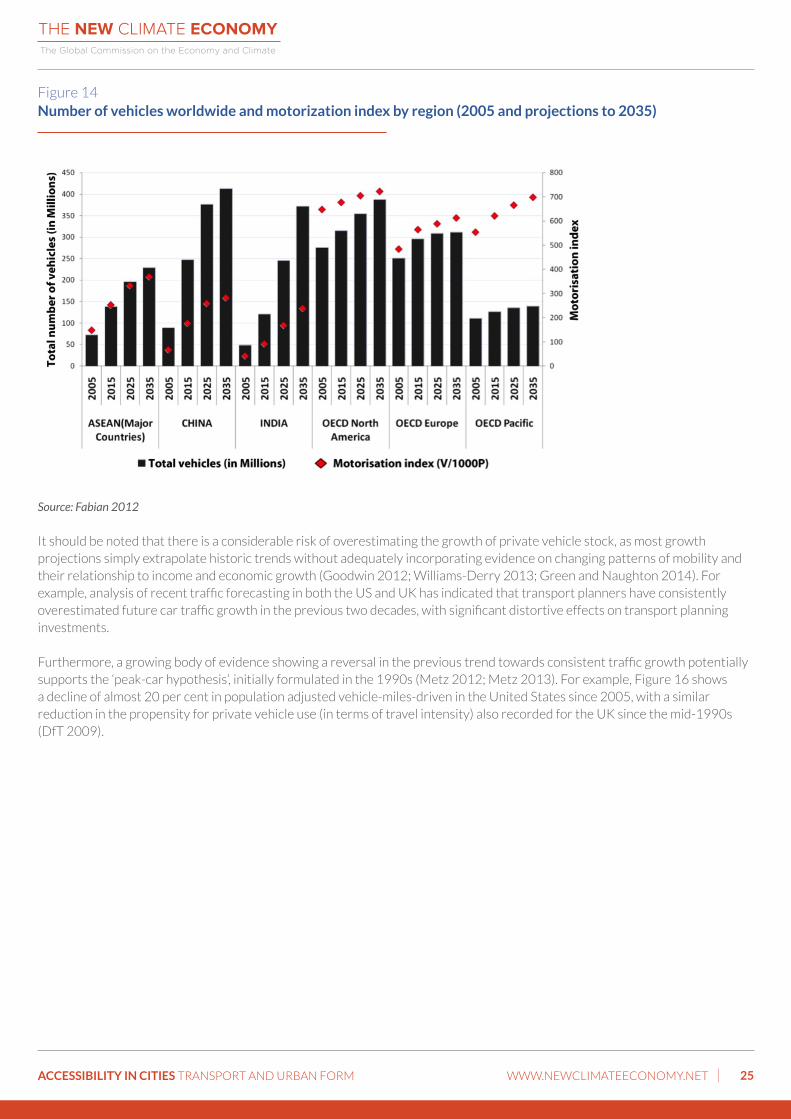
With regards to current global trends, the most persistent urban transport development continues to be a strong growth in motorised trips and, above all, an increase in private vehicular traffic. Although forecasts vary significantly in terms of outcome and across regions (Ecola, Rohr et al. 2014), they present a unified picture of sharply rising motorisation. The International Energy Agency forecasts total growth of the vehicle fleet to almost 1.7 billion by 2035 (IEA 2011).13 Others have predicted that the number of passenger vehicles will reach 2.6 billion by 2050 (Wright and Fulton 2005). Once again, this growth of automobiles is highest in rapidly urbanising emerging economies. Figure 14 shows that there will be more vehicles in China by 2025 than in North America or Europe. By 2050 the vehicle stock in China is projected to reach between 486 and 662 million (UNEP 2011).
ACCESSIBILITY IN CITIES TRANSPORT AND URBAN FORM WWW.NEWCLIMATEECONOMY.NET 25
Figure 14 Number of vehicles worldwide and motorization index by region (2005 and projections to 2035)
Source: Fabian 2012
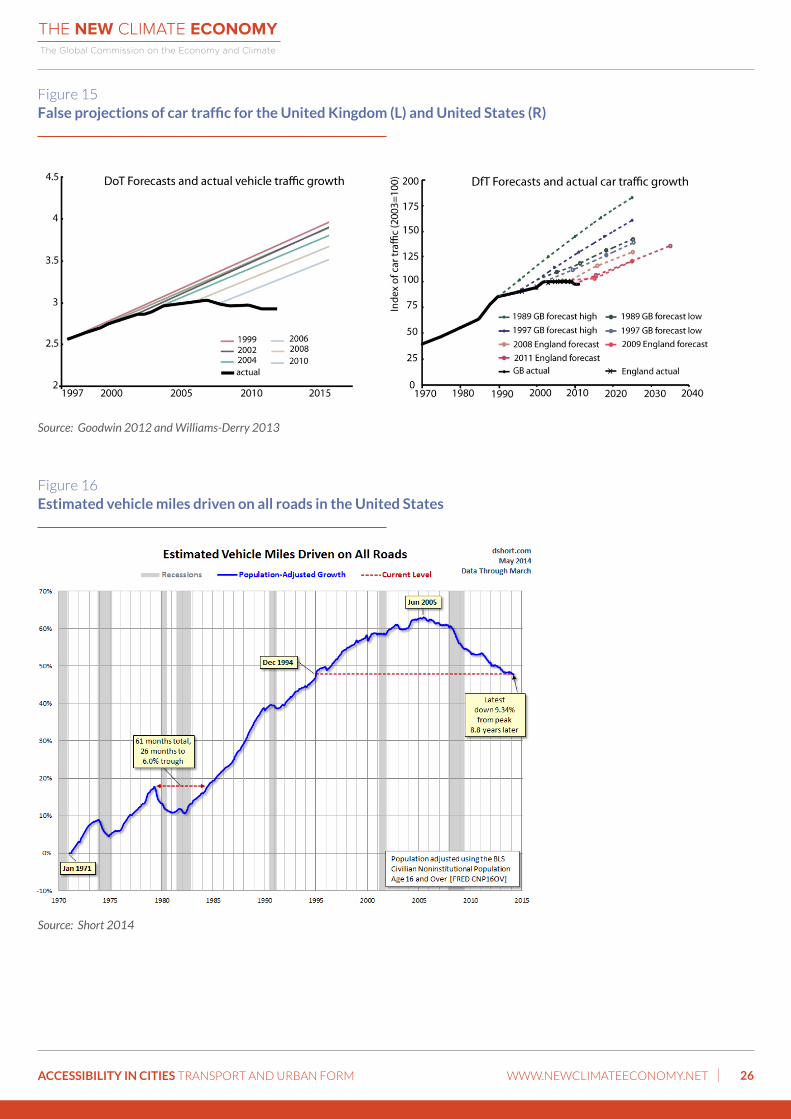
It should be noted that there is a considerable risk of overestimating the growth of private vehicle stock, as most growth projections simply extrapolate historic trends without adequately incorporating evidence on changing patterns of mobility and their relationship to income and economic growth (Goodwin 2012; Williams-Derry 2013; Green and Naughton 2014). For example, analysis of recent traffic forecasting in both the US and UK has indicated that transport planners have consistently overestimated future car traffic growth in the previous two decades, with significant distortive effects on transport planning investments.
Furthermore, a growing body of evidence showing a reversal in the previous trend towards consistent traffic growth potentially supports the ‘peak-car hypothesis’, initially formulated in the 1990s (Metz 2012; Metz 2013). For example, Figure 16 shows a decline of almost 20 per cent in population adjusted vehicle-miles-driven in the United States since 2005, with a similar reduction in the propensity for private vehicle use (in terms of travel intensity) also recorded for the UK since the mid-1990s (DfT 2009).
ACCESSIBILITY IN CITIES TRANSPORT AND URBAN FORM WWW.NEWCLIMATEECONOMY.NET 26
Figure 15 False projections of car traffic for the United Kingdom (L) and United States (R)
Source: Goodwin 2012 and Williams-Derry 2013
Figure 16 Estimated vehicle miles driven on all roads in the United States
Source: Short 2014
ACCESSIBILITY IN CITIES TRANSPORT AND URBAN FORM WWW.NEWCLIMATEECONOMY.NET 27
Despite the global trend towards increasing motorisation, new and alternative patterns of urban form and transport planning have emerged in recent years. In the developed world, several cities have increased their share of public and non-motorised transport and reduced car ownership while creating more attractive and economically prosperous inner cities. For example, between 2000 and 2010 levels of car ownership in New York, London and Berlin has been declining. Non-motorised transport, particularly cycling, is on the rise and public transport passenger numbers have bounced back (Burdett and Rode 2012; Rode, Floater et al. 2013).
The variation of NMT rates and public transport performance in cities with similar preconditions (e.g. cities of similar size within the same country) suggests that these changes may only materialise if policy makers act and facilitate change: London’s congestion charge is a very prominent example of a policy which is embedded in a wider policy framework aimed at stimulating a modal shift towards public transport. Similarly, inner urban Low Emission Zones introduced in the UK, Germany, Italy and the Netherlands are regarded as a successful policy tool to target the worst polluters (Santos et al. 2010). More recently, even the largest growth markets for private vehicles have diverged from their previous patterns of year on year growth. In early 2014, India’s vehicle sales growth rate was negative and sales growth in China decelerated significantly in 2011 and 2012 (OICA 2014b).
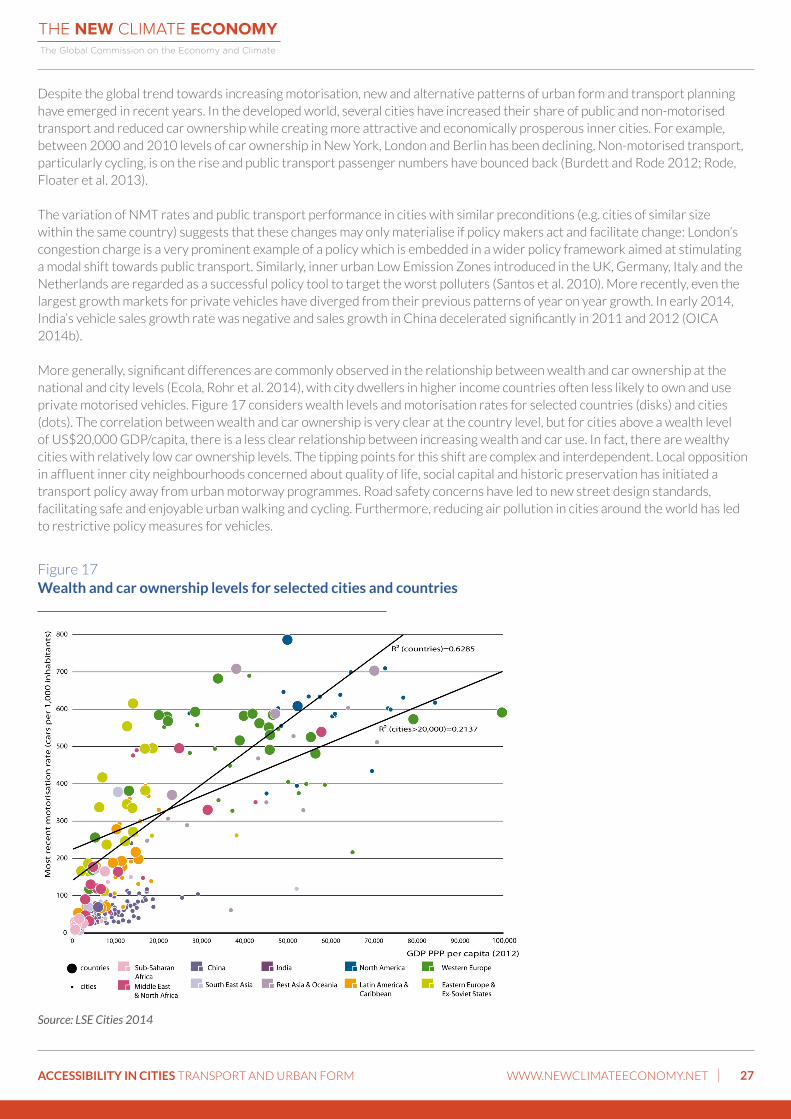
More generally, significant differences are commonly observed in the relationship between wealth and car ownership at the national and city levels (Ecola, Rohr et al. 2014), with city dwellers in higher income countries often less likely to own and use private motorised vehicles. Figure 17 considers wealth levels and motorisation rates for selected countries (disks) and cities (dots). The correlation between wealth and car ownership is very clear at the country level, but for cities above a wealth level of US$20,000 GDP/capita, there is a less clear relationship between increasing wealth and car use. In fact, there are wealthy cities with relatively low car ownership levels. The tipping points for this shift are complex and interdependent. Local opposition in affluent inner city neighbourhoods concerned about quality of life, social capital and historic preservation has initiated a transport policy away from urban motorway programmes. Road safety concerns have led to new street design standards, facilitating safe and enjoyable urban walking and cycling. Furthermore, reducing air pollution in cities around the world has led to restrictive policy measures for vehicles.
Figure 17Wealth and car ownership levels for selected cities and countries
Source: LSE Cities 2014
ACCESSIBILITY IN CITIES TRANSPORT AND URBAN FORM WWW.NEWCLIMATEECONOMY.NET 28
The changing paradigm of personal mobility observed in cities may be due to increasing congestion and the costs of maintaining a car, which is shifting new generations of urban dwellers to alternative transport options such as car sharing or car-on-demand. These alternatives have become more attractive with the introduction of smart phone technologies which have assisted car-free travel. A study of 23,000 respondents in 19 countries found that younger urban dwellers (the so-called Generation Y) are more likely to live in areas where amenities are within walking distance, to relocate to reduce their daily commuting time and also to car share or car-pool based on smart technologies (Deloitte 2014). In the US, 87 per cent of 19 year olds had a driver’s licence in 1983, but only 69 per cent of 19 year olds had a licence in 2010 (Green and Naughton 2014).
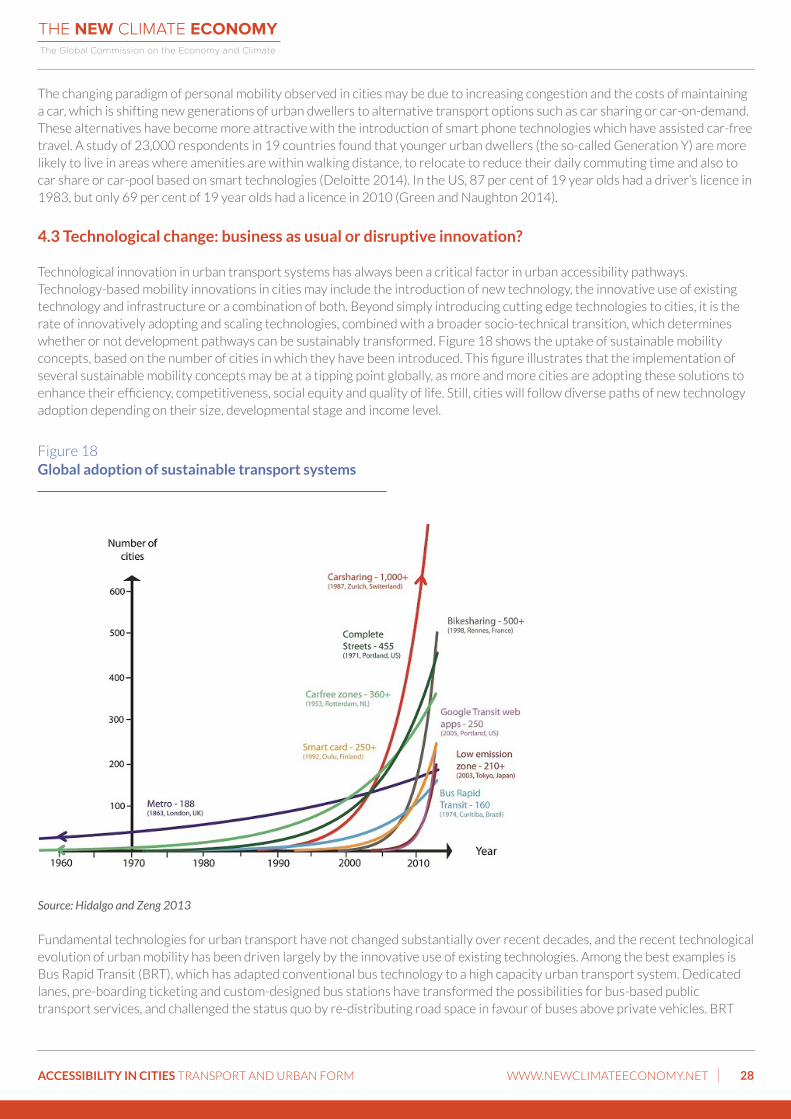
4.3 Technological change: business as usual or disruptive innovation?
Technological innovation in urban transport systems has always been a critical factor in urban accessibility pathways. Technology-based mobility innovations in cities may include the introduction of new technology, the innovative use of existing technology and infrastructure or a combination of both. Beyond simply introducing cutting edge technologies to cities, it is the rate of innovatively adopting and scaling technologies, combined with a broader socio-technical transition, which determines whether or not development pathways can be sustainably transformed. Figure 18 shows the uptake of sustainable mobility concepts, based on the number of cities in which they have been introduced. This figure illustrates that the implementation of several sustainable mobility concepts may be at a tipping point globally, as more and more cities are adopting these solutions to enhance their efficiency, competitiveness, social equity and quality of life. Still, cities will follow diverse paths of new technology adoption depending on their size, developmental stage and income level.
Figure 18Global adoption of sustainable transport systems
Source: Hidalgo and Zeng 2013
Fundamental technologies for urban transport have not changed substantially over recent decades, and the recent technological evolution of urban mobility has been driven largely by the innovative use of existing technologies. Among the best examples is Bus Rapid Transit (BRT), which has adapted conventional bus technology to a high capacity urban transport system. Dedicated lanes, pre-boarding ticketing and custom-designed bus stations have transformed the possibilities for bus-based public transport services, and challenged the status quo by re-distributing road space in favour of buses above private vehicles. BRT
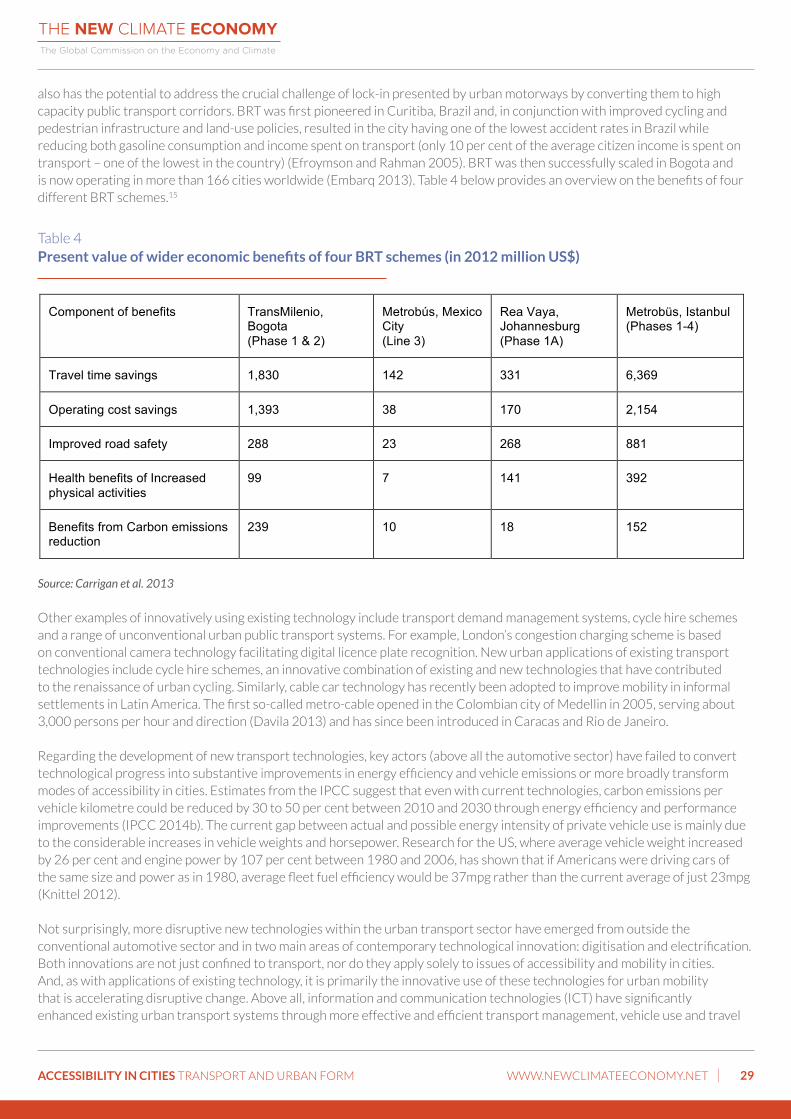
ACCESSIBILITY IN CITIES TRANSPORT AND URBAN FORM WWW.NEWCLIMATEECONOMY.NET 29
also has the potential to address the crucial challenge of lock-in presented by urban motorways by converting them to high capacity public transport corridors. BRT was first pioneered in Curitiba, Brazil and, in conjunction with improved cycling and pedestrian infrastructure and land-use policies, resulted in the city having one of the lowest accident rates in Brazil while reducing both gasoline consumption and income spent on transport (only 10 per cent of the average citizen income is spent on transport – one of the lowest in the country) (Efroymson and Rahman 2005). BRT was then successfully scaled in Bogota and is now operating in more than 166 cities worldwide (Embarq 2013). Table 4 below provides an overview on the benefits of four different BRT schemes.15
Table 4Present value of wider economic benefits of four BRT schemes (in 2012 million US$)
Component of benefits TransMilenio, Bogota (Phase 1 & 2)
Metrobús, Mexico City (Line 3)
Rea Vaya, Johannesburg (Phase 1A)
Metrobüs, Istanbul (Phases 1-4)
Travel time savings 1,830 142 331 6,369
Operating cost savings 1,393 38 170 2,154
Improved road safety 288 23 268 881
Health benefits of Increased physical activities
99 7 141 392
Benefits from Carbon emissions reduction
239 10 18 152
Source: Carrigan et al. 2013
Other examples of innovatively using existing technology include transport demand management systems, cycle hire schemes and a range of unconventional urban public transport systems. For example, London’s congestion charging scheme is based on conventional camera technology facilitating digital licence plate recognition. New urban applications of existing transport technologies include cycle hire schemes, an innovative combination of existing and new technologies that have contributed to the renaissance of urban cycling. Similarly, cable car technology has recently been adopted to improve mobility in informal settlements in Latin America. The first so-called metro-cable opened in the Colombian city of Medellin in 2005, serving about 3,000 persons per hour and direction (Davila 2013) and has since been introduced in Caracas and Rio de Janeiro.
Regarding the development of new transport technologies, key actors (above all the automotive sector) have failed to convert technological progress into substantive improvements in energy efficiency and vehicle emissions or more broadly transform modes of accessibility in cities. Estimates from the IPCC suggest that even with current technologies, carbon emissions per vehicle kilometre could be reduced by 30 to 50 per cent between 2010 and 2030 through energy efficiency and performance improvements (IPCC 2014b). The current gap between actual and possible energy intensity of private vehicle use is mainly due to the considerable increases in vehicle weights and horsepower. Research for the US, where average vehicle weight increased by 26 per cent and engine power by 107 per cent between 1980 and 2006, has shown that if Americans were driving cars of the same size and power as in 1980, average fleet fuel efficiency would be 37mpg rather than the current average of just 23mpg (Knittel 2012).
Not surprisingly, more disruptive new technologies within the urban transport sector have emerged from outside the conventional automotive sector and in two main areas of contemporary technological innovation: digitisation and electrification. Both innovations are not just confined to transport, nor do they apply solely to issues of accessibility and mobility in cities. And, as with applications of existing technology, it is primarily the innovative use of these technologies for urban mobility that is accelerating disruptive change. Above all, information and communication technologies (ICT) have significantly enhanced existing urban transport systems through more effective and efficient transport management, vehicle use and travel
ACCESSIBILITY IN CITIES TRANSPORT AND URBAN FORM WWW.NEWCLIMATEECONOMY.NET 30
information. In addition, real opportunities for substituting physical travel in cities with digital communication and virtualisation are beginning to emerge (Banister and Hickman 2006; Black and van Geenhuizen 2006; de Graaff and Rietveld 2007; Perego, Perotti et al. 2011; Aguiléra, Guillot et al. 2012; Thomopoulos, Givoni et al. 2014).
Over the last decade ICT has, for example, considerably changed ticketing for public transport with contactless payment through smart cards. 90 per cent of bus passengers and 75 per cent of subway passengers use smart cards to board buses, subways or taxis in Seoul, offering convenience and reduced travel costs (Pucher, Park et al. 2005; Pelletier, Trépanier et al. 2011; Turner and Pourbaix 2014). ICT infrastructure, open and big data further allow for crowd-sourced information to update network maps, offer real time transport information and improve service quality (Xu and Dodds forthcoming). The most important recent enabler for enhancing mobility systems in cities for individual users has been a combination of smart phone technologies and geo-positioning systems. Smart phone penetration has reached 72 per cent in the United States, 71 per cent in China and 49 per cent in Thailand (Phadke 2013). Today, well over 70 per cent of Londoners regularly use smart phone travel applications (Rode, Hoffmann et al. 2014) and more than 40 million travel information requests by smart phones are registered every month in Sydney (Berejiklian 2014).
Equally, digitisation offers major opportunities for shared mobility (Knie 2011). Car and bike sharing schemes, for example, have profited enormously from real time information on vehicle/cycle availability. Effective car sharing has already demonstrated a reduction in car ownership levels (Martin and Shaheen 2011) and potentially even total vehicle kilometres travelled, as users are more open to using public transport when not owning their own vehicle. Globally, 1.8 million users of car sharing schemes were registered in 27 countries across all continents by the end of 2012 (Cohen 2013). Furthermore, ride sharing and taxi services can be significantly enhanced through taxi-related smartphone applications. Service providers such as Hailo, Taxibeat, Taxi for sure and Uber are growing exponentially in cities around the world, with already disruptive effects on conventional taxi services and potentially car use. Uber is currently valued at US$17 billion and has recently raised US$1.2 billion allowing them to further expand their global operations (Saitto and Stone 2014). Similarly, bike sharing programmes assisted by digitisation have proliferated in both developed and developing cities, with 535 schemes operating in 49 countries in 2013 (Larsen 2013). The Bicing cycle scheme in Barcelona, which is financed through parking regulation measures, registered 2 million hires during its first six months of operation, reducing CO
2 emissions in the city by 960 tonnes (Turner and Pourbaix 2014), whilst the largest
schemes, with over 60,000 bicycles each, have been implemented in Hangzhou and Wuhan.
Beyond digitisation, new technology more directly tailored to urban transport focuses mainly on further electrifying urban mobility systems. Unlike the introduction of electric railways, trams and elevators at the turn of the last century, this second wave of electrification is focused primarily on allowing electric vehicles to operate with stored electricity, eliminating the requirement for constant grid connection. High energy conversion rates (around 80 per cent for electric vehicles compared to 25-30 per cent for internal combustion engines (ADB 2014; IPCC 2014b), elimination of local air pollution and the reduction of noise are among the key advantages of further electrifying urban transport.
Storage and charging technologies are therefore the central innovation focus and have led to significant improvement in size, weight, battery capacity and overall cost, with the latter reducing from US$1000/kWh in 2008 to US$400/kWh in 2013 (Heck and Rogers 2014). Consequently, switching propulsion systems of vehicles currently using internal combustion engines (ICE’s) to electric drive has been the main focus, while a more holistic re-design and re-application of urban vehicle use and the decarbonisation of electricity are increasingly important components (Anderson 2009). Today, e-mobility carbon abatement based on renewable or low carbon electricity (less than 200 gCO
2/kWh) costs less than US$200
2010 per tonne of CO
2 and with
further technological advances will get closer to zero or at least below US$1002010
per tonne of CO2 (IPCC 2014b).
While the number of electric vehicles introduced to cities has been slower than initially anticipated, estimates suggest that substantial growth is beginning to emerge, with the 45,000 electric cars sold in 2011 increasing to more than 200,000 cars sold in 2013 (Mock and Yang 2014; ZSW 2014). This exponential growth rate has continued into 2013, with more than 400,000 electric vehicles now registered in cities worldwide (ZSW 2014). Cities such as London, Berlin and Paris already have more than 1,000 vehicles and have invested in extensive public charging infrastructure (in the case of London, more than 700 charging stations). Growth has been particularly rapid in the non-car segment, including pedelecs, three-wheelers, e-bikes and e-scooters. The majority of this growth has occurred in developing countries, with China accounting for 96 per cent of e-bikes currently in use, and the market in India expected to grow 10-fold in the next four years (Grebert 2014).
Several European and North American cities have also combined electric vehicle strategies with car sharing services (Grebert
ACCESSIBILITY IN CITIES TRANSPORT AND URBAN FORM WWW.NEWCLIMATEECONOMY.NET 31
2014). The largest of this kind is Paris’ Autolib’ programme with 3,000 vehicles and 1,200 stations (Huré 2012). In addition, the electrification of public transport is being driven by the increasing adoption of hybrid and electric bus technologies which have been shown to deliver on average a 37 per cent improvement in fuel economy and energy production through regenerative braking systems (Chandler and Walkowicz 2006). Fully electric BRT technologies have been tested since 2010 in Guangzhou and are currently being trialled in Sao Paulo (C40 2014).
In the medium term, the development and introduction of potentially autonomous vehicles opens up the possibility for disruptive change of motorised transport in cities. Autonomous driverless vehicles use vehicle-to-infrastructure and vehicle-to-vehicle technologies which will eventually allow them to be responsive to complex urban environments. Autonomous vehicles can potentially allow for de-privatising vehicles in cities, increasing their utility and offering one-way, door-to-door public transport services not unlike current taxi services. Younger generations appear to be at ease with the potential use of autonomous vehicles (Deloitte 2014), whilst 44 per cent of people surveyed in the US would be willing to travel with driverless cars to reduce congestion (Green and Naughton 2014). A recent modelling scenario has shown that the entire current mobility needs of the city of Singapore could be accommodated through a fleet of shared autonomous vehicles which requires only 1/3 of the current numbers of vehicles in circulation (Spieser, Treleaven et al. 2014). Regardless of the far-reaching technological change that has begun to alter transport systems in cities worldwide, in the foreseeable future it is highly unlikely that technological innovation will fundamentally change the co-dependence of urban form and transport systems and their combined role in providing accessibility in cities.
ACCESSIBILITY IN CITIES TRANSPORT AND URBAN FORM WWW.NEWCLIMATEECONOMY.NET 32
5 ENABLING ACCESSIBILITY THROUGH COMPACT CITIES AND SUSTAINABLE TRANSPORT
As discussed above, promoting efficient urban accessibility pathways based on compact, public transport oriented city form must play a central role in global GHG emission reduction strategies. While city-level policy initiatives are not a substitute for concerted carbon reduction efforts at a national and sectoral level, they can play an important complementary role. For example, evidence suggests that the price elasticity of fuel consumption is low in the absence of viable public transport offers (Avner, Rentschler et al. 2013). Furthermore, policies supporting higher urban densities and congestion charging were found to have lower stabilisation costs compared to carbon taxes and other economy-wide approaches (IPCC 2014a).
Urban accessibility pathways based on compact and public transport oriented cities may involve both the retrofitting and re-densification of established urban cores and the promotion of dense, transit-oriented urban expansion (particularly within already high-density, high-growth cities) (Angel 2011). Within urban transport policy, three key principles are commonly recognised - usually summarised as ‘avoid, shift, improve’ (UNEP 2011; Government of India 2014): first, to reduce the travel intensity in cities through greater physical proximity and co-location of different urban functions; second, to shift from spatially inefficient and energy intensive private motorised modes to public, shared and non-motorised transport; and third, to improve the efficiency (in terms of energy and space consumption) of road-based vehicles.
Above all, to be more effective in the future, urban policies will have to build on the experiences of those cities already registering a shift towards more compact urban development and sustainable transport, and learn from the related tipping points discussed above. In addition, the promotion of these urban accessibility pathways will have to be driven by sound institutional structures and planning processes as presented in the NCE Cities Paper 02 ‘Steering urban growth: governance, policy and finance’ (Floater, Rode et al. 2014a). Section 5 below presents an overview of some of the key barriers and enabling conditions of particular relevance for urban form and transport.
5.1 Barriers
As discussed above, some cities are already working to deliver a paradigm shift in urban transport and accessibility, prompted by socio-demographic shifts, changing public attitudes, and technological innovation. Even pioneering cities, however, continue to face significant barriers to progress, several of which are important to highlight.
First, while the economic, social and climate change case for limiting car dependency and urban sprawl is strong, there exist potential negative trade-offs with respect to industry sectors that are currently highly dependent on the business-as-usual urbanisation model. In particular, business models (and key business actors) in the automotive, construction and real estate sectors have proven resistant to change to date. Secondly, strong consumer preferences relating to car ownership and suburban lifestyles remain, and are often most pronounced in developing cities where car use by higher-income households is driven by status and safety concerns, and a lack of viable alternatives. Third, switching costs in many existing cities are high, particularly in urban areas that have already developed as low-density and car-oriented settlements (which includes most of the wider metropolitan hinterland of even dense and public transport oriented cities).
And fourthly, a range of institutional and process barriers to a paradigmatic shift in urban and transport planning also exist. Policy integration across urban planning, design and transport is frequently compromised by sectoral and disciplinary silos. Fragmented governance and the lack of coordination between national and local policy frameworks for urban form and transport are widespread (Ang and Marchal 2013; IPCC 2014a); and the continued use of narrowly defined cost-benefit analysis (CBA) for transport projects (Odgaard, Kelly et al. 2005; Mackie and Worsley 2013; Thomopoulos and Grant-Muller 2013) often obstructs more effective and well-coordinated transport-related investments.
5.2 Planning and regulation: Shaping cities across temporal and geographic scales
Given the strong interrelationship between urban form and transport, the integration of land-use and transport planning represents a unique policy opportunity. Above all, the provision of strategic infrastructure is one of the most critical public
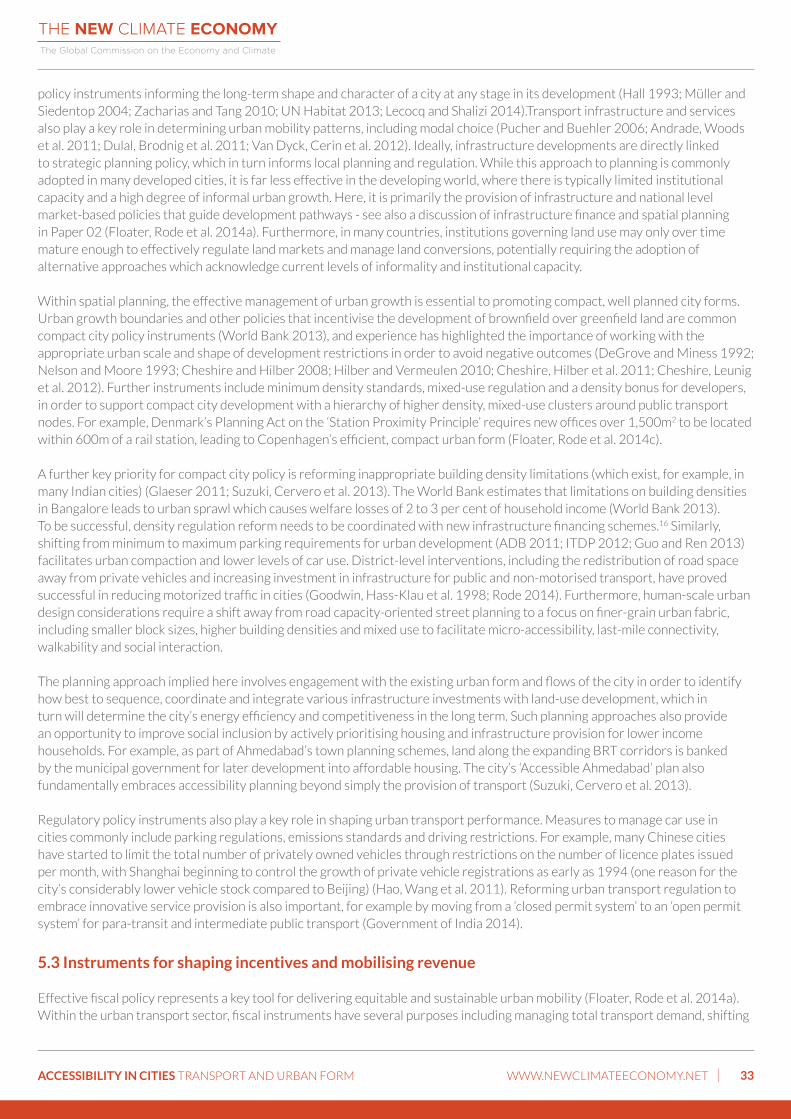
ACCESSIBILITY IN CITIES TRANSPORT AND URBAN FORM WWW.NEWCLIMATEECONOMY.NET 33
policy instruments informing the long-term shape and character of a city at any stage in its development (Hall 1993; Müller and Siedentop 2004; Zacharias and Tang 2010; UN Habitat 2013; Lecocq and Shalizi 2014).Transport infrastructure and services also play a key role in determining urban mobility patterns, including modal choice (Pucher and Buehler 2006; Andrade, Woods et al. 2011; Dulal, Brodnig et al. 2011; Van Dyck, Cerin et al. 2012). Ideally, infrastructure developments are directly linked to strategic planning policy, which in turn informs local planning and regulation. While this approach to planning is commonly adopted in many developed cities, it is far less effective in the developing world, where there is typically limited institutional capacity and a high degree of informal urban growth. Here, it is primarily the provision of infrastructure and national level market-based policies that guide development pathways - see also a discussion of infrastructure finance and spatial planning in Paper 02 (Floater, Rode et al. 2014a). Furthermore, in many countries, institutions governing land use may only over time mature enough to effectively regulate land markets and manage land conversions, potentially requiring the adoption of alternative approaches which acknowledge current levels of informality and institutional capacity.
Within spatial planning, the effective management of urban growth is essential to promoting compact, well planned city forms. Urban growth boundaries and other policies that incentivise the development of brownfield over greenfield land are common compact city policy instruments (World Bank 2013), and experience has highlighted the importance of working with the appropriate urban scale and shape of development restrictions in order to avoid negative outcomes (DeGrove and Miness 1992; Nelson and Moore 1993; Cheshire and Hilber 2008; Hilber and Vermeulen 2010; Cheshire, Hilber et al. 2011; Cheshire, Leunig et al. 2012). Further instruments include minimum density standards, mixed-use regulation and a density bonus for developers, in order to support compact city development with a hierarchy of higher density, mixed-use clusters around public transport nodes. For example, Denmark’s Planning Act on the ‘Station Proximity Principle’ requires new offices over 1,500m2 to be located within 600m of a rail station, leading to Copenhagen’s efficient, compact urban form (Floater, Rode et al. 2014c).
A further key priority for compact city policy is reforming inappropriate building density limitations (which exist, for example, in many Indian cities) (Glaeser 2011; Suzuki, Cervero et al. 2013). The World Bank estimates that limitations on building densities in Bangalore leads to urban sprawl which causes welfare losses of 2 to 3 per cent of household income (World Bank 2013). To be successful, density regulation reform needs to be coordinated with new infrastructure financing schemes.16 Similarly, shifting from minimum to maximum parking requirements for urban development (ADB 2011; ITDP 2012; Guo and Ren 2013) facilitates urban compaction and lower levels of car use. District-level interventions, including the redistribution of road space away from private vehicles and increasing investment in infrastructure for public and non-motorised transport, have proved successful in reducing motorized traffic in cities (Goodwin, Hass-Klau et al. 1998; Rode 2014). Furthermore, human-scale urban design considerations require a shift away from road capacity-oriented street planning to a focus on finer-grain urban fabric, including smaller block sizes, higher building densities and mixed use to facilitate micro-accessibility, last-mile connectivity, walkability and social interaction.
The planning approach implied here involves engagement with the existing urban form and flows of the city in order to identify how best to sequence, coordinate and integrate various infrastructure investments with land-use development, which in turn will determine the city’s energy efficiency and competitiveness in the long term. Such planning approaches also provide an opportunity to improve social inclusion by actively prioritising housing and infrastructure provision for lower income households. For example, as part of Ahmedabad’s town planning schemes, land along the expanding BRT corridors is banked by the municipal government for later development into affordable housing. The city’s ‘Accessible Ahmedabad’ plan also fundamentally embraces accessibility planning beyond simply the provision of transport (Suzuki, Cervero et al. 2013).
Regulatory policy instruments also play a key role in shaping urban transport performance. Measures to manage car use in cities commonly include parking regulations, emissions standards and driving restrictions. For example, many Chinese cities have started to limit the total number of privately owned vehicles through restrictions on the number of licence plates issued per month, with Shanghai beginning to control the growth of private vehicle registrations as early as 1994 (one reason for the city’s considerably lower vehicle stock compared to Beijing) (Hao, Wang et al. 2011). Reforming urban transport regulation to embrace innovative service provision is also important, for example by moving from a ‘closed permit system’ to an ‘open permit system’ for para-transit and intermediate public transport (Government of India 2014).
5.3 Instruments for shaping incentives and mobilising revenue
Effective fiscal policy represents a key tool for delivering equitable and sustainable urban mobility (Floater, Rode et al. 2014a). Within the urban transport sector, fiscal instruments have several purposes including managing total transport demand, shifting
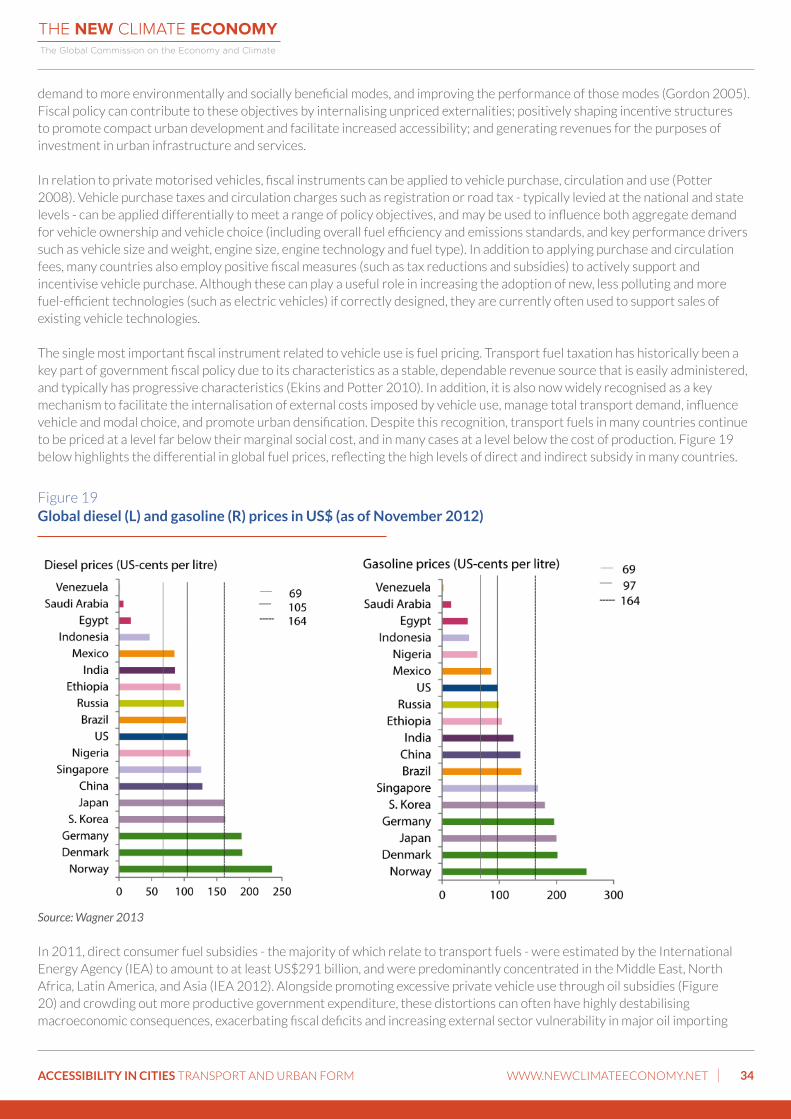
ACCESSIBILITY IN CITIES TRANSPORT AND URBAN FORM WWW.NEWCLIMATEECONOMY.NET 34
demand to more environmentally and socially beneficial modes, and improving the performance of those modes (Gordon 2005). Fiscal policy can contribute to these objectives by internalising unpriced externalities; positively shaping incentive structures to promote compact urban development and facilitate increased accessibility; and generating revenues for the purposes of investment in urban infrastructure and services.
In relation to private motorised vehicles, fiscal instruments can be applied to vehicle purchase, circulation and use (Potter 2008). Vehicle purchase taxes and circulation charges such as registration or road tax - typically levied at the national and state levels - can be applied differentially to meet a range of policy objectives, and may be used to influence both aggregate demand for vehicle ownership and vehicle choice (including overall fuel efficiency and emissions standards, and key performance drivers such as vehicle size and weight, engine size, engine technology and fuel type). In addition to applying purchase and circulation fees, many countries also employ positive fiscal measures (such as tax reductions and subsidies) to actively support and incentivise vehicle purchase. Although these can play a useful role in increasing the adoption of new, less polluting and more fuel-efficient technologies (such as electric vehicles) if correctly designed, they are currently often used to support sales of existing vehicle technologies.
The single most important fiscal instrument related to vehicle use is fuel pricing. Transport fuel taxation has historically been a key part of government fiscal policy due to its characteristics as a stable, dependable revenue source that is easily administered, and typically has progressive characteristics (Ekins and Potter 2010). In addition, it is also now widely recognised as a key mechanism to facilitate the internalisation of external costs imposed by vehicle use, manage total transport demand, influence vehicle and modal choice, and promote urban densification. Despite this recognition, transport fuels in many countries continue to be priced at a level far below their marginal social cost, and in many cases at a level below the cost of production. Figure 19 below highlights the differential in global fuel prices, reflecting the high levels of direct and indirect subsidy in many countries.
Figure 19Global diesel (L) and gasoline (R) prices in US$ (as of November 2012)
Source: Wagner 2013
In 2011, direct consumer fuel subsidies - the majority of which relate to transport fuels - were estimated by the International Energy Agency (IEA) to amount to at least US$291 billion, and were predominantly concentrated in the Middle East, North Africa, Latin America, and Asia (IEA 2012). Alongside promoting excessive private vehicle use through oil subsidies (Figure 20) and crowding out more productive government expenditure, these distortions can often have highly destabilising macroeconomic consequences, exacerbating fiscal deficits and increasing external sector vulnerability in major oil importing
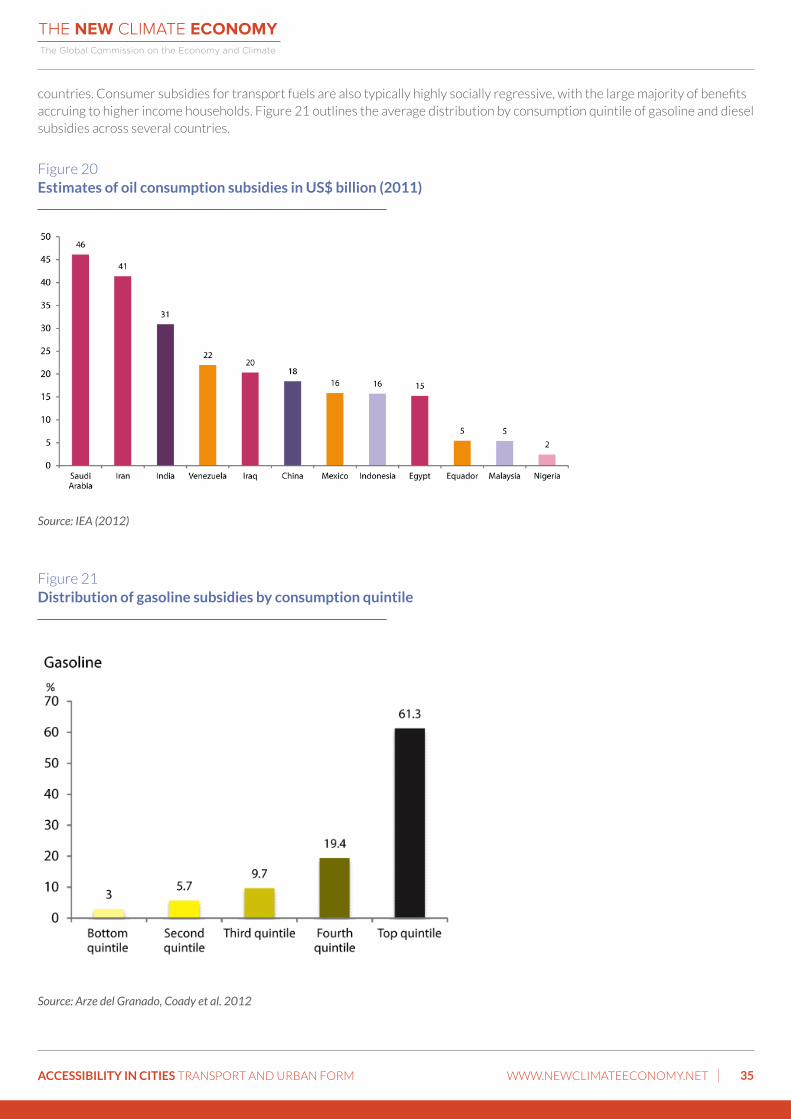
ACCESSIBILITY IN CITIES TRANSPORT AND URBAN FORM WWW.NEWCLIMATEECONOMY.NET 35
countries. Consumer subsidies for transport fuels are also typically highly socially regressive, with the large majority of benefits accruing to higher income households. Figure 21 outlines the average distribution by consumption quintile of gasoline and diesel subsidies across several countries.
Figure 20Estimates of oil consumption subsidies in US$ billion (2011)
Source: IEA (2012)
Figure 21 Distribution of gasoline subsidies by consumption quintile
Source: Arze del Granado, Coady et al. 2012
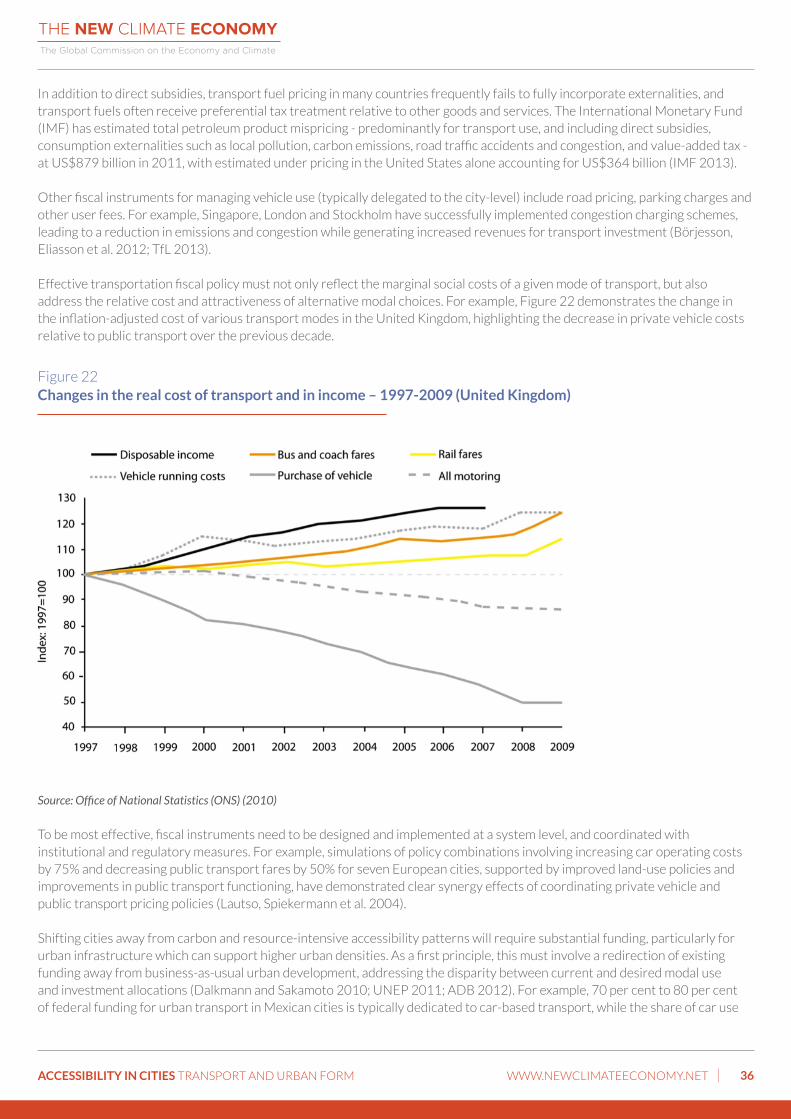
ACCESSIBILITY IN CITIES TRANSPORT AND URBAN FORM WWW.NEWCLIMATEECONOMY.NET 36
In addition to direct subsidies, transport fuel pricing in many countries frequently fails to fully incorporate externalities, and transport fuels often receive preferential tax treatment relative to other goods and services. The International Monetary Fund (IMF) has estimated total petroleum product mispricing - predominantly for transport use, and including direct subsidies, consumption externalities such as local pollution, carbon emissions, road traffic accidents and congestion, and value-added tax - at US$879 billion in 2011, with estimated under pricing in the United States alone accounting for US$364 billion (IMF 2013).
Other fiscal instruments for managing vehicle use (typically delegated to the city-level) include road pricing, parking charges and other user fees. For example, Singapore, London and Stockholm have successfully implemented congestion charging schemes, leading to a reduction in emissions and congestion while generating increased revenues for transport investment (Börjesson, Eliasson et al. 2012; TfL 2013).
Effective transportation fiscal policy must not only reflect the marginal social costs of a given mode of transport, but also address the relative cost and attractiveness of alternative modal choices. For example, Figure 22 demonstrates the change in the inflation-adjusted cost of various transport modes in the United Kingdom, highlighting the decrease in private vehicle costs relative to public transport over the previous decade.
Figure 22 Changes in the real cost of transport and in income – 1997-2009 (United Kingdom)
Source: Office of National Statistics (ONS) (2010)
To be most effective, fiscal instruments need to be designed and implemented at a system level, and coordinated with institutional and regulatory measures. For example, simulations of policy combinations involving increasing car operating costs by 75% and decreasing public transport fares by 50% for seven European cities, supported by improved land-use policies and improvements in public transport functioning, have demonstrated clear synergy effects of coordinating private vehicle and public transport pricing policies (Lautso, Spiekermann et al. 2004).
Shifting cities away from carbon and resource-intensive accessibility patterns will require substantial funding, particularly for urban infrastructure which can support higher urban densities. As a first principle, this must involve a redirection of existing funding away from business-as-usual urban development, addressing the disparity between current and desired modal use and investment allocations (Dalkmann and Sakamoto 2010; UNEP 2011; ADB 2012). For example, 70 per cent to 80 per cent of federal funding for urban transport in Mexican cities is typically dedicated to car-based transport, while the share of car use
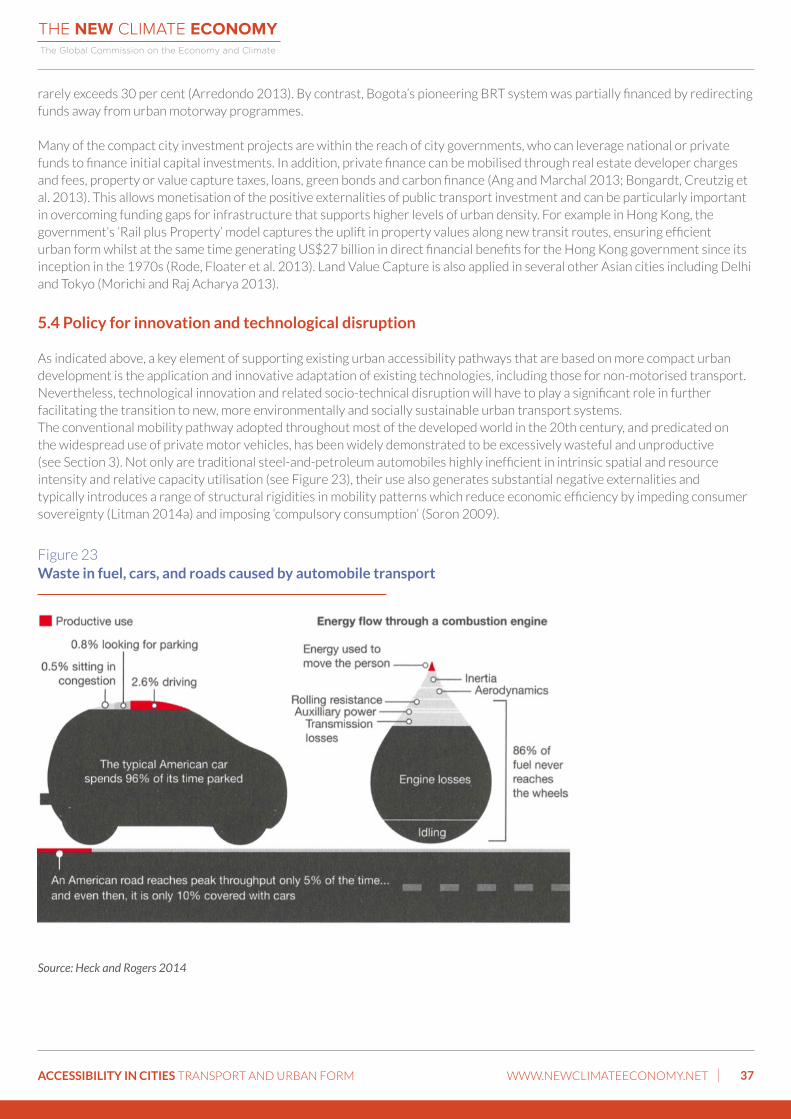
ACCESSIBILITY IN CITIES TRANSPORT AND URBAN FORM WWW.NEWCLIMATEECONOMY.NET 37
rarely exceeds 30 per cent (Arredondo 2013). By contrast, Bogota’s pioneering BRT system was partially financed by redirecting funds away from urban motorway programmes.
Many of the compact city investment projects are within the reach of city governments, who can leverage national or private funds to finance initial capital investments. In addition, private finance can be mobilised through real estate developer charges and fees, property or value capture taxes, loans, green bonds and carbon finance (Ang and Marchal 2013; Bongardt, Creutzig et al. 2013). This allows monetisation of the positive externalities of public transport investment and can be particularly important in overcoming funding gaps for infrastructure that supports higher levels of urban density. For example in Hong Kong, the government’s ‘Rail plus Property’ model captures the uplift in property values along new transit routes, ensuring efficient urban form whilst at the same time generating US$27 billion in direct financial benefits for the Hong Kong government since its inception in the 1970s (Rode, Floater et al. 2013). Land Value Capture is also applied in several other Asian cities including Delhi and Tokyo (Morichi and Raj Acharya 2013).
5.4 Policy for innovation and technological disruption
As indicated above, a key element of supporting existing urban accessibility pathways that are based on more compact urban development is the application and innovative adaptation of existing technologies, including those for non-motorised transport. Nevertheless, technological innovation and related socio-technical disruption will have to play a significant role in further facilitating the transition to new, more environmentally and socially sustainable urban transport systems.The conventional mobility pathway adopted throughout most of the developed world in the 20th century, and predicated on the widespread use of private motor vehicles, has been widely demonstrated to be excessively wasteful and unproductive (see Section 3). Not only are traditional steel-and-petroleum automobiles highly inefficient in intrinsic spatial and resource intensity and relative capacity utilisation (see Figure 23), their use also generates substantial negative externalities and typically introduces a range of structural rigidities in mobility patterns which reduce economic efficiency by impeding consumer sovereignty (Litman 2014a) and imposing ‘compulsory consumption’ (Soron 2009).
Figure 23 Waste in fuel, cars, and roads caused by automobile transport
Source: Heck and Rogers 2014
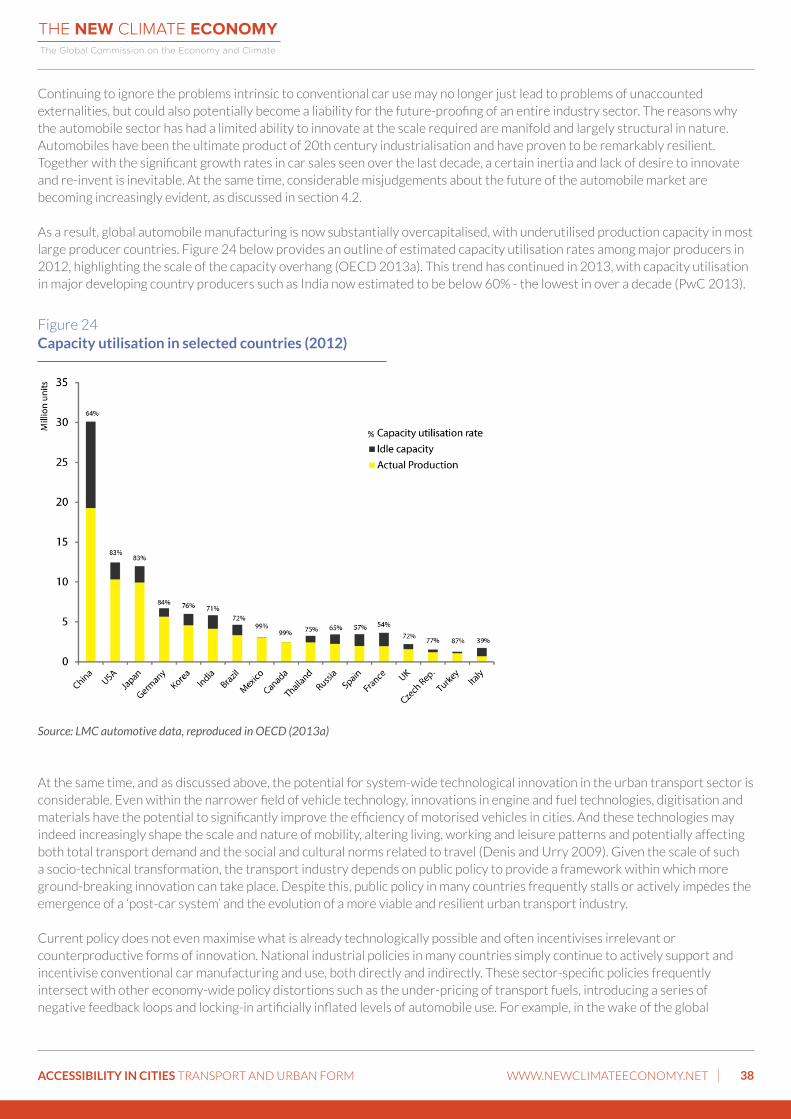
ACCESSIBILITY IN CITIES TRANSPORT AND URBAN FORM WWW.NEWCLIMATEECONOMY.NET 38
Continuing to ignore the problems intrinsic to conventional car use may no longer just lead to problems of unaccounted externalities, but could also potentially become a liability for the future-proofing of an entire industry sector. The reasons why the automobile sector has had a limited ability to innovate at the scale required are manifold and largely structural in nature. Automobiles have been the ultimate product of 20th century industrialisation and have proven to be remarkably resilient. Together with the significant growth rates in car sales seen over the last decade, a certain inertia and lack of desire to innovate and re-invent is inevitable. At the same time, considerable misjudgements about the future of the automobile market are becoming increasingly evident, as discussed in section 4.2.
As a result, global automobile manufacturing is now substantially overcapitalised, with underutilised production capacity in most large producer countries. Figure 24 below provides an outline of estimated capacity utilisation rates among major producers in 2012, highlighting the scale of the capacity overhang (OECD 2013a). This trend has continued in 2013, with capacity utilisation in major developing country producers such as India now estimated to be below 60% - the lowest in over a decade (PwC 2013).
Figure 24Capacity utilisation in selected countries (2012)
Source: LMC automotive data, reproduced in OECD (2013a)
At the same time, and as discussed above, the potential for system-wide technological innovation in the urban transport sector is considerable. Even within the narrower field of vehicle technology, innovations in engine and fuel technologies, digitisation and materials have the potential to significantly improve the efficiency of motorised vehicles in cities. And these technologies may indeed increasingly shape the scale and nature of mobility, altering living, working and leisure patterns and potentially affecting both total transport demand and the social and cultural norms related to travel (Denis and Urry 2009). Given the scale of such a socio-technical transformation, the transport industry depends on public policy to provide a framework within which more ground-breaking innovation can take place. Despite this, public policy in many countries frequently stalls or actively impedes the emergence of a ‘post-car system’ and the evolution of a more viable and resilient urban transport industry.
Current policy does not even maximise what is already technologically possible and often incentivises irrelevant or counterproductive forms of innovation. National industrial policies in many countries simply continue to actively support and incentivise conventional car manufacturing and use, both directly and indirectly. These sector-specific policies frequently intersect with other economy-wide policy distortions such as the under-pricing of transport fuels, introducing a series of negative feedback loops and locking-in artificially inflated levels of automobile use. For example, in the wake of the global
ACCESSIBILITY IN CITIES TRANSPORT AND URBAN FORM WWW.NEWCLIMATEECONOMY.NET 39
financial crisis, several of the largest car-producing countries launched economic stimulus packages (such as scrappage schemes) directly targeted at the automobile sector, with Germany, Japan and the United States alone spending almost US$10 billion subsidising new vehicle purchases (Schweinfurth 2009; OECD 2012b). This support often exists in direct contradiction to competing national and subnational policy goals, including addressing externalities such as carbon emissions (particularly when considering embedded emissions) and congestion, and promoting responsible macroeconomic policy. For example, major car producers such as China and India are now increasingly dependent on oil imports for the majority of their consumption, with transport representing the single largest consuming sector.
Partially as a result of such policy frameworks and despite consistent improvements in the intrinsic performance of established transport technologies such as the internal combustion engine, technological progress has repeatedly failed to feed through to a more substantive improvement in overall vehicle performance for urban mobility and energy efficiency, as discussed in section 4.3. Ultimately this may weaken the long-term competitiveness of established transport industry sectors, artificially extend the contemporary auto-based mobility system and shift future business opportunities to more innovative digital technology companies that will eventually transform the urban transport sector.
Instead, industrial and innovation policy could recognise the inconsistencies above and provide a much stronger and coherent policy context within which urban transport technology can evolve. Above all, political leadership coupled to a long-term political commitment will have to set out the principal policy direction and eliminate policy uncertainty as far as possible in order to unlock greater levels of investment in more ground-breaking innovation. Innovation policy would first have to acknowledge that the status quo car system is part of the problem and that future projections of private vehicle use are often linear assumptions, based on the recent past extrapolated into the future as discussed in section 4.2. On the basis of correcting existing market distortions - particularly the under-pricing of car use - a range of pro-active measures can then be applied.
Overall, the optimum policy set is a blend of pricing and regulatory mechanisms and it needs to be applied at a system level of urban mobility. Furthermore, national and subnational policy need to be congruent and coordinated (Lautso, Spiekermann et al. 2004) in order to capture synergistic effects and include policies for education and professional training as well as direct research and development. Regulatory interventions such as emission or fuel consumption standards have repeatedly proved highly effective in triggering substantial technological innovation (Jaffe, Newell et al. 2002; Gerard and Lave 2005; Farrell and Sperling 2007; West 2010; Saikawa and Urpelainen 2014). In many instances, they have also increased the global competitiveness of vehicle manufacturers that were exposed to more stringent regulation (Saikawa and Urpelainen 2014).18
As with price distortions, regulatory impediments to the adoption of new urban transport technologies and the innovative use of existing technologies are ubiquitous. For example, the regulation of taxis in most cities have created monopolies and today act as a major barrier to the introduction of more effective, efficient and affordable mobility services assisted by digital technology. Electric rickshaws in Indian cities have started to operate in a legal vacuum and would immensely profit from supportive regulation, while alternative dealership models for the purchase of electric vehicles have been challenged by several states and countries. Most important for incentivising innovation, the international patenting system has been repeatedly singled out as a potential barrier to innovation (Scotchmer 2004; Jaffe and Lerner 2011).
The policy context in which cities can play a particularly important role in assisting urban mobility innovation relates to the support and establishment of urban test beds. Besides acting as brokers of relevant public-private partnerships and securing the support of the general public, cities can proactively support the establishment of technological experiments in the field by providing legal and technical assistance. Important areas for related experimentation include shared electric mobility, grid-to-vehicle technology and, in the medium term, the testing of autonomous vehicles. In addition, progressive local transport policy in individual cities has again and again proved to be an important factor in the innovation cycle. For example, local parking and congestion charging policy in London has facilitated the roll-out of electric vehicles ahead of most other European cities.
ACCESSIBILITY IN CITIES TRANSPORT AND URBAN FORM WWW.NEWCLIMATEECONOMY.NET 40
6 CONCLUSION
This paper introduces the concept of ‘urban accessibility pathways’ and argues that policy choices leading towards either more sprawling, car-dependent urban development, or alternatively more compact, public transport-oriented cities, have substantial implications, both for the economic and social performance of cities and for their carbon emissions. The paper began with an overview of the role of spatial structures and urban transport systems in determining the level of accessibility in cities, which in turn facilitates the creation of economies of scale, agglomeration effects and networking advantages. While each city has developed a unique configuration of transport provision and urban form, it is argued that some basic differentiating characteristics between urban accessibility pathways can be identified. These are largely determined by the degree of provision for public and non-motorised transport and the level of urban compactness, both of which are affected by substantial degrees of path dependency.
The paper then discussed the comparative performance of the two principal urban accessibility pathways. It highlighted the more than 10-fold difference in transport-related carbon emissions between the most energy-intensive sprawling cities and energy-efficient compact cities, and the significant difference in embedded emissions and building energy demand. With regards to direct economic impacts, the paper discussed the considerably higher infrastructure, maintenance and operating costs of sprawling cities. It then addressed the implications of the increased adoption of public and non-motorised transport for the transport industry and highlighted some of the key externalities generated by an automobile-centric approach to urban mobility.
In summary, this paper suggests that more compact urban growth, aligned with the increased provision of public transport infrastructure and services and pro-active support for non-motorised transport use, is likely to deliver substantial net economic and social benefits. Despite this, current urban development trajectories across much of the world diverge considerably from more efficient urban accessibility pathways. This paper provides an overview of current global patterns and trends in the physical development of cities and related urban mobility behaviour. Overall, cities continue to sprawl excessively, with some estimates suggesting that total urban land area could triple between 2000 and 2030. Similarly, in many key emerging economies (such as China and India), private motorised vehicle use and modal share is expanding rapidly, with a range of negative economic and social implications. At the same time, however, evidence on tipping points towards more sustainable development trajectories is emerging in cities across different wealth levels. As a result of socio-demographic change, shifting public opinion, strong political leadership and technological innovation, some cities are moving towards a more compact and public-transport oriented urban development model with increasing shares of non-motorised transport.
The last section of this paper then discusses the key policy areas (and related instruments) relevant to enabling spatially- and energy-efficient urban development. Undertaking strategic spatial planning in relation to key infrastructure developments, managing compact urban growth by identifying areas for intensification rather than simply restricting development, and closely integrating the provision of housing with public transport are among the key planning approaches adopted by leading city governments. In addition, the strategic use of incentives and revenue mobilisation instruments is recognised as essential to ensuring the availability of financing for urban infrastructure investment, respecting the ‘polluter pays’ principle and creating positive feedback mechanisms between infrastructure investment, transport modal choice and urban form.
And finally, broader policy frameworks may have to be tested more with regards to their impact on innovation and technological disruption. Here, the paper has identified a substantial number of perverse incentives which act as considerable barriers towards the development of more efficient and effective urban transport. Across all these policy instruments, national and city governments can increasingly learn from existing transformative change in a range of cities and also build on potential tipping points that have emerged in recent years.
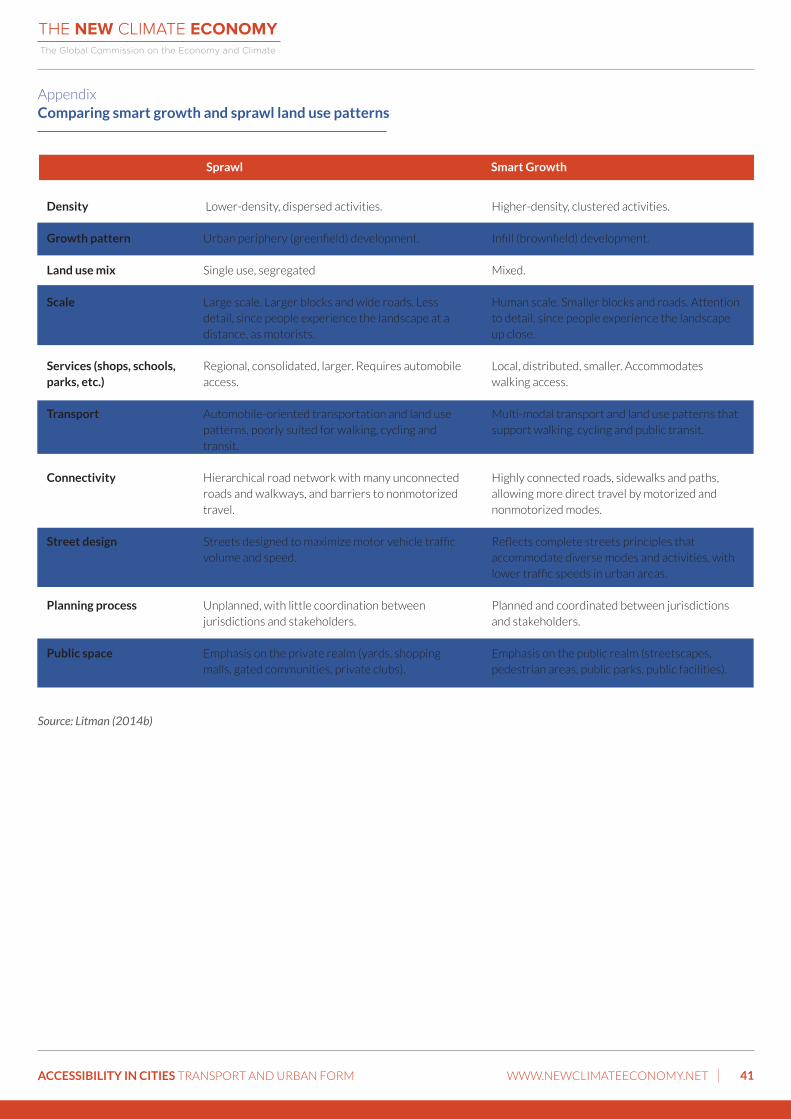
ACCESSIBILITY IN CITIES TRANSPORT AND URBAN FORM WWW.NEWCLIMATEECONOMY.NET 41
Sprawl Smart Growth
Lower-density, dispersed activities.
Urban periphery (greenfield) development.
Single use, segregated
Large scale. Larger blocks and wide roads. Less detail, since people experience the landscape at a distance, as motorists.
Regional, consolidated, larger. Requires automobile access.
Automobile-oriented transportation and land use patterns, poorly suited for walking, cycling and transit.
Hierarchical road network with many unconnected roads and walkways, and barriers to nonmotorized travel.
Streets designed to maximize motor vehicle traffic volume and speed.
Unplanned, with little coordination between jurisdictions and stakeholders.
Emphasis on the private realm (yards, shopping malls, gated communities, private clubs).
Higher-density, clustered activities.
Infill (brownfield) development.
Mixed.
Human scale. Smaller blocks and roads. Attention to detail, since people experience the landscape up close.
Local, distributed, smaller. Accommodates walking access.
Multi-modal transport and land use patterns that support walking, cycling and public transit.
Highly connected roads, sidewalks and paths, allowing more direct travel by motorized and nonmotorized modes.
Reflects complete streets principles that accommodate diverse modes and activities, with lower traffic speeds in urban areas.
Planned and coordinated between jurisdictions and stakeholders.
Emphasis on the public realm (streetscapes, pedestrian areas, public parks, public facilities).
Density
Growth pattern
Land use mix
Scale
Services (shops, schools, parks, etc.)
Transport
Connectivity
Street design
Planning process
Public space
AppendixComparing smart growth and sprawl land use patterns
Source: Litman (2014b)
ACCESSIBILITY IN CITIES TRANSPORT AND URBAN FORM WWW.NEWCLIMATEECONOMY.NET 42
BIBLIOGRAPHY
ADB (2009). Changing Course: A new paradigm for Sustainable Urban Transport. Urban Development Series. Philippines, Asian Development Bank.
ADB (2011). Parking Policy in Asian Cities (final consultant’s report). Manila, Asian Development Bank.
ADB (2012). Green Cities. Mandaluyong, Philippines, Asian Development Bank.
ADB. (2014). “e-trikes - Driving Change.” Retrieved 27th May, 2014, from http://www.adb.org/projects/43207-012/background.
Aftabuzzaman, M., Currie, G.,Sarvi, M. (2010). “Evaluating the Congestion Relief Impacts of Public Transport in Monetary Terms.” Journal of Public Transportation 13(1): 1-24.
Aguiléra, A., Guillot, C.,Rallet, A. (2012). “Mobile ICTs and physical mobility: Review and research agenda.” Transportation Research Part A: Policy and Practice 46(4): 664-672.
Aguiléra, A., Wenglenski, S.,Proulhac, L. (2009). “Employment suburbanisation, reverse commuting and travel behaviour by residents of the central city in the Paris metropolitan area.” Transportation Research Part A: Policy and Practice 43(7): 685-691.
Airoldi, M., Chua, J., Gerbert, P., Justus, J.,Rilo, R. (2013). Bridging the gap: Meeting the infrastructure challenge with Publi-Private Partnerships. Boston, Boston Consulting Group.
Alpert, P., Shvainshtein, O.,Kishcha, P. (2012). “AOD trends over megacities based on space monitoring using MODIS and MISR.” American Journal of Climate Change 1: 117.
An, F., Earley, R.,Green-Weiskel, L. (2011). Global overview on fuel efficiency and motor vehicle emission standards: policy options and perspectives for international cooperation. United Nations Background Paper. New York, UNDESA.
Anderson, R. (2009). Maximizing the potential for metros to reduce energy consumption and deliver low-carbon transportation in cities. Delhi, Community of Metros.
Andrade, K., Woods, L.,Kagaya, S. (2011). Cycling within urban areas: the cases of England and Japan. European Transport Conference 2011.
Ang, G.,Marchal, V. (2013). Mobilising private investment in sustainable transport: The case of land-based passenger transport infrastructure. OECD Environment Working Papers. Paris, OECD Publishing.
Angel, S. (2011). Making Room for a Planet of Cities, Lincoln Institute of Land Policy.
Angel, S. (2012). Planet of cities. Cambridge, MA, Lincoln Institute of Land Policy
Angel, S., Parent, J., Civco, D. L., Blei, A.,Potere, D. (2011). “The dimensions of global urban expansion: Estimates and projections for all countries, 2000–2050.” Progress in Planning 75(2): 53-107.
Angel, S., Sheppard, S., Civco, D. L., Buckley, R., Chabaeva, A., Gitlin, L., Kraley, A., Parent, J.,Perlin, M. (2005). The dynamics of global urban expansion, Transport and Urban Development Department, The World Bank.
APTA (2010). 2010 Public Transportation Fact Book - Appendix A: Historical tables. Washington DC, American Public Transportation Association.
ACCESSIBILITY IN CITIES TRANSPORT AND URBAN FORM WWW.NEWCLIMATEECONOMY.NET 43
Arredondo, J. G. (2013). Invertir para overnos, prioridad inaplazable: Diagnostico de fondos federales para transporte y accesibilidad urbana en Mexico, 2012. Executive summary, ITDP and British Embassy in Mexico.
Arrington, G.,Cervero, R. (2008). TCRP Report 128: Effects of TOD on Housing, Parking, and Travel. Transportation Research Board of the National Academies. Washington, DC. 3.
Arze del Granado, F. J., Coady, D.,Gillingham, R. (2012). “The unequal benefits of fuel subsidies: A review of evidence for developing countries.” World Development 40(11): 2234-2248.
Avner, P., Rentschler, J.,Hallegatte, S. (2013). Carbon price efficiency: lock in and path dependence in urban forms and transport infrastructure. Washington DC, World Bank.
ATM (2013) Observatori de la mobilitat. Barcelona, Area de Barcelona, Autoritat del Transport Metropolita.
Badami, M. G. (2005). “The urban transport challenge in India: Considerations, implications and strategies.” International Development Planning Review 27(2): 169-194.
Badami, M. G.,Haider, M. (2007). “An analysis of public bus transit performance in Indian cities.” Transportation Research Part A: Policy and Practice 41(10): 961-981.
Baker, J. L., Basu, R., Cropper, M., Lall, S.,Takeuchi, A. (2005). Urban poverty and transport: the case of Mumbai. World Bank Policy Research Working Paper, World Bank. 3693.
Banister, D. (2011). “Cities, mobility and climate change.” Journal of Transport Geography 19(6): 1538-1546.
Banister, D.,Hickman, R. (2006). How to design a more sustainable and fairer built environment: transport and communications. IEE Proceedings - Intelligent Transport Systems, IET. 153: 276-291.
Baum-Snow, N. (2007). “Did highways cause suburbanization?” Quarterly Journal of Economics 122(2): 775-805.
Baum-Snow, N., Brandt, L., Henderson, J. V., Turner, M. A.,Zhang, Q. (2012). Roads, railroads and decentralization of chinese cities, Citeseer.
Bereitschaft, B.,Debbage, K. (2013). “Urban Form, Air Pollution, and CO2 Emissions in Large US Metropolitan Areas.” The
Professional Geographer 65(4): 612-635.
Berejiklian, G. (2014). Number of customers using real time transport apps surges. Transport, M. o. Chippendale, NSW.
Berke, E. M., Gottlieb, L. M., Moudon, A. V.,Larson, E. B. (2007). “Protective association between neighborhood walkability and depression in older men.” Journal of the American Geriatrics Society 55(4): 526-533.
Bhalla, K., Shotten, M., Cohen, A., Brauer, M., Shahraz, S., Burnett, R., Leach-Kemon, K., Freedman, G.,Murray, C. J. L. (2014). Transport for health: the global burden of disease from motorized road transport. Global Road Safety Facility. Washington DC, Institute for Health Metrics and Evaluation and World Bank.
Black, W.,van Geenhuizen, M. (2006). “ICT innovation and sustainability of the transport sector.” European Journal of Transport and Infrastructure Research 6(1): 39-60.
Black, W. R. (1996). “Sustainable transportation: a US perspective.” Journal of Transport Geography 4(3): 151-159.
Bongardt, D., Creutzig, F., Hüging, H., Sakamoto, K., Bakker, S., Gota, S.,Böhler-Baedeker, S. (2013). Low-carbon Land Transport: Policy Handbook, Routledge.
ACCESSIBILITY IN CITIES TRANSPORT AND URBAN FORM WWW.NEWCLIMATEECONOMY.NET 44
Börjesson, M., Eliasson, J., Hugosson, M. B.,Brundell-Freij, K. (2012). “The Stockholm congestion charges—5 years on. Effects, acceptability and lessons learnt.” Transport Policy 20: 1-12.
Borrego, C., Martins, H., Tchepel, O., Salmim, L., Monteiro, A.,Miranda, A. I. (2006). “How urban structure can affect city sustainability from an air quality perspective.” Environmental modelling & software 21(4): 461-467.
Boschmann, E. E. (2011). “Job access, location decision, and the working poor: A qualitative study in the Columbus, Ohio metropolitan area.” Geoforum 42(6): 671-682.
Bottles, S. L. (1987). Los Angeles and the automobile: The making of the modern city. Berkeley, California, University of California Press.
Bradbury, A., Tomlinson, P.,Millington, A. (2007). Understanding the evolution of community severance and its consequences on mobility and social cohesion over the past century. European Transport Conference 2007, Creating a Livable Environment Seminar, Association for European Transport and Contributors.
Brilon, W. (1994). “Traffic engineering and the new German highway capacity manual.” Transportation Research Part A: Policy and Practice 28(6): 469-481.
Brueckner, J. K.,Kim, H.-A. (2003). “Urban sprawl and the property tax.” International Tax and Public Finance 10(1): 5-23.
Brueckner, J. K., Mills, E.,Kremer, M. (2001). “Urban Sprawl: Lessons from Urban Economics [with Comments].” Brookings-Wharton papers on urban affairs: 65-97.
Bryceson, D. F., Mbara, T. C.,Maunder, D. (2003). “Livelihoods, daily mobility and poverty in sub-Saharan Africa.” Transport Reviews 23(2): 177-196.
Bull, F., Armstrong, T., Dixon, T., Ham, S., Neiman, A.,Pratt, M. (2004). Physical inactivity. Comparative quantification of health risks. Ezzati M, L. A., Rodgers A, Murray CJL,. Geneva, World Health Organization.
Burchell, R. W., Anglin, R., Beaton, W. P., Brail, R. K., Danielson, M. N., Foxley, S. J., Listokin, D., Newton, L. Q., Schwartz, A.,Walker, C. C. (1992). Impact assessment of the New Jersey interim state development and redevelopment plan. New Jersey, New Jersey Office of State Planning.
Burchell, R. W., Lowenstein, G., Dolphin, W. R., Galley, C. C., Downs, A., Seskin, S., Still, K. G.,Moore, T. (2002). Costs of sprawl--2000, Federal Transit Administration.
Burchell, R. W.,Mukherji, S. (2003). “Conventional development versus managed growth: the costs of sprawl.” American Journal of Public Health 93(9): 1534-1540.
Burdett, R., Cavusoglu, O.,Verdis, S. (2013). City Transformations. UA Newspaper. Urban Age Conference, Rio de Janeiro, LSE Cities, London School of Economics and Political Science.
Burdett, R.,Rode, P. (2012). The Electric City. Urban Age Electric City Conference. Burdett, R. and Rode, P. London, LSE Cities. London School of Economics.
C40. (2014, 8th January 2014). “Sao Paulo to introduce electric bus fleet, add 300km of priority bus lines.” Retrieved 11th June, 2014, from http://c40.org/blog_posts/sao-paulo-to-introduce-electric-bus-fleet-add-300km-of-priority-bus-lines-english-portuguese.
Campbell, R.,Wittgens, M. (2004). “The Business Case for Active Transportation.” Gloucester: Go for Green.
Carrigan, A., King, R., Velasquez, J. M., Raifman, M.,Duduta, N. (2013). Social, environmental and economic impacts of BRT systems, EMBARQ - WRI.
ACCESSIBILITY IN CITIES TRANSPORT AND URBAN FORM WWW.NEWCLIMATEECONOMY.NET 45
Carruthers, J. I.,Ulfarsson, G. F. (2003). “Urban sprawl and the cost of public services.” Environment and Planning B: Planning and Design 30(4): 503-522.
Cervero, R. (1998). The transit metropolis: a global inquiry. Washington DC, Island Press.
Cervero, R.,Duncan, M. (2006). “’Which Reduces Vehicle Travel More: Jobs-Housing Balance or Retail-Housing Mixing?” Journal of the American planning association 72(4): 475-490.
Cervero, R., Sarmiento, O. L., Jacoby, E., Gomez, L. F.,Neiman, A. (2009). “Influences of built environments on walking and cycling: lessons from Bogotá.” International Journal of Sustainable Transportation 3(4): 203-226.
Chandler, K.,Walkowicz, K. (2006). King County Metro Transit Hybrid articulated buses: final evaluation results, National Renewable Energy Laboratory.
Chen, C., Gong, H.,Paaswell, R. (2008). “Role of the built environment on mode choice decisions: additional evidence on the impact of density.” Transportation 35(3): 285-299.
Chen, H., Jia, B.,Lau, S. S. Y. (2008). “Sustainable urban form for Chinese compact cities: Challenges of a rapid urbanized economy.” Habitat International 32(1): 28-40.
Chen, J. (2007). “Rapid urbanization in China: A real challenge to soil protection and food security.” Catena 69(1): 1-15.
Cheshire, P., Hilber, C.,Kaplanis, I. (2011). “Evaluating the effects of planning policies on the retail sector: Or do town centre first policies deliver the goods?” SERC Discussion Paper, London School of Economics 66.
Cheshire, P., Leunig, T., Nathan, M.,Overman, H. (2012) “Links between planning and economic performance: Evidence note for LSE Growth Commission.”
Cheshire, P. C.,Hilber, C. A. L. (2008). “Office Space Supply Restrictions in Britain: The Political Economy of Market Revenge.” The Economic Journal 118(529): F185-F221.
Chester, M. V.,Horvath, A. (2009). “Environmental assessment of passenger transportation should include infrastructure and supply chains.” Environmental Research Letters 4(2): 1-8.
China Ministry of Industry and Information Technology. (2011). “Automobile industry becomes a pillar of the national economy.” Retrieved 9th May, 2014, from http://www.gov.cn/jrzg/2011-09/03/content_1939735.htm
Cohen, A. (2013, 1st July 2013). “Innovative Mobility Carsharing Outlook: Carsharing Market Overview, Analysis, and Trends - Summer 2013.” Retrieved 21st May, 2014, from http://www.innovativemobility.org/publications/Carsharing_Innovative_Mobility_Industry_Outlook.shtml.
Cortright, J. (2010). New York City’s Green Dividend. CEOs for Cities.
CPCB (2010). Air quality monitoring, emission inventory and source apportionment study for Indian cities. National Summary Report, Central Pollution Control Board.
Crane, R.,Crepeau, R. (1998). “Does neighborhood design influence travel?: A behavioral analysis of travel diary and GIS data.” Transportation Research Part D: Transport and Environment 3(4): 225-238.
Credo (2014). The mobility opportunity: Improving public transport to drive economic growth - Executive summary. Munich, Siemens AG.
D’Onofrio, D. (2014). Understanding the regulatory environment of climate and the impact of community design on greenhouse gas emissions. Atlanta, GA, Atlanta Regional Commission.
ACCESSIBILITY IN CITIES TRANSPORT AND URBAN FORM WWW.NEWCLIMATEECONOMY.NET 46
Dalkmann, H.,Sakamoto, K. (2010). UNEP Green Economy report: Transport chapter - Full technical report, UNEP.
Dargay, J., Gatley, D.,Sommer, M. (2007). “Vehicle Ownership and Income Growth, Worldwide: 1960-2030.” Energy Journal 28(4): 143-170.
Darido, G., Torres-Montoya, M.,Shomik, M. (2009). Urban transport and CO2 emissions: some evidence from Chinese cities.
Washington DC, World Bank.
Davila, J. D., Ed. (2013). Urban Mobility and Poverty: Lessons from Medellin and Soacha, Colombia. London, Development Planning Unit, UCL & Universidad Nacional de Colombia.
Davis, S., Diegel, S.,Boundy, R. (2011). Transportation Energy Data Book. Oak Ridge, Tennessee, Oak Ridge National Laboratory, U.S. Department of Energy.
de Graaff, T.,Rietveld, P. (2007). “Substitution between working at home and out-of-home: The role of ICT and commuting costs.” Transportation Research Part A: Policy and Practice 41(2): 142-160.
DeGrove, J.,Miness, D. (1992). “Planning and growth management in the states: The new frontier for land policy.” Cambridge, MA: Lincoln Institute of Land Policy.
Deloitte (2014). Global automotive consumer study: Exploring consumers’ mobility choices and transportation decisions.
Deng, T.,Nelson, J. D. (2011). “Recent developments in bus rapid transit: a review of the literature.” Transport Reviews 31(1): 69-96.
Denis, K.,Urry, J. (2009). After the car. Cambridge, Polity Press.
DfT (2009). Transport Trends 2009 Edition, Department for Transport.
Dimitriou, H. T.,Gakenheimer, R. (2009). Urban transport in the developing world: perspectives from the first decade of the new millenium, Edward Elgar Pub.
Doll, C.,Hartwig, J. (2012). Clean, safe and healthy mobility through non-technical measures - Linking individual and public decision levels. Transportation Demand Management - mobil.TUM2012 International Scientific Conference on Mobility and Transport, Munich, Institute of Transportation, Technische Universitaet Muenchen.
Dora, C. (2007). “Health burden of urban transport: The technical challenge.” Sãdhanã 32(4): 285-292.
Drabo, A. (2013). “Intra-Country Health Inequalities and Air Pollution in Developing Countries.” Oxford Development Studies 41(4): 455-475.
Druckman, A.,Jackson, T. (2009). “The carbon footprint of UK households 1990–2004: a socio-economically disaggregated, quasi-multi-regional input–output model.” Ecological economics 68(7): 2066-2077.
Dulac, J. (2013). Global land transport infrastructure requirements - Estimating road and railway infrastructure capacity and costs to 2050. Information paper. Paris, OECD/IEA.
Dulal, H. B., Brodnig, G.,Onoriose, C. G. (2011). “Climate change mitigation in the transport sector through urban planning: A review.” Habitat International 35(3): 494-500.
Duncan, D. T., Piras, G., Dunn, E. C., Johnson, R. M., Melly, S. J.,Molnar, B. E. (2013). “The built environment and depressive symptoms among urban youth: a spatial regression study.” Spatial and spatio-temporal epidemiology 5: 11-25.
ACCESSIBILITY IN CITIES TRANSPORT AND URBAN FORM WWW.NEWCLIMATEECONOMY.NET 47
Ecola, L., Rohr, C., Zmud, J., Kuhnimhof, T.,Phleps, P. (2014). The future of driving in developing countries, RAND and IfMo.
ECOTEC (1993). Reducing transport emissions through planning. London, HMSO.
EEA (2006). Urban Sprawl in Europe: The ignored challenge. EEA report. Copenhagen, European Environment Agency.
Efroymson, D.,Rahman, M. (2005). Transportation policy for poverty reduction and social equity. Dhaka, WBB Trust - Roads for people.
EIA (2001). Total Energy Consumption in US households by urban-rural location, 2001. Washington DC, US Department of Energy.
Ekins, P.,Potter, S. (2010). Reducing Carbon emissions through transport taxation. GFC Briefing Paper. London, Green Fiscal Commission.
Ekosgen (2010). Employment in sustainable transport.
Embarq. (2013). “166 cities worldwide adopt bus rapid transit – a key tipping point.” Retrieved 25th April, 2014, from http://www.embarq.org/en/news/13/10/30/160-cities-worldwide-adopt-bus-rapid-transit-%E2%80%93-a-key-tipping-point.
Estiri, H. (2012). Residential Energy Use and the City-Suburb Dichotomy, University of Washington.
European Commission. (2007). “EU 27 CO2 emissions by sector.” from http://ec.europa.eu/dgs/energy_transport/figures/
pocketbook/doc/2007/2007_environment_en.xls.
Ewing, R., Bartholomew, K., Winkelman, S., Walters, J.,Anderson, G. (2008). “Urban development and climate change.” Journal of Urbanism 1(3): 201-216.
Ewing, R.,Cervero, R. (2010). “Travel and the built environment.” Journal of the American planning association 76(3): 265-294.
Ezzati, M., Lopez, A., Rodgers, A.,Murray, C., Eds. (2004). Comparative quantification of helath risks. Geneva, World Health Organization.
Fabian, B. (2012). Overview on transport data and MRV potential in Asia. Transport Sector and NAMAs: Assessing Data Readiness for MRV. Pasig, Philippines, Clean Air Initiative for Asian Cities Center (CAI-Asia Center).
Fallah, B. N., Partridge, M. D.,Olfert, M. R. (2011). “Urban sprawl and productivity: Evidence from US metropolitan areas.” Papers in Regional Science 90(3): 451-472.
Farrell, A. E.,Sperling, D. (2007). “A low-carbon fuel standard for California, Part 1: Technical analysis.”
Farrington, J. H. (2007). “The new narrative of accessibility: its potential contribution to discourses in (transport) geography.” Journal of Transport Geography 15(5): 319-330.
Floater, G., Rode, P., Friedel, B., Robert, A. (2014a). Steering Urban Growth: Governance, Policy and Finance. NCE Cities Paper 02. LSE Cities. London School of Economics and Political Science.
Floater, G., Rode, P., Robert, A., Kennedy, C., Hoornweg, D., Slavcheva, R., Godfrey, N. (2014b). Cities and the New Climate Economy: the Transformative Role of Global Urban Growth. NCE Cities Paper 01. LSE Cities. London School of Economics and Political Science.
Floater, G., Rode, P., Zenghelis, D., Montero Carrero, M.,Smith, D. A. (2013). Stockholm: Green Economy Leader Report. London, LSE Cities - London School of Economics and Political Science.
ACCESSIBILITY IN CITIES TRANSPORT AND URBAN FORM WWW.NEWCLIMATEECONOMY.NET 48
Floater, G., Rode, P., Zenghelis, D., Ulterino, M., Smith, D., Baker, K.,Heeckt, C. (2014c). Copenhagen: Green Economy Leader Report. London, LSE Cities - London School of Economics and Political Science.
Focas, C. (2014). Cities, Economy and Climate - LSE call for evidence submission, Transport Studies Unit, School of Geography and the Environment, University of Oxford. Oxford, UK, University of Oxford.
Foth, N., Manaugh, K.,El-Geneidy, A. M. (2013). “Towards equitable transit: examining transit accessibility and social need in Toronto, Canada, 1996–2006.” Journal of Transport Geography 29: 1-10.
Galea, S., Ahern, J., Rudenstine, S., Wallace, Z.,Vlahov, D. (2005). “Urban built environment and depression: a multilevel analysis.” Journal of Epidemiology and Community Health 59(10): 822-827.
Gallagher, R. (1992). THE RICKSHAWS OF BANGLADESH.
Garrett-Peltier, H. (2011). “Pedestrian and Bicycle Infrastructure: A National Study of Employment Impacts.” Amherst, MA: Political Economy Research Institute.
Gayda, S., Haag, G., Besussi, E., Lautso, K., Noël, C., Martino, A., Moilanen, P.,Dormoi, R. (2005). SCATTER - Sprawling Cities And Transport, Stratec S.A.
Gerard, D.,Lave, L. B. (2005). “Implementing technology-forcing policies: The 1970 Clean Air Act Amendments and the introduction of advanced automotive emissions controls in the United States.” Technological Forecasting and Social Change 72(7): 761-778.
Geurs, K. T.,van Wee, B. (2004). “Accessibility evaluation of land-use and transport strategies: review and research directions.” Journal of Transport Geography 12(2): 127-140.
Gilbert, R., Irwin, N., Hollingworth, B.,Blais, P. (2002). Sustainable transportation performance indicators. TRB 2003 Annual Meeting CD-ROM, Washington DC.
Glaeser, E. (2011). Triumph of the city: How our greatest invention makes US richer, smarter, greener, healthier and happier, Pan Macmillan.
Glaeser, E. L.,Kahn, M. E. (2004). Chapter 56 Sprawl and urban growth. Handbook of Regional and Urban Economics. Henderson, J. V. and Jacques-François, T., Elsevier. 4: 2481-2527.
Gomez-Ibanez, J. A. (1991). “A global view of automobile dependence.” Journal of the American planning association 57(3): 376-379.
Goodwin, P. (2012). Due diligence, traffic forecasts and pensions. Local Transport Today. 594.
Goodwin, P., Hass-Klau, C.,Cairns, S. (1998). “Evidence on the effects of road capacity reduction on traffic levels.” Traffic Engineering+ Control 39(6): 348-354.
Gordon, D. (2005). Fiscal policies for sustainable transportation: international best practices, Energy Foundation and the Hewlett Foundation.
Gordon, P.,Richardson, H. W. (1989). “Gasoline consumption and cities: A reply.” Journal of the American planning association 55(3): 342-346.
Government of India (2014). India transport report - Moving India to 2032. New Delhi, Planning Commission, Government of India. III.
ACCESSIBILITY IN CITIES TRANSPORT AND URBAN FORM WWW.NEWCLIMATEECONOMY.NET 49
Grebert, J. (2014). Renault contribution to the LSE Call for evidence submission.
Green, J.,Naughton, K. (2014). “Woes of Megacity Driving Signal Dawn of ‘Peak Car’ Era “ Retrieved 9th April, 2014, from http://www.bloomberg.com/news/2014-02-24/woes-of-megacity-driving-signals-dawn-of-peak-car-era.html.
Grubler, A., Bai, X., Buettner, T., Dhakal, S., Fisk, D., Ichinose, T., Keirstead, J., Sammer, G., Satterthwaite, D.,Schulz, N. (2012). Urban energy systems. Global energy assessment: Toward a sustainable future. Gomez-Echeverri, L., Johansson, T., Nakicenovic, N. and Patwardhan, A. Cambridge, Cambridge University Press: 1307-1400.
Guo, Z.,Ren, S. (2013). “From Minimum to Maximum: Impact of the London Parking Reform on Residential Parking Supply from 2004 to 2010?” Urban Studies 50(6): 1183-1200.
Guttikunda, S. K.,Mohan, D. (2014). “Re-fueling road transport for better air quality in India.” Energy Policy 68: 556-561.Hall, P. (1993). “Forces shaping urban Europe.” Urban Studies 30(6): 883-898.
Hall, P. (2001). Sustainable Cities or Town Cramming? Planning for a sustainable future: 101.
Hansjèurgens, B. (2010). Emissions trading for climate policy. Cambridge, Cambridge University Press.
Hao, H., Wang, H.,Ouyang, M. (2011). “Comparison of policies on vehicle ownership and use between Beijing and Shanghai and their impacts on fuel consumption by passenger vehicles.” Energy Policy 39(2): 1016-1021.
Harford, J. D. (2006). “Congestion, pollution, and benefit-to-cost ratios of US public transit systems.” Transportation Research Part D: Transport and Environment 11(1): 45-58.
Heath, G. W., Brownson, R. C., Kruger, J., Miles, R., Powell, K. E.,Ramsey, L. T. (2006). “The effectiveness of urban design and land use and transport policies and practices to increase physical activity: a systematic review.” Journal of Physical Activity & Health 3(Supplement 1): S55-S76.
Heck, S.,Rogers, M. (2014). Resource Revolution: How to Capture the Biggest Business Opportunity in a Century, Houghton Mifflin Harcourt.
Heinze, G. W.,Kill, H. H. (1991). “Chancen des ÖPNV am Ende der autogerechten Stadt. Verkehrspolitische Lehren für einen traditionellen Verkehrsträger im Strukturbruch.” Jahrbuch für Regionalwissenschaft 12/13: 105-136
Henderson, V. (2010). “Cities and development.” Journal of Regional Science 50(1): 515-540.
Herzog, B. (2010). Urban freight in developing cities. Eschborn, GTZ.
Hickman, R.,Banister, D. (2014). Transport, Climate Change and the City, Routledge.
Hidalgo, D.,Zeng, H. (2013). “On the move: Pushing sustainable transport from concept to tipping point.” Retrieved 25th April, 2014, from http://thecityfix.com/blog/on-the-move-pushing-sustainable-transport-concept-tipping-point-dario-hidalgo-heshuang-zeng/.
Hilber, C.,Vermeulen, W. (2010). The impact of restricting housing supply on house prices and affordability. UK Department for Communities and Local Government. London, HM Stationary Office.
Holtzclaw, J. W. (1994). Using residential patterns and transit to decrease auto dependence and costs - Executive summary. San Francisco, Natural Resources Defense Council.
Holtzclaw, J. W. (2000). Smart Growth—As Seen from the Air: Convenient Neighborhood, Skip the Car. Air and Waste Management Association’s 93rd Annual Meeting and Exhibition.
ACCESSIBILITY IN CITIES TRANSPORT AND URBAN FORM WWW.NEWCLIMATEECONOMY.NET 50
Houghton, S. J. (1995). 18th Report of the Royal Commission on Environmental Pollution: Transport and the Environment. Oxford, Oxford University Press.
Huo, H., Wang, M., Johnson, L.,He, D. (2007). “Projection of Chinese motor vehicle growth, oil demand, and CO 2 emissions through 2050.” Transportation Research Record: Journal of the Transportation Research Board 2038(1): 69-77.
Huré, M. (2012, 6th January 2012). “De Vélib’ à Autolib’. Les grands groupes privés, nouveaux acteurs des politiques de mobilité urbaine.” Retrieved 28th May, 2014, from http://www.metropolitiques.eu/De-Velib-a-Autolib-Les-grands.html#nb1.
IBI Group (2009). The implications of alternative growth patterns on infrastructure costs. Calgary, Canada.
IEA (2011). World Energy Outlook 2011. Paris, OECD/International Energy Agency.
IEA (2012). World Energy Outlook 2012. Paris, OECD / International Energy Agency.
IMF (2013). Energy subsidy reform: Lessons and implications, International Monetary Fund.
IPCC (2014a). Climate Change 2014: Mitigation of Climate Change - Human Settlements. Working Group III: Mitigation of Climate Change. Potsdam, Intergovernmental Panel on Climate Change.
IPCC (2014b). Climate Change 2014: Mitigation of Climate Change - Transport. Working Group III: Mitigation of Climate Change. Potsdam, Intergovernmental Panel on Climate Change.
IRAP (2013). The global cost of road crashes: Fact sheet, International Road Assessment Programme.
ITC (2014). Trade statistics for international business development 8703 - Cars (incl.station wagon). Geneva, International Trade Center.
ITDP (2012). Transforming urban mobility in Mexico: Towards accessible cities less reliant on cars. Mexico City, Institute for Transportation and Development Policy.
Jaffe, A. B.,Lerner, J. (2011). Innovation and its discontents: How our broken patent system is endangering innovation and progress, and what to do about it, Princeton University Press.
Jaffe, A. B., Newell, R. G.,Stavins, R. N. (2002). “Environmental policy and technological change.” Environmental and resource economics 22(1-2): 41-70.
Johnson, D., Mackie, P., Laird, J., Shires, J.,Ercolani, M. (2012). Buses and economic growth. Leeds, Institute for Transport Studies, University of Leeds.
Kagermeier, A. (1997). “Siedlungsstrukturell bedingter Verkehrsaufwand in großstädtischen Verflechtungsbereichen.” Raumforschung und Raumordnung 55(4/5).
Kalthier, R. (2002). Urban Transport and Poverty in Developing Countries: Analysis and options for transport policy and planning. Eschborn, Germany, Deutsche Gesellschaft für Technische Zusammenarbeit.
Kamakate, F.,Gordon, D. (2009). “Managing motorcycles: Opportunities to reduce pollution and fuel use from two-and-three wheeled vehicle.” International Council on Clean Transportation (ICCT).
Kamal-Chaoui, L.,Robert, A. (2009). Competitive Cities and Climate Change, Regional Development Working Papers N° 2, OECD publishing.
Kenworthy, J., Laube, F. (2001) The Millennium Cities Database for Sustainable Transport. (CDROM Database) International Union (Association) of Public Transport, (UITP), Brussels and Institute for Sustainability and Technology Policy (ISTP), Perth.
ACCESSIBILITY IN CITIES TRANSPORT AND URBAN FORM WWW.NEWCLIMATEECONOMY.NET 51
Kersys, A. (2011). “Sustainable Urban Transport System Development Reducing Traffic Congestions Costs.” Engineering Economics 22(1): 5-13.
Khattak, A. J.,Rodriguez, D. (2005). “Travel behavior in neo-traditional neighborhood developments: A case study in USA.” Transportation Research Part A: Policy and Practice 39(6): 481-500.
Kim, D. (2008). “Blues from the neighborhood? Neighborhood characteristics and depression.” Epidemiologic reviews 30(1): 101-117.
Knie, A. (2011). Neue Beweglichkeit. Internationales Verkehrswesen. 63.
Knittel, C. (2012). “Automobiles on steroids: Product attribute trade-offs and technological progress in the automobile sector.” American Economic Review 101: 3368–3399.
Knoflacher, H., Rode, P.,Tiwari, G. (2008). How roads kill cities. The Endless City. Burdett, R. and Sudjic, D. London, UK, Phaidon: 340-347.
Kockelman, K. M. (1997). “Travel behavior as function of accessibility, land use mixing, and land use balance: evidence from San Francisco Bay Area.” Transportation Research Record: Journal of the Transportation Research Board 1607(1): 116-125.
Kutzbach, M. (2010). “Megacities and Megatraffic.” Access 37: 31-35.
Laconte, P. (2005). Urban and Transport Management - International Trends and Practices. International Symposium “Sustainable Urban Transport and City”. Shanghai, Tongji University and Nagoya University.
Larsen, J. (2013). “Bike-sharing programs hit the streets in over 500 cities worldwide.” Retrieved 11th May, 2014, from http://www.earth-policy.org/plan_b_updates/2013/update112.
Lautso, K., Spiekermann, K., Wegener, M., Sheppard, I., Steadman, P., Martino, A., Domingo, R., Gayda, S.,Echenique, M. (2004). Planning and research of policies for land use and transport for increasing urban sustainability - PROPOLIS Final Report. Helsinki, LT Consultants.
Lecocq, F.,Shalizi, Z. (2014). “The economics of targeted mitigation in infrastructure.” Climate Policy 14(2): 187-208.
Lefèvre, B. (2009). “Long-term energy consumptions of urban transportation: A prospective simulation of “transport–land uses” policies in Bangalore.” Energy Policy 37(3): 940-953.
Li, F.,Cao, B. (2012). Path and potential of carbon emissions reduction caused by urban energy use: A case study of Shanghai. Urban China Project Report
Limtanakool, N., Dijst, M.,Schwanen, T. (2006). “The influence of socioeconomic characteristics, land use and travel time considerations on mode choice for medium-and longer-distance trips.” Journal of Transport Geography 14(5): 327-341.
Lin, J.-J.,Yang, A.-T. (2009). “Structural analysis of how urban form impacts travel demand: Evidence from Taipei.” Urban Studies 46(9): 1951-1967.
Litman, T. (1999). “The costs of automobile dependency.” Victoria Transportation Policy Institute.
Litman, T. (2006). Cities connect: How urbanity helps achieve social inclusion objectives. Metropolis Conference. Victoria, Victoria Transport Policy Institute.
Litman, T. (2008). Evaluating accessibility for transportation planning. Victoria, Victoria Transport Policy Institute.
Litman, T. (2009). “Transportation cost and benefit analysis.” Victoria Transport Policy Institute: 1-19.
ACCESSIBILITY IN CITIES TRANSPORT AND URBAN FORM WWW.NEWCLIMATEECONOMY.NET 52
Litman, T. (2011). Win-Win transportation solutions: Mobility management strategies that provide economic, social and environmental benefits. Victoria, Canada, Victoria Transport Policy Institute.
Litman, T. (2012). Evaluating public transportation health benefits. Victoria, Victoria Transport Policy Institute.
Litman, T. (2014a). “Evaluating public transit benefits and costs.” Victoria Transport Policy Institute 65.
Litman, T. (2014b). Smart growth savings. Victoria, Canada, Victoria Transport Policy Institute.
Liu, Y., Chen, T.,Song, X. (2012). Relationship between Urban Form and Urban CO2 Efficiency with Policies and
Recommendations.
Lotfi, S.,Koohsari, M. J. (2011). “Proximity to neighborhood public open space across different socio-economic status areas in metropolitan Tehran.” Environmental Justice 4(3): 179-184.
Lovejoy, K., Handy, S.,Mokhtarian, P. (2010). “Neighborhood satisfaction in suburban versus traditional environments: An evaluation of contributing characteristics in eight California neighborhoods.” Landscape and Urban Planning 97(1): 37-48.
LSE Cities (2014). Transport related carbon emissions in Atlanta and Barcelona: Updated comparative calculations. Working paper. London, LSE Cities.
Mackie, P.,Worsley, T. (2013). “International Comparison of Transport Appraisal Practice.” Institute for Transport Studies (www. its. leeds. ac. uk) for the UK Department for Transport.
Mair, C., Roux, A. D.,Galea, S. (2008). “Are neighbourhood characteristics associated with depressive symptoms? A review of evidence.” Journal of Epidemiology and Community Health 62(11): 940-946.
Manville, M.,Shoup, D. (2004). “People, parking and cities.” ACCESS Magazine.
Martin, E. W.,Shaheen, S. A. (2011). “Greenhouse gas emission impacts of carsharing in North America.” Intelligent Transportation Systems, IEEE Transactions on 12(4): 1074-1086.
McCubbin, D. R.,Delucchi, M. A. (1999). “The health costs of motor-vehicle-related air pollution.” Journal of Transport Economics and Policy 33(3): 253-286.
Medley, A. J., Wong, C.-M., Thach, T. Q., Ma, S., Lam, T.-H.,Anderson, H. R. (2002). “Cardiorespiratory and all-cause mortality after restrictions on sulphur content of fuel in Hong Kong: an intervention study.” The lancet 360(9346): 1646-1652.
Menckhoff, G. (2005). Latin American experience with bus rapid transit. Annual meeting of the Institute of Transportation Engineers, Melbourne.
Metz, D. (2012). “Demographic determinants of daily travel demand.” Transport Policy 21: 6.
Metz, D. (2013). “Peak car and beyond: The fourth era of travel.” Transport Reviews 33(3): 255-270.
MGI (2009). Preparing for China’s urban billion, McKinsey Global Institute.
MGI (2010). India’s urban awakening: Building inclusive cities, sustaining economic growth, McKinsey Global Institute.
Mock, P.,Yang, Z. (2014). Driving electrification: A global comparison of fiscal incentive policy for electric vehicles. Washington DC, ICCT.
Morichi, S.,Raj Acharya, S. (2013). Transport Development in Asian Megacities, Springer.
ACCESSIBILITY IN CITIES TRANSPORT AND URBAN FORM WWW.NEWCLIMATEECONOMY.NET 53
Mu, Q.,Zhang, S.-q. (2013). “An evaluation of the economic loss due to the heavy haze during January 2013 in China.” China Environmental Science 33(11).
Müller, B.,Siedentop, S. (2004). “Growth and shrinkage in Germany–Trends, perspectives and challenges for spatial planning and development.” German Journal of Urban Studies 44(1): 14-32.
Murie, A.,Musterd, S. (2004). “Social exclusion and opportunity structures in European cities and neighbourhoods.” Urban Studies 41(8): 1441-1459.
National Research Council (2009). Driving and the Built Environment:The Effects of Compact Development on Motorized Travel, Energy Use, and CO
2 Emissions -- Special Report 298, The National Academies Press.
Nelson, A. C., Anderson, G., Bartholomew, K., Perlich, P., Sanchez, T.,Ewing, R. (2009). The best stimulus for the money: Briefing papers on the economics of transportation spending, University of Utah.
Nelson, A. C.,Moore, T. (1993). “Assessing urban growth management: The case of Portland, Oregon, the USA’s largest urban growth boundary.” Land Use Policy 10(4): 293-302.
Newman, P.,Kenworthy, J. R. (1989). Cities and automobile dependence : a sourcebook. Aldershot, Gower.
Newman, P. ,Kenworthy, J. R. (1996). “The land use—transport connection: An overview.” Land Use Policy 13(1): 1-22.
Newman, P. ,Kenworthy, J. R. (2015) “The end of automobile dependence: How cities are moving beyond car-based planning.” Island Press, Washington DC.
Norman, J., MacLean, H. L.,Kennedy, C. A. (2006). “Comparing high and low residential density: life-cycle analysis of energy use and greenhouse gas emissions.” Journal of Urban Planning and Development 132(1): 10-21.
O’Connor, K. M.,Sauer, S. J. (2006). “Recognizing Social Capital in Social Networks: Experimental Results.” Johnson School Research Paper Series 18-06.
Odgaard, T., Kelly, C.,Laird, J. (2005). Current practice in project appraisal in Europe, HEATCO research project (Harmonised European Approaches for Transport Costing and Project Assessment).
OECD (2010). Trends in Urbanisation and Urban Policies in OECD Countries: What lessons for China?, OECD, China Development Research Foundation.
OECD. (2011). “STAN indicators.” Retrieved 22 April, 2014, from http://stats.oecd.org/Index.aspx?DataSetCode=STANINDICATORS.
OECD (2012a). Compact City Policies: A Comparative Assessment. OECD Green Growth Studies, OECD.
OECD (2012b). Inventory of estimated budgetary support and tax expenditures for fossil fuels 2013. Paris, OECD.
OECD (2013a). Medium-run capacity adjustment in the automobile industry. OECD Economics Department Policy Notes.
OECD (2013b). Tracking clean energy progress. Power generation figures, OECD.
OECD (2014). The cost of air pollution: Health impacts of road transport OECD.
OICA (2014a). 2005-2013 production statistics. Paris, International Organization of Motor Vehicle Manufacturers. 2014.
OICA (2014b). 2005-2013 sales statistics. Paris, International Organization of Motor Vehicle Manufacturers. 2014.
ACCESSIBILITY IN CITIES TRANSPORT AND URBAN FORM WWW.NEWCLIMATEECONOMY.NET 54
OJEU (2009). Regulation EC 449/2009.
ONS (2010). Transport trends - 2009 edition. Transport Statistics. London, Office of National Statistics.Owens, S. (1995). “From ‘predict and provide’ to ‘predict and prevent’?: Pricing and planning in transport policy.” Transport Policy 2(1): 43-49.
Owens, S.,Cowell, R. (2011). Land and limits: interpreting sustainability in the planning process, Routledge.
Pai, M., Gadgil, R., Mahendra, A., Vernekar, S., Heywood, R.,Chanchani, R. (2013). Motorized two-wheelers in Indian cities: A case study of the city of Pune, EMBARQ India.
Pelletier, M.-P., Trépanier, M.,Morency, C. (2011). “Smart card data in public transit : a literature review.” Transportation Research Part C 19: 557–568.
Perego, A., Perotti, S.,Mangiaracina, R. (2011). “ICT for logistics and freight transportation: a literature review and research agenda.” International Journal of Physical Distribution & Logistics Management 41(5): 457-483.
PFNYC. (2013). “Growth for Gridlock.” Retrieved 28 April 2014, 2014, from http://www.pfnyc.org/reports/GrowthGridlock_4pg.pdf.
Phadke, S. (2013, 17th September 2013). “The Asian mobile consumer decoded.” Retrieved 21st May, 2014, from http://www.nielsen.com/us/en/newswire/2013/the-asian-mobile-consumer-decoded0.html.
Pickrell, D. (1999). Transportation and land use. Essays in Transportation Economics and Policy. A Handbook in Honor of John R. Meyer Gomez-Ibanez, J., Tye, W. B. and Winston, W. Wasahington DC, Brookings Institution Press: 403-435.
Potter, S. (2008). Purchase, circulation and fuel taxation. The Implementation and Effectiveness of Transport Demand Management Measures: An International Perspective. Ison, S. and Rye, T. Aldershot, Ashgate: 13.
Pourbaix, J. (2012). “Towards a Smart Future for Cities.” Journeys - May 2012.
Prud’homme, R.,Lee, C.-W. (1999). “Size, sprawl, speed and the efficiency of cities.” Urban Studies 36(11): 1849-1858.
Pucher, J.,Buehler, R. (2006). “Why Canadians cycle more than Americans: a comparative analysis of bicycling trends and policies.” Transport Policy 13(3): 265-279.
Pucher, J., Park, H., Kim, M. H.,Song, J. (2005). “Public transport reforms in Seoul: innovations motivated by funding crisis.” Journal of Public Transportation 8(5): 41.
Putnam, R. D. (2004). Education, diversity, social cohesion and ‘social capital’ - Meeting of OECD Education Ministry. Raising the quality of learning for all. Dublin.
Putnam, R. D., Leonardi, R.,Nanetti, R. (1994). Making democracy work: civic traditions in modern Italy, Princeton University Press.
PwC. (2013). “Technological breakthroughs - Global Annual Review 2013.” from http://www.pwc.com/gx/en/annual-review/megatrends/technological-breakthroughs-bob-moritz.jhtml.
Qin, B.,Han, S. S. (2013). “Planning parameters and household carbon emission: Evidence from high-and low-carbon neighborhoods in Beijing.” Habitat International 37: 52-60.
Rayle, L.,Pai, M. (2010). “Scenarios for Future Urbanization: Carbon Dioxide Emissions from Passenger Travel in Three Indian Cities.” Transportation Research Record: Journal of the Transportation Research Board 2193(1): 124-131.
ACCESSIBILITY IN CITIES TRANSPORT AND URBAN FORM WWW.NEWCLIMATEECONOMY.NET 55
Renner, M., Gardner, G.,Alliance, A. (2010). Global competitiveness in the rail and transit industry. Washington DC, Worldwatch Institute.
Reno, A.,Weisbrod, G. (2009). Economic Impact of Public Transportation Investment. Transit Cooperative Research Program.Rérat, P. (2012). “The new demographic growth of cities: The case of reurbanisation in Switzerland.” Urban Studies 49(5): 1107-1125.
Robinson, C. W. (2003). Risks and rights: The causes, consequences, and challenges of development-induced displacement. Washington, DC, Brookings Institution
Rode, P. (2014). The Politics and Planning of Urban Compaction: The Case of the London Metropolitan Region. The Economy of Sustainable Construction. Ilka and Andreas Ruby, N. J. Berlin, Ruby Press.
Rode, P.,Burdett, R. (2011). Cities: investing in energy and resource efficiency, United Nations Environment Programme.
Rode, P., Floater, G., Kandt, J., Baker, K., Carrero, M. M., Heeckt, C., Smith, D.,Delfs, M. (2013). Going Green: How cities are leading the next economy. London, LSE Cities, ICLEI and Global Green Growth Institute.
Rode, P.,Gipp, C. (2001). Dynamische Raeume: Die Nutzungsflexibilisierung urbaner Mobilitaetsraeume am Beispiel der Berliner Innenstadt, Technical University Berlin.
Rode, P., Hoffmann, C., Kandt, J., Graff, A.,Smith, D. (2014). New Urban Mobility in London and Berlin, LSE Cities and InnoZ.
Rode, P., Kandt, J.,Baker, K. (2013). Transport Equity in Sao Paulo, Istanbul and Mumbai. LSE Cities Working Paper. London, LSE Cities.
Saelens, B. E., Sallis, J. F., Black, J. B.,Chen, D. (2003). “Neighborhood-based differences in physical activity: an environment scale evaluation.” American Journal of Public Health 93(9): 1552-1558.
Saikawa, E.,Urpelainen, J. (2014). “Environmental standards as a strategy of international technology transfer.” Environmental
Science & Policy 38: 192-206.
Saitto, S.,Stone, B. (2014). “Uber sets valuation record of $17 billion in new funding.” Retrieved 14th June, 2014, from http://www.bloomberg.com/news/2014-06-06/uber-sets-valuation-record-of-17-billion-in-new-funding.html.
Sallis, J. F., Saelens, B. E., Frank, L. D., Conway, T. L., Slymen, D. J., Cain, K. L., Chapman, J. E.,Kerr, J. (2009). “Neighborhood built environment and income: examining multiple health outcomes.” Social science & medicine 68(7): 1285-1293.
Salon, D.,Aligula, E. M. (2012). “Urban travel in Nairobi, Kenya: analysis, insights, and opportunities.” Journal of Transport Geography 22: 65-76.
Santos, G., Behrendt, H.,Teytelboym, A. (2010). “Part II: Policy instruments for sustainable road transport.” Research in Transportation Economics 28(1): 46-91.
Savy, M. (2012). Urban freight: a comprehensive approach. Urban Freight for Livable Cities, Gothenburg, Volvo Research and Education Foundation.
Schubert, J., Wolbring, T.,Gill, B. (2013). “Settlement Structures and Carbon Emissions in Germany: The Effects of Social and Physical Concentration on Carbon Emissions in Rural and Urban Residential Areas.” Environmental Policy and Governance 23(1): 13-29.
ACCESSIBILITY IN CITIES TRANSPORT AND URBAN FORM WWW.NEWCLIMATEECONOMY.NET 56
Schweinfurth, A. (2009). Car-scrapping schemes: An effective economic rescue policy? Policy Brief, International Institute for Sustainable Development.
Scotchmer, S. (2004). Innovation and incentives, MIT press.
Sellers, J., Han, S. S., Huang, J., Lu, X. X., Marcotullio, P.,Ramachandra, T. V. (2009). Peri-urban development and environmental sustainability: Examples from China and India, Asia-Pacific Network for Global Change Research.
Seto, K. C., Güneralp, B.,Hutyra, L. R. (2012). “Global forecasts of urban expansion to 2030 and direct impacts on biodiversity and carbon pools.” Proceedings of the National Academy of Sciences 109(40): 16083-16088.
SGA (2011). Recent lessons from the stimulus: Transportation Funding and Job Creation, Smart Growth America.
Short, D. (2014). “Vehicle miles driven: Another population-adjusted low.” Retrieved 14th June, 2014, from http://www.advisorperspectives.com/dshort/updates/DOT-Miles-Driven.php.
Sietchiping, R., Permezel, M. J.,Ngomsi, C. (2012). “Transport and mobility in sub-Saharan African cities: An overview of practices, lessons and options for improvements.” Cities 29(3): 183-189.
Smith, K. R., Jerrett, M., Anderson, H. R., Burnett, R. T., Stone, V., Derwent, R., Atkinson, R. W., Cohen, A., Shonkoff, S. B.,Krewski, D. (2010). “Public health benefits of strategies to reduce greenhouse-gas emissions: health implications of short-lived greenhouse pollutants.” The lancet 374(9707): 2091-2103.
Smith, W. S. (1984). “Mass transport for high-rise high-density living.” Journal of Transportation Engineering 110(6): 521-535.
Sorensen, A.,Hess, P. (2007). Metropolitan form, density and transportation, The Neptis Foundation.
Soron, D. (2009). Driven to drive: Cars and the problem of ‘compulsory consumption’. Car Troubles: Critical Studies of Automobility and Auto-Mobility. Conley, J. and Tigar, A. Aldershot, Ashgate: 181-198.
Sperling, D.,Nichols, M. (2012). “California’s Pioneering Transportation Strategy.” Issues in Science and Technology 28(2): 59-66.
Spieser, K., Treleaven, K. B., Zhang, R., Frazzoli, E., Morton, D.,Pavone, M. (2014). “Toward a Systematic Approach to the Design and Evaluation of Automated Mobility-on-Demand Systems: A Case Study in Singapore.”
Staniford, S. (2010). Chinese Transportation Growth.STF. (2014). “Shrink your travel footprint.” Retrieved 12th June 2014, from http://shrinkthatfootprint.com/shrink-your-travel-footprint.
Suzuki, H., Cervero, R.,Iuchi, K. (2013). Transforming cities with transit: Transit and land-use integration for sustainable urban development, World Bank Publications.
TfL (2013). Annual Report and Statement of Accounts 2012/13. London, Transport for London.
Thomopoulos, N., Givoni, M.,Rietveld, P., Eds. (forthcoming). ICT for transport: opportunities and threats. NECTAR Series on Transportation and Communications Networks Research. Cheltenham, Edward Elgar.
Thomopoulos, N.,Grant-Muller, S. (2013). “Incorporating equity as part of the wider impacts in transport infrastructure assessment: an application of the SUMINI approach.” Transportation 40(2): 315-345.
Thompson, D. (2013). Suburban sprawl: Exposing hidden costs, identifying innovations. Ottawa, Sustainable Prosperity, University of Ottawa.
ACCESSIBILITY IN CITIES TRANSPORT AND URBAN FORM WWW.NEWCLIMATEECONOMY.NET 57
Turner, P.,Pourbaix, J. (2014). UITP call for evidence response - Actions to reduce emissions, urban innovation and smart technologies, UITP.
UK Ministry of Transport (1963). The Buchanan Report - Traffic in towns: a study of the long term problems of traffic in urban areas, H.M. Stationery Off.
UN Habitat (2008). Part three: Environmental harmony. London, Earthscan.
UN Habitat (2010). State of the World’s Cities 2010/2011: Bridging the Urban Divide.
UN Habitat (2013). Planning and design for sustainable urban mobility: Global report on human settlements 2013. United Nations Human Settlements Programme. New York, United Nations.
UNCSD (2012). Sustainable, Low carbon transport in emerging and developing economies. Rio 2012 Issues Briefs, Rio+20 United Nations Conference on Sustainable Development. 13.
UNEP (2011). Towards a Green Economy: Pathways to sustainable development and poverty eradication., UNEP.
UTF (1999). Towards an Urban Renaissance: The Report of the Urban Task Force Chaired by Lord Rogers of Riverside; Executive Summary. London, HMSO.
Valeur, H. (2013). The horrendous costs of motorized transportation in (Indian) cities. Alog.van Audenhove, F.-J., Korniichuk, O., Dauby, L.,Pourbaix, J. (2014). The Future of Urban Mobility 2.0, Arthur D. Little and UITP.
Van Dyck, D., Cerin, E., Conway, T. L., De Bourdeaudhuij, I., Owen, N., Kerr, J., Cardon, G., Frank, L. D., Saelens, B. E.,Sallis, J. F. (2012). “Perceived neighborhood environmental attributes associated with adults’ transport-related walking and cycling: Findings from the USA, Australia, and Belgium.” International Journal Behavioral Nutritin and Physical Activity 9(1): 70.
VandeWeghe, J. R.,Kennedy, C. (2007). “A spatial analysis of residential greenhouse gas emissions in the Toronto census metropolitan area.” Journal of Industrial Ecology 11(2): 133-144.
Vasconcellos, E. A. (1997). “The making of the middle-class city: transportation policy in Sao Paulo.” Environment and Planning A 29(2): 293-310.
Vigar, G. (2001). “Reappraising UK transport policy 1950–99: the myth of’mono-modality’and the nature of’paradigm shifts’.” Planning Perspectives 16(3): 269-291.
Wagner, A. (2013). GIZ International Fuel Prices 2012/2013 - Data preview April 2013. Eschborn, Deutsche Gesellschaft fur Internationale Zusammenarbeit (GIZ).
WBCSD (2009). The cement sustainability initiative: Recycling concrete - Executive summary, WBCSD-CSI.
WBCSD. (2012). “About the cement industry.” Retrieved 27th May, 2014, from http://www.wbcsdcement.org/index.php/about-cement.
Webster, D., Bertaud, A., Jianming, C.,Zhenshan, Y. (2010). Toward efficient urban form in China. Working paper series, World Institute for Development Economics Research.
West, S. E. (2010). “Taxes versus standards.” 21st Century Economics: A Reference Handbook 1: 247.
Wheaton, W. C. (1998). “Land use and density in cities with congestion.” Journal of Urban Economics 43(2): 258-272.
WHO (2004). The World Health Report 2004: Changing history. Geneva, World Health Organization.
ACCESSIBILITY IN CITIES TRANSPORT AND URBAN FORM WWW.NEWCLIMATEECONOMY.NET 58
WHO. (2008). “Mortality: Chronic respiratory diseases, deaths per 100,000 - Data by country.” Retrieved 6th June, 2014, from http://apps.who.int/gho/data/node.main.A866?lang=en.
WHO (2013). Global status report on road safety 2013.
WHO. (2014a, February 2014). “Physical activity.” Factsheet Retrieved 12th June, 2014, from http://www.who.int/mediacentre/factsheets/fs385/en/.
WHO (2014b). Unlocking new opportunities: Jobs in green and healthy transport, World Health Organisation.
Williams-Derry, C. (2013). “Traffic forecast follies - The US DOT refuses to learn from recent travel trends.” Retrieved 28th May, 2014, from http://daily.sightline.org/2013/12/23/traffic-forecast-follies/.Wipperman, T.,Sowula, T. (2007, 9th August 2007). “Pulling rickshaws out of poverty: A proposal.” Retrieved 29th April, 2014, from http://www.progressivebangladesh.org/index.php?option=com_content&task=view&id=74&Itemid=30.
World Bank (2010). Guangzhou Green Trucks Pilot Project : Technology Pilot Report, World Bank and Clean Air Initiative for Asian Cities Centre.
World Bank (2013). Urbanization beyond Municipal Boundaries: Nurturing Metropolitan Economies and Connecting Peri-Urban Areas in India, World Bank.
World Bank (2014a). Supporting Reports II - Urban China
World Bank (2014b). Urban China: Toward Efficient, Inclusive, and Sustainable Urbanization.
World Bank, , (2002). Cities on the Move.
Wright, L. (2002). “Bus Rapid Transit, sustainable transport: A sourcebook for policy-makers in developing cities.” Deutsche Gesellschaft fuer Technische Zusammenarbeit (GTZ), Eschborn.
Wright, L.,Fulton, L. (2005). “Climate Change Mitigation and Transport in Developing Nations.” Transport Reviews 25(6): 691-717.
Wu, J. (2006). “Environmental amenities, urban sprawl, and community characteristics.” Journal of Environmental Economics and Management 52(2): 527-547.
Xu, Q.,Dodds, E. (forthcoming). Enhancing transport through Open Geospatial Data and crowdsourcing ICT for transport: opportunities and threats. Thomopoulos, N., Givoni, M. and Rietveld, P. Cheltenham, Edward Elgar.
Yen, I. H., Michael, Y. L.,Perdue, L. (2009). “Neighborhood environment in studies of health of older adults: a systematic review.” American journal of preventive medicine 37(5): 455-463.
Zacharias, J.,Tang, Y. (2010). “Restructuring and repositioning Shenzhen, China’s new mega city.” Progress in Planning 73(4): 209-249.
Zhang, J., Mauzerall, D. L., Zhu, T., Liang, S., Ezzati, M.,Remais, J. V. (2010). “Environmental health in China: progress towards clean air and safe water.” The lancet 375(9720): 1110-1119.
Zhang, M. (2004). “The role of land use in travel mode choice: evidence from Boston and Hong Kong.” Journal of the American planning association 70(3): 344-360.
Zhang, M. (2006). “Travel Choice with No Alternative Can Land Use Reduce Automobile Dependence?” Journal of Planning Education and Research 25(3): 311-326.
ACCESSIBILITY IN CITIES TRANSPORT AND URBAN FORM WWW.NEWCLIMATEECONOMY.NET 59
1. Accessibility is frequently contrasted with mobility-based frameworks that dominate urban transport policy (Litman 2008) and draws attention to the interaction of transport conditions, land-use patterns and individual attributes in determining how easily residents of a city can access a range of social and economic opportunities. Improving accessibility may well involve an increase of people’s levels of mobility through improved transport systems, however, the concept has advantages in opening up a wider range of policy responses for addressing transport problems, including changes to the spatial distribution of opportunities that bring activities closer to residents, rather than requiring increased mobility (Farrington 2007; Litman 2008). Accessibility has been defined as: ‘the extent to which land-use and transport systems enable (groups of) individuals to reach activities or destinations by means of a (combination of) transport mode(s)’ (Geurs and van Wee 2004, p. 128)
2. We define compact urban growth (which can be both new urban development and urban retrofitting) as urban development which is characterised by human-scale built environments with higher density, mixed-use urban form and high quality urban design. Compact urban development typically focuses on urban regeneration, the revitalisation of urban cores, the promotion of public and non-motorised transport, and high standards of urban management (Floater, Rode et al. 2014b). Related concepts include the European City model, smart growth and transit oriented development (TOD).
3. It is important to note that a range of earlier studies were more critical of the potential of reducing travel demand through higher residential densities (Kagermeier 1997; Crane and Crepeau 1998; Kockelman 1997; Hall 2001; Gomez-Ibanez 1991; Gordon and Richardson 1989). However, these studies also tended to look at density in isolation and independent from related changes such as mix use or design quality. Studies supporting the land use transport pattern impacts further include Cervero and Duncan (2006), Limtanakool et al (2006) and Chen et al (2008).
4. Urban freight transport accounts for 31 per cent of energy use and CO2 emissions throughout Europe (Herzog 2010).
5. Embedded emissions are upstream CO2 emissions from energy used for transport, housing or the production of goods
and services (Druckman and Jackson 2009). These also include emissions that occur as part of constructing or building transport infrastructure or vehicles.
6. Rapid urbanisation in conjunction with population growth in developing countries and maintenance of existing transport and urban infrastructure in developed countries impose high demand for building materials. 30 billion tonnes of concrete were consumed in 2006 in contrast to 2 billion tonnes in 1950 (WBCSD 2009), while cement production accounts for 5 per cent of global anthropogenic CO
2 emissions (WBCSD 2012).
7. Urban area in London includes Greater London, whereas the peri-urban area includes the rest of the Southeast of England. Urban area in New York includes urban New York i.e. New York City (Bronx, Brooklyn, Manhattan, Queens) including the largely built-up Hudson County of New Jersey apart from Richmond (Staten Island), whereas the peri-urban area includes the rest of the Tri-State area i.e. New York state, New Jersey and Connecticut (Focas, 2014).
8. The maximum capacity levels of metro rail systems typically exceeds BRT by a factor of 1.5.
9. In Sao Paulo, the most sprawling and socially segregated city of the three, the most disadvantaged groups are on average required to travel twice as long to access basic services as the most privileged – a pattern that does not exist in more compact and socially mixed Istanbul and Mumbai (Rode, Kandt et al. 2013).
NOTES

ACCESSIBILITY IN CITIES TRANSPORT AND URBAN FORM WWW.NEWCLIMATEECONOMY.NET 60
10. While European and American cities have seen the strongest decline of public transport during the post-war decades, negative trends stabilised or even reversed from the 1990s onwards, most notably in larger cities with historically well-established metro and regional rail systems. High income cities in Asia such as Hong Kong, Singapore and most cities in Japan were able to maintain a public transport share of up to 70 to 90 per cent due to high investment in public transport and a land-use integrated urban planning framework. Developing cities in Asia, Africa and Latin America have registered a greater variation of trends.
11. Over the last decade, the growth of motor vehicles in China has been exponential (Staniford 2010; Kutzbach 2010). In 2000, the number of motor vehicles per thousand people in China was 7, increasing to 44 in 2010 and 54 in 2011 (World Bank 2014a). At the moment there are two hundred times as many motor vehicles (including two-wheelers) in India as there were fifty years ago, with the numbers increasing from 0.7 million in 1961 to 142 million in 2011.
12. Italy has over 600 cars per 1,000 people, Australia 556 and Germany 517. In contrast, Brazil has 179, South Africa 112, China 44 and Indonesia 37 passenger cars per 1,000 inhabitants; however these countries have higher growth rates compared to developed countries (World Bank 2014a). At the same time, medium-income megacities have car ownership levels similar or even higher than those in western megacities: 465, 294 and 206 in Sao Paulo, Mexico City and Johannesburg respectively compared to 209 in New York and 331 in London (Burdett et al. 2013).
13. Less conservative studies estimate the vehicle stock could increase to 2 billion by 2030 if motorisation levels across 45 countries accounting for 75 per cent of the world’s population continue to grow on a business-as-usual scenario (Dargay et al 2007).
14. India will retain lower vehicle volumes, reflected in the low motorisation index which measures the number of vehicles per 1,000 citizens. Still, by 2035, three times as many motor vehicles are expected to be on Indian roads as there were in 2005 (Fabian 2012).
15. BRT systems can yield high returns particularly to middle/lower income cities (Credo 2014). Aside the substantial travel time savings which range between 20 and 50 per cent in Buenos Aires and up to 40 per cent in Lagos, these BRTs demonstrate commuter cost savings of up to 50 per cent in Lagos or 40 million net benefits as showcased through the CBA of Metrobus in Mexico City. In addition, improved safety impacts accrue through reduced crime incidents and less injuries as reported in Jakarta for instance, as well as increased physical activity implications. Furthermore, CO
2
emissions have been reduced by 350,000 tonnes CO2 per year through TransMilenio in Bogota and by 120,000 tonnes
CO2 per year through TransJakarta in Jakarta (Turner and Pourbaix 2014).
16. Building densities in Indian cities were usually kept low as part of formal regulations to ensure that infrastructure systems can still cope with local demand. The World Bank suggests that this argument ignores opportunities of generating revenues from higher land values which can improve local infrastructure as also discussed in Section 5.3 (World Bank 2013).
17. Figure 19 (L): 69 – benchmark line (Price of Crude Oil on World Market = 69 US-Cents/Litre); 105 – benchmark (Retail price of Diesel in the United States = 105 US-Cents/Litre); 164 – benchmark (Retail price of Diesel in Luxembourg = 164 US-Cents/Litre).Figure 19 (R): 69 – benchmark line (Price of Crude Oil on World Market = 69 US-Cents/Litre); 97 – benchmark (Retail price of Gasoline in the United States = 97 US-Cents/Litre); 164 – benchmark (Retail price of Gasoline in Luxembourg = 164 US-Cents/Litre).
ACCESSIBILITY IN CITIES TRANSPORT AND URBAN FORM WWW.NEWCLIMATEECONOMY.NET 61
18. The current difference between carbon emission standards required by the European Union and the United States will provide important lessons. In Europe, average fleet emission standards need to be met by individual automobile manufactures (OJEU 2009) whereas in the US, manufacturers producing vehicles above the average emission target can purchase ‘emission permits’ from vehicle producers significantly outperforming these standards (An et al 2011; Hansjeurgens 2010). As a result, innovation in Europe is internalised and mainstreamed within each manufacturer whereas in the US innovation is ‘supercharged’ and concentrated within a few more radical producers that have recently entered the market, above all Tesla (Sperling and Nichols 2012).