access for ells 2013 statewide results · 2013 access for ells statewide results: massachusetts 4...
TRANSCRIPT

ACCESS for ELLs 2013 Statewide Results
October 2013 Massachusetts Department of Elementary and Secondary Education 75 Pleasant Street, Malden, MA 02148 Phone 781-338-3000 TTY: N.E.T. Relay 800-439-2370 www.doe.mass.edu
This document was prepared by the Massachusetts Department of Elementary and Secondary Education
Mitchell D. Chester, Ed.D. Commissioner
The Massachusetts Department of Elementary and Secondary Education, an affirmative action employer, is committed to ensuring that all of its programs and facilities are accessible to all members of the public.
We do not discriminate on the basis of age, color, disability, gender identity, national origin, race, religion, sex, or sexual orientation.
Inquiries regarding the Department’s compliance with Title IX and other civil rights laws may be directed to the Human Resources Director, 75 Pleasant St., Malden, MA 02148 781-338-6105.
© 2013 Massachusetts Department of Elementary and Secondary Education Permission is hereby granted to copy any or all parts of this document for non-commercial educational purposes. Please
credit the “Massachusetts Department of Elementary and Secondary Education.”
Massachusetts Department of Elementary and Secondary Education 75 Pleasant Street, Malden, MA 02148-4906
Phone 781-338-3000 TTY: N.E.T. Relay 800-439-2370 http://www.doe.mass.edu/

Commissioner’s Foreword
Dear Colleagues: I am pleased to provide you with the statewide results from the 2013 Assessing Comprehension and Communication in English State-to-State for English Language Learners (ACCESS for ELLs) tests, which are intended to measure the language proficiency of English language learner (ELL) students. The ACCESS for ELLs tests were given in Massachusetts for the first time in 2013, replacing the Massachusetts English Proficiency Assessment (MEPA) tests, which were given from 2005–2012. ACCESS for ELLs tests measure how well ELL students have achieved the English Language Development Standards developed by the World-Class Instructional Design and Assessment (WIDA) consortium. The WIDA standards focus on the development of academic language skills by ELLs, and replace the Massachusetts English Language Proficiency Benchmarks and Outcomes for English Language Learners (2003). Massachusetts adopted the WIDA standards and assessments because they are aligned with the 2011 Massachusetts Curriculum Frameworks which incorporate the Common Core State Standards. All Massachusetts ELL students in grades K–12 whose education is publicly funded must participate in ACCESS for ELLs. I am pleased to note that the overall participation rate on 2013 English language proficiency tests increased two percentage points from 95 percent in the 2012 MEPA tests to 97 percent in the 2013 ACCESS for ELLs tests, and has increased five percentage points overall since 2010. This report summarizes the results of more than 69,000 ELL students who participated in the tests, and the progress they have made toward attaining English language proficiency. In order to determine whether progress was made, a linking study was conducted to ensure accurate comparisons could be made between the results of the 2013 ACCESS for ELLs tests and the results of spring 2012 MEPA tests. Thank you for your contribution to the education of English language learner students in Massachusetts, and for making the necessary adjustments to enable a smooth transition to the ACCESS for ELLs tests. I hope you find this report informative and useful. Sincerely, Mitchell D. Chester, Ed.D. Commissioner of Elementary and Secondary Education

Table of Contents Commissioner’s Foreword Executive Summary ...................................................................................................................... 1 I. Background ........................................................................................................................... 4 II. Summary of the 2013 Statewide ACCESS For ELLs Results .......................................... 6
Student Participation ................................................................................................................................ 6 Student Performance ................................................................................................................................ 6 Determining the Progress of ELL Students in Learning English: Bridge Study.................. 12 Progress of ELL Students in Learning English..................................................................12
III. Performance of ELL Students from the State’s Highest-Incidence First Language
Groups................................................................................................................................. 14 Appendix A. ACCESS for ELLs Proficiency Level Cut Scores by Grade Level for Overall (Composite) Score ........................................................................................................................ 21 Appendix B. Performance Definitions for the Levels of English Language Proficiency ............. 22 Appendix C. Features of the ACCESS for ELLs Tests ................................................................ 23 Appendix D. Number and Percentage of Enrolled ELL Students by 20 Highest-Incidence First (Native) Languages ....................................................................................................................... 24

2013 ACCESS for ELLs Statewide Results: MASSACHUSETTS 1
Executive Summary
The ACCESS for ELLs tests were given in Massachusetts for the first time in 2013, replacing the Massachusetts English Proficiency Assessment (MEPA) tests that had been given annually since 2005. The ACCESS for ELLs tests are administered in approximately thirty member states of the WIDA consortium, including Massachusetts. The tests measure the performance and progress of Massachusetts ELL students in learning English. State and federal laws require that states test and report annually on the performance of ELL students in the domains of reading, writing, listening, and speaking, and on their progress toward achieving English proficiency. The ACCESS for ELLs tests are administered in order to comply with these federal and state assessment requirements, and to
• assist in determining the level of English proficiency of ELL students; • measure student, school, and district performance on the WIDA standards on which the
assessments are based; • improve student achievement and classroom instruction by providing feedback with
respect to the acquisition of knowledge and skills in English. ACCESS for ELLs is composed of four separate tests in reading, writing, listening, and speaking that are administered annually to ELL students in grades kindergarten through grade 12 in the following grade-level clusters: kindergarten, grades 1–2, 3–5, 6–8, and 9–12. Results are reported at six performance levels (Levels 1−6), and on a numerical scale from 100 to 600. The ACCESS for ELLs tests were administered in Massachusetts during a five-week period in January and February 2013. Major Findings
• In 2013, 69,089 of the 71,114 ELL students in grades K–12 participated in all four sections of the ACCESS for ELLs tests, a participation rate of 97 percent, an increase of two percentage points from participation in the MEPA tests in 2012.
• A comparison of the percentage of students who performed at each Level on MEPA in 2012 and ACCESS for ELLs in 2013 reveals a variable pattern. (See Figure 1, which compares the levels of student performance in both assessments.) In MEPA students performed at Levels 1 through 5, while in ACCESS for ELLs there are six levels of performance. In general, a slightly higher percentage of students attained higher performance Levels on 2012 MEPA than in ACCESS for ELLs, but the reverse is the case in some instances. Comparisons should be made with caution, in consideration of the difference in the standards assessed. While both assessments tested English proficiency, MEPA assessed only Language Arts while ACCESS for ELLs also assessed the use of English in Mathematics, Social Studies, Science, and Social and Instructional Settings.
• The combined percentage of students at Level 5 and Level 6 in ACCESS for ELLs varied by grade level, ranging from 5 percent in kindergarten to 40 percent in grade level 4 (see Figure 1). Generally, a student who attains an overall score of Level 5 or Level 6, and also attains a Literacy Composite score (Reading + Writing) of 4.0 or above, is likely to be able to perform ordinary classroom work in English and is recommended for reclassification as a student who is no longer reported as an English language learner.

2013 ACCESS for ELLs Statewide Results: MASSACHUSETTS 2
Figure 1. Percentage of Students in Each Performance Level on the 2012 MEPA and 2013 ACCESS for ELLs (Grades K−12)
2012MEPA
2013ACCESS
2012MEPA
2013ACCESS
2012MEPA
2013ACCESS
2012MEPA
2013ACCESS
2012MEPA
2013ACCESS
2012MEPA
2013ACCESS
2012MEPA
2013ACCESS
Grade K Grade 1 Grade 2 Grade 3 Grade 4 Grade 5 Grade 6
Level 6 1 1 3 10 13 12 3
Level 5 0 4 5 3 26 10 16 29 33 27 35 26 41 16
Level 4 7 8 33 15 44 29 56 37 49 35 38 35 33 38
Level 3 46 13 49 54 25 45 19 16 12 17 17 17 15 29
Level 2 35 16 10 22 4 10 5 6 4 5 6 6 6 11
Level 1 12 59 3 5 2 4 4 2 3 3 4 4 4 4
0%10%20%30%40%50%60%70%80%90%
100%
Perc
ent o
f Stu
dent
s
Grades K-6
2012MEPA
2013ACCESS
2012MEPA
2013ACCESS
2012MEPA
2013ACCESS
2012MEPA
2013ACCESS
2012MEPA
2013ACCESS
2012MEPA
2013ACCESS
Grade 7 Grade 8 Grade 9 Grade 10 Grade 11 Grade 12
Level 6 2 2 3 5 5 6
Level 5 32 13 36 8 26 10 26 14 26 12 33 11
Level 4 29 31 27 28 44 29 20 25 20 25 26 27
Level 3 24 35 21 35 25 45 36 29 37 30 36 33
Level 2 9 13 10 19 4 10 10 20 10 20 4 18
Level 1 6 6 6 8 2 4 8 7 6 9 1 6
0%
10%
20%
30%
40%
50%
60%
70%
80%
90%
100%
Perc
ent o
f Stu
dent
s
Grades 7-12
N/A N/A N/A N/A N/A N/A
N/A N/A N/A N/A N/A N/A N/A

2013 ACCESS for ELLs Statewide Results: MASSACHUSETTS 3
• Performance on the 2013 ACCESS for ELLs tests varied according to the number of years ELL students had been enrolled in Massachusetts schools. The percentages of students who performed at Level 1 and Level 2 generally declined the longer students had been enrolled, and the percentages at Level 5 and Level 6 tended to increase the longer students were enrolled. See Tables 2–6 on pages 7–8.
• A statistical study was conducted to bridge the results of the 2012 MEPA and 2013 ACCESS for ELLs tests in order to determine the attainment of English language skills in 2013 relative to previous years, and the progress made by Massachusetts ELL students in learning English from 2012 to 2013. A student is deemed to have “made progress” if the test results from two successive years showed gains that were sufficient, in general, to move the student from the beginning level of English proficiency to the point at which the student can perform standards-based classroom work in English within five years. Overall, 61 percent of ELL students who participated in both the spring 2012 MEPA tests and 2013 ACCESS for ELLs tests made progress toward attaining English proficiency (see Figure 2). The percentage of students in 2012 who made progress was 63 percent overall. In 2013, the percentage making progress varied by grade level, from 45 to 72 percent. Figure 2 shows the statewide progress by grade level. See pages 12–13 for an explanation of the approach used to determine progress and for additional data on the progress made by ELL students in 2013.
Figure 2. 2013 Statewide Progress Rates by Grade Based on Linked 2012 MEPA and 2013 ACCESS for ELLs Scores
0 10 20 30 40 50 60 70 80
Total121110
987654321K
Percent of students who made progress since spring 2012

2013 ACCESS for ELLs Statewide Results: MASSACHUSETTS 4
I. Background
ACCESS for ELLs consists of four separate sub-domain tests in reading, writing, listening, and speaking. Only students who participate in all four domains receive an overall score. Students participate in tests intended for specific grade-level clusters: kindergarten, grades 1–2, 3–5, 6–8, and 9–12, and take either Tier A, B, or C, depending on their level of English language proficiency. A tier is selected to ensure an appropriate testing experience for each student across a full range of language proficiency (except for students in kindergarten who do not take tiered tests). Schools have the option of using the WIDA Access Placement Test (W-APT), a screening and placement test, to identify and place incoming ELL students and to assist in determining the most appropriate ACCESS for ELLs test tier to administer. Additional guidance was provided to schools for the selection of tiered tests for their students, based on students’ previous (2012) MEPA test scores, as follows: Tier A, for beginning ELLs, is appropriate for students who:
• received a score of Level 1 or Level 2 Low on the 2012 MEPA test Tier B, the level that is typically assigned to most ELL students, is appropriate for ELL students who:
• received a score of Level 2 High or Level 3 on the 2012 MEPA test Tier C is appropriate for students who will likely meet the criteria to exit ELL status by the end of the academic year and who:
• received a score of high Level 4 or Level 5 on the 2012 MEPA test School staff were required to participate in online training modules and become certified to administer the tests by scoring at or above 80 percent correct on the certification quizzes. Prospective test administrators were required to participate in one or more of following training modules, depending on the tests they would administer:
• Group-administered Reading, Writing, and Listening tests • Individually-administered Speaking tests (this module includes information regarding the
use of the Speaking Test Rubric and review of student oral response samples) • Individually-administered Kindergarten tests
The requirement to administer the Listening and Speaking portions of the ACCESS for ELLs assessment represents a significant change from the MELA-O assessment administered in 2005-2012 as part of MEPA, which required a trained administrator to apply the MELA-O Scoring Matrix during class observations. Assessment scores were reported in the four domains of listening, speaking, reading, and writing in one of six WIDA English Language Proficiency Levels: 1-Entering, 2-Emerging, 3-Developing, 4-Expanding, 5-Bridging, and 6-Reaching (see Appendix B for a description of each). Students received scaled scores between 100−600 in each domain. Proficiency level scores are also reported as whole numbers followed by a decimal (e.g., 3.4). The whole number indicates the student’s language proficiency level based on scaled scores and the Performance Definitions for the Levels of English Language Proficiency found in Appendix B. The decimal

2013 ACCESS for ELLs Statewide Results: MASSACHUSETTS 5
indicates the relative position within the proficiency level of the student’s scale score, rounded to the nearest tenth. An overall composite score, combining the four domain scores, was also reported in one of the six proficiency levels, as were composite scores derived from a combination of weighted scale scores in the following areas:
• Oral Language, combining equally weighted scale scores from Listening (50%) and Speaking (50%);
• Literacy, combining equally weighted scale scores from Reading (50%) and Writing (50%); • Comprehension, combining scale scores for Listening (30%) and Reading (70%).
The Department recommended that districts consider exiting students from ELL status when they met the following criteria, based on the likelihood that they will be able to perform standards-based classroom work in English:
• Overall (Composite) score of 5.0, and • Composite Literacy score (Reading and Writing) of 4.0 or higher
However, the use of other relevant data was also recommended before exiting a student from ELL language status, including:
• observations by, and the judgment of, teachers; • student’s classwork; • MCAS and other diagnostic test results.

2013 ACCESS for ELLs Statewide Results: MASSACHUSETTS 6
II. Summary of the 2013 Statewide ACCESS for ELLs Results
Student Participation
Participation in the 2013 ACCESS for ELLs tests is summarized below and includes students in grades K−12 who participated in all four test domains―reading, writing, listening, and speaking. Table 1 provides the number and percentage of ELL students who participated in the 2013 ACCESS for ELLs tests by grade cluster and years of enrollment in Massachusetts. Note that the number of students tested by years of enrollment may not equal the total for all students because number of years of enrollment was not available for some students.
Table 1. Participation of ELL Students in 2013 ACCESS for ELLs by Grade Cluster and Years of Enrollment in Massachusetts
Grade Cluster/ Years of
Enrollment
Grade K
Grades 1-2
Grades 3-5
Grades 6–8
Grades 9–12 Total
# % # % # % # % # % # % First Year 8,971 98 1,624 99 1,772 99 1,720 99 2,597 97 16,684 98
Second Year 388 100 8,224 99 1,500 99 1,463 98 2,225 96 13,800 98 Third Year 4 100 6,551 99 1,633 99 1,339 98 2,040 95 11,567 98
Fourth Year 1 100 812 99 5,178 99 1,026 97 1,417 92 8,434 98 Fifth Year or More 0 0 10 91 8,208 99 6,364 96 2,874 86 17,456 96
All Students 9,375 98 17,239 99 18,319 99 11,946 97 12,210 91 69,089 97
In 2013, grade clusters 1–2 and 3–5 had the highest participation rate at 99 percent, and grade span 9–12 had the lowest at 91 percent. The participation rate by years of enrollment in grade clusters 6–8 and 9–12 declined for students the longer they received language services. This was particularly evident in grade cluster 9–12, where 97 percent in their first year of enrollment participated compared to 86 percent in their fifth year of enrollment. In 2013, there were 1,353 students, or about 2 percent of all ELLs, who received Speaking and Listening subscores, but did not participate in the Reading and Writing subsection tests. These students did not receive an overall ACCESS for ELLs score for the 2013 test and were therefore not included as tested students for 2013. Student Performance
Results for the 2013 ACCESS for ELLs test administrations, disaggregated by years of enrollment for each grade cluster, are summarized below. Results are not reported if fewer than 10 students were tested. Grade K At the Kindergarten level, one percent of all ELL students who participated in the 2013 ACCESS for ELLs tests performed at Level 6, while 59 percent performed at Level 1. One percent of students in their second year of enrollment performed at Level 6, while 48 percent performed at Level 1. In 2013, a total of 16 percent of ELL students in Kindergarten performed at Level 2, 13 percent at Level 3, 8 percent at Level 4, and 4 percent at Level 5.

2013 ACCESS for ELLs Statewide Results: MASSACHUSETTS 7
Table 2. Performance of ELL Students in 2013 ACCESS for ELLs by Years of Enrollment in Massachusetts:
Kindergarten Years of Enrollment Number
Tested Average Scaled Score
Percentage of Students at Each Performance Level
Level 1 Level 2 Level 3 Level 4 Level 5 Level 6
First Year 8,971 220 60 16 13 8 4 1
Second Year 388 233 48 21 19 8 4 1 Third Year 4 - - - - - - -
Fourth Year 1 - - - - - - - Fifth Year or More 0 - - - - - - -
All Students 9,375 220 59 16 13 8 4 1
Grade Cluster 1–2 At grade cluster 1–2, two percent of participating ELL students performed at Level 6 and 6 percent at Level 5 in 2013 ACCESS for ELLs testing. The largest number of students performed at Level 3. A total of 5 percent performed at Level 1, 16 percent performed at Level 2, 50 percent at Level 3, and 22 percent at Level 4.
Table 3. Performance of ELL Students in 2013 ACCESS for ELLs by Years of Enrollment in Massachusetts:
Grade Cluster 1–2 Years of Enrollment Number
Tested Average Scaled Score
Percentage of Students at Each Performance Level
Level 1 Level 2 Level 3 Level 4 Level 5 Level 6
First Year 1,624 271 29 33 30 7 1 1 Second Year 8,224 290 3 21 55 17 3 1
Third Year 6,551 312 1 8 48 30 10 3 Fourth Year 812 311 1 7 51 30 9 1
Fifth Year or More 10 317 0 0 50 40 10 0 All Students 17,239 297 5 16 50 22 6 2
Grade Cluster 3–5 At grade cluster 3–5, the percentage of participating ELL students who performed at Level 6 in 2013 ACCESS for ELLs testing was 11 percent. The percentage of ELL students performing at Level 5 in this grade cluster was 28. The highest percentage of students, 36 percent, performed at Level 4. A total of 3 percent of ELL students in grade cluster 3–4 performed at Level 1, 6 percent performed at Level 2, 17 percent at Level 3. The majority of students in grade cluster 3–5 performed at Level 4 or above.

2013 ACCESS for ELLs Statewide Results: MASSACHUSETTS 8
Table 4. Performance of ELL Students in 2013 ACCESS for ELLs
by Years of Enrollment in Massachusetts: Grade Cluster 3–5
Years of Enrollment Number
Tested Average Scaled Score
Percentage of Students at Each Performance Level
Level 1 Level 2 Level 3 Level 4 Level 5 Level 6
First Year 1,772 313 20 28 24 20 6 3
Second Year 1,500 337 3 16 28 35 12 7 Third Year 1,633 348 1 6 23 38 22 10
Fourth Year 5,178 347 1 2 14 38 32 13 Fifth Year or More 8,208 360 1 2 14 37 33 13
All Students 18,319 349 3 6 17 36 28 11 Grade Cluster 6–8 At grade cluster 6–8, two percent of participating ELL students performed at Level 6 in 2013 ACCESS for ELLs. The percentage of ELL students performing at Level 5 in grades 6–8 was 13 percent. An equal number of students performed at Levels 3 and Level 4 (33 percent). 14 percent of students performed at Level 2, while 6 percent performed at Level 1.
Table 5. Performance of ELL Students in 2013 ACCESS for ELLs by Years of Enrollment in Massachusetts:
Grade Cluster 6-8 Years of Enrollment Number
Tested Average Scaled Score
Percentage of Students at Each Performance Level
Level 1 Level 2 Level 3 Level 4 Level 5 Level 6
First Year 1,720 335 26 31 24 14 4 2
Second Year 1,463 352 7 27 36 21 7 3 Third Year 1,339 360 2 17 40 30 8 2
Fourth Year 1,026 364 2 12 40 31 13 2 Fifth Year or More 6,364 369 1 6 31 42 17 2
All Students 11,946 360 6 14 33 33 13 2 Grade Cluster 9–12 At grade span 9–12, the percentage of participating ELL students who performed at Level 6 was 5 percent, while 13 percent performed at Level 5. The highest percentage of students performed at Level 3, 28 percent, followed by 23 percent performing at Level 4. Twenty percent of students performed at Level 2 while 10 percent performed at Level 1.
Table 6. Performance of ELL Students in 2013 ACCESS for ELLs by Years of Enrollment in Massachusetts:
Grade Cluster 9-12 Years of Enrollment Number
Tested Average Scaled Score
Percentage of Students at Each Performance Level
Level 1 Level 2 Level 3 Level 4 Level 5 Level 6
First Year 2,597 357 24 31 22 13 7 3
Second Year 2,225 372 10 27 32 19 8 4 Third Year 2,040 381 6 20 32 25 11 6
Fourth Year 1,417 384 4 17 35 27 13 5 Fifth Year or More 2,874 389 4 10 27 30 22 7
All Students 12,210 377 10 20 28 23 13 5

2013 ACCESS for ELLs Statewide Results: MASSACHUSETTS 9
Composite Scores With the transition from MEPA to ACCESS for ELLs, Massachusetts students received three new composite scores, providing added details on their performance. The ACCESS for ELLs composite scores were in oral language, comprehension, and literacy, and were derived from a combination of weighted scale scores from the four language domains as follows:
• Oral Language (Oral Lang)―combining equally weighted scale scores for Listening and Speaking (50% each)
• Comprehension (Compr)―combining scale scores for Listening (30%) and Reading (70%) • Literacy―combining equally weighted scale scores for Reading and Writing (50% each)
Kindergarten
Kindergartners performed best in Oral Language at a proficiency level of 3.8. They attained a proficiency level of 2.6 in Comprehension, which was better than their performance in Literacy at a proficiency level of 2.0.
Table 7. Composite Scores of ELL Students in 2013 ACCESS for ELLs by Years of Enrollment in Massachusetts:
Grade Cluster K
Years of Enrollment
Number Tested
Oral Lang Scale Score
Oral Lang Prof
Level
Compr Scale Score
Compr Prof
Level
Literacy Scale Score
Literacy Prof
Level
First Year 8,971 288 3.8 209 2.6 191 2.0 Second Year 388 303 4.1 223 2.8 204 2.2
Third Year 4 - - - - - - Fourth Year 1 - - - - - -
Fifth Year or More 0 - - - - - - All Students 9,375 289 3.8 209 2.6 191 2.0
Grade Cluster 1–2
For students in grade cluster 1–2, composite scores for Oral Language and Comprehension were the same, at proficiency level 4.4. This was 10 points higher than the Literacy score in this grade cluster, which was level 3.3.
Table 8. Composite Scores of ELL Students in 2013 ACCESS for ELLs by Years of Enrollment in Massachusetts:
Grade Cluster 1–2
Years of Enrollment Number Tested
Oral Lang Scale Score
Oral Lang Prof
Level
Compr Scale Score
Compr Prof
Level
Literacy Scale Score
Literacy Prof
Level
First Year 1,624 286 3.1 275 3.3 265 2.7 Second Year 8,224 322 4.3 289 4.3 276 3.2
Third Year 6,551 343 4.8 314 4.7 299 3.6 Fourth Year 812 344 4.8 314 4.6 298 3.5
Fifth Year or More 10 347 5.0 319 4.9 305 3.7 All Students 17,239 328 4.4 299 4.4 285 3.3

2013 ACCESS for ELLs Statewide Results: MASSACHUSETTS 10
Grade Cluster 3–5 Students in grade cluster 3–5 performed at a Level 4 in all three composite score areas. They performed best in Comprehension at a proficiency level of 4.8. Performance in this grade cluster was slightly better in Oral Language than Literacy, with proficiency levels at 4.7 and 4.5 respectively.
Table 9. Composite Scores of ELL Students in 2013 ACCESS for ELLs by Years of Enrollment in Massachusetts:
Grade Cluster 3–5
Years of Enrollment
Number Tested
Oral Lang Scale Score
Oral Lang Prof
Level
Compr Scale Score
Compr Prof
Level
Literacy Scale Score
Literacy Prof
Level
First Year 1,772 312 3.2 314 3.4 314 3.3 Second Year 1,500 344 4.2 335 4.2 334 4.0
Third Year 1,633 358 4.7 345 4.7 344 4.4 Fourth Year 5,178 359 4.9 343 5.0 343 4.8
Fifth Year or More 8,208 372 5.1 358 5.0 355 4.7 All Students 18,319 359 4.7 346 4.8 345 4.5
Grade Cluster 6–8 For each composite score area, performance improved consistently by year of enrollment for students in grade cluster 6–8. First-year students attained a proficiency level of 3.0 in Oral Language, 3.1 in Comprehension, and 3.0 in Literacy. Students in their fifth year or more of enrollment performed at a proficiency level of 4.9 in Oral Language, 4.2 in Comprehension, and 3.6 in Literacy. All students in grade cluster 6–8 attained their highest composite score in Oral Language at a proficiency level of 4.4, while the proficiency level at 4.1 in Comprehension was followed by a Literacy score of 3.6.
Table 10. Composite Scores of ELL Students in 2013 ACCESS for ELLs by Years of Enrollment in Massachusetts:
Grade Cluster 6–8
Years of Enrollment Number Tested
Oral Scale Score
Oral Perf
Level
Compr Scale Score
Compr Perf
Level
Literacy Scale Score
Literacy Perf
Level
First Year 1,720 325 3.0 338 3.1 339 3.0 Second Year 1,463 353 3.8 353 3.6 351 3.4
Third Year 1,339 367 4.2 362 4.0 357 3.6 Fourth Year 1,026 376 4.6 367 4.2 359 3.7
Fifth Year or More 6,364 385 4.9 371 4.4 362 3.9 All Students 11,946 370 4.4 362 4.1 357 3.6
Grade Cluster 9–12
Like the performance in grade cluster 6–8, performance improved consistently by year of enrollment in each composite score area for students in grade cluster 9–12. Students in their fifth or more year of enrollment attained a composite Oral Language proficiency level of 4.6, Comprehension proficiency level of 4.4 and Literacy proficiency level of 3.9. Students in their first year of enrollment attained a composite Oral Language proficiency level of 2.0,

2013 ACCESS for ELLs Statewide Results: MASSACHUSETTS 11
Comprehension proficiency level of 3.0, and Literacy proficiency level of 3.3. Significantly, first year students in grade cluster 9–12 were the only students who attained a higher Literacy proficiency level (3.3) than either Oral Language (2.9) or Comprehension (3.0). Overall, students in grade cluster 9–12 achieved their highest composite score in Oral Language at 3.9, followed by a Literacy score of 3.7, and a Comprehension score of 3.6.
Table 11. Composite Scores of ELL Students in 2013 ACCESS for ELLs
by Years of Enrollment in Massachusetts: Grade Cluster 9–12
Years of Enrollment
Number Tested
Oral Lang Scale Score
Oral Lang Prof
Level
Compr Scale Score
Compr Prof
Level
Literacy Scale Score
Literacy Prof
Level
First Year 2,597 335 2.9 354 3.0 368 3.3 Second Year 2,225 362 3.6 365 3.4 376 3.6
Third Year 2,040 378 4.0 374 3.7 382 3.8 Fourth Year 1,417 384 4.2 378 3.8 384 3.8
Fifth Year or More 2,874 393 4.6 382 4.1 387 4.1 All Students 12,210 372 3.9 371 3.6 380 3.7

2013 ACCESS for ELLs Statewide Results: MASSACHUSETTS 12
Determining the Progress of ELL Students in Learning English: Bridge Study As part of the transition from MEPA to ACCESS for ELLs, the Department undertook a statistical study to develop “concordance tables” listing the comparable scores of the MEPA tests (given between 2005–2012) and the 2013 ACCESS for ELLs tests. This was necessary in order to provide the basis for determining progress made by Massachusetts ELLs in learning English from 2012 to 2013. This bridge study included the following components:
• Separate equipercentile scales (i.e., a percentile ranking of scores) for the 2013 ACCESS results and the 2012 MEPA results, in order to compare the results by percentile rank;
• Concordance tables based on the equivalent percentile rank of scores on each test that showed a cross-referenced comparison of the 2013 ACCESS for ELLs and 2012 MEPA scaled scores and proficiency levels for students in each grade;
• Criteria for determining attainment of English proficiency, using the 2013 ACCESS for ELLs test scores, the concordance tables, and the existing rules for determining attainment that were approved for MEPA;
• Criteria for determining progress in learning English using a comparison of each student’s 2012 MEPA score and his or her 2013 ACCESS for ELLs score converted to the equivalent MEPA score on the concordance table. The existing MEPA “step approach” rules were applied to the 2012 and 2013 equated results to determine whether students, schools, districts, and the state made progress.
The Bridge Study Linking the Results of 2012 MEPA and 2013 ACCESS for ELLs is available at http://www.doe.mass.edu/mcas/access/, and includes details on the information described above and the concordance tables showing estimates of the equivalent scores on the 2012 MEPA and 2013 ACCESS for ELLs tests. Progress of ELL Students in Learning English The percentages of students making progress is shown in Table 13 and was calculated for students in each grade, based on the number of years in a Massachusetts school. Overall, 61 percent of ELL students who participated in the 2013 ACCESS for ELLs tests and who also participated in the spring 2012 MEPA tests made progress toward attaining English proficiency. Progress varied by grade span, with 66 percent making progress at kindergarten, 69 percent at grade cluster 1–2, 57 percent at grade cluster 3–5, 59 percent at grade cluster 6–8, and 55 percent at grade cluster 9–12. In general, younger ELL students were more likely to make progress than older ELL students. The number of students in their first year of enrollment was too low to make reliable judgments. However, students in their second year of enrollment appeared most likely to make progress, followed closely by students in their third year of enrollment. Beyond the second year of enrollment, the longer students had been enrolled, the less likely it was that progress would be made.

2013 ACCESS for ELLs Statewide Results: MASSACHUSETTS 13
Table 12. Progress of ELL Students Participating in Spring 2013 ACCESS for ELLs and Spring 2012 MEPA
by Grade Span and Years of Enrollment in Massachusetts Grade Span / Years of Enrollment
Number of Students Includeda
Percentage of Students Making Progress
Grade K First Year 1 -
Second Year 346 66 Third Year 4 -
Fourth Year - - Fifth Year or More - -
All Studentsb 351 66 Grades 1-2
First Year 7 - Second Year 7,685 68
Third Year 6,265 70 Fourth Year 786 65
Fifth Year or More 9 - All Studentsb 14,754 69
Grades 3-5 First Year 1 -
Second Year 1,339 82 Third Year 1,545 67
Fourth Year 4,980 48 Fifth Year or More 7,899 57
All Studentsb 15,771 57 Grades 6-8
First Year 1 Second Year 1,333 81
Third Year 1,265 66 Fourth Year 985 60
Fifth Year or More 5,968 52 All Studentsb 9,552 59
Grades 9–12 First Year 12 33
Second Year 2,071 71 Third Year 1,933 58
Fourth Year 1,323 50 Fifth Year or More 3,433 46
All Studentsb 8,773 55 Total
First Year 22 45 Second Year 12,774 72
Third Year 11,012 67 Fourth Year 8,074 51
Fifth Year or More 17,309 53 All Studentsb 49,201 61
a This figure represents the number of students tested in spring 2013 who were also tested in spring 2012. b Number of students tested by years of enrollment may not equal the total for all students because number of years of enrollment was not available for some students.

2013 ACCESS for ELLs Statewide Results: MASSACHUSETTS 14
III. Performance of ELL Students from the State’s Highest-Incidence First Language Groups
Tables 14–20 display the results of ELL students on the spring 2013 ACCESS for ELLs tests by grade clusters and years of enrollment disaggregated for the seven highest incidence first languages of the students participating: Spanish, Portuguese, Haitian Creole, Chinese, Cape Verdean, Vietnamese, and Khmer. Appendix D provides the number and percentage of enrolled ELL students for the 20 highest-incidence first language groups in the state.
Table 13. Performance of ELL Students in 2013 ACCESS for ELLs
by Grade Cluster and Years of Enrollment in Massachusetts First Language: SPANISH
Grade Cluster / Years of Enrollment Number
Tested Average Scaled Score
Percentage of Students at Each Performance Level Level 1 Level 2 Level 3 Level 4 Level 5 Level 6
Grade K First Year 4,503 211 66 14 11 6 2 0
Second Year 255 235 47 22 17 9 3 1 Third Year 3 - - - - - - -
Fourth Year 0 - - - - - - - Fifth Year or More 0 - - - - - - -
All Students 4,762 213 65 15 12 6 2 0 Grade 1-2
First Year 688 263 39 34 24 3 0 0 Second Year 4,168 287 3 25 56 13 2 0
Third Year 3,511 307 1 11 53 26 7 1 Fourth Year 540 312 0 8 52 30 9 1
Fifth Year or More 8 - - - - - - - All Students 8,915 294 5 19 52 18 4 1
Grade 3-5 First Year 738 304 27 32 21 13 5 1
Second Year 754 331 4 20 32 32 9 3 Third Year 786 343 1 7 29 38 19 6
Fourth Year 2,566 343 1 3 18 40 31 8 Fifth Year or More 4,758 357 1 2 16 39 33 9
All Students 9,602 346 3 6 19 37 28 7 Grade 6-8
First Year 805 326 34 34 20 8 2 1 Second Year 735 343 10 36 36 14 3 0
Third Year 696 355 3 22 42 25 7 1 Fourth Year 527 359 3 17 43 25 10 1
Fifth Year or More 3,932 366 1 8 35 40 15 1 All Students 6,712 357 7 16 35 31 11 1
Grade 9-12 First Year 1,096 343 37 35 15 7 4 1
Second Year 1,025 362 16 34 31 13 5 2 Third Year 898 372 8 27 35 19 9 2
Fourth Year 726 380 5 19 35 27 11 3 Fifth Year or More 1,728 386 5 10 28 31 20 6
All Students 6,224 372 13 22 28 22 12 3

2013 ACCESS for ELLs Statewide Results: MASSACHUSETTS 15
Table 14. Performance of ELL Students in 2013 ACCESS for ELLs by Grade Cluster and Years of Enrollment in Massachusetts
First Language: PORTUGUESE Grade Cluster / Years of Enrollment Number
Tested Average Scaled Score
Percentage of Students at Each Performance Level Level 1 Level 2 Level 3 Level 4 Level 5 Level 6
Grade K First Year 874 221 62 16 12 6 3 0
Second Year 36 235 44 19 19 6 11 0 Third Year 1 - - - - - - -
Fourth Year 0 - - - - - - - Fifth Year or More 0 - - - - - - -
All Students 910 222 61 17 12 6 3 0 Grade 1-2
First Year 117 266 25 44 27 4 0 0 Second Year 791 288 3 19 62 15 2 0
Third Year 526 312 1 6 53 29 10 2 Fourth Year 43 312 0 7 49 42 2 0
Fifth Year or More 0 All Students 1,477 296 4 16 56 20 4 1
Grade 3-5 First Year 118 316 19 26 26 20 7 2
Second Year 75 338 1 19 27 32 16 5 Third Year 99 353 1 4 14 40 21 19
Fourth Year 392 348 0 2 11 43 32 13 Fifth Year or More 458 363 0 0 9 41 35 14
All Students 1,142 351 2 5 13 39 29 12 Grade 6-8
First Year 141 336 22 32 30 13 2 1 Second Year 91 362 5 13 37 31 10 3
Third Year 45 373 0 2 36 44 16 2 Fourth Year 50 371 0 6 26 42 22 4
Fifth Year or More 235 375 0 3 20 45 29 3 All Students 562 362 7 12 27 34 17 2
Grade 9-12 First Year 201 365 12 32 29 15 5 5
Second Year 128 384 3 19 24 31 17 5 Third Year 107 389 1 16 27 36 13 7
Fourth Year 47 395 2 2 34 32 17 13 Fifth Year or More 90 399 1 6 19 39 23 12
All Students 587 382 5 19 26 28 14 7
2013 ACCESS for ELLs Statewide Results: MASSACHUSETTS 16
Table 15. Performance of ELL Students in 2013 ACCESS for ELLs
by Grade Cluster and Years of Enrollment in Massachusetts First Language: HAITIAN CREOLE
Grade Cluster / Years of Enrollment Number
Tested Average Scaled Score
Percentage of Students at Each Performance Level Level 1 Level 2 Level 3 Level 4 Level 5 Level 6
Grade K First Year 280 213 67 12 10 9 2 0
Second Year 11 234 36 27 36 0 0 0 Third Year 0 - - - - - - -
Fourth Year 0 - - - - - - - Fifth Year or More 0 - - - - - - -
All Students 291 214 66 13 11 9 2 0 Grade 1-2
First Year 75 272 29 31 29 8 3 0 Second Year 288 289 3 .23 57 13 3 1
Third Year 225 309 1 9 50 32 7 0 Fourth Year 39 306 0 13 62 21 5 0
Fifth Year or More 0 - - - - - - - All Students 627 295 6 18 51 20 5 0
Grade 3-5 First Year 120 309 23 32 24 18 3 1
Second Year 112 340 0 14 28 42 12 4 Third Year 151 349 0 6 21 42 20 11
Fourth Year 246 344 1 2 21 41 27 9 Fifth Year or More 376 356 2 1 15 41 31 10
All Students 1,005 345 4 7 20 38 23 8 Grade 6-8
First Year 113 333 23 35 29 10 3 0 Second Year 113 355 3 14 52 27 4 0
Third Year 146 364 1 7 43 40 10 0 Fourth Year 99 370 0 7 32 37 22 1
Fifth Year or More 276 367 1 5 38 42 13 1 All Students 748 360 5 11 39 34 10 1
Grade 9-12 First Year 259 354 23 38 24 10 3 1
Second Year 255 372 7 27 40 17 7 2 Third Year 247 384 5 12 36 28 15 4
Fourth Year 122 386 4 10 37 25 19 5 Fifth Year or More 177 388 6 10 30 29 21 5
All Students 1,093 375 10 21 33 21 12 3

2013 ACCESS for ELLs Statewide Results: MASSACHUSETTS 17
Table 16. Performance of ELL Students in 2013 ACCESS for ELLs by Grade Cluster and Years of Enrollment in Massachusetts
First Language: CHINESE Grade Cluster / Years of Enrollment Number
Tested Average Scaled Score
Percentage of Students at Each Performance Level Level 1 Level 2 Level 3 Level 4 Level 5 Level 6
Grade K First Year 606 237 44 15 18 14 8 1
Second Year 2 - - - - - - - Third Year 1 - - - - - - -
Fourth Year 0 - - - - - - - Fifth Year or More 0 - - - - - - -
All Students 609 237 44 15 18 14 8 1 Grade 1-2
First Year 110 279 19 31 35 11 1 4 Second Year 492 300 0 11 51 25 8 4
Third Year 383 326 1 1 28 42 16 13 Fourth Year 15 313 13 0 40 27 13 7
Fifth Year or More 0 - - - - - - - All Students 1,000 308 3 9 40 30 11 8
Grade 3-5 First Year 99 324 10 21 33 25 3 7
Second Year 55 346 2 4 35 36 11 13 Third Year 88 363 0 0 8 38 24 31
Fourth Year 327 358 1 1 6 28 33 30 Fifth Year or More 334 373 1 0 4 27 31 37
All Students 904 359 2 3 10 29 27 29 Grade 6-8
First Year 113 333 23 35 29 10 3 0 Second Year 113 355 3 14 52 27 4 0
Third Year 146 364 1 7 43 40 10 0 Fourth Year 99 370 0 7 32 37 22 1
Fifth Year or More 276 367 1 5 38 42 13 1 All Students 427 365 6 12 26 34 14 8
Grade 9-12 First Year 203 377 10 20 27 26 9 7
Second Year 133 384 4 26 24 25 11 11 Third Year 152 396 4 10 23 32 10 22
Fourth Year 109 390 3 14 32 28 9 14 Fifth Year or More 87 400 3 9 16 24 22 25
All Students 701 388 5 16 25 27 12 15

2013 ACCESS for ELLs Statewide Results: MASSACHUSETTS 18
Table 17. Performance of ELL Students in 2013 ACCESS for ELLs by Grade Cluster and Years of Enrollment in Massachusetts
First Language: CAPE VERDEAN Grade Cluster / Years of Enrollment Number
Tested Average Scaled Score
Percentage of Students at Each Performance Level Level 1 Level 2 Level 3 Level 4 Level 5 Level 6
Grade K First Year 266 213 61 17 14 6 2 1
Second Year 16 221 69 13 13 0 0 6 Third Year 0 - - - - - - -
Fourth Year 0 - - - - - - - Fifth Year or More 0 - - - - - - -
All Students 282 214 61 17 13 6 2 1 Grade 1-2
First Year 51 249 61 29 8 2 0 0 Second Year 238 286 2 30 54 13 1 0
Third Year 191 309 1 9 48 36 5 1 Fourth Year 26 310 4 4 50 38 4 0
Fifth Year or More 0 - - - - - - - All Students 506 292 8 21 47 22 2 0
Grade 3-5 First Year 64 283 44 38 17 0 0 2
Second Year 66 321 5 38 39 17 2 0 Third Year 64 339 0 14 31 34 20 0
Fourth Year 188 344 1 1 22 39 29 7 Fifth Year or More 362 356 1 2 19 37 33 7
All Students 744 342 5 9 23 33 25 5 Grade 6-8
First Year 97 315 44 40 15 0 0 0 Second Year 81 345 5 43 33 17 1 0
Third Year 88 356 2 19 50 26 1 1 Fourth Year 68 362 1 9 50 28 12 0
Fifth Year or More 314 370 0 4 32 48 15 0 All Students 648 356 8 17 34 32 9 0
Grade 9-12 First Year 183 352 21 44 26 7 1 0
Second Year 180 373 4 29 41 18 7 1 Third Year 161 380 2 19 41 24 11 2
Fourth Year 133 380 3 17 51 20 7 3 Fifth Year or More 228 389 2 11 32 33 18 4
All Students 916 376 6 23 37 22 10 2
2013 ACCESS for ELLs Statewide Results: MASSACHUSETTS 19
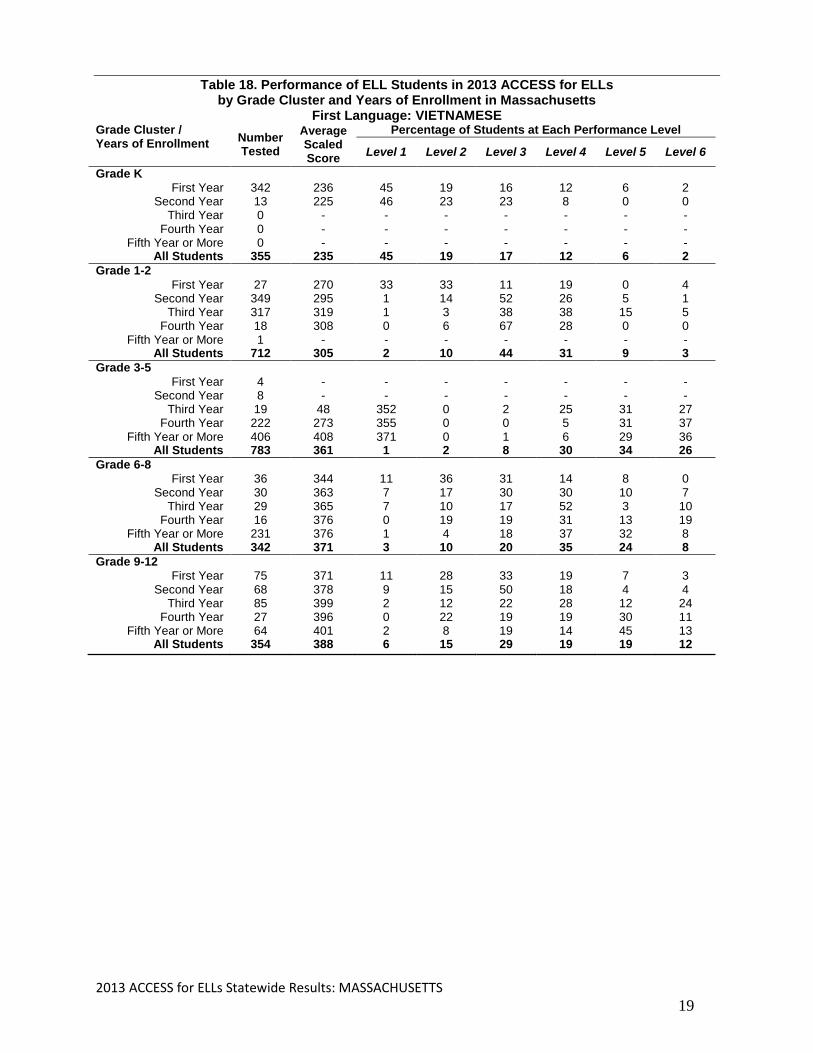
Table 18. Performance of ELL Students in 2013 ACCESS for ELLs
by Grade Cluster and Years of Enrollment in Massachusetts First Language: VIETNAMESE
Grade Cluster / Years of Enrollment Number
Tested Average Scaled Score
Percentage of Students at Each Performance Level Level 1 Level 2 Level 3 Level 4 Level 5 Level 6
Grade K First Year 342 236 45 19 16 12 6 2
Second Year 13 225 46 23 23 8 0 0 Third Year 0 - - - - - - -
Fourth Year 0 - - - - - - - Fifth Year or More 0 - - - - - - -
All Students 355 235 45 19 17 12 6 2 Grade 1-2
First Year 27 270 33 33 11 19 0 4 Second Year 349 295 1 14 52 26 5 1
Third Year 317 319 1 3 38 38 15 5 Fourth Year 18 308 0 6 67 28 0 0
Fifth Year or More 1 - - - - - - - All Students 712 305 2 10 44 31 9 3
Grade 3-5 First Year 4 - - - - - - -
Second Year 8 - - - - - - - Third Year 19 48 352 0 2 25 31 27
Fourth Year 222 273 355 0 0 5 31 37 Fifth Year or More 406 408 371 0 1 6 29 36
All Students 783 361 1 2 8 30 34 26 Grade 6-8
First Year 36 344 11 36 31 14 8 0 Second Year 30 363 7 17 30 30 10 7
Third Year 29 365 7 10 17 52 3 10 Fourth Year 16 376 0 19 19 31 13 19
Fifth Year or More 231 376 1 4 18 37 32 8 All Students 342 371 3 10 20 35 24 8
Grade 9-12 First Year 75 371 11 28 33 19 7 3
Second Year 68 378 9 15 50 18 4 4 Third Year 85 399 2 12 22 28 12 24
Fourth Year 27 396 0 22 19 19 30 11 Fifth Year or More 64 401 2 8 19 14 45 13
All Students 354 388 6 15 29 19 19 12

2013 ACCESS for ELLs Statewide Results: MASSACHUSETTS 20
Table 19. Performance of ELL Students in 2013 ACCESS for ELLs by Grade Cluster and Years of Enrollment in Massachusetts
First Language: KHMER Grade Cluster / Years of Enrollment Number
Tested Average Scaled Score
Percentage of Students at Each Performance Level Level 1 Level 2 Level 3 Level 4 Level 5 Level 6
Grade K First Year 207 221 58 20 15 4 1 1
Second Year 7 - - - - - - - Third Year 0 - - - - - - -
Fourth Year 0 - - - - - - - Fifth Year or More 0 - - - - - - -
All Students 214 221 57 20 17 4 1 1 Grade 1-2
First Year 4 - - - - - - - Second Year 227 288 2 19 64 14 0.01 0.00
Third Year 249 312 1 7 51 32 0.08 0.02 Fourth Year 35 315 0 3 51 34 0.11 0.00
Fifth Year or More 1 - - - - - - - All Students 516 301 1 12 56 24 5 1
Grade 3-5 First Year 4 - - - - - - -
Second Year 8 - - - - - - - Third Year 19 345 0 0 37 42 11 11
Fourth Year 222 346 0 1 11 45 32 11 Fifth Year or More 406 360 0 2 14 42 27 15
All Students 659 355 0 2 14 43 28 13 Grade 6-8
First Year 7 - - - - - - - Second Year 14 349 0 29 64 7 0 0
Third Year 9 - - - - - - - Fourth Year 12 374 0 0 33 33 25 8
Fifth Year or More 413 373 0 1 30 46 19 3 All Students 455 372 0 3 31 44 18 3
Grade 9-12 First Year 12 362 0 67 8 17 8 0
Second Year 21 387 0 10 48 33 10 0 Third Year 13 392 0 0 38 54 8 0
Fourth Year 15 392 7 7 20 47 13 7 Fifth Year or More 74 397 3 1 18 36 34 8
All Students 213 394 3 7 22 36 27 5

2013 ACCESS for ELLs Statewide Results: MASSACHUSETTS 21
Appendix A. ACCESS for ELLs Proficiency Level Cut Scores by Grade Level for Overall (Composite) Score
Six WIDA English Language Proficiency levels are used to report ACCESS for ELLs results: 1-Entering, 2-Emerging, 3-Developing, 4-Expanding, 5-Bridging, and 6-Reaching. The cut score levels (based on scaled scores) used for the Overall Scores for each grade level are shown below: ACCESS for ELLs Proficiency Level
Cut Scores
Grade Level
1.0 2.0 3.0 4.0 5.0 6.0
K 145 237 263 288 307 329 1 162 249 277 303 321 344 2 166 261 290 316 335 357 3 174 272 303 328 347 369 4 179 283 314 340 359 380 5 185 293 324 350 369 390 6 191 302 334 359 379 399 7 197 311 342 368 386 407 8 203 319 350 375 394 414 9 208 327 357 382 400 419 10 214 333 363 387 405 424 11 220 340 368 391 409 427 12 226 346 372 395 413 430

2013 ACCESS for ELLs Statewide Results: MASSACHUSETTS 22
Appendix B. Performance Definitions for the Levels of English Language Proficiency At the given level of English language proficiency, English language learners will process, understand, produce, or use:
6 - Reaching
• specialized or technical language reflective of the content area at grade level
• a variety of sentence lengths of varying linguistic complexity in extended oral or written discourse as required by the specified grade level
• oral or written communication in English comparable to proficient English peers
5 - Bridging • specialized or technical language of the content areas • a variety of sentence lengths of varying linguistic complexity in
extended oral or written discourse, including stories, essays, or reports • oral or written language approaching comparability to that of English
proficient peers when presented with grade-level material 4 - Expanding • specific and some technical language of the content areas
• a variety of sentence lengths of varying linguistic complexity in oral discourse or multiple, related sentences or paragraphs
• oral or written language with minimal phonological, syntactic, or semantic errors that do not impede the overall meaning of the communication when presented with oral or written connected discourse with sensory, graphic, or interactive support
3 - Developing • general and some specific language of the content areas • expanded sentences in oral interaction or written paragraphs • oral or written language with phonological, syntactic, or semantic errors
that may impede the communication, but retain much of its meaning, when presented with oral or written, narrative, or expository descriptions with sensory, graphic, or interactive support
2 - Emerging • general language related to the content areas • phrases or short sentences • oral or written language with phonological, syntactic, or semantic errors
that often impede the meaning of the communication when presented with one to multiple-step commands, directions, questions, or a series of statements with sensory, graphic, or interactive support
1 - Entering • pictorial or graphic representation of the language of the content areas • words, phrases, or chunks of language when presented with one-step
commands, directions, WH-, choice, or yes/no questions, or statements with sensory, graphic, or interactive support
• oral language with phonological, syntactic, or semantic errors that often impede meaning when presented with basic oral commands, direct questions, or simple statement with sensory, graphic or interactive support

2013 ACCESS for ELLs Statewide Results: MASSACHUSETTS 23
Appendix C. Features of the ACCESS for ELLs Tests
Test Feature Description
Students tested in grade-level clusters
Grades K; 1-2; 3-5; 6-8; 9-12
Tests administered in “Tiers”
Depending on English proficiency level, the student takes a grade-cluster test at either: • Tier A (low English language proficiency) • Tier B (intermediate English language
proficiency) • Tier C (high English language proficiency)
Scores reported as a Proficiency Level
Proficiency Level 1–Level 6 1-Entering, 2-Beginning, 3-Developing, 4-Expanding, 5-Bridging, 6-Reaching Also reported as a whole number and decimal to denote placement within each level; e.g., 3.4
Scores reported as a Scaled Score
Score Range: 100–600
Scores reported to Parent/Guardians, Schools, and Districts
Proficiency levels in: • Each Domain: Reading, Writing, Listening, and
Speaking • Four Composite Areas: − Oral Language (Listening 50% and Speaking
50%) − Literacy (Reading 50% and Writing 50%) − Comprehension (Listening 30% and Reading
70%) − Overall (15% Listening, 15% Speaking, 35%
Reading, and 35% Writing)
Standards Assessed by the Test WIDA English Language Development Standards: • Social and Instructional Language • Language of English Language Arts • Language of Mathematics • Language of Science • Language of Social Studies

2013 ACCESS for ELLs Statewide Results: MASSACHUSETTS 24
Appendix D. Number and Percentage of Enrolled ELL Students by 20 Highest-incidence First (Native) Languages
First Languagea Number Percent 1. Spanish 38,594 53.1 2. Portuguese 4,785 6.6 3. Haitian Creole 3,963 5.5 4 Chinese b 3,714 5.1 5. Cape Verdean 3,243 4.5 6. Vietnamese 2,657 3.7 7. Khmer 2,122 2.9 8. Arabic 2,016 2.8 9. Russian 1,044 1.4 10. Somali 637 .9 11. Nepali 611 .8 12. French 498 .7 13. Korean 488 .7 14. Albanian 449 .6 15. Twi 441 .6 16. Swahili 343 .5 17. Japanese 333 .5 18. Urdu 319 .4 19. Gujarati 294 .4 20. Hindi 252 .3 a Data of the 20 highest-incidence first language groups were based on March 2013 SIMS data. b The Chinese language group includes the students whose first language was reported in SIMS as Chinese, Canton, Mandarin, Fukien, or Taiwanese.