accelerating sustainable shareholder value creation - … · accelerating sustainable shareholder...
TRANSCRIPT
Accelerating sustainable shareholder value creation
Paul Polman / Graeme Pitkethly
6th April 2017
SAFE HARBOUR STATEMENTThis announcement contains forward-looking statements, including 'forward-looking statements' within the meaning of the United States Private Securities Litigation Reform Act of 1995, including statements related to underlying sales growth, underlying operating margin, the benefits of corporate restructuring, restructuring costs, expected dividend increases, our cash conversion ratio and share buy-back. Words such as 'will', 'aim', 'expects', 'anticipates', 'intends', 'looks', 'believes', 'vision', or the negative of these terms and other similar expressions of future performance or results, and their negatives, are intended to identify such forward-looking statements. These forward-looking statements are based upon current expectations and assumptions regarding anticipated developments and other factors affecting the Unilever Group (the 'Group'). They are not historical facts, nor are they guarantees of future performance.
Because these forward-looking statements involve risks and uncertainties, there are important factors that could cause actual results to differ materially from those expressed or implied by these forward-looking statements. Among other risks and uncertainties, the material or principal factors which could cause actual results to differ materially are: Unilever's global brands not meeting consumer preferences; Unilever's ability to innovate and remain competitive; Unilever's investment choices in its portfolio management; inability to find sustainable solutions to support long-term growth; customer relationships; the recruitment and retention of talented employees; disruptions in our supply chain; the cost of raw materials and commodities; the production of safe and high quality products; secure and reliable IT infrastructure; successful execution of acquisitions, divestitures and business transformation projects; economic and political risks and natural disasters; the effect of climate change on Unilever's business; financial risks; failure to meet high and ethical standards; and managing regulatory, tax and legal matters.
These forward-looking statements speak only as of the date of this announcement. Except as required by any applicable law or regulation, the Group expressly disclaims any obligation or undertaking to release publicly any updates or revisions to any forward-looking statements contained herein to reflect any change in the Group's expectations with regard thereto or any change in events, conditions or circumstances on which any such statement is based. Further details of potential risks and uncertainties affecting the Group are described in the Group's filings with the London Stock Exchange, Euronext Amsterdam and the US Securities and Exchange Commission, including in the Annual Report on Form 20-F 2016 and the Unilever Annual Report and Accounts 2016.
Paul Polman
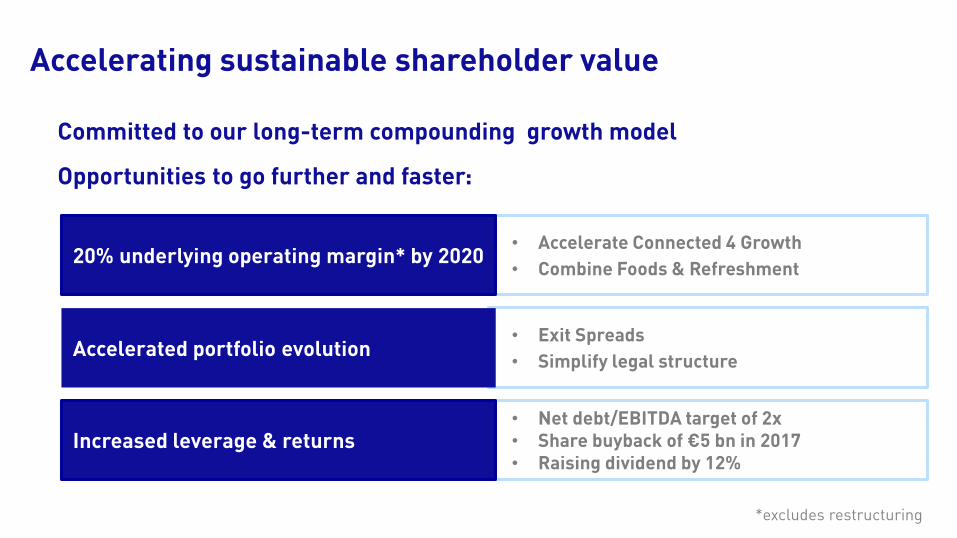
Accelerating sustainable shareholder value
Committed to our long-term compounding growth model
Opportunities to go further and faster:
• Accelerate Connected 4 Growth
• Combine Foods & Refreshment
• Exit Spreads
• Simplify legal structure
• Net debt/EBITDA target of 2x• Share buyback of €5 bn in 2017 • Raising dividend by 12%
20% underlying operating margin* by 2020
Accelerated portfolio evolution
Increased leverage & returns
*excludes restructuring
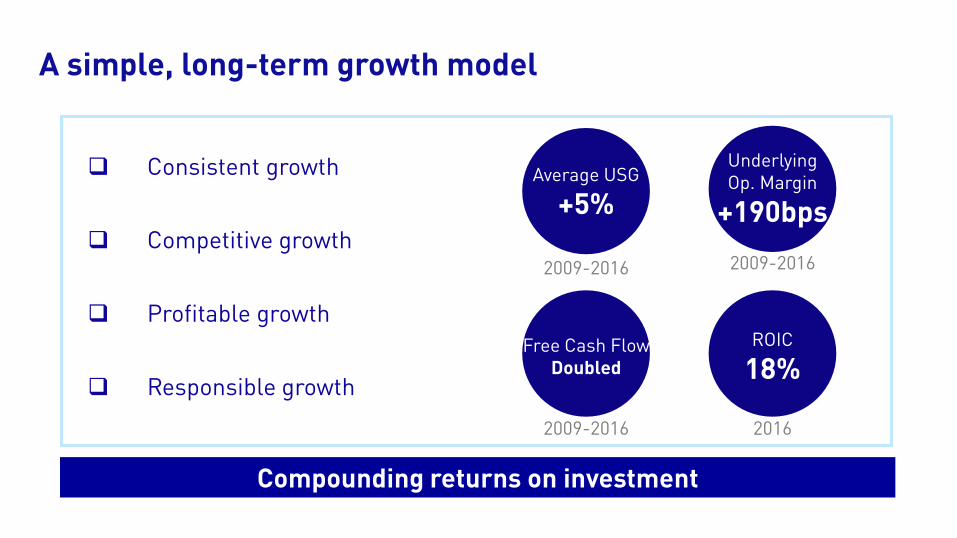
2009-2016 2009-2016
2009-2016
Free Cash FlowDoubled
2016
ROIC
18%
Underlying Op. Margin
+190bps
Average USG
+5%
A simple, long-term growth model
Consistent growth
Competitive growth
Profitable growth
Responsible growth
Compounding returns on investment
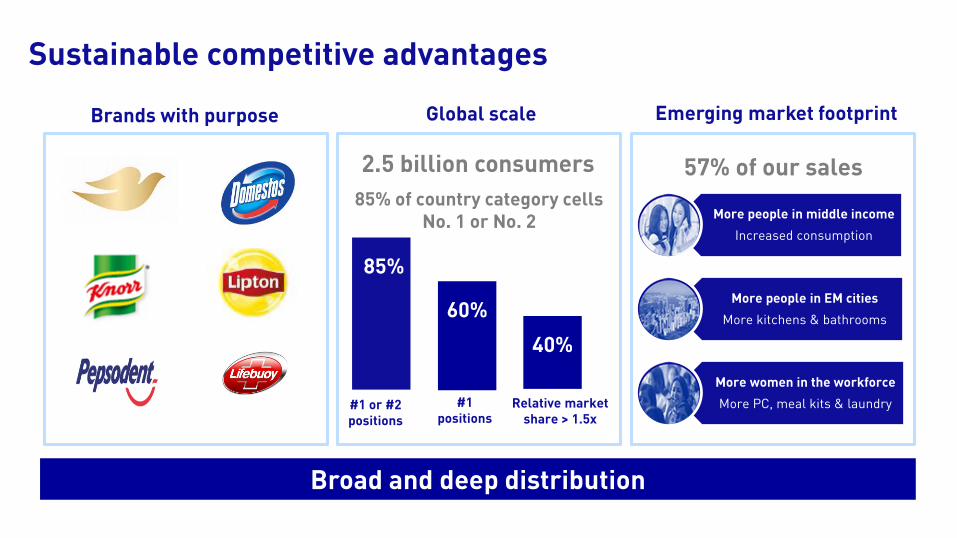
Sustainable competitive advantages
Global scale Emerging market footprint
85% of country category cells No. 1 or No. 2
Brands with purpose
Broad and deep distribution
2.5 billion consumers 57% of our sales
85%
60%
40%
#1 or #2 positions
#1 positions
Relative market share > 1.5x
More people in middle income
Increased consumption
More people in EM cities
More kitchens & bathrooms
More women in the workforce
More PC, meal kits & laundry
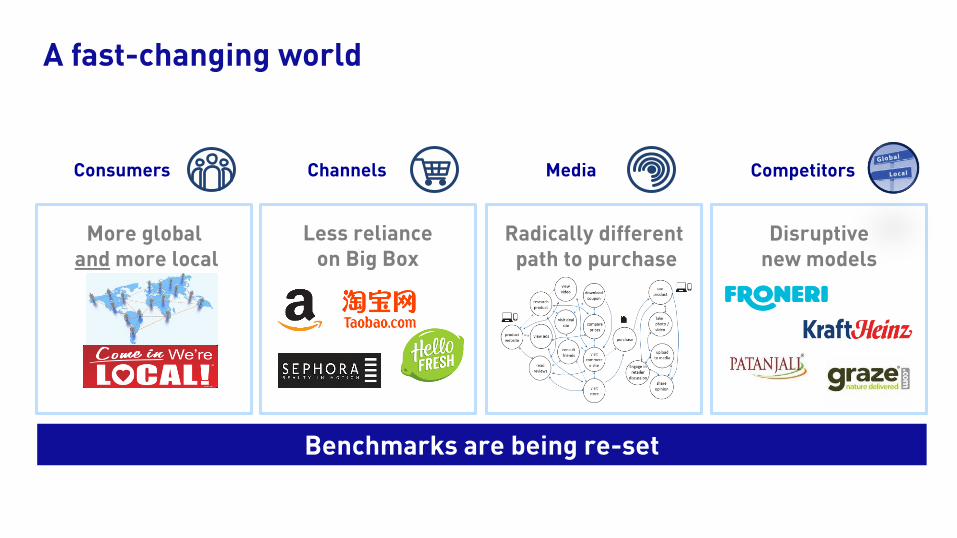
Radically differentpath to purchase
A fast-changing world
Less reliance on Big Box
Consumers MediaChannels Competitors
More globaland more local
Disruptive new models
Benchmarks are being re-set
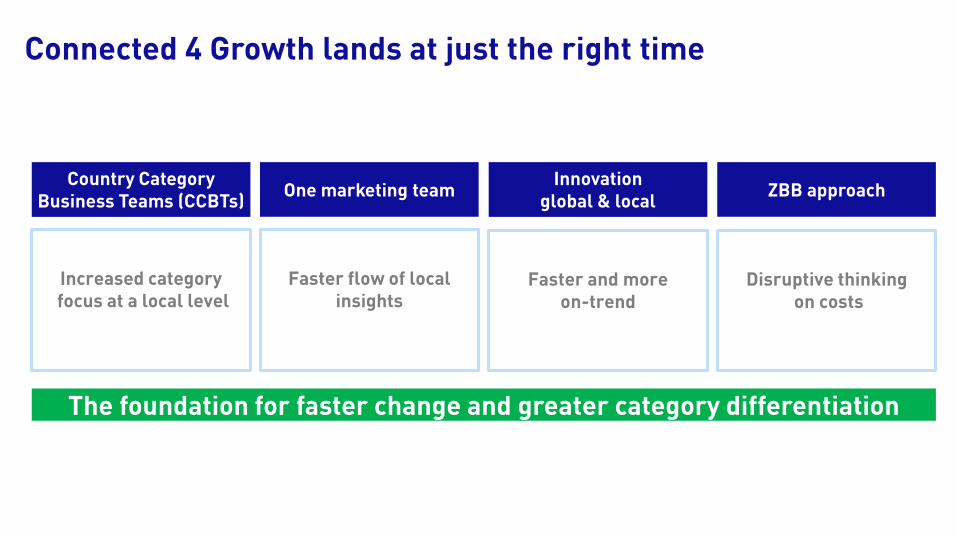
Connected 4 Growth lands at just the right time
Country CategoryBusiness Teams (CCBTs)
ZBB approachOne marketing team Innovation
global & local
The foundation for faster change and greater category differentiation
Increased categoryfocus at a local level
Faster flow of local insights
Faster and more on-trend
Disruptive thinkingon costs
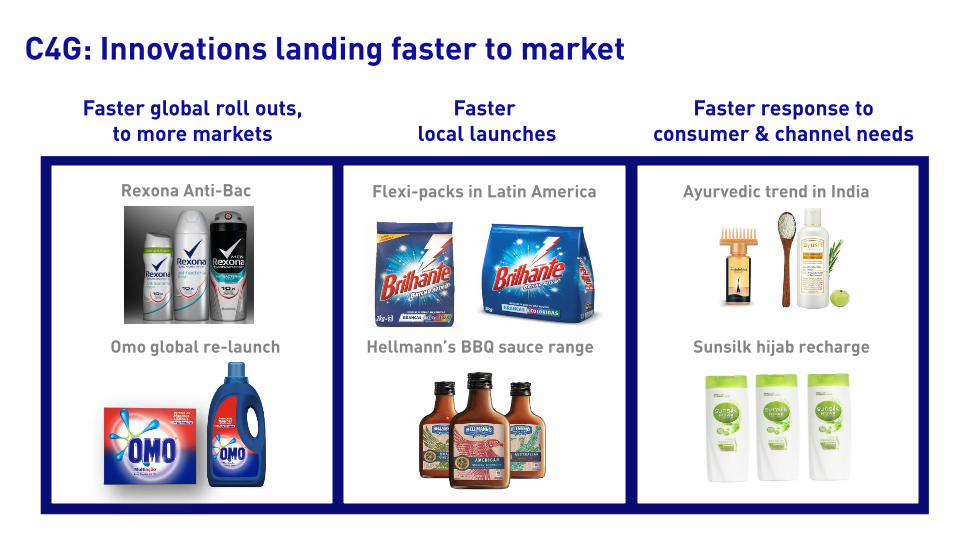
C4G: Innovations landing faster to market
Fasterlocal launches
Faster global roll outs, to more markets
Faster response to consumer & channel needs
Ayurvedic trend in India Flexi-packs in Latin America
Hellmann’s BBQ sauce range
Rexona Anti-Bac
Omo global re-launch Sunsilk hijab recharge
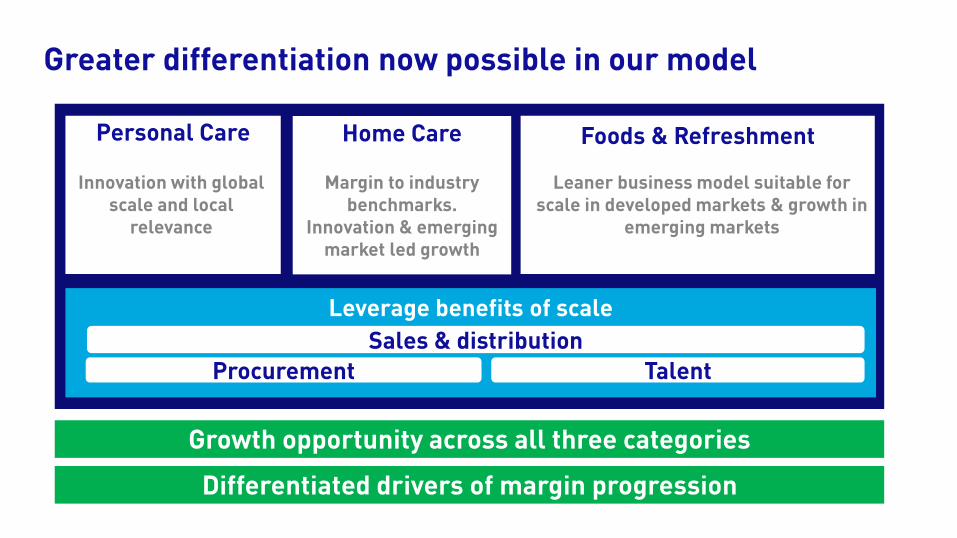
Greater differentiation now possible in our model
Personal Care
Leverage benefits of scale
Sales & distribution
Foods & Refreshment
Procurement Talent
Home Care
Leaner business model suitable for scale in developed markets & growth in
emerging markets
Margin to industry benchmarks.
Innovation & emerging market led growth
Innovation with global scale and local
relevance
Growth opportunity across all three categories
Differentiated drivers of margin progression
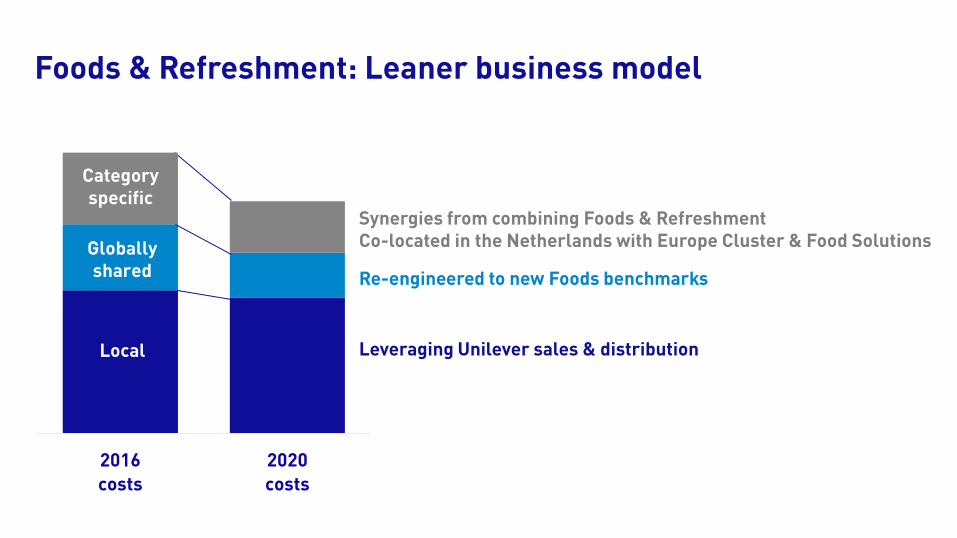
Foods & Refreshment: Leaner business model
2016
costs
2020
costs
Category specific
Globally shared
Local
Re-engineered to new Foods benchmarks
Synergies from combining Foods & Refreshment Co-located in the Netherlands with Europe Cluster & Food Solutions
Leveraging Unilever sales & distribution

December 2014
•Separate unit announced
June 2015
•Set up BCS organisation
2016
•Additional €80m of cash profit
• Continue to pursue bolt-on M&A to reshape
• Sale or de-merger of Spreads
• Board review has concluded that Spreads now better outside Unilever
• €3 billion of Unilever turnover (includes BCS & rest of world Spreads)
More dynamic management of our portfolio
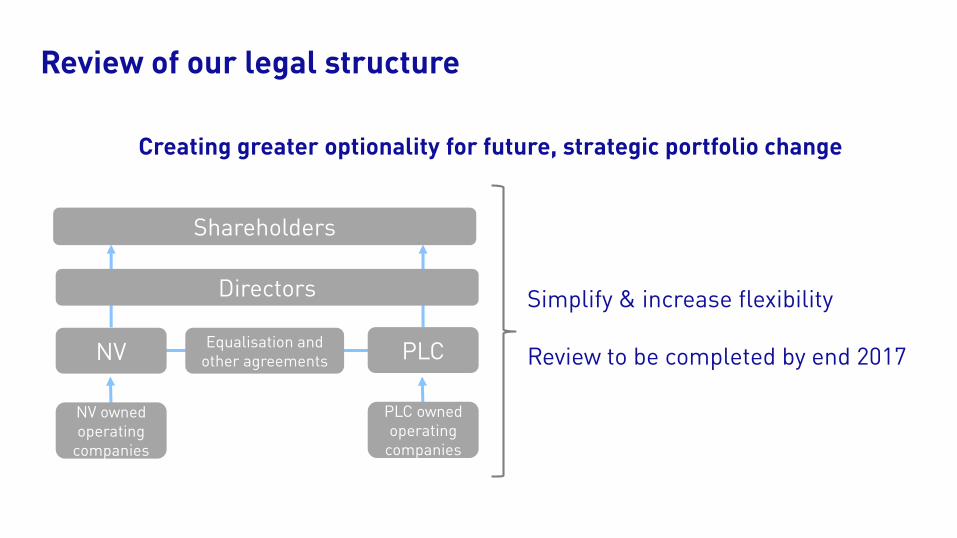
Review of our legal structure
Simplify & increase flexibility
Review to be completed by end 2017
Shareholders
Directors
NVEqualisation and
other agreements PLC
NV owned operating
companies
PLC owned operating
companies
Creating greater optionality for future, strategic portfolio change

Graeme Pitkethly
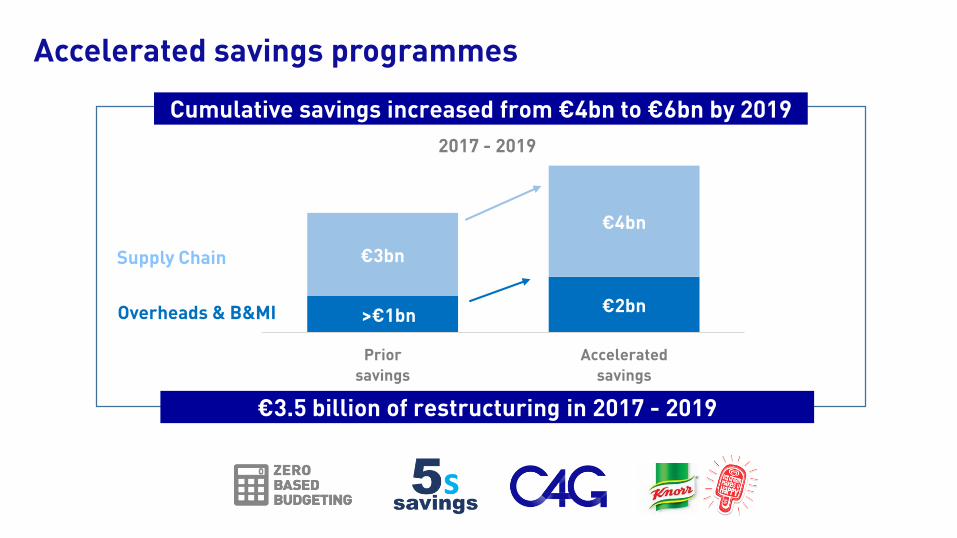
Accelerated savings programmes
Cumulative savings increased from €4bn to €6bn by 2019
>€1bn€2bn
€3bn
€4bn
Prior
savings
Accelerated
savings
Supply Chain
Overheads & B&MI
2017 - 2019
€3.5 billion of restructuring in 2017 - 2019
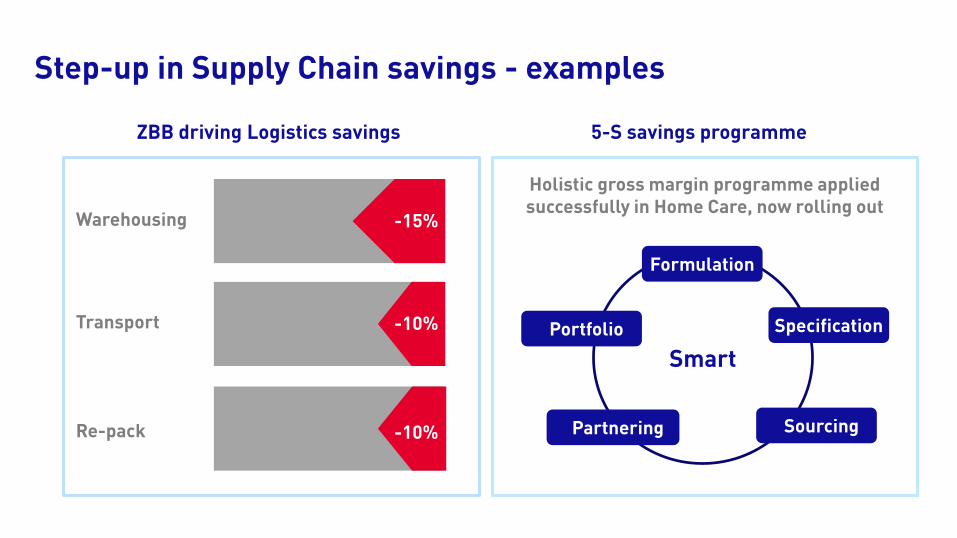
Holistic gross margin programme applied successfully in Home Care, now rolling out
Step-up in Supply Chain savings - examples
ZBB driving Logistics savings 5-S savings programme
Warehousing
Transport
Re-pack
-X%
-15%
-10%
-10%
Smart
Formulation
SourcingPartnering
Portfolio
Formulation
Specification
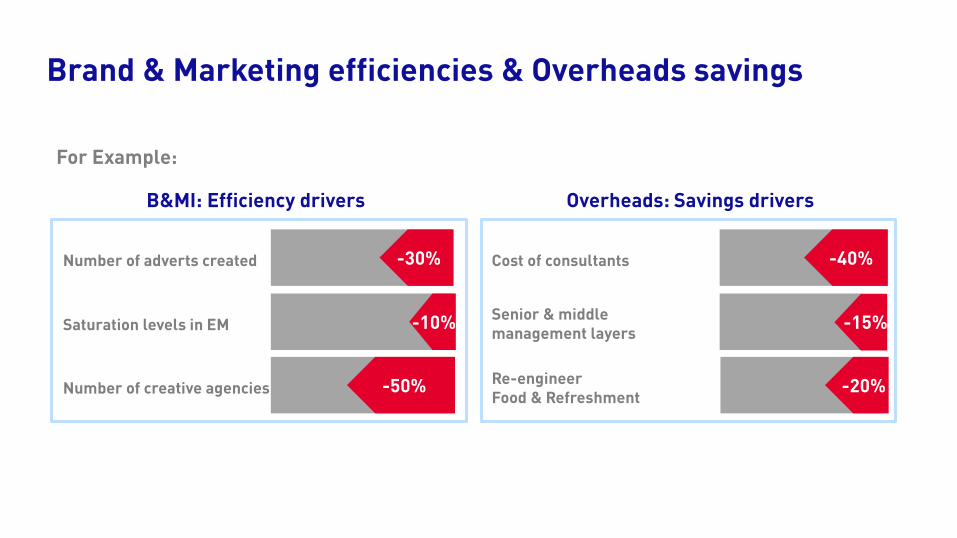
Brand & Marketing efficiencies & Overheads savings
B&MI: Efficiency drivers
Number of adverts created
Number of creative agencies
Saturation levels in EM
Overheads: Savings drivers
-30%
-50%
-10%
Cost of consultants
Re-engineer Food & Refreshment
Senior & middlemanagement layers
-40%
-15%
-20%
For Example:
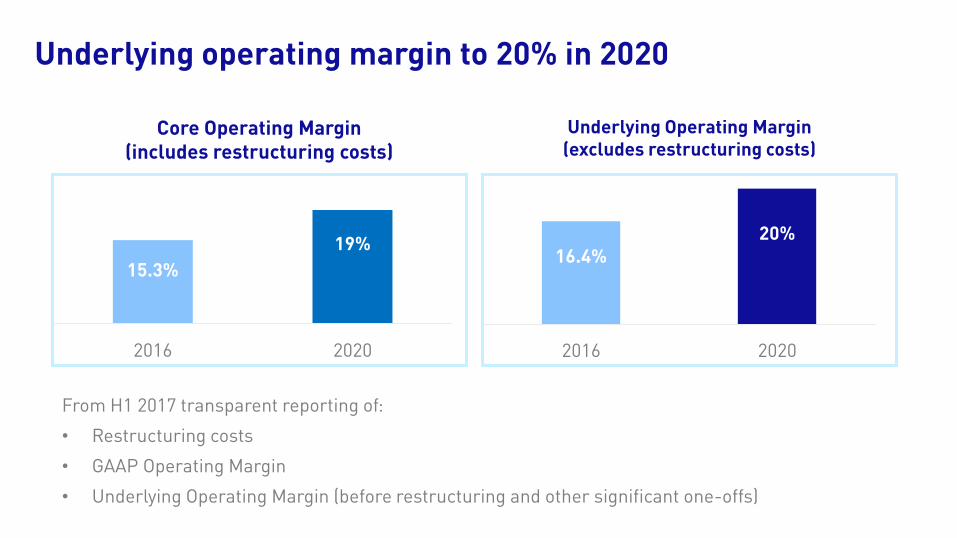
Underlying operating margin to 20% in 2020
From H1 2017 transparent reporting of:
• Restructuring costs
• GAAP Operating Margin
• Underlying Operating Margin (before restructuring and other significant one-offs)
Core Operating Margin (includes restructuring costs)
15.3%
19%
2016 2020
Underlying Operating Margin (excludes restructuring costs)
16.4%20%
2016 2020
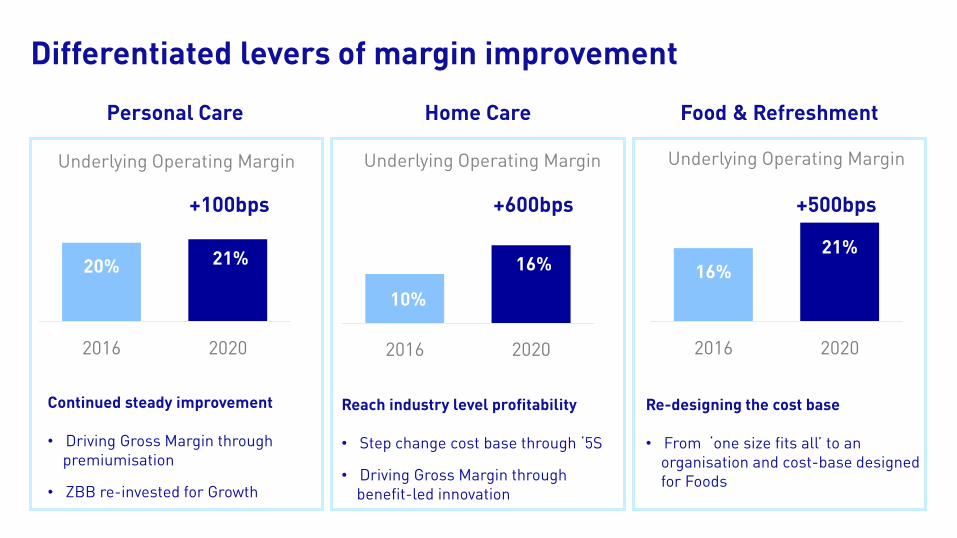
Differentiated levers of margin improvement
Personal Care Food & Refreshment
20% 21%
2016 2020
Continued steady improvement
• Driving Gross Margin through premiumisation
• ZBB re-invested for Growth
Underlying Operating Margin
Reach industry level profitability
• Step change cost base through ‘5S
• Driving Gross Margin through benefit-led innovation
Underlying Operating Margin Underlying Operating Margin
Re-designing the cost base
• From ‘one size fits all’ to an organisation and cost-base designed for Foods
10%
16%
2016 2020
16%
21%
2016 2020
Home Care
+100bps +600bps +500bps
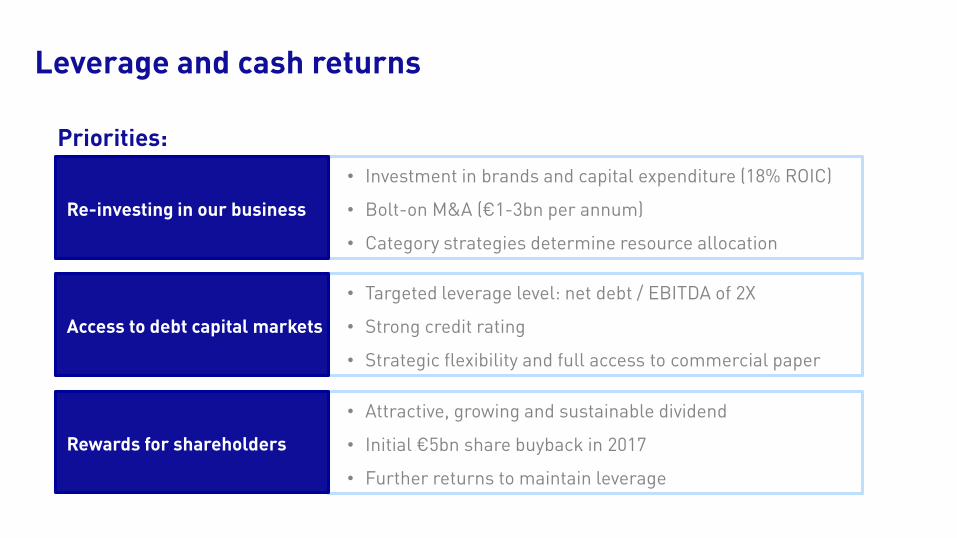
Leverage and cash returns
• Investment in brands and capital expenditure (18% ROIC)
• Bolt-on M&A (€1-3bn per annum)
• Category strategies determine resource allocation
• Attractive, growing and sustainable dividend
• Initial €5bn share buyback in 2017
• Further returns to maintain leverage
• Targeted leverage level: net debt / EBITDA of 2X
• Strong credit rating
• Strategic flexibility and full access to commercial paper
Re-investing in our business
Rewards for shareholders
Access to debt capital markets
Priorities:

New financial targets
USG Underlying Operating Margin
Cash conversion ROIC
100%by 2020
Capex 3% of turnover
One-off cash injection to pension funds
High teens
20%by 2020
Ahead of markets
3-5%
USG 3-5% based on current market conditions Cash conversion defined as Free Cash Flow as a % of Net Profit before profits & losses on disposalsROIC defined as Underlying Operating Profit after tax / Average (PPE + Working Capital+ Assets held for sale + Goodwill + Software)

Paul Polman
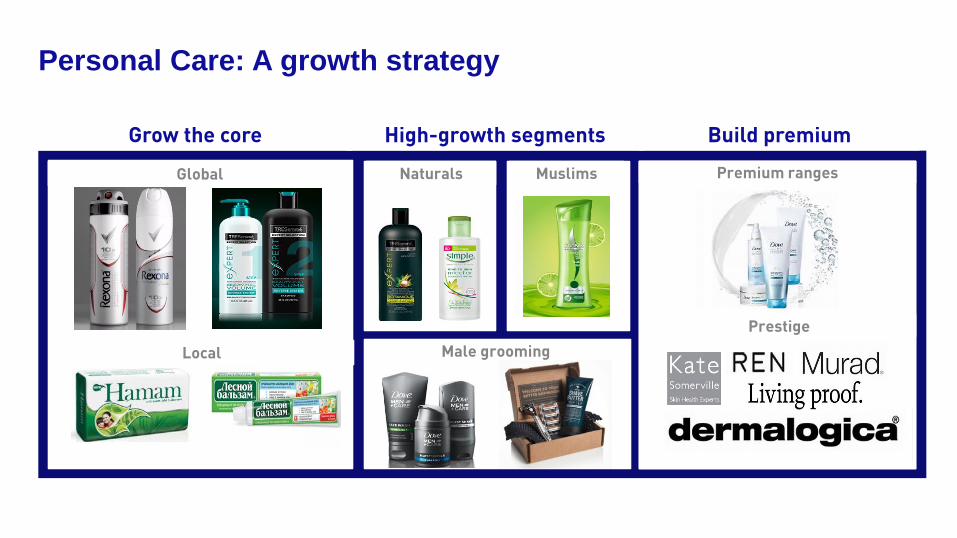
Personal Care: A growth strategy
Male grooming
Grow the core High-growth segments Build premium
Premium ranges
Prestige
Global Naturals Muslims
Local

Home Care: A growth strategy
Grow the core Innovation with benefits Emerging Needs
Market development
Health & hygiene
SensitiveNaturals
Water scarcity
Stain removers & pre-treaters
Sensorial Concentrated
Mo
re b
en
efi
ts
Rising income
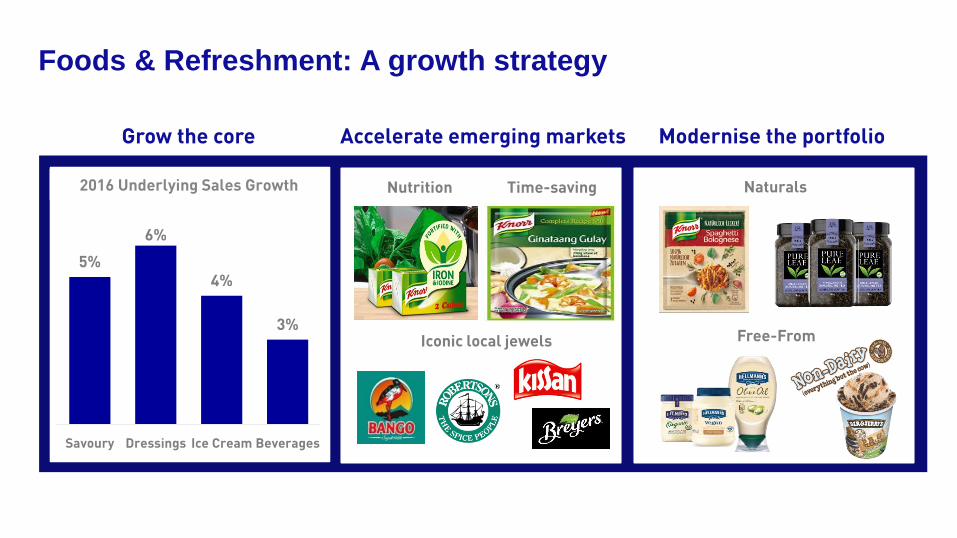
Foods & Refreshment: A growth strategy
Grow the core Accelerate emerging markets Modernise the portfolio
2016 Underlying Sales Growth
5%
6%
4%
3%
Savoury Dressings Ice Cream Beverages
Nutrition
Iconic local jewels
Time-saving
Free-From
Naturals
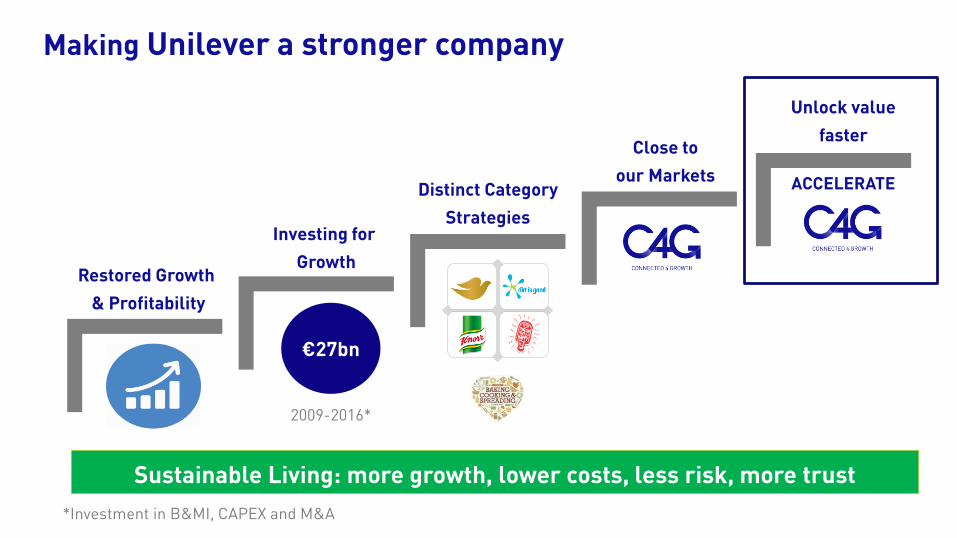
Making Unilever a stronger company
Investing for
Growth
Distinct Category
Strategies
Restored Growth
& Profitability
Close to
our Markets
*Investment in B&MI, CAPEX and M&A
€27bn
2009-2016*
Unlock value
faster
ACCELERATE
Sustainable Living: more growth, lower costs, less risk, more trust
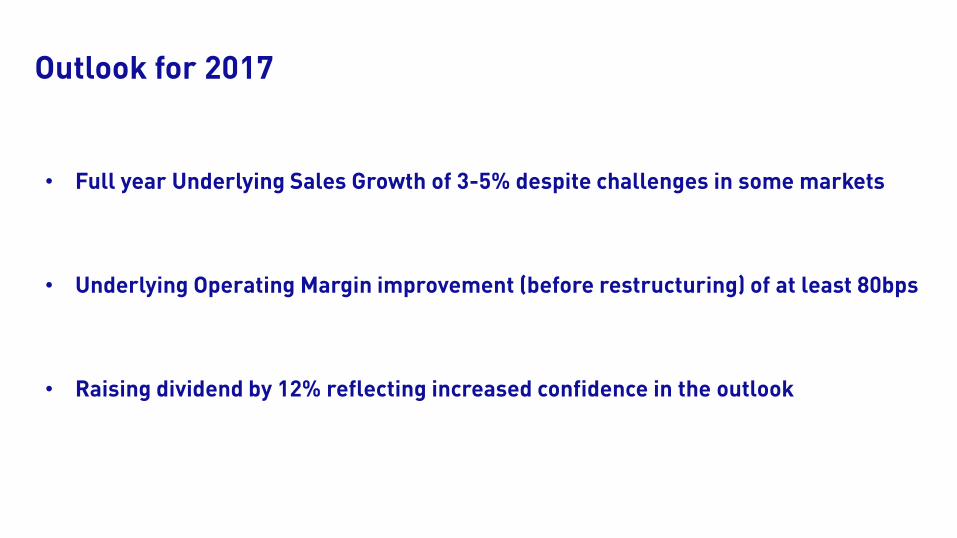
Outlook for 2017
• Full year Underlying Sales Growth of 3-5% despite challenges in some markets
• Underlying Operating Margin improvement (before restructuring) of at least 80bps
• Raising dividend by 12% reflecting increased confidence in the outlook

Accelerating sustainable shareholder value creation
Paul Polman / Graeme Pitkethly
6th April 2017