accelerated debt repayment in leveraged leases
TRANSCRIPT
Accelerated Debt Repayment in Leveraged LeasesAuthor(s): Bruce D. SmithSource: Financial Management, Vol. 11, No. 2 (Summer, 1982), pp. 73-80Published by: Wiley on behalf of the Financial Management Association InternationalStable URL: http://www.jstor.org/stable/3665027 .
Accessed: 14/06/2014 10:58
Your use of the JSTOR archive indicates your acceptance of the Terms & Conditions of Use, available at .http://www.jstor.org/page/info/about/policies/terms.jsp
.JSTOR is a not-for-profit service that helps scholars, researchers, and students discover, use, and build upon a wide range ofcontent in a trusted digital archive. We use information technology and tools to increase productivity and facilitate new formsof scholarship. For more information about JSTOR, please contact [email protected].
.
Wiley and Financial Management Association International are collaborating with JSTOR to digitize, preserveand extend access to Financial Management.
http://www.jstor.org
This content downloaded from 185.2.32.109 on Sat, 14 Jun 2014 10:58:44 AMAll use subject to JSTOR Terms and Conditions

Accelerated Debt Repayment in
Leveraged Leases
Bruce D. Smith
The author is Assistant Vice President with New England Merchants
Leasing Corporation in Boston, Massachusetts.
Introduction There are two fundamental approaches to the evalua-
tion of lease investments from the lessor's perspective. The first of these, the approach that is used nearly
universally in practice, is based on the computation of yield according to one of the so-called "sinking fund" methods. Currently the most widely-used of these meth- ods is the Multiple Investment Sinking Fund method (MISF). This measure of yield is often supplemented by another measure known as inherent profit, resulting in a 2-dimensional approach to the evaluation of lease invest- ments. (Note: There has developed a certain degree of standardization in the measures of profitability applied to leveraged lease investments, due in part to the fact that an active and competitive market for the placement of such transactions has developed among financial institutions.) As it turns out, structuring a leveraged lease so as to include an accelerated repayment schedule for the non- recourse debt results in lease structures that are dominant in terms of this widely-used two-dimensional analysis, and such leases with accelerated debt structures have consequently become quite popular in recent years. The apparent benefits, however, are misleading.
A sounder approach to the analysis of lease invest-
ments is based on the net present value (NPV) approach. Analysis of leases with accelerated debt structures using the NPV approach leads to conclusions opposite to those derived from the MISF approach. That is, such structures actually result in reduced economic benefit to the lessor.
Yield-Inherent Profit Approach The net after-tax cashflows to the lessor in a leveraged
lease transaction include both positive and negative cash- flows throughout the term of the lease, and it is well known that such a cashflow stream may exhibit multiple internal rates of return (IRR). In general, there may be as many solutions to the IRR equation as there are algebraic sign changes in the cashflow stream [10]. Another objec- tion to the use of IRR to measure yield in a leveraged lease is that the use of IRR tacitly assumes that excess cash balances generated by the lease can be reinvested at the yield implicit in the lease, an assumption that has been criticized both by practitioners [6] and by academicians 171. For these reasons, the use of IRR as a measure of yield is rejected by nearly all lessors.
In order to obtain a better measure of yield, various approaches have been tried at one time or another, includ- ing the so-called standard "Sinking Fund" method (still
73
This content downloaded from 185.2.32.109 on Sat, 14 Jun 2014 10:58:44 AMAll use subject to JSTOR Terms and Conditions

FINANCIAL MANAGEMENT/SUMMER 1982
used by some lessors), and another method known as
"Sinking Fund with Borrowing" (no longer widely used). In more recent years, the measure of yield that has been most generally accepted within the leasing industry is based on a method first suggested in an article pub- lished in Management Science in 1965 by Teichroew, Robichek, and Montalbano [8, 9]. They referred to their method as "Return on Investment Capital" (RIC), and it is referred to by this name in the academic literature [1], but in the leasing industry it is more commonly known as the "Multiple Investment Sinking Fund" (MISF) meth- od. An excellent discussion of the MISF method can be found in 161. The use of the sinking fund approach has also been endorsed in more recent academic literature [5]. This is the method currently used by most major lessors to evaluate yield.
The MISF method explicitly recognizes that the lease is both a source as well as a use of funds at various times
during the life of the investment. Basically this approach divides the lease term into distinct periods in which the lease represents an investment, or use of funds, and peri- ods in which it represents a negative investment, or source of funds. Whereas the IRR approach assigns the same interest rate to the outstanding investment balance each period, regardless of whether that investment bal- ance is positive or negative, the MISF approach assigns one rate (r) to the investment during positive phases and assigns a different rate (r) to the investment during negative phases. The negative investment phases rep- resent temporary cash surpluses, known as a sinking fund, and r, represents the assumed rate at which these cash balances can be reinvested. r, is given (called the sinking fund rate), and the rate r, which amortizes the initial investment to zero over the lease term is then said to be the yield. More precisely,
Let C, = net cashflow in period i, for i =0, 1, . . ,N Then P,, the ending investment balance in period i, is defined as follows: PO, = -C,, (thus by convention P(, > 0) P,-l = P (1 + r,) - C.+,
r if P, < 0 where r, iP
r, is given, and r, is then the unique value such that PN = 0. The yield is normally expressed in terms of a pre- tax "equivalent" figure, r', = r/(l - t) where t is the effective tax rate. Note that if P, i 0 for all i, then MISF reduces to IRR.
It is generally felt that r. should be chosen to repre- sent a fairly secure return readily available to the firm, and in fact Childs and Gridley 14] go so far as to
advocate r, = 0. In practice, it has become fairly standard to use the conservative value r, = 3.5%. (We of course have no direct means of knowing the sinking fund rates used by various firms for internal purposes, but when yields are quoted in the market the 3.5% rate is most frequently used.) It is argued in [1] and [5] that, in the absence of capital rationing, the firm's marginal cost of funds would be the appropriate value for r,, a
position with which we agree. Thus, to be consistent with the material that follows, we will use r, = 5% in our examples.
Consider a lease with the following parameters: Lease term: 10 years Equipment cost: $1,000,000 Estimated residual value: $0 Rentals: 10 equal payments of $162,000, paid
annually in arrears Non-recourse debt: $684,892 at 12% interest Debt service: 10 equal payments, paid annually
in arrears Depreciable life: 7 years Salvage: $0 Depreciation method: SYD Investment tax credit: $0
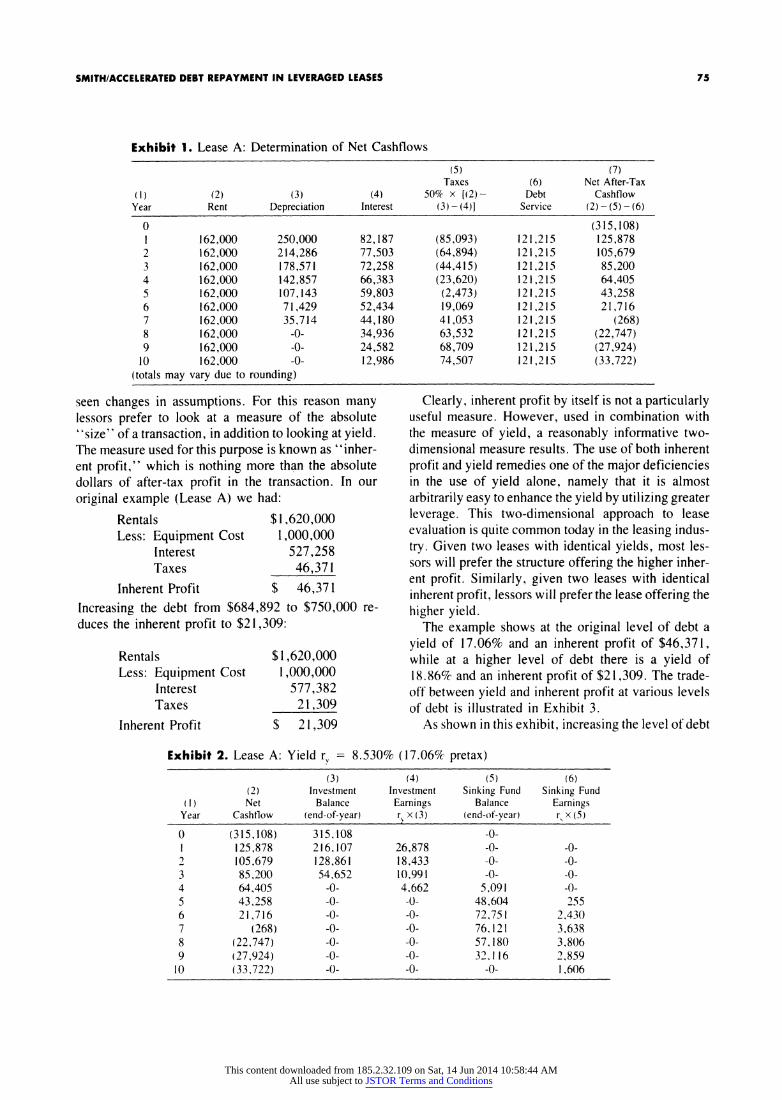
We shall assume throughout that the lessor's tax rate is 50% and that all taxes for the current year are paid at the end of that year. Exhibit 1 shows the net cashflows in this lease: Exhibit 2 presents the computation of
yield according to the MISF method using the net cashflows shown in Exhibit 1. (Actually Exhibit 2
merely verifies the yield; computation of the value r, is
by iterative search.) "Investment Balance" represents P, in those periods when P, > 0. "Sinking Fund Balance" represents -P, in those periods when P, < 0. PN0O is equivalent to the fact that both the in- vestment balance and sinking fund balance are zero at the end of the lease term, thus verifying the correctness of r,.
Generally speaking, yield can always be increased by increasing the degree of leverage in the transaction. For instance, by increasing the level of debt from $684,892 to $750,000 in the preceding example, the yield is increased from 17.06% to 18.86% (assuming a 10-year maturity and level debt service in both cases). However, by increasing the leverage we are left with a net investment which, though higher yielding, is smaller in absolute size. This means that the yield becomes much more sensitive to changes in the various lease assumptions, such as tax rates, or transaction costs and other fees. So the transaction is higher yield- ing, but it is more "fragile" in the sense that the actual realized yield can more easily be destroyed by unfore-
74
This content downloaded from 185.2.32.109 on Sat, 14 Jun 2014 10:58:44 AMAll use subject to JSTOR Terms and Conditions
SMITH/ACCELERATED DEBT REPAYMENT IN LEVERAGED LEASES
Exhibit 1. Lease A: Determination of Net Cashflows
(5) (7) Taxes (6) Net After-Tax
(1) (2) (3) (4) 50% x [(2)- Debt Cashflow Year Rent Depreciation Interest (3) - (4)1 Service (2) - (5) -(6)
0 (315,108) 1 162,000 250,000 82,187 (85,093) 121,215 125,878 2 162,000 214,286 77,503 (64,894) 121,215 105,679 3 162,000 178,571 72,258 (44,415) 121,215 85,200 4 162,000 142,857 66,383 (23,620) 121,215 64,405 5 162,000 107,143 59,803 (2,473) 121,215 43,258 6 162,000 71,429 52,434 19,069 121,215 21,716 7 162,000 35,714 44,180 41,053 121,215 (268) 8 162,000 -0- 34,936 63,532 121,215 (22,747) 9 162,000 -0- 24,582 68,709 121,215 (27,924)
10 162,000 -0- 12,986 74,507 121,215 (33,722) (totals may vary due to rounding)
seen changes in assumptions. For this reason many lessors prefer to look at a measure of the absolute "size" of a transaction, in addition to looking at yield. The measure used for this purpose is known as "inher- ent profit," which is nothing more than the absolute dollars of after-tax profit in the transaction. In our
original example (Lease A) we had:
Rentals $1,620,000 Less: Equipment Cost 1,000,000
Interest 527,258 Taxes 46,371
Inherent Profit $ 46,371
Increasing the debt from $684,892 to $750,000 re- duces the inherent profit to $21,309:
Rentals Less: Equipment Cost
Interest Taxes
Inherent Profit
$1,620,000 1,000,000
577,382 21,309
$ 21,309
Clearly, inherent profit by itself is not a particularly useful measure. However, used in combination with the measure of yield, a reasonably informative two- dimensional measure results. The use of both inherent profit and yield remedies one of the major deficiencies in the use of yield alone, namely that it is almost arbitrarily easy to enhance the yield by utilizing greater leverage. This two-dimensional approach to lease evaluation is quite common today in the leasing indus-
try. Given two leases with identical yields, most les- sors will prefer the structure offering the higher inher- ent profit. Similarly, given two leases with identical inherent profit, lessors will prefer the lease offering the
higher yield. The example shows at the original level of debt a
yield of 17.06% and an inherent profit of $46,371, while at a higher level of debt there is a yield of 18.86% and an inherent profit of $21,309. The trade- off between yield and inherent profit at various levels of debt is illustrated in Exhibit 3.
As shown in this exhibit, increasing the level of debt
Exhibit 2. Lease A: Yield rv = 8.530% (17.06% pretax)
(3) (4) (5) (6) (2) Investment Investment Sinking Fund Sinking Fund
(I) Net Balance Earnings Balance Earnings Year Cashflow (end-of-year) r x (3) (end-of-year) r x (5)
0 (315,108) 315,108 -0- 1 125,878 216,107 26,878 -0- -0- 2 105,679 128,861 18,433 -0- -0- 3 85,200 54,652 10,991 -0- -0- 4 64,405 -0- 4,662 5,091 -0- 5 43,258 -0- -0- 48,604 255 6 21,716 -0- -0- 72,751 2,430 7 (268) -0- -0- 76.121 3,638 8 (22,747) -0- -0- 57,180 3,806 9 (27,924) -0- -0- 32.116 2.859
10 (33,722) -0- -0- -0- 1,606
75
This content downloaded from 185.2.32.109 on Sat, 14 Jun 2014 10:58:44 AMAll use subject to JSTOR Terms and Conditions
FINANCIAL MANAGEMENT/SUMMER 1982
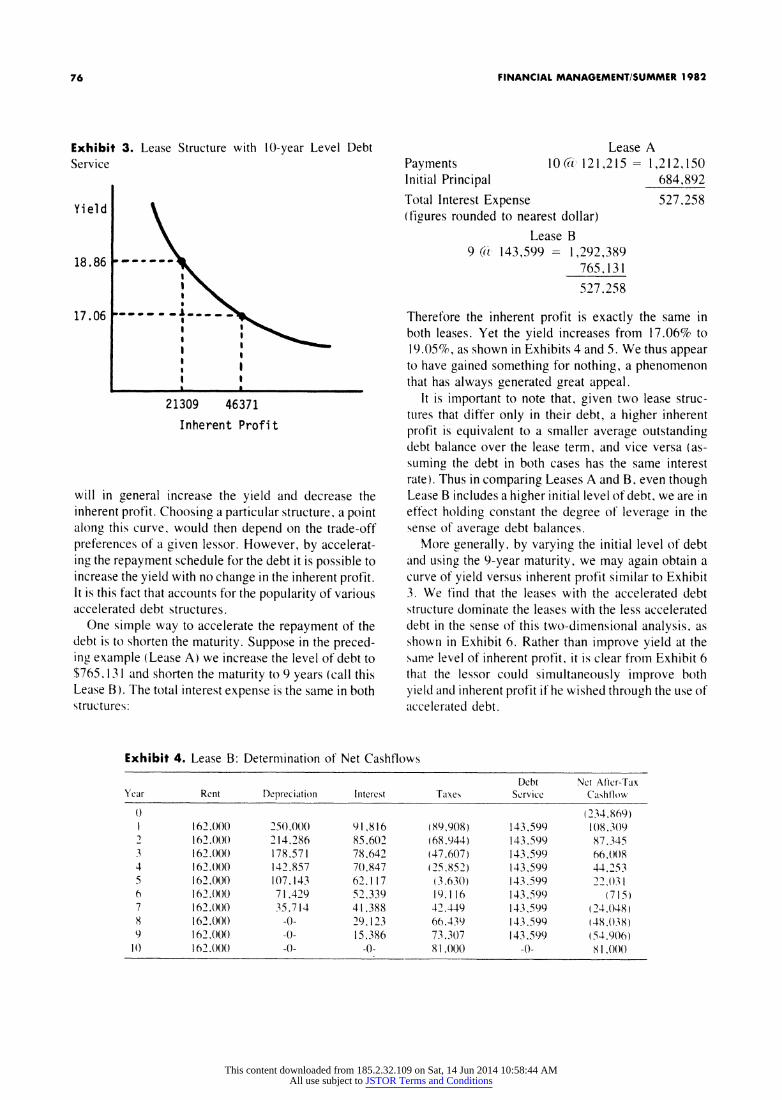
Exhibit 3. Lease Structure with 10-year Level Debt Service
Yield
Lease A Payments 10 (i 121,215 = 1,212,150 Initial Principal 684,892
Total Interest Expense 527.258 (figures rounded to nearest dollar)
Lease B 9 (t 143,599 = 1,292,389
765.131
527.258
I I I
I I t
I I I I I_ I
21309 46371
Inherent Profit
will in general increase the yield and decrease the inherent profit. Choosing a particular structure, a point along this curve, would then depend on the trade-off preferences of a given lessor. However, by accelerat- ing the repayment schedule for the debt it is possible to increase the yield with no change in the inherent profit. It is this fact that accounts for the popularity of various accelerated debt structures.
One simple way to accelerate the repayment of the debt is to shorten the maturity. Suppose in the preced- ing example (Lease A) we increase the level of debt to $765.131 and shorten the maturity to 9 years (call this Lease B). The total interest expense is the same in both structures:
Therefore the inherent profit is exactly the same in both leases. Yet the yield increases from 17.06% to 19.05%, as shown in Exhibits 4 and 5. We thus appear to have gained something for nothing, a phenomenon that has always generated great appeal.
It is important to note that, given two lease struc- tures that differ only in their debt, a higher inherent profit is equivalent to a smaller average outstanding debt balance over the lease term, and vice versa (as- suming the debt in both cases has the same interest rate). Thus in comparing Leases A and B, even though Lease B includes a higher initial level of debt, we are in effect holding constant the degree of leverage in the sense of average debt balances.
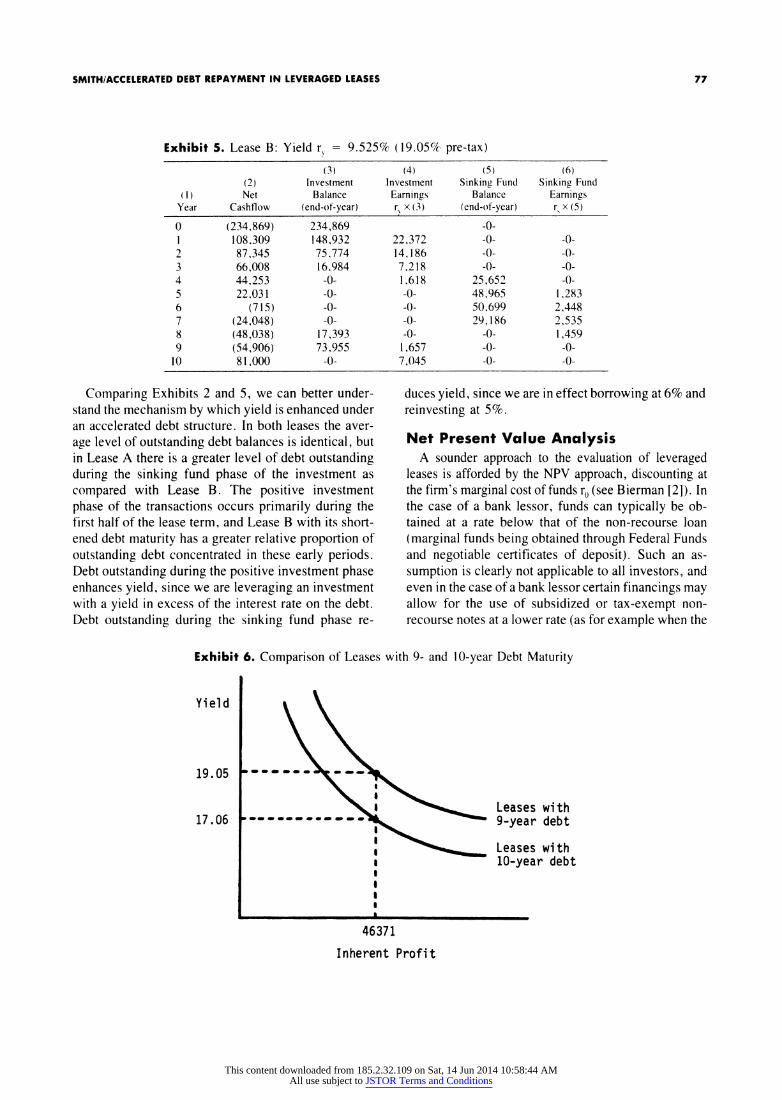
More generally, by varying the initial level of debt and using the 9-year maturity, we may again obtain a curve of yield versus inherent profit similar to Exhibit 3. We find that the leases with the accelerated debt structure dominate the leases with the less accelerated debt in the sense of this two-dimensional analysis, as shown in Exhibit 6. Rather than improve yield at the same level of inherent profit, it is clear from Exhibit 6 that the lessor could simultaneously improve both yield and inherent profit if he wished through the use of accelerated debt.
Exhibit 4. Lease B: Determination of Net Cashflows
Debt Net Attcr-Tax Year Rent Depreciation Interest Taxes Scrvice Cashflow
(~~~~0)~~~~~~~~~~~~~~ (234.869) 1 162,00(0 250,000 91,816 (89,908) 143,599 108.309 2 162.00() 214.286 85.602 (68.944) 143.599 87.345 3 162.000 178.571 78,642 (47,607) 143.599 66()008 4 162.000 142.857 7(.847 (25,852) 143.599 44.253 5 162.00) 107.143 62,117 (3.630) 143.599 22.031 6 162.000 71,429 52.339 19,116 143.599 (715) 7 162.000 35,714 41.388 42,449 143,599 (24.048) 8 162.000 -0- 29123 66.439 143.599 (48.038) 9 162.000 -0- 15,386 73,307 143.599 (54.906)
10 162.00() -0- -0- 81,)000 -0- 81.(((
17.06
76
18.86 ---_
This content downloaded from 185.2.32.109 on Sat, 14 Jun 2014 10:58:44 AMAll use subject to JSTOR Terms and Conditions
SMITH/ACCELERATED DEBT REPAYMENT IN LEVERAGED LEASES
Exhibit 5. Lease B: Yield r, = 9.525% (19.05% pre-tax)
(3) (4) (5) (6) (2) Investment Investment Sinking Fund Sinking Fund
(1) Net Balance Earnings Balance Earnings Year Cashflow (end-of-year) r x (3) (end-of-year) r x (5)
0 (234,869) 234,869 -0- 1 108,309 148,932 22,372 -0- -0- 2 87,345 75.774 14,186 -0- -0- 3 66,008 16.984 7,218 -0- -0- 4 44.253 -0- 1.618 25,652 -0- 5 22.031 -0- -0- 48,965 1,283 6 (715) -0- -0- 50.699 2,448 7 (24,048) -0- -0-29,186 2,535 8 (48,038) 17,393 -0- -0- 1,459 9 (54,906) 73.955 1,657 -0-0-
10 81,000 -0- 7,045 -0--
Comparing Exhibits 2 and 5, we can better under- stand the mechanism by which yield is enhanced under an accelerated debt structure. In both leases the aver- age level of outstanding debt balances is identical, but in Lease A there is a greater level of debt outstanding during the sinking fund phase of the investment as compared with Lease B. The positive investment phase of the transactions occurs primarily during the first half of the lease term, and Lease B with its short- ened debt maturity has a greater relative proportion of
outstanding debt concentrated in these early periods. Debt outstanding during the positive investment phase enhances yield, since we are leveraging an investment with a yield in excess of the interest rate on the debt. Debt outstanding during the sinking fund phase re-
duces yield, since we are in effect borrowing at 6% and
reinvesting at 5%.
Net Present Value Analysis A sounder approach to the evaluation of leveraged
leases is afforded by the NPV approach, discounting at the firm's marginal cost of funds r0 (see Bierman [2]). In the case of a bank lessor, funds can typically be ob- tained at a rate below that of the non-recourse loan (marginal funds being obtained through Federal Funds and negotiable certificates of deposit). Such an as-
sumption is clearly not applicable to all investors, and even in the case of a bank lessor certain financings may allow for the use of subsidized or tax-exempt non- recourse notes at a lower rate (as for example when the
Exhibit 6. Comparison of Leases with 9- and 10-year Debt Maturity
Leases with 9-year debt
Leases with 10-year debt
46371
Inherent Profit
Yield
19.05
17.06
I I I
I I I I IA-
77
4 ~( _ _ _ _ _ _
__ _ _ _ _ 4. a
_ _ .
This content downloaded from 185.2.32.109 on Sat, 14 Jun 2014 10:58:44 AMAll use subject to JSTOR Terms and Conditions
FINANCIAL MANAGEMENT/SUMMER 1982
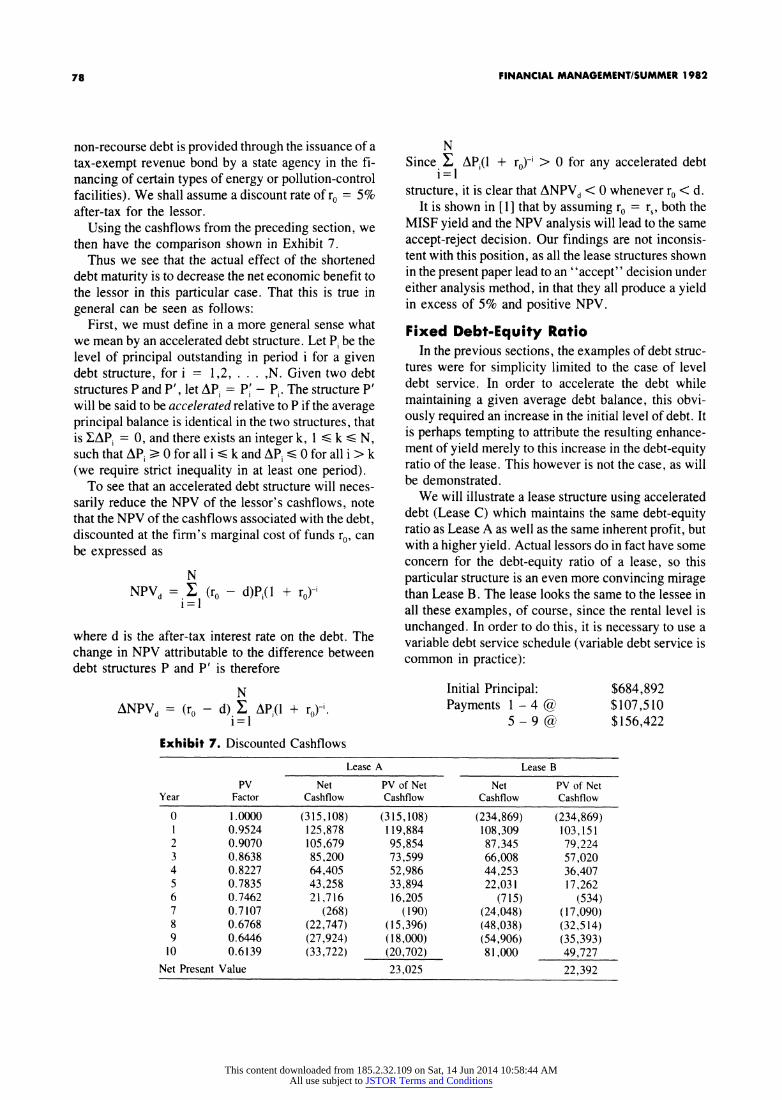
non-recourse debt is provided through the issuance of a tax-exempt revenue bond by a state agency in the fi- nancing of certain types of energy or pollution-control facilities). We shall assume a discount rate of r0 = 5% after-tax for the lessor.
Using the cashflows from the preceding section, we then have the comparison shown in Exhibit 7.
Thus we see that the actual effect of the shortened debt maturity is to decrease the net economic benefit to the lessor in this particular case. That this is true in general can be seen as follows:
First, we must define in a more general sense what we mean by an accelerated debt structure. Let P, be the level of principal outstanding in period i for a given debt structure, for i = 1,2, .... ,N. Given two debt structures P and P', let APi = Pi - Pi. The structure P' will be said to be accelerated relative to P if the average principal balance is identical in the two structures, that is YAP, = 0, and there exists an integer k, 1 < k < N, such that APi > 0 for all i < k and AP, < 0 for all i > k (we require strict inequality in at least one period).
To see that an accelerated debt structure will neces- sarily reduce the NPV of the lessor's cashflows, note that the NPV of the cashflows associated with the debt, discounted at the firm's marginal cost of funds ro, can be expressed as
N NPVd= E (ro - d)P,(l + ro)-
i=l
where d is the after-tax interest rate on the debt. The change in NPV attributable to the difference between debt structures P and P' is therefore
N Since X APP(l + ro)-i > 0 for any accelerated debt
i=l structure, it is clear that ANPVd < 0 whenever ro < d.
It is shown in [1] that by assuming ro = r,, both the MISF yield and the NPV analysis will lead to the same accept-reject decision. Our findings are not inconsis- tent with this position, as all the lease structures shown in the present paper lead to an "accept" decision under either analysis method, in that they all produce a yield in excess of 5% and positive NPV.
Fixed Debt-Equity Ratio In the previous sections, the examples of debt struc-
tures were for simplicity limited to the case of level debt service. In order to accelerate the debt while maintaining a given average debt balance, this obvi- ously required an increase in the initial level of debt. It is perhaps tempting to attribute the resulting enhance- ment of yield merely to this increase in the debt-equity ratio of the lease. This however is not the case, as will be demonstrated.
We will illustrate a lease structure using accelerated debt (Lease C) which maintains the same debt-equity ratio as Lease A as well as the same inherent profit, but with a higher yield. Actual lessors do in fact have some concern for the debt-equity ratio of a lease, so this particular structure is an even more convincing mirage than Lease B. The lease looks the same to the lessee in all these examples, of course, since the rental level is unchanged. In order to do this, it is necessary to use a variable debt service schedule (variable debt service is common in practice):
ANPVd = (ro N
- d) APi(l + r0)-'. i=l
Initial Principal: Payments 1 - 4 @
5-9@ Exhibit 7. Discounted Cashflows
Lease A Lease B
PV Net PV of Net Net PV of Net Year Factor Cashflow Cashflow Cashflow Cashflow
0 1.0000 (315,108) (315,108) (234,869) (234,869) 1 0.9524 125,878 119,884 108,309 103,151 2 0.9070 105,679 95,854 87,345 79,224 3 0.8638 85,200 73,599 66,008 57,020 4 0.8227 64,405 52,986 44,253 36,407 5 0.7835 43,258 33,894 22,031 17,262 6 0.7462 21,716 16,205 (715) (534) 7 0.7107 (268) (190) (24,048) (17,090) 8 0.6768 (22,747) (15,396) (48,038) (32,514) 9 0.6446 (27,924) (18,000) (54,906) (35,393)
10 0.6139 (33,722) (20,702) 81,000 49,727 Net Present Value 23,025 22,392
$684,892 $107,510 $156,422
78
This content downloaded from 185.2.32.109 on Sat, 14 Jun 2014 10:58:44 AMAll use subject to JSTOR Terms and Conditions
SMITH/ACCELERATED DEBT REPAYMENT IN LEVERAGED LEASES
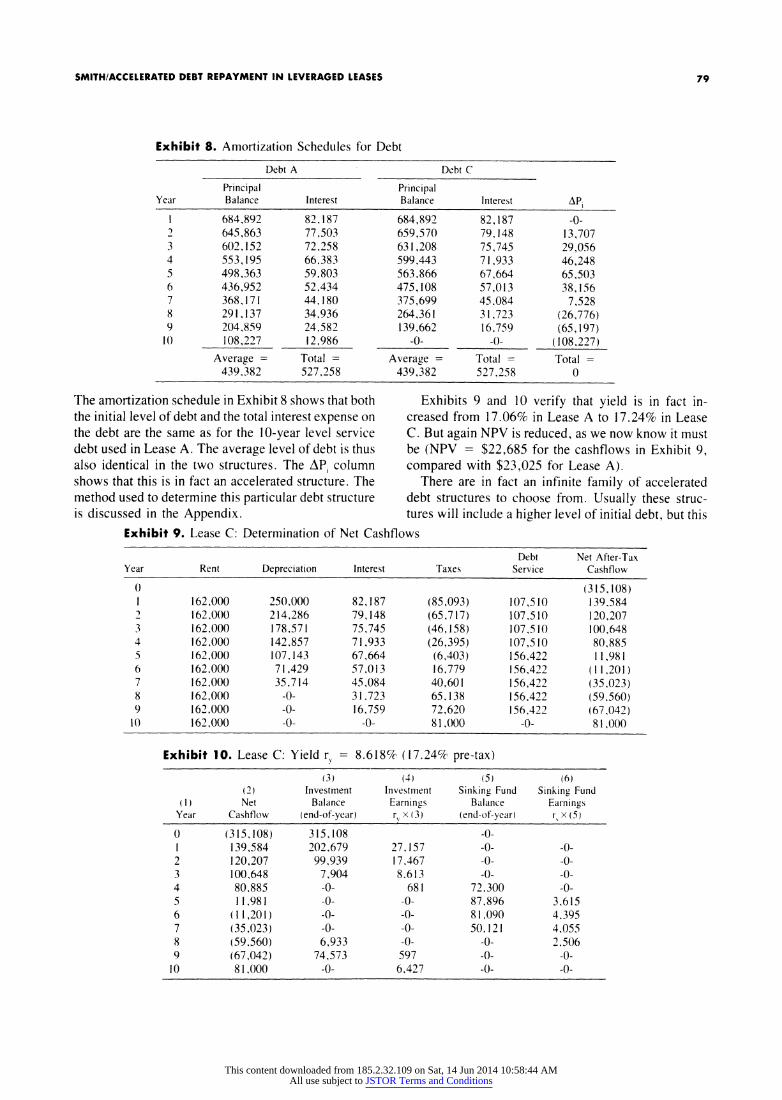
Exhibit 8. Amortization Schedules for Debt
Debt A Debt C
Principal Principal Year Balance Interest Balance Interest APi
1 684,892 82,187 684,892 82,187 -0- 2 645,863 77,503 659,570 79,148 13,707 3 602,152 72,258 631,208 75,745 29,056 4 553,195 66,383 599,443 71,933 46,248 5 498,363 59,803 563,866 67,664 65,503 6 436,952 52.434 475,108 57,013 38,156 7 368,171 44,180 375,699 45.084 7,528 8 291,137 34,936 264,361 31,723 (26,776) 9 204.859 24,582 139,662 16,759 (65,197)
10 108,227 12,986 -0- -0- (108,227) Average = Total = Average = Total = Total =
439.382 527,258 439,382 527,258 0
The amortization schedule in Exhibit 8 shows that both the initial level of debt and the total interest expense on the debt are the same as for the 10-year level service debt used in Lease A. The average level of debt is thus also identical in the two structures. The AP, column shows that this is in fact an accelerated structure. The method used to determine this particular debt structure is discussed in the Appendix.
Exhibit 9. Lease C: Determination
Exhibits 9 and 10 verify that yield is in fact in- creased from 17.06% in Lease A to 17.24% in Lease C. But again NPV is reduced, as we now know it must be (NPV = $22,685 for the cashflows in Exhibit 9, compared with $23,025 for Lease A).
There are in fact an infinite family of accelerated debt structures to choose from. Usually these struc- tures will include a higher level of initial debt, but this
of Net Cashflows
Debt Net After-Tax Year Rent Depreciation Interest Taxes Service Cashflow
0 (315,108) 1 162,000 250,000 82,187 (85,093) 107,510 139.584 2 162,000 214,286 79,148 (65,717) 107,510 120,207 3 162.000 178,571 75,745 (46,158) 107,510 100,648 4 162,000 142.857 71,933 (26,395) 107,510 80,885 5 162,000 107.143 67,664 (6,403) 156,422 11,981 6 162.000 71,429 57,013 16,779 156,422 (11,201) 7 162.000 35,714 45,084 40,601 156,422 (35,023) 8 162,000 -0- 31.723 65.138 156,422 (59,560) 9 162,000 -0- 16,759 72,620 156,422 (67,042)
10 162,000 -0- -0- 81,000 -0- 81,000
Exhibit 10. Lease C: Yield r, = 8.618% (17.24% pre-tax)
(3) (4) (5) (6) (2) Investment Investment Sinking Fund Sinking Fund
(I) Net Balance Earnings Balance Earnings Year Cashflow (end-of-year) r, x(3) (end-of-year) r, x(5)
0 (315,108) 315,108 -0- 1 139,584 202,679 27,157 -0- -0- 2 120,207 99,939 17.467 -0- -0- 3 100,648 7,904 8.613 -0- -0- 4 80,885 -0- 681 72.300 -0- 5 11,981 -0- -0- 87,896 3.615 6 (11,201) -0- -0- 81,090 4.395 7 (35,023) -0- -0- 50.121 4.055 8 (59,560) 6,933 -0- -0- 2.506 9 (67,042) 74,573 597 -0- -0-
10 81.000 -0- 6,427 -0- -0-
79
This content downloaded from 185.2.32.109 on Sat, 14 Jun 2014 10:58:44 AMAll use subject to JSTOR Terms and Conditions
FINANCIAL MANAGEMENT/SUMMER 1982
is not necessarily the case. Sometimes these debt struc- tures are given colorful names, such as a "ledge" or "'accelerated 2-step."' All offer the attractiveness of an enhanced yield at a given level of inherent profit.
Conclusion The use of a 2-dimensional (yield, inherent profit)
approach to the evaluation of lease profitability has
encouraged the use of various forms of accelerated debt structures, since the use of such a structure results in an enhanced yield at a given level of inherent profit. This is true when the average level of debt is held constant, and even when both the initial level and average level of debt are held constant. The apparent advantage of this type of structure is misleading, how- ever, in that the NPV of after-tax cashflows to the lessor is reduced under such a structure.
Other factors not discussed in this article include the effect on the lessor's reported earnings. Use of an accelerated debt structure will result in a shift in report- able income for accounting purposes to the latter por- tion of the lease term, and will reduce average return on assets over the lease term. This adverse impact on the timing of book earnings is further discussed in [3].
Finally, rather than enhancing the yield at a given level of inherent profit and a given nominal rate to the lessee (nominal lease rate is the discount rate at which NPV of rentals equals equipment cost), competitive pressures will in practice tempt the lessor to merely mainttain yield and inherent profit while reducing the lessee's nominal rate (i.e., reduce rent). The negative impact on NPV to the lessor of such an approach is significantly greater in magnitude than that depicted in the present article.
References 1. Peter J. Athanasopoulos and Peter W. Bacon, "The Evalu-
ation of Leveraged Leases," Financial Management (Spring 1980), pp. 76-80.
2. Harold Bierman. Jr., "Leveraged Leasing: An Alternative Analysis," Bankers Maiga:ine (Summer 1974), pp. 62-65.
3. Edward P. Brennan, "Shortened Debt: A Spurious Struc- turing Technique," Mollo! Assoc(iates Monitor (Septem- ber 1977).
4. C. Rogers Childs, Jr., and William G. Gridley, Jr., "Lev-
eraged Leasing and the Reinvestment Rate Fallacy," Bankers Magazine (Winter 1973), pp. 53-61.
5. Edward A. Dyl and Stanley A. Martin. Jr.. "Setting Terms for Leveraged Leases," Financial Management (Winter 1977), pp. 20-27.
6. Bruce E. Fritch and Albert F. Reisman, editors. Equipment Leasing: Leveraged Leasing, Practising Law Institute, New York, N.Y. (1977), pp. 372-378.
7. James C. T. Mao, Quantitative Analysis of Fiznacial Deci- sions, New York, The Macmillan Company (1969), pp. 196-212.
8. Daniel Teichroew, Alexander Robichek, and Michael Montalbano, "An Analysis of Criteria for Investment and Financing Decisions Under Certainty," Management Sci- ence (November 1965), pp. 151-179.
9. Daniel Teichroew, Alexander Robichek, and Michael Montalbano, "Mathematical Analysis of Rate of Return Under Certainty," Management Science (January 1965). pp. 395-403.
10. Robert C. Wiar, "Economic Implications of Multiple Rates of Return in the Leveraged Lease Context." Jouriinal of Fiunance (December 1973), pp. 1275-1286.
Appendix: Determination of Variable Debt Structure
In the discussion of a fixed debt-equity ratio, we required a variable debt structure with an initial princi- pal of $684,892, such that the total interest cost is $527,258. The total debt service then must be $1,212,150. We have arbitrarily decided to use a 9- year maturity and a 2-step structure, with the'first 4 payments at level x, and the last 5 payments at level x,. Therefore we need only solve the simultaneous equations
4 9 684892 = x, E (1 + d)-' + x, E (1 + d)-
i=l -i=5
1212150 4x, + 5x,
where d is the interest rate on the debt, in this case 12%. We thus obtain the solution values
x, = 107510 x, = 156422.
80
This content downloaded from 185.2.32.109 on Sat, 14 Jun 2014 10:58:44 AMAll use subject to JSTOR Terms and Conditions