absence data sequential hypothesis testing with spatially ... filebianchi et al. 2008, takakura...
TRANSCRIPT

BioOne sees sustainable scholarly publishing as an inherently collaborative enterprise connecting authors, nonprofit publishers,academic institutions, research libraries, and research funders in the common goal of maximizing access to critical research.
Sequential Hypothesis Testing with Spatially Correlated Presence-Absence DataAuthor(s): Elijah DePalma, Daniel R. Jeske, Jesus R. Lara, and Mark HoddleSource: Journal of Economic Entomology, 105(3):1077-1087. 2012.Published By: Entomological Society of AmericaDOI: http://dx.doi.org/10.1603/EC11199URL: http://www.bioone.org/doi/full/10.1603/EC11199
BioOne (www.bioone.org) is a nonprofit, online aggregation of core research in thebiological, ecological, and environmental sciences. BioOne provides a sustainable onlineplatform for over 170 journals and books published by nonprofit societies, associations,museums, institutions, and presses.
Your use of this PDF, the BioOne Web site, and all posted and associated content indicatesyour acceptance of BioOne’s Terms of Use, available at www.bioone.org/page/terms_of_use.
Usage of BioOne content is strictly limited to personal, educational, and non-commercialuse. Commercial inquiries or rights and permissions requests should be directed to theindividual publisher as copyright holder.
SAMPLING AND BIOSTATISTICS
Sequential Hypothesis Testing With Spatially CorrelatedPresence-Absence Data
ELIJAH DEPALMA,1 DANIEL R. JESKE,1,2 JESUS R. LARA,3 AND MARK HODDLE3
J. Econ. Entomol. 105(3): 1077Ð1087 (2012); DOI: http://dx.doi.org/10.1603/EC11199
ABSTRACT A pest management decision to initiate a control treatment depends upon an accurateestimate of mean pest density. Presence-absence sampling plans signiÞcantly reduce sampling effortsto make treatment decisions by using the proportion of infested leaves to estimate mean pest densityin lieu of counting individual pests. The use of sequential hypothesis testing procedures can signif-icantly reduce the number of samples required to make a treatment decision. Here we construct amean-proportion relationship for Oligonychus perseae Tuttle, Baker, and Abatiello, a mite pest ofavocados, from empirical data, and develop a sequential presence-absence sampling plan usingBartlettÕs sequential test procedure. BartlettÕs test can accommodate pest population models thatcontain nuisance parameters that are not of primary interest. However, it requires that populationmeasurements be independent, which may not be realistic because of spatial correlation of pestdensities across trees within an orchard. We propose to mitigate the effect of spatial correlation in asequential sampling procedure by using a tree-selection rule (i.e., maximin) that sequentially selectseach newly sampled tree to be maximally spaced from all other previously sampled trees. Our proposedpresence-absence sampling methodology applies BartlettÕs test to a hypothesis test developed usingan empirical mean-proportion relationship coupled with a spatial, statistical model of pest populations,with spatial correlation mitigated via the aforementioned tree-selection rule. We demonstrate theeffectiveness of our proposed methodology over a range of parameter estimates appropriate fordensities of O. perseae that would be observed in avocado orchards in California.
KEY WORDS BartlettÕs sequential test, binomial sampling, generalized linear mixed model
Neglecting the spatial structure of pest populationscan result in an inaccurate estimation of pest densities.Spatial analyses have been previously used in studiesof diverse groups of pests of agricultural crops such aslentils (Schotzko and OÕKeeffe 1989), cotton (Goze etal. 2003), and grapes (Ifoulis and Savopoulou-Soultani2006, Ramõrez-Davila and Porcayo-Camargo 2008). Inall these studies, spatial analyses were conducted byÞrst transforming count data so as to resemble con-tinuous, normally distributed data. Generalized linearmixed models (GLMM), however, are statistical mod-els that are particularly useful for modeling discreteresponse variables that may be correlated (Breslowand Clayton 1993), such as spatially correlated countdata or presence-absence data. GLMMs have beenused across multiple scientiÞc disciplines, includingecological studies of pest populations (Candy 2000,Bianchi et al. 2008, Takakura 2009). In this article, wepropose a spatial GLMM for a sequential presence-absence sampling program for Oligonychus perseae,Tuttle, Baker, and Abatiello (Acari: Tetranychidae), apest mite of avocados (Persea americanaMiller [Lau-
raceae]) in California as an example for developingthis modeling approach.
The persea mite,O. perseae, is native to Mexico andis an invasive pest in California, Costa Rica, Spain, andIsrael. It is a foliar pest of avocados and is most dam-aging to the popular ÔHassÕ variety that accounts for94% of the total production acreage in California (Cal-ifornia Avocado Commission [CAC] 2009), it is worth�$300 million each year, and �6,000 growers farm�27,000 ha of this cultivar (CAC 2010). Feeding byhigh-density populations of O. perseae can cause ex-tensive defoliation to avocados (Hoddle et al. 2000),and in California this pest is typically controlled withpesticides (Humeres and Morse 2005). A scientiÞcallybased action threshold and economic injury level(EIL) has not been calculated for O. perseae in Cal-ifornia. However, work from Israel suggests that theEIL lies between 100 and 250 mites per leaf and therecommended action threshold is in the range of 50Ð100 mites per leaf (Moaz et al. 2011).
Counting O. perseae mites with a hand lens in theÞeld is tedious, time consuming, and an inaccurateapproach to monitor population densities for makingcontrol decisions. An alternative approach is pres-ence-absence or binomial sampling, which estimatespest population density using the proportion of leavesinfested with at least one mite versus the proportion
1 Department of Statistics, University of California, Riverside, Riv-erside, CA 92521.
2 Corresponding author, e-mail: [email protected] Department of Entomology, University of California, Riverside,
Riverside, CA 92521.
0022-0493/12/1077Ð1087$04.00/0 � 2012 Entomological Society of America
of clean leaves with no mites. Presence-absence sam-pling is fast, simple, and allows large areas to be sur-veyed quickly to quantify pest damage. Presence-ab-sence sampling programs have been developed for avariety of agricultural pests including other spidermite species, eriophyid mites, aphids, ßea beetles, leafhoppers, whiteßies, mealybugs, and leaf miners (Ala-tawi et al. 2005, Binns et al. 2000, Galvan et al. 2007,Hall et al. 2007, Hyung Lee et al. 2007, Kabaluk et al.2006, Martinez-Ferrer et al. 2006, Robson et al. 2006).
Sequential sampling procedures are considered acost effective approach to assessing pest densities(Mulekar et al. 1993, Young and Young 1998, Binns etal. 2000). Cost savings accrue in comparison to Þxedsample size procedures, because sequential proce-dures often require a signiÞcantly reduced number ofsampled observations to reach a treatment decision,which can result in appreciable savings in the cost ofsampling. In applications of sequential sampling,WaldÕs (1947) sequential probability ratio test (SPRT)is the most often used approach. WaldÕs SPRT is usefulfor sampling programs when it can be assumed that,aside from the primary parameter of interest, there areno additional unknown parameters (i.e., nuisance pa-rameters) in the model.
In the case of independent and identically distrib-uted (IID) samples, a modiÞcation to WaldÕs SPRTresults in BartlettÕs (1946) SPRT, which can be appliedto pest count models containing nuisance parameters(Shah et al. 2009). However, spatial correlation of pestpopulations violates the independence assumption re-quired for BartlettÕs SPRT. In related work on spatiallycorrelated pest count data, Li et al. (2012) proposeda Þrst-stage initial sample used to assess the effectiverange of spatial correlation, followed by a second-stage sampling procedure in which each sampled ob-servation is outside of the effective range of all pre-viously sampled observations. Sampling outside of theeffective range eliminates any spatial correlation sothat BartlettÕs SPRT may be applied. In this article, wepropose to sequentially sample observations for O.perseae so that each sampled observation is maximallyspaced from all other previously sampled observa-tions, thereby eliminating spatial correlation. Thissampling strategy eliminates the necessity of an initial,Þrst-stage sample as proposed by Li et al. (2012), and
we demonstrate its effectiveness for mitigating spatialcorrelation sufÞciently to allow the application of Bar-tlettÕs SPRT for a range of parameter estimates appro-priate toO. perseae in California avocado orchards. Toour knowledge, this article is the Þrst to combinesequential hypothesis testing techniques with pres-ence-absence sampling strategies that account for spa-tial correlation of pest densities.
Materials and Methods
Mean-Proportion Relationship. The essential com-ponent of a presence-absence sampling plan is anaccurate relationship between the mean pest density,M, and the proportion of leaves infested with at leastone pest individual, P. The mean-proportion relation-ship can be modeled using an empirical equation(Kono and Sugino 1958, Gerrard and Chaing 1970),which has been used to develop binomial samplingplans for pests (Hall et al. 2007, Martinez-Ferrer et al.2006),
ln(�ln�1 � P�) � a � b � ln�M� [1]
The parameters a and b can be Þt using linear regres-sion.
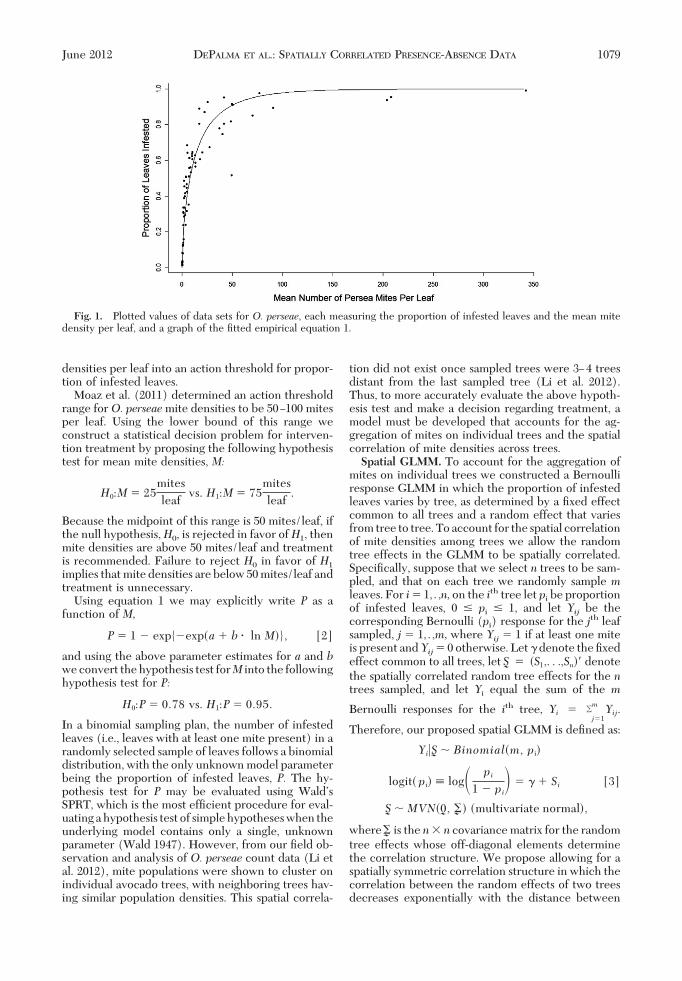
To construct a mean-proportion relationship forO.perseae,Hass avocado leaves were collected randomlyfrom nine avocado orchards in Southern Californiaacross various years (Table 1), and counts of all O.perseae stages (except eggs) were performed usingstereomicroscopes. Seventy-two mite count data sets(incorporating 30,656 leaves with a density range of0Ð342 mites per leaf) were used to Þt equation 1, withresulting parameter estimates a � �1.72762 and b ��0.66527. This relationship is shown in Fig. 1 wherewe plotted the 72 data pairs of mean pest density perleaf and proportion of infested leaves, along with theÞtted empirical equation 1.Presence-Absence Sampling Hypothesis Test. The
mean-proportion relationship allows a pest controladviser to estimate the mean density of mites per leafwithout counting individual mites. This is achieved bysampling a number of leaves and determining theproportion of leaves for which at least one mite ispresent. In our context, we use the mean-proportionrelationship to convert an action threshold for mite
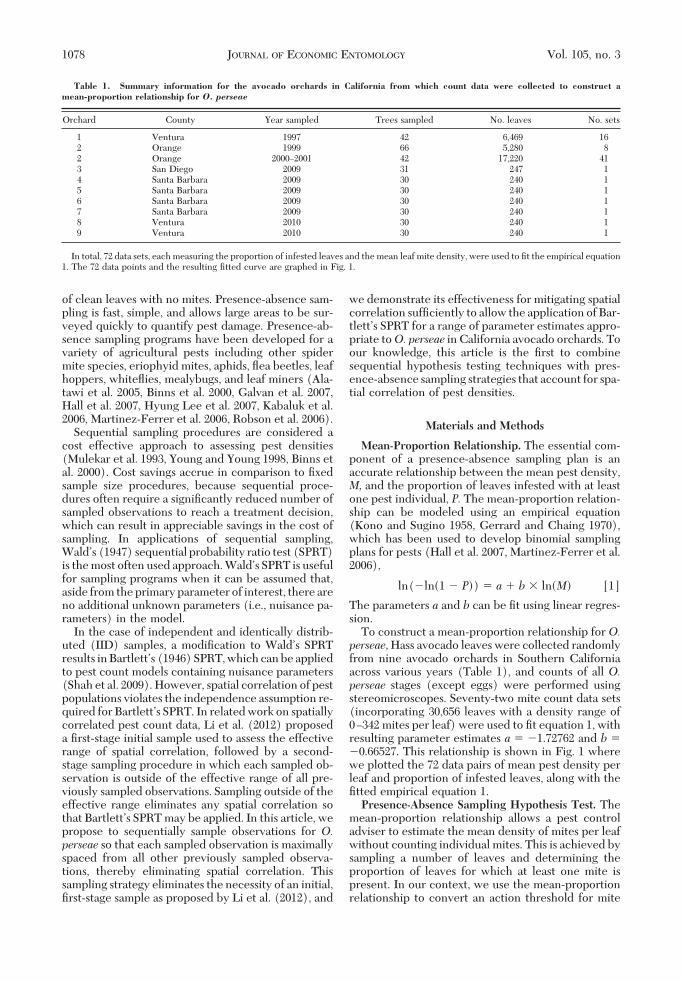
Table 1. Summary information for the avocado orchards in California from which count data were collected to construct amean-proportion relationship for O. perseae
Orchard County Year sampled Trees sampled No. leaves No. sets
1 Ventura 1997 42 6,469 162 Orange 1999 66 5,280 82 Orange 2000Ð2001 42 17,220 413 San Diego 2009 31 247 14 Santa Barbara 2009 30 240 15 Santa Barbara 2009 30 240 16 Santa Barbara 2009 30 240 17 Santa Barbara 2009 30 240 18 Ventura 2010 30 240 19 Ventura 2010 30 240 1
In total, 72 data sets, each measuring the proportion of infested leaves and the mean leaf mite density, were used to Þt the empirical equation1. The 72 data points and the resulting Þtted curve are graphed in Fig. 1.
1078 JOURNAL OF ECONOMIC ENTOMOLOGY Vol. 105, no. 3
densities per leaf into an action threshold for propor-tion of infested leaves.
Moaz et al. (2011) determined an action thresholdrange forO. perseaemite densities to be 50Ð100 mitesper leaf. Using the lower bound of this range weconstruct a statistical decision problem for interven-tion treatment by proposing the following hypothesistest for mean mite densities, M:
H0:M � 25mites
leafvs. H1:M � 75
mites
leaf.
Because the midpoint of this range is 50 mites/leaf, ifthe null hypothesis,H0, is rejected in favor ofH1, thenmite densities are above 50 mites/leaf and treatmentis recommended. Failure to reject H0 in favor of H1
implies that mite densities are below 50 mites/leaf andtreatment is unnecessary.
Using equation 1 we may explicitly write P as afunction of M,
P � 1 � exp{�exp�a � b � ln M�}, [2]
and using the above parameter estimates for a and bwe convert the hypothesis test forM into the followinghypothesis test for P:
H0:P � 0.78 vs. H1:P � 0.95.
In a binomial sampling plan, the number of infestedleaves (i.e., leaves with at least one mite present) in arandomly selected sample of leaves follows a binomialdistribution, with the only unknown model parameterbeing the proportion of infested leaves, P. The hy-pothesis test for P may be evaluated using WaldÕsSPRT, which is the most efÞcient procedure for eval-uatingahypothesis testof simplehypotheseswhen theunderlying model contains only a single, unknownparameter (Wald 1947). However, from our Þeld ob-servation and analysis of O. perseae count data (Li etal. 2012), mite populations were shown to cluster onindividual avocado trees, with neighboring trees hav-ing similar population densities. This spatial correla-
tion did not exist once sampled trees were 3Ð4 treesdistant from the last sampled tree (Li et al. 2012).Thus, to more accurately evaluate the above hypoth-esis test and make a decision regarding treatment, amodel must be developed that accounts for the ag-gregation of mites on individual trees and the spatialcorrelation of mite densities across trees.Spatial GLMM. To account for the aggregation of
mites on individual trees we constructed a Bernoulliresponse GLMM in which the proportion of infestedleaves varies by tree, as determined by a Þxed effectcommon to all trees and a random effect that variesfrom tree to tree. To account for the spatial correlationof mite densities among trees we allow the randomtree effects in the GLMM to be spatially correlated.SpeciÞcally, suppose that we select n trees to be sam-pled, and that on each tree we randomly sample mleaves. For i� 1,É,n, on the ith tree let pi be proportionof infested leaves, 0 � pi � 1, and let Yij be thecorresponding Bernoulli (pi) response for the jth leafsampled, j � 1,É,m, where Yij � 1 if at least one miteis present andYij� 0 otherwise. Let � denote the Þxedeffect common to all trees, let �S � �S1,. . .,Sn�� denote
the spatially correlated random tree effects for the ntrees sampled, and let Yi equal the sum of the m
Bernoulli responses for the ith tree, Yi � �j�1
mYij.
Therefore, our proposed spatial GLMM is deÞned as:
Yi��S � Binomial�m, pi�
logit� pi� � log� pi
1 � pi� � � � Si [3]
�S � MVN��0, ��� �multivariate normal�,
where �� is the n n covariance matrix for the random
tree effects whose off-diagonal elements determinethe correlation structure. We propose allowing for aspatially symmetric correlation structure in which thecorrelation between the random effects of two treesdecreases exponentially with the distance between
Fig. 1. Plotted values of data sets for O. perseae, each measuring the proportion of infested leaves and the mean mitedensity per leaf, and a graph of the Þtted empirical equation 1.
June 2012 DEPALMA ET AL.: SPATIALLY CORRELATED PRESENCE-ABSENCE DATA 1079
the trees, known as a spatial exponential correlationstructure (Schabenberger and Gotway 2005). Withthis correlation structure, the (i, i�) element of �� is
�2 exp(�di,i�/), where di,iÕ is the Euclidean distancebetween the i-th and iÕ-th trees, is a scale parameterthat dictates the strength of the spatial correlation, and�2 is a scale parameter that determines the variabilityof the random tree effect on an individual tree. Underthis parameterization it can easily be shown that theeffective range of the spatial correlation is 3, and thatfor tree-separation distances beyond this range thespatial correlation is essentially diminished (Schaben-berger and Gotway 2005).Spatial GLMM Hypothesis Test. It follows from
equation 3 that for each tree the proportion of infestedleaves, pi, is a logit-normal random variable with pa-rameters � and �2. Although the mean of a logit-normal random variable cannot be analytically relatedto its parameters, a simple analytic relation exists be-tween � and the median of pi,
� � log� median� pi�
1 � median� pi�� . [4]
In the spatial GLMM model the proportion of infestedleaves varies from tree to tree, and a pest managerseeking to make a treatment decision for an entireorchard may use median (pi) as a measure of theproportion of infested leaves over the entire orchard.Thus, using the spatial GLMM the hypothesis test wepreviously derived forO. perseae in terms of Pmay beconverted into a hypothesis test for � as follows:
H0:� � log� 0.78
1 � 0.78� � 1.27 vs. H1:�
� log� 0.95
1 � 0.95� � 2.94. [5]
Hence, the median pest density over an entire orchardis determined by the spatial GLMM parameter �,whereas �2, and are nuisance parameters.Bartlett’s SPRT. In a model without nuisance pa-
rameters, WaldÕs SPRT is the most efÞcient test ofsimple hypotheses, requiring the minimum number ofexpected samples among all hypothesis tests with thesame Type-1 (falsely reject H0) and Type-2 (falselyfail to reject H0) error rates. In a model that containsnuisance parameters, Bartlett (1946) proved that, ifthe samples are independent and identically distrib-uted (IID), then the Type-1,-2 error rates are asymp-totically preserved if the nuisance parameters are re-placed with their conditional maximum likelihoodestimates at each stage of the sequential testing pro-cedure.
In the context of this study, the IID assumption ofBartlettÕs SPRT is achieved if spatial correlation is notpresent, and in a subsequent section we propose atree-selection rule that effectively diminishes any spa-tial correlation. Hence, throughout this section wepresume that our proposed spatial GLMM has beenreduced to a GLMM with no spatial correlation ( �0) to which BartlettÕs SPRT may be applied.
We apply BartlettÕs SPRT to the observations
Y1,Y2,. . .�, where Yi is the number of mite-infestedleaves on the ith tree among them leaves sampled, withm determined in the next section. The sequential testfor subsequent sampling occasions is based on thelog-likelihood ratio,
n � log f��Yn;�1,�n2��1��/f��Yn;�0,�n
2��0���.
[6]
Here, n denotes the current number of trees sampled
in the sequential procedure, �Yn � �Y1,. . .,Yn�� are the
current observed responses, and the likelihoods areobtained from equation 3 by integrating out the ran-
dom effects, �Sn � �S1,. . .,Sn��, assuming � 0,
f��Yn;�,�2� � � . . .� nf��Yn��Sn� � f��Sn�d�Sn
� � . . .� ni�1
n � mYi �piYi�1 � pi�m�Yi�
� 1
��2��n����exp��
1
2�Sn����1�Sn��d�Sn
� i�1
n �� mYi �� exp�� � Si�
1 � exp�� � Si��Yi
�1 �exp�� � Si�
1 � exp�� � Si��m�Yi
�1
�2��2exp
��1
2�2Si2�dSi� . [7]
Equation 7 consists of a product of n one-dimensionalintegrals, each of which is easily numerically evaluatedusing GaussÐHermite quadrature. For � � �0,�1�, �n
2���denotes the conditional MLE of the unknown nuisanceparameter �2 obtained by setting � in equation 7 to �0
or �1, respectively, and then maximizing the right-hand side with respect to �2. For the hypothesis testin equation 6 used to make a treatment decision forO.perseae, �0 � 1.27 and �1 � 2.94.
The upper and lower stopping boundaries of Bar-tlettÕs SPRT are
A � ln�
1 � �� and B � ln�1 �
� � , [8]
respectively, so that BartlettÕs SPRT rejectsH0 in favorof H1 at the Þrst n for which n � B, fails to reject H0
in favor of H1 at the Þrst n for which n � A andcontinues by sampling another tree ifA n B.Theresulting Type-1 and Type-2 error rates asymptoticallysatisfy P(Reject H0H0) � � and P(Fail to rejectH0H1) � , respectively, so that � and are Type-1,2error rate upper bounds, respectively.
1080 JOURNAL OF ECONOMIC ENTOMOLOGY Vol. 105, no. 3
Leaf-Selection Rules and Sampling Cost. To deter-mine the optimal number of leaves to sample per tree,m, and assuming that our tree-selection rule has ef-fectively diminished spatial correlation ( � 0), weconducted a simulation study to analyze average sam-ple numbers (ASN) of BartlettÕs SPRT applied to thehypothesis test in equation 6, over a range ofm and �2
parameter values appropriate toO. perseae, and Type-1,-2 error rate upper bounds of � � 0.10 and � 0.10.
LetN denote the number of sampled trees requiredto reach the stopping rule in BartlettÕs SPRT. As thenumber of leaves sampled per tree, m, increases, theexpected number of sampled trees, E(N) decreases,but the expected total number of sampled leaves, m �E(N) increases (see the Results section for details). Todetermine an optimal value for m, we constructed asimple sampling cost function that includes a samplingcost for each tree and an additional sampling cost foreach leaf:
Cost � �cost per tree� � N � �cost per leaf� � m � N
[9]
For a given value of m the expected cost, E(Cost),depends on E(N) that varies with �. For each value ofm, we evaluate E(N) at the value of �, say �max, forwhich E(N) is maximized. We choose m to minimizethe expected cost, which up to a constant of propor-tionality can be written as:
E�Cost� � �1 � cm� � E�N���max,
where c �cost per leaf
cost per tree. [10]
In practice, the costs associated with selecting an ad-ditional leaf should be much less than the costs asso-ciated with selecting and locating an additional tree, sothat the leaf-to-tree cost ratio, c, should be much lessthan one. Given a value of c 1, E(Cost) versus m isplotted and in the resulting graph an optimal value ofc 1, E(Cost) versus m is chosen so as to minimizeE(Cost).Sequential Maximin Tree-Selection Rule. To miti-
gate spatial correlation of mite counts between adja-
cent trees we propose to sequentially select each treeto be maximally spaced from all other previously se-lected trees. We base our notion of Ômaximally spacedÕon a maximin distance criterion, in which each tree isselected so as to maximize the minimum distance it hasto all other previously selected trees. A design con-structed by this rule has been referred to as a Ôcoffee-houseÕ design for the similar way in which customersselect their tables in a coffee-house (Muller 2007).
In a nonsequential, Þxed-size spatial sampling set-ting, maximin designs possess optimality propertiesthat we now brießy describe. In a Þxed-size samplingsetting, a maximin design simultaneously selects allpoints so that the minimum distance between all pairsof selected points is maximized. The index of a Þxed-size maximin design is the number of pairs of pointsseparated by this maximal, minimum distance. For anystatistical model in which the correlation between twopoints is a decreasing function of the distance betweenthe two points, a Þxed-size maximin design of smallestindex is asymptotically related to an optimal designthat minimizes the variances of parameter estimates(Johnson et al. 1990). This result enables the con-struction of an asymptotically optimal Þxed-size sam-pling design based on geometric criteria alone.
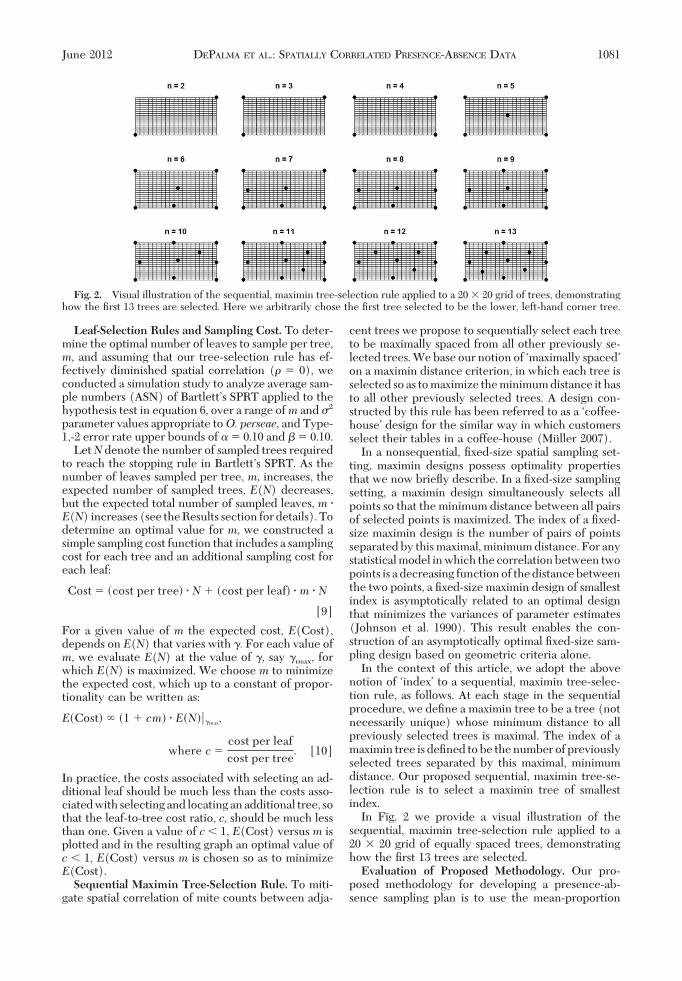
In the context of this article, we adopt the abovenotion of ÔindexÕ to a sequential, maximin tree-selec-tion rule, as follows. At each stage in the sequentialprocedure, we deÞne a maximin tree to be a tree (notnecessarily unique) whose minimum distance to allpreviously selected trees is maximal. The index of amaximin tree is deÞned to be the number of previouslyselected trees separated by this maximal, minimumdistance. Our proposed sequential, maximin tree-se-lection rule is to select a maximin tree of smallestindex.
In Fig. 2 we provide a visual illustration of thesequential, maximin tree-selection rule applied to a20 20 grid of equally spaced trees, demonstratinghow the Þrst 13 trees are selected.Evaluation of Proposed Methodology. Our pro-
posed methodology for developing a presence-ab-sence sampling plan is to use the mean-proportion
Fig. 2. Visual illustration of the sequential, maximin tree-selection rule applied to a 20 20 grid of trees, demonstratinghow the Þrst 13 trees are selected. Here we arbitrarily chose the Þrst tree selected to be the lower, left-hand corner tree.
June 2012 DEPALMA ET AL.: SPATIALLY CORRELATED PRESENCE-ABSENCE DATA 1081
relationship coupled with the spatial GLMM to con-struct the treatment decision hypothesis test in equa-tion 5, to which we apply BartlettÕs SPRT coupled withthe sequential, maximin tree-selection rule and theleaf-selection rule. We validate the proposed meth-odology by verifying that the sequential, maximintree-selection rule successfully diminishes spatial cor-relation sufÞcient to preserve the Type-1,2 error ratesof BartlettÕs SPRT applied to the hypothesis test inequation 5, for a range of �2 and parameter valuesappropriate to O. perseae.
In a simulation study we simulated presence-ab-sence data from a spatial GLMM for a range of valuesof the spatial correlation parameter, , and the nui-sance parameter, �2, appropriate to O. perseae. As-suming the optimal leaf selection rule ofm� 6 leavesper tree (see Results section), we simulated data froma 20 20 grid of 400 equally spaced trees. For eachsimulation we evaluated the hypothesis test in equa-tion 5 by applying BartlettÕs SPRT with Type-1,2 errorrate upper bounds of � � 0.10 and � 0.10. However,we truncated BartlettÕs SPRT so that the maximumpossible number of trees sampled is 10% of the or-chard, or 40 trees in this example. If a stopping rule hadnot been reached after 40 trees had been sampled,then the sequential procedure was halted and a de-cision made based on whether the sequential hypoth-esis test statistic, 40, was closer to B the stopping ruleupper boundary (reject H0), or closer to A, the stop-ping rule lower boundary (fail to reject H0).
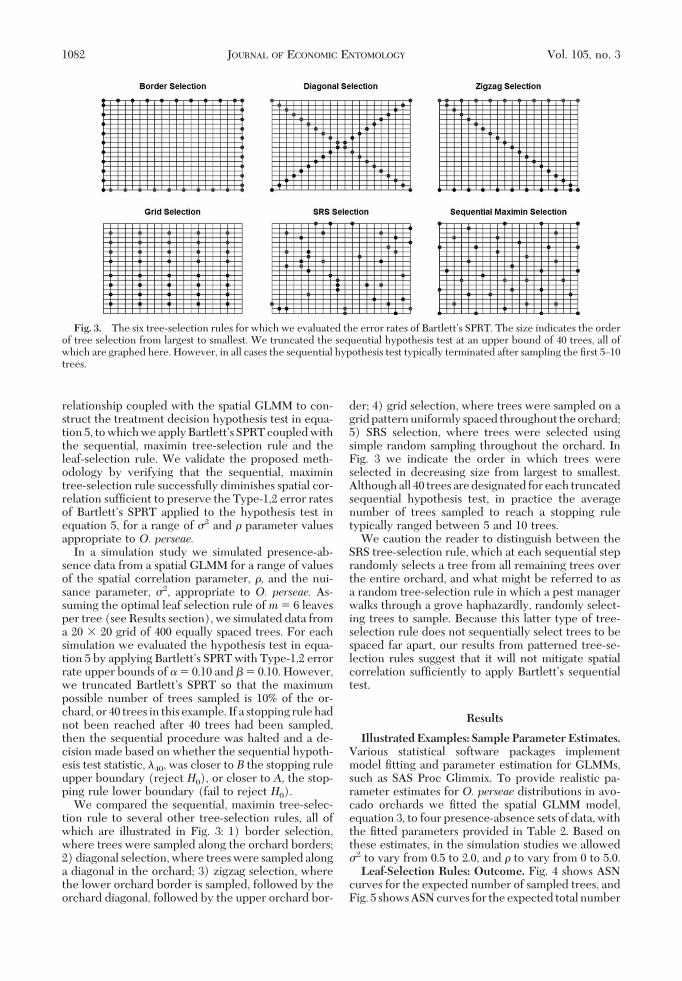
We compared the sequential, maximin tree-selec-tion rule to several other tree-selection rules, all ofwhich are illustrated in Fig. 3: 1) border selection,where trees were sampled along the orchard borders;2) diagonal selection, where trees were sampled alonga diagonal in the orchard; 3) zigzag selection, wherethe lower orchard border is sampled, followed by theorchard diagonal, followed by the upper orchard bor-
der; 4) grid selection, where trees were sampled on agridpatternuniformly spaced throughout theorchard;5) SRS selection, where trees were selected usingsimple random sampling throughout the orchard. InFig. 3 we indicate the order in which trees wereselected in decreasing size from largest to smallest.Although all 40 trees are designated for each truncatedsequential hypothesis test, in practice the averagenumber of trees sampled to reach a stopping ruletypically ranged between 5 and 10 trees.
We caution the reader to distinguish between theSRS tree-selection rule, which at each sequential steprandomly selects a tree from all remaining trees overthe entire orchard, and what might be referred to asa random tree-selection rule in which a pest managerwalks through a grove haphazardly, randomly select-ing trees to sample. Because this latter type of tree-selection rule does not sequentially select trees to bespaced far apart, our results from patterned tree-se-lection rules suggest that it will not mitigate spatialcorrelation sufÞciently to apply BartlettÕs sequentialtest.
Results
Illustrated Examples: Sample Parameter Estimates.Various statistical software packages implementmodel Þtting and parameter estimation for GLMMs,such as SAS Proc Glimmix. To provide realistic pa-rameter estimates for O. perseae distributions in avo-cado orchards we Þtted the spatial GLMM model,equation 3, to four presence-absence sets of data, withthe Þtted parameters provided in Table 2. Based onthese estimates, in the simulation studies we allowed�2 to vary from 0.5 to 2.0, and to vary from 0 to 5.0.Leaf-Selection Rules: Outcome. Fig. 4 shows ASN
curves for the expected number of sampled trees, andFig. 5 shows ASN curves for the expected total number
Fig. 3. The six tree-selection rules for which we evaluated the error rates of BartlettÕs SPRT. The size indicates the orderof tree selection from largest to smallest. We truncated the sequential hypothesis test at an upper bound of 40 trees, all ofwhich are graphed here. However, in all cases the sequential hypothesis test typically terminated after sampling the Þrst 5Ð10trees.
1082 JOURNAL OF ECONOMIC ENTOMOLOGY Vol. 105, no. 3
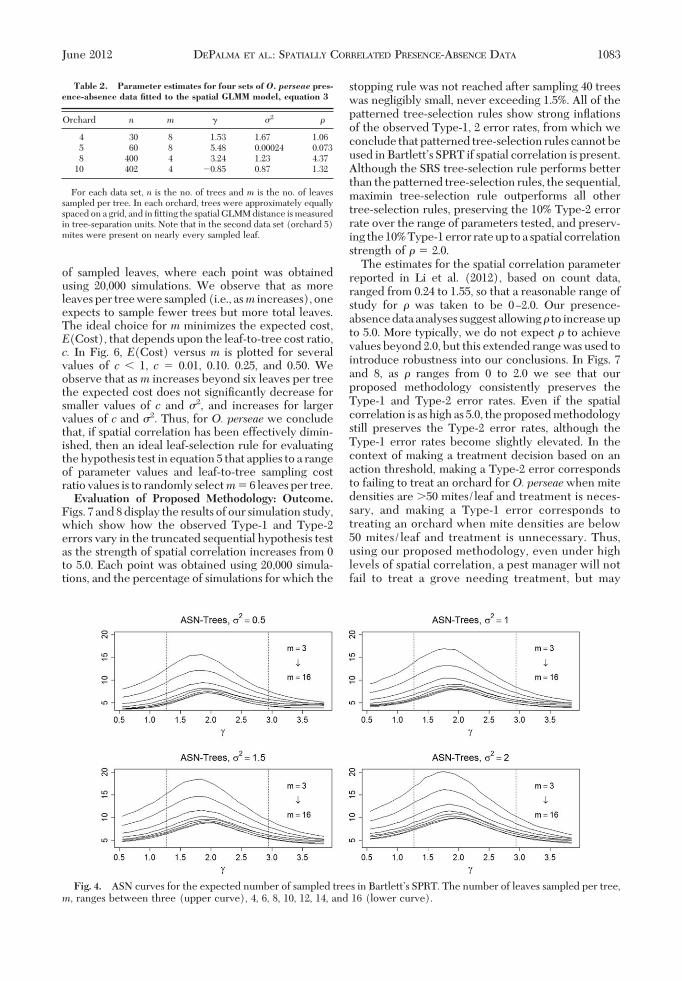
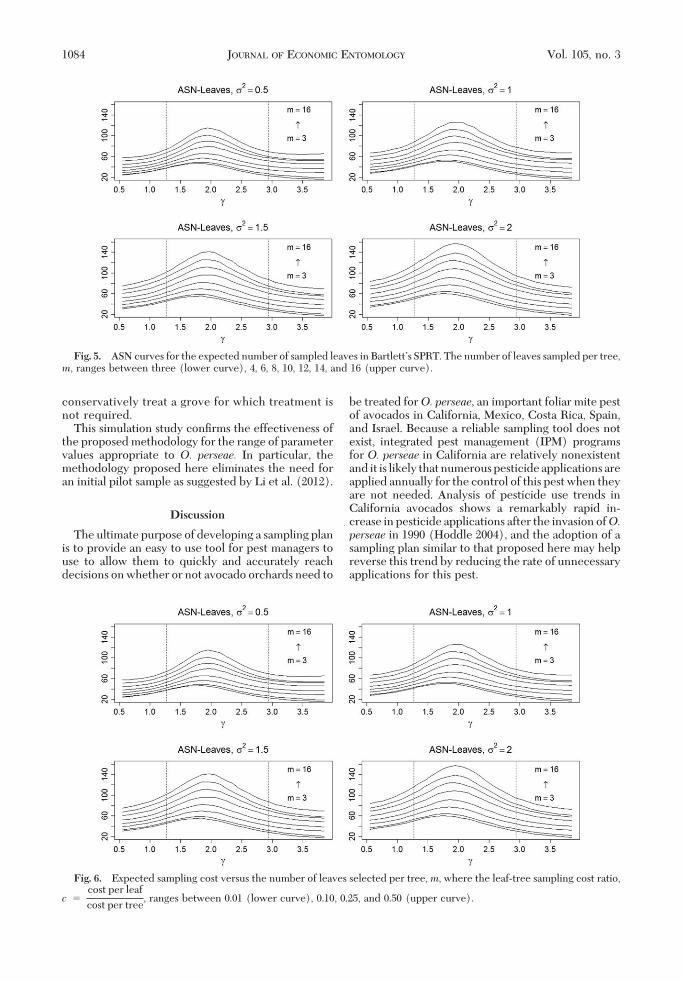
of sampled leaves, where each point was obtainedusing 20,000 simulations. We observe that as moreleaves per tree were sampled (i.e., asm increases), oneexpects to sample fewer trees but more total leaves.The ideal choice for m minimizes the expected cost,E(Cost), that depends upon the leaf-to-tree cost ratio,c. In Fig. 6, E(Cost) versus m is plotted for severalvalues of c 1, c � 0.01, 0.10. 0.25, and 0.50. Weobserve that asm increases beyond six leaves per treethe expected cost does not signiÞcantly decrease forsmaller values of c and �2, and increases for largervalues of c and �2. Thus, for O. perseae we concludethat, if spatial correlation has been effectively dimin-ished, then an ideal leaf-selection rule for evaluatingthe hypothesis test in equation 5 that applies to a rangeof parameter values and leaf-to-tree sampling costratio values is to randomly selectm� 6 leaves per tree.Evaluation of Proposed Methodology: Outcome.
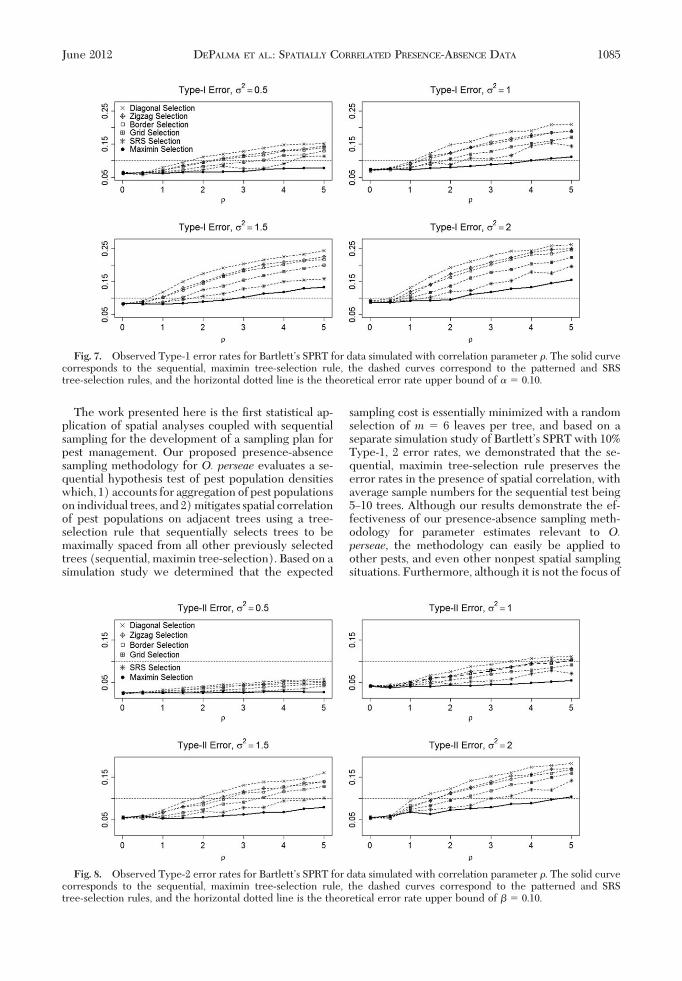
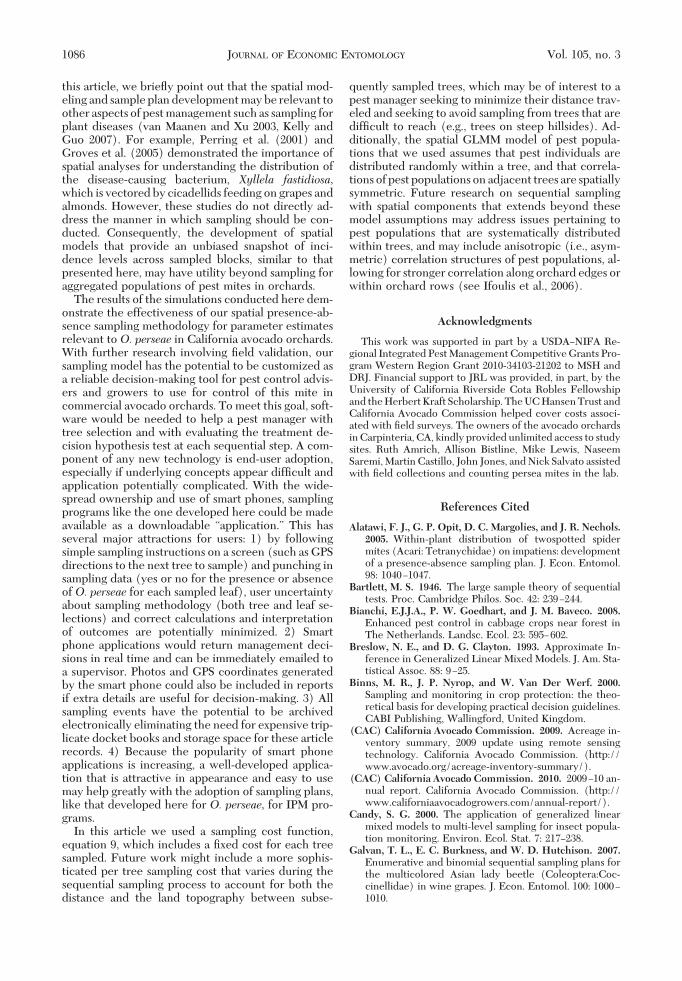
Figs. 7 and 8 display the results of our simulation study,which show how the observed Type-1 and Type-2errors vary in the truncated sequential hypothesis testas the strength of spatial correlation increases from 0to 5.0. Each point was obtained using 20,000 simula-tions, and the percentage of simulations for which the
stopping rule was not reached after sampling 40 treeswas negligibly small, never exceeding 1.5%. All of thepatterned tree-selection rules show strong inßationsof the observed Type-1, 2 error rates, from which weconclude that patterned tree-selection rules cannot beused in BartlettÕs SPRT if spatial correlation is present.Although the SRS tree-selection rule performs betterthan the patterned tree-selection rules, the sequential,maximin tree-selection rule outperforms all othertree-selection rules, preserving the 10% Type-2 errorrate over the range of parameters tested, and preserv-ing the10%Type-1error rateup toa spatial correlationstrength of � 2.0.
The estimates for the spatial correlation parameterreported in Li et al. (2012), based on count data,ranged from 0.24 to 1.55, so that a reasonable range ofstudy for was taken to be 0Ð2.0. Our presence-absencedataanalyses suggest allowing to increaseupto 5.0. More typically, we do not expect to achievevalues beyond 2.0, but this extended range was used tointroduce robustness into our conclusions. In Figs. 7and 8, as ranges from 0 to 2.0 we see that ourproposed methodology consistently preserves theType-1 and Type-2 error rates. Even if the spatialcorrelation is as high as 5.0, the proposed methodologystill preserves the Type-2 error rates, although theType-1 error rates become slightly elevated. In thecontext of making a treatment decision based on anaction threshold, making a Type-2 error correspondsto failing to treat an orchard forO. perseaewhen mitedensities are �50 mites/leaf and treatment is neces-sary, and making a Type-1 error corresponds totreating an orchard when mite densities are below50 mites/leaf and treatment is unnecessary. Thus,using our proposed methodology, even under highlevels of spatial correlation, a pest manager will notfail to treat a grove needing treatment, but may
Table 2. Parameter estimates for four sets of O. perseae pres-ence-absence data fitted to the spatial GLMM model, equation 3
Orchard n m � �2
4 30 8 1.53 1.67 1.065 60 8 5.48 0.00024 0.0738 400 4 3.24 1.23 4.37
10 402 4 �0.85 0.87 1.32
For each data set, n is the no. of trees and m is the no. of leavessampled per tree. In each orchard, trees were approximately equallyspaced on a grid, and in Þtting the spatial GLMM distance is measuredin tree-separation units. Note that in the second data set (orchard 5)mites were present on nearly every sampled leaf.
Fig. 4. ASN curves for the expected number of sampled trees in BartlettÕs SPRT. The number of leaves sampled per tree,m, ranges between three (upper curve), 4, 6, 8, 10, 12, 14, and 16 (lower curve).
June 2012 DEPALMA ET AL.: SPATIALLY CORRELATED PRESENCE-ABSENCE DATA 1083
conservatively treat a grove for which treatment isnot required.
This simulation study conÞrms the effectiveness ofthe proposed methodology for the range of parametervalues appropriate to O. perseae. In particular, themethodology proposed here eliminates the need foran initial pilot sample as suggested by Li et al. (2012).
Discussion
The ultimate purpose of developing a sampling planis to provide an easy to use tool for pest managers touse to allow them to quickly and accurately reachdecisions on whether or not avocado orchards need to
be treated forO. perseae, an important foliar mite pestof avocados in California, Mexico, Costa Rica, Spain,and Israel. Because a reliable sampling tool does notexist, integrated pest management (IPM) programsfor O. perseae in California are relatively nonexistentand it is likely that numerous pesticide applications areapplied annually for the control of this pest when theyare not needed. Analysis of pesticide use trends inCalifornia avocados shows a remarkably rapid in-crease in pesticide applications after the invasion ofO.perseae in 1990 (Hoddle 2004), and the adoption of asampling plan similar to that proposed here may helpreverse this trend by reducing the rate of unnecessaryapplications for this pest.
Fig. 5. ASN curves for the expected number of sampled leaves in BartlettÕs SPRT. The number of leaves sampled per tree,m, ranges between three (lower curve), 4, 6, 8, 10, 12, 14, and 16 (upper curve).
Fig. 6. Expected sampling cost versus the number of leaves selected per tree,m, where the leaf-tree sampling cost ratio,
c �cost per leaf
cost per tree, ranges between 0.01 (lower curve), 0.10, 0.25, and 0.50 (upper curve).
1084 JOURNAL OF ECONOMIC ENTOMOLOGY Vol. 105, no. 3
The work presented here is the Þrst statistical ap-plication of spatial analyses coupled with sequentialsampling for the development of a sampling plan forpest management. Our proposed presence-absencesampling methodology for O. perseae evaluates a se-quential hypothesis test of pest population densitieswhich, 1) accounts for aggregation of pest populationson individual trees, and 2) mitigates spatial correlationof pest populations on adjacent trees using a tree-selection rule that sequentially selects trees to bemaximally spaced from all other previously selectedtrees (sequential, maximin tree-selection). Based on asimulation study we determined that the expected
sampling cost is essentially minimized with a randomselection of m � 6 leaves per tree, and based on aseparate simulation study of BartlettÕs SPRT with 10%Type-1, 2 error rates, we demonstrated that the se-quential, maximin tree-selection rule preserves theerror rates in the presence of spatial correlation, withaverage sample numbers for the sequential test being5Ð10 trees. Although our results demonstrate the ef-fectiveness of our presence-absence sampling meth-odology for parameter estimates relevant to O.perseae, the methodology can easily be applied toother pests, and even other nonpest spatial samplingsituations. Furthermore, although it is not the focus of
Fig. 7. Observed Type-1 error rates for BartlettÕs SPRT for data simulated with correlation parameter . The solid curvecorresponds to the sequential, maximin tree-selection rule, the dashed curves correspond to the patterned and SRStree-selection rules, and the horizontal dotted line is the theoretical error rate upper bound of � � 0.10.
Fig. 8. Observed Type-2 error rates for BartlettÕs SPRT for data simulated with correlation parameter . The solid curvecorresponds to the sequential, maximin tree-selection rule, the dashed curves correspond to the patterned and SRStree-selection rules, and the horizontal dotted line is the theoretical error rate upper bound of � 0.10.
June 2012 DEPALMA ET AL.: SPATIALLY CORRELATED PRESENCE-ABSENCE DATA 1085
this article, we brießy point out that the spatial mod-eling and sample plan development may be relevant toother aspects of pest management such as sampling forplant diseases (van Maanen and Xu 2003, Kelly andGuo 2007). For example, Perring et al. (2001) andGroves et al. (2005) demonstrated the importance ofspatial analyses for understanding the distribution ofthe disease-causing bacterium, Xyllela fastidiosa,which is vectored by cicadellids feeding on grapes andalmonds. However, these studies do not directly ad-dress the manner in which sampling should be con-ducted. Consequently, the development of spatialmodels that provide an unbiased snapshot of inci-dence levels across sampled blocks, similar to thatpresented here, may have utility beyond sampling foraggregated populations of pest mites in orchards.
The results of the simulations conducted here dem-onstrate the effectiveness of our spatial presence-ab-sence sampling methodology for parameter estimatesrelevant to O. perseae in California avocado orchards.With further research involving Þeld validation, oursampling model has the potential to be customized asa reliable decision-making tool for pest control advis-ers and growers to use for control of this mite incommercial avocado orchards. To meet this goal, soft-ware would be needed to help a pest manager withtree selection and with evaluating the treatment de-cision hypothesis test at each sequential step. A com-ponent of any new technology is end-user adoption,especially if underlying concepts appear difÞcult andapplication potentially complicated. With the wide-spread ownership and use of smart phones, samplingprograms like the one developed here could be madeavailable as a downloadable “application.” This hasseveral major attractions for users: 1) by followingsimple sampling instructions on a screen (such as GPSdirections to the next tree to sample) and punching insampling data (yes or no for the presence or absenceof O. perseae for each sampled leaf), user uncertaintyabout sampling methodology (both tree and leaf se-lections) and correct calculations and interpretationof outcomes are potentially minimized. 2) Smartphone applications would return management deci-sions in real time and can be immediately emailed toa supervisor. Photos and GPS coordinates generatedby the smart phone could also be included in reportsif extra details are useful for decision-making. 3) Allsampling events have the potential to be archivedelectronically eliminating the need for expensive trip-licate docket books and storage space for these articlerecords. 4) Because the popularity of smart phoneapplications is increasing, a well-developed applica-tion that is attractive in appearance and easy to usemay help greatly with the adoption of sampling plans,like that developed here for O. perseae, for IPM pro-grams.
In this article we used a sampling cost function,equation 9, which includes a Þxed cost for each treesampled. Future work might include a more sophis-ticated per tree sampling cost that varies during thesequential sampling process to account for both thedistance and the land topography between subse-
quently sampled trees, which may be of interest to apest manager seeking to minimize their distance trav-eled and seeking to avoid sampling from trees that aredifÞcult to reach (e.g., trees on steep hillsides). Ad-ditionally, the spatial GLMM model of pest popula-tions that we used assumes that pest individuals aredistributed randomly within a tree, and that correla-tions of pest populations on adjacent trees are spatiallysymmetric. Future research on sequential samplingwith spatial components that extends beyond thesemodel assumptions may address issues pertaining topest populations that are systematically distributedwithin trees, and may include anisotropic (i.e., asym-metric) correlation structures of pest populations, al-lowing for stronger correlation along orchard edges orwithin orchard rows (see Ifoulis et al., 2006).
Acknowledgments
This work was supported in part by a USDAÐNIFA Re-gional Integrated Pest Management Competitive Grants Pro-gram Western Region Grant 2010-34103-21202 to MSH andDRJ. Financial support to JRL was provided, in part, by theUniversity of California Riverside Cota Robles Fellowshipand the Herbert Kraft Scholarship. The UC Hansen Trust andCalifornia Avocado Commission helped cover costs associ-ated with Þeld surveys. The owners of the avocado orchardsin Carpinteria, CA, kindly provided unlimited access to studysites. Ruth Amrich, Allison Bistline, Mike Lewis, NaseemSaremi, Martin Castillo, John Jones, and Nick Salvato assistedwith Þeld collections and counting persea mites in the lab.
References Cited
Alatawi, F. J., G. P. Opit, D. C. Margolies, and J. R. Nechols.2005. Within-plant distribution of twospotted spidermites (Acari: Tetranychidae) on impatiens: developmentof a presence-absence sampling plan. J. Econ. Entomol.98: 1040Ð1047.
Bartlett, M. S. 1946. The large sample theory of sequentialtests. Proc. Cambridge Philos. Soc. 42: 239Ð244.
Bianchi, E.J.J.A., P. W. Goedhart, and J. M. Baveco. 2008.Enhanced pest control in cabbage crops near forest inThe Netherlands. Landsc. Ecol. 23: 595Ð602.
Breslow, N. E., and D. G. Clayton. 1993. Approximate In-ference in Generalized Linear Mixed Models. J. Am. Sta-tistical Assoc. 88: 9Ð25.
Binns, M. R., J. P. Nyrop, and W. Van Der Werf. 2000.Sampling and monitoring in crop protection: the theo-retical basis for developing practical decision guidelines.CABI Publishing, Wallingford, United Kingdom.
(CAC) California Avocado Commission. 2009. Acreage in-ventory summary, 2009 update using remote sensingtechnology. California Avocado Commission. (http://www.avocado.org/acreage-inventory-summary/).
(CAC) California Avocado Commission. 2010. 2009Ð10 an-nual report. California Avocado Commission. (http://www.californiaavocadogrowers.com/annual-report/).
Candy, S. G. 2000. The application of generalized linearmixed models to multi-level sampling for insect popula-tion monitoring. Environ. Ecol. Stat. 7: 217Ð238.
Galvan, T. L., E. C. Burkness, and W. D. Hutchison. 2007.Enumerative and binomial sequential sampling plans forthe multicolored Asian lady beetle (Coleoptera:Coc-cinellidae) in wine grapes. J. Econ. Entomol. 100: 1000Ð1010.
1086 JOURNAL OF ECONOMIC ENTOMOLOGY Vol. 105, no. 3
Gerrard, D. J., and H. C. Chaing. 1970. Density estimationof corn rootworm egg populations based upon frequencyof occurrence. Ecology 51: 237Ð245.
Goze, E., S. Nibouche, and J. P. Deguine. 2003. Spatial andprobability distribution of Helicoverpa armigera (Hub-ner)(Lepidoptera:Noctuidae) incotton: systematic sam-pling, exact conÞdence intervals and sequential test. En-viron. Entomol. 32: 1203Ð1210.
Groves, R. L., J. Chen, E. L. Civerolo, M. W. Freeman, andM. A. Viveros. 2005. Spatial analysis of almond leafscorch disease in the San Joaquin Valley of California:factors affecting pathogen distribution and spread. PlantDis. 89: 581Ð589.
Hall, D. G., C. C. Childers, and J. E. Eger. 2007. Binomialsampling to estimate rust mite (Acari: Eriophyidae) den-sities on orange fruit. J. Econ. Entomol. 100: 233Ð240.
Hoddle, M. S. 2004. Invasions of leaf feeding arthropods:why are so many new pests attacking California-grownavocados? Calif. Avocado Soc. Yrbk. 87: 65Ð81.
Hoddle, M. S., L. Robinson, and J. Virzi. 2000. Biologicalcontrol ofOligonychus perseaeon avocado: III. Evaluatingthe efÞcacy of varying release rates and release frequencyof Neoseiulus californicus (Acari: Phytoseiidae). Int. J.Acarol. 26: 203Ð214.
Humeres, E. C., and J. G. Morse. 2005. Baseline suscepti-bility of persea mite (Acari: Tetranychidae) to abamectinand milbemectin in avocado groves in southern Califor-nia. Exp. Appl. Acarol. 36: 51Ð59.
Hyung, D. L., J. J. Park, J.-H. Lee, K.-I. Shin, and K. Cho.2007. Evaluation of binomial sequential classiÞcationsampling plan for leafmines of Liriomyza trifoli (Diptera:Agromyzidae) in greenhouse tomatoes. Int. J. PestManag. 53: 59Ð67.
Ifoulis, A. A., andM. Savopoulou-Soultani. 2006. Use of geo-statistical analysis to characterize the distribution ofLobesia botrana (Lepidoptera: Tortricidae) larvae innorthern Greece. Environ. Entomol. 35: 497Ð506.
Johnson, M. E., L. M. Moore, and D. Ylvisaker. 1990. Min-imax and maximin distance designs. J. Stat. Plann. Infer-ence 26: 131Ð148.
Kabaluk, J. T., M. R. Binns, and R. S. Vernon. 2006. Oper-ating characteristics of full count and binomial samplingplans for green peach aphid (Hemiptera: Aphididae) inpotato. J. Econ. Entomol. 99: 987Ð992.
Kelly, M., and Q. Guo. 2007. Integrated agricultural pestmanagement through remote sensing and spatial analy-ses, pp. 191Ð207. In A. Ciancio and K. G. Mukerji (eds.),General concepts in integrated pest and disease manage-ment. Springer, Dordrecht, The Netherlands.
Kono, T., and T. Sugino. 1958. On the estimation of thedensity of rice stems infested by the rice stem borer. Jpn.J. Appl. Entomol. Zool. 2: 184Ð188.
Li, J. X., D. R. Jeske, J. L. Lara, and M. S. Hoddle. 2012.Sequential hypothesis testing with spatially correlatedcount data. Integration: Math. Theory Appl. 2: 269Ð284.
Martinez-Ferrer, M. T., J. L. Ripolles, and F. Garcia-Mari.2006. Enumerative and binomial sampling plans for cit-rus mealybug (Homoptera: Psuedococcidae) in citrusgroves. J. Econ. Entomol. 99: 993Ð1001.
Moaz, Y., S. Gal., M. Zilberstein, Y. Izhar, V. Alchanatis, M.Coll, and E. Palevsky. 2011. Determining an economicinjury level for the persea mite, Oligonychus perseae, anew pest of avocado in Israel. Entomol. Exp. Appl. 138:110Ð116.
Mulekar, M. S., L. J. Young, and J. H. Young. 1993. Testinginsect population density relative to critical densities with2-SPRT. Environ. Entomol. 22: 346Ð351.
Muller,W. 2007. Collecting spatial data: optimum design ofexperiments for random Þelds. Springer, Berlin, Ger-many.
Perring, T. M., C. A. Farrar, andM. J. Blua. 2001. Proximityto citrus inßuences PierceÕs disease in Temecula valleyvineyards. Calif. Agric. 55: 13Ð18.
Ramırez-Davila, J. F., and E. Porcayo-Camargo. 2008. Spa-tial distribution of the nymphs of Jacobiasca lybica(Hemiptera: Cicadellidae) in a vineyard in Andalucia,Spain. Rev. Colomb. Entomol. 34: 169Ð175.
Robson, J. D., M. G. Wright, and R.P.P. Almeida. 2006.Within-plant distribution and binomial sampling of Pen-talonia nigronervosa (Hemiptera: Aphididae) on banana.J. Econ. Entomol. 99: 2185Ð2190.
Schabenberger, O., and C. A. Gotway. 2005. Statisticalmethods for spatial data analysis. Chapman & Hall/CRC,Boca Raton, FL.
Schotzko, D. J., and L. E. Okeeffe. 1989. Geostatistical de-scription of the spatial-distribution of Lygus hesperus(Heteroptera: Miridae) in lentils. J. Econ. Entomol. 82:1277Ð1288.
Shah, P., D. R. Jeske, and R. Luck. 2009. Sequential hypoth-esis testing techniques for pest count models with nui-sance parameters. J. Econ. Entomol. 102: 1970Ð1976.
Takakura, K. 2009. Reconsiderations on evaluating method-ology of repellent effects: validation of indices and sta-tistical analyses. J. Econ. Entomol. 102: 1977Ð1984.
Van Maanen, A., and X. M. Xu. 2003. Modelling plant dis-ease epidemics. Eur. J. Plant Pathol. 109: 669Ð682.
Wald, A. 1947. Sequential analysis. Wiley, New York.Young, L. J., and J. H. Young. 1998. Statistical ecology. Klu-
wer Academic Publishers, Boston.
Received 18 June 2011; accepted 11 February 2012.
June 2012 DEPALMA ET AL.: SPATIALLY CORRELATED PRESENCE-ABSENCE DATA 1087