abrasion on concrete surfaces caused by … on concrete surfaces caused by hydraulic loading with...
TRANSCRIPT

Abrasion on Concrete Surfaces Caused by Hydraulic Loading with Water-Borne Sands
Mohammad Sabbir Hasan
A Thesis
In
The Department
Of
Building, Civil and Environmental Engineering
Presented in Partial Fulfilment of Requirements
For the Degree of Master of Applied Science (Civil Engineering) at
Concordia University
Montréal, Québec, Canada
August 2015
© Mohammad Sabbir Hasan, 2015

Concordia University
School of Graduate Studies
This is to certify that the thesis prepared
By: Mohammad Sabbir Hasan
Entitled: Abrasion on Concrete Surfaces Caused by Hydraulic Loading with Water-Borne Sands
and submitted in partial fulfilment of the requirements for the degree of
Master of Applied Science (Civil Engineering)
Complies with the regulations of the University and meets the accepted standards with respect to
originality and quality.
Signed by the final examining committee:
Dr. Zhi Chen Chair
Dr. Ali Dolatabadi Examiner
Dr. Lan Lin Examiner
Dr. Samuel Li Co-Supervisor
Dr. Michelle Nokken Co-Supervisor
Approved by ____________________________________________
Chair of the Department of Graduate Program Director
August, 2015 _____________________________________________
Dean of Faculty

iii
ABSTRACT
Abrasion on Concrete Surfaces Caused by Hydraulic Loading with Water-Borne Sands
Mohammad Sabbir Hasan
Hydraulic structures play an important role in regulation and transport of water in reservoirs as
well as open channels. They are also useful for flow measurement. Examples of such structures
include spillways, stilling basins, weirs, gates, and culverts. These structures commonly have
concrete surfaces. Under the impacts of water flow, the concrete surfaces suffer inevitably from
abrasive erosion. This is particularly problematic for ageing structures under the impacts of
flowing water with suspended sediment in high concentrations. Severe abrasion can cause
structural deterioration, leading to a shortened service life. It may not be possible to completely
prevent abrasion in hydraulic structures. However, it is possible to reduce abrasion by using proper
repairing materials. This study is aimed at investigating different types of repairing materials, with
respect to their suitability as a protective layer on existing concrete surfaces. This study takes the
experimental approach. Concrete specimens of cylindrical shape were cast using four types of
materials: 1) a premium quality concrete mix of Portland cement, 2) latex modified repair material,
3) silica fume fibre-reinforced repair material, and 4) fly ash fibre-reinforced repair material. The
concrete specimens were allowed to harden for a period of up to 28 days. A series of laboratory
experiments were carried out, where the flat circular surface at the top of the concrete cylinders
was subject to direct impact (for 3 to 9 hours) from a high-speed jet of a sand and water mixture
from a nozzle. Material mass loss was determined as well as the depth of jet-induced abrasion on
the top surface, abraded surface topography and abraded material volume, were measured using
3D scan technology. These measurements were analyzed using ArcGIS tools, and MATLAB
functions. Evaluations of how well the concrete specimens resisted abrasive erosion were

iv
determined through comparisons. The results show that in terms of abrasion resistance, the silica
fume material is the best among the four types of materials, whereas the concrete mix is the
poorest. The results also show that abrasion resistance of the concrete specimens increases when
they have had sufficient time to age to their maximum structural integrity. A longer exposure to
jet flow leads to higher abrasion. This study is perhaps the first to combine 3D scan and ArcGIS
technologies to investigate abrasion depth and volume of different concrete materials. This study
has led to the development of effective methods for data analysis and interpretation.

v
Acknowledgement
Prima facea, I am grateful to the Almighty God for the good health and wellbeing that were
necessary to complete this research.
I would like to express my special appreciation and thanks to my supervisors Dr. Samuel Li and
Dr. Michelle Nokken. Both of them have been a tremendous mentor for me. I am thankful for their
aspiring guidance, invaluably constructive criticism and friendly advice during the research
project. I am sincerely grateful to them for sharing their truthful and illuminating views on a
number of issues related to the research project.
A special thanks to Dr. Attila Michael Zsaki, I am extremely grateful to him for his expert, sincere,
valuable guidance and without his help it would not be possible to use 3D scan technology in my
research project.
A special thanks to my family. Words cannot express how grateful I am with my mother and father
for all of the sacrifices that they have made on my behalf. Their prayer for me was what sustained
me thus far. I would also like to thank all of my friends who supported me in my study and incited
me to strive towards my goal. At the end, I would like express special appreciation to my close
friend Sarfaraz Alam for his generous support when there was no one to answer my queries.

vi
Table of Contents
1. Introduction ......................................................................................................................... 1
1.1 General Description ............................................................................................................ 1
1.2 Research Objectives ............................................................................................................ 3
1.3 Organization of Thesis ........................................................................................................ 4
2. Literature Review ................................................................................................................ 5
2.1 Introduction ......................................................................................................................... 5
2.2 Abrasion of Concrete Surface ............................................................................................. 5
2.2.1 Abrasion due to Cavitation.................................................................................................. 5
2.2.2 Abrasion due to Chemical Attack ....................................................................................... 6
2.2.3 Abrasion due to Erosion ...................................................................................................... 6
2.3 Standard ASTM Test Methods for Determining Abrasion Resistance of Concrete ........... 7
2.3.1 Measurement of Abrasion Resistance of Concrete by Sandblasting (ASTM C 418) ......... 8
2.3.2 Measurement of Abrasion Resistance of Horizontal Concrete Surface (ASTM C 779) .... 9
2.3.3 Abrasion Resistance of Concrete by Rotating-Cutter Method (ASTM C 944) ................ 12
2.3.4 Test of Abrasion Resistance of Concrete - Under Water Method (ASTM C1138) .......... 13
2.4 Factors Affecting Abrasion Resistance of Concrete ......................................................... 15
2.5 Factors Related to Environment ........................................................................................ 41
2.6 Factors Related to Casting Procedure ............................................................................... 51
3. Methodology ..................................................................................................................... 55

vii
3.1 General Description .......................................................................................................... 55
3.2 Materials Used .................................................................................................................. 55
3.2.1 Concrete Material .............................................................................................................. 56
3.2.2 Latex Modified Repair Material........................................................................................ 56
3.2.3 Silica Fume Fibre Reinforced Repair Material ................................................................. 57
3.2.4 Fly Ash Fibre Reinforced Repair Material........................................................................ 57
3.3 Procedures for Laboratory Tests and Data Analysis ......................................................... 59
3.3.1 Mixing, Casting and Curing .............................................................................................. 59
3.3.2 Strength Testing ................................................................................................................ 61
3.3.3 Description of Abrasion Test Apparatus ........................................................................... 62
3.3.4 Velocity of Water Jet Measurement .................................................................................. 68
3.3.5 Abrasion Test Procedures ................................................................................................. 69
3.3.6 Scanning in 3D Scanner and Data Processing using MATLAB ....................................... 71
3.3.7 Calculation of Abraded Volume using ArcMap ............................................................... 79
4. Test Results and Discussion .............................................................................................. 84
4.1 Introduction ....................................................................................................................... 84
4.1.1 Effect of Age of Concrete on Abrasion Resistance .......................................................... 84
4.1.2 Effect of Exposure Duration ............................................................................................. 88
4.1.3 Effects of Strength............................................................................................................. 91
4.1.4 3D Scanner Results ........................................................................................................... 94

viii
4.1.5 Relationship between Abrasion Volume Loss and Age .................................................... 98
4.1.6 Depth of Abrasion ........................................................................................................... 101
5. Conclusions and Recommendations ............................................................................... 106
5.1 Conclusions ..................................................................................................................... 106
5.2 Recommendations ........................................................................................................... 108
5.3 Research Contributions ................................................................................................... 110
6. References ....................................................................................................................... 111
7. Appendix ......................................................................................................................... 115
ix
List of Figures
Figure 2-1: Abrasive action of water-borne particle on concrete surface (Liu et al., 2006). .......... 7
Figure 2-2: Sand blasting cabinet. (ASTM C418 2012) ................................................................. 9
Figure 2-3: Revolving-Disks abrasion test apparatus (ASTM C779, 2012) ................................. 10
Figure 2-4: Dressing-wheel abrasion test apparatus (ASTM C779, 2012). .................................. 11
Figure 2-5: Ball-bearing abrasion test apparatus (ASTM C779, 2012) ........................................ 12
Figure 2-6: The Rotating cutter drill press (ASTM C944, 2012). ................................................ 13
Figure 2-7: Abrasion test apparatus (under water method) (ASTM C1138, 2012). ..................... 14
Figure 2-8: Relationship between w/cm and Abrasion erosion rate (Liu et al., 2006) ................. 16
Figure 2-9: Relationship between depth of abrasion and w/cm (Shamsai et al., 2012). ............... 17
Figure 2-10: Relationship between abrasion resistance and compressive strength of concrete.
(Witte and Backstrom 1951) ......................................................................................................... 18
Figure 2-11: Relationship between compressive strength and abrasion erosion rate (Liu et al.,
2006) ............................................................................................................................................. 19
Figure 2-12: Relationship between flexural strength and abrasion erosion rate (Liu et al., 2006)19
Figure 2-13: Abrasion Test apparatus as specified in TS699 (Gencel et al., 2011) ..................... 21
Figure 2-14: Mass loss of concrete under 5 kg load (Gencel et al., 2011) ................................... 21
Figure 2-15: Mass loss of concrete under 10kg load (Gencel et al., 2011) .................................. 22
Figure 2-16: Mass loss of concrete under 15kg load (Gencel et al., 2011) .................................. 22
Figure 2-17: The cracks on the interface of the aggregate and cement paste with w/cm = 0.05
(Liu et al., 2006)............................................................................................................................ 23

x
Figure 2-18: Influence of coarse aggregate nature on concrete abrasion resistance (Laplante et
al., 1991) ....................................................................................................................................... 24
Figure 2-19: Effect of silica fume addition on abrasion rate. (Liu, 2006) .................................... 25
Figure 2-20: Relation of abrasion volume and slag content (Wu et al., 2008). ............................ 26
Figure 2-21: Effect of fly ash on the abrasion resistance of concrete at the age of 28 days (Yen et
al., 2007). ...................................................................................................................................... 28
Figure 2-22: Effect of fly ash on the abrasion resistance of concrete at the age of 91 days. (Yen et
al., 2007) ....................................................................................................................................... 28
Figure 2-23: Depth of wear at 60 min of abrasion versus fine aggregate replacement with fly ash
(Siddique, 2003). ........................................................................................................................... 29
Figure 2-24: Fibre used for reinforcement: a) polypropylene fibres, (b) steel fibres (ME 50/10),
(c) steel fibres (ME 30/50) (Horszczaruk, 2009) .......................................................................... 30
Figure 2-25: Abrasion test results of concrete specimens: (a) mass loss, (b) mean depth of wear,
concretes with steel fibres: ME 30/50 and ME 50/1.0, PP- concrete with polypropylene fibres,
HPC – concrete without fibres (Horszczaruk, 2009). ................................................................... 31
Figure 2-26: Abrasion volume of fibre concrete from flow abrasion test. (Wu et al., 2008) ....... 33
Figure 2-27: Abrasion volume of fibre concretes vs. Test time (28 days) (Wu et al., 2008) ....... 33
Figure 2-28: Abrasion volume of fibre concretes vs. Test time (56 days) (Wu et al., 2008) ....... 33
Figure 2-29: IS 1237-1980 Abrasion test machine (Siddique et al., 2012) .................................. 34
Figure 2-30: Relationships between compressive strength and depth of wear (without fibres)
(Siddique et al., 2012) ................................................................................................................... 35
Figure 2-31: Relationships between compressive strength and depth of wear (with 0.05% fibres)
(Siddique et al., 2012) ................................................................................................................... 35
Figure 2-32: The relationship of compressive strength and abrasion erosion rate (Zoran et al.,
2012). ............................................................................................................................................ 37

xi
Figure 2-33: Abrasion erosion loss comparison between SC, PCC and RCC (Francis et al., 2002).
....................................................................................................................................................... 38
Figure 2-34: Abrasion-erosion underwater mass loss of the RefC|EMor system: (A) EMor
sample photograph after abrasion-erosion; (B) EMor sample schematic 3-D abrasion-erosion
mass loss (Korman et al., 2003). ................................................................................................... 40
Figure 2-35: Relative abrasion-erosion underwater mass loss of the repairing material systems
(Korman et al., 2003). ................................................................................................................... 41
Figure 2-38: Relationship between impact angle and abrasion rate (Liu et al., 2012). ................ 42
Figure 2-39: SEM-images of worn concrete surface (w/cm =0.36). Impacted at (a) 90and (b)
45 (Liu et al., 2012) ..................................................................................................................... 43
Figure 2-40: Worn concrete surfaces under various erodent size (w/cm = 0.36, angle of impact =
45) (Liu et al., 2012). ................................................................................................................... 44
Figure 2-41: Effect of various sand content on abrasion erosion of concrete (Liu et al., 2012). . 46
Figure 2-42: Relationship between abrasion rate and sand content in water for concrete made
with w/cm= 0.36, angle of impact 45° (Liu et al., 2012). ............................................................. 47
Figure 2-43: Water borne sand flow impinging site: (a) impinging site above crack site A and (b)
impinging site on the crack site B (Liu, 2007). ............................................................................. 48
Figure 2-44: (a) water flow impingement directly on the crack (b) water flow impingement above
the crack (Liu, 2007). .................................................................................................................... 48
Figure 2-45: Relationship between crack width and abrasion rate (Liu, 2007). ........................... 49
Figure 2-46: Effect of crack direction on the abrasion rate (Liu, 2007). ...................................... 50
Figure 2-47: Abrasion resistance of various concrete surfaces (Mindess et al., 2003). ............... 53
Figure 3-1: Curing of abrasion sample specimens in lime water.................................................. 60
Figure 3-2: Casting of beam, cylinder, and abrasion test samples. ............................................... 60

xii
Figure 3-3: ASTM C78- Third-Point Loading- half of the load applied on each third of the span
length (ASTM, 2015). ................................................................................................................... 62
Figure 3-4: Aluminum Oxide particle used in this study which is 60% of total abrasive material
....................................................................................................................................................... 63
Figure 3-5: Fine Silica used in this study which is 40% of total abrasive particle. ...................... 63
Figure 3-6: Impeller of the pump. ................................................................................................. 64
Figure 3-7: Blockage problem of the pump due to the usage of larger particles. ......................... 64
Figure 3-8: Schematic diagram of abrasion test apparatus. .......................................................... 67
Figure 3-9: Abrasion test apparatus used in this study. ................................................................ 67
Figure 3-10: The Cartesian coordinates system ............................................................................ 72
Figure 3-11: (X, Y, Z) coordinates from three-dimensional scanning, shown as blue circles. The
two arrows are the directions of most variance or PC’s. .............................................................. 74
Figure 3-12: (X, Y, Z) coordinates (blue circles) after SVD or after rotation. The two arrows or
the directions of most variance or PC’s after rotation become parallel to the axes. ..................... 74
Figure 3-13: Effective surface area of the concrete surface. The area inside the red circle (40 mm
in radius) denotes the effective area. ............................................................................................. 78
Figure 3-14: Surface area considered for calculating average depth of the specimen, which was
used as a reference height in abraded volume calculation. ........................................................... 81
Figure 3-15: TIN surface of Fly ash Modified Repair Materials sample at the age of 90 days. .. 82
Figure 3-16: Measurement of volume using "Surface Volume'' tool from a reference plane
(http://resources.arcgis.com, accessed on 15/06/2015). ................................................................ 83
Figure 4-1: The relationship between abrasion erosion rate and age of concrete at different ages.
....................................................................................................................................................... 86
Figure 4-2: Image of sample specimens used in abrasion test. From left: a) Latex modified
material, b) Fly ash modified material c) Concrete material d) Silica fume modified material ... 87

xiii
Figure 4-3: The relationship between abrasion loss and duration of exposure at the age of 28 days
with a sand density of 400kg/m3 in water. .................................................................................... 90
Figure 4-4: The relationship between abrasion loss and duration of exposure at the age of 90 days
with a sand density of 500 kg/m3 in water. ................................................................................... 91
Figure 4-5: The relationship between compressive strength and 28 day abrasion rate. ............... 93
Figure 4-6: The relationship between Flexural strength and 28 day abrasion rate. ...................... 93
Figure 4-7: Concrete material sample after 9 hour abrasion test at the age of 7 days (surface
radius 50mm) The dark red circle on the image shows the 40mm radius circle. ......................... 96
Figure 4-8:TIN surface of a Concrete Material sample after 9 hour abrasion test at the age of 7
days (surface radius 40mm) . ........................................................................................................ 96
Figure 4-9: Ringshape TIN surface of a Concrete Material sample after 9 hour abrasion test at the
age of 7 days of which average depth is zero mm. (inner radius 40mm, outer radius 48mm). .... 97
Figure 4-10: Surface profile of a concrete material sample after a 3 hour at the age of 7 days
(surface radius 50mm). ................................................................................................................. 98
Figure 4-11: The relationship between total abrasion volume loss and age of concrete at 2, 4, 7
and 28 days age. ............................................................................................................................ 99
Figure 4-12: The relationship between abrasion volume loss and age of concrete at 90 days age.
..................................................................................................................................................... 100
Figure 4-13: The relationship between volume loss and mass loss of concrete surface............. 101
Figure 4-14: The relationship between abrasion depth and age of concrete at 4, 7, 28 and 90 days
age for all four types of concrete. ............................................................................................... 104
Figure 4-15: Relationship between mass loss and maximum abrasion depth ............................ 105
xiv
List of Tables
Table 2-1 : Characteristics of fibres .............................................................................................. 36
Table 3-1 : A summary of the properties of all four types of materials used in this study ........... 58
Table 3-2: Detail configuration of Pumps .................................................................................... 66
Table 3-3 : Flow velocity and discharge ....................................................................................... 69
Table 3-4: Casting & test date of abrasion test of each sample .................................................... 70
Table 4-1: Abrasion rate of concrete materials at different age for a 3hour abrasion test ............ 86
Table 4-2: Compressive strength, flexural strength and abrasion rate of concrete at 28 days ..... 92
Table 4-3: Comparing different resolution with abrasion depth of same sample specimen ......... 95
Table 4-4: Average depth of abrasion and maximum depth of abrasion .................................... 103
xv
List of Symbols and Abbreviations
Symbols
a Affected surface area m2
b Average width of beam mm
d Average depth of beam mm
Dmax Maximum aggregate size mm
L Span length mm
P Maximum applied load N
Pv Velocity losses in the transport hoses m/s
p Pressure of water jet on the sample surface MPa
R Modulus of Rupture MPa
t Test duration min
U An orthogonal matrix
v Velocity of water jet m/s
v
Non-zero eigenvector of v
wo Critical threshold velocity m/s
w1 Mass of the sample g
w/cm Water cementing materials ratio
x1 Independent variable (age of concrete)
x2 Independent variable (compressive strength)
ρw Density of water kg/m3
ρ Density of water-sand mix kg/m3
λ Eigenvalue of B, which is a scalar

xvi
λ Aspect ratio
μ Velocity losses in the nozzle m/s
Abbreviations
ACI American Concrete Institute
ASTM ASTM International
C3S Tricalcium aluminate
EMor Epoxy mortar
FM Fineness modulus
HPC High performance concrete
HPFRC High performance fibre-reinforced concrete
PC Principal component
PMor Polymer-modified cement mortar
SEM Scanning electron microscope
SFmo Silica fume mortar
SFco Steel fibre concrete
SSD Saturated surface dry
SVD Singular value decomposition

1
1. Introduction
1.1 General Description
Durable materials are those which can last for a long span of time without significant deterioration.
As a durable material lasts for long, it conserves resources, reduces waste and saves the
environment from the negative impacts of repair and replacement. The durability of concrete is far
more important than any other material on earth as concrete is the most widely used material in
the world after water. The success of concrete lies in its ability to withstand the action of water
without serious deterioration, making it an ideal material for building structures to control, store
and transport water. Moreover, it is a versatile, strong and durable material which can be formed
into a variety of shapes and sizes. Though concrete is most used building material, it consumes a
lot of energy for its production, which is an obstacle in sustainable development. Many scientists
and researchers have been working on concrete to make it more durable so that it can perform for
a longer period. This effort will decrease the demand for the replacement of concrete which will
automatically reduce the energy consumption for its production. Also, it will save money.
Concrete is a versatile construction material. One of the most attractive properties of concrete is
that when it is newly mixed, it is plastic and malleable, but when it is hardened it becomes very
strong and durable. These qualities make concrete unique from other materials. Concrete has
various types of usage, such as for building skyscrapers, dams, bridges, sidewalks, highways, and
houses. Depending on the use, purpose and environmental conditions, concrete might need some
special qualities. That is why various types of concrete have evolved in the last decades for
different purposes. For combatting freeze thaw effects, air entrained concrete was developed.
There are many other types of concrete as well such as high performance concrete, lightweight

2
concrete, shotcrete, and roller compacted concrete. Every type of structure has its own issue.
Hydraulic structures are submerged or partially submerged in a water body and interrupting the
natural water flow. As it disrupts the natural flow of water, one of the major problems of hydraulic
structures is abrasion due to water-borne particles like sand, gravel and any other debris. These
suspended particles can cause severe damage to hydraulic concrete structures and shorten their life
span. Moreover, in North America, a majority of the hydraulic structures are reaching their
expected design life. It is not viable to replace them; costs are high and a huge amount of solid
waste is generated. Concrete is not a green material, around 5% of greenhouse gases are emitted
from cement industry alone. So repair and maintenance of structures is the best way to reduce use
of concrete and make the world more sustainable thereby saving a lot of money.
Abrasion erosion damage leads to maintenance problems in hydraulic structures. Minor abrasion-
erosion can easily be neglected, but severe abrasion can deteriorate the durability of concrete
immensely. Abrasion-erosion damage is mostly caused by the rolling and grinding effect of water-
borne particles such as silt, sand, gravel and other solid debris. To protect the hydraulic structures
from abrasion, durable and abrasion resistant concrete mixtures are needed.
There are several factors which remarkably influence abrasion resistance of concrete. These factors
can be categorized into two different groups, factors from the first group are solely related to the
properties of concrete materials such as compressive strength, aggregate properties, water cement
ratio, mixture proportions, uses of supplementary materials, fibre reinforcement, curing and
surface finishing. Factors from the second group are related to the environment around the

3
hydraulic structures such as water flow velocity, size, shape and hardness of water-borne particles,
impact angle, and frequency of impact attack.
To determine the abrasion resistance of concrete there are four distinguished ASTM standard
methods. But among the four, only one method (ASTM C1138) is directly applicable for the
abrasion in hydraulic structures. But according to several researchers (Liu 2007), this method is
not good for abrasion due to impact. The main focus of this research is to measure the abrasion
resistance of concrete due to impact. For this reason, another method has been used in this study,
which is adopted from Liu et al. (2006).
1.2 Research Objectives
There are a few goals of this exploration study, destinations are given beneath.
1. The main goal of this study is to determine the abrasion resistance of four types of concrete
repair materials which contains supplementary materials such as silica fume, fly ash, latex
etc. These repair materials will be used to repair the concrete surfaces of various kind of
hydraulic structures which are subjected to abrasion erosion due to water-borne sand.
2. Compare the abrasion resistance of various kind of repair materials in terms of abrasion
mass loss, strength, volume loss and abrasion depth.
3. Evaluate the impact of supplementary materials such as silica fume, fly ash, latex polymer
and impact of synthetic fibre (polypropylene microfirbe) on abrasion resistance and
strength of concrete.
4. In past study, abrasion resistance of concrete was analyzed in terms of abrasion mass loss,
compressive strength and abrasion depth. However, volume loss can be another medium
to assess abrasion resistance with high accuracy. One of the major focus of this study is to

4
quantify volume loss utilizing 3D scan technology and processing the data in MATLAB
and ArcGIS and establish a new methodology regarding of volume loss.
1.3 Organization of Thesis
This thesis contains of five chapters as follows:
- Chapter 1 begins with the concept of concrete durability, significance of concrete materials
and then a background of the abrasion erosion problem of hydraulic structures was
described. The scope of the research is also explained.
- Chapter 2 contains a detailed review of previous research related to concrete abrasion due
water borne particles. The influence of different parameters such as compressive strength,
w/cm ratio, admixtures, fibre reinforcement and finishing procedure on concrete abrasion
resistant are described in detail on the basis of previous works.
- Chapter 3 describes the types and properties of concrete materials used, test procedures,
methodology which was performed in the experimental program.
- Chapter 4 contains the data obtained from the test procedures. All the test results are
discussed and compared with various parameters and compared with the findings of
previous research.
- Chapters 5 and 6 present the conclusion of this study and some recommendation for future
work.

5
2. Literature Review
2.1 Introduction
This chapter includes a detailed overview of available research on abrasion erosion in concrete
hydraulic structures due to water borne particles such as sand and gravel. There are two types of
factors concerning concrete abrasion, the first type one which is solely related to concrete
properties such as w/cm ratio, concrete strength, aggregates, admixtures and the second type is
related to environment such as velocity of water flow, impact angle, types of debris or water-borne
particles. All these factors are discussed in this chapter. Moreover, the existing standard methods
for measuring abrasion resistance are also discussed.
2.2 Abrasion of Concrete Surface
Erosion on the concrete structure surface is defined as a “progressive disintegration of solid by
cavitation, abrasion or chemical action’’ in the ACI Committee 210 report (ACI, 2003). There are
basically three types of erosion processes which occur in concrete structures. They are:
1) Abrasion due to cavitation
2) Abrasion due to chemical attack
3) Abrasion due to erosion
2.2.1 Abrasion due to Cavitation
Cavitation damage can start at a point where there is a collapse in water flow due to a pressure
change. Usually cavitation bubbles will grow and travel with the water flow and collapse due to a
pressure field change. When cavitation bubbles explode close to or near a hard surface, the hard
surface faces an extremely high pressure for a very short period of time on a very small area. These
kind of high energy impacts are able to damage any kind of solid material. The cavitation process

6
in concrete is not well documented as metals, but the erosion progresses rapidly after a period of
exposure when the surface slightly roughens with tiny cracks or pits. The possible reason behind
this phenomenon is that the material beneath the surface is more vulnerable to attack the geometry
of pits thereby weakening of the materials due to fatigue load. Frizell et al. (1991) mentioned that
the erosion effect of 0.2 cavitation number is small enough to ignore. It this research, cavitation is
not considered as it is small enough to be ignored.
2.2.2 Abrasion due to Chemical Attack
There are several types of compounds in hardened concrete, which are attacked by water, salt and
acidic solutions, but in most cases the deleterious actions on an impermeable concrete surface is
so slow that it can be ignored. There are certain cases in which it might accelerate deterioration
and erosion of concrete at a rapid rate. Chemical attack is not the concern of this study so no
consideration was made for this type of erosion in this study.
2.2.3 Abrasion due to Erosion
According to ACI ‘’Abrasion erosion is a process of friction and impact of water borne particles
such as silt, sand, gravel, rocks, ice and other kind of debris over a concrete surface of a hydraulic
structure’’ (ACI 2003). The abrasion erosion impact can be easily recognized it creates a smooth,
worn-appearing surface where erosion due to cavitation leaves small holes and pits on the surface.
There are several factors which affect the rate of abrasion erosion and these factors can be
categorized into two types. The first type is related to the characteristics of flow and water-borne
particles and the second type is related to the properties of concrete itself. The major factors of the
first type are size, shape, hardness and density of particles being transported in the water, the flow

7
velocity and impact angle of water on concrete surface. Bridge piers, spillway aprons, sluiceways,
stilling basins and tunnel linings are most vulnerable to abrasion erosion (ACI 2003).
The abrasion action of a particle is divided into three stages. In the first stage, pre-abrasion peeling
occurs by water molecules which depends mainly on flow velocity and associated hydraulic
pressure. In the second stage the solid particles create an impact on the concrete surface and this
impact is dependent on the particle size and hardness of water-borne particles. And in the third
stage, abrasion erosion action occurs which is associated with the combined effects of the water
borne particle hardness and shape, flow velocity and interfacial bonds of concrete materials (Liu
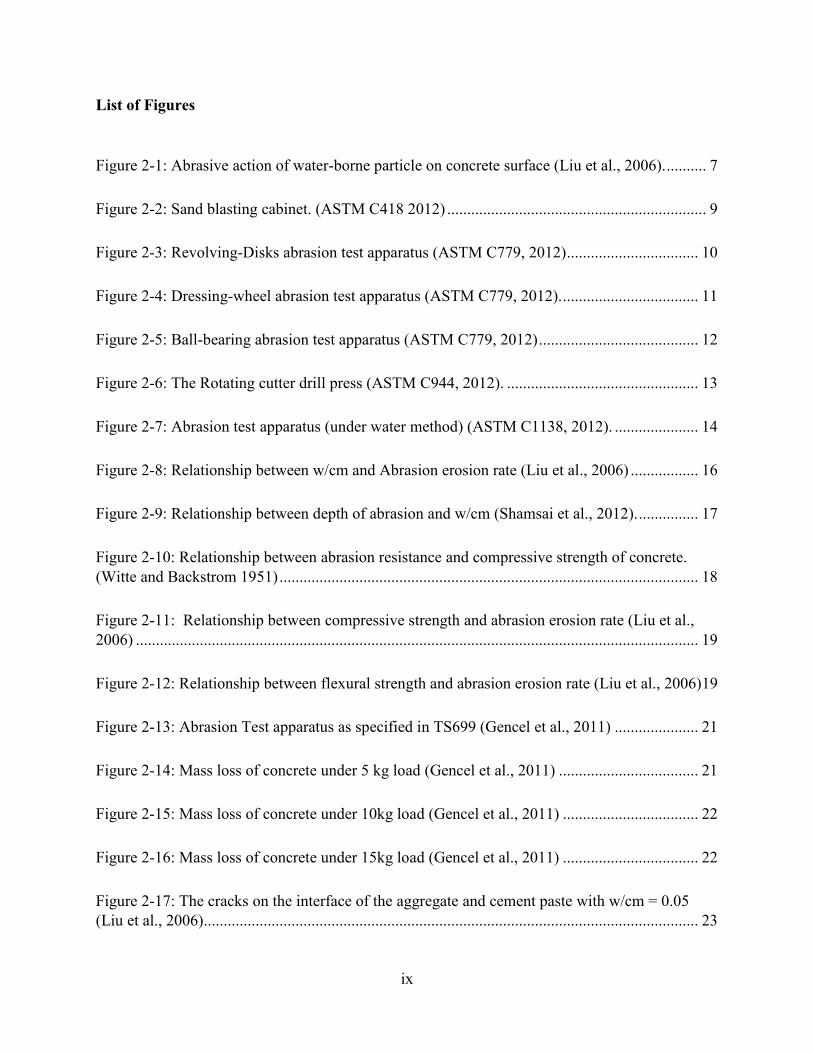
et al., 2006). Figure 2-1 shows all three stages of abrasion process.
Figure 2-1: Abrasive action of water-borne particle on concrete surface (Liu et al., 2006).
2.3 Standard ASTM Test Methods for Determining Abrasion Resistance of Concrete
There are four standard ASTM test methods for measuring abrasion resistance of concrete. These
methods are given below:
1) Abrasion resistance of concrete by sandblasting (ASTM C418)
2) Abrasion resistance of horizontal concrete surface (ASTM C779)

8
3) Abrasion resistance of concrete or mortar surfaces by the rotating-cutter method (ASTM
C944)
4) Abrasion resistance of concrete – Underwater method (ASTM C1138)
2.3.1 Measurement of Abrasion Resistance of Concrete by Sandblasting (ASTM C 418)
ASTM C418 (ASTM 2012) uses the principle of producing abrasion by sandblasting, where
concrete is subjected to impingement of air driven silica sand. This test method is a dry method
where no water is used, though it can simulate the action of waterborne particles like sand and
abrasives under traffic on a concrete surface. In this method, a cutting action is performed which
tend to abrade the components of concrete severly which are less resistant. The sandblast apparatus
consists of an injector-type gun, which has a high velocity air jet fed with a suitable controlled rate
of flow for the abrasive sand (Figure 2-2). The abrasive should follow the specification of ASTM
C 778 for sand which specifies that the sand should pass the No. 20 sieve and be retained on the
No. 30 sieve. Before the test, the concrete specimen needs to be saturated and surface dried by
immersion in water for 24h before the test and wiped with a damp cloth. After making the sample
surface dry, the specimen should be kept under the sand blasting nozzle at a distance of 75 ± 2.5
mm. After the test, there will be loss of some concrete mass from the surface due to sand blasting.
To determine the volume of abraded materials, an oil based clay is used as a filler to fill the cavities
with a moderate amount of finger pressure. From the weight and specific gravity of clay it is
possible to determine the mass of abraded portion easily. The adjusting parameters in this method
are air pressure, gradation of sand, rate of feed of abrasive charge and the distance of the nozzle
from the surface.

9
Figure 2-2: Sand blasting cabinet. (ASTM C418 2012)
2.3.2 Measurement of Abrasion Resistance of Horizontal Concrete Surface (ASTM C 779)
There are three different available procedures in ASTM C 779 (ASTM 2012) to determine the
relative abrasion resistance of horizontal concrete surface. These procedures depending on the type
and degree of abrasive force and are used in determining the variations on concrete surface affected
by mixture design, finishing procedure and surface treatment. The three procedures are:
A. The revolving-disk machine
B. The dressing-wheel machine
C. The ball-bearing machine
The revolving-disk machine abrades the concrete surface by generating frictional forces on the
surface by rubbing and grinding. Figure 2-3 shows the image of the test apparatus.

10
Figure 2-3: Revolving-Disks abrasion test apparatus (ASTM C779, 2012)
Rotating steel disks are in conjunction with abrasive grit sliding and scuffing is accomplished.
Abrasive particles used in this method are silicon carbide supplied at the rate of 4-6 g/min. The
duration of each test period is 30 minutes, which generally produces significant wear on most
concrete surfaces, but if the duration of the test period could be changed from 30 to 60 mins it
would provide better results.
The dressing wheel machine and revolving disk machine are similar. The key difference between
these two are that three sets of seven dressing wheels mounted on the horizontal shafts take the
place of the three rotating steel disks (Figure 2-4). No abrasive particles are used in this machine.
With the help of a micrometer, initial and intermediate depths of the test path are measured. The
test surface becomes irregular and rough after the test as harder aggregate particles stand out from

11
the softer paste and dressing wheel leaves a grooved of path on the tracked surface. Depth of wear
occurring due to dressing wheel is more than double that occurring with the revolving-disk
machine for the same amount of duration (Kumar et al. 2014). This dressing-wheel test method
simulates rolling, pounding and cutting action of steel wheel.
Figure 2-4: Dressing-wheel abrasion test apparatus (ASTM C779, 2012).
For the ball bearing procedure, a series of eight ball bearings rotate under load at a speed of 1000
rpm on a wet concrete surface (Figure 2-5). Water is used to move away the loose particles from
the path and bring the ball bearings into contact with the sand and stone particles that still bonded
with the concrete surface. Readings of abrasion depth are taken every 50 seconds with a
micrometer mounted directly on the supporting shaft allowing readings on the fly. The duration of

12
each test is 20 minutes where readings are taken at every 50 s. The test is stopped when maximum
depth of abrasion is reached which is 3.0 mm. There are a few factors that could affect test accuracy
such as the rapid wear of steel balls, differences in age of concrete, insufficient number of wear
readings.
Figure 2-5: Ball-bearing abrasion test apparatus (ASTM C779, 2012)
2.3.3 Abrasion Resistance of Concrete by Rotating-Cutter Method (ASTM C 944)
The ASTM C944 test method is similar to procedure B of ASTM C779 (ASTM 2012). This
method is used to determine the abrasion resistance of both concrete and mortar surfaces. It has
been used successfully to control the quality of highway and bridge concrete subjected to traffic.
It gives an indication of relative abrasion resistance of mortar and concrete based on testing of
13
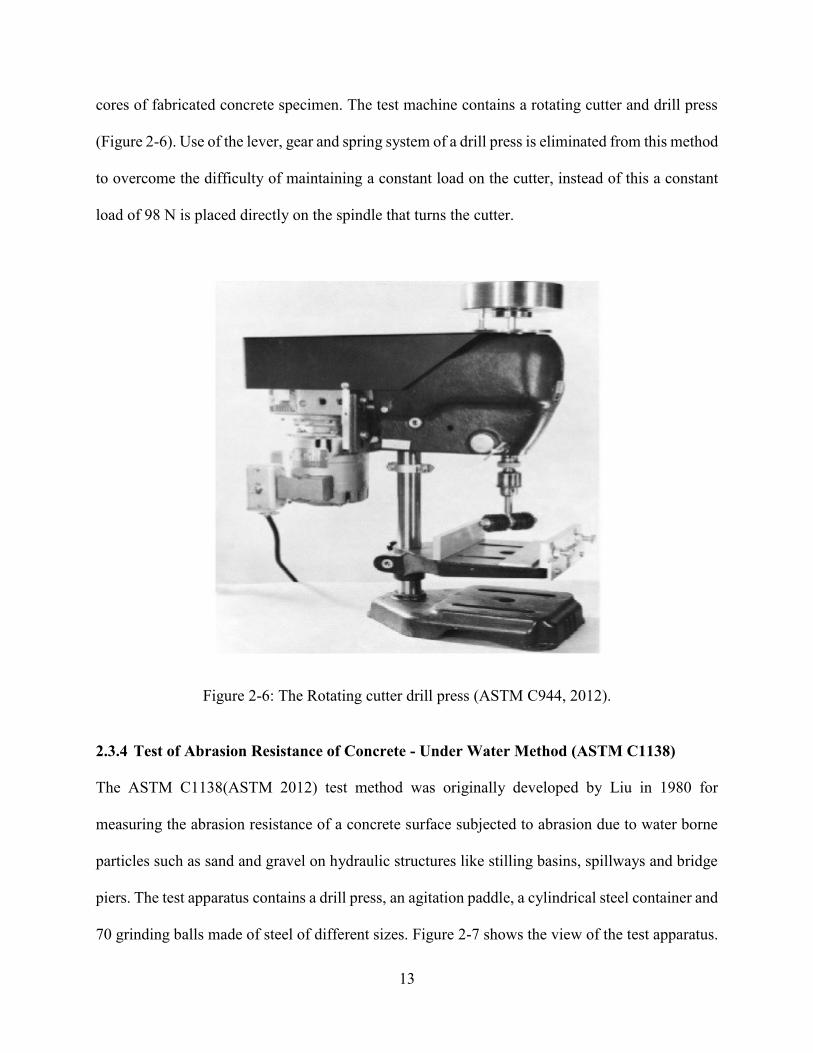
cores of fabricated concrete specimen. The test machine contains a rotating cutter and drill press
(Figure 2-6). Use of the lever, gear and spring system of a drill press is eliminated from this method
to overcome the difficulty of maintaining a constant load on the cutter, instead of this a constant
load of 98 N is placed directly on the spindle that turns the cutter.
Figure 2-6: The Rotating cutter drill press (ASTM C944, 2012).
2.3.4 Test of Abrasion Resistance of Concrete - Under Water Method (ASTM C1138)
The ASTM C1138(ASTM 2012) test method was originally developed by Liu in 1980 for
measuring the abrasion resistance of a concrete surface subjected to abrasion due to water borne
particles such as sand and gravel on hydraulic structures like stilling basins, spillways and bridge
piers. The test apparatus contains a drill press, an agitation paddle, a cylindrical steel container and
70 grinding balls made of steel of different sizes. Figure 2-7 shows the view of the test apparatus.

14
Water in the tank is circulated by the agitation paddle which is powered by the drill press rotating
at a speed of 1200 rpm. Circulating water moves the grinding balls which create frictional forces
on the concrete surface, producing abrasion effects. The duration of a standard test is six 12 hours
test periods for a total of 72 hours.
Figure 2-7: Abrasion test apparatus (under water method) (ASTM C1138, 2012).
Among four ASTM standard test method, only ASTM C1138 –Under water method is directly
applicable for abrasion erosion in hydraulic structure as it can represents real abrasion scenario in
nature. However, Li et al. 2006 says, this method is good for frictional abrasion but not good for
abrasion due to impact and also, standard duration of abrasion test is 72hr which is very long.

15
2.4 Factors Affecting Abrasion Resistance of Concrete
There are several types of factors that affect concrete abrasion. All the factors can be categorized
into two major groups. Factors in group one are related to concrete materials and mixture properties
and factors in group two are related to the surrounding environment of hydraulic structures. Both
types of factors are described below in detail.
Factors related to concrete materials and mixture properties are discussed below:
i. Effect of Water Cement Ratio
Water cement ratio is one of the basic criteria which defines the strength of concrete. Concrete
with a low water cement has low porosity which leads to a higher strength and a stronger interfacial
bond in hardened concrete, and thus enhances the overall abrasion erosion performance of concrete
overall. Lower the water cement ratio lower is the workability. Concrete with a higher water
cement ratio has higher workability but the extra amount of water in the concrete makes the
hardened mortar porous which decreases the strength of concrete. Different researches has been
done regarding the effect of the water cement ratio on abrasion strength of concrete. Liu, Yen and
Hsu (2006) investigated Type I Portland cement concrete containing 30% Class F fly ash and used
four w/cm ratios of 0.50, 0.36, 0.32 and 0.28. They developed a test method for specially designed
to evaluate the abrasion resistance of concrete subjected to water-jet impact and sand impingement.
A water jet, which contains sand with a concentration of 400 kg/m3, directly hits the concrete
surface with a speed of 8 m/s and creates a pressure of 0.17 MPa on the surface which causes the
abrasion. The test result indicated that abrasion resistance is inversely proportional to the w/cm
ratio used in the study. Figure 2-8 shows the relationship of w/cm and abrasion erosion rate. Figure
2-8, clearly shows that with an increase of w/cm the abrasion erosion rate of concrete is also
increasing.

16
Figure 2-8: Relationship between w/cm and Abrasion erosion rate (Liu et al., 2006)
Shamsai et al. (2012) also evaluated the effect of water-cement ratio of abrasive strength of nano-
silica concrete. They used Type I Portland cement in which 3% nano-powder was used to
accompany by with 20 mm aggregates. The water-cement ratio varied and the range of the ratio
was from 0.33 to 0.50. The experimental method used in this study is a wet-sand blast technique
which reflects the abrasion due to water-borne particles in a real scenario.

17
Figure 2-9: Relationship between depth of abrasion and w/cm (Shamsai et al., 2012).
Figure 2-9 shows a similar relation as Liu et al. (2006) between abrasion depth and water cement
ratio. Abrasion depth gradually increased as the w/cm ratio increased from 0.33 to 0.50. Shamsai
et al. (2012) stated that there are two phases in the nature of abrasion. As the water-cement ratio
increases, the abrasion resistance of mortar decreases, but the abrasive resistance of concrete
dominates by the resistance of aggregates.
Laplante (1991) used silica-fume concrete with four different w/cm ratios which are 0.27, 0.32,
0.33 and 0.41. All the concrete mixtures were super-plasticized non-air-entrained with a slump
ranging from 90mm to 190mm. This study also depicts the same results as expected; lowering
w/cm ratio resulted in higher compressive strengths and increased abrasion resistance in both
concrete and its mortar.

18
ii. Effect of Compressive Strength
Compressive strength is one of the most significant factors responsible for the abrasion resistance
of concrete stated by many researchers such as Witte and Backstrom (1951). For similar concrete
mixtures which contain the same aggregates and finishing procedure, the abrasion resistance of
concrete increases with an increment in compressive strength. Figure 2-10 shows an example; the
average abrasion resistance of concrete containing limestone increases approximately 44% as
compressive strength increases from 3 to 10 ksi (20.7 MPa to 62.1 MPa).
Figure 2-10: Relationship between abrasion resistance and compressive strength of concrete.
(Witte and Backstrom 1951)
Liu et al. (2006) compared compressive and flexural strength with abrasion rate where a water-jet
with sand was used for abrasion and abrasion was performed for 3 hours. It is clear that concrete
strength has a profound impact on the abrasion resistance. Figures 2-11 and 2-12 show the

19
relationship between abrasion rate, compressive strength and flexural strength, respectively for 3-
hour water-jet test.
Figure 2-11: Relationship between
compressive strength and abrasion erosion
rate (Liu et al., 2006)
Figure 2-12: Relationship between flexural
strength and abrasion erosion rate (Liu et al.,
2006)
The computed R2 for compressive strength and flexural strength are 0.80 and 0.873, respectively,
which are reasonably high showing that the properties have good correlation between them. After
observing the water jet test, it was revealed that the water jet with sand mix impinged the test slab
which caused local tensile stresses on the top layer of the concrete. Intensities of tensile stress vary
with the force of water-jet and concentration of sand particles in the jet. These tensile stresses are
the main reason behind micro-cracks in the hardened mortar and fractures around the aggregates
which eventually lead to abrasion erosion of the surface. The main way to slow down the abrasion
erosion is to strengthen the mechanical properties of concrete like compressive strength and
flexural strength (Liu et al., 2006).

20
iii. Effect of Aggregates
Aggregates occupy around 75% of the volume of concrete, which clearly denotes the importance
of the properties of aggregates. Gencel et al. (2011) conducted a study on the effect of metallic
aggregate on the abrasion resistance behavior of concrete. In this study, hematite was used as a
replacement for limestone based aggregates in plain Portland cement concrete. Hematite is a
natural bedrock which contains iron oxide and has a Mohs hardness between 5.5 to 6.5 and specific
gravity between 4.9 to 5.5 g·cm-3; whereas Mohs hardness of limestone is between 3 to 4 and
specific gravity is 2.5 to 2.7 g·cm-3. Mixture samples were divided into four major groups A, B, C
and D with 300, 350, 400 and 450 kg/m3 of cement and five subgroups according to replacement
percentage of hematite. A single w/cm ratio of 0.4 was used for all the mixture. In this study, 0,
15, 30, 45 and 60% aggregate replacement ratio was used to evaluate the effect of metallic
aggregates in concrete (subgroups 1 to 5 respectively). The test method adopted in this study was
TS699 which is a Turkish standard method used as an alternative of ASTM C779. The size of
sample specimen is 70x70x70 which is used to determine the wear or abrasion resistance at the
age of 28 days. According to TS699, the apparatus has a steel disc with a diameter of 750mm
which rotates at a speed of 30 cycles/min. An abrasive dust used in this test was crystalline Al203
which is also known as corundum and it gives better friction and causes wear. Three types of
normal load (5, 10 and 15 kg) were applied to the specimen and the disc was rotated for four
periods where each period was equal to 22 cycles, The normal and frictional forces due to rotation
cause abrasion in the sample specimen. Figure 2-13 shows the test apparatus TS699.

21
Figure 2-13: Abrasion Test apparatus as specified in TS699 (Gencel et al., 2011)
Figure 2-14: Mass loss of concrete under 5 kg load (Gencel et al., 2011)

22
The test results are illustrated in Figures 2-14, 2-15 and 2-16. Mass loss graphics can be explained
in terms of cement content (Group A having the lowest and Group D the highest). Compressive
strength increases with the increment of cement dosage with a low w/cm ratio. Mass loss increases
with the increasing applied normal load. But when hematite percentage is 0%, an abrasion mass
loss is the highest, and it drops at a great scale after adding 15% hematite. Beyond 15% hematite
replacement the mass loss difference is not significant which proves that 15% hematite
replacement gives optimum results. Abrasive particles produce shear forces due to rotation while
normal load helps abrasive materials to penetrate into the specimen surface. The shear force helps
to form scratches and grooves on the surface. The test results can be therefore summarized as, an
increase in cement content with low w/cm and the replacement of limestone based aggregates in
the mixture by hematite increases the compressive strength of concrete which improves the
abrasion resistance of concrete.
According to Liu et al. (2006), coarse aggregate size, quality, and bond between aggregates and
mortar are the prime factors in concrete abrasion. Coarse aggregate near the top surface is often
plucked away by the water-borne sand jet flow, which creates a void on the surface. Later, the wall
Figure 2-15: Mass loss of concrete under 10kg
load (Gencel et al., 2011)
Figure 2-16: Mass loss of concrete under 15kg
load (Gencel et al., 2011)

23
of the void is subsequently ruptured due to the swirling effect of sand and water pressure, which
leads to a larger void and significant surface abrasion erosion. Figure 2-17 shows the void
formation attributed to cracks and bleeding along the joint surface between mortar and coarse
aggregate (in center of photo). If a high w/cm ratio is used in concrete, it will increase the amount
of cementitious material and decrease the coarse aggregate content and will also increase the
abrasion erosion rate. When Dmax is greater than 13mm it increases the abrasion resistance &
when Dmax less than or equal to 5mm it decreases the abrasion resistance (Liu et al., 2006).
Figure 2-17: The cracks on the interface of the aggregate and cement paste with w/cm = 0.05
(Liu et al., 2006)
Laplante et al. (1991) tested four types of aggregate with similar composition in concrete with a
w/cm ratio of 0.32 and silica fume. All aggregates were characterized in terms of compressive
strength, modulus of elasticity, and Los Angeles abrasion resistance. Test results exhibited trap
rock had the smallest wear loss which indicates the greatest abrasion resistance among the four.
The trap rock and granite concretes exhibited high abrasion resistance where the soft limestone
recorded much poorer results. Dolomite limestone is also a good abrasion resistant material, but

24
not as good as granite and trap rock. Figure 2-18 shows the relationship between abrasion depth
and coarse aggregate.
Figure 2-18: Influence of coarse aggregate nature on concrete abrasion resistance (Laplante et
al., 1991)
iv. Effect of Silica Fume
Silica fume is a well-known concrete admixture which is primarily used for filling the micro voids
of the concrete matrix and the interfacial zone between mortar and coarse aggregate. Silica fume
is a pozzolan which reacts with calcium hydroxide and it produces more calcium silicate hydrate,
hence reducing the porosity and increasing strength of concrete. Liu et al. (2006) studied the effect
of silica fume on concrete abrasion. Two concrete mixtures were prepared by using 5% and 10%
silica fume (by weight of cement replacement), with w/cm of 0.38 and 0.40, respectively. Both
specimens were moist cured for 28 days. The test results showed that there is a decrease in the

25
abrasion rate of 10% and 16%, respectively compared to control concrete which contained 0%
silica fume. Figure 2-19 shows the effect of silica fume on abrasion rate. Silica fume decreases the
abrasion rate because it makes concrete denser and helps to develop good interfacial bond strength
between mortar and aggregate.
Figure 2-19: Effect of silica fume addition on abrasion rate. (Liu, 2006)
v. Effect of Blast Furnace Slag
Wu et al. (2006) investigated the impact of blast furnace slag on concrete abrasion. Five different
w/cm ratios and four slag contents were chosen for the study and other parameters were kept the
same. Type I Portland cement (used for general purpose with fairly high C3S content for early
strength development), coarse aggregate with a maximum size of 0.75'' (19 mm), fine aggregates
with FM 2.82 and super-plasticizer were the same for all concrete mixtures. The flow abrasion test
method was used where quartz tic river sand was used to make a slurry mixture and the nozzle was
held at 45angle with respect to sample specimen. Figure 2-20 shows the abrasion loss due to

26
different slag contents at different ages of concrete. Concrete containing 45% slag with a w/cm
ratio of 0.35 exhibited the best abrasion erosion resistance. A reduction in w/cm ratio from 0.42 to
0.28 reduced the abrasion loss.
Figure 2-20: Relation of abrasion volume and slag content (Wu et al., 2008).
vi. Effect of Fly ash
Fly ash is one of the popular materials used as a partial replacement of Portland cement in concrete
production. Fly ash also known as flue-ash, is one of the residues of coal combustion and it is made
of silicon dioxide and calcium oxide. However the components of fly ash may vary considerably
depending on the source & the way coal is being burnt. Naik et al. (1993) investigated the effect
of Class C fly ash on the abrasion resistance of high-strength concrete. In that study, they used five

27
levels of cement replacement levels (15, 30, 40, 50, and 70%) of Class C fly ash. Their study says
that abrasion resistance is very much related to compressive strength and up to 30% replacement
of cement by class C fly ash exhibited similar abrasion resistance as cement without fly ash.
However beyond 30%, the compressive strength of concrete decreased by a considerable amount
and also abrasion resistance of concrete decreased significantly. Cement replacement of 70% with
fly ash exhibits worst abrasion resistance as compressive strength decreases significantly. The
conclusion of this study performs up to 30 % replacement of cement by Class C fly ash well,
beyond that both compressive strength and abrasion resistance decreased with the increase of fly
ash content in concrete.
However, Yen et al. (2007) stated that concrete mixtures up to 15% cement replacement by Class
F fly ash had similar abrasion resistance to concrete without fly ash. Beyond 15%, abrasion
resistance decreased with increasing amount of cement replacement, particularly at low w/c ratios.
In this study, 15%, 20%, 25% and 30% cement replacement by Class F fly ash were used in high
strength concrete (HSC) and the test was done in accordance with ASTM C 1138. Figures 2-21
and 2-22 show the relation of wear with cement replacement by mass with fly ash at the age of 28
and 91 days, respectively. It was found that when cement replacement by fly ash is beyond 15%
and when the compressive strength of concrete samples are similar the abrasion resistance of the
samples decreases with the increasing fly ash content.

28
Figure 2-21: Effect of fly ash on the abrasion resistance of concrete at the age of 28 days (Yen et
al., 2007).
Figure 2-22: Effect of fly ash on the abrasion resistance of concrete at the age of 91 days. (Yen et
al., 2007)
Siddique (2003) conducted similar research with 10, 20, 30, 40 % Class F fly ash as a replacement
for fine aggregates in Portland cement concrete. Contrary to other researchers, the conclusion for
this research was that abrasion resistance of concrete increased with the increasing fly ash content.
Figure 2-23 shows that depth of wear decreased with the increment of fly ash percentage when it

29
is used as a replacement for fine aggregate and moreover abrasion decreases with the increasing
age of concrete.
Figure 2-23: Depth of wear at 60 min of abrasion versus fine aggregate replacement with fly ash
(Siddique, 2003).
However, in a later study, Siddique et al. (2007) used high volume fly ash (HVFA) concretes made
with 35, 45, 55, and 65 % of cement replacement for their study. Test results indicated that concrete
containing fly ash up to 35% as cement replacement exhibited similar abrasion resistance to control
mixture at the ages of 28 and 365 days.
vii. Effect of Fibre on Concrete Abrasion
Horszczaruk (2009) investigated abrasion resistance of two types of concrete; high performance
concrete (HPC) and high performance fibre-reinforced concrete (HPFRC). The three types of fibre
used in this investigation are steel fibre of 30 and 50mm length and polypropylene fibres of 19mm
length. Figure 2-24 shows an image of the three types of fibres used. The first steel fibre’s length

30
is 30mm where the diameter is 0.5mm with an aspect ratio of λ=60 and tensile strength of above
1400 N/mm2 and the second steel fibre’s length is 50mm with a diameter of 1.0mm, aspect ratio
of λ= 50 and tensile strength of above 1200 N/mm2. High performance concrete used here had a
compressive strength of 100 MPa and was made of Portland cement, natural river sand having a
fineness modulus of 2.5. For aggregates, basalt was used with a nominal particle size of 16mm.
Silica fume containing 92% SiO2 with a specific surface area of 19,000 m2/kg and a polycarboxylic
ether was used as super-plasticizer. The test method used in this study was ASTM C 1138,
“Underwater method’’. All abrasion tests were performed for 120 hours.
Figure 2-24: Fibre used for reinforcement: a) polypropylene fibres, (b) steel fibres (ME 50/10),
(c) steel fibres (ME 30/50) (Horszczaruk, 2009)
The test results showed that the steel fibres do not increase abrasion resistance if the speed of flow
is low. Abrasion erosion depends on the orientation of the fibres, especially on the upper surface
of the concrete and the incident angle of abrasive particles on the fibres. It showed that the best
abrasion resistance was observed for the steel fibre with an aspect ratio of 50 which has a low
rigidity. Concrete with polypropylene fibre exhibited better abrasion resistance than HPC concrete

31
without fibres. Figure 2-25 (a & b) illustrates the mass loss and mean wear depth of different types
of concrete with test duration.
Figure 2-25: Abrasion test results of concrete specimens: (a) mass loss, (b) mean depth of wear,
concretes with steel fibres: ME 30/50 and ME 50/1.0, PP- concrete with polypropylene fibres,
HPC – concrete without fibres (Horszczaruk, 2009).

32
Wu et al. (2008) investigated the impact of three types of fibres on the abrasion resistance of
concrete. Carbon fibre, glass fibre, and steel fibre were used with Type I Portland cement with a
constant w/cm ratio of 0.28. Different percentages of fibre were used in the concrete mixtures; the
content of carbon fibre was 1%, glass fibre 0.5%, 1.0%, 1.5% and steel fibre 0.5%, 1.0%, 1.5%.
Two different types of test methods were adopted for the research; one was the flow abrasion test
where a jet flow at 12m/s which also contained water borne sand was used to abrade concrete. The
second method was ASTM C 1138 “Under water method” which is a standard method for abrasion
of concrete. Figure 2-26 shows the test results from flow abrasion test for 1% fibre additions. Each
test was conducted for 48 hours at the concrete age of 28 days and 56 days. In summary, the steel
fibre concrete showed better abrasion resistance with compared to others. The authors also
mentioned that fibre concrete with various fibre amounts of 0.5% to 1.5% at the age of 28 and 56
days show almost the same amount of abrasion loss from which it can be concluded that fibre
contents have insignificant effects (using fibre reinforcement) on the abrasion resistance of fibre
concrete. Results from underwater abrasion test exhibited a similar conclusion. Figures 2-27 and
2-28 show the relation of abrasion erosion volume with test duration of all three types of fibre.
Abrasion volume is determined by evaluating mass loss of the concrete specimen. Based on both
test results, steel fibre concrete gave better resistance when fibre content is 1%. In the underwater
method (ASTM C1138), carbon and glass fibre performance were almost similar where steel fibre
concrete showed the best results among the three. The volume of abrasion loss for steel fibre is
20% lower than carbon and glass fibre concretes.

33
Figure 2-26: Abrasion volume of fibre concrete from flow abrasion test. (Wu et al., 2008)
Figure 2-27: Abrasion volume of fibre
concretes vs. Test time (28 days) (Wu et al.,
2008)
Figure 2-28: Abrasion volume of fibre
concretes vs. Test time (56 days) (Wu et al.,
2008)

34
viii. Effect of Polymer Fibre
Siddique et al. (2012) investigated the effect of polyester fibre on the abrasion resistance of high
volume fly ash concrete (HVFA) where different percentage of class F fly ash was used along
with different content of fibres. These monofilament fibres are alkaline resistant 100% virgin
polyester with a length of 12mm with low thermal and electrical conductivity. The method adopted
for this study was Indian Standard Specifications IS 1237-1980. Figure 2-29 shows the abrasion
test machine which contains a grinding disk with some abrasive particles. In this study, a
comparison was made between the content of fibres and compressive strength with same HVFA
concrete of the same age.
Figure 2-29: IS 1237-1980 Abrasion test machine (Siddique et al., 2012)

35
Figure 2-30: Relationships between
compressive strength and depth of wear
(without fibres) (Siddique et al., 2012)
Figure 2-31: Relationships between
compressive strength and depth of wear
(with 0.05% fibres) (Siddique et al., 2012)
Test results showed that the abrasion resistance increased with the inclusion of fibres in the HVFA
concrete matrix. The fibres are crack arresters which can improve the tensile strength and delay
the abrasion but the maximum improvement in abrasion resistance is about 15% of these fibres. A
possible reason for this is because these monofilament fibres are not as stiff as common plastic
fibres. Figure 2-30 and 2-31 show the relationship between compressive strength and depth of
wear. In Figure 2-31, the concrete mixtures had no fibres, whereas in the Figure 2-32, the concrete
mixture had 0.05% fibre. Comparing both figures it clearly shows that there is a reduction in depth
of wear when 0.05% fibre was used regardless of compressive strength.
In other research, Zoran et al. (2012) explored the impact of polypropylene fibres on the abrasion
resistance of concrete (Figure 2-33). Two types of polypropylene fibres were used with Portland
cement where 3 different w/cm ratios were used to evaluate the impact of the water cement ratio
on abrasion resistance and compressive strength. Table 2-1 shows the properties of fibres used in
the study.

36
Table 2-1 : Characteristics of fibres
The flow abrasion test apparatus was used for conducting the experiment which is similar to the
experiment done by Liu et al. (2006). Figure 2-32 shows the relationship between abrasion rate
with compressive strength of three different concrete mixtures, where the first mixture is
considered as the benchmark concrete containing Portland cement without any fibres. In the other
two mixtures, F 120 and S 120 polypropylene fibre were used. The graph clearly shows that
abrasion rate decreased with the increment of compressive strength. Also, it is clear that F 120
polypropylene fibre gave better abrasion protection than S 120 polypropylene fibre. At w/cm of
0.5 the addition of monofilament propylene fibres, FIBRILs S120, increased abrasion resistance
by 7.08% where FIBRILs F 120 increased it by 13.74%.

37
Figure 2-32: The relationship of compressive strength and abrasion erosion rate (Zoran et al.,
2012).
ix. Effect of RCC, PCC and SC
Francis et al. (2002) studied several mixtures of Portland Cement Concrete (PCC), Roller
Compacted Concrete (RCC) and Soil Cement (SC) to evaluate their abrasion resistance
performance. For each type of concrete, similar kinds of aggregate were used to make an accurate
comparison. For mixture design, ASTM standard procedure was followed for each material.
Abrasion tests were conducted in accordance with ASTM C1138, which is the Under Water
method. For RCC and PCC, the abrasion loss was obtained from the results between 24 and 72
hours testing whereas for SC the results were obtained from 12 to 36 hours because of its high
erodibility.
Figure 2-34 shows the relationship between abrasion loss and time with three different concrete
mixtures. RCC showed the least abrasion loss which means better performance against abrasion

38
where SC showed the least abrasion resistance. RCC exhibited better abrasion resistance than PCC,
especially during the first 36 hours. The primary reasons are aggregates’ hardness and strength of
cement paste. (The compressive strength of each mixture is shown on the figure in the legend.)
The graph indicates that SC is approximately 12 and 19.7 times more erodible than PCC and RCC,
respectively at 36hours test.
Figure 2-33: Abrasion erosion loss comparison between SC, PCC and RCC (Francis et al., 2002).

39
x. Performance by repairing materials on concrete abrasion
Korman et al. (2003) studied the performance of four repair materials as a function of a reference
conventional concrete (RefC). The materials are polymer-modified cement mortar (PMor), steel
fibre concrete (SFco), epoxy mortar (EMor) and silica fume mortar (SFmo). The test method was
slightly modified from ASTM C1138 where a 20x5 cm void was left in the center of the concrete
sample in order to place the repairing materials and to simulate a border effect which is typically
produced when repairing concrete is used in water flow in spillway conditions. Figure 2-34 (a)
shows an actual image of EMor sample and Figure 2-34(b) shows a schematic 3-D diagram of
EMor sample after abrasion test. From Figure 2-35, it is clear that SFco was found as the best
material, followed by EMor. Both of them presented a relative homogeneous surface and lower
mass loss was than the RefC sample. The SFmo and PMor presented a visible border abrasion-
erosion effect; also PMor presented the highest mass loss. Though SFco was good at abrasion it
showed rigorous metal fibre corrosion which is usually followed by volume expansion and tends
to crack the mortar or concrete in service which is considered a drawback to its use in hydraulic
structures.

40
Figure 2-34: Abrasion-erosion underwater mass loss of the RefC|EMor system: (A) EMor
sample photograph after abrasion-erosion; (B) EMor sample schematic 3-D abrasion-erosion
mass loss (Korman et al., 2003).

41
Figure 2-35: Relative abrasion-erosion underwater mass loss of the repairing material systems
(Korman et al., 2003).
2.5 Factors Related to Environment
i. Effect of Flow velocity
Flow velocity is always an important parameter for the abrasion erosion process. According to
Momber and Kovacevic (1994), a critical threshold velocity (wo) is needed to initiate and continue
the erosion process. Below this threshold velocity, no visible erosion will be observed, though
invisible cracks will still be generated in the concrete matrix. In this research (Momber and
Kovacevic, 1994), a 400 m/s water jet was used to erode concrete without using any abrasive
material. It is observed from the test that concrete specimens were not destroyed completely at
high flow velocities, but a continuous removal of materials was always found.

42
ii. Effect of Impact angle
The angle of impact of the water jet has a very high influence on abrasion erosion because the
main culprits for abrasion erosion are the normal stress and tensile stress generated on the concrete
surface. These stresses cause micro-cracks in hardened mortar and fractures around the aggregate
particles which eventually leads to abrasion erosion. As both normal and tensile stress occurs
simultaneously, the ratio of these two stresses depends on the incident angle of water jet on the
concrete surface. Normal stress is maximum when the angle of impact is 90° and during this time
shear stress is minimized. When the impact of an angle is 45°, both normal and tensile stresses
have equal impact on the concrete surface. Figure 2-38 shows the relationship between impact
angle and abrasion loss at various water cement ratios. It is obvious from the figure that abrasion
is maximum when the impact angle is 90° as normal stress is maximum which has more power to
abrade at any w/cm ratio. At 45°, concrete shows a minimum abrasion loss. It can be concluded
that beyond 45°, abrasion rate increases with an increasing impact angle.
Figure 2-36: Relationship between impact angle and abrasion rate (Liu et al., 2012).

43
Concrete impacted at 90° exhibits a more rough and rugged surface than concrete impacted at
45°and 30°. Normal stress is maximum at 90°, whereas shear stress has a good contribution at 45°
which is the reason for comparatively smooth abrasion erosion. Figure 2-39 (a) shows an image
of a concrete surface impacted at an angle of 90°. It was observed that mortar was abraded easily
and abrasion occurred by forming many small cracks rather than a few large cracks. The impacted
surface is rougher and more rugged than concrete surface impacted at 45° (Figure 2-39(b)).
Figure 2-37: SEM-images of worn concrete surface (w/cm =0.36). Impacted at (a) 90and (b)
45 (Liu et al., 2012)

44
iii. Effect of Erodent size
Size of erodent, shape, roughness, concentration and hardness have a significant influence on
abrasion damage on concrete surface. Liu et al. (2012) investigated the impact of erodent size and
concentration of erodent on concrete abrasion using waterborne sand flow impact abrasion method.
Figure 2-40 shows the images of eroded concrete surfaces under various erodent sizes, where a
fixed w/cm ratio of is 0.36 and angle of impact at 45° was used.
Figure 2-38: Worn concrete surfaces under various erodent size (w/cm = 0.36, angle of impact =
45) (Liu et al., 2012).

45
Test results exhibited that when the size of the erodent increased, the rate of concrete abrasion
increased from 100% to 217% and 367% respectively. The main factor is that when the erodent
size is small, the small particles are not capable of initiating cracks on the surface; they could only
plastically deform the surface.
iv. Effect of Sand Content in Water on abrasion
Concentration of sand has a great impact on abrasion. Water without sand or abrasive particles has
much less abrasion damage than water with just sand (Liu et al., 2012). Figure 2-41 clearly shows
that when sand concentration is zero, abrasion damage on concrete surface is nearly negligible.
When sand content increases in the water flow, abrasion erosion increases. As the concentration
of sand particle increases, impact energy of sand mixed with water also increases which causes
more abrasion erosion. The test results exhibited that when sand content in water is 110, 230, and
340 kg/m3, impact angle is at 45 °and 90 °and the abrasion rate is 10, 17 and 23 times, whereas the
abrasion rate is 23, 37 and 57 times of when the water has no sand as illustrated in Figure 2-42.

46
Figure 2-39: Effect of various sand content on abrasion erosion of concrete (Liu et al.,
2012).

47
Figure 2-40: Relationship between abrasion rate and sand content in water for concrete made
with w/cm= 0.36, angle of impact 45° (Liu et al., 2012).
v. Effect of Crack width and Flow direction
Microcracks are the starting point of abrasion erosion. Microcracks form in the concrete matrix
due to impact and shear stresses originated by water flow and water-borne particles. These
microcracks get widened gradually with time because of rubbing and swirling effects caused by
water flow. Cement and other small aggregates get pulled out of the crack surface and cracks get
bigger and bigger. Liu (2007) investigated how cracks increased abrasion and also what kind of
difference the flow direction make on abrasion.

48
Figure 2-41: Water borne sand flow impinging site: (a) impinging site above crack site A and (b)
impinging site on the crack site B (Liu, 2007).
Figure 2-43 shows two different impinging sites in the first figure the water flow impacted directly
on the crack (site a) and it created vertical and shear stress at the crack. In the second figure b, it
creates shear stress around the crack as water impact is above the crack. Figure 2-44 shows a
typical abraded surface after test of the above two different impact conditions. In Figure 2-44 (a)
water flow directly hit the crack from vertical direction and in Figure 2-44 (b), water flow hit the
surface vertically above the crack.
Figure 2-42: (a) water flow impingement directly on the crack (b) water flow impingement above
the crack (Liu, 2007).

49
Figure 2-45 illustrates the relationship between the crack width and the abrasion rate for the two
sites. The abrasion rate increases in the flow, which has a direct impinging effect on the crack.
But, if there is an existing crack, abrasion increases with width for both sites.
Figure 2-43: Relationship between crack width and abrasion rate (Liu, 2007).
In general, test results exhibited that abrasion rate increases with the increment of the width of the
crack. If the crack width is larger than 1 mm, water can impinge directly into the crack and makes
abrasion easier. Test results show a crack with a 3 mm width has the maximum abrasion rate. For
the same concrete mixture made with 0.36 w/cm, the abrasion rate increases by 16%, 21% and
38% respectively, with respect to an increase of crack width from 1 to 3 mm.

50
.
Figure 2-44: Effect of crack direction on the abrasion rate (Liu, 2007).
Liu (2007) tested the crack with three different flow angles on the crack surface and those angles
are 0°, 45° and 90° (Figure 2-46). Test results showed that the abrasion rate increases significantly
when flow impingement occurs directly on the surface crack (site a) and it was also found that a
larger angle will give higher abrasion than a smaller angle. But, when impingement occurs above
the crack surface (site b), the influence of the larger angle is not as significant. When water flow
impinges directly on the crack surface with a large angle it creates more local stress and swirling
and rubbing effect which causes more abrasion than when the impingement occurs above the crack
surface.

51
2.6 Factors Related to Casting Procedure
vi. Effects of Curing
Bakke (2006) states that efficient curing increases the compressive strength of concrete
simultaneously, it also increases the abrasion resistance of concrete. Sawyer (1957) investigated
the effect of curing with a series of tests, including a wide range of cement contents, w/c and
incremental curing. The study shows that a noticeable improvement in abrasion resistance can be
expected with the extended curing time, especially for surfaces composed of leaner concrete.
Another study by the California Division of Highways shows that greatest abrasion loss
encountered were associated with less adequate curing procedure (Spellman et al., 1967).
vii. Effects of Vacuum Treatment
The vacuum treatment in which excess water is extracted from a concrete mixture by applying
suction has been used for a number of years in numerous parts of the world to reduce water from
the top surface of concrete as the top layer of the surface tends to have an extra amount of water
(Mindess, 2003). It was found by investigating different types of concrete that the abrasion
resistance was significantly higher for vacuum-treated concrete than for unprocessed concrete. Liu
(1981) investigated two sets of concrete samples with two different w/cm ratios (0.54 and 0.72),
one set of sample was vacuum treated where the other set was not. Abrasion tests were conducted
with these samples in accordance with ASTM C1138. Test results showed that the average losses
for 72 hours were reduced to 44% and 39% by vacuum treatment of concretes with water-cement
ratio of 0.72 and 0.54 respectively. The improvement in abrasion resistance of vacuum-treated
concrete was mainly due to reduction of water content in concrete mixtures. The U.S Army Corps
of Engineers confirmed that vacuum-treated concrete surfaces are noticeably more resistant to

52
abrasion than surfaces with untreated concrete (Liu, 1980). The improvement in abrasion
resistance of vacuum-treated concrete is due to the reduction of water content in the concrete
mixture. This treatment is most effective on concrete with high w/c ratio.
viii. Effects of Surface Coating
Liu (2006) investigated the relative abrasion resistance of seven different types of concrete surface
coatings: two types of polyurethane coating, acrylic mortar, high modulus and low modulus epoxy
resin mortar, furan resin and iron aggregate topping. Generally, all surface coatings that were
investigated had good resistance to abrasion and had significantly less abrasion resistance than the
conventional concrete. The test results are shown in Figure 2-47. Among all the surface coatings,
the iron aggregate topping had the largest amount of abrasion loss which is 1.16 percent for an
average 72 hour abrasion.
Some specific chemicals such as magnesium and zinc flourosilicates, sodium silicate, gums and
waxes increases the life of older floors and are considered an emergency measure for surface
treatment (Bakke, 2006). Surface treatment with linseed oil can increase about 30% of abrasion
resistance of poor or porous concrete surfaces. Paints and coatings are used for sealing concrete
surfaces and to protect their concrete from the attack of toxic chemicals which possess only limited
abrasion resistance. (Bakke, 2006)

53
.
Figure 2-45: Abrasion resistance of various concrete surfaces (Mindess et al., 2003).
ix. Effects of Finishing Procedures
Bleeding is a problem of concrete; as bleeding occurs on the surface, w/cm ratio is higher at the
concrete surface than other parts of concrete surface which makes concrete more porous and weak.
Finishing procedures have a significant impact on concrete abrasion resistance. A study of Kettle
and Sadegzadeh (1987) indicated that the abrasion resistance of concrete subjected to power
finishing is significantly higher than that subjected to hand finishing. This is attributed to surface
compaction and reduction of w/c of the surface matrix.
Wood float, magnesium float, steel trowel and hard-steel trowel finishes are some finishing
techniques studied by Fentress (1973) in regards to the abrasion resistance of concrete. A wood

54
float tends to tear the surface and to displace the aggregate. The magnesium float, despite its ease
of finishing, causes a rough-textured surface lowering in abrasion resistance. Both the steel trowel
and hard-steel trowel produce smooth surfaces and provide excellent resistance to abrasion.
After going through all the research it has been realized that, there are numerous factors which
contributes to the abrasion resistance concrete. Factors related to the properties of concrete have
major impact on concrete abrasion such as a water cement ratio, strength of concrete, aggregates,
etc. The contribution of water cement ratio, compressive strength, aggregates has already been
analysed and no further analysis regarding these factors are not imperative. Now a day all the
research regarding concrete abrasion are happening on supplementary materials and fibre
reinforcement of concrete. There are lots of scope to analyse the impact of different supplementary
materials along with the various types of fibre reinforcement with different content. Also factors
related to environment such as flow velocity, waterborne particles and their concentration, impact
angle etc. plays a great role in abrasion erosion. Such factors can also be a focus point in a research
study about this topic. Among all factors, supplementary materials and fibre reinforcement,
compressive strength and age of concrete were studied in this research, rest of the factors either
kept constant or not considered in this study. Major factors considered in this study is flow velocity,
sand concentration, water-borne particle and impact angle. In previous studies, abrasion resistance
was compared mainly with abrasion mass loss, compressive strength or abrasion depth. Volume
loss due to abrasion can also be a good way to compare the abrasion resistance of different
concrete. However, quantifying volume loss of known density and mass will not be appropriate as
accuracy of mass loss measurement has some error. For, volume loss measurement some new
method can be developed.

55
3. Methodology
3.1 General Description
This chapter provides a description of the methodologies used in this study, including details about
casting and curing of concrete specimens, experimental standards for testing the specimens, and
procedures for the analysis of experimental data obtained from laboratory tests. Note that this study
was intended to evaluate the abrasion resistance of different types of ready-made repair materials.
Materials with high abrasion resistance presumably have the potential to be used for repairing
ageing hydraulic structures in the aquatic environment.
3.2 Materials Used
Four types of ready-made prepackaged repair materials were used in this study. All materials were
obtained from King Construction Products based in Ontario, Canada. The materials are listed
below:
1) Concrete Material
2) Latex Modified Repair Material
3) Silica Fume Fibre-Reinforced Repair Material
4) Fly Ash Fibre-Reinforced Repair Material
The main reason to choose these materials were that all the materials used were pre-blended and
pre-packaged and easily available on the market for surface repair. Only adding water was enough
to cast the materials. Moreover, each type of material contains specific supplementary materials
which gives some special properties to the concrete specimen.

56
3.2.1 Concrete Material
The first material is a concrete mixture designed for consistent strength and durability, which can
be used for general purposes like slabs, sidewalk, footings, and poles. This pre-bagged material is
marketed for the home improvement market; in this research it was used for comparison with other
materials specifically designed for repair. The proprietary concrete mix contains Portland cement
(30 to 60%), silica and total quartz (60 to 100%), and other ingredients. The specific gravity of the
concrete mix is 2.5. Aggregates are well graded, ranging from 0 to 10 mm in size. The concrete
mix is ready to use; adding water to the mix is the only requirement. The manufacturer’s suggestion
is that water addition at the ratio of 2.7 L water to 30 kg dry material gives an approximate
water/cement ratio of 0.60. The height of slump ranges from 25 to 175 mm. Entrapped and/or
entrained air volume range is 2% to 7%. The compressive strength of these materials is given as
41.9 MPa at 28 days and flexural strength is 5.3 MPa at 28 days.
3.2.2 Latex Modified Repair Material
The second material is a special type of concrete, which contains a re-dispersible polymer and
other carefully selected compounds with Portland cement. Aggregates are well graded, their sizes
being in the range of 0 to 6 mm. This concrete is very low in permeability and has excellent
compatibility to parent concrete. It has good resistance to sulphate attack and bleeding. It contains
10% to 30% of Portland cement and 60% to 100% of silica and total quartz. The specific gravity
of the material is 2.65. The manufacturer suggests water addition at the ratio of 2.5 L water to 30
kg dry material, giving an approximate water/cement ratio of 0.40. The height of slump ranges
from 50 to 200 mm. Entrapped and/or entrained air volume range is 4% to 9%. The compressive

57
strength of this material is given as 45.4 MPa at 28 days and flexural strength is 7.5 MPa at 28
days
3.2.3 Silica Fume Fibre Reinforced Repair Material
The third material is a high performance concrete, which contains silica fume and polypropylene
microfibres and other carefully selected ingredients with Portland cement. Aggregates are well
graded; their sizes range from 0 to 6 mm. This concrete mix contains silica fume up to 5%, Portland
cement (10 to 30%) and Silica, total quartz of 60% to100%. The specific gravity of the material is
2.5. The manufacturer’s suggested water addition, which is 2.6L/30kg, gives an approximate
water/cement ratio of 0.40. The height of slump ranges from 50 to 200 mm. Entrapped and/or
entrained air volume range is 4% to 9%. The compressive strength of this material is 57.8 MPa at
28 days and flexural strength is 12 MPa at 28 days.
The fibre used in this material is a synthetic fibre that is hydrophobic. Thus, it does not absorb
water and has no effect on water requirements of concrete. The length of this fibre ranges from
6.35 to 20mm. The tensile strength is about 550 to 750 kPa, where Young’s modulus is 23769 to
33276ksi. Most of the research shows that fibre reinforcement has good impact on crack resistance
and can improve impact and abrasion resistance (Horszczaruk 2009).
3.2.4 Fly Ash Fibre Reinforced Repair Material
The fourth material is a high performance pre-blended concrete with synthetic fibre similar to
previously-mentioned material. The only difference is that fly ash is used in this material instead
of silica fume. Aggregates are well graded; their sizes range from 0 to 6 mm. This concrete mixture
contains fly ash of up to 5%, Portland cement (10 to 30%) and silica, total quartz of 60% to 100%.

58
The specific gravity of the material is 2.5. The manufacturer’s suggested water addition which is
3.0L/30kg gives an approximate water/cement ratio of 0.40. The height of slump ranges from 50
to 200 mm. Entrapped and/or entrained air volume range is 4% to 9%. The compressive strength
of this material is 48.15 MPa at 28 days and flexural strength is 11 MPa at 28 days. Polypropylene
fibre used for this material is similar to the silica fume repair material. Relevant properties of the
four types of concrete used in this study are summarized in Table 3.1.
Table 3-1 : A summary of the properties of all four types of materials used in this study
Properties
Concrete
Materials
Latex
Modified
Repair
Material
Silica Fume
Fibre
Reinforced
Repair
Material
Fly Ash Fibre
Reinforced
Repair
Materials
w/cm (approximate) 0.60 0.40 0.40 0.40
Portland cement content (%) 30-60 10-30 10-30 10-30
Silica, total quartz (%) 60-100 60-100 60-100 60-100
Specific gravity 2.5 2.65 2.5 2.5
Aggregate sizes (mm) 0-10 0-6 0-6 0-6
Fibre Reinforcement No No Yes Yes
Entrapped/ Entrained Air (%) 2-7 4-9 4-9 4-9
Slump Range (mm) 25-175 50-200 50-200 50-200
Compressive Strength at 28
days (MPa) 41.9 45.4 57.8 48.15
Flexural Strength at 28days
(MPa) 5.3 7.5 12 11

59
3.3 Procedures for Laboratory Tests and Data Analysis
The steps used in the methodology are described below with details.
3.3.1 Mixing, Casting and Curing
The following specimens were cast for each type of concrete mixture: (a) three cylindrical
specimens (with a diameter of 100 mm and a height of 200 mm) for compressive strength; (b)
three beams (with a length of 525 mm, a width of 150 mm and a thickness of 150 mm) for flexural
strength; (c) five cylindrical specimens (with a diameter of 100 mm and a height of 50 mm) for
abrasion test. Dimension of cylindrical specimens and beam are chosen in accordance with ASTM
C39 and ASTM C78, respectively. As there was no specification regarding the dimension of
abrasion test specimens, 100x50mm cylinders were selected. The size and mass of the specimen
provided a sufficient surface area for abrasion while having a relatively small mass for precise
measurement.
To mix all types of material, a mechanical pan mixer (Imer U.S.A Inc, Model: Workman II 350)
was used where multiple bags of materials were mixed easily at once. Clean water was used as per
manufacturer’s recommendation. Mixing occurred for 10 minutes in the mechanical mixer. No
super-plasticizer or admixture was used during casting. After casting, every specimen was kept in
a moist environment in the moulds for one day, and then placed into saturated lime water until the
day tested. The curing of sample specimens in lime water is shown in Figure 3-1. Cast beams,
cylinders and samples for abrasion test are shown in Figure 3-2.

60
Figure 3-1: Curing of abrasion sample specimens in lime water.
Figure 3-2: Casting of beam, cylinder, and abrasion test samples.

61
3.3.2 Strength Testing
The compressive strength is the most commonly used parameter by engineers. Compressive
strength is measured in a compression-testing machine by breaking a cylindrical specimen and is
calculated from the failure load divided by the cross-sectional area of the cylinder. In this study,
compressive strength test was performed at the age of 28 days for all types of materials in
accordance with ASTM C39 [Standard Test Method for Compressive Strength of Cylindrical
Concrete Specimens (ASTM 2015).
Another very important property of concrete used by designers is flexural strength, which is about
10 to 20 percent of the compressive strength of the same concrete, although it depends on the type,
size and volume of coarse aggregates. Flexural strength represents the tensile strength of concrete
where an unreinforced concrete beam or slab is tested to resist failure in bending. Flexural strength
is expressed as Modulus of Rupture (MR). There are two ASTM standards: one is ASTM C78
(third point loading), and the other is ASTM C293 (center-point loading). In this study, flexural
strength test was performed at the age of 28 days for all materials in accordance with ASTM C78.
The dimensions of each beam were 525 mm × 150 mm × 150 mm, where 525 mm is the total beam
length and 450 mm is the span length (Figure 3-3). The loading mechanism was third-point loading
where the maximum stress occurs over the center 1/3 portion of the beam. The loading condition
of beam in ASTM C78 is shown in Figure 3-3.

62
Figure 3-3: ASTM C78- Third-Point Loading- half of the load applied on each third of the span
length (ASTM, 2015).
Flexural strength is calculated as
Modulus of rupture: 𝑅 =𝑃𝐿
𝑏𝑑2 (3.1)
where R = modulus of rupture (MPa), P = maximum applied load ( N), L = span length (mm), b =
average width of beam (mm), d = average depth of beam ( mm).
3.3.3 Description of Abrasion Test Apparatus
The test method developed here in this study mainly focuses on the determination of the abrasion
losses of concrete on hydraulic structures due to impact force and friction. The method is adapted
from Liu et al. (2006). In this study, two types of sand were used with water to cause abrasion due
to mixed particles, which reflects the real scenarios of abrasion in hydraulic structures. Aluminium
oxide (Figure 3-4) with a Mohs hardness of 9 and 16 mesh size (average size of 0.6 to 1.18 mm
and fineness modulus 3.85) and fine silica (average size of 0.15-0.30 mm and fineness modulus
1.36) (Figure 3-5) with a Mohs hardness of 7 have been used. The two types of sands were mixed
in a ratio of 0.6 parts aluminium oxide to 0.4 parts silica. At 2, 4, 7 and 28 days of age the
concentration of sand mix was 400 kg/m3 whereas at 90 days of age the concentration of sand mix

63
was 500 kg/m3 but the ratio of two types of sand was kept the same. Initially tests were performed
using a sand and gravel mix. Although the pump can handle particles up to a size of 19.05 mm,
during test larger particles became trapped between the impeller and casing which blocked the
impeller and eventually stopped the pump. This can cause severe damage to the impeller, for this
smaller particle size was used in this research. Figure 3-6 shows the probable area with red arrow
the where large particle can become trapped. In Figure 3-7, it can be seen that the impeller was
totally dislodged with a high amount of particles trapped in the space between the impeller and
casing. . Images of the sands used in this study as abrasive materials are shown in Figures 3-4 and
3-5
Figure 3-4: Aluminum Oxide particle used
in this study which is 60% of total abrasive
material
Figure 3-5: Fine Silica used in this study
which is 40% of total abrasive particle.

64
Figure 3-6: Impeller of the pump.
Figure 3-7: Blockage problem of the pump due to the usage of larger particles.

65
The dimensions of water tank (Figure 3-8) are 1219 mm x 914 mm x 914 mm (or 48’’ x 36’’ x
36’’). Prior to the addition of sand, the height of the water is approximately 20 cm from the bottom
of the tank when both pumps are submerged in water. The water level rises to some extent when
the sands are mixed in water. The water tank is divided into two chambers: The first chamber
contains the pumps as well as the water-sand mix, whereas the second chamber contains only water
but no sand. Essentially, the sand remains in half of the floor area. Figure 3-8 shows the partition
of water-sand zone and the water zone. There are two advantages: a) the concentration of sand
remains consistently high in the water flow system, and b) the sands circulate well in the small
area and near the pump. If the whole area were used for water-sand mixture, most of the sand
would just settle far away from the pump. It would not circulate through the pump and would not
participate in the abrasion process.
Moreover, the Al2O3 sand particles used in this study are very hard and heavy. Their average size
is 1 to 1.5 mm. If they are not kept in small area, most of the sands would settle quickly far away
from the pump and would remain unused for the whole duration of a test. To circulate the sand
well, an air pressure nozzle was used during a test (Figure 3-9). The position of the air nozzle in
the tank is such that it can push the maximum amount of sand towards the pump. When water-
sand mixture comes back after hitting the specimen, it falls directly near or on the pump so that
sand particles can circulate immediately through the pump.
Two submersible pumps of same congifuration were used to abrade concrete samples. Because
concrete is a very hard material, it needs high water pressure to abrade concrete particles from its
surface. Some details about the two pumps are listed in Table 3-2.

66
Table 3-2: Detail configuration of Pumps
Pump Type Submersible Effluent Pump
Horsepower 4/10
Discharge rate at 5’’ height 215 litres/minute
Size of Solids can handle 19.05 mm
Voltage 115V
Ampere 9 amps
Inner Diameter of pipe used 50.8 mm
The concentration of sand in the water is about 400kg/m3. To determine the sand concentration,
the amount of clean water used in the tank was measured and then an adequate amount of sand
was poured into the water to make the sand concentration 400kg/m3. The two pumps (Figure 3-9)
were used to create a high-velocity jet of water-sand mixture. The distance between the nozzle and
the specimen is 30 cm. The diameter of the nozzle is 12.5 mm. As both pumps have constant
discharge, the average velocity of the water jet is about 8.4 m/s. This creates a pressure of about
0.82 MPa. Equation (3.2) was used to determine the pressure created on the surface of the sample.
𝑝 = 𝜌. 𝑣2 (3.2)
where p = pressure of water jet on the sample surface (MPa); ρ= density of water-sand mix (kg/m3);
v = velocity of water jet (m/s). The density of the water sand mix was measured by collecting
water-mix in a bucket for several times and measuring the mass and volume of water mix in the
bucket. Dividing the average mass with average volume gives the density of water-sand mix; it
was determined to be 1167 kg/m3.
This high-velocity jet hits the sample specimen directly on its top surface, with an incident angle
of 90, and causes the impact and abrasion. Only 90 impact angle was used in this study. Note
that previous studies (Liu, 2012) showed that abrasion due to impact is maximum when the
incident angle is 90. A schematic diagram of the abrasion test apparatus is shown in Figure 3-8.
A photo of the actual experimental setup of abrasion test apparatus is shown in Figure 3-9.

67
Figure 3-8: Schematic diagram of abrasion test apparatus.
Figure 3-9: Abrasion test apparatus used in this study.

68
3.3.4 Velocity of Water Jet Measurement
As mentioned in the previous section, the flow velocity used for the abrasion test is 8.4 m/s which
was kept constant. The discharge rate of both pumps was the same and constant. For a specific
pipe network, the flow velocity is always same as discharge is the same. In that condition, the best
way to increase or decrease the flow velocity is by changing the diameter of the outlet pipe/nozzle.
Three different nozzle diameters were used to find the best flow velocity which will give proper
abrasion with a good amount of discharge. Table 3-3 contains all the data and results on velocity
and discharge. The discharge rate was measured by collecting water in a bucket for a specific time
period. The mass of water collected water mass was measured. From the weight of water, the
volume was determined and from volume and time, discharge rate was measured. The results show
that, when the nozzle radius is 9.5 mm (19 mm in diameter) the discharge is maximized, but the
velocity is low and is not strong enough to abrade the concrete surface. When the radius is 7.9 mm
(15.8 mm in diameter) which is the smallest among the three nozzles gives highest velocity, which
is 13.22 m/s, but the discharge is too low and also as the radius is small; therefore, it is not
convenient for sand particles to pass smoothly through this small hole . Also there is a possibility
of jam/ blockage by the sand particle as the average size of particles is 1 to 1.5 mm. The optimum
results were obtained when the nozzle radius was 9.5 mm (19 mm in diameter) which exhibited
sufficient flow velocity to initiate and abrade the concrete surface and also the discharge rate is
adequate to carry sand particles smoothly. For these reasons, flow velocity of 8.4 m/s was chosen
for this research; from previous studies, the most common flow velocity was used is 8 to 12 m/s.

69
Table 3-3 : Flow velocity and discharge
Nominal nozzle radius
(mm)
Area of nozzle
opening (m2) Discharge (m3/s) Velocity (m/s)
9.5 0.00028502 0.001966 6.9
7.937 0.00019793 0.001662 8.4
3.9687 0.00004950 0.000654 13.2
3.3.5 Abrasion Test Procedures
The duration of each abrasion test was 3 hours. Prior to a test, each sample was removed from the
curing and was made saturated surface dry (SSD), then the mass of the sample (w1) was determined
to an accuracy of 0.01 grams. After the completion of the test, the saturated surface of the sample
was made SSD again, then the mass of the sample (w2) was determined. The difference between
w1 and w2 gives the abrasion-induced mass loss, ∆w:
21 www (3.3)
The abrasion rate (Ar) is determined as
at
wAr
(3.4)
where a = affected surface area (m2); t = test duration (minute).
During a test, the sand flow through the pump was consistently monitored. Typical conditions as
observed in the laboratory were as follows. In the first 2 to 3 minutes, sand flow through the pump
was maximized as a high amount of sand near the pump goes into the pump very quickly.
Subsequently, the sand flow maintains at a steady rate. The test apparatus was covered with a thin
plastic sheet to prevent water splashing outside the tank. The water flow velocity was estimated
using the volume-time method. It was measured several times by catching water in a bucket for a
fixed period of time and then calculating the discharge from it. As discharge was known as well
as the cross section of the outlet nozzle, it was easy to measure the velocity of water-jet. The
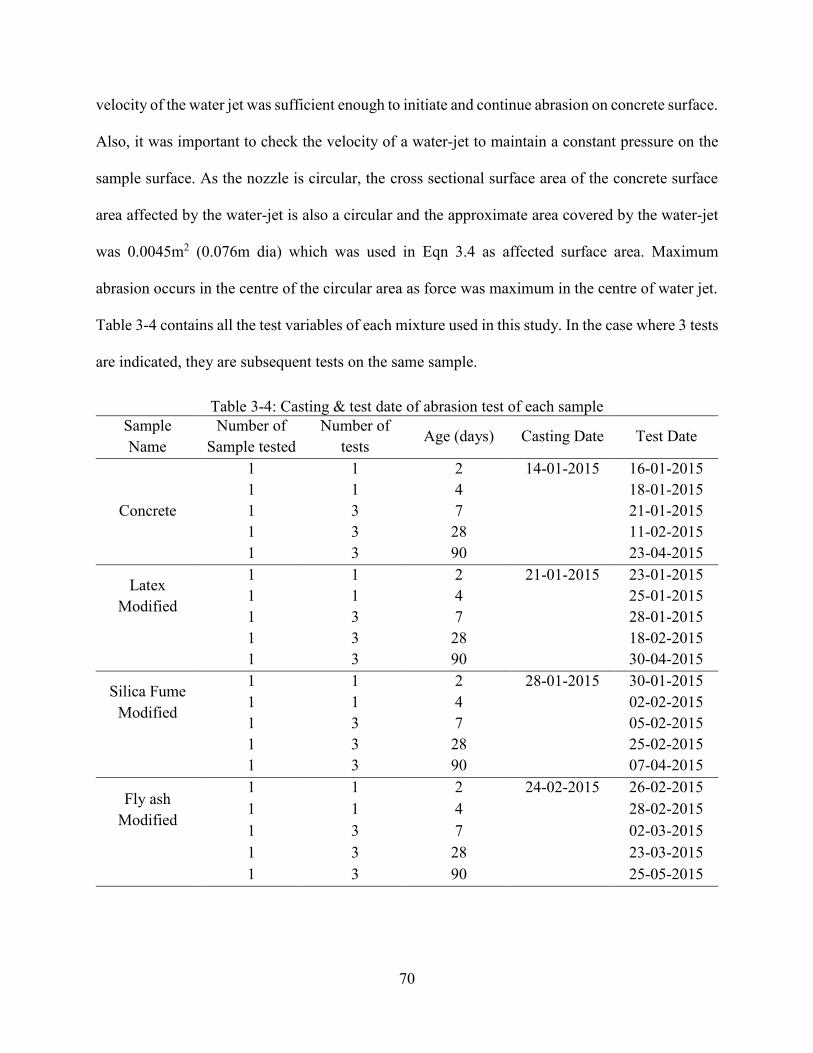
70
velocity of the water jet was sufficient enough to initiate and continue abrasion on concrete surface.
Also, it was important to check the velocity of a water-jet to maintain a constant pressure on the
sample surface. As the nozzle is circular, the cross sectional surface area of the concrete surface
area affected by the water-jet is also a circular and the approximate area covered by the water-jet
was 0.0045m2 (0.076m dia) which was used in Eqn 3.4 as affected surface area. Maximum
abrasion occurs in the centre of the circular area as force was maximum in the centre of water jet.
Table 3-4 contains all the test variables of each mixture used in this study. In the case where 3 tests
are indicated, they are subsequent tests on the same sample.
Table 3-4: Casting & test date of abrasion test of each sample
Sample
Name
Number of
Sample tested
Number of
tests Age (days) Casting Date Test Date
Concrete
1 1 2 14-01-2015
16-01-2015
1 1 4 18-01-2015
1 3 7 21-01-2015
1 3 28 11-02-2015
1 3 90 23-04-2015
Latex
Modified
1 1 2 21-01-2015
23-01-2015
1 1 4 25-01-2015
1 3 7 28-01-2015
1 3 28 18-02-2015
1 3 90 30-04-2015
Silica Fume
Modified
1 1 2 28-01-2015
30-01-2015
1 1 4 02-02-2015
1 3 7 05-02-2015
1 3 28 25-02-2015
1 3 90 07-04-2015
Fly ash
Modified
1 1 2 24-02-2015
26-02-2015
1 1 4 28-02-2015
1 3 7 02-03-2015
1 3 28 23-03-2015
1 3 90 25-05-2015

71
3.3.6 Scanning in 3D Scanner and Data Processing using MATLAB
In addition to the mass loss [equation (3.3)], changes to the concrete surface due to abrasion (Figure
3-10) are obtained by three-dimensional scan. The abraded concrete specimens were scanned using
a Nextengine 3D Scanner HD. The scanner can be set to a number of resolutions, ranging from
700 points per square inch to 40,000 points per square inch. The finer the scan resolution, the larger
the size of output data files. These output files are object files whose file names have the extension
‘obj’. In this study, a constant resolution of 4400 points per square inch was used. This resolution
was a compromise between file size and surface details. The maximum accuracy of the scanner is
±0.127 mm. At 4400 ppi, it is ±0.381mm.
In the Cartesian coordinate system (X, Y, Z), the Z-axis is taken to point positively upward (Figure
3-10). Prior to jet-induced abrasion, a cylindrical concrete specimen has its top surface located at
Z = Z0. Let z denote the abrasion depth at a given point of (X, Y) in the X-Y plane. z is given by
Y,XZZz 0 (3.5)
In equation (3.5), Z presents the elevation of the abraded top surface Sa.
The 3D scan gives output data of coordinates (X, Y, Z) for the abraded top surface Sa. All the data
files were post processed in MATLAB. The obj format is a common visualization format readable
by many computer graphics software such as Maya (2015) and Meshlab (2015). An ‘obj’ data file
contains various types of geometric data, which includes geometric vertices of an object, texture
coordinates, and vertex normals. In this study, only vertices were required on the sample surface.

72
The ‘obj’ text file was opened in Microsoft Notepad, and only vertices data were extracted from
the file and saved in a new data file (whose name has the extension ‘txt’) for processing using
MATLAB scripts.
There are several steps in MATLAB data processing, as discussed below:
1) Read the (X, Y, Z) coordinates from a txt file. The MATLAB script for this purpose is given
in Appendix A.
2) While scanning a concrete specimen, the scanner’s front plate and the specimen were more
or less aligned to be parallel, but the scanner’s laser diodes were not necessarily
perpendicular to the specimen. Thus, the output data has an ‘arbitrary’ orientation in space.
The arbitrary orientation is rectified in a MATLAB script which rotates the dataset such
that the disk is in the X-Y plane (Figure 3-10) and the depth of the concrete surface is in the
z-direction. In this MATLAB script, the center of the dataset is identified by averaging
each coordinate component using the ‘bsxfun’ function. This function deducts the mean of
each axis from each corresponding (X, Y, Z).
Figure 3-10: The Cartesian coordinates system

73
After that, the direction of most variance or the direction of the principal component (PC)
of the variance of the dataset was determined through singular value decomposition (SVD).
Details about SVD will be discussed later. As illustrated in Figure 3-11, the (X, Y, Z) data
were plotted as blue dots. The two dimensions (X, Z) are moderately correlated to each
other, by taking the SVD of the data. The two principal components (PC) were obtained,
shown as the yellow and red arrows. The first PC points in the direction along which the
data tend to lie. In Figure 3-12, the data was projected onto the PC’s and re-plotted. The
result is that the space has been rotated, and the data points are correlated and aligned with
the coordinate axes. In other words, the new (X, Y) coordinates become parallel to a
horizontal plane, and the Z-axis becomes in the vertical. The average of the Z values is very
small (close to zero). The difference in Z coordinates between before and after an abrasion
test gives the depth of abrasion (equation 3.5). The MATLAB script for SVD is given in
Appendix B.

74
Figure 3-11: (X, Y, Z) coordinates from three-dimensional scanning, shown as blue circles. The
two arrows are the directions of most variance or PC’s.
Figure 3-12: (X, Y, Z) coordinates (blue circles) after SVD or after rotation. The two arrows or
the directions of most variance or PC’s after rotation become parallel to the axes.

75
The mathematical analysis behind the Singular Value Decomposition or SVD function is
discussed below. SVD is a method for identifying and ordering the dimensions along which
data points exhibit the most variation. SVD is based on a theorem of linear algebra which
says that a rectangular matrix A can be broken down into the product of three matrices.
The theorem can be presented as
T
nnmmnmnm VSUA (3.6)
where U = an orthogonal matrix, its columns being orthogonal eigenvectors of AAT; V =
the transpose of an orthogonal matrix, its columns being orthogonal eigenvectors of ATA;
S = a diagonal matrix containing square roots of the eigenvalues from U or V in descending
order.
The matrix A can contain any number of column and rows. In this study, A is the original
data set of the abraded surface which needs to be rotated. Typically a raw scan data file of
a sample concrete surface contains around 46000 ± 1000 (X, Y, Z) coordinate points.
Thus, a raw data file has 3 columns (X, Y, Z) and around 46000 rows. For the purpose of
demonstration, take 46000 as the number of rows. In other words, the dimensions of the A
matrix are 46000 × 3. In order to find U, first, the transpose of A (or AT) was determined.
As the dimensions of A matrix are 46000 × 3, the dimensions of AT are 3 × 46000. Then,
AAT was determined by multiplying A with AT. The dimensions of AAT are 46000 × 3.
Next, the eigenvalues and corresponding eigenvectors of AAT are evaluated by solving the
equation given below
𝐁�⃗� = 𝜆�⃗� (3.7)
76
where B = AAT, its dimensions being 3 × 3; v
= non-zero eigenvector of v, its dimension
being 3 × 1; λ = eigenvalue of B, which is a scalar.
Equation (3-7) can be rewritten as
𝐁�⃗� − 𝜆 · 𝐈 · �⃗� = 0 (3.8)
(𝐁 − 𝜆 · 𝐈)�⃗� = 0 (3.9)
The first step is to solve equation (3.9) for λ, from (𝐁 − 𝜆 · 𝐈) = 0. The second step is to
substitute values of λ into equation (3.7), to determine the vector v
. The eigenvector v
forms the column vector in a matrix ordered by the size of the corresponding eigenvalue.
The third step is to convert the vector v
into an orthogonal matrix by applying the Gram-
Schmidt orthonormalisation process of column vectors. This process produces U, its
dimensions being 46000 × 3.
The calculation of V is similar to that of U. V is based on the matrix ATA. In order to
determine V, the first and second steps mentioned above need to be repeated. Once V is
obtained, V needs to be transposed to find VT. The dimensions of both V and VT are 3 × 3.
In order to find the matrix S in equation (3.6), the square roots of non-zero eigenvalues was
taken and populated the eigenvalues diagonally in a way that s11 is the largest among all
eigenvalues, s22 is the next largest and so on until the smallest value. The non-zero
eigenvalues of U and V are always same. Thus, it does not matter from which one
eigenvalues are to be taken. The dimensions of the matrix S are 3 × 3. An example of
calculations in the SVD analysis is provided in Appendix C.

77
The main purpose of computing the SVD is to determine V, because the columns are the
principal components (PCs) of A, and these columns are mutually orthogonal unit-length
vectors. The few characteristics of PCs are that PCs define an orthogonal coordinate system
such that in this system the data are uncorrelated and PCs maximize the variance explained
in the data.
The last step is to multiply the original data set by V to project all the data points onto each
of the PCs. This yields the coordinates of the points with respect to the space defined by
the PCs. Since the PCs forms an orthogonal basis, what is really happening is the rotation
of space, as given below
T
USVA (3.10)
USVUSVAV T (3.11)
The result of US has the property that the columns are uncorrelated with one another. Since
the matrix S is a diagonal matrix, multiplication with S simply rescales the columns of the
matrix U, which does not change the condition of the mutual orthogonality.
In summary, the purpose of these calculations is to rotate the data set of an abraded surface
such that the horizontal surface becomes parallel to the X-axis and Y-axis of the coordinates
system, whereas Z-axis gives the depth of the surface abrasion. This rotation is done by
calculating the Principal component axis of the original data set and projecting the data set
onto the PCs.

78
3) Abrasion loss only occurred in the middle or centre of the circular concrete surface. There
was no significant abrasion near the edge. For this reason, a 10 mm length from the edge
was not considered for further calculation. Accordingly, the actual radius is 50 mm,
whereas the effective radius is 40 mm (Figure 3-13). This 40 radius is larger than the 38
mm radius of the water jet. Figure 3-13 shows the plot where the red circle indicates the 40
mm radius area. Using the 40mm radius surface a 3D surface profile was plotted to see
how much abrasion has occurred, and in which position abrasion has occurred, using a
mesh function (Figure 4-10). The script of MATLAB is given in the appendix.
Figure 3-13: Effective surface area of the concrete surface. The area inside the red circle (40 mm
in radius) denotes the effective area.

79
3.3.7 Calculation of Abraded Volume using ArcMap
Calculations of the abraded volume (Va) use the following equation
n
N
n
nn
SS
a sY,XzdszdsY,XZZV
aa
1
0 (3.12)
where N is the total number of data points (or surface elements) from 3D scan of an abraded
concrete surface. The depth of abrasion z, given in equation (3.12), differs from point to point.
sn represents the horizontal area of the n'th surface element.
ArcMap (2015) is a program for processing geospatial data, which is the main component of Esri’s
ArcGIS suite. The version ArcMap 10.1 was very convenient to use to find the abraded volume
(Va) from concrete surface. The steps about how to determine the abraded volume from concrete
surface are given below:
1) The data of (X, Y, Z) coordinates of a sample specimen are imported to ArcMap using “Add
XY data” from the file menu. The data are saved in a shape file. By right clicking on the
current data layer at “table of contents”, one will find the “Export Data’’ option which will
export all the data in a specified directory.
For volume calculation, the whole sample surface was not considered as it was not affected
by the water jet impact. The concrete surface area affected by the water jet is about a circle
of 20 mm radius. But the position of the abraded surface on all samples is not fixed, it
varies a little from sample to sample, for this reason, a 40mm radius circle from the surface
center was chosen from which volume loss will be measured for all sample specimens. It
was observed that the abraded surface occurred within the 40 mm circle for all sample

80
specimens. As was mentioned earlier, data 10 mm from the edge was excluded, but this
area was used to determine Z0.
2) Data were clipped into two files. All the data outside the 40mm radius were excluded using
“Clip’ tool in ArcMap for abrasion. Data between 40 and 48 mm radius were used to
determine the average initial datum height. To perform the clipping accurately, a polygon
shapefile was created in the same directory. In that polygon shape file, a circle was drawn
with a radius of 40 mm and the center of the circle is the center of the concrete surface.
After that, using the ‘’Clip’’ tool data outside the circle were excluded and new file was
saved as shapefile using “Export data” like step one.
3) In this study, average depth of an annular surface of which the inner diameter is 40 mm
and the outer diameter is 48 mm was taken as a reference height for each individual sample.
It was observed that there were some data points at the edges (between 48 and 50 mm
radius) that were not consistent and belong to the side surface of the sample (Figure 3-12
clearly shows this). For this reason, points within 2 mm distance towards the center from
the edge were excluded from the data set. Figure 3-14 shows the ring surface from which
average depth was determined.

81
Figure 3-14: Surface area considered for calculating average depth of the specimen, which was
used as a reference height in abraded volume calculation.
4) It was necessary to convert the latest shapefile into TIN (triangulated irregular network).
The TIN is a vector data structure which represents a surface in a geographic information
system. TIN consists of a non-overlapping triangular network of vertices associated with
the coordinates in three dimensions. In “3D Analyst toolbox” of ArcMap there is an option
called “Data Management toolset’’. In “Data Management toolset there is an option called
“TIN’’ under this option, one can find “Create TIN’’ option. Using “Create TIN’’ current
shapefile was converted to TIN. Figure 3-15 shows a TIN surface of a Fly ash modified
materials with an age of 90days. The different colours showthe range of abrasion depth..

82
As the non-abraded portion does contain small irregularities, some points are higher than
the calculated datum.
Figure 3-15: TIN surface of Fly ash Modified Repair Materials sample at the age of 90 days.
Note that in the integral (equation 3.11) for determining the volume of abrasion, the
reference value Z0 is taken as the average elevation of 40-48 mm ring (Figure 3-15) in this
study. Appendix C shows the MATLAB script for evaluating the average elevation of a
concrete specimen.
Using the “Surface Volume’’ tool, setting the reference plane height as the average depth
and selecting the “Below” option in the “Reference plane”, the surface volume was
measured. An output text file was generated from the “Surface Volume” analysis, which
contains some results, including projected area, surface area and volume. Figure 3-16
visualizes how ‘surface volume’ tool works. Surface volume tool calculates the area of

83
each triangle on the surface and use integration to method to calculate the volume from the
reference plane to the bottom/top point the surface.
Figure 3-16: Measurement of volume using "Surface Volume'' tool from a reference plane
(http://resources.arcgis.com, accessed on 15/06/2015).

84
4. Test Results and Discussion
4.1 Introduction
This chapter contains the results obtained from all the experiments. The results are analyzed and
discussed in detail in regards to relevant published research findings. For determining compressive
and flexural strength of concrete specimens, the average observation of three samples tested at
same condition was considered. Both compressive and flexural strength test was performed at the
age of 28 days in accordance with ASTM methods. For abrasion resistance measurements, single
tests were performed at concrete ages of 2, 4, 7, 28 and 90 days. At early ages, 2 and 4 days, one
sample was tested for 3 hours. For 7, 28 and 90 days, 3 cycles of abrasion testing was performed
on a single sample. The density of sand mix with water was maintained same which is 400 kg/m3
at the age of 2, 4, 7 and 28 days and during the experiment; at the age of 90 days sand density was
increased to 500kg/m3 to observe that effect of density variation of the sand-water mixture.
Another reason to increase the sand density was that the expected abrasion mass loss at 90 days
age for a few types of material such as silica fume modified material would be very negligible.
The main parameters used to compare the results are type of material, age of concrete, duration of
exposure and sand/water density. All the results are discussed and graphically represented in this
chapter.
4.1.1 Effect of Age of Concrete on Abrasion Resistance
Four types of materials were used to observe the effect of age on the abrasion resistance of
concrete. Figure 4-1 shows the relationship between ages of concrete with the abrasion resistance

85
at different ages of concrete. The test duration at 2 & 4days of age was 3hours and at 7, 28 &
90days it was 9hours. The abrasion test was performed at ages of 2, 4, 7 and 28 days and the sand
mix concentration was 400 kg/m3 water. However, for the better observation another set of
experiments was performed at the age of 90 days with a sand concentration of 500kg/m3 to evaluate
the impact of higher sand concentration. In general, it is observed that, for each type of concrete
mixtures, abrasion rate decreases with the increasing age. It is clearly observed that the standard
concrete material is more vulnerable to abrasion then other repair materials. The silica fume repair
material shows the best abrasion resistance among the three materials. The silica fume and the
randomly distributed micro polymeric fibres give increased resistance. After silica fume, latex
modified repair exhibits the next best abrasion resistance. The abrasion rate of concrete material
was reduced by 19.6% within a duration period of 2 to 4 age with respect to 4days abrasion rate,
by 25.6% at 7 days age with respect to 4days abrasion rate and by 47.7% at 28days age with respect
to 7days abrasion rate.
Table 4-1 shows the average abrasion rate at different ages for all four types of concrete for a 3hour
abrasion test. The abrasion rate of Concrete material at 28 days of age was reduced by 69%
comparing to 2days of age. Though the reduction is very high the abrasion rate is still high in
comparison to other materials. At 28days of age, Latest modified showed a reduction of 63.4%,
Silica fume modified material showed a reduction of 69.5% and Fly ash modified material showed
a reduction of 28.9% within compared of 2days of age abrasion rate.

86
Table 4-1: Abrasion rate of concrete materials at different age for a 3hour abrasion test
Age of concrete (days) 2 4 7 28 90
Abrasion rate (g/m2/min)
Concrete material 21.66 17.41 12.95 6.72 9.99
Latex modified material 13.04 12.51 11.98 4.77 10.65
Silica fume modified repair material 8.66 8.00 6.72 2.64 3.57
Fly ash modified repair material 10.30 6.57 7.53 7.32 8.34
Figure 4-1: The relationship between abrasion erosion rate and age of concrete at different ages.
As it was observed that for silica fume material the abrasion rate is very low which denotes its
high abrasion resistance. At 28 days, the abrasion mass loss for silica fume material is below 1 g.
It was expected that at the age of 90days abrasion rate will decrease as concrete’s strength will
increase compared to 28 days. For this reason, the density of sand in water was increased to 500
kg/m3. The results show that at higher concentrations of sand mix it was observed that the abrasion

87
rate was higher than it was during 28 days; clearly indicating that the density of sand has an
influence on abrasion. But the overall ranking is similar to 28 days results. Again, silica fume
exhibits best abrasion resistance as expected. Latex modified and concrete materials exhibited an
almost similar kind of abrasion whereas fly ash repair material exhibited a little less abrasion than
both of them. Through all the experiments, the fly ash material’s abrasion rate was not reduced as
much with its increasing age in comparison to other types of materials, Figure 4-2 shows the image
of all types of sample after abrasion test.
Figure 4-2: Image of sample specimens used in abrasion test. From left: a) Latex modified
material, b) Fly ash modified material c) Concrete material d) Silica fume modified material
.

88
4.1.2 Effect of Exposure Duration
All four types of materials were tested for 9 hours at intervals of 3 hours at 7, 28 and 90 days of
age. Overall, the test results showed that the amount of abrasion increased with the increment of
exposure time and the relation is linear. At the top layer of the surface, the water cement ratio is
higher which made the top surface of the concrete weaker and caused higher abrasion. Abrasion
erosion reduced when aggregates became visible and the relationship became nonlinear as they
became dislodged. In this research, non-linearity relationship was not observed. It was observed
that the abrasion depth was just a couple of millimeter, which was not sufficient to dislodge the
larger aggregates.
At 7 and 28 days age, the abrasion test was performed with a sand mix concentration of 400kg/m3
and at 90 days age sand density was 500kg/m3 as the abrasion mass loss for silica fume material
during an age of 28 days was below 1g. This will reduce more at the age of 90 days thereby making
it negligible to compare. Figure 4-2 shows the relationship between abrasion loss and duration of
test at the age of 7 days when sand density was 400 kg/m3. Again, the silica fume material exhibited
the best abrasion resistance among the other three types. The concrete material showed a maximum
abrasion loss followed by latex modified material and fly ash material. For all the four types of
materials, the relationship is linear between abrasion loss, exposure time and slopes.

89
Figure 4-2: The relationship between abrasion loss and duration of exposure at the age of 7 days
with a sand density of 400 kg/m3 in water.
Figure 4-3 shows the same relationship at the age of 28 days. This time, the latex modified material
exhibited higher abrasion than others. The slope of the concrete material was quite high compared
to the other materials. At the beginning, concrete material showed less abrasion than fly ash, but
at the end of 9 hours abrasion, it exhibited higher abrasion than fly ash but lower than latex
modified material. The overall results of all ages’ concrete showed that abrasion loss increased
linearly with an increasing exposure time and reduced with an increasing age and increasing sand
density. There was no significant change in the rate of abrasion as all the three tests were conducted
on the same day, which denoted the same age of concrete for each individual sample. There was a
reduction of about 58.8% in abrasion loss of silica fume material at the age of 28 days compared
to 7 days abrasion test results. For latex modified materials, it was about 40.2% and for concrete

90
materials it was about 31.5%. Fly ash concrete showed the highest abrasion loss with a reduction
in abrasion loss which is only 3% in comparison with a 7 days abrasion loss.
Figure 4-3: The relationship between abrasion loss and duration of exposure at the age of 28 days
with a sand density of 400kg/m3 in water.
At 90 days, abrasion loss was higher for all types of concrete with respect to 28 days as sand
density was increased to 500kg/m3 (Figure 4-4). Even though the test results were similar, again
silica fume exhibited minimum abrasion loss. It also exhibited the same kind of results as that
during 28 days, but fly ash concrete exhibited a bit higher abrasion loss than the concrete material.
Silica fume material showed a minimum abrasion loss which was less than 2 g in 9 hours. On the
other hand, latex modified concrete showed moderate abrasion loss.
0.00
1.00
2.00
3.00
4.00
5.00
6.00
3 6 9
Abra
sion l
oss
(gra
m)
at 2
8d
ays
Duration of test (hour)
Concrete Material
Latex modified Material
Silica Fume Repair Material
Fly ash Repair Material

91
Figure 4-4: The relationship between abrasion loss and duration of exposure at the age of 90 days
with a sand density of 500 kg/m3 in water.
4.1.3 Effects of Strength
When a sample specimen is subjected to the abrasion test according to the method used in this
study the specimen faces compressive, tensile and shear stresses near the top surface of the
specimen due to the impact induced by the water-jet. From literature, it has been already
established that the strength of concrete has a profound impact on the abrasion resistance of
concrete. Table 4-2 shows the values of compressive strength and flexural strength at 28 days and
the abrasion rate at various ages of all types of concrete materials used in this study. It can be seen
that the compressive strength generally exceeded the manufacturer’s values. This is expected as
these represent minimum results.

92
Table 4-2: Compressive strength, flexural strength and abrasion rate of concrete at 28 days
Compressive
Strength
Flexural
Strength
MPa MPa Abrasion rate (g/m2/min)
Concrete Material 41.9 5.3 6.36
Latex modified Repair
Material 45.4 7.5 5.04
Silica Fume Repair
Material 57.8 12 2.91
Fly Ash Repair Material 48.15 11 7.15
Figures 4-5 and 4-6 illustrate the relationship between abrasion rate, compressive strength and
tensile strength, respectively, for the 3 hour jet test at the age of 28 days. In a nutshell, the abrasion
rate decreases when the concrete strength increases. Coefficients of determination (R2) are often
useful to correlate the concrete strength with the abrasion rate. The figures show that excluding
the fly ash material, the R2 for compressive and flexural strengths are very high, 0.9685 and 0.9962,
respectively. Both the figures and table clearly show that if compressive and flexural strength
increase, the abrasion rate decrease which coincides with the previous research. However, the
abrasion rate of fly ash modified materials were quite high despite of its high compressive and
flexural strength. The triangular point on both Figure 4-5 and Figure 4-6 denotes the data of fly
ash modified material.

93
Figure 4-5: The relationship between compressive strength and 28 day abrasion rate.
Figure 4-6: The relationship between Flexural strength and 28 day abrasion rate.
y = -0.2051x + 14.689
R² = 0.9687
2
3
4
5
6
7
8
39 43 47 51 55 59
Abra
sion r
ate
at 3
hours
(g/m
2/m
in)
Compressive strength (MPa)
y = -0.5088x + 8.9759
R² = 0.9963
2
3
4
5
6
7
4.8 6.3 7.8 9.3 10.8 12.3
Abra
sion r
ate
at 3
hours
(g/m
2/m
in)
Flexural Strength (MPa)

94
4.1.4 3D Scanner Results
To measure the abrasion depth and abraded volume, the Nextengine 3D scanner was used. A total
of sixteen sample specimens were scanned. Data files obtained from the 3D scanner contained
vertices with XYZ coordinates which formed the triangular mesh surface. The scanner was capable
of scanning any sample with different resolution ranging from 700 to 44,000 points per square
inch. If a higher resolution is used, the accuracy of the analysis will be high as it will take more
data point into account in the same area. If the resolution is high, the file size is also becoming
high which needs more time and a powerful computer to analyze the data. Table 4-3 shows the
volume loss and the average abrasion depth due to abrasion. The volume loss is obtained from the
circular area with a radius of 40mm from the center of the surface and the abrasion depth is
obtained from the area between 40mm to 48mm radius where abrasion did not occur.It is clearly
visible that, volume loss and abrasion depth is not constant with a changing resolution. The higher
the resolution, the higher is the volume loss even though the difference is not that big, however
higher resolution provide more accurate results. Among 5 different resolutions, 4400 points per
square inch provided the optimum volume loss and also the volume loss difference between the
10000per square inch and 4400 per square inch was very negligible, the number of vertices was
very high in the second one for which data file was very high. That is why 4400 per square inch
resolution was used for the analysis which provided optimum results with good accuracy and
moderate file size.

95
Table 4-3: Comparing different resolution with abrasion depth of same sample specimen
Resolution of
Scanner (per
square inch)
Volume loss
(mm3)
Ave. Abrasion
Depth
Number of
Vertices File size (Mb)
700 116.8503 -0.1823 16241 1.93
1100 121.8208 -0.1784 25514 3.11
2000 138.2612 -0.1677 45150 5.62
4400 138.7712 -0.1698 45342 5.64
10000 136.1226 -0.1688 101908 12.8
Two different types of graph were plotted in MATLAB to visualize the abrasion depth and
abrasion surface. One is a surface profile of each sample in three dimensional space and another
one is abrasion depth from one edge to another in a 2D plot. A TIN (triangular irregular network)
surface was also obtained from analysis in ArcMap, which also represented the surface topography
in two dimensional space. Figure 4-7 shows a real image of the 7 day latex-modified sample after
the 9 hour test. Figure 4-8 shows the TIN surface of the same sample specimen from which abraded
area on the surface was easily distinguishable. The legend besides the TIN surface in Figure 4-8
shows the abrasion depth with respect to their color. In Figure 4-9, shows a ring shaped surface of
which inner radius is 40mm and outer radius is 48mm. It is observed that there was no abrasion
erosion in this zone for all sample specimens, that is why this average depth of this area was
considered as zero and abrasion depth in 40mm circle was measured with respect to this zero depth.
Figure 4-10 illustrates the surface profile of the Concrete Material sample after a 9 hour test at the
age of 7 days. The orientation of Figure 4-10 with respect to Figure 4-9 is X-Y plane 45° anti-
clockwise, Z-axis 36° clockwise. The yellow and blue colour areas represent the abraded surface
of that specific sample.
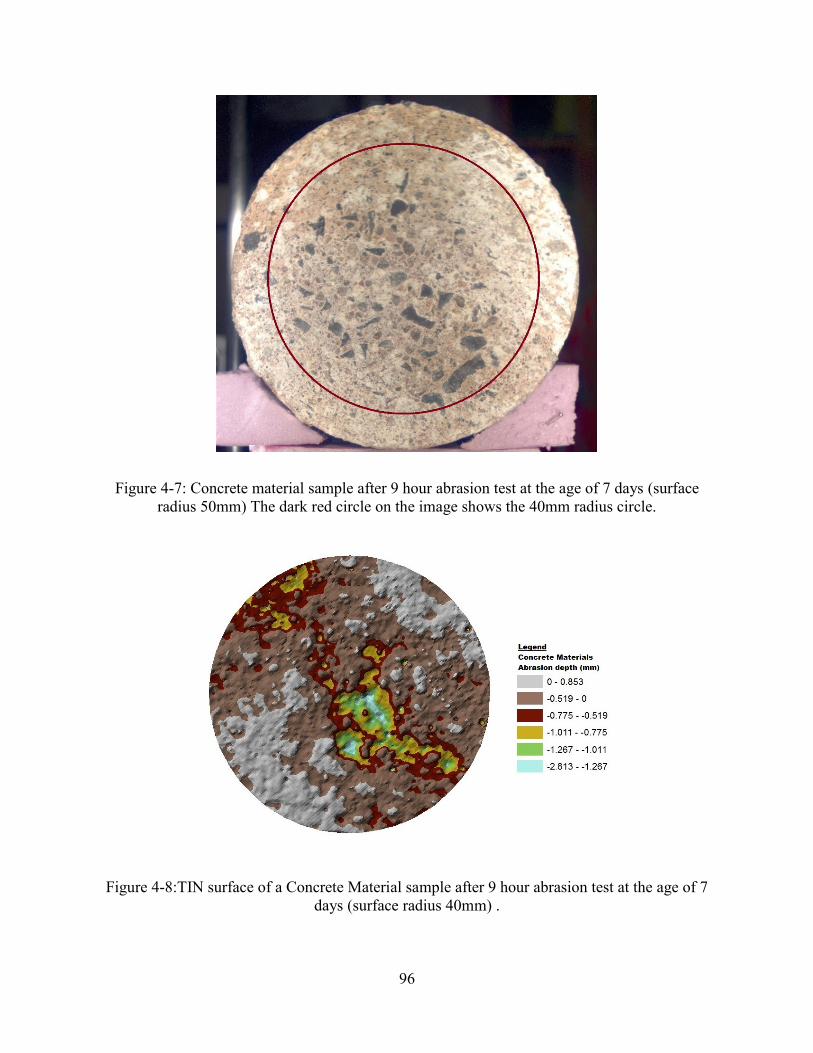
96
Figure 4-7: Concrete material sample after 9 hour abrasion test at the age of 7 days (surface
radius 50mm) The dark red circle on the image shows the 40mm radius circle.
Figure 4-8:TIN surface of a Concrete Material sample after 9 hour abrasion test at the age of 7
days (surface radius 40mm) .

97
Figure 4-9: Ringshape TIN surface of a Concrete Material sample after 9 hour abrasion test at the
age of 7 days of which average depth is zero mm. (inner radius 40mm, outer radius 48mm).
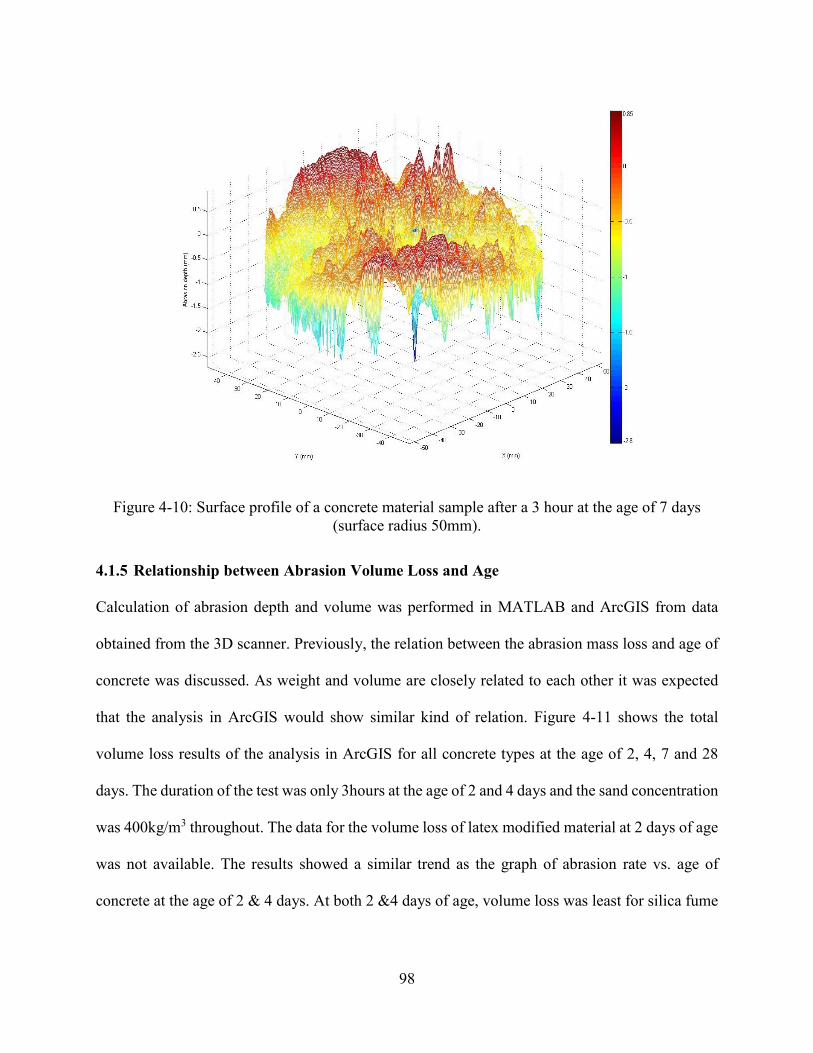
98
Figure 4-10: Surface profile of a concrete material sample after a 3 hour at the age of 7 days
(surface radius 50mm).
4.1.5 Relationship between Abrasion Volume Loss and Age
Calculation of abrasion depth and volume was performed in MATLAB and ArcGIS from data
obtained from the 3D scanner. Previously, the relation between the abrasion mass loss and age of
concrete was discussed. As weight and volume are closely related to each other it was expected
that the analysis in ArcGIS would show similar kind of relation. Figure 4-11 shows the total
volume loss results of the analysis in ArcGIS for all concrete types at the age of 2, 4, 7 and 28
days. The duration of the test was only 3hours at the age of 2 and 4 days and the sand concentration
was 400kg/m3 throughout. The data for the volume loss of latex modified material at 2 days of age
was not available. The results showed a similar trend as the graph of abrasion rate vs. age of
concrete at the age of 2 & 4 days. At both 2 &4 days of age, volume loss was least for silica fume

99
modified repair materials whereas it was the highest for the concrete material. Fly Ash material
showed a similar volume loss at the age of 2 & 4 days as silica fume.
The duration of the abrasion test was 9 hours at the age of 7 and 28 days. It was also observed that
volume loss decreased with an increment in age for tests for the same duration. For concrete
materials, volume loss was reduced by 15.37% from 7 days to 28 days where as for latex modified
materials volume loss was reduced by 44.20%. For silica fume modified materials and for fly ash
modified materials the reduction was 11.64% and 9.19%, respectively.
Figure 4-11: The relationship between total abrasion volume loss and age of concrete at 2, 4, 7
and 28 days age.
At the age of 90 days, sand concentration was increased to 500kg/m3 to see the effect of sand
concentration on abrasion resistance. Figure 4-12 shows the volume loss at the age of 90 days for
all the four types of materials. As the mass loss in 90 days was higher than the mass loss at the age
of 28 days because of the increased sand concentration; volume loss also showed similar results.
Again, among the four materials, silica fume modified materials showed less abrasion loss and

100
concrete materials showed the highest volume loss. From the relation between mass and volume,
the mass loss and volume loss should be proportional to each other.
Figure 4-12: The relationship between abrasion volume loss and age of concrete at 90 days age.
Figure 4-13 shows the relationship between volume loss and mass loss at different age. As, density
is almost same for all specimens (2500-2650kg/m3), the ratio between mass and volume should be
constant at all ages. But, in this analysis it was observed that the ratio was not constant at all ages.
Figure 4-13 was plotted with all mass loss and respective volume loss data at different ages. The
dotted line in the graph shows the trend line for all data points and the solid line shows the expected
line. The slope of the trend line provides density of the concrete sample as density is the ratio of
mass to volume. It is clear that, expected trend line does not coincide with obtained trend line from
data. It is due to this uncertainty in the abrasion test procedure for which mass volume ratios varied

101
and the probable reasons could be the human error in measuring weight, improper saturated surface
dry of the specimen before starting and after the test and non-uniform flow of sand through pumps
during abrasion test.
Figure 4-13: The relationship between volume loss and mass loss of concrete surface.
4.1.6 Depth of Abrasion
The depth of abrasion is also a measure which can correlate abrasion resistance of different types
of concrete. Depth of abrasion was evaluated in MATLAB using data from the 3D scanner. The
test results showed that the higher the abrasion volume, the higher the abrasion depth as shown in
Table 4-4. But the depth of abrasion depends on the abraded surface area. For the same abraded
volume if the area is small, depth of abrasion will be higher than where the abraded area is large.
Also, maximum abrasion depth can be locally higher for a small abrasion mass loss due to an
aggregate particle loss as it make a hole on the surface of the concrete. There are some other
discrepancies with depth measurements as the water-jet does not cover the entire surface of the

102
specimen. As well as, the pressure is higher in the center of the water-jet, so if the center moves a
bit in each 3 hour test for the same sample, the maximum abrasion depth location also changes.
So, only considering the depth of abrasion does not provide the whole scenario, as the position of
the water jet impact area were not kept constant for the whole test duration. One must consider the
depth along with the abrasion mass loss and affected surface area. Table 4-4 shows all the data
obtained from analysis regarding average abrasion depth and maximum abrasion depth.
For better observation and accurate volume loss calculation, average abrasion depth was measured
in three different ways. Firstly, average abrasion depth was measured in a ring shape, surface area
whose inner radius was 40mm and outer radius was 48mm and this ring shape was not affected by
the water jet and volume loss was calculated taking this depth as the reference depth. Secondly,
abrasion depth was calculated at the center part of the surface where abrasion occurred and the
radius of the area was 40mm from the center. Thirdly, the whole surface area was considered for
determining average depth. Average depth in Table 4-4 show the depth in a 0-40mm radius circle
in relation to the depth in a 40-48mm radius circle. The overall results showed that, average
abrasion depth was lower in the circle in the center with a radius of 40mm as all abrasion occurred
in that area, as compared to the average depth in the ring shaped surface area since there was no
abrasion loss. When the whole surface was considered the average abrasion depth value fall in
between the circular area in the center with 40mm radius and the ring shaped area outside the a
40mm circle.

103
Table 4-4: Average depth of abrasion and maximum depth of abrasion
Age of
Specimen
(days)
Abrasion Depth (mm)
Test
duration
(hour)
Mass
(g)
Volume
(mm3)
Maximum
Depth
(mm)
4
Concrete Material 3 5.92 1400.58 -2.59
Latex Modified Repair
Material 3 1.98 833.84 -1.47
Silica Fume Modified
Material 3 2.56 809.4 -1.05
Fly Ash Modified
Material 3 0.74 462.57 -1.19
7
Concrete Material 9 6.15 2115.87 -3.03
Latex Modified Repair
Material 9 4.99 1362.88 -1.13
Silica Fume Modified
Material 9 3.99 728.23 -2.17
Fly Ash Modified
Material 9 4.71 1147.09 -1.82
28
Concrete Material 9 4.57 1445.77 -2.35
Latex Modified Repair
Material 9 3.25 946.4 -1.77
Silica Fume Modified
Material 9 1.79 470.73 -1.40
Fly Ash Modified
Material 9 4.96 1200.56 -2.08
90
Concrete Material 9 6.79 2788.5 -2.85
Latex Modified Repair
Material 9 7.24 2860 -2.60
Silica Fume Modified
Material 9 2.42 910.278 -1.33
Fly Ash Modified
Material 9 5.66 2457.11 -3.07
It is useful to consider the maximum abrasion depth of concrete to compare the abrasion resistance
of concrete. Figure 4-14 shows the results of abrasion depth at the age of 4,7,28 and 90 days for
all four types of concrete with respect to age. Comparing the results with the abrasion loss at 4
days age, it is observed that, though abrasion mass loss of silica fume modified material was higher
than fly ash modified material the abrasion depth is higher for fly ash modified materials. The
probable reason is the movement of the specimen during an abrasion test for which impacted area
of water jet was changed a bit.

104
At 7 days age, maximum abrasion depth for silica fume modified materials are higher than fly ash
modified materials which should be opposite according the abrasion mass loss results. Despite of
some of these individual discrepancies, the test results for abrasion depth shows similar trends as
that of abrasion mass loss and volume. Maximum abrasion depth reduces as age of concrete
decreases. The maximum depth of abrasion was higher at 90 days age compared with 28 days age
as sand concentration was increased from 400 kg/m3 to 500 kg/m3. Ultimately, at 28 days age and
90 days age, silica fume modified materials showed the less abrasion depth compared to with
others and fly ash modified and concrete material showed higher abrasion depths.
Figure 4-14: The relationship between abrasion depth and age of concrete at 4, 7, 28 and 90 days
age for all four types of concrete.
Figure 4-15 shows the relationship between maximum abrasion and mass loss of a concrete
specimen at different ages. It clearly shows that, if the maximum depth increases the mass loss
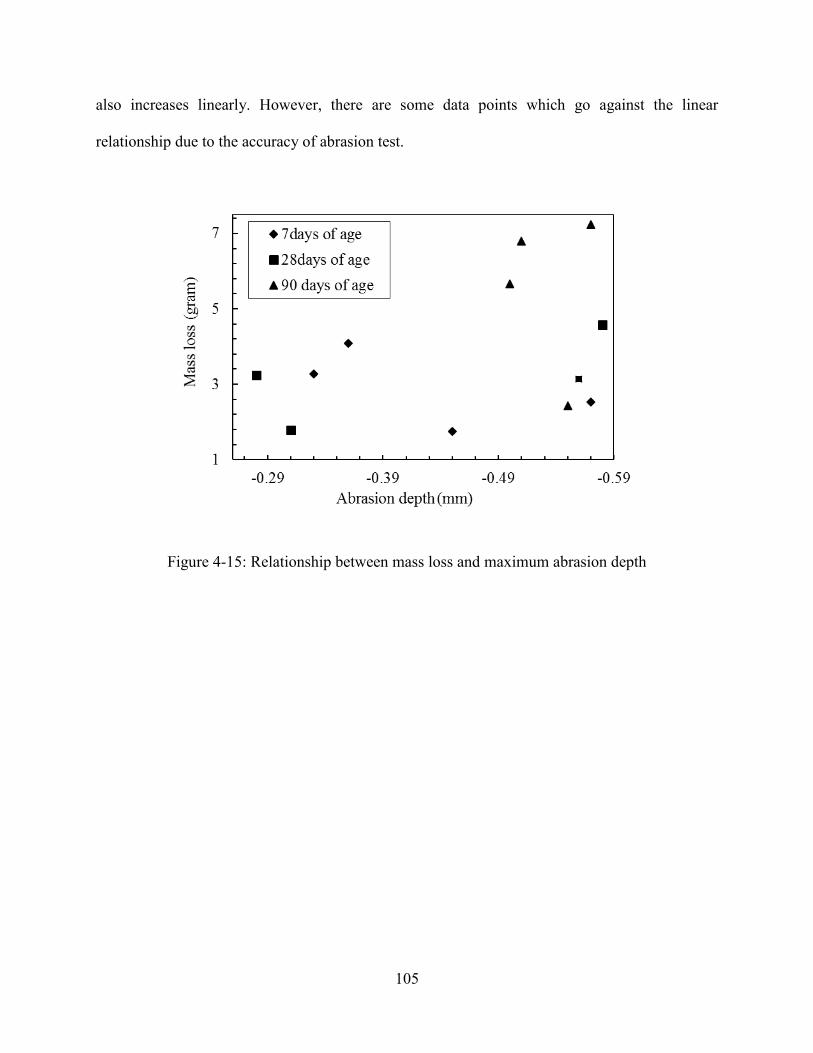
105
also increases linearly. However, there are some data points which go against the linear
relationship due to the accuracy of abrasion test.
Figure 4-15: Relationship between mass loss and maximum abrasion depth

106
5. Conclusions and Recommendations
5.1 Conclusions
The aim of the study was to evaluate the abrasion resistance of different concrete repair materials
due to the impact of water-borne particles. The experimental study was helpful to understand the
influence of physical properties of different concrete repair materials regarding the abrasion
erosion problem in hydraulic structures and will help to achieve a viable engineering solution for
this particular problem. The conclusions drawn from the results of this study can be summarized
as follows:
1) The experimental procedure used in the study is appropriate to perform experimental
evaluation of abrasion resistance of concrete due to impact as this test method can replicate
the real scenario occurred in hydraulic structures. The abrasive materials and velocity of
flow was sufficient to initiate the disintegration of particles from the sample surface.
Hardness of aluminum oxide played a major role in the observed abrasion erosion. There
is some variability in the test procedure such as uniform sand flow into the pumps, concrete
specimen’s moisture content before and after test for which experimental results may vary
but proper care and attention can eliminate that variability easily. One probable
improvement is to design the water tank in a way that it will supply the same amount of
sand flow into the pumps during the test and measuring the moisture content of concrete
sample before and after the test.
2) Four types of materials were used in the study. Among all four materials, silica fume
modified fibre reinforced repair material exhibited better abrasion than others. Latex
modified material comes after silica fume modified material in terms of abrasion resistance.
The worst abrasion resistance was exhibited by the concrete material, which is a

107
conventional concrete. Test results proved that supplementary materials can improve the
abrasion resistance of concrete to a good extent. Fly ash modified repair material, exhibits
lower abrasion than concrete repair material, but it's more than latex modified concrete.
The results of Fly ash were variable, sometimes it showed better abrasion resistance
sometimes not. Silica fume modified repair material and fly ash modified repair material
both contained the same amount of polypropylene microfibres as reinforcement, cement
and aggregates. The abrasion resistance exhibited by silica fume modified material is far
better than fly ash modified material. Therefore it can be said that polypropylene
microfibre’s contribution to abrasion resistance appears to be negligible.
3) Abrasion rate was compared with age of concrete and exposure time. Test results exhibited
that abrasion loss decreases with the increment of age and it increases linearly with
exposure duration which is similar to the previous research.
4) Abrasion mass loss is strongly correlated to compressive strength in most cases. With the
increment of compressive and flexural strength, abrasion loss decreases linearly. The
higher the compressive strength of concrete, the better the abrasion resistance. Fly ash
material exhibited slightly different results; compressive strength of fly ash repair materials
is higher than latex modified repair material, even though fly ash repair material exhibits
higher abrasion than latex modified material. More work is needed in this topic.
5) The method used for evaluating abrasion depth and volume using the 3D scanner and
analyzing the data in MATLAB and ArcMap was appropriate. As the resolution was high,
it was possible to analyze the data in MATLAB and ArcMap with high accuracy. Utilizing
ArcMap to calculate the abraded volume was a good choice as ArcMap was capable to
measure projected volume from a reference plane which gave more accurate results.

108
Overall, calculating abrasion volume in this approach is a new concept and gives a new
criteria to compare abrasion resistance of different types of concrete.
6) Depth of abrasion and volume showed a similar relation to the age of concrete as mass loss.
But, solely the depth of abrasion will not give an accurate comparison. It is only possible
if the position and the area of the water jet impact area were kept the same throughout the
test. Therefore, mass loss or volume loss should take into account when comparing the
abrasion resistance of concrete as this gives much more information. Most common test
methods use abrasion depth as a criterion.
5.2 Recommendations
On the basis of this study, a number of recommendations are made:
1) The test method adopted in this research is suitable for evaluating abrasion resistance due
to impact. But still there is significant scope to improve the performance of the abrasion
test apparatus. Two types of sand were mixed with water as abrasive materials and these
sand mix flows through the pump with water, but it is not possible to determine exactly
how much sand was transferred through the pump onto the concrete surface of concrete in
the test duration and also it is possible that the amount of sand flow is not equal for all tests.
However, it was assumed that sand flow is same for all the experiments as surrounding
conditions were kept same. The design of the abrasion test apparatus can be improved by
some modification which can ensure constant sand in the pump.
2) Aluminium oxide with a Mohr hardness 9 and fine silica was used as abrasive material.
Different sands and other larger particle like gravel can be used to evaluate the impact of
different abrasive particles with different hardness on abrasion.

109
3) As the amount of abrasion mass loss is very small, the difference between the saturation
level of concrete sample before and after the test can contribute to the mass loss which was
a source of error in this study. This error can be checked by measuring the moisture content
of the samples before and after test which will help to evaluate the accurate abrasion loss.
4) Only two types of sand concentrations were used; 400kg/m3 and 500kg/m3 to evaluate the
impact of abrasive concentration on abrasion which shows higher the concentration higher
is the abrasion. Few more different abrasive concentrations with different particle can be
used to evaluate the effect of abrasive particle concentration.
5) Ready-made concrete repair materials were used for the study where the limitation was
that the amount, percentage of latex polymer, fly ash, silica fume, polypropylene
microfibre were fixed. Experiments with different concentration of these materials would
help to analyse more accurately on their contribution to abrasion resistance. There is
immense scope to use different supplementary materials and fibre reinforcement to
evaluate the performance against abrasion resistance.
6) Use of the 3D scanner and evaluating the surface profile, abrasion depth and abrasion
volume with the help of MATLAB and ArcMap is a new approach. Better observation of
volume loss with more accuracy can be possible by scanning each sample before and after
the abrasion test.

110
5.3 Research Contributions
This experimental study of concrete surface abrasion has made the following research
contributions:
The loss of volume is quantified and added to the analysis of abrasion. This quantity is important
but has been ignored in previous studies. They have only considered mass loss, abrasion depth and
compressive strength.
For the first time, this study introduced 3D scan technology for accurate measurements of volume
loss and abrasion depth. The associated data processing methods developed in this study are very
efficient and suitable for handling a large of volume of measurements.

111
6. References
ACI Committee 210, Erosion of Concrete in Hydraulic structure (ACI 210R-03), ACI Manual
Concrete Practice, Part 1, American Concrete Institute, Farmington Hill, MI, 2003.
Alexander, M. G., and. Magee, B. J. "Durability Performance of Concrete Containing Condensed
Silica Fume." Cement and Concrete Research 29.6 (1999): 917-22.
ArcMap 10.1, http://www.esri.com/software/arcgis (accessed on 27/07/2015), (2012)
ASTM C418-12, Standard Test Method for Abrasion Resistance of Concrete by Sandblasting,
ASTM International, West Conshohocken, PA, 2012, www.astm.org
ASTM C779 / C779M-12, Standard Test Method for Abrasion Resistance of Horizontal Concrete
Surfaces, ASTM International, West Conshohocken, PA, 2012, www.astm.org
ASTM C944 / C944M-12, Standard Test Method for Abrasion Resistance of Concrete or Mortar
Surfaces by the Rotating-Cutter Method, ASTM International, West Conshohocken, PA,
2012, www.astm.org
ASTM C1138M-12, Standard Test Method for Abrasion Resistance of Concrete (Underwater
Method), ASTM International, West Conshohocken, PA, 2012, www.astm.org
Bakke, K. J. "Abrasion Resistance." Significance of Tests and Properties of Concrete and
Concrete-Making Materials (ASTM STP 169D), ASTM, West Conshohocken, PA (2006):
184-93.
Frizell, K.H, Mefford, B.W.,’’ Designing spillways to prevent cavitation damage’’, Concrete
International (May 1991): 58-64
112
Gencel, Osman., Ozel, Cengiz., Filiz, Mumin, and Koksal, Fuat. "The Relations between
Mechanical Strengths and Abrasive Wear of Concrete Incorporating the Hematite
Aggregate." International Journal of Pavement Engineering 13.3 (2012): 235-243.
Grdic, Z. J., Toplicic Curicic, Gordana A., Ristic, N.S. and Despotovic, I. M, "Abrasion Resistance
of Concrete Micro-Reinforced with Polypropylene Fibres." Construction and Building
Materials 27.1 (2012): 305-12.
Horszczaruk, E. K. "Hydro-Abrasive Erosion of High Performance Fibre-Reinforced Concrete."
Wear 267.1–4 (2009): 110-5.
Horszczaruk, Elżbieta. "Abrasion Resistance of High-Strength Concrete in Hydraulic Structures."
Wear 259.1–6 (2005): 62-9.
Kumar, R.G., Shamra, U. K. “Standard test methods for determining of abrasion resistance of
concrete’’. Internation journal of civil engineering research. ISSN 2278-3652 Volume 5,
Number 2 (2014), pp. 155-162
Lane, R.O. "Abrasion Resistance." Significance of Tests and Properties of Concrete and Concrete-
Making Material (1966): 332-50.
Laplante, P., Aitcin, P. and Vézina D. "Abrasion Resistance of Concrete." Journal of Materials in
Civil Engineering 3.1 (1991): 19-28.
Liu, Yu-Wen, Tsong Yen, and Tsao-Hua Hsu. "Abrasion Erosion of Concrete by Water-Borne
Sand." Cement and Concrete Research 36.10 (2006): 1814-20.
Liu, Yu-Wen. "Improving the Abrasion Resistance of Hydraulic-Concrete Containing Surface
Crack by Adding Silica Fume." Construction and Building Materials 21.5 (2007): 972-7.
Liu, Y.W., Cho, S.W., and Hsu, T.H. ‘’Impact Abrasion of Hydraulic Structures Concrete’’
Journal of Marine Science and Technology, Vol. 20, No. 3, (2012) pp. 253-258.

113
Momber, A., and Kovacevic, R. "Fundamental Investigations on Concrete Wear by High Velocity
Water Flow." Wear 177.1 (1994): 55-62.
Mindess, Sidney., Young, J. F., Darwin, David. Concrete (2nd Ed.) Prentice Hall. Pearson
Education, Inc., Upper Saddle River, NJ 07458, USA (2003)
Maya. Autodesk Maya 2015, www.area/autodesk.com/maya2015 (accessed on 27/07/2015),
Naik, T. R., Shiw S. S., and Mohammad M. H. "Abrasion Resistance of Concrete as Influenced by
Inclusion of Fly Ash." Cement and Concrete Research 24.2 (1994): 303-12.
Nawy, E. G. Concrete Construction Engineering Handbook. CRC press, 2008.
Nazari, Ali., and Shadi Riahi. "Abrasion Resistance of Concrete Containing SiO2 and Al2O3
Nanoparticles in Different Curing Media." Energy and Buildings 43.10 (2011): 2939-46.
Sadegzadeh, M., Page, CL., and Kettle, RJ. "Surface Microstructure and Abrasion Resistance of
Concrete." Cement and Concrete Research 17.4 (1987): 581-90.
Sawyer, J. L. "Wear Tests on Concrete using the German Standard Method of Test and Machine".
ASTM Proceedings. 1957.
Shamsai, A., Peroti, S., Rahmani, K., Rahemi, L.,’’ Effect of water-cement ratio on abrasive
strength porosity and permeability of Nano-silica Concrete.’’ World Applied Sciences Journal
17 (8):929-933. (2012).
Siddique, Rafat. "Effect of Fine Aggregate Replacement with Class F Fly Ash on the Abrasion
Resistance of Concrete." Cement and Concrete Research 33.11 (2003): 1877-81.
Wang, Xin., Lua, S., Hu, Ya-an., Yuan, Qiang. , Wang, H.S., Zhao, L.H. "High-Speed Flow
Erosion on a New Roller Compacted Concrete Dam during Construction." Journal of
Hydrodynamics, Ser.B 24.1 (2012): 32-8.

114
Witte, L.P. and Backstrom, J.E., ‘’Some Properties Affecting the Abrasion Resistance of Air-
Entrained Concrete,’’ Proceedings, ASTM International, West Conshohocken, PA. Vol. 51,
1951, P 1141.
Wu, C.H., Liu, Y., Huang, C., Yen, T., Hsu, T.H., ‘’Research on the Abrasion Erosion and Impact
Resistance of Fibre Concrete’’ NCHU Research and Development.
http://research.nchu.edu.tw/eng (accessed on 27/07/2015)
Wu, C.H., Yen, T., Liu, W.Y., and Hsu, T.H., ‘’The Abrasion Erosion Resistance of Concrete
Containing Blast Furnace Slag’’ Taiwan Power Company Report.
Yen, Tsong, Hsu, T-H., Liu, Yu-Wen., Chen, S.H. "Influence of Class F Fly Ash on the abrasion–
erosion Resistance of High-Strength Concrete." Construction and Building Materials 21.2
(2007): 458-63.
Yen, T., Hsu, T.H., Liu, Y., Chen S.H., ‘’Influence of class F fly ash on the abrasion–erosion
resistance of high-strength concrete ‘’. Construction and Building Materials 02/2007; 21(2-
21):458-463.

115
7. Appendix
A. MATLAB script for rotating concrete surface into a horizontal plane
fnameInput = 'Concrete-F3 -v.obj'; fid = fopen(fnameInput); data = textscan(fid, '%s %f %f %f ','HeaderLines',2); fclose(fid); X=data{2}; Y=data{3}; Z=data{4}; XYZ=[X Y Z]; xyz0=mean(XYZ); A=bsxfun(@minus,XYZ,xyz0); %center the data scatter3(A(:,1),A(:,2),A(:,3)); %% Step 2. Find the direction of most variance using SVD and rotate the data to make that the x
axis. (Your data is almost perfectly aligned with the x-axis to begin with). [U,S,V]=svd(A,0); A_rot = A*V; %V(:,1) is the direction of most variance hold on, scatter3(A_rot(:,1),A_rot(:,2),A_rot(:,3)); %% Step 3. Slide the data up the x axis so all the points are x >= 0. A_final = bsxfun(@minus,A_rot,[min(A_rot(:,1)) 0 0]); scatter3(A_final(:,1),A_final(:,2),A_final(:,3));
B. MATLAB script for plotting various graph
% 3D scanner data
load A_final.txt;
x = A_final(:,1); y = A_final(:,2); z = A_final(:,3);
%load xyz_raw.txt;
%x = xyz_raw(:,1); y = xyz_raw(:,2); z = xyz_raw(:,3);
mid_x = (max(x) + min(x))/2;
mid_y = (max(y) + min(y))/2;
x = x - mid_x;
y = y - mid_y;
% Radius of data inclusion

116
r = 40;
mid_x = (max(x) - min(x))/2;
mid_y = (max(y) - min(y))/2;
xr = [-r:1:r];
yr1 = sqrt(r^2 - xr.*xr);
yr2 = -sqrt(r^2 - xr.*xr);
data_pts = size(x,1);
for n = 1: data_pts
dist = sqrt(x(n)^2 + y(n)^2);
if dist >= r
z(n) = NaN;
end
end
figure(1);
plot(x,y,'+',xr,yr1,'-r',xr,yr2,'-r');
title (['Abrasion depth locations +; ' 'Total number of valid data points = ' num2str(data_pts)]);
xlabel('X (mm)');
ylabel('Y (mm)');
x_max = max(x);
x_min = min(x);
y_max = max(y);
y_min = min(y);
xlim([x_min x_max]);
ylim([y_min y_max]);
figure(2);
plot((1:data_pts)',z,[1 data_pts],[0 0], '-r');
xlabel('Data point from one edge to another');
ylabel('Abrasion depth (mm)');
xlim([1 data_pts]);
figure(4)
xlin = linspace(min(x),max(x),300);
ylin = linspace(min(y),max(y),300);
[Xs,Ys] = meshgrid(xlin,ylin);
f = TriScatteredInterp(x,y,z);
Zs = f(Xs,Ys);
mesh(Xs,Ys,Zs) %interpolated
axis tight; hold on
%plot3(Xs,Ys,Zs,'.','MarkerSize',15) %nonuniform
contour(Xs,Ys,Zs)
xlabel('X (mm)');
ylabel('Y (mm)');

117
zlabel('Abrasion depth (mm)');
set(gca,'ZDir','reverse')
%set(gca,'ZDir','reverse')
C. MATLAB script for calculating average depth
% 3D scanner data load A_final.txt; x = A_final(:,1); y = A_final(:,2); z = A_final(:,3); data_pts = size(x,1); x0 = mean(x); y0 = mean(y); figure(1); plot(x,y,'.'); title (['before; ' 'Total number of valid data points = ' num2str(data_pts)]); xlabel('X (mm)'); ylabel('Y (mm)'); % Radius of data inclusion r1 = 40; r2 = 48; sum_z = 0; cnt = 0; for n = 1: data_pts dist = sqrt((x(n) - x0)^2 + (y(n) - y0)^2); if dist >= r1 && dist <= r2; sum_z = sum_z + z(n); cnt = cnt + 1; else x(n) = NaN; y(n) = NaN; end end zave = sum_z / cnt figure(2); plot(x,y,'.'); title (['after; ' 'Total number of valid data points = ' num2str(data_pts)]); xlabel('X (mm)'); ylabel('Y (mm)');

118
D. Sample Calculation of SVD of a concrete sample
A_ raw was the dataset obtained from 3D scanner after scanning Fly ash modified repair material
sample at the age of 7days. After that whole data was centered so that the center of the whole data
set become (0, 0) A matrix contains the data after centering. The columns of A matrix represent
the x, y & z coordinates of vertex points of sample concrete surface, respectively where the number
of rows represent the total number of vertex points.
A_raw=
24.568.103776.17
...
...
...
8411.21516.123.8
7094.21944.1735.7
Amn =
4467.17634.514981.3
...
...
...
9604.07724.50046.6
0921.17296.5054.6
The theorem of SVD (singular value decomposition) analysis can be represent like this,
𝐀𝐦𝐧 = 𝐔𝐦𝐧𝐒𝐦𝐦𝐕𝐧𝐧𝐓
After using SVD function in MATLAB for Amn matrix, the value of U, S and V matrix were
evaluated which are given below.

119
Umn=
8118.91036.8172e0097.0
...
...
...
0.0108-04-1.7217e-0096.
0.0092-05-7.68e096.0
Smm=
8118.9100
003249.50
0003344.5
e
e
VT=
9986.00370.00375.0
0422.01350.09899.0
0316.09902.01364.0
So the equation Amn= Umn Smm VTnn becomes like this,
4467.17634.514981.3
...
...
...
9604.07724.50046.6
0921.17296.5054.6
=
8118.91036.8172e0097.0
...
...
...
0.0108-04-1.7217e-0096.
0.0092-05-7.68e096.0
8118.9100
003249.50
0003344.5
e
e
9986.00370.00375.0
0422.01350.09899.0
0316.09902.01364.0

120
The main objective of the SVD function was to determine Vnn by which Amn matrix was
multiplied to determine the coordinates of rotated concrete surface.
Amn*Vnn =
6283.05787.37743.51
...
...
...
9916.09038.01226.51
8426.04104.01530.51