above-ground arthropod fauna of four swedish cropping systems and its role in carbon and nitrogen...
TRANSCRIPT

Above-Ground Arthropod Fauna of Four Swedish Cropping Systems and Its Role in Carbonand Nitrogen CyclingAuthor(s): J. P. CurrySource: Journal of Applied Ecology, Vol. 23, No. 3 (Dec., 1986), pp. 853-870Published by: British Ecological SocietyStable URL: http://www.jstor.org/stable/2403939 .
Accessed: 01/02/2014 09:32
Your use of the JSTOR archive indicates your acceptance of the Terms & Conditions of Use, available at .http://www.jstor.org/page/info/about/policies/terms.jsp
.JSTOR is a not-for-profit service that helps scholars, researchers, and students discover, use, and build upon a wide range ofcontent in a trusted digital archive. We use information technology and tools to increase productivity and facilitate new formsof scholarship. For more information about JSTOR, please contact [email protected].
.
British Ecological Society is collaborating with JSTOR to digitize, preserve and extend access to Journal ofApplied Ecology.
http://www.jstor.org
This content downloaded from 128.248.155.225 on Sat, 1 Feb 2014 09:32:43 AMAll use subject to JSTOR Terms and Conditions
Journal of Applied Ecology (1986) 23, 853-870
ABOVE-GROUND ARTHROPOD FAUNA OF FOUR SWEDISH CROPPING SYSTEMS AND ITS ROLE IN
CARBON AND NITROGEN CYCLING
By J. P. CURRY
Department ofAgricultural Zoology and Genetics, University College, Belfield, Dublin 4, Ireland
SUMMARY
(1) Above-ground arthropod populations in field plots of barley receiving no nitrogen (barley 0), barley receiving 120 kg N ha-1 y-1 (barley 120), meadow fescue leys and lucerne leys were D-vac sampled monthly between June and September in 1982 and 1983.
(2) One hundred and ninety-six arthropod species or higher taxonomic groups were recorded. Mean population densities ranged from 1098 m-2 in barley 0 to 3683 m-2 in lucerne; corresponding biomass values were 69 mg m-2 to 321 mg m-2 dry mass.
(3) Lowest mean population densities and biomass generally occurred in barley 0 and highest in the leys, particularly in lucerne.
(4) Herbivores contributed from 29% of the total arthropod biomass in lucerne to 52% in barley 120. The range for detritivores/microbivores was 20% in barley 120 to 51% in lucerne, while predators/parasites accounted for between 20% of arthropod biomass in lucerne and 37% in barley 0.
(5) Mean arthropod respiration ranged from 285 mg C m-2 in barley 0 to 1127 mg C m-2 in lucerne for the period 1 June to 30 September.
(6) Herbivores were estimated to consume 502 mg C m-2 in barley 0 and 2948 mg C m-2 in barley 120 on average when consumption was calculated from respiration; the corresponding figures for N consumption were 25 and 147 mg. Herbivore consumption represented 0.3% (barley 0) to 0.7% (barley 120) of the carbon, and 0.3% (grass ley) to 0 9% (barley 120) of the nitrogen fixed in above-ground net primary production.
(7) Estimates of herbivore consumption based on assumed mean daily ingestion rates were somewhat higher, ranging from 0 3% (grass ley) to 1 3% (barley 120) of the carbon and 0 3% to 1 6% of the nitrogen fixed in above-ground net primary production.
INTRODUCTION
A number of studies have assessed the role of invertebrates in ecosystem processes such as energy flow and nutrient cycling in grasslands (Macfadyen 1963; Persson & Lohm 1977; Coulson & Whittaker 1978; Hutchinson & King 1980; T6rmdli 1982), but there is little information on the role of the fauna in these processes in arable land (Ryszkowski 1979).
Concern about increasing mineral fertilizer use, low crop utilization efficiency and risks of environmental pollution led to the establishment of an integrated research project on the ecology of arable land in central Sweden (Rosswall 1982, 1983; Svensson 1984). A major objective was to assess the role of the microflora and fauna in the circulation of carbon and nitrogen in four cropping systems differing in nitrogen input, above and below-ground primary production, and organic matter return to the soil. Data on population density and biomass of above-ground arthropods in the four cropping systems are presented in this paper and estimates of carbon and nitrogen flows through the major trophic groups are made.
853
This content downloaded from 128.248.155.225 on Sat, 1 Feb 2014 09:32:43 AMAll use subject to JSTOR Terms and Conditions

854 Above-ground arthropods offour Swedish crops
STUDY SITE
The site was at Kjettslinge on the Orbyhus Estate in central Sweden. A site description and details of the experimental treatments are given in Steen, Jansson & Persson (1984). The field had been under arable crops including oats, spring wheat, barley, winter rape and clover-timothy leys for a considerable period prior to the establishment of the current experimental plots in 1979. The top soil is a loam overlying sandy loam horizons and a 2-4 m deep clay layer. The climate is cold-temperate semi-humid, with annual precipitation of c. 520 mm and mean annual temperature 5.4 IC. The monthly means range from -5.3 ?C for January to 16*7 ?C for July, and the ground is normally covered with snow for 100 days (10 December-20 March). The experimental plots were 40 x 14 m and were arranged in a 4 x 4 randomized block design, which was retained throughout the study. The four cropping systems were:
(a) spring barley with no addition of nitrogen fertilizer (barley 0); (b) spring barley receiving 120 kg N ha-' y-1 as calcium nitrate (barley 120); (c) meadow fescue (Festuca pratensis L.) ley receiving 120 + 80 kg N ha-1 y-1; (d) lucerne (Medicago sativa L.) ley with no added N.
The leys were established by undersowing to spring barley in 1980, but the grass ley had to be resown in spring 1981. Appropriate NPK fertilizers were applied in mid-May, with a second application of calcium nitrate to the grass ley plots in late June or early July. Barley plots were ploughed and harrowed in October and were sown the following May. Herbicides (MCPA or Certrol Trippel) were applied to the barley crops in July for weed control, and the crops were harvested in September. The leys were cut twice, in mid June and late August.
METHODS OF STUDY
Population and biomass estimation The arthropod fauna of the growing crops was sampled monthly between June and
September in 1982 and 1983, using a 'D-vac' suction sampler (Dietrick 1961). Five randomly chosen areas per plot were sampled initially and pooled in accordance with normal practice to reduce sampling error, giving a composite sample of total area 0*46 M2.
The sample size was increased to 0 92 M2 in August and September 1982, but this resulted in an unacceptably high level of contamination by soil and plant debris and the sample area reverted to 0*46 m2 during 1983. Sampling was restricted to one block on the first sampling date and thereafter two blocks were sampled. The sampling dates were 15 June, 13 July, 12 August and 9 September 1982 and 14 June, 7 July, 15 August and 6 September 1983.
Mean dry mass of the more abundant species was obtained from pooled samples of 10-20 individuals dried to constant weight at 60 OC in a vacuum oven and weighed on a Cahn 25 electrobalance (sensitivity 0 1 pug), while biomass values cited by Luxton (1975), Persson & Lohm (1977) and other sources were used for less abundant species.
Respiration Respiration was computed from biomass according to the expression y- 0357X? 813
where y = ,ul 02 consumed h-1 at 15 ?C and x = average live mass (mg) per individual of each taxonomic group in each treatment on each sampling date (Ryszkowski 1975). Live mass was estimated from dry mass using ratios given by Edwards (1967), Persson & Lohm
This content downloaded from 128.248.155.225 on Sat, 1 Feb 2014 09:32:43 AMAll use subject to JSTOR Terms and Conditions

J. P. CURRY 855
(1977) and Petersen & Luxton (1982) for the various groups. Mean daily abundances were linearly interpolated between sampling dates, while population densities for early June and late September were set at the levels recorded on the sampling dates in those two months. An RQ value of 0-8 was adopted for estimating CO2 release from 02 consumption. Respiration was assumed to be exponentially dependent on temperature according to the following Q10 relationships adapted from Persson & Lohm (1977): Acari 3, Araneae 2, Chilopoda 2, Collembola 2.6, Coleoptera 3.5, Dermaptera 2, Diplura 2.6, Diptera 3, Hemiptera 4, Hymenoptera 3, Lepidoptera 4, Neuroptera 3, Opiliones 2, Psocoptera 2.6, Thysanoptera 4. Mean daily 1.5 m screen temperatures were used in the calculations and corrections were made for diurnal temperature variations according to the method of Agren & Axelsson (1980). The calculations were carried out using the computer pro- gramme BUDCAL (K. Paustian, unpublished).
Carbon and nitrogen utilization Food energy utilization by the above-ground arthropod populations was assessed on
the basis of the relationships C = A + F and A = R + P where C = consumption, A = assimilation, R = respiration, P = tissue production and F = unutilized energy. Since data were only available for respiration, the other parameters had to be derived on the basis of assumed energy conversion efficiencies. Assimilation efficiencies (A/C) for invertebrate herbivores frequently fall within the range 0.3-0.6 while values for detritivores/microbivores commonly range from 0.2 to 0.5 (Heal & MacLean 1975; Reichle 1977; Andrzejewska & Gyllenberg 1980; Petersen & Luxton 1982). Predators may have food assimilation efficiencies ranging from <0.4 to >0*9 (Reichle 1977; Kajak 1980). Corresponding estimates of the proportion of assimilated food energy lost through respiration (R/A) range from 0*4 to 0.8 for herbivores and detritivores/microbivores; predators commonly lose 60-95% while parasitic Hymenoptera may lose <40% of assimilated energy through respiration (Chlodny 1968; Reichle 1977; Kajak 1980). The following relationships were adopted in the present study:
A/C (%) R/A (%)
Herbivores 45 60 Detritivores/microbivores 35 60 Predators/parasites 70 70
The carbon content of plant food material was taken as 42% and that of animal tissue as 50% on a dry mass basis, while nitrogen utilization was derived from carbon values on the basis of the C: N ratios specified in Table 9.
Alternative estimates of herbivore consumption were made based on mean daily ingestion rates. These vary widely with factors such as food quality, temperature, species and developmental stage (Crossley 1966; Waldbauer 1968; Hinton 1971; Prestidge 1982). Aphids feeding on herbaceous plants may ingest 0.5-3 6 ul of phloem sap per individual per day (Auclair 1963; Banks & Macauly 1965; Mittler 1970), while Prestidge (1982) reported daily ingestion rates ranging from 12 to 72% of dry body mass for Auchenorrhyncha feeding on grass phloem, xylem and mesophyll. Andrzejewska (1979) cited studies indicating daily ingestion rates ranging from 14 to 410% of body mass per day for chewing insects. Mean daily ingestion rates of 1 aul phloem sap (= 0*2 mg dry mass) per aphid and 0*25 mg dry plant sap or tissue per mg dry body mass for other herbivores
This content downloaded from 128.248.155.225 on Sat, 1 Feb 2014 09:32:43 AMAll use subject to JSTOR Terms and Conditions

856 Above-ground arthropods offour Swedish crops
were adopted in the present study. The mean monthly population densities recorded were used for calculating monthly consumption except in the case of the aphid Rhopalosiphum padi (L.) which was very abundant in barley 120 and grass ley plots in July 1982. Adjusted average population densities for this species for June and July 1982 were derived from a population growth curve based on more intensive sampling in nearby cereal fields (S. Wiktelius, unpublished).
RESULTS
Trends in abundance and biomass of major groups Mean population densities of the major taxonomic groups and of the more abundant
species are given in Tables 1-3 and mean biomass values for the major groups are given in Table 4. Figures 1 and 2 indicate the changes in abundance and biomass of the more important taxonomic groups throughout the sampling periods. Population densities and biomass of most groups tended to be highest in July and August although this trend was less pronounced in the perennial ley crops where many groups were abundant in June
TABLE 1. Mean population densities (numbers m-2) of the more abundant Collembola, Hemiptera and Thysanoptera in the various cropping systems. Ranges (differences between two replicate plots) are given in parentheses.
+ =< 1 m-2
Barley 0 Barley 120 Grass ley Lucerne 1982 1983 1982 1983 1982 1983 1982 1983
COLLEMBOLA total 352 (13) 292 (145) 426 (5) 230 (109) 673 (497) 986 (15) 1768 (628) 2062 (6) Isotomidae
Isotoma viridis Bourl. 104 (47) 89 (27) 79 (38) 57 (8) 123 (78) 447 (86) 883 (541) 1241 (271) Entomobryidae
Entomobrya nicoleti + 1 (1) + 1 (2) 36 (71) 143 (159) + 2 (1) (Lubb.) Pseudosinella alba 22 (28) 45 (42) 76 (152) 59 (116) 2 (4) 15 (25) 13 (26) 35 (7) (Pack.) Pseudosinella decipiens 11 (21) 10 (0) 9 (8) 2 (1) 0 1 (2) 2 (4) 2 (1) Denis
Sminthuridae Bourletiellahortensis 107 (17) 46 (71) 91 (93) 32 (11) 3 (4) 1 (0) 5 (8) 4 (8) (Fitch) Deuterosminthurinus 16 (17) 3 (3) 69 (89) 13 (20) 102 (138) 67(58) 138 (235) 211 (80) sulphurea (Koch) Sminthurides malmgreni 4 (0) 21 (17) 4 (1) 17 (5) 9 (3) 3 (0) 22 (18) 8 (14) (Tullb.) Sminthurinus spp. 74 (1) 72 (41) 86 (13) 36 (1) 97 (8) 137 (127) 262 (354) 82 (13) Sminthurus nigro- 13 (8) 2 (1) 11 (7) 3 (6) 293 (533) 167 (166) 442 (89) 340 (89) maculatus Tullb.
HEMIPTERA total 114 (11) 77 (20) 2050 (696) 126 (18) 392(60) 141 (94) 244 (3) 92 (17) Aphididae
Acyrthosiphonpisum 0 + 1 (1) 0 + 0 94 (11) 36 (10) (Harris) Sitobion avenae (Fab.) 8 (3) 26 (24) 14 (7) 37 (25) 0 1 (1) 0 + Rhopalosiphumpadi (L.) 51 (14) 17 (9) 1971(688) 46 (1) 292 (74) 15 (2) 1(0) 3 (3)
Delphacidae 7 (4) 8 (3) 11 (8) 20 (30) 28 (7) 8 (3) 1 (2) 1 (1) Cicadellidae 28 (10) 9 (1) 21(5) 6 (8) 46 (26) 111 (82) 15 (3) 21 (6) Miridae
Lygus rugulipennis Popp. 1 (0) 1 (0) 3 (3) 2 (4) 1 (0) + 49 (10) 15 (2) THYSANOPTERA total 108 (5) 339 (3) 302 (64) 562 (85) 104 (17) 353 (56) 84 (16) 167 (26) Thripidae
Frankliniella tenuicornis 46 (6) 211 (57) 142 (91) 315 (151) 45 (13) 268 (46) 38 (4) 117 (34) (Uzel) Limothrips denticornis 23 (7) 98 (61) 78 (2) 213 (77) 3 (1) 12 (5) 1 (2) 6 (6) Hal.
This content downloaded from 128.248.155.225 on Sat, 1 Feb 2014 09:32:43 AMAll use subject to JSTOR Terms and Conditions

J. P. CURRY 857
10 000 - (a) Collembola
1000 4
100
10
1L 10 000
(b) Hemiptera
1000 _
100 - t E
Eo 1 L 0 11 ~ 11 ; itl
_0 0) 1L E 0
(c) Thysanoptera
8~~~~~~~~~~ -Q 0 00 E
15 Jun 13Jl+2Ag et 4Jn uy 1 u et
z
100
10L
1982 1 983
FIG. 1. Mean numbers (open) and biomass (shaded) of (a) Collembola, (b) Hemiptera, (c) Thysanoptera and (d) Diptera on the various sampling dates. 1 = Barley 0, 2 = Barley 120, 3 = Grass ley, 4 = Lucerne. Vertical bars indicate ranges (differences between the two replicate
plots).
This content downloaded from 128.248.155.225 on Sat, 1 Feb 2014 09:32:43 AMAll use subject to JSTOR Terms and Conditions
858 Above-ground arthropods offour Swedish crops
(a) Coleoptera
1000 _
10' ~ i t f
(b) Hymenoptera
1 000
100-
>1L
-o
- 1 000 E | ii ;10 D11!
E
z
10
(d) Acari
1000
; A0 I -4A- an2 1 0
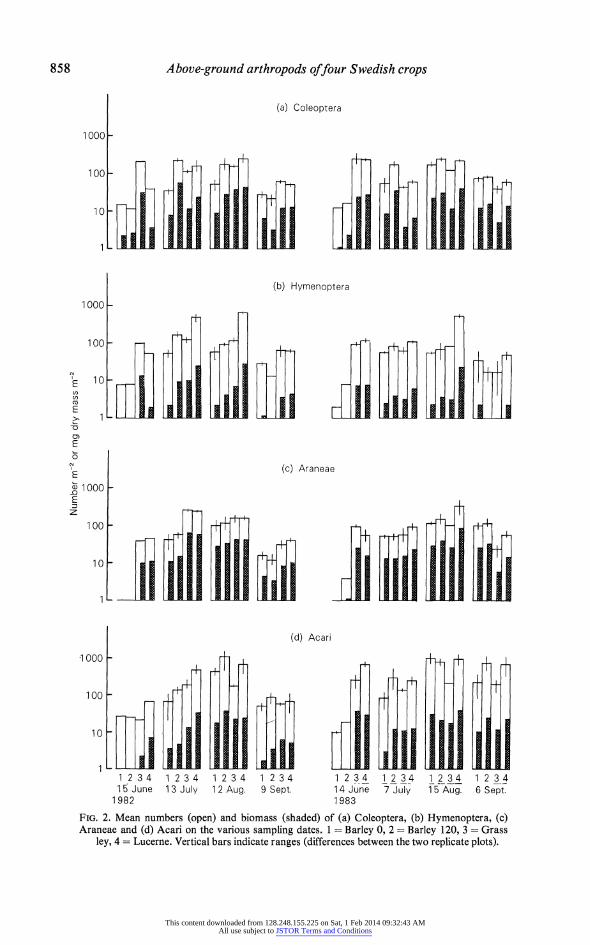
1 2 34 1 2 34 12 34 12 34 1 2 34 1 2 34 12 34 1 23 4 15~ June 1 3 July 1 2 Aug. 9 Sept. 14 June 7 July 1 5 Aug. 6 Sept.
1982 1 983
FIG. 2. Mean numbers (open) and biomass (shaded) of (a) Coleoptera, (b) Hymenoptera, (c) Araneae and (d) Acari on the various sampling dates. 1 = Barley 0, 2 = Barley 120, 3 = Grass
ley, 4 = Lucerne. Vertical bars indicate ranges (differences between the two replicate plots).
This content downloaded from 128.248.155.225 on Sat, 1 Feb 2014 09:32:43 AMAll use subject to JSTOR Terms and Conditions

J. P. CURRY 859
TABLE 2. Mean population densities (numbers m-2) with ranges (differences between the two replicate plots) in parentheses of the more abundant Hymenoptera, Diptera, Coleoptera and other groups in the various cropping systems.
+ = < 1 m-2
Barley 0 Barley 120 Grass ley Lucerne 1982 1983 1982 1983 1982 1983 1982 1983
HYMENOPTERA total 36 (6) 37 (13) 74 (13) 45 (8) 101 (13) 65 (4) 312 (58) 199 (19) Braconidae 5 (1) 7 (0) 14 (1) 10 (5) 23 (0) 11 (2) 46 (6) 43 (7) Chalcidoidea 18 (1) 16 (5) 37 (7) 20 (1) 47 (14) 38 (6) 202(75) 112 (6) Cynipoidea + 4 (1) 2 (0) 1 (3) 3 (1) 2 (2) 10 (7) 8 (1) Ichmeumonidae 0 1 (2) 2 (3) 1 (2) 13 (0) 3 (1) 8 (8) 5 (1) Myrmaridae 8 (8) 5 (1) 10 (6) 10 (2) 4 (0) 5 (1) 15 (7) 21 (12) Proctotrupoidea 5 (3) 2 (0) 8 (3) 2 (1) 8 (3) 3 (0) 24 (17) 6 (8)
DIPTERA total 76 (10) 83 (3) 243 (9) 143 (34) 452 (19) 289(34) 599(67) 430 (81) Anthomyzidae + 0 8 (1) 3 (2) 28 (3) 25 (4) 22 (6) 7 (2) Cecidomyidae 22 (12) 29 (11) 114 (13) 87 (13) 143 (47) 32 (4) 174 (33) 92 (62) Chironomidae 21 (9) 9 (9) 42 (20) 11 (6) 42 (5) 13 (14) 101 (25) 54 (12) Chloropidae 7 (7) 12 (3) 24 (1) 11 (6) 90 (65) 96 (53) 8 (8) 22 (5) Dolichopodidae + 6 (4) 7 (5) 2 (3) 2 (2) 2 (4) 4 (0) 2 (1) Drosophilidae 3 (5) 1 (2) 2 (0) 5 (4) 26 (2) 2 (2) 67 (22) 39 (31) Empididae 2 (1) 4 (0) 14 (22) 5 (7) 5 (5) 2 (4) 15 (7) 10 (4) Ephydridae 1 (0) 1 (0) 4 (2) 2 (3) 8 (3) 1 (0) 42 (49) 23 (16) Lonchopteridae 1 (0) 0 4 (1) 0 14 (1) 2 (2) 4 (3) 3 (3) Phoridae 1 (0) 3 (2) 4 (0) 3 (2) 3 (0) 3 (2) 9 (15) 11 (12) Sphaeroceridae 1 (0) 0 6 (3) 1 (0) 9 (2) 2 (1) 9 (5) 6 (1) Sciaridae 14 (9) 15 (6) 8 (3) 10 (2) 71 (5) 91 (5) 125 (26) 156 (51)
COLEOPTERAtotal 32 (3) 82 (16) 112 (47) 131 (3) 137 (9) 116 (38) 125 (61) 143 (5) Curculionidae 1 (0) 0 1 (0) 1 (0) 1 (0) 0 9 (6) 9 (1) Chrysomelidae 5 (3) 13 (11) 13 (2) 10 (3) 8 (3) 9 (3) 6 (3) 4 (1) Lathridiidae 10 (1) 30 (6) 9 (8) 29 (18) 12 (9) 13 (2) 26 (13) 16 (3) Mycetophagidae 0 3 (2) 9 (1) 5 (0) 1 (1) 3 (0) 4 (5) 7 (1) Carabidae
Bembidion spp. 3 (2) 6 (0) 3 (1) 2 (3) 2 (2) + 2 (1) 3 (2) Staphylinidae
Tachyporus spp. + 2 (2) 9 (5) 5 (1) 10 (0) 2 (1) 1 (0) 3 (1) Amischa + Atheta 7 (0) 15 (2) 55 (23) 56 (15) 72 (5) 62 (33) 58(42) 57 (16)
LEPIDOPTERA + 0 2 (2) 4 (6) 1 (0) 1 (1) 1 (1) 6 (4) NEUROPTERA 1 (1) 1 (0) 2 (2) 4 (5) 4 (0) 0 1 (2) 1 (1) PSOCOPTERA 0 0 3 (5) 11 (1) 1 (1) 0 1 (0) 2 (1) OPILIONES 0 0 0 1 (1) + 0 2 (3) 0 CHILOPODA + 0 + 1 (1) + 0 + 0 DERMAPTERA 0 0 0 0 0 0 2 (2) 0 DIPLURA 2 (3) 17 (33) 0 4 (7) 0 1 (2) + 0
1983. Two-way analysis of variance among crops and sampling dates within years, and among crops between years (Tables 5 and 6), supports the general trend (Tables 1 to 4) of higher mean population densities and biomass in the leys, particularly in lucerne. However, Figs 1 and 2 indicate considerable variability in crop rankings between sampling dates. Notable exceptions to the general trend were Thysanoptera which reached maximum population densities in barley 120 in both years, and Hemiptera which did likewise in July 1982 when a heavy aphid infestation occurred.
Dominant species/species groups One hundred and ninety-six species of other taxonomic groups were recorded during the
study. Sminthurus nigromaculatus and to a lesser extent Isotoma viridis and Deuterosminthurinus sulphurea were the most abundant Collembola in the leys
This content downloaded from 128.248.155.225 on Sat, 1 Feb 2014 09:32:43 AMAll use subject to JSTOR Terms and Conditions
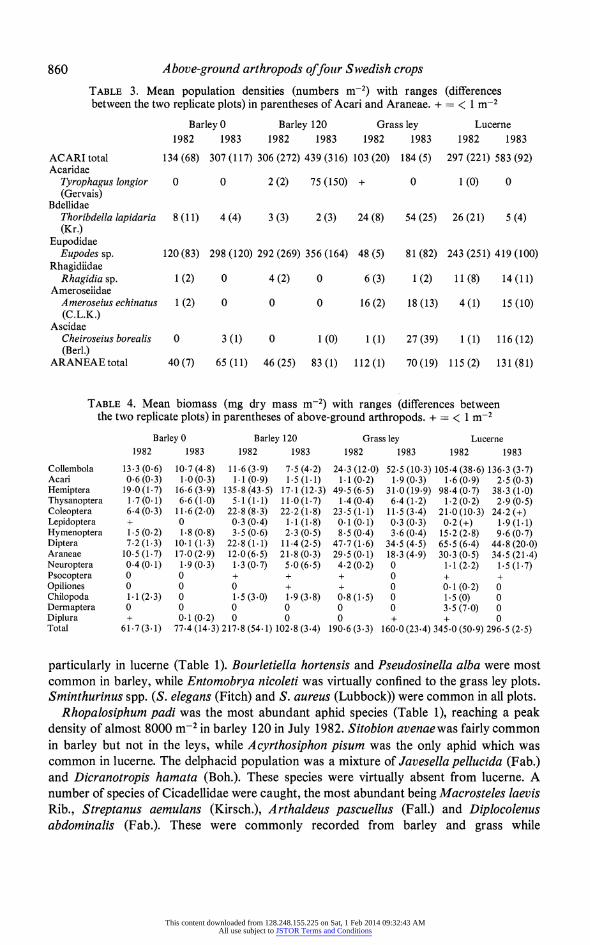
860 Above-ground arthropods offour Swedish crops TABLE 3. Mean population densities (numbers m-2) with ranges (differences between the two replicate plots) in parentheses of Acari and Araneae. + = < 1 m-2
Barley 0 Barley 120 Grass ley Lucerne 1982 1983 1982 1983 1982 1983 1982 1983
ACARI total 134 (68) 307 (117) 306 (272) 439 (316) 103 (20) 184 (5) 297 (221) 583 (92) Acaridae
Tyrophagus longior 0 0 2 (2) 75 (150) + 0 1 (0) 0 (Gervais)
Bdellidae Thoribdella lapidaria 8 (11) 4 (4) 3 (3) 2 (3) 24 (8) 54 (25) 26 (21) 5 (4) (Kr.)
Eupodidae Eupodes sp. 120(83) 298 (120) 292 (269) 356 (164) 48 (5) 81 (82) 243 (251) 419 (100)
Rhagidfidae Rhagidia sp. 1 (2) 0 4 (2) 0 6 (3) 1 (2) 11 (8) 14 (11)
Amerosefidae Ameroseius echinatus 1 (2) 0 0 0 16 (2) 18 (13) 4 (1) 15 (10) (C.L.K.)
Ascidae Cheiroseius borealis 0 3 (1) 0 1 (0) 1 (1) 27(39) 1 (1) 116 (12) (Berl.)
ARANEAEtotal 40(7) 65 (11) 46 (25) 83 (1) 112(1) 70(19) 115 (2) 131 (81)
TABLE 4. Mean biomass (mg dry mass m-2) with ranges (differences between the two replicate plots) in parentheses of above-ground arthropods. + = < 1 m-2
Barley 0 Barley 120 Grass iey Lucerne 1982 1983 1982 1983 1982 1983 1982 1983
Collembola 13 3 (0.6) 10 7 (4.8) 11.6 (3.9) 7.5 (4.2) 24 3 (12.0) 52.5 (10.3) 105 4 (38.6) 136.3 (3.7) Acari 0.6(0.3) 1.0(0.3) 1.1(0.9) 1.5(1.1) 1.1(0.2) 1.9(0.3) 1.6(0.9) 2.5(0.3) Hemiptera 19.0(1.7) 16.6(3.9) 135.8(43.5) 171 (12.3) 49.5(6.5) 31.0(19.9) 98.4(0.7) 38.3 (1.0) Thysanoptera 1.7 (0.1) 6.6 (1.0) 5.1 (1.1) 11.0 (1.7) 1.4 (0.4) 6.4 (1.2) 1.2 (0.2) 2.9 (0.5) Coleoptera 6.4(0.3) 11.6(2.0) 22.8(8.3) 22.2(1.8) 23.5(1.1) 11.5(3.4) 21.0(10.3) 24.2(+) Lepidoptera + 0 0.3 (0.4) 1.1 (1.8) 0. 1 (0. 1) 0.3 (0.3) 0.2 (+) 1 9 (1 1) Hymenoptera 1.5 (0.2) 1.8 (0.8) 3.5 (0.6) 2.3 (0.5) 8.5 (0.4) 3.6 (0.4) 15.2 (2.8) 9.6 (0.7) Diptera 7.2(1.3) 10.1(1.3) 22.8(1.1) 11.4(2.5) 47.7(1.6) 34.5 (4.5) 65.5 (6.4) 44.8(20.0) Araneae 10.5(1.7) 17.0(2.9) 12.0(6.5) 21.8(0.3) 29.5(0.1) 18.3(4.9) 30.3(0.5) 34.5(21.4) Neuroptera 0.4(0.1) 1.9(0.3) 1.3(0.7) 5.0(6.5) 4.2(0.2) 0 1.1(2.2) 1.5(1.7) Psocoptera 0 0 + + + 0 + + Opiliones 0 0 0 + + 0 0.1(0.2) 0 Chilopoda 1.1(2.3) 0 1.5 (3.0) 1.9(3.8) 0.8(1.5) 0 1.5 (0) 0 Dermaptera 0 0 0 0 0 0 3.5 (7.0) 0 Diplura + 0.1(0.2) 0 0 0 + + 0 Total 61.7 (3.1) 77.4 (14.3) 217.8 (54.1) 102.8 (3.4) 190.6 (3.3) 160.0 (23.4) 345.0 (50.9) 296.5 (2.5)
particularly in lucerne (Table 1). Bourletiella hortensis and Pseudosinella alba were most common in barley, while Entomobrya nicoleti was virtually confined to the grass ley plots. Sminthurinus spp. (S. elegans (Fitch) and S. aureus (Lubbock)) were common in all plots.
Rhopalosiphum padi was the most abundant aphid species (Table 1), reaching a peak density of almost 8000 m-2 in barley 120 in July 1982. Sitobion avenae was fairly common in barley but not in the leys, while Acyrthosiphon pisum was the only aphid which was common in lucerne. The delphacid population was a mixture of Javesella pellucida (Fab.) and Dicranotropis hamata (Boh.). These species were virtually absent from lucerne. A number of species of Cicadellidae were caught, the most abundant being Macrosteles laevis Rib., Streptanus aemulans (Kirsch.), Arthaldeus pascuellus (Fall.) and Diplocolenus abdominalis (Fab.). These were commonly recorded from barley and grass while
This content downloaded from 128.248.155.225 on Sat, 1 Feb 2014 09:32:43 AMAll use subject to JSTOR Terms and Conditions
J. P. CURRY 861
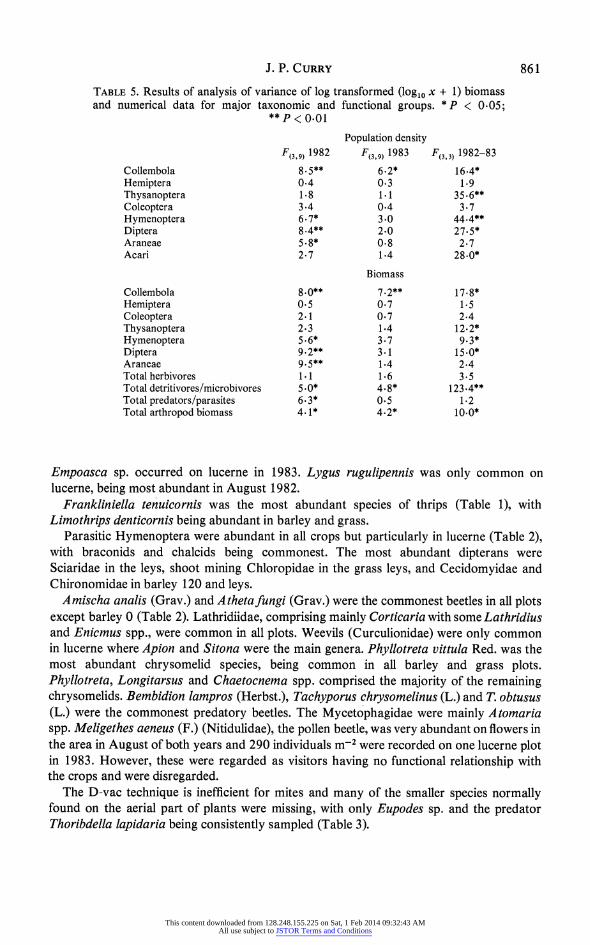
TABLE 5. Results of analysis of variance of log transformed (log1o x + 1) biomass and numerical data for major taxonomic and functional groups. * P < 0.05;
*P < 0.01
Population density F(3,9) 1982 F(3,9) 1983 F(3,3) 1982-83
Collembola 8.5** 6-2* 16-4* Hemiptera 0.4 0.3 1.9 Thysanoptera 1.8 1.1 35.6** Coleoptera 3*4 0.4 3.7 Hymenoptera 6-7* 3.0 44.4** Diptera 8.4** 2.0 27.5* Araneae 5.8* 0-8 2.7 Acari 2.7 1.4 28-0*
Biomass
Collembola 8.0** 7.2** 17.8* Hemiptera 0.5 0.7 1-5 Coleoptera 2.1 0.7 2.4 Thysanoptera 2.3 1.4 12.2* Hymenoptera 5-6* 3.7 9.3* Diptera 9.2** 3-1 15.0* Araneae 9.5** 1.4 2.4 Total herbivores 1.1 1.6 3.5 Total detritivores/microbivores 5-0* 4-8* 123.4** Total predators/parasites 6.3* 0.5 1.2 Total arthropod biomass 4-1* 4-2* 10-0*
Empoasca sp. occurred on lucerne in 1983. Lygus rugulipennis was only common on lucerne, being most abundant in August 1982.
Frankliniella tenuicornis was the most abundant species of thrips (Table 1), with Limothrips denticornis being abundant in barley and grass.
Parasitic Hymenoptera were abundant in all crops but particularly in lucerne (Table 2), with braconids and chalcids being commonest. The most abundant dipterans were Sciaridae in the leys, shoot mining Chloropidae in the grass leys, and Cecidomyidae and Chironomidae in barley 120 and leys.
Amischa analis (Grav.) and A theta fungi (Grav.) were the commonest beetles in all plots except barley 0 (Table 2). Lathridiidae, comprising mainly Corticaria with some Lathridius and Eniemus spp., were common in all plots. Weevils (Curculionidae) were only common in lucerne where Apion and Sitona were the main genera. Phyllotreta vittula Red. was the most abundant chrysomelid species, being common in all barley and grass plots. Phyllotreta, Longitarsus and Chaetocnema spp. comprised the majority of the remaining chrysomelids. Bembidion lampros (Herbst.), Tachyporus chrysomelinus (L.) and T. obtusus (L.) were the commonest predatory beetles. The Mycetophagidae were mainly A tomaria spp. Meligethes aeneus (F.) (Nitidulidae), the pollen beetle, was very abundant on flowers in the area in August of both years and 290 individuals m-2 were recorded on one lucerne plot in 1983. However, these were regarded as visitors having no functional relationship with the crops and were disregarded.
The D-vac technique is inefficient for mites and many of the smaller species normally found on the aerial part of plants were missing, with only Eupodes sp. and the predator Thoribdella lapidaria being consistently sampled (Table 3).
This content downloaded from 128.248.155.225 on Sat, 1 Feb 2014 09:32:43 AMAll use subject to JSTOR Terms and Conditions

862 Above-ground arthropods offour Swedish crops
TABLE 6. Comparisons of means based on Duncan Multiple range test. Means are ranked in ascending order and those underscored by the same line do not differ
significantly at the 95% level
Population density 1982 1983 1982/83
Collembola B120 BO GL Luc B120 BO GL Luc B120 BO GL Luc
Thysanoptera Luc BO GL B 120
Hymenoptera BO B 120 GL Luc BO B 120 GL Luc
Diptera BO B 120 GL Luc BO B 120 GL Luc
Araneae BO B 120 GL Luc
Acari GL BO B 120 Luc
Biomass
Collembola B 120 BO GL Luc B 120 BO GL Luc B 120 BO GL Luc
Thysanoptera Luc GL BO B 120
Hymenoptera BO B 120 GL Luc BO B 120 GL Luc
Diptera BO B 120 GL Luc BO B 120 GL Luc
Araneae BO B 120 GL Luc
Total detritivores/microbivores B 120 BO GL Luc BO B 120 GL Luc BO B 120 GL Luc
Total predators/parasites BO B 120 Luc GL
Total arthropod biomass BO B 120 GL Luc BO B 120 GL Luc BO B 120 GL Luc
Dominance, species richness and similarity Cumulative percentage abundances of all species recorded are plotted against log10
species rank (k) for the various cropping systems in Fig. 3. The resulting k-dominance curves provide a useful means of comparing the arthropod communities of the four crops and, because all species recorded are taken into account, they avoid the difficulties of interpretation associated with single diversity indices (Lambshead, Platt & Shaw 1983). The results indicate similar patterns of dominance structure in all the crops with relatively few abundant species and large numbers of scarce species. Thus, in all cases the twenty most abundant species accounted for 88 to 95% of individuals sampled. Barley 120 was strikingly different from the other crops in 1982, reflecting the high population densities of R. padi occurring in that year. Interpretation according to the criteria suggested by Lambshead, Platt & Shaw (1983) indicates that barley 120 had the least diverse fauna in 1982, lucerne had a somewhat less diverse fauna in 1982 than had barley 0 and the grass ley, while in 1983 lucerne was less diverse than other crops.
Barley 0 had the poorest fauna in terms of numbers of species recorded (78 in 1982, 77 in 1983) while barley 120 and the leys were fairly comparable (103-107 in 1982, 91-114 in 1983). The marked increase in species richness with increasing maturity that has been recorded in other leys did not occur (Purvis & Curry 1980).
This content downloaded from 128.248.155.225 on Sat, 1 Feb 2014 09:32:43 AMAll use subject to JSTOR Terms and Conditions

J. P. CURRY 863
100
9 80 50
c70 -
a, 60 G > 0*~ ~ ~~~~~0 50
/0
o O ? ? < m < m ',im 'S U < m < m a, 40 -/ IV 0) / 6
~-20 7 1 0
Li I I hIl I I 1 I1 1111 ,Li I I 1 I1 Jill I I I 1 Lfil1
1 2 3 4 5 67 9 20 30 40 60 80100 1 2 3 4 5 67 9 20 30 40 60 80100 8 10 50 7090 8 10 50 7-090
Species rank(k
FIG. 3. k-dominance curves for fauna of the four crops in (a) 1982 and (b) 1983 obtained by plotting species rank (logGr scale) against % cumulative abundance. Only the twenty most abundant species in each crop are indicated separately. 0 = Barley 0, 5 = Barley 120,
* = Grass ley, A =Lucerne.
CN CN co co ~ ~ ~ C C C C co co co co coM CN CN CN CN c CO CO CN CN
CN CN CN CN
1 00 ~ ~ ~ ~ ~ ~ ~ ~ ~ 0 0 C
90
80
P~ 70 C/)
60
50
40
FIG. 4. Percentage similarity between plots based on the Whittaker index. B= Barley, GL = Grass ley, Luc = Lucerne; A and B are replicate plots.
This content downloaded from 128.248.155.225 on Sat, 1 Feb 2014 09:32:43 AMAll use subject to JSTOR Terms and Conditions
864 Above-ground arthropods offour Swedish crops
The relative abundances of the forty-eight most common taxa (Tables 1-3) which accounted for 85-95% of all individuals caught were used in calculating indices of similarity between plots according to the method of Whittaker (1972) and the resulting similarity matrix was reduced to the dendrogram presented in Fig. 4. As expected, the crop replicate plots show higher similarity to one another than to other plots. Between-year variation was least in the case of lucerne and greatest in the case of barley 120, again reflecting the distorting influence of high 1982 aphid numbers.
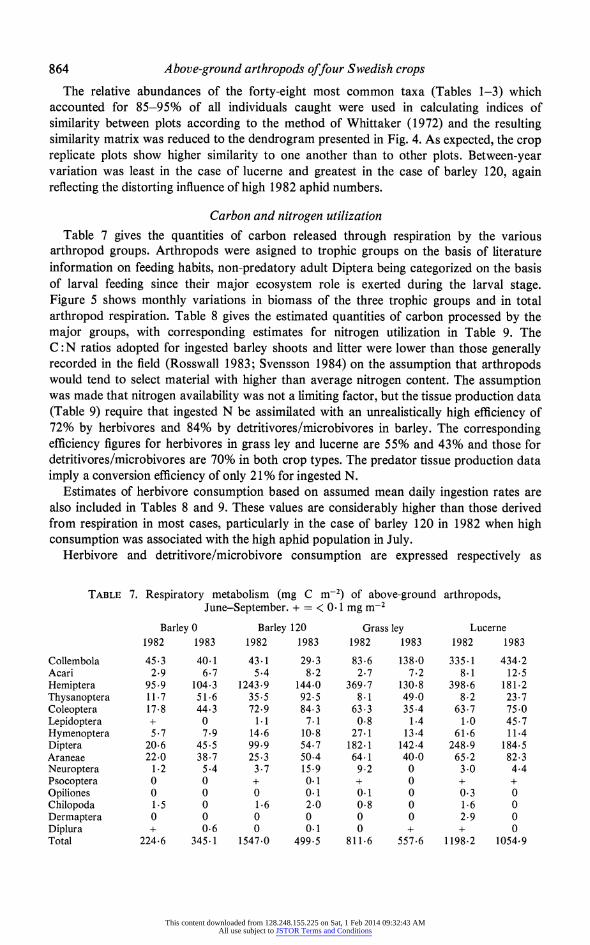
Carbon and nitrogen utilization Table 7 gives the quantities of carbon released through respiration by the various
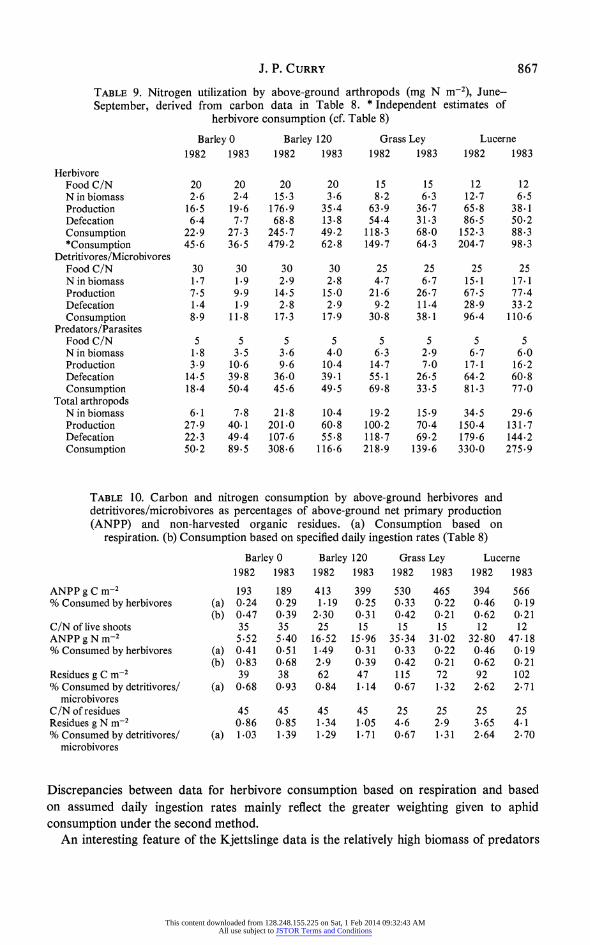
arthropod groups. Arthropods were asigned to trophic groups on the basis of literature information on feeding habits, non-predatory adult Diptera being categorized on the basis of larval feeding since their major ecosystem role is exerted during the larval stage. Figure 5 shows monthly variations in biomass of the three trophic groups and in total arthropod respiration. Table 8 gives the estimated quantities of carbon processed by the major groups, with corresponding estimates for nitrogen utilization in Table 9. The C: N ratios adopted for ingested barley shoots and litter were lower than those generally recorded in the field (Rosswall 1983; Svensson 1984) on the assumption that arthropods would tend to select material with higher than average nitrogen content. The assumption was made that nitrogen availability was not a limiting factor, but the tissue production data (Table 9) require that ingested N be assimilated with an unrealistically high efficiency of 72% by herbivores and 84% by detritivores/microbivores in barley. The corresponding efficiency figures for herbivores in grass ley and lucerne are 55% and 43% and those for detritivores/microbivores are 70% in both crop types. The predator tissue production data imply a conversion efficiency of only 21 % for ingested N.
Estimates of herbivore consumption based on assumed mean daily ingestion rates are also included in Tables 8 and 9. These values are considerably higher than those derived from respiration in most cases, particularly in the case of barley 120 in 1982 when high consumption was associated with the high aphid population in July.
Herbivore and detritivore/microbivore consumption are expressed respectively as
TABLE 7. Respiratory metabolism (mg C m-2) of above-ground arthropods, June-September. + = < 0. 1 mg m-2
Barley 0 Barley 120 Grass ley Lucerne 1982 1983 1982 1983 1982 1983 1982 1983
Collembola 45.3 40.1 43.1 29-3 83.6 138-0 335-1 434.2 Acari 2-9 6.7 5-4 8.2 2-7 7.2 8-1 12.5 Hemiptera 95.9 104.3 1243.9 144-0 369.7 130-8 398.6 181-2 Thysanoptera 11.7 51-6 35.5 92.5 8-1 49.0 8-2 23-7 Coleoptera 17-8 44.3 72.9 84-3 63.3 35-4 63.7 75-0 Lepidoptera + 0 1.1 7.1 0.8 1.4 1.0 45-7 Hymenoptera 5.7 7.9 14-6 10-8 27.1 13-4 61.6 11.4 Diptera 20-6 45-5 99-9 54-7 182.1 142.4 248.9 184-5 Araneae 22-0 38-7 25.3 50-4 64.1 40-0 65-2 82-3 Neuroptera 1-2 5-4 3-7 15.9 9.2 0 3-0 4.4 Psocoptera 0 0 + 0.1 + 0 + + Opiliones 0 0 0 0.1 0.1 0 0.3 0 Chilopoda 1-5 0 1.6 2-0 0.8 0 1.6 0 Dermaptera 0 0 0 0 0 0 2-9 0 Diplura + 0.6 0 0-1 0 + + 0 Total 224.6 345-1 1547-0 499.5 811-6 557-6 1198-2 1054.9
This content downloaded from 128.248.155.225 on Sat, 1 Feb 2014 09:32:43 AMAll use subject to JSTOR Terms and Conditions

J. P. CURRY 865
1085k 700 - :.j Predators/
parasites Detritivores/
600 - microbivores
(bsdo aai osal(93 adSeso 18) Tbe1) Herbivores
0) E
500- 0
F- 400 - 0)~~~~~~~ 0
0)
E200 -
1 00 - ~ ~ ~ ~ ~ ~ ~ ~ ~ ~ ~
1c2u3p 4 12 3 34 1 2 3 4 1234 123 4 1234 12 n34 12 1c5tJune 13 3July 1 2 aAug. 9Sept correspon ing rner.-
1982 ~~~~~~~~~~~1 983
FIG. 5. Biomass of major trophic groups and total monthly respiration (0). I = Barley 0, 2 = Barley 120, 3 = Grass ley, 4 = Lucerne.
percentages of carbon and nitrogen fixed in above-ground net primary production (ANPP) and remaining in the field as stubble and post-harvest residues during 1982 and 1983 (based on data in Rosswall (1983) and Svensson (1984)) (Table 10). Herbivore consumption constituted 0. 19-1b19% of C and 0. 19-1S49% of N in ANPP when consumption was estimated from respiration; the corresponding ranges were 0.21-2.3% for C and 0.21-2.9% for N based on specific daily ingestion rates. In all cases the percentage consumption was highest in barley 120 during 1982. Detritivore/microbivore percentage consumption of C and N was highest for lucerne residues in both years.
DISCUSSION
Arthropod population densities at Kjettslinge are broadly similar to those recorded by Curry & O'Neill (1979) and Purvis & Curry (1980) from grass and clover leys in Ireland, by Vickerman (1978) from barley and grass fields in West Sussex, England and by Persson & Lohm (1970) from old grassland at Spikbole, Sweden. Person & Lohm's (1977) mean summer biomass estimate of 277 mg dry mass based on hand sorting and Tullgren funnel extraction lies within the range encountered at Kjettslinge. Mean summer herbivore biomass at Spikbole was somewhat higher (230 mg dry mass m-2) than that at Kjettslinge, mainly because of greater coleopteran biomass. Herbivore biomass at Kjettslinge was of a similar order to that reported from steppe grasslands in the USSR and Polish meadows (Andrzejewska & Gyllenberg 1980).
This content downloaded from 128.248.155.225 on Sat, 1 Feb 2014 09:32:43 AMAll use subject to JSTOR Terms and Conditions

866 Above-ground arthropods offour Swedish crops TABLE 8. Carbon utilization by above-ground arthropods (mg C m-2), June- September, based on calculated respiration. Values for carbon in 'standing crop' arthropod biomass are June-September averages. * Independent estimates of herbivore consumption based on daily ingestion rates of 0.2 mg dry mass
aphid-1 and 0.25 mg mg-1 body mass for others Barley 0 Barley 120 Grass Ley Lucerne
1982 1983 1982 1983 1982 1983 1982 1983
Herbivores Cinbiomass 13.1 11-9 76.6 17.7 40.8 31.7 63.4 32.7 Respiration 123.6 147-3 1326.4 265-4 478.9 275.3 493.3 286.0 Production 82.4 98.2 884.3 176-9 319.3 183-5 328-9 190.7 Defecation 251.8 299.9 2702-0 540-6 975.7 560.8 1004-9 582.6 Consumption 457.8 545-4 4912-7 982.9 1773-9 1019-6 1827-1 1059.3 *Consumption 912-3 729-6 9584-6 1256-3 2244.7 963.8 2456.7 1179-6
Detritivores/Microbivores C in biomass 8.6 9.3 14-3 13.9 23.2 33.5 75-7 85-6 Respiration 55.9 74.4 109-1 112.9 161.7 200.2 505.9 580.3 Production 37.3 49.6 72.7 75.2 107.8 133.4 337.3 286-8 Defecation 173.1 230.3 337.6 349.3 500.5 619.4 1565.9 1795-9 Consumption 266.3 354.3 519-4 537-4 770-0 953.0 2409.1 2763.0
Predators/Parasites C in biomass 9.1 17-5 18-0 19-7 31.3 14.7 33.5 30.0 Respiration 45.1 123-4 111.5 121.2 171.0 82.1 199-0 188-6 Production 19-3 52-9 47.8 51.9 73.3 35.2 85.3 80.8 Defecation 27.6 75-5 68.3 74.2 104-7 50.3 121-8 115.5 Consumption 92.0 251-8 227-6 247-3 349.0 167.6 406.1 384.9
Total arthropods C in biomass 30-8 38.7 108.9 51.4 95.3 79.8 172.5 145-2 Respiration 224.6 345-1 1547-0 499-5 811.6 557.6 1198.2 1054.9 Production 139.0 200.7 1004-8 304.0 500-4 352-1 751-5 658.3 Defecation 452.5 605.7 3107.9 964.1 1580-9 1230-5 2692.6 2494.0 Consumption 816-1 1151.5 5659.7 1767.6 2892-9 2140.2 4642-3 4207-2
The lower arthropod biomass in the barley 0 plots is similar to Andrzejewska & Gyllenberg's (1980) relationship between net primary production and invertebrate biomass. In addition to increasing the vegetation mass, mineral fertilizers increase nutrient content and the quality of the vegetation as food for herbivores (Andrzejewska 1976; Prestidge 1982).
While the arthropod faunas do exhibit differences in qualitative and quantitative composition which reflect botanical and cultural differences, the k-dominance curves indicate a high degree of similarity between the crops in terms of their overall community structure. All crops exhibit features which are associated with disturbed, successional communities (few dominant species, large number of scarce species) and which have previously been noted for managed grass swards (Curry & Tuohy 1978).
The seasonal mean respiration values recorded at Kjettslinge for total arthropods in the leys were higher than reported for Spikbole (Persson & Lohm 1977), but herbivore respiration was somewhat higher at Spikbole. Above-ground herbivore consumption at Spikbole constituted 0.8% of ANPP, rather higher than values similarly derived from respiration for the Kjettslinge leys.
Food consumption values derived from respiration represent overall mean daily ingestion rates of 0.2-0.4 mg per mg arthropod dry mass. These figures are higher than those characteristic of soil and litter-dwelling invertebrates (Reichle 1968; Petersen & Luxton 1982), reflecting the higher metabolic rates attributed to the above-ground fauna.
This content downloaded from 128.248.155.225 on Sat, 1 Feb 2014 09:32:43 AMAll use subject to JSTOR Terms and Conditions
J. P. CURRY 867
TABLE 9. Nitrogen utilization by above-ground arthropods (mg N m-2), June- September, derived from carbon data in Table 8. * Independent estimates of
herbivore consumption (cf. Table 8)
Barley 0 Barley 120 Grass Ley Lucerne 1982 1983 1982 1983 1982 1983 1982 1983
Herbivore Food C/N 20 20 20 20 15 15 12 12 N in biomass 2.6 2.4 15-3 3.6 8.2 6.3 12.7 6.5 Production 16-5 19.6 176.9 35.4 63.9 36.7 65.8 38-1 Defecation 6.4 7.7 68.8 13.8 54-4 31.3 86.5 50.2 Consumption 22.9 27.3 245.7 49.2 118.3 68.0 152.3 88.3 *Consumption 45.6 36.5 479.2 62.8 149.7 64.3 204.7 98.3
Detritivores/Microbivores Food C/N 30 30 30 30 25 25 25 25 N in biomass 1.7 1.9 2.9 2.8 4.7 6.7 15.1 17.1 Production 7.5 9.9 14.5 15.0 21.6 26.7 67.5 77.4 Defecation 1.4 1.9 2.8 2.9 9.2 11.4 28.9 33.2 Consumption 8-9 11.8 17.3 17.9 30.8 38-1 96.4 110.6
Predators/Parasites Food C/N 5 5 5 5 5 5 5 5 N in biomass 1.8 3.5 3.6 4.0 6.3 2.9 6.7 6.0 Production 3-9 10-6 9.6 10.4 14.7 7.0 17.1 16.2 Defecation 14.5 39.8 36.0 39.1 55.1 26.5 64.2 60.8 Consumption 18-4 50.4 45.6 49.5 69.8 33.5 81.3 77.0
Total arthropods N in biomass 6.1 7.8 21.8 10.4 19.2 15.9 34.5 29.6 Production 27.9 40.1 201.0 60.8 100.2 70-4 150-4 131.7 Defecation 22.3 49.4 107.6 55.8 118.7 69-2 179-6 144.2 Consumption 50.2 89.5 308.6 116.6 218.9 139.6 330.0 275.9
TABLE 10. Carbon and nitrogen consumption by above-ground herbivores and detritivores/microbivores as percentages of above-ground net primary production (ANPP) and non-harvested organic residues. (a) Consumption based on
respiration. (b) Consumption based on specified daily ingestion rates (Table 8)
Barley 0 Barley 120 Grass Ley Lucerne 1982 1983 1982 1983 1982 1983 1982 1983
ANPP g C m-2 193 189 413 399 530 465 394 566 % Consumed by herbivores (a) 0.24 0.29 1.19 0-25 0.33 0-22 0.46 0.19
(b) 0.47 0.39 2.30 0-31 0.42 0-21 0.62 0.21 C/N of live shoots 35 35 25 15 15 15 12 12 ANPP g N m-2 5.52 5.40 16-52 15-96 35-34 31-02 32-80 47-18 % Consumed by herbivores (a) 0.41 0.51 1.49 0.31 0.33 0.22 0.46 0.19
(b) 0.83 0.68 2.9 0.39 0.42 0-21 0-62 0-21 Residues g C m-2 39 38 62 47 115 72 92 102 % Consumed by detritivores/ (a) 0.68 0.93 0.84 1.14 0.67 1.32 2.62 2.71
microbivores C/N of residues 45 45 45 45 25 25 25 25 Residues g N m-2 0.86 0.85 1.34 1-05 4.6 2.9 3.65 4.1 % Consumed by detritivores/ (a) 1.03 1-39 1.29 1.71 0.67 1.31 2.64 2-70
microbivores
Discrepancies between data for herbivore consumption based on respiration and based on assumed daily ingestion rates mainly reflect the greater weighting given to aphid consumption under the second method.
An interesting feature of the Kjettslinge data is the relatively high biomass of predators
This content downloaded from 128.248.155.225 on Sat, 1 Feb 2014 09:32:43 AMAll use subject to JSTOR Terms and Conditions

868 Above-ground arthropods offour Swedish crops
and parasites, consisting mainly of spiders, predatory beetles and parasitic Hymenoptera. Biomass in the leys particularly was comparable with that of undisturbed natural grasslands (Kajak 1980), indicating that the effects of arable cultivation and management on these groups are not as drastic as is sometimes suggested. Estimated predator/parasite consumption formed a high proportion of, and sometimes exceeded, estimated production by lower trophic groups (Table 8). While other prey including some soil invertebrates and surface forms not efficiently sampled by the D-vac technique would also be available, nevertheless it is likely that predators and parasites exerted significant natural control of above-ground invertebrate populations. Data cited by Kajak (1980) indicate that predators in undisturbed grasslands characterized by a high degree of population regulation consume on average c. 40% of the production of lower trophic levels.
The role of the above-ground fauna was probably overestimated to some degree since Diptera, which accounted for between 16 and 56% of detritivore/microbivore con- sumption, feed mainly on organic residues in the soil. Also, many of the flies sampled may have been merely 'visitors' resting in the crops. However, flies form a major component of the diet of predators such as spiders (Kajak 1980) and therefore warrant inclusion in the above-ground fauna. It is also likely that several taxa were underestimated, notably shoot-mining Diptera, species which are able to cling to the vegetation, and large caterpillars and beetles which are not efficiently sampled by suction. Despite these likely sources of error and the assumptions involved in the various calculations it seems valid to conclude that the contribution of the above-ground arthropods to carbon and nitrogen cycling at Kjettslinge is small when assessed purely in terms of the quantities processed. A more complete evaluation of the role of the fauna as a whole must await the results of parallel studies on soil invertebrates.
There is evidence to indicate that invertebrate decomposers have a much greater influence on decomposition and mineralization processes than their metabolic activity would suggest (Persson et al. 1980; Anderson, Coleman & Cole 1981; Coleman, Reid & Cole 1983). Likewise the effects of herbivory on primary production are not readily predictable from the amounts of matter consumed but are influenced by factors such as the physiological state of the plant, the nature of the tissue fed on, water loss associated with sap feeding, disease transmission, etc. (Andrzejewska 1967; Dyer & Bokhari 1976; Vickerman & Wratten 1979; Crawley 1983). Despite the absence of data on these factors the present study offers no reasons to disagree with the general assumption that herbivore populations have little impact on crop yields except under conditions of pest outbreak.
ACKNOWLEDGMENTS
This work is a contribution to the Ecology of Arable Land project at the Swedish University of Agricultural Sciences, Uppsala, Sweden. I am grateful to Professor Eliel Steen and to the sponsors (the Swedish Council for Planning and Coordination of Research, the Swedish Council for Agricultural and Forestry Research, the Swedish Natural Science Research Council and the Swedish National Environment Protection Board) of this project for the opportunity to work in Uppsala during summer 1982, to Jan Lagerl6f for collecting and posting samples to me during 1983 and to Keith Paustian for help with computing faunal respiration. Manochehr Azrang of the Department of Plant and Forest Protection, Swedish University of Agricultural Sciences, kindly identified the Auchenorrhyncha.
This content downloaded from 128.248.155.225 on Sat, 1 Feb 2014 09:32:43 AMAll use subject to JSTOR Terms and Conditions

J. P. CURRY 869
REFERENCES
Agren, G. I. & Axelsson, B. (1980). Population respiration: a theoretical approach. Ecological Modelling, 11, 39-54.
Anderson, R. V., Coleman, D. C. & Cole, C. V. (1981). Effects of saprophytic grazing on net mineralization. Terrestrial Nitrogen Cycles (Ed. by F. E. Clark & T. Rosswall). Ecological Bulletins (Stockholm), 33, 201-216.
Andrzejewska, L. (1967). Estimation of the effects of feeding of the sucking insect Cicadella viridis L. (Homoptera: Auchenorrhyncha) on plants. Secondary Productivity of Terrestrial Ecosystems, Vol. 2 (Ed. by K. Petrusewicz), pp. 791-805. Polish Academy of Sciences, Warsaw.
Andrzejewska, L. (1976). The influence of mineral fertilization on the meadow phytophagous fauna. Polish Ecological Studies, 2,93-109.
Andrzejewska, L. (1979). Herbivorous fauna and its role in the economy of grassland ecosystems. II. The role of herbivores in trophic relationships. Polish Ecological Studies, 5, 45-76.
Andrzejewska, L. & Gyllenberg, G. (1980). Small herbivore subsystem. Grasslands, Systems Analysis and Man (Ed. by A. J. Breymeyer & G. M. Van Dyne). International Biological Programme 19, pp. 201-267. Cambridge University Press, Cambridge.
Auclair, J. C. (1963). Aphid feeding and nutrition. Annual Review of Entomology, 8, 439-480. Banks, C. J. & Macauly, E. D. M. (1965). The ingestion of nitrogen and solid matter from Viciafaba by Aphis
fabae Scop. Annals of Applied Biology, 55, 207-218. Chlodny, J. (1968). Evaluation of some parameters of the individual's energy budget of the larvae of
Pteromalus puparum (L.) (Pteromalidae) and Pimpla instigator (Fabr.) (Ichneumonidae). Ekologia Polska, Series A, 16,505-14.
Coleman, D. C., Reid, C. P. P. & Cole, C. V. (1983). Biological strategies of nutrient cycling in soil systems. Advances in Ecological Research, 13, 1-55.
Coulson, J. C. & Whittaker, J. B. (1978). Ecology of moorland animals. The Ecology of some British Moors and Montane Grasslands (Ed. by 0. W. Heal & D. F. Perkins), pp. 52-93. Springer, Berlin.
Crawley, M. J. (1983). Herbivory. The Dynamics of Animal-Plant Interactions. Studies in Ecology Vol. 10. Blackwell Scientific Publications, Oxford.
Crossley, D. A. Jr (1966). Radioisotope measurements of food consumption by a leaf beetle species, Chrysomela knabi Brown. Ecology, 47, 1-8.
Curry, J. P. & O'Neill, N. (1979). A comparative study of the arthropod communities of various swards using the D-vac suction sampling technique. Proceedings of the Royal Irish Academy, 79(B), 247-258.
Curry, J. P. & Tuohy, C. F. (1978). Studies on the epigeal microarthropod fauna of grassland swards managed for silage production. Journal of Applied Ecology, 15, 727-74 1.
Dietrick, E. J. (1961). An improved back pack motor fan for suction sampling of insect populations. Journal of Economic Entomology, 54,394-395.
Dyer, M. I. & Bokhari, U. G. (1976). Plant-animal interactions: studies of the effects of grasshopper grazing on blue gamma grass. Ecology, 57, 762-772.
Edwards, C. A. (1967). Relationships between weights, volumes and numbers of soil animals. Progress in Soil Biology (Ed. by 0. Graff & J. E. Satchell), pp. 585-594. North-Holland Publishing Co., Amsterdam.
Heal, 0. W. & MacLean, S. F. (1975). Comparative productivity in ecosystems: Secondary productivity. Unifying Concepts in Ecology (Ed. by W. H. Van Dobben & R. H. Lowe-McConnell), pp. 89-109. W. Junk, The Hague.
Hinton, J. M. (1971). Energy flow in a natural population of Neophilaenus lineatus (Homoptera). Oikos 22, 155-171.
Hutchinson, K. J. & King, K. L. (1980). The effects of sheep stocking level on invertebrate abundance, biomass and energy utilization in a temperate, sown grassland. Journal of Applied Ecology, 17, 369-387.
Kajak, A. (1980). Invertebrate predator subsystem. Grasslands, Systems Analysis and Man (Ed. by A. J. Breymeyer & G. M. Van Dyne). International Biological Programme 19, pp. 539-589. Cambridge University Press, Cambridge.
Lambshead, P. J. D., Platt, H. M. & Shaw, K. M. (1983). The detection of differences among assemblages of marine benthic species based on an assessment of dominance and diversity. Journal of Natural History, 17, 859-874.
Luxton, M. (1975). Studies on the oribatid mites of a Danish beech wood soil. II. Biomass, calorimetry and respirometry. Pedobiologia, 15,161-200.
Maefadyen, A. (1963). The contribution of the microfauna to total soil metabolism. Soil Organisms (Ed. by J. Doeksen & J. Van der Drift), pp. 3-17, North-Holland Publishing Co., Amsterdam.
Mittler, T. E. (1970). Uptake rates of plant sap and synthetic diet by the aphid Myzus persicae. Annals of the Entomological Society ofA merica, 63, 1701-1705.
Persson, T. & Lohm, U. (1977). Energetical significance of the annelids and arthropods in a Swedish grassland soil. Ecological Bulletins (Stockholm), 23, 1-211.
This content downloaded from 128.248.155.225 on Sat, 1 Feb 2014 09:32:43 AMAll use subject to JSTOR Terms and Conditions
870 Above-ground arthropods offour Swedish crops Persson, T., Biath, E., Clarholm, M., Lundkvist, H. & Sdderstrdm, B. E. (1980). Trophic structure, biomass
dynamics and carbon metabolism of soil organisms in a Scots pine forest. Structure and Function of Northern Coniferous Forests: An Ecosystem Study (Ed. by T. Persson). Ecological Bulletins (Stockholm), 32,419-459.
Petersen, H. & Luxton, M. (1982). A comparative analysis of soil fauna populations and their role in decomposition processes. Oikos, 39,287-388.
Prestidge, R. A. (1982). Instar duration, adult consumption, oviposition and nitrogen utilization efficiencies of leaf hoppers feeding on different quality food (Auchenorrhyncha: Homoptera). Ecological Entomology, 7, 91-101.
Purvis, G. & Curry, J. P. (1980). Successional changes in the arthropod fauna of a new ley pasture established on previously cultivated arable land. Journal of Applied Ecology, 17, 309-321.
Reichle, D. E. (1968). Relation of body size to food intake, oxygen consumption and trace element metabolism in forest floor arthropods. Ecology, 49,538-542.
Reichle, D. E. (1977). The role of soil invertebrates in nutrient cycling. Soil Organisms as Components of Ecosystems (Ed. by U. Lohm & T. Persson). Ecological Bulletins (Stockholm), 25, 145-156.
Rosswall, T. (Ed.) (1982). Ecology of Arable Land. The Role of Organisms in Nitrogen Cycling. Progress Report 1981. Swedish University of Agricultural Sciences, Uppsala.
Rosswall, T. (Ed.) (1983). Ecology of Arable Land. The Role of Organisms in Nitrogen Cycling. Progress Report 1982. Swedish University of Agricultural Sciences, Uppsala.
Ryszkowski, L. (1975). Energy and matter economy of ecosystems. Unifying Concepts in Ecology (Ed. by W. H. Van Dobben & R. H. Lowe-McConnell), pp. 109-126. Junk, The Hague.
Ryszkowski, L. (1979). Croplands. Consumers. Grassland Ecosystems of the World (Ed. by R. T. Coupland). International Biological Programme 18, pp. 309-318. Cambridge University Press, Cambridge.
Steen, E., Jansson, P.-E. & Persson, J. (1984). Experimental site of the ecology of arable land project. Acta Agriculturae Scandinavia, 34, 153-166.
Svensson, B. H. (Ed.) (1984). Ecology of Arable Land. The Role of Organisms in Nitrogen Cycling. Progress Report 1983. Swedish University of Agricultural Sciences, Uppsala.
Tormili, T. (1982). Structure and dynamics of reserved field ecosystems in central Finland. Biological Research Reports from the University of Jyvdskyld, 8, 1-58.
Vickerman, G. P. (1978). The arthropod fauna of undersown grass and cereal fields. Scientific Proceedings of the Royal Dublin Society, 6A, 273-283.
Vickerman, G. P. & Wratten, S. D. (1979). The biology and pest status of cereal aphids (Hemiptera: Aphididae) in Europe: a review. Bulletin of Entomological Research, 69, 1-32.
Waldbauer, G. P. (1968). The consumption and utilization of food by insects. Advances in Insect Physiology, 5, 229-288.
Whittaker, R. H. (1972). Evolution and the measurement of species diversity. Taxon, 2,213-251.
(Received 13 May 1985; revision received 27 January 1986)
This content downloaded from 128.248.155.225 on Sat, 1 Feb 2014 09:32:43 AMAll use subject to JSTOR Terms and Conditions