about this document - home - ofcom · 2016-08-25 · about this document . ... it presents selected...
TRANSCRIPT

About this document
The report contains statistics and analysis of the UK communications sector. It is a reference for industry, stakeholders, academics and consumers. It provides context to the work Ofcom undertakes in furthering the interests of consumers and citizens in the markets we regulate.
The report contains data and analysis on broadcast television and radio, fixed and mobile telephony, internet take-up and consumption and post.
We publish this report to support Ofcom’s regulatory goal to research markets constantly and to remain at the forefront of technological understanding. It also fulfils the requirements on Ofcom under Section 358 of the Communications Act 2003 to publish an annual factual and statistical report. It also addresses the requirement to undertake and make public our consumer research (as set out in Sections 14 and 15 of the same Act).
Much of the data included in this report is available for anyone to access, use and share on the open data pages of Ofcom’s website: www.ofcom.org.uk/opendata
Contents
Introduction 1
Methodological note 2
1 Market in context 3
2 Television and audio-visual 51
3 Radio and audio 109
4 Telecoms and networks 135
5 Internet and online content 177
6 Post 217
7 Glossary & Table of Figures 247

Introduction The availability of technologies and services that offer faster and more reliable internet connections has continued to grow this year. 4G mobile services are now available to 97.8% of UK premises, and superfast broadband is available to more than eight in ten households. Consumers are increasingly embracing these services. 4G take-up has increased to 48% of UK adults and 37% of fixed broadband connections are providing actual speeds of 30Mbit/s.
The greater choice of where and how to access the internet is driving greater use of online services. The smartphone in particular has become an ever more important device for many consumers, and take-up of this device has increased again this year. Seventy-one per cent of all adults now own a smartphone, up from 66% in 2015.
More traditional means of communication are being substituted for over-the-top services. The amount of time people spend texting and emailing has fallen, while the proportion of people who use instant messaging services, VoIP and video calling has increased.
Over-the-top services are also being used for audio-visual and audio content. Viewing to live TV has fallen, while use of on-demand services has grown. The use of traditional broadcast media is still high among all adults, but there are some clear differences in use by age. While 63% of all adults’ viewing time is spent with live TV, this ranges between 36% for the 16-24s to 83% for the over-65s. There is a similar pattern for listening time; 16-24s spend 29% of their listening time with live radio, compared to 71% for all adults.
The changing way in which younger people are engaging with content is affecting the way that they interact with media and communications activity overall. This age group is now watching less live TV and more on-demand content, so their attention is focused on the specific content that they have chosen to watch, rather than on texting and web browsing at the same time as watching live TV.
The increased use of on-demand and online services has also led to an increase in demand for data. The average fixed broadband line used 41% more data each month in June 2015 than in the same month the previous year.
This year’s Communications Market Report analyses and examines these, and other, trends. It presents selected findings from some of our regular consumer tracking surveys, information collected directly from industry, analysis of data from the audience measurement systems for TV, radio and online use, as well as the findings of bespoke Ofcom research. This research includes an update of our 2014 Digital Day diary study, looking into how people in the UK are using media and communication services and devices throughout the day, and research into how people feel about, and how they are dealing with, the enhanced connectivity offered by new services and devices.
1
Methodological note A variety of data sources were used in compiling this report: Ofcom’s technology tracker survey, its residential consumer postal tracking survey, its business postal tracking survey and its media tracking survey, as well as a range of ad-hoc research. The following is a brief outline of the tracking surveys used, any methodological changes and an explanation of the significance testing.
Ofcom Technology Tracker The technology tracker survey is run twice a year. It provides Ofcom with continuous understanding of consumer behaviour in the UK communications markets, helping us to monitor change and assess the degree and success of competition. The data collected is weighted to the profile of UK adults, so the data are representative of adults aged 16+. The weighting profile was updated from 2015 to reflect updated Census and NRS data.
Ofcom Residential Postal Tracker
The residential postal tracker survey is run throughout the course of the year and reported on a quarterly basis. The main objective is to help Ofcom to keep abreast of the UK postal market and to help us to quickly identify and react to any changes in attitudes and behaviour among residential postal consumers.
Ofcom Business Postal Tracker
The business postal tracker survey is run throughout the course of the year on a sample of 1600 SMEs (businesses with 0-249 employees) and reported annually. The main objective is to help Ofcom to keep abreast of the UK postal market and to help us to quickly identify and react to any changes in attitudes and behaviours among SME postal consumers.
Ofcom Media Tracker
The media tracker survey is run throughout the course of the year to counter potential seasonality issues, and is reported on an annual basis. The research provides Ofcom with a valuable source of information on consumers’ attitudes, and helps inform Ofcom’s work on broadcasting standards.
Significance testing
In statistics, a ‘significant’ result is one that is unlikely to have occurred by chance. All of the differences (e.g. year on year) that are commented on in the text of this report will be significantly different to one another. Where percentages are described as being the same or similar, despite there being a difference in number, this is because the difference is not statistically significant. Ofcom conducts all significance testing to a 95% confidence level, which means that we are 95% certain that there has been a ‘real’ change and that the difference has not occurred by chance. Significance is tested using the effective sample size, where available, and the unweighted base, where not.
2
The Communications Market 2016
1
1 Market in context
3
Contents
1.1 Market in context 5
1.1.1 Overview 5
1.2 Fast facts 7
1.3 Key market developments 9
1.4 The Digital Day 15
1.4.1 Key findings 15 1.4.2 Introduction 17 1.4.3 Comparisons with industry data 17 1.4.4 Activities and definitions 18 1.4.5 Overview of findings 18
1.5 Coping in a connected world 30
1.5.1 Introduction 30 1.5.2 The importance of the internet 30 1.5.3 Uses of the internet and effects of being online 34 1.5.4 Effects on face-to-face communication? 36 1.5.5 Taking a break from being online 40
1.6 A forward look: spectrum, innovations and technology 45
1.6.1 The future of spectrum 45 1.6.2 Innovations and technology 47
4
1.1 Market in context 1.1.1 Overview This introductory chapter of the Communications Market Report 2016 looks at the sectors Ofcom regulates as a whole.
It starts by looking at communications sector revenues (telecoms, TV, radio and post), and average monthly household spend on these sectors and services over the past five years, followed by take-up and availability of communications services and devices.
Following on from this, we present the findings of two pieces of market research that seek to understand consumer behaviour in relation to the time we spend on media and communications activities. Digital Day 2016 studies adults’ total media time on a minute-by minute-basis to provide a broad overview of people’s media activity, with some consumers spending more time on media and communications each day than they do sleeping. The amount of time spent on media and communications (8h 45m) has remained stable since the diary was last run in 2014, but this does mask some generational shifts, and changes in the types of activities we are undertaking and the devices we are using, including an increase in use of instant messaging and paid on-demand services among those aged 16-24.
Building on this overview of media activity, our Coping in a Connected World research seeks to better understand the impact – both positive and negative - of the possibility of constant connectivity on people’s lives. It looks at people’s perceptions of their use of the internet, their attitudes towards connectivity and whether people have a desire to switch off – to go on a ‘digital detox’. With nine in ten adults reporting going online every day, being ‘connected’ is seen as a core part of many people’s daily lives, with many respondents claiming to feel lost without it and admitting to being ‘hooked’ on their smartphones, tablets or other connected devices. The internet is highly valued for facilitating communications and preventing boredom, but time spent online does have its drawbacks. Four in ten internet users say they spend too much time online, and report negative effects on their work or personal lives, such as being late for work or missing out on sleep.
Finally, looking at the possibilities and challenges this connectivity provides to consumers, and the further technological developments always on the horizon, two sector experts from Ofcom provide their thoughts on the future use of, and demands on, Spectrum and Technology. David Mark Harrison, Ofcom’s Head of Technology Strategy, writes a forward-looking piece considering three key themes: the greater coverage of fixed and mobile services, the capability of new technologies to deliver increased amounts of data, and how these will enable a wide range of new consumer services. Philip Marnick, Director of Spectrum Group, considers the competing demands for spectrum, and the next generation services that require spectrum, including 5G networks, the connected car, and smart grids.
5

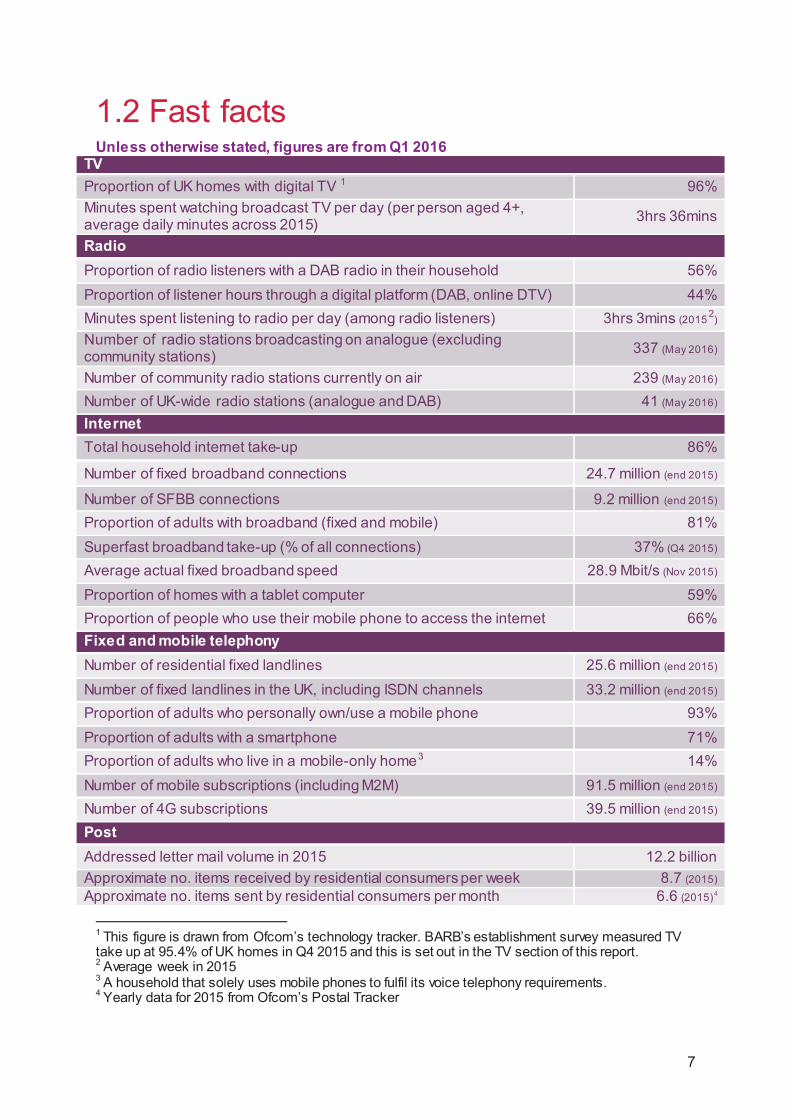
1.2 Fast facts Unless otherwise stated, figures are from Q1 2016
TV Proportion of UK homes with digital TV 1 96% Minutes spent watching broadcast TV per day (per person aged 4+, average daily minutes across 2015) 3hrs 36mins
Radio Proportion of radio listeners with a DAB radio in their household 56% Proportion of listener hours through a digital platform (DAB, online DTV) 44% Minutes spent listening to radio per day (among radio listeners) 3hrs 3mins (2015 2) Number of radio stations broadcasting on analogue (excluding community stations) 337 (May 2016)
Number of community radio stations currently on air 239 (May 2016) Number of UK-wide radio stations (analogue and DAB) 41 (May 2016) Internet Total household internet take-up 86%
Number of fixed broadband connections 24.7 million (end 2015)
Number of SFBB connections 9.2 million (end 2015) Proportion of adults with broadband (fixed and mobile) 81% Superfast broadband take-up (% of all connections) 37% (Q4 2015) Average actual fixed broadband speed 28.9 Mbit/s (Nov 2015) Proportion of homes with a tablet computer 59% Proportion of people who use their mobile phone to access the internet 66% Fixed and mobile telephony Number of residential fixed landlines 25.6 million (end 2015) Number of fixed landlines in the UK, including ISDN channels 33.2 million (end 2015) Proportion of adults who personally own/use a mobile phone 93% Proportion of adults with a smartphone 71% Proportion of adults who live in a mobile-only home3 14% Number of mobile subscriptions (including M2M) 91.5 million (end 2015) Number of 4G subscriptions 39.5 million (end 2015) Post Addressed letter mail volume in 2015 12.2 billion Approximate no. items received by residential consumers per week 8.7 (2015) Approximate no. items sent by residential consumers per month 6.6 (2015)4
1 This figure is drawn from Ofcom’s technology tracker. BARB’s establishment survey measured TV take up at 95.4% of UK homes in Q4 2015 and this is set out in the TV section of this report. 2 Average week in 2015 3 A household that solely uses mobile phones to fulfil its voice telephony requirements. 4 Yearly data for 2015 from Ofcom’s Postal Tracker
7

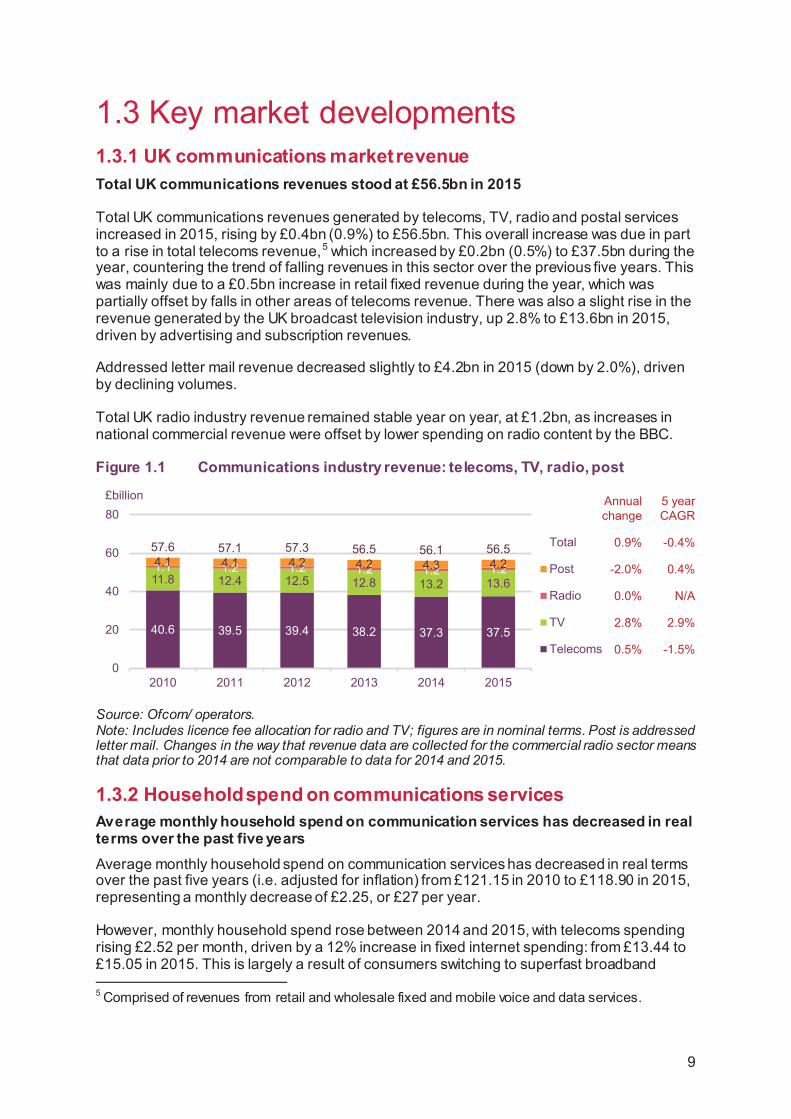
1.3 Key market developments 1.3.1 UK communications market revenue Total UK communications revenues stood at £56.5bn in 2015
Total UK communications revenues generated by telecoms, TV, radio and postal services increased in 2015, rising by £0.4bn (0.9%) to £56.5bn. This overall increase was due in part to a rise in total telecoms revenue,5 which increased by £0.2bn (0.5%) to £37.5bn during the year, countering the trend of falling revenues in this sector over the previous five years. This was mainly due to a £0.5bn increase in retail fixed revenue during the year, which was partially offset by falls in other areas of telecoms revenue. There was also a slight rise in the revenue generated by the UK broadcast television industry, up 2.8% to £13.6bn in 2015, driven by advertising and subscription revenues.
Addressed letter mail revenue decreased slightly to £4.2bn in 2015 (down by 2.0%), driven by declining volumes.
Total UK radio industry revenue remained stable year on year, at £1.2bn, as increases in national commercial revenue were offset by lower spending on radio content by the BBC.
Figure 1.1 Communications industry revenue: telecoms, TV, radio, post
Source: Ofcom/ operators. Note: Includes licence fee allocation for radio and TV; figures are in nominal terms. Post is addressed letter mail. Changes in the way that revenue data are collected for the commercial radio sector means that data prior to 2014 are not comparable to data for 2014 and 2015.
1.3.2 Household spend on communications services Average monthly household spend on communication services has decreased in real terms over the past five years Average monthly household spend on communication services has decreased in real terms over the past five years (i.e. adjusted for inflation) from £121.15 in 2010 to £118.90 in 2015, representing a monthly decrease of £2.25, or £27 per year.
However, monthly household spend rose between 2014 and 2015, with telecoms spending rising £2.52 per month, driven by a 12% increase in fixed internet spending: from £13.44 to £15.05 in 2015. This is largely a result of consumers switching to superfast broadband
5 Comprised of revenues from retail and wholesale fixed and mobile voice and data services.
40.6 39.5 39.4 38.2 37.3 37.5
11.8 12.4 12.5 12.8 13.2 13.61.1 1.2 1.2 1.2 1.2 1.24.1 4.1 4.2 4.2 4.3 4.2
57.6 57.1 57.3 56.5 56.1 56.5
0
20
40
60
80
2010 2011 2012 2013 2014 2015
Total
Post
Radio
TV
Telecoms
£billion Annual change
5 year CAGR
0.9% -0.4%
-2.0% 0.4%
0.0% N/A
2.8% 2.9%
0.5% -1.5%
9
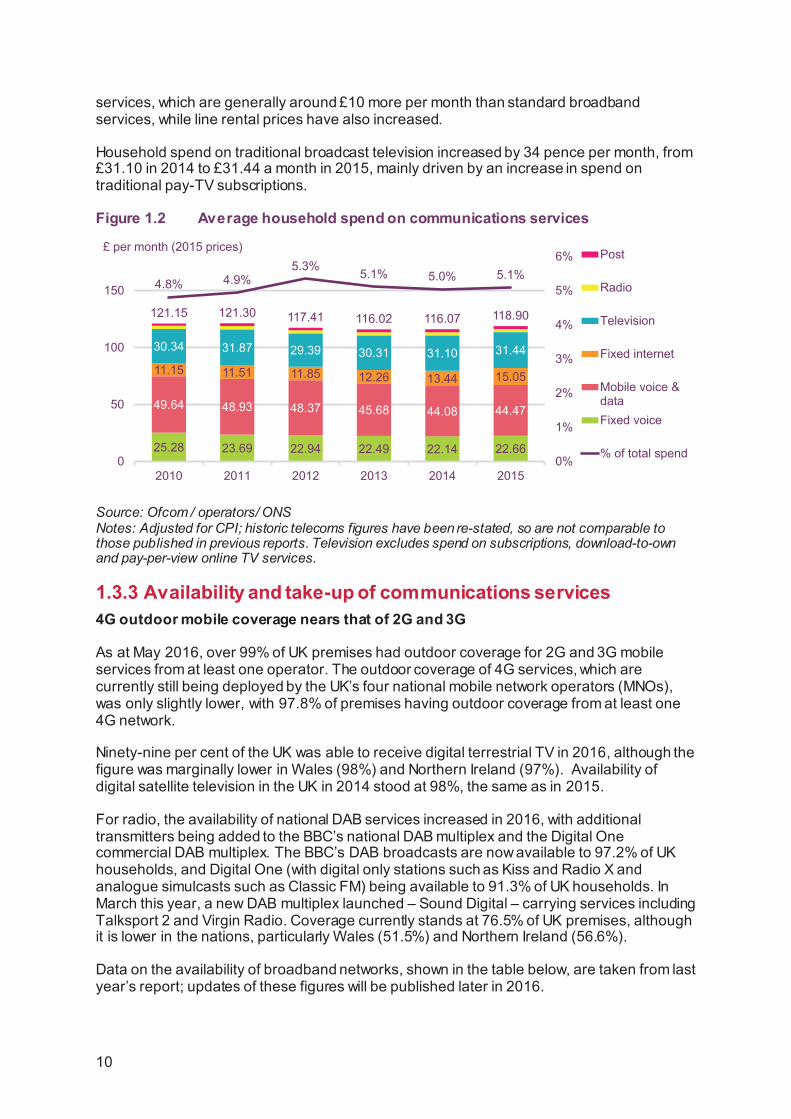
services, which are generally around £10 more per month than standard broadband services, while line rental prices have also increased.
Household spend on traditional broadcast television increased by 34 pence per month, from £31.10 in 2014 to £31.44 a month in 2015, mainly driven by an increase in spend on traditional pay-TV subscriptions.
Figure 1.2 Average household spend on communications services
Source: Ofcom / operators/ ONS Notes: Adjusted for CPI; historic telecoms figures have been re-stated, so are not comparable to those published in previous reports. Television excludes spend on subscriptions, download-to-own and pay-per-view online TV services.
1.3.3 Availability and take-up of communications services 4G outdoor mobile coverage nears that of 2G and 3G
As at May 2016, over 99% of UK premises had outdoor coverage for 2G and 3G mobile services from at least one operator. The outdoor coverage of 4G services, which are currently still being deployed by the UK’s four national mobile network operators (MNOs), was only slightly lower, with 97.8% of premises having outdoor coverage from at least one 4G network.
Ninety-nine per cent of the UK was able to receive digital terrestrial TV in 2016, although the figure was marginally lower in Wales (98%) and Northern Ireland (97%). Availability of digital satellite television in the UK in 2014 stood at 98%, the same as in 2015.
For radio, the availability of national DAB services increased in 2016, with additional transmitters being added to the BBC’s national DAB multiplex and the Digital One commercial DAB multiplex. The BBC’s DAB broadcasts are now available to 97.2% of UK households, and Digital One (with digital only stations such as Kiss and Radio X and analogue simulcasts such as Classic FM) being available to 91.3% of UK households. In March this year, a new DAB multiplex launched – Sound Digital – carrying services including Talksport 2 and Virgin Radio. Coverage currently stands at 76.5% of UK premises, although it is lower in the nations, particularly Wales (51.5%) and Northern Ireland (56.6%).
Data on the availability of broadband networks, shown in the table below, are taken from last year’s report; updates of these figures will be published later in 2016.
25.28 23.69 22.94 22.49 22.14 22.66
49.64 48.93 48.37 45.68 44.08 44.47
11.15 11.51 11.85 12.26 13.44 15.05
30.34 31.87 29.39 30.31 31.10 31.44
121.15 121.30 117.41 116.02 116.07 118.90
4.8% 4.9%5.3% 5.1% 5.0% 5.1%
0%
1%
2%
3%
4%
5%
6%
0
50
100
150
2010 2011 2012 2013 2014 2015
Post
Radio
Television
Fixed internet
Mobile voice &dataFixed voice
% of total spend
£ per month (2015 prices)
10
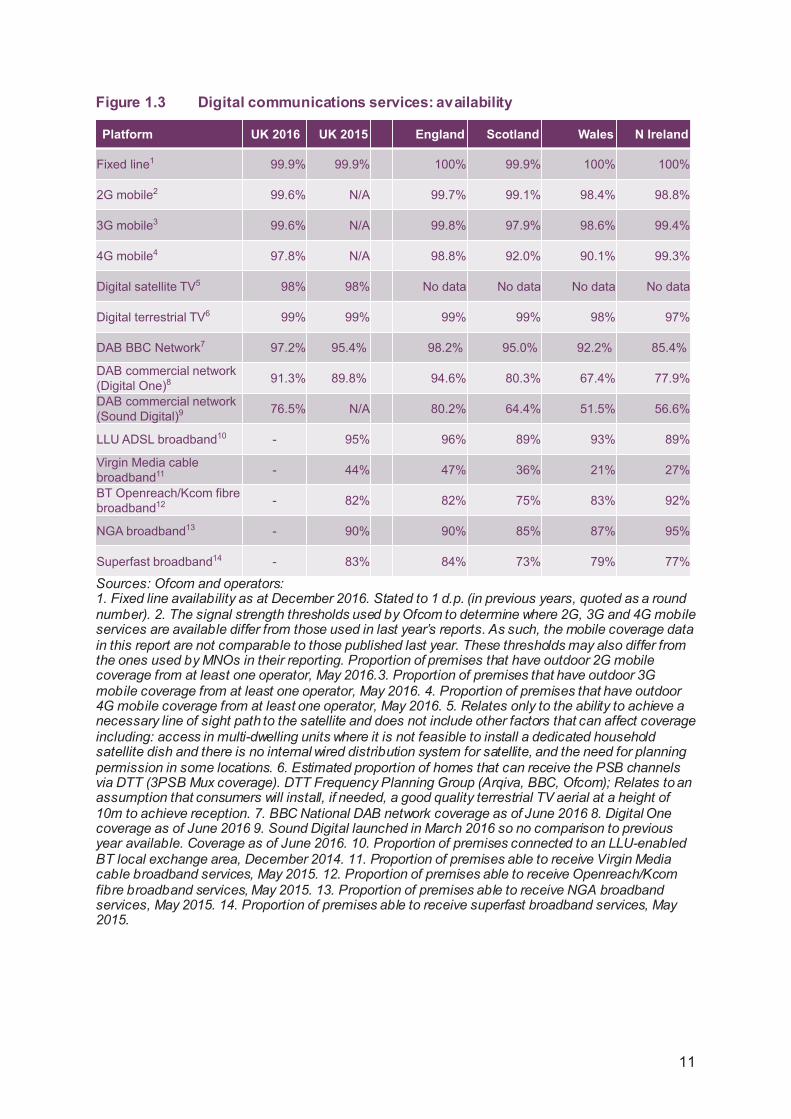
Figure 1.3 Digital communications services: availability
Sources: Ofcom and operators: 1. Fixed line availability as at December 2016. Stated to 1 d.p. (in previous years, quoted as a round number). 2. The signal strength thresholds used by Ofcom to determine where 2G, 3G and 4G mobile services are available differ from those used in last year’s reports. As such, the mobile coverage data in this report are not comparable to those published last year. These thresholds may also differ from the ones used by MNOs in their reporting. Proportion of premises that have outdoor 2G mobile coverage from at least one operator, May 2016.3. Proportion of premises that have outdoor 3G mobile coverage from at least one operator, May 2016. 4. Proportion of premises that have outdoor 4G mobile coverage from at least one operator, May 2016. 5. Relates only to the ability to achieve a necessary line of sight path to the satellite and does not include other factors that can affect coverage including: access in multi-dwelling units where it is not feasible to install a dedicated household satellite dish and there is no internal wired distribution system for satellite, and the need for planning permission in some locations. 6. Estimated proportion of homes that can receive the PSB channels via DTT (3PSB Mux coverage). DTT Frequency Planning Group (Arqiva, BBC, Ofcom); Relates to an assumption that consumers will install, if needed, a good quality terrestrial TV aerial at a height of 10m to achieve reception. 7. BBC National DAB network coverage as of June 2016 8. Digital One coverage as of June 2016 9. Sound Digital launched in March 2016 so no comparison to previous year available. Coverage as of June 2016. 10. Proportion of premises connected to an LLU-enabled BT local exchange area, December 2014. 11. Proportion of premises able to receive Virgin Media cable broadband services, May 2015. 12. Proportion of premises able to receive Openreach/Kcom fibre broadband services, May 2015. 13. Proportion of premises able to receive NGA broadband services, May 2015. 14. Proportion of premises able to receive superfast broadband services, May 2015.
Platform UK 2016 UK 2015 England Scotland Wales N Ireland
Fixed line1 99.9% 99.9% 100% 99.9% 100% 100%
2G mobile2 99.6% N/A 99.7% 99.1% 98.4% 98.8%
3G mobile3 99.6% N/A 99.8% 97.9% 98.6% 99.4%
4G mobile4 97.8% N/A 98.8% 92.0% 90.1% 99.3%
Digital satellite TV5 98% 98% No data No data No data No data
Digital terrestrial TV6 99% 99% 99% 99% 98% 97%
DAB BBC Network7 97.2% 95.4% 98.2% 95.0% 92.2% 85.4%
DAB commercial network (Digital One)8 91.3% 89.8% 94.6% 80.3% 67.4% 77.9%
DAB commercial network (Sound Digital)9 76.5% N/A 80.2% 64.4% 51.5% 56.6%
LLU ADSL broadband10 - 95% 96% 89% 93% 89%
Virgin Media cable broadband11 - 44% 47% 36% 21% 27%
BT Openreach/Kcom fibre broadband12 - 82% 82% 75% 83% 92%
NGA broadband13 - 90% 90% 85% 87% 95%
Superfast broadband14 - 83% 84% 73% 79% 77%
11
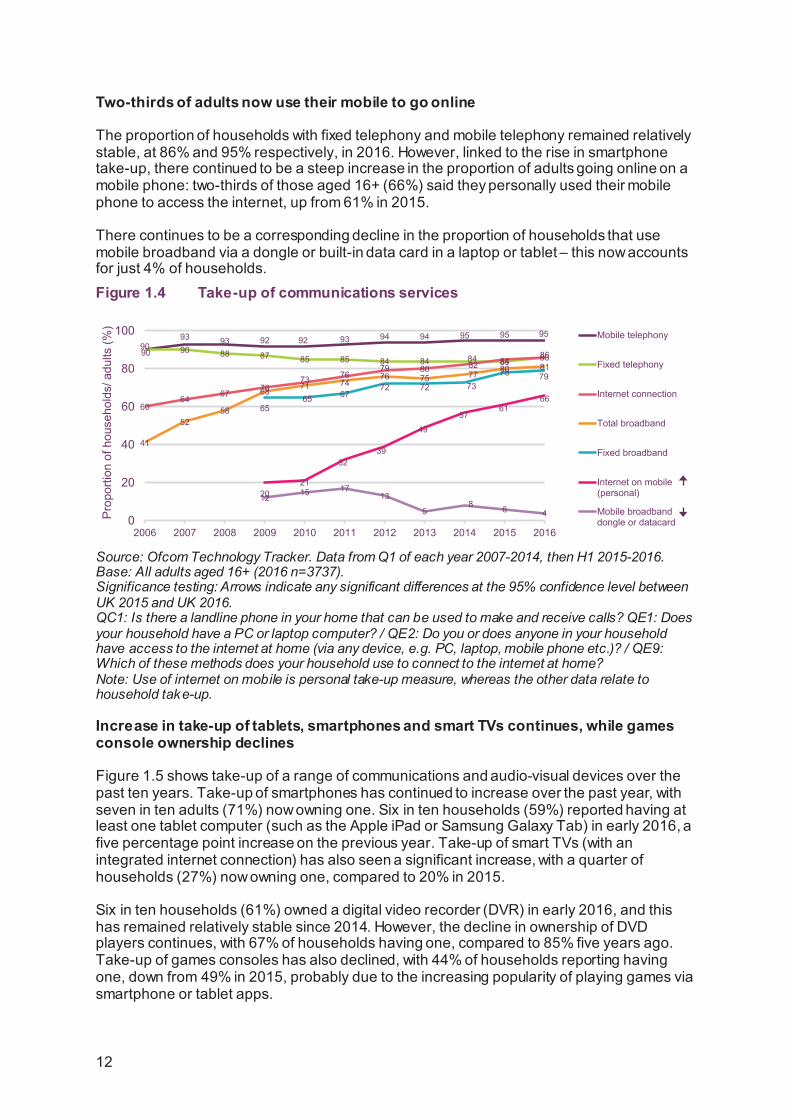
Two-thirds of adults now use their mobile to go online
The proportion of households with fixed telephony and mobile telephony remained relatively stable, at 86% and 95% respectively, in 2016. However, linked to the rise in smartphone take-up, there continued to be a steep increase in the proportion of adults going online on a mobile phone: two-thirds of those aged 16+ (66%) said they personally used their mobile phone to access the internet, up from 61% in 2015.
There continues to be a corresponding decline in the proportion of households that use mobile broadband via a dongle or built-in data card in a laptop or tablet – this now accounts for just 4% of households. Figure 1.4 Take-up of communications services
Source: Ofcom Technology Tracker. Data from Q1 of each year 2007-2014, then H1 2015-2016. Base: All adults aged 16+ (2016 n=3737). Significance testing: Arrows indicate any significant differences at the 95% confidence level between UK 2015 and UK 2016. QC1: Is there a landline phone in your home that can be used to make and receive calls? QE1: Does your household have a PC or laptop computer? / QE2: Do you or does anyone in your household have access to the internet at home (via any device, e.g. PC, laptop, mobile phone etc.)? / QE9: Which of these methods does your household use to connect to the internet at home? Note: Use of internet on mobile is personal take-up measure, whereas the other data relate to household take-up.
Increase in take-up of tablets, smartphones and smart TVs continues, while games console ownership declines
Figure 1.5 shows take-up of a range of communications and audio-visual devices over the past ten years. Take-up of smartphones has continued to increase over the past year, with seven in ten adults (71%) now owning one. Six in ten households (59%) reported having at least one tablet computer (such as the Apple iPad or Samsung Galaxy Tab) in early 2016, a five percentage point increase on the previous year. Take-up of smart TVs (with an integrated internet connection) has also seen a significant increase, with a quarter of households (27%) now owning one, compared to 20% in 2015.
Six in ten households (61%) owned a digital video recorder (DVR) in early 2016, and this has remained relatively stable since 2014. However, the decline in ownership of DVD players continues, with 67% of households having one, compared to 85% five years ago. Take-up of games consoles has also declined, with 44% of households reporting having one, down from 49% in 2015, probably due to the increasing popularity of playing games via smartphone or tablet apps.
Pro
porti
on o
f hou
seho
lds/
adu
lts (%
)
90
93 93 92 92 93 94 94 95 95 9590 90 88 87 85 85 84 84 84 84 86
6064
6770
73 7679 80 82 85
86
41
5258
6871 74
76 75 7780 81
6565 67
72 72 7378 79
2021
3239
49
5761
66
1215 17
13
58 6 4
0
20
40
60
80
100
2006 2007 2008 2009 2010 2011 2012 2013 2014 2015 2016
Mobile telephony
Fixed telephony
Internet connection
Total broadband
Fixed broadband
Internet on mobile(personal)
Mobile broadbanddongle or datacard
12
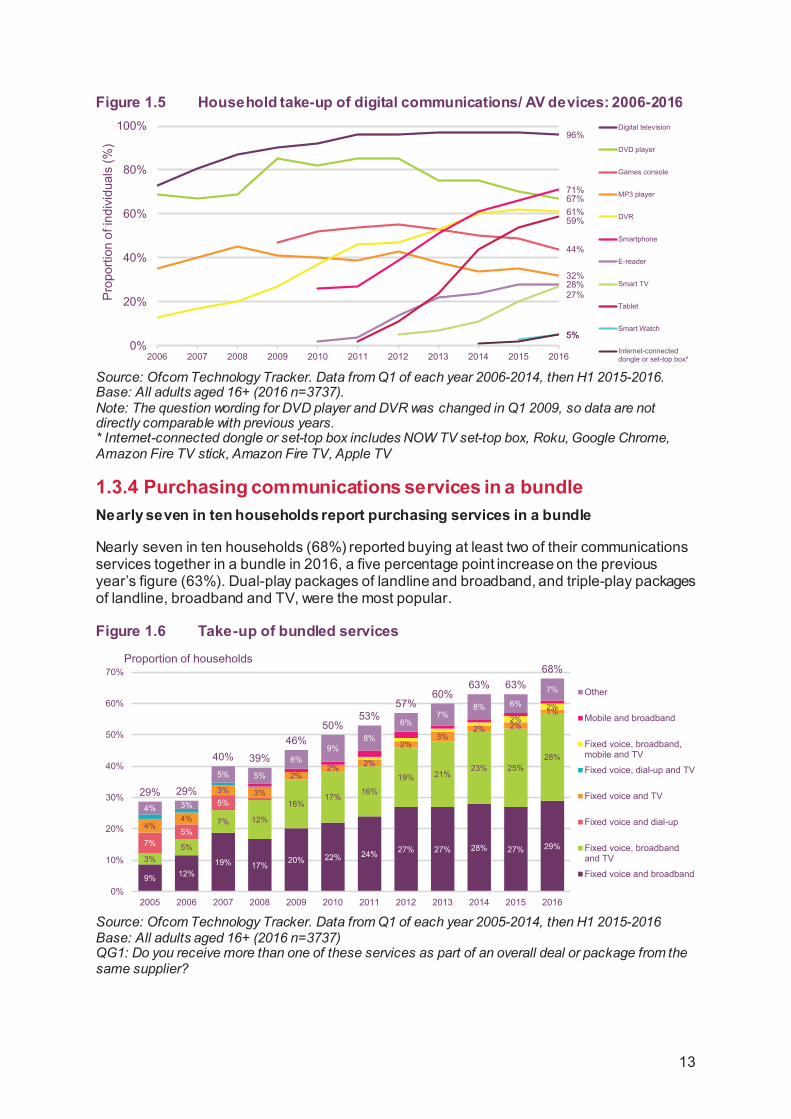
Figure 1.5 Household take-up of digital communications/ AV devices: 2006-2016
Source: Ofcom Technology Tracker. Data from Q1 of each year 2006-2014, then H1 2015-2016. Base: All adults aged 16+ (2016 n=3737). Note: The question wording for DVD player and DVR was changed in Q1 2009, so data are not directly comparable with previous years. * Internet-connected dongle or set-top box includes NOW TV set-top box, Roku, Google Chrome, Amazon Fire TV stick, Amazon Fire TV, Apple TV
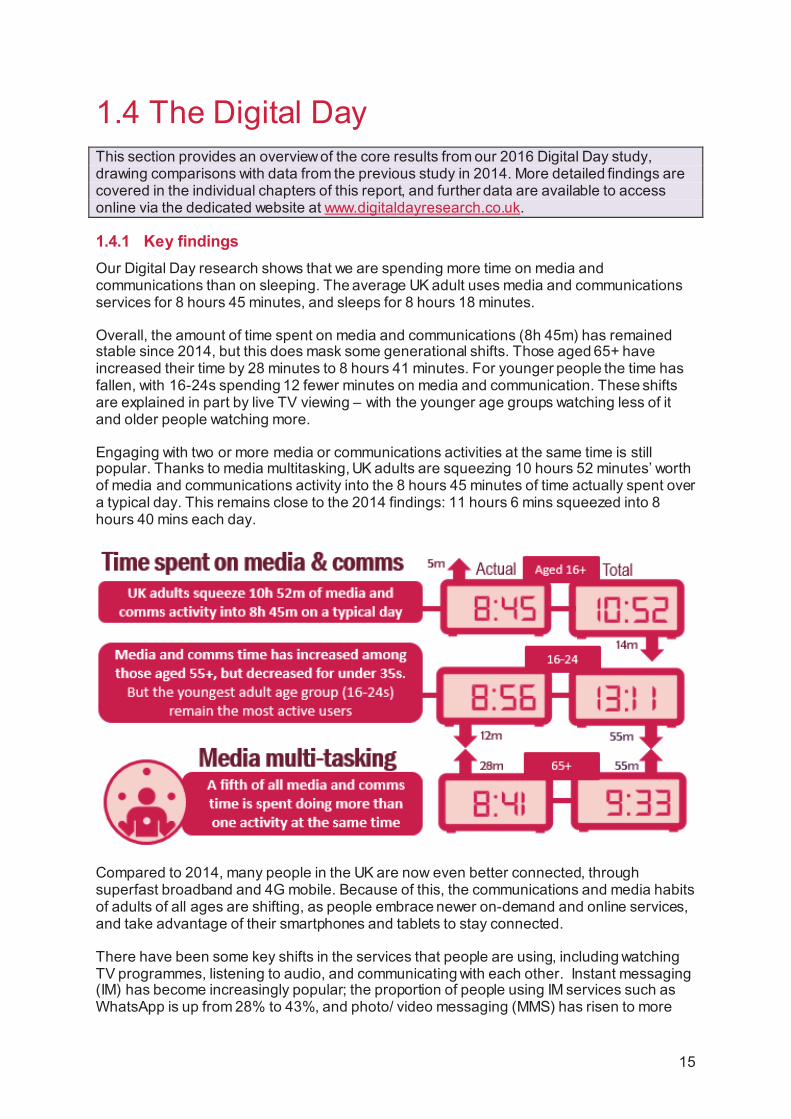
1.3.4 Purchasing communications services in a bundle Nearly seven in ten households report purchasing services in a bundle
Nearly seven in ten households (68%) reported buying at least two of their communications services together in a bundle in 2016, a five percentage point increase on the previous year’s figure (63%). Dual-play packages of landline and broadband, and triple-play packages of landline, broadband and TV, were the most popular.
Figure 1.6 Take-up of bundled services
Source: Ofcom Technology Tracker. Data from Q1 of each year 2005-2014, then H1 2015-2016 Base: All adults aged 16+ (2016 n=3737) QG1: Do you receive more than one of these services as part of an overall deal or package from the same supplier?
Pro
porti
on o
f ind
ivid
uals
(%)
96%
67%
44%
32%
61%
71%
28%27%
59%
5%5%0%
20%
40%
60%
80%
100%
2006 2007 2008 2009 2010 2011 2012 2013 2014 2015 2016
Digital television
DVD player
Games console
MP3 player
DVR
Smartphone
E-reader
Smart TV
Tablet
Smart Watch
Internet-connecteddongle or set-top box*
9% 12%19% 17% 20% 22% 24% 27% 27% 28% 27% 29%
3%5%
7% 12%
16%17%
16%
19% 21%23% 25%
28%
7%5%
5%
4%4%
3% 3%
2%2% 2%
2%3%
2% 2%
1%2%
2%
4% 3%
5% 5%
6%9%
8%
6%7%
8% 6%
7%
29% 29%
40% 39%
46%50%
53%57%
60%63% 63%
68%
0%
10%
20%
30%
40%
50%
60%
70%
2005 2006 2007 2008 2009 2010 2011 2012 2013 2014 2015 2016
Other
Mobile and broadband
Fixed voice, broadband,mobile and TV
Fixed voice, dial-up and TV
Fixed voice and TV
Fixed voice and dial-up
Fixed voice, broadbandand TV
Fixed voice and broadband
Proportion of households
13

1.4 The Digital Day This section provides an overview of the core results from our 2016 Digital Day study, drawing comparisons with data from the previous study in 2014. More detailed findings are covered in the individual chapters of this report, and further data are available to access online via the dedicated website at www.digitaldayresearch.co.uk.
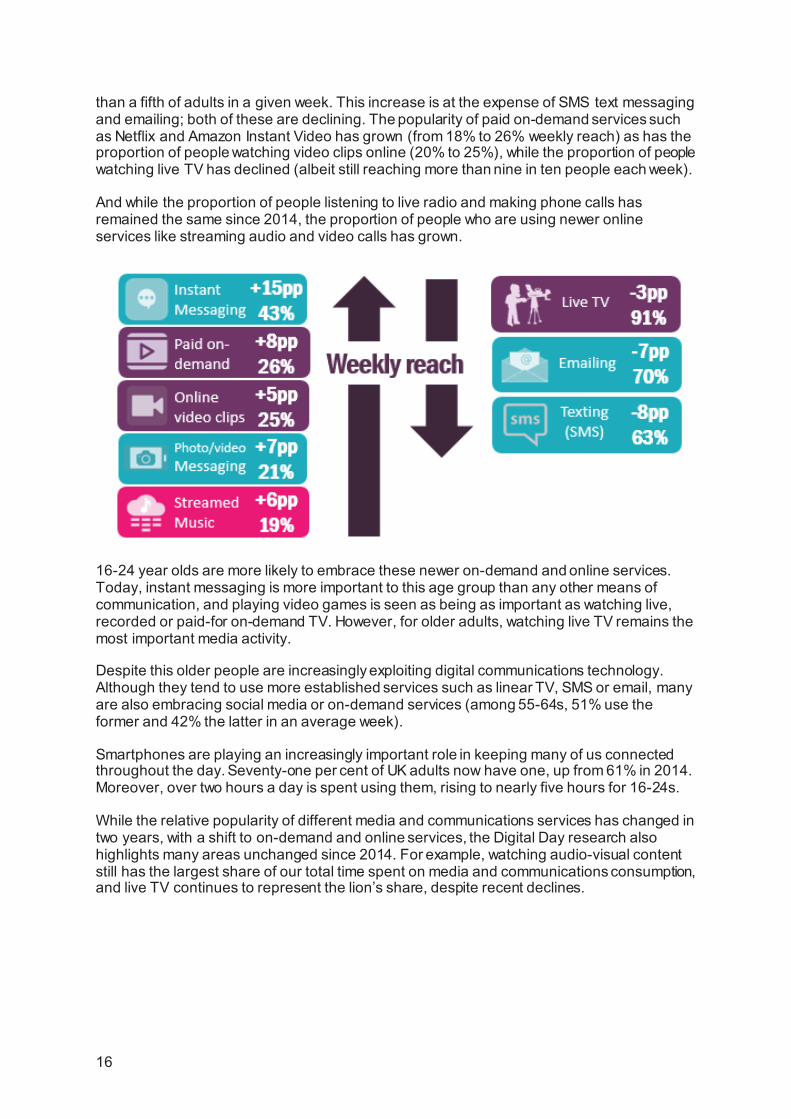
1.4.1 Key findings Our Digital Day research shows that we are spending more time on media and communications than on sleeping. The average UK adult uses media and communications services for 8 hours 45 minutes, and sleeps for 8 hours 18 minutes.
Overall, the amount of time spent on media and communications (8h 45m) has remained stable since 2014, but this does mask some generational shifts. Those aged 65+ have increased their time by 28 minutes to 8 hours 41 minutes. For younger people the time has fallen, with 16-24s spending 12 fewer minutes on media and communication. These shifts are explained in part by live TV viewing – with the younger age groups watching less of it and older people watching more.
Engaging with two or more media or communications activities at the same time is still popular. Thanks to media multitasking, UK adults are squeezing 10 hours 52 minutes’ worth of media and communications activity into the 8 hours 45 minutes of time actually spent over a typical day. This remains close to the 2014 findings: 11 hours 6 mins squeezed into 8 hours 40 mins each day.
Compared to 2014, many people in the UK are now even better connected, through superfast broadband and 4G mobile. Because of this, the communications and media habits of adults of all ages are shifting, as people embrace newer on-demand and online services, and take advantage of their smartphones and tablets to stay connected.
There have been some key shifts in the services that people are using, including watching TV programmes, listening to audio, and communicating with each other. Instant messaging (IM) has become increasingly popular; the proportion of people using IM services such as WhatsApp is up from 28% to 43%, and photo/ video messaging (MMS) has risen to more
15
than a fifth of adults in a given week. This increase is at the expense of SMS text messaging and emailing; both of these are declining. The popularity of paid on-demand services such as Netflix and Amazon Instant Video has grown (from 18% to 26% weekly reach) as has the proportion of people watching video clips online (20% to 25%), while the proportion of people watching live TV has declined (albeit still reaching more than nine in ten people each week).
And while the proportion of people listening to live radio and making phone calls has remained the same since 2014, the proportion of people who are using newer online services like streaming audio and video calls has grown.
16-24 year olds are more likely to embrace these newer on-demand and online services. Today, instant messaging is more important to this age group than any other means of communication, and playing video games is seen as being as important as watching live, recorded or paid-for on-demand TV. However, for older adults, watching live TV remains the most important media activity.
Despite this older people are increasingly exploiting digital communications technology. Although they tend to use more established services such as linear TV, SMS or email, many are also embracing social media or on-demand services (among 55-64s, 51% use the former and 42% the latter in an average week).
Smartphones are playing an increasingly important role in keeping many of us connected throughout the day. Seventy-one per cent of UK adults now have one, up from 61% in 2014. Moreover, over two hours a day is spent using them, rising to nearly five hours for 16-24s.
While the relative popularity of different media and communications services has changed in two years, with a shift to on-demand and online services, the Digital Day research also highlights many areas unchanged since 2014. For example, watching audio-visual content still has the largest share of our total time spent on media and communications consumption, and live TV continues to represent the lion’s share, despite recent declines.
16
1.4.2 Introduction While Ofcom makes use of a wide range of industry research, to understand how people consume broadcast media and online content, this research generally provides limited insight into how people use all media and communications services and devices together, and how they form a central part of a consumer’s day.
In Q1 2016 we conducted an in-depth quantitative diary study into UK adults’ and children’s6 total media and communications activities, to provide an overview of the role of media and communications in people’s lives. The study was last conducted in 2014, and so one of the primary objectives was to gauge how things have changed since then; the study was therefore designed to remain as consistent as possible in terms of methodology.
The research provides a snapshot of media and communications behaviour over a seven-day period, exploring when and how people use services and devices throughout the day, covering both personal and work/study use; in and away from home.
Adult participants recorded all their media and communications activities in a paper diary booklet for seven days, and this was transferred digitally on a daily basis using a dedicated website (completed by the respondent or with the help of a telephone interview) 7:
1.4.3 Comparisons with industry data As in the 2014 study, television industry data from BARB show weekly reach levels and volumes of activity comparable with this study. However, this study recorded lower reach and volumes than industry data for radio (comparing Digital Day results to the RAJAR database). A range of factors may have contributed to this difference. These include:
• The broad nature of the Digital Day survey; it covers a wide range of media, rather than focusing on one specific medium.
• Activities that receive lower consumer attention, or are undertaken passively, such as radio, may be less likely to be recalled.
These factors may explain differences between the two data sources.
6 Within this report we focus on the data from the adults’ diaries only. We plan to publish a separate children’s report later on in the year alongside our children’s media literacy annual report. 7 A comprehensive description of the methodology is available in the technical appendix. This includes all questionnaire material, sample information and analysis definitions - http://stakeholders.ofcom.org.uk/binaries/research/cross-media/2016/technical_appendix.pdf
17
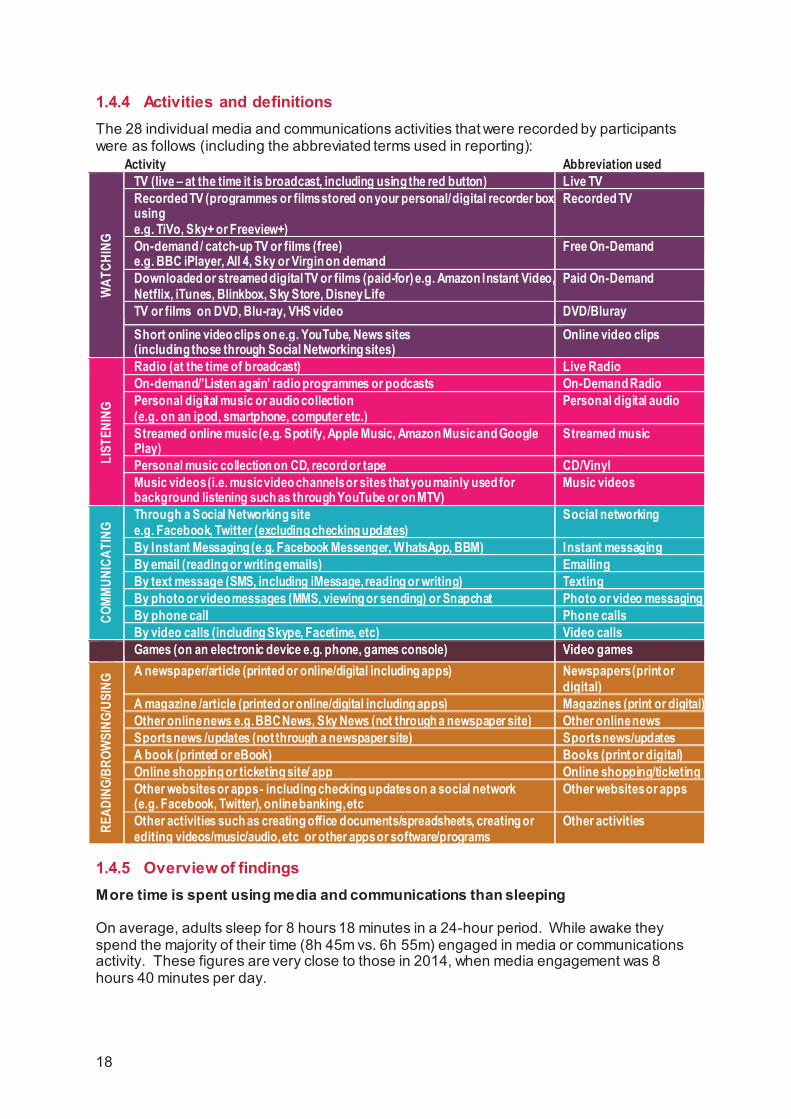
1.4.4 Activities and definitions The 28 individual media and communications activities that were recorded by participants were as follows (including the abbreviated terms used in reporting):
Activity Abbreviation used
WAT
CHIN
G
TV (live – at the time it is broadcast, including using the red button) Live TV Recorded TV (programmes or films stored on your personal/ digital recorder box using e.g. TiVo, Sky+ or Freeview+)
Recorded TV
On-demand / catch-up TV or films (free) e.g. BBC iPlayer, All 4, Sky or Virgin on demand
Free On-Demand
Downloaded or streamed digital TV or films (paid-for) e.g. Amazon Instant Video, Netflix, iTunes, Blinkbox, Sky Store, Disney Life
Paid On-Demand
TV or films on DVD, Blu-ray, VHS video DVD/Bluray Short online video clips on e.g. YouTube, News sites (including those through Social Networking sites)
Online video clips
LIST
ENIN
G
Radio (at the time of broadcast) Live Radio On-demand/’Listen again’ radio programmes or podcasts On-Demand Radio Personal digital music or audio collection (e.g. on an ipod, smartphone, computer etc.)
Personal digital audio
Streamed online music (e.g. Spotify, Apple Music, Amazon Music and Google Play)
Streamed music
Personal music collection on CD, record or tape CD/Vinyl Music videos (i.e. music video channels or sites that you mainly used for background listening such as through YouTube or on MTV)
Music videos
COMM
UNIC
ATIN
G
Through a Social Networking site e.g. Facebook, Twitter (excluding checking updates)
Social networking
By Instant Messaging (e.g. Facebook Messenger, WhatsApp, BBM) Instant messaging By email (reading or writing emails) Emailing By text message (SMS, including iMessage, reading or writing) Texting By photo or video messages (MMS, viewing or sending) or Snapchat Photo or video messaging By phone call Phone calls By video calls (including Skype, Facetime, etc) Video calls
Games (on an electronic device e.g. phone, games console) Video games
READ
ING/
BROW
SING
/USI
NG A newspaper/article (printed or online/digital including apps) Newspapers (print or
digital) A magazine /article (printed or online/digital including apps) Magazines (print or digital) Other online news e.g. BBC News, Sky News (not through a newspaper site) Other online news Sports news /updates (not through a newspaper site) Sports news/updates A book (printed or eBook) Books (print or digital) Online shopping or ticketing site/ app Online shopping/ticketing Other websites or apps - including checking updates on a social network (e.g. Facebook, Twitter), online banking, etc
Other websites or apps
Other activities such as creating office documents/spreadsheets, creating or editing videos/music/audio, etc or other apps or software/programs
Other activities
1.4.5 Overview of findings More time is spent using media and communications than sleeping
On average, adults sleep for 8 hours 18 minutes in a 24-hour period. While awake they spend the majority of their time (8h 45m vs. 6h 55m) engaged in media or communications activity. These figures are very close to those in 2014, when media engagement was 8 hours 40 minutes per day.
18
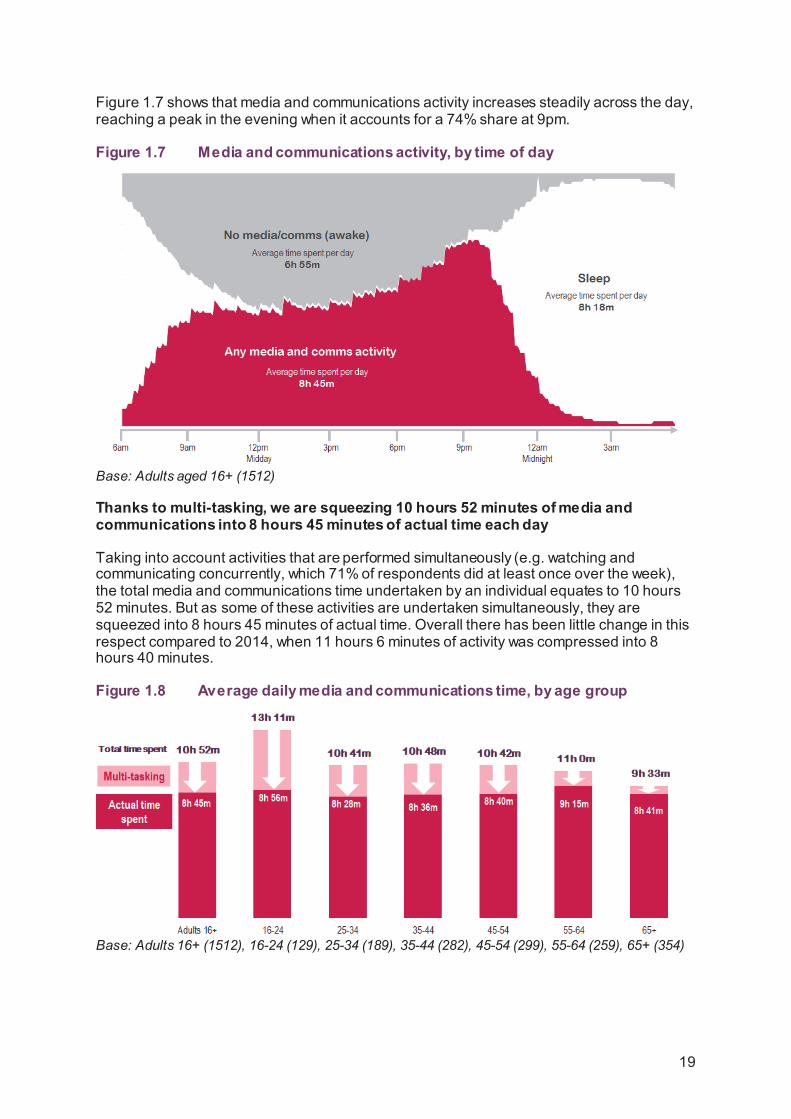
Figure 1.7 shows that media and communications activity increases steadily across the day, reaching a peak in the evening when it accounts for a 74% share at 9pm.
Figure 1.7 Media and communications activity, by time of day
Base: Adults aged 16+ (1512)
Thanks to multi-tasking, we are squeezing 10 hours 52 minutes of media and communications into 8 hours 45 minutes of actual time each day
Taking into account activities that are performed simultaneously (e.g. watching and communicating concurrently, which 71% of respondents did at least once over the week), the total media and communications time undertaken by an individual equates to 10 hours 52 minutes. But as some of these activities are undertaken simultaneously, they are squeezed into 8 hours 45 minutes of actual time. Overall there has been little change in this respect compared to 2014, when 11 hours 6 minutes of activity was compressed into 8 hours 40 minutes.
Figure 1.8 Average daily media and communications time, by age group
Base: Adults 16+ (1512), 16-24 (129), 25-34 (189), 35-44 (282), 45-54 (299), 55-64 (259), 65+ (354)
19
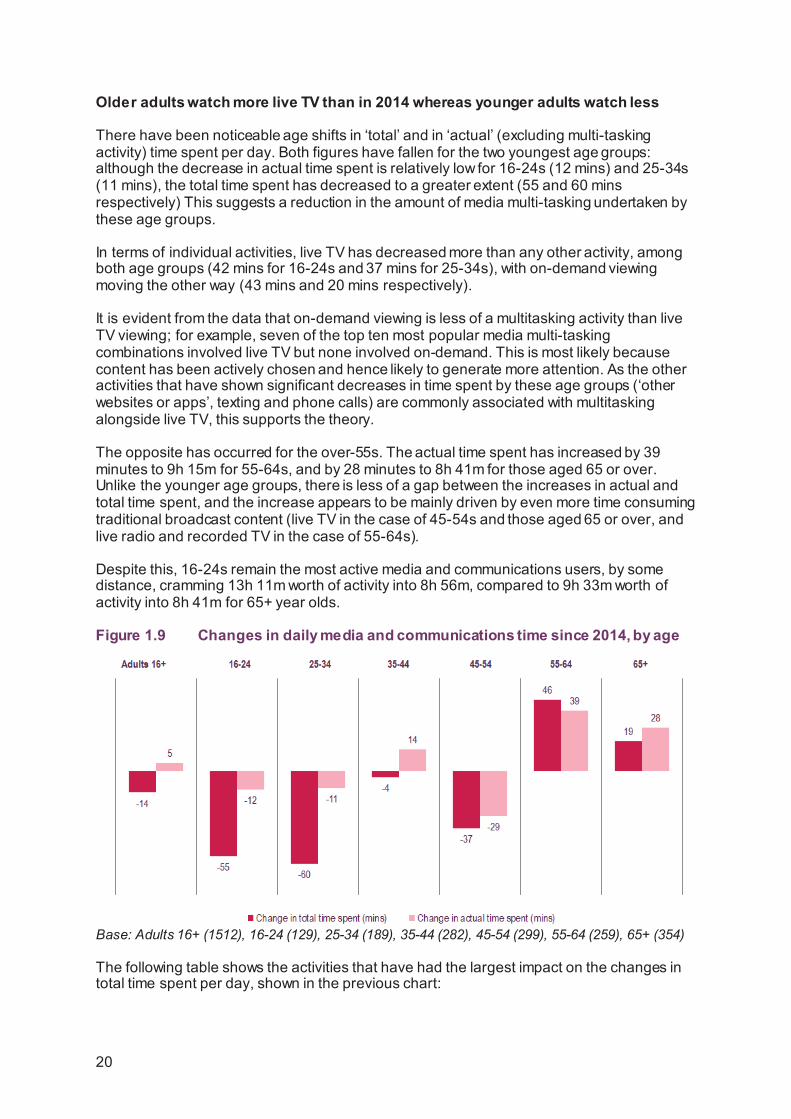
Older adults watch more live TV than in 2014 whereas younger adults watch less
There have been noticeable age shifts in ‘total’ and in ‘actual’ (excluding multi-tasking activity) time spent per day. Both figures have fallen for the two youngest age groups: although the decrease in actual time spent is relatively low for 16-24s (12 mins) and 25-34s (11 mins), the total time spent has decreased to a greater extent (55 and 60 mins respectively) This suggests a reduction in the amount of media multi-tasking undertaken by these age groups.
In terms of individual activities, live TV has decreased more than any other activity, among both age groups (42 mins for 16-24s and 37 mins for 25-34s), with on-demand viewing moving the other way (43 mins and 20 mins respectively).
It is evident from the data that on-demand viewing is less of a multitasking activity than live TV viewing; for example, seven of the top ten most popular media multi-tasking combinations involved live TV but none involved on-demand. This is most likely because content has been actively chosen and hence likely to generate more attention. As the other activities that have shown significant decreases in time spent by these age groups (‘other websites or apps’, texting and phone calls) are commonly associated with multitasking alongside live TV, this supports the theory.
The opposite has occurred for the over-55s. The actual time spent has increased by 39 minutes to 9h 15m for 55-64s, and by 28 minutes to 8h 41m for those aged 65 or over. Unlike the younger age groups, there is less of a gap between the increases in actual and total time spent, and the increase appears to be mainly driven by even more time consuming traditional broadcast content (live TV in the case of 45-54s and those aged 65 or over, and live radio and recorded TV in the case of 55-64s).
Despite this, 16-24s remain the most active media and communications users, by some distance, cramming 13h 11m worth of activity into 8h 56m, compared to 9h 33m worth of activity into 8h 41m for 65+ year olds.
Figure 1.9 Changes in daily media and communications time since 2014, by age
Base: Adults 16+ (1512), 16-24 (129), 25-34 (189), 35-44 (282), 45-54 (299), 55-64 (259), 65+ (354)
The following table shows the activities that have had the largest impact on the changes in total time spent per day, shown in the previous chart:
20
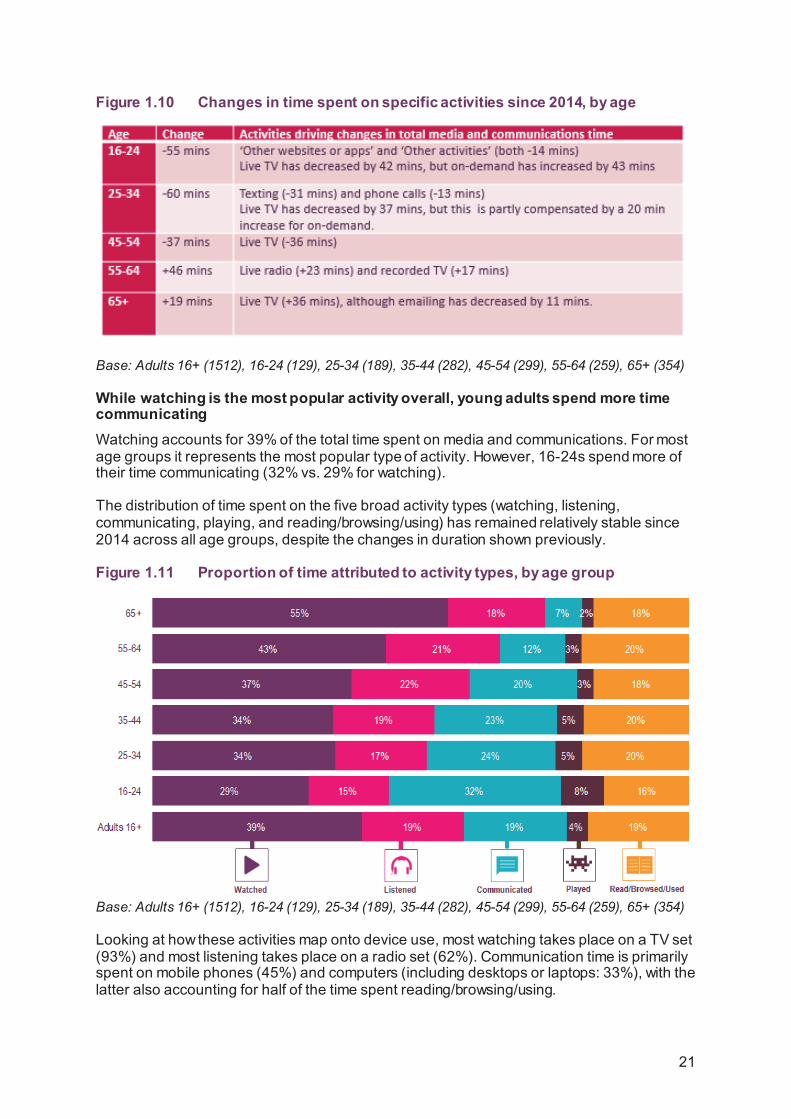
Figure 1.10 Changes in time spent on specific activities since 2014, by age
Base: Adults 16+ (1512), 16-24 (129), 25-34 (189), 35-44 (282), 45-54 (299), 55-64 (259), 65+ (354)
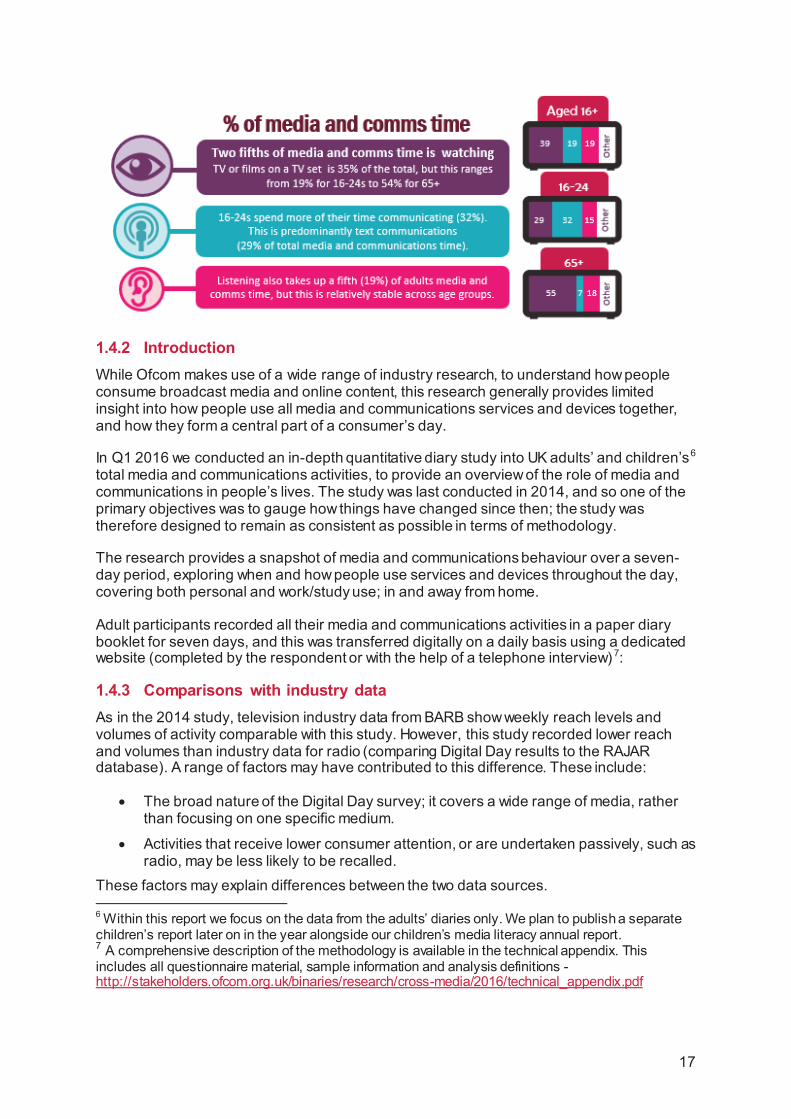
While watching is the most popular activity overall, young adults spend more time communicating Watching accounts for 39% of the total time spent on media and communications. For most age groups it represents the most popular type of activity. However, 16-24s spend more of their time communicating (32% vs. 29% for watching).
The distribution of time spent on the five broad activity types (watching, listening, communicating, playing, and reading/browsing/using) has remained relatively stable since 2014 across all age groups, despite the changes in duration shown previously.
Figure 1.11 Proportion of time attributed to activity types, by age group
Base: Adults 16+ (1512), 16-24 (129), 25-34 (189), 35-44 (282), 45-54 (299), 55-64 (259), 65+ (354)
Looking at how these activities map onto device use, most watching takes place on a TV set (93%) and most listening takes place on a radio set (62%). Communication time is primarily spent on mobile phones (45%) and computers (including desktops or laptops: 33%), with the latter also accounting for half of the time spent reading/browsing/using.
21
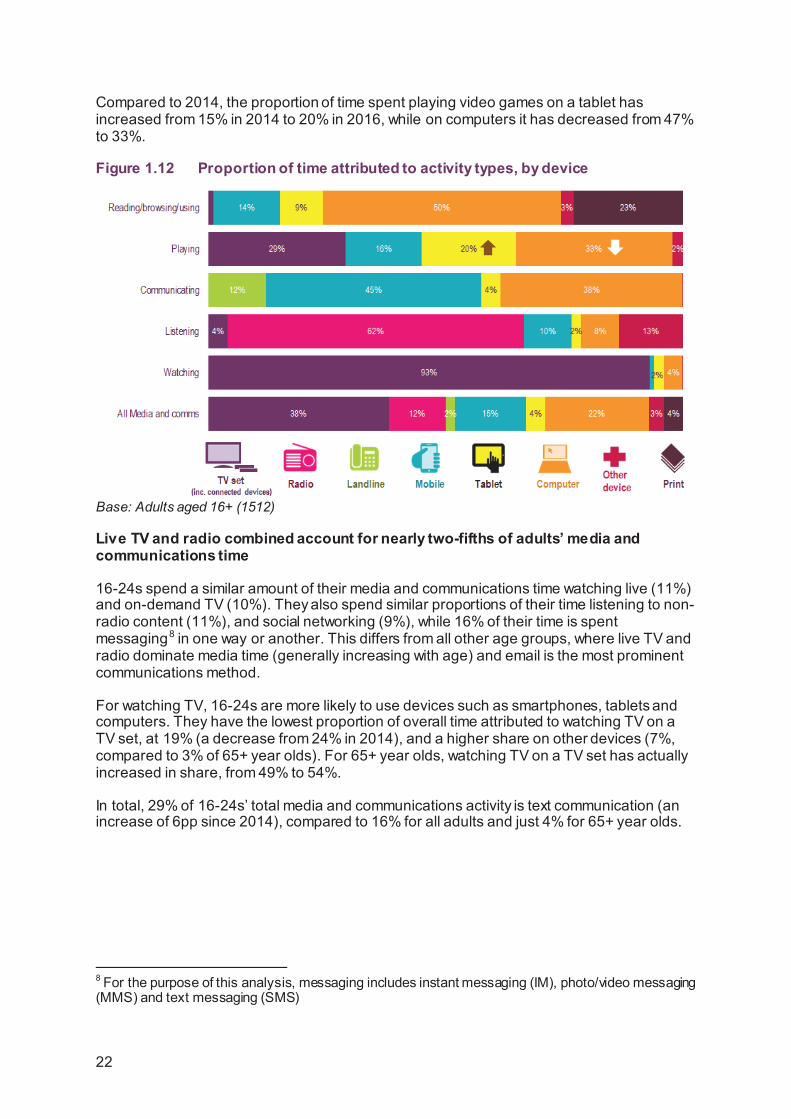
Compared to 2014, the proportion of time spent playing video games on a tablet has increased from 15% in 2014 to 20% in 2016, while on computers it has decreased from 47% to 33%.
Figure 1.12 Proportion of time attributed to activity types, by device
Base: Adults aged 16+ (1512)
Live TV and radio combined account for nearly two-fifths of adults’ media and communications time
16-24s spend a similar amount of their media and communications time watching live (11%) and on-demand TV (10%). They also spend similar proportions of their time listening to non-radio content (11%), and social networking (9%), while 16% of their time is spent messaging8 in one way or another. This differs from all other age groups, where live TV and radio dominate media time (generally increasing with age) and email is the most prominent communications method.
For watching TV, 16-24s are more likely to use devices such as smartphones, tablets and computers. They have the lowest proportion of overall time attributed to watching TV on a TV set, at 19% (a decrease from 24% in 2014), and a higher share on other devices (7%, compared to 3% of 65+ year olds). For 65+ year olds, watching TV on a TV set has actually increased in share, from 49% to 54%.
In total, 29% of 16-24s’ total media and communications activity is text communication (an increase of 6pp since 2014), compared to 16% for all adults and just 4% for 65+ year olds.
8 For the purpose of this analysis, messaging includes instant messaging (IM), photo/video messaging (MMS) and text messaging (SMS)
22
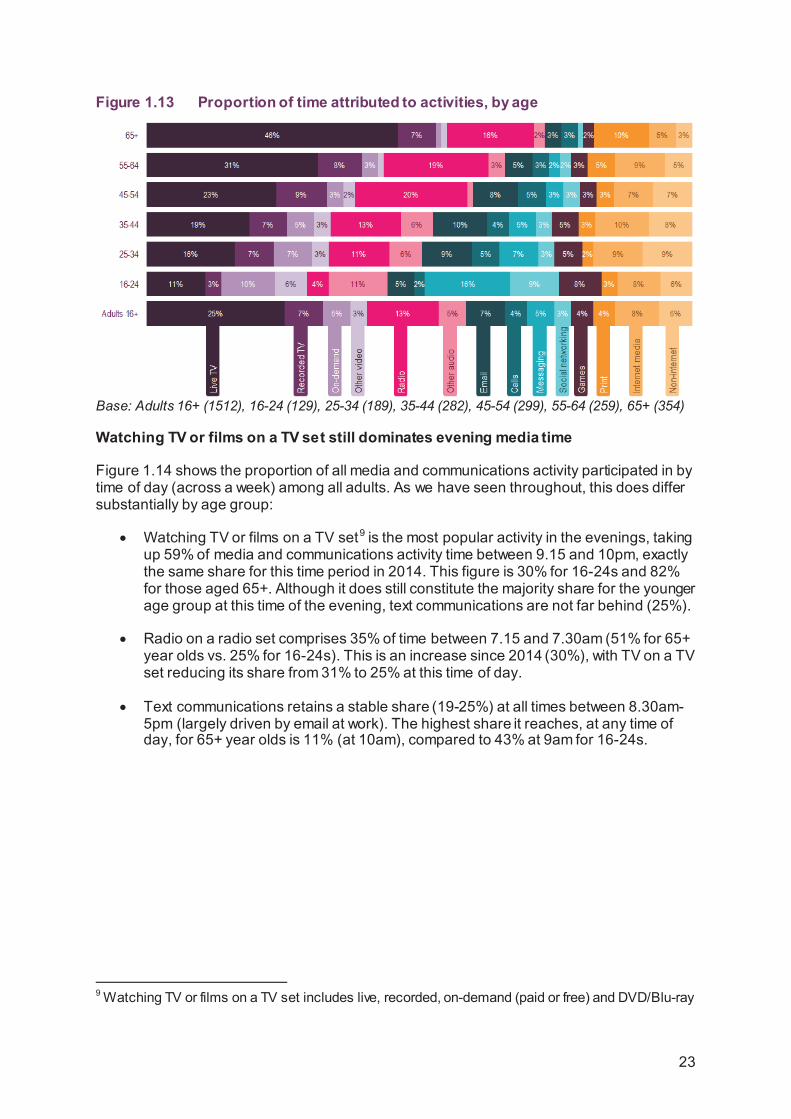
Figure 1.13 Proportion of time attributed to activities, by age
Base: Adults 16+ (1512), 16-24 (129), 25-34 (189), 35-44 (282), 45-54 (299), 55-64 (259), 65+ (354)
Watching TV or films on a TV set still dominates evening media time
Figure 1.14 shows the proportion of all media and communications activity participated in by time of day (across a week) among all adults. As we have seen throughout, this does differ substantially by age group:
• Watching TV or films on a TV set9 is the most popular activity in the evenings, taking up 59% of media and communications activity time between 9.15 and 10pm, exactly the same share for this time period in 2014. This figure is 30% for 16-24s and 82% for those aged 65+. Although it does still constitute the majority share for the younger age group at this time of the evening, text communications are not far behind (25%).
• Radio on a radio set comprises 35% of time between 7.15 and 7.30am (51% for 65+ year olds vs. 25% for 16-24s). This is an increase since 2014 (30%), with TV on a TV set reducing its share from 31% to 25% at this time of day.
• Text communications retains a stable share (19-25%) at all times between 8.30am-5pm (largely driven by email at work). The highest share it reaches, at any time of day, for 65+ year olds is 11% (at 10am), compared to 43% at 9am for 16-24s.
9 Watching TV or films on a TV set includes live, recorded, on-demand (paid or free) and DVD/Blu-ray
23
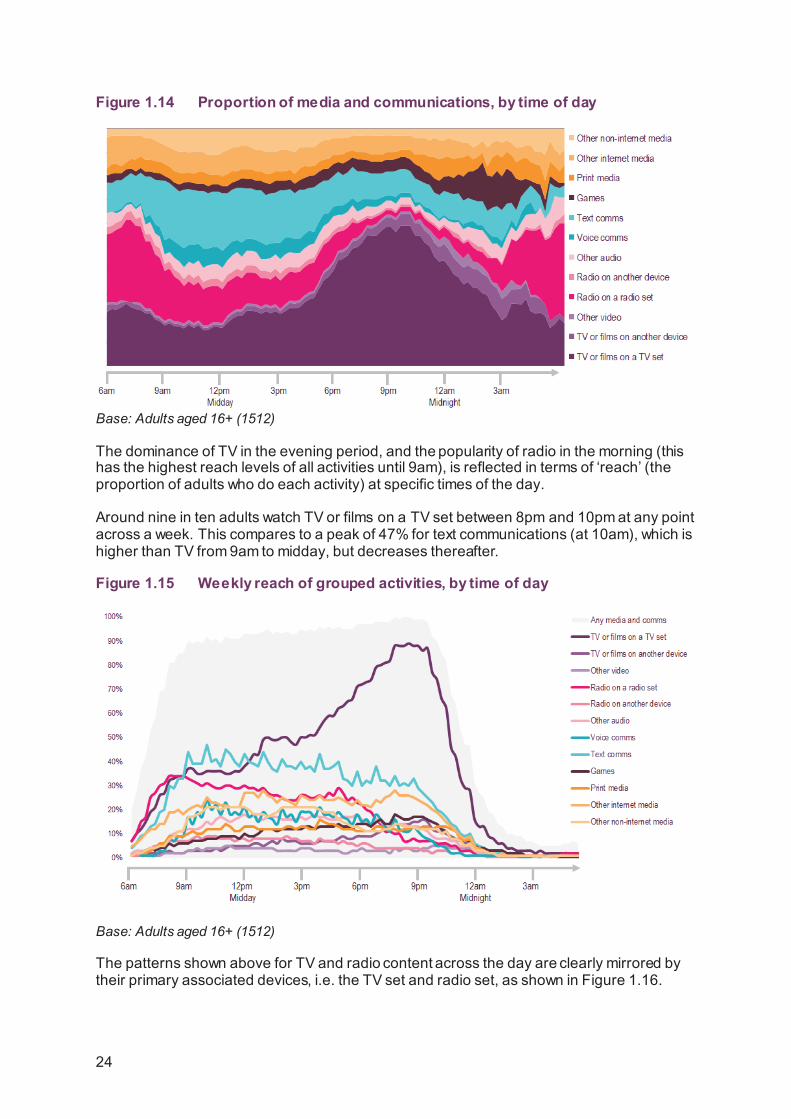
Figure 1.14 Proportion of media and communications, by time of day
Base: Adults aged 16+ (1512)
The dominance of TV in the evening period, and the popularity of radio in the morning (this has the highest reach levels of all activities until 9am), is reflected in terms of ‘reach’ (the proportion of adults who do each activity) at specific times of the day.
Around nine in ten adults watch TV or films on a TV set between 8pm and 10pm at any point across a week. This compares to a peak of 47% for text communications (at 10am), which is higher than TV from 9am to midday, but decreases thereafter.
Figure 1.15 Weekly reach of grouped activities, by time of day
Base: Adults aged 16+ (1512)
The patterns shown above for TV and radio content across the day are clearly mirrored by their primary associated devices, i.e. the TV set and radio set, as shown in Figure 1.16.
24
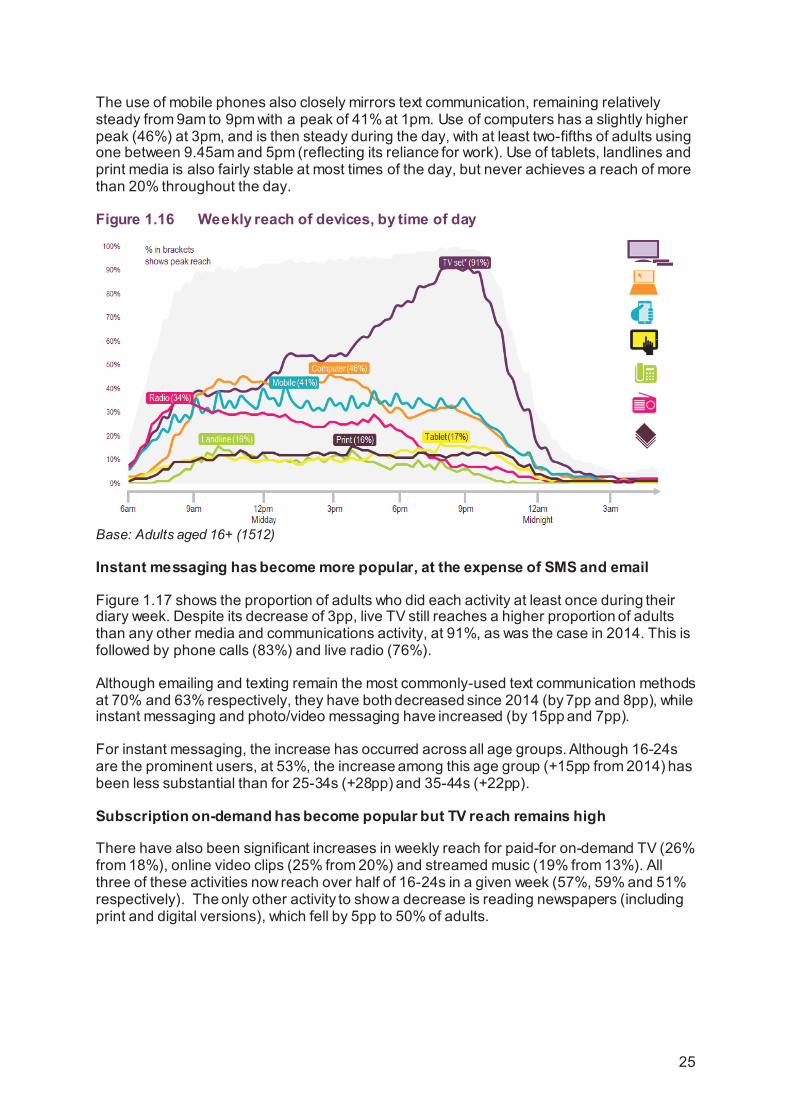
The use of mobile phones also closely mirrors text communication, remaining relatively steady from 9am to 9pm with a peak of 41% at 1pm. Use of computers has a slightly higher peak (46%) at 3pm, and is then steady during the day, with at least two-fifths of adults using one between 9.45am and 5pm (reflecting its reliance for work). Use of tablets, landlines and print media is also fairly stable at most times of the day, but never achieves a reach of more than 20% throughout the day.
Figure 1.16 Weekly reach of devices, by time of day
Base: Adults aged 16+ (1512)
Instant messaging has become more popular, at the expense of SMS and email
Figure 1.17 shows the proportion of adults who did each activity at least once during their diary week. Despite its decrease of 3pp, live TV still reaches a higher proportion of adults than any other media and communications activity, at 91%, as was the case in 2014. This is followed by phone calls (83%) and live radio (76%).
Although emailing and texting remain the most commonly-used text communication methods at 70% and 63% respectively, they have both decreased since 2014 (by 7pp and 8pp), while instant messaging and photo/video messaging have increased (by 15pp and 7pp).
For instant messaging, the increase has occurred across all age groups. Although 16-24s are the prominent users, at 53%, the increase among this age group (+15pp from 2014) has been less substantial than for 25-34s (+28pp) and 35-44s (+22pp).
Subscription on-demand has become popular but TV reach remains high
There have also been significant increases in weekly reach for paid-for on-demand TV (26% from 18%), online video clips (25% from 20%) and streamed music (19% from 13%). All three of these activities now reach over half of 16-24s in a given week (57%, 59% and 51% respectively). The only other activity to show a decrease is reading newspapers (including print and digital versions), which fell by 5pp to 50% of adults.
25
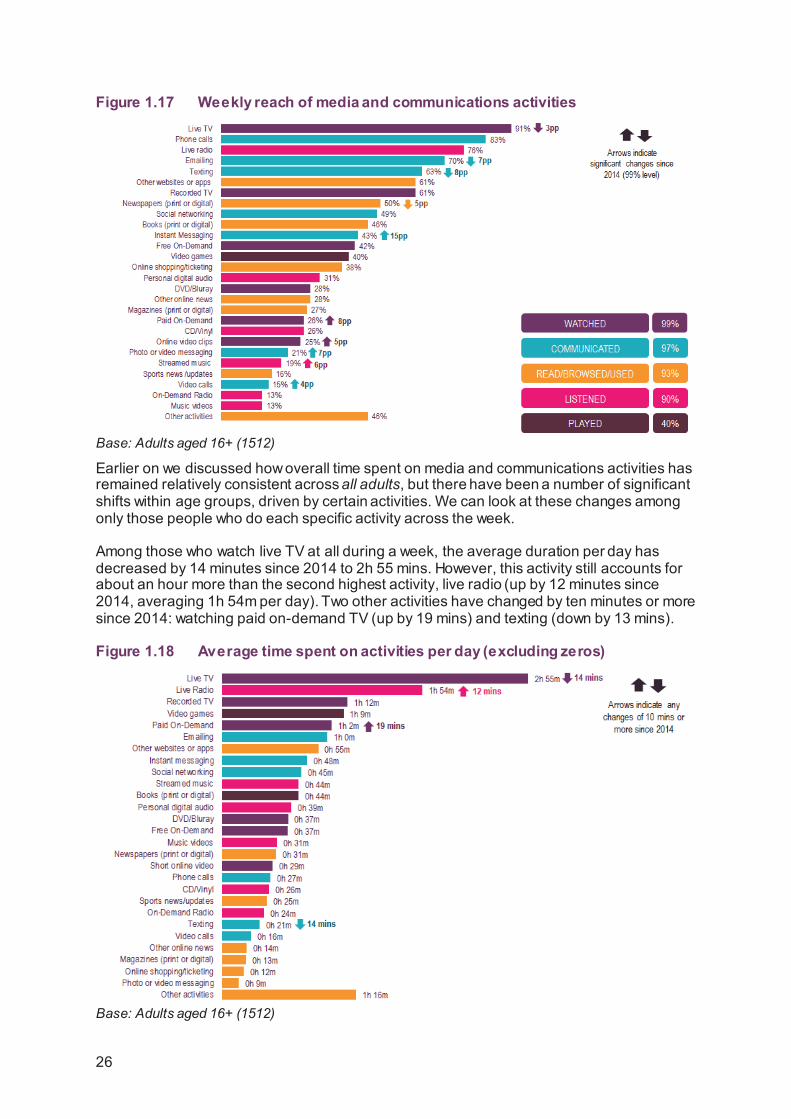
Figure 1.17 Weekly reach of media and communications activities
Base: Adults aged 16+ (1512)
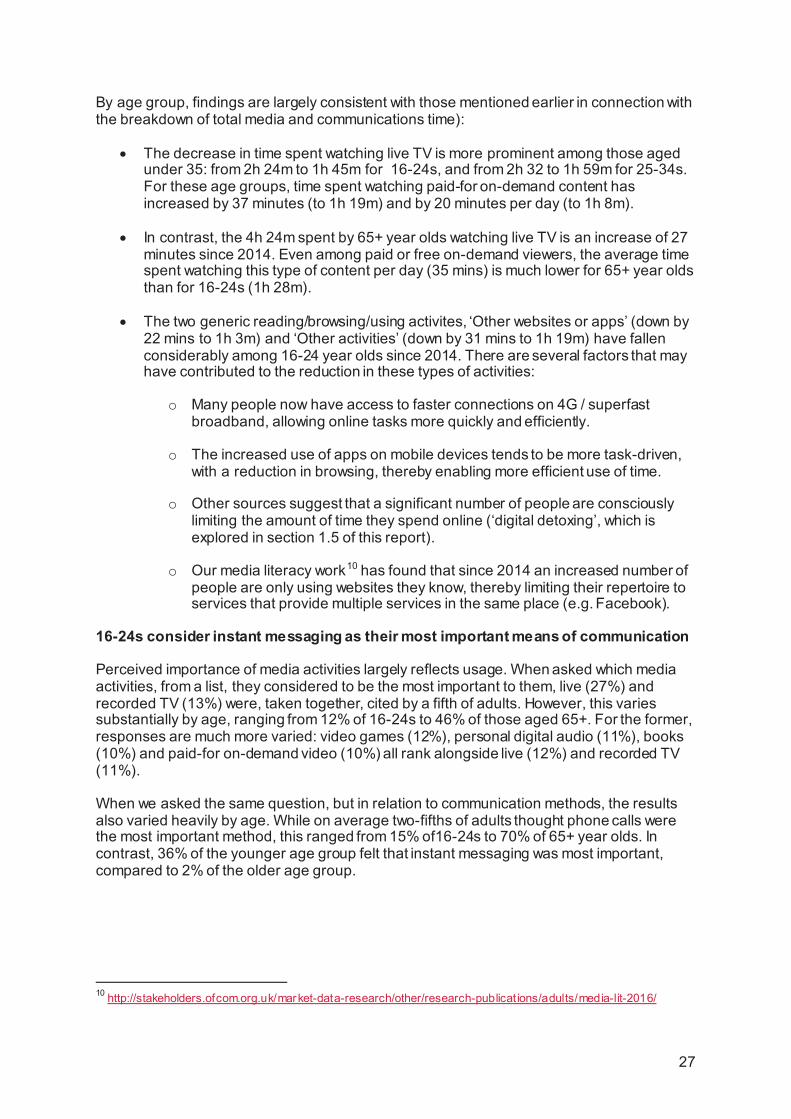
Earlier on we discussed how overall time spent on media and communications activities has remained relatively consistent across all adults, but there have been a number of significant shifts within age groups, driven by certain activities. We can look at these changes among only those people who do each specific activity across the week.
Among those who watch live TV at all during a week, the average duration per day has decreased by 14 minutes since 2014 to 2h 55 mins. However, this activity still accounts for about an hour more than the second highest activity, live radio (up by 12 minutes since 2014, averaging 1h 54m per day). Two other activities have changed by ten minutes or more since 2014: watching paid on-demand TV (up by 19 mins) and texting (down by 13 mins).
Figure 1.18 Average time spent on activities per day (excluding zeros)
Base: Adults aged 16+ (1512)
26
By age group, findings are largely consistent with those mentioned earlier in connection with the breakdown of total media and communications time):
• The decrease in time spent watching live TV is more prominent among those aged under 35: from 2h 24m to 1h 45m for 16-24s, and from 2h 32 to 1h 59m for 25-34s. For these age groups, time spent watching paid-for on-demand content has increased by 37 minutes (to 1h 19m) and by 20 minutes per day (to 1h 8m).
• In contrast, the 4h 24m spent by 65+ year olds watching live TV is an increase of 27 minutes since 2014. Even among paid or free on-demand viewers, the average time spent watching this type of content per day (35 mins) is much lower for 65+ year olds than for 16-24s (1h 28m).
• The two generic reading/browsing/using activites, ‘Other websites or apps’ (down by 22 mins to 1h 3m) and ‘Other activities’ (down by 31 mins to 1h 19m) have fallen considerably among 16-24 year olds since 2014. There are several factors that may have contributed to the reduction in these types of activities:
o Many people now have access to faster connections on 4G / superfast broadband, allowing online tasks more quickly and efficiently.
o The increased use of apps on mobile devices tends to be more task-driven, with a reduction in browsing, thereby enabling more efficient use of time.
o Other sources suggest that a significant number of people are consciously limiting the amount of time they spend online (‘digital detoxing’, which is explored in section 1.5 of this report).
o Our media literacy work10 has found that since 2014 an increased number of people are only using websites they know, thereby limiting their repertoire to services that provide multiple services in the same place (e.g. Facebook).
16-24s consider instant messaging as their most important means of communication
Perceived importance of media activities largely reflects usage. When asked which media activities, from a list, they considered to be the most important to them, live (27%) and recorded TV (13%) were, taken together, cited by a fifth of adults. However, this varies substantially by age, ranging from 12% of 16-24s to 46% of those aged 65+. For the former, responses are much more varied: video games (12%), personal digital audio (11%), books (10%) and paid-for on-demand video (10%) all rank alongside live (12%) and recorded TV (11%).
When we asked the same question, but in relation to communication methods, the results also varied heavily by age. While on average two-fifths of adults thought phone calls were the most important method, this ranged from 15% of16-24s to 70% of 65+ year olds. In contrast, 36% of the younger age group felt that instant messaging was most important, compared to 2% of the older age group.
10 http://stakeholders.ofcom.org.uk/market-data-research/other/research-publications/adults/media-lit-2016/
27
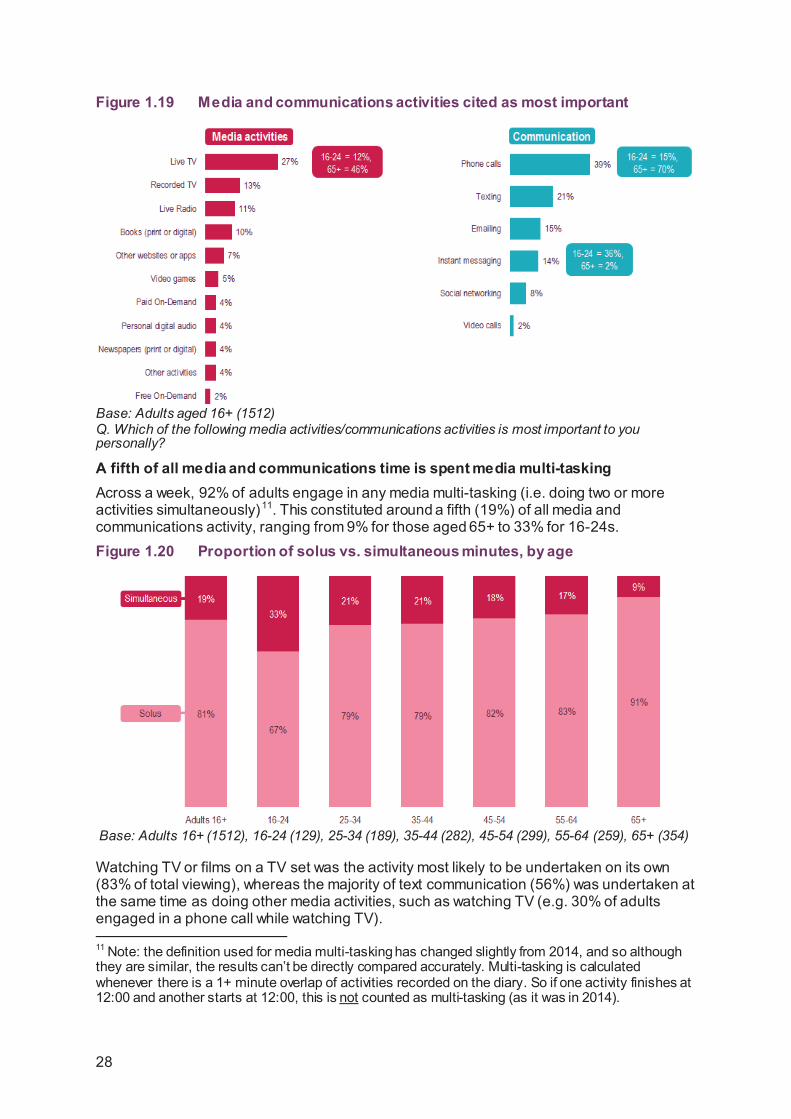
Figure 1.19 Media and communications activities cited as most important
Base: Adults aged 16+ (1512) Q. Which of the following media activities/communications activities is most important to you personally?
A fifth of all media and communications time is spent media multi-tasking Across a week, 92% of adults engage in any media multi-tasking (i.e. doing two or more activities simultaneously)11. This constituted around a fifth (19%) of all media and communications activity, ranging from 9% for those aged 65+ to 33% for 16-24s. Figure 1.20 Proportion of solus vs. simultaneous minutes, by age
Base: Adults 16+ (1512), 16-24 (129), 25-34 (189), 35-44 (282), 45-54 (299), 55-64 (259), 65+ (354)
Watching TV or films on a TV set was the activity most likely to be undertaken on its own (83% of total viewing), whereas the majority of text communication (56%) was undertaken at the same time as doing other media activities, such as watching TV (e.g. 30% of adults engaged in a phone call while watching TV).
11 Note: the definition used for media multi-tasking has changed slightly from 2014, and so although they are similar, the results can’t be directly compared accurately. Multi-tasking is calculated whenever there is a 1+ minute overlap of activities recorded on the diary. So if one activity finishes at 12:00 and another starts at 12:00, this is not counted as multi-tasking (as it was in 2014).
28
Figure 1.21 Proportion of solus vs. simultaneous minutes, by grouped activities
Base: Adults aged 16+ (1512)
Media multi-tasking can be segmented into a further two categories12: Meshing - When the simultaneous activities are related e.g. searching for info on a TV programme online while watching it. Stacking - When the simultaneous activities are not related e.g. instant messaging with a friend while watching TV (not in relation to the programme).
The research showed that doing two or more unrelated activities (‘stacking’) is much more common (done by 90% of people across the week) than doing two or more related activites (‘meshing’); just under four in ten do this in a week. This pattern is also shown in the overall distribution of time, with media stacking representing the largest share of multi-tasking (84%). Media stacking was most likely to occur in combination with watching TV or listening to the radio – watching live TV while talking on the phone was the most popular combination.
Figure 1.22 Proportion of stacking vs. meshing minutes, by activity types
Base: Adults aged 16+ (1512)
12 Note: This was a new element introduced in the 2016 study, so no comparable data are available for 2014.
29
1.5 Coping in a connected world 1.5.1 Introduction As we have seen in our Digital Day research in section 1.4, people spend the majority of their time awake engaged in media or communications activities, and they often spend more time involved in these activities than they do sleeping. This section builds on these findings, using research commissioned to investigate how people feel about being connected and what they see as the benefits and disadvantages. Indeed, daily internet use is now almost universal, with our research showing that nine in ten adults report going online every day. The internet also takes up a considerable proportion of people’s time each week, with one in ten (11%) stating that they access the internet more than 50 times a day and the average internet user estimating they spend 25 hours online each week, which rises to 29 hours for those aged 16-24 and 26 hours for teens.
This volume of internet use demonstrates how being online is seen as a core part of many people’s daily lives, with many respondents reporting feeling lost without it and admitting to being ‘hooked’ on their smartphones, tablets or other connected devices. Although the internet is valued by consumers for many reasons, ranging from facilitating communications to preventing boredom, time spent online has some drawbacks. Four in ten (41%) internet users think they spend too much time online, and some internet users have reported experiencing negative effects on their work or personal lives, on occasion causing them to neglect housework or arrive late for work; or simply by getting in the way of talking to friends or family.
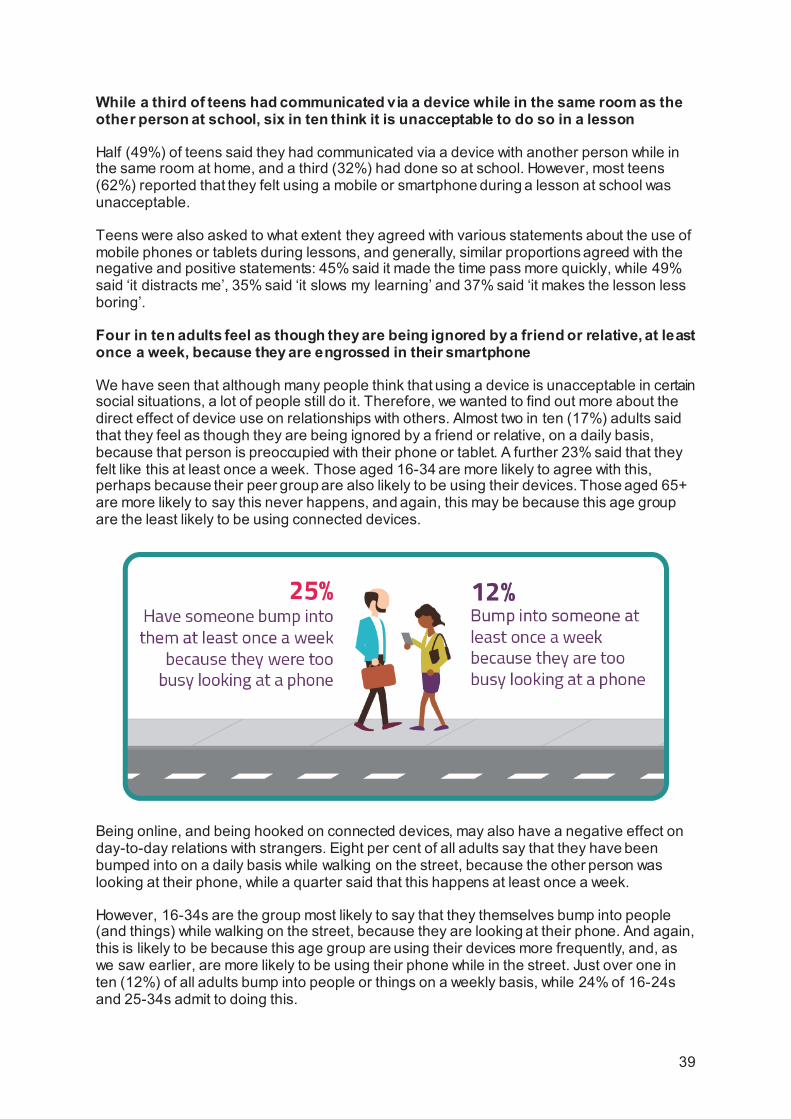
The effects of the internet on relations with friends and family features heavily in this section, and respondents have contrasting feelings about this. While some believe that being online can make communications easier and can help them keep in touch with others, many report feeling ignored while others are busy using a connected device. The internet is affecting traditional face-to-face relationships; with respondents admitting to instant messaging, texting or emailing others even when they are the same room as them. The effects of device immersion are not just on friends and family; a quarter of people report that they have been bumped into in the street, because another person was too busy looking at their phone to see where they were going.
It seems that as a society, we just can’t put our phones down. However, some people are starting to feel the downside of constant connectivity, and believe they spend too much time online. As a result, respondents are actively trying to reduce the time they spend online – some by taking a break from being connected.
Methodology: This section draws on new Ofcom research carried out between 31 March and 8 May 2016, conducted by BDRC Continental. This research used a mixed methodology comprising 1,401 online and 624 face-to-face interviews among adults aged 16+, and 500 online interviews among 12-15 year olds.
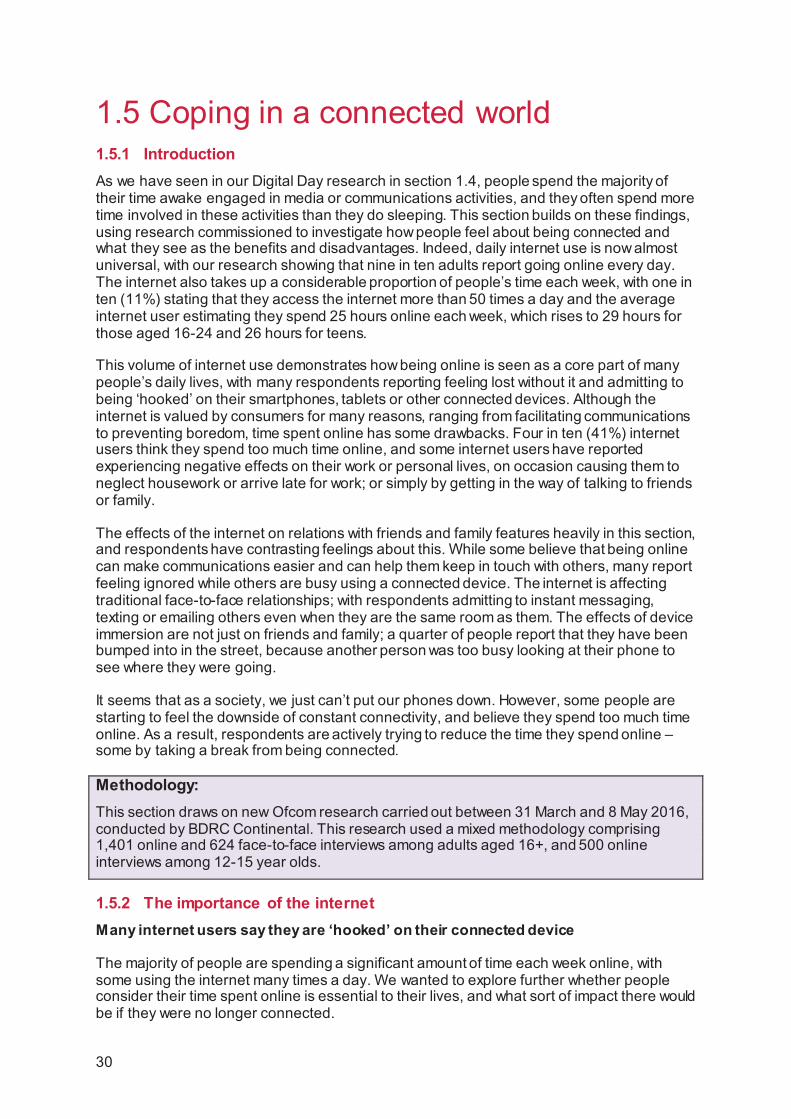
1.5.2 The importance of the internet Many internet users say they are ‘hooked’ on their connected device
The majority of people are spending a significant amount of time each week online, with some using the internet many times a day. We wanted to explore further whether people consider their time spent online is essential to their lives, and what sort of impact there would be if they were no longer connected.
30
When asked on a scale of one to ten how important the internet was to their daily lives, three-quarters (75%) of internet users said that it was ‘important’13. Mirroring the greater amount of time they spend online, compared to the older age groups, teens and 16-24s were significantly more likely than all internet users to rate the internet as important. This may be due to the fact that many in the younger age groups have grown up with constant connectivity and have not known life without the internet.
In addition to this, we asked respondents to say, on a scale of one to ten, how hooked they were on their connected device, and six in ten (59%) internet users said they were ‘hooked’ (between 7 and 10). Breaking this figure down, nearly a quarter (23%) were ‘very hooked’ (choosing 9 or 10) and 15% were ‘completely hooked’ (10). Relating to this, a third of internet users (34%) say that they find it ‘difficult to disconnect from the internet’.
The way people are ‘hooked’ is illustrated by their sleeping behaviour: half (51%) of all mobile users make sure their phone is within reaching distance when they go to bed, while a similar proportion say the last thing they do before they sleep (45%) and when they wake up (44%) is to check their phone. A quarter (27%) of mobile users said that when they wake up during the night, the first thing they do is check their phone.
Given these results, it comes as no surprise that some respondents report negative effects if the device they use to access the internet is taken away or inaccessible for some reason. Just under half (47%) said that they feel lost when they cannot access the internet, rising to six in ten (59%) of 16-24s. Fifteen per cent of internet users and a quarter (25%) of 16-24s said that when they are offline they feel nervous and/or anxious.
13 ‘Important’ refers to an answer between 7 and 10.
31
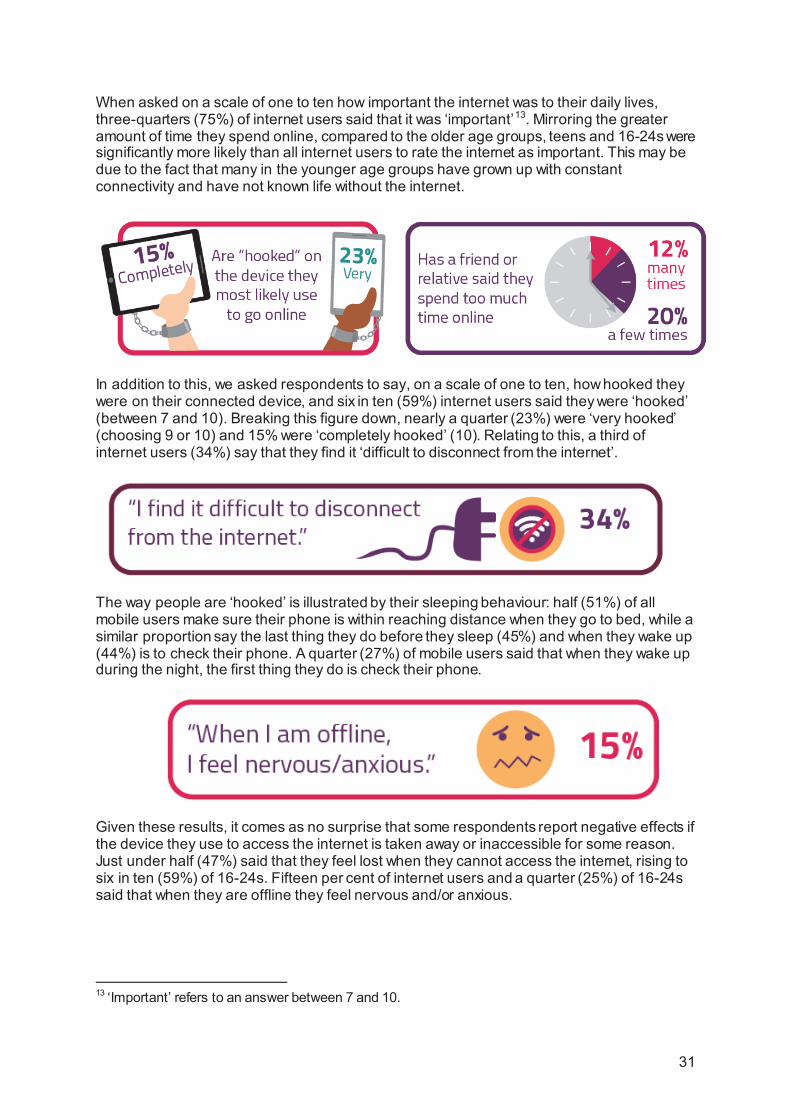
Six in ten 16-24s say they spend too much time online
While teens were among those most likely to say that the internet was ‘important’ to their daily lives, and to feel ‘hooked’ on their connected device, they were less ready to say they spent too much time online; just 37% agreed with this. This is possibly because teens have grown up with constant connectivity and largely associate with others who have similar online behaviour, so are less likely to think the time they spend online is too much. Those aged 16-24 were much more likely to say they spend too much time online, with six in ten agreeing.
While teens were less likely to say they used the internet too much, their friends and relatives held their online behaviour to a different standard. More than a third (35%) of teens said that a friend or relative had told them many times that they spend too much time online. This compares to 12% of all adult internet users.
Figure 1.23 Attitudes towards the internet and connected devices
Source: Ofcom research 2016 Base: All going online at least once a month (All: 1861, 16-24: 275, 65+: 309, teens: 494) Q.C1 How much do you agree or disagree with the following statements (I spend too much time online); Q.D1 On a scale of 1 to 10, how important is the internet to your daily life? Q.D2 If you had to choose a number between 1 and 10, where 1 represented 'I'm not at all hooked on my [device most likely to use to go online from b5] and 10 represented 'I’m completely hooked on my [device most likely to use to go online from b5]', which number would you choose for yourself?
Too much time online can have negative effects on work and home life
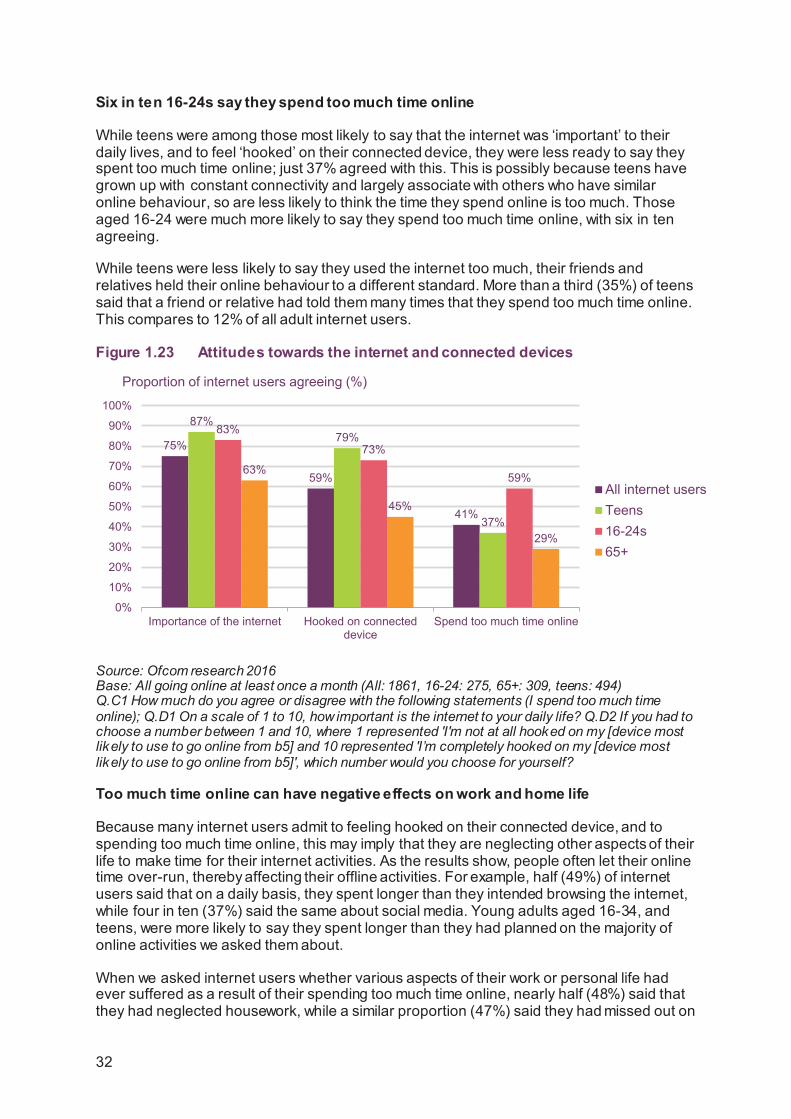
Because many internet users admit to feeling hooked on their connected device, and to spending too much time online, this may imply that they are neglecting other aspects of their life to make time for their internet activities. As the results show, people often let their online time over-run, thereby affecting their offline activities. For example, half (49%) of internet users said that on a daily basis, they spent longer than they intended browsing the internet, while four in ten (37%) said the same about social media. Young adults aged 16-34, and teens, were more likely to say they spent longer than they had planned on the majority of online activities we asked them about.
When we asked internet users whether various aspects of their work or personal life had ever suffered as a result of their spending too much time online, nearly half (48%) said that they had neglected housework, while a similar proportion (47%) said they had missed out on
75%
59%
41%
87%79%
37%
83%
73%
59%63%
45%
29%
0%
10%
20%
30%
40%
50%
60%
70%
80%
90%
100%
Importance of the internet Hooked on connecteddevice
Spend too much time online
All internet usersTeens16-24s65+
Proportion of internet users agreeing (%)
32
sleep, or were tired the next day, rising to 72% of 16-24s. Reflecting the broad agreement that being online interrupts face-to-face communications, a third (31%) said they had missed out on spending time with friends and family, while two in ten (22%) said they had been late for a meeting with friends or family.
Some internet users reported that spending too much time online had had negative effects on their work or job, with 20% saying they had neglected their work and 13% saying they had been late for work. As with the previous figures, 16-34s are more likely to agree that all areas of their work and personal life had been negatively affected by spending too much time online. For example, nearly four in ten (37%) of 16-24s said that they had neglected their work or job, and 27% had been late for work.
Figure 1.24 Reported negative effects of spending too much time online
Source: Ofcom research, 2016 Base: All going online at least once a month (All: 1861, 16-24: 275, 65+: 309) Q.D7 Have any of these parts of your work or personal life ever been negatively affected by spending too much time online?
Despite not thinking they spend too much time online, nearly eight in ten (78%) teens said they had been told off by their parents for spending too much time on the internet, while 72% said they had missed out on sleep or had been tired the next day. As with the impact on adults’ working lives, teens were quite likely to report negative effects on schoolwork; 60% agreed that they had neglected their schoolwork or studies, and 26% said they had been late for school. A large proportion of teens had sacrificed time socialising; 57% stated that they had missed out on spending time with friends or family, and 34% had been late for a meeting with friends or family.
37%
2%
13%
20%
22%
31%
47%
48%
20%
2%
27%
37%
37%
46%
72%
56%
51%
4%
1%
6%
6%
15%
26%
36%
0% 20% 40% 60% 80%
None of those mentioned
Other
Late for work
Neglected work/job
Late for meeting with friends/family
Missed out on spending time withfriends/family
Missed out on sleep/ tired the nextday
Neglected housework
65+16-24sAll internet users
Proportion of internet users agreeing (%)
33
1.5.3 Uses of the internet and effects of being online People use the internet for a wide range of uses, including as a way to prevent boredom
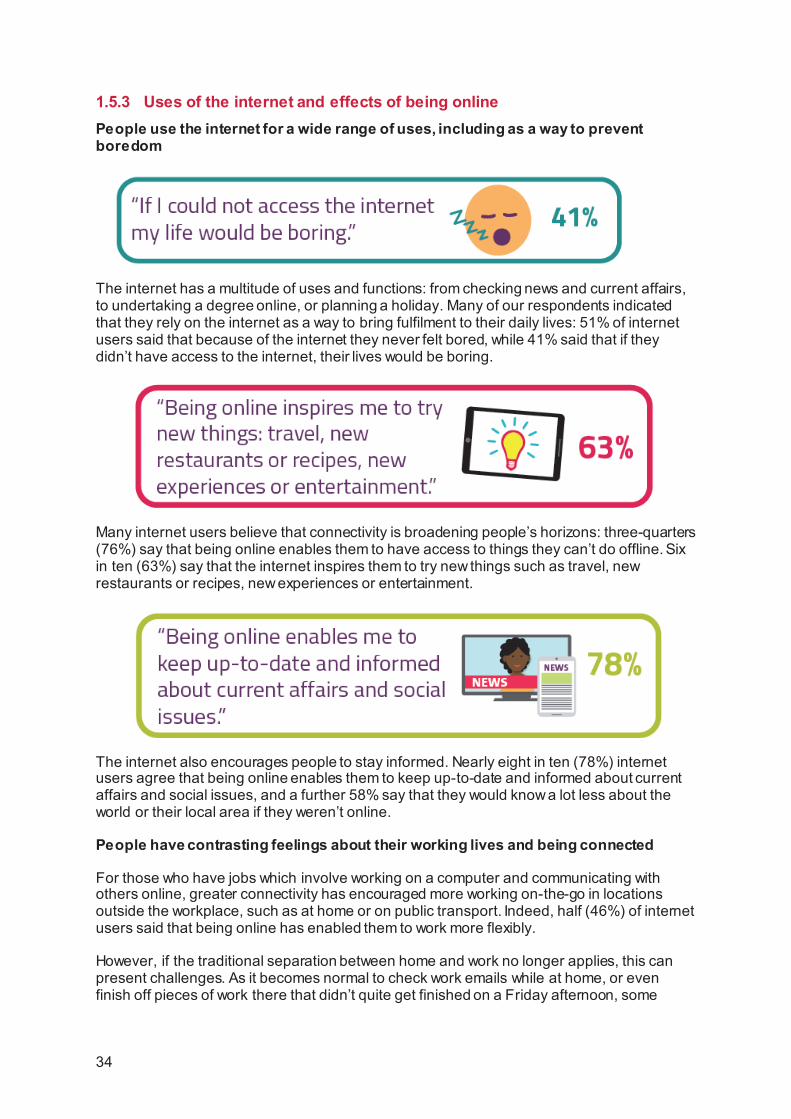
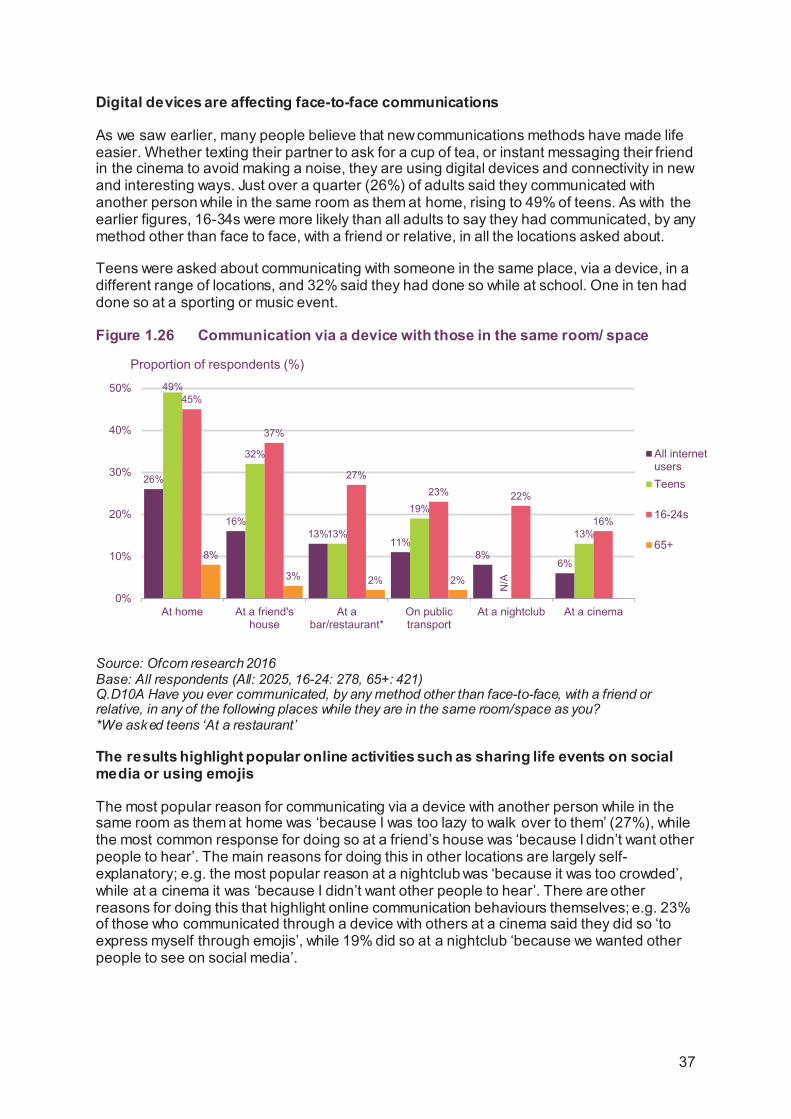
The internet has a multitude of uses and functions: from checking news and current affairs, to undertaking a degree online, or planning a holiday. Many of our respondents indicated that they rely on the internet as a way to bring fulfilment to their daily lives: 51% of internet users said that because of the internet they never felt bored, while 41% said that if they didn’t have access to the internet, their lives would be boring.
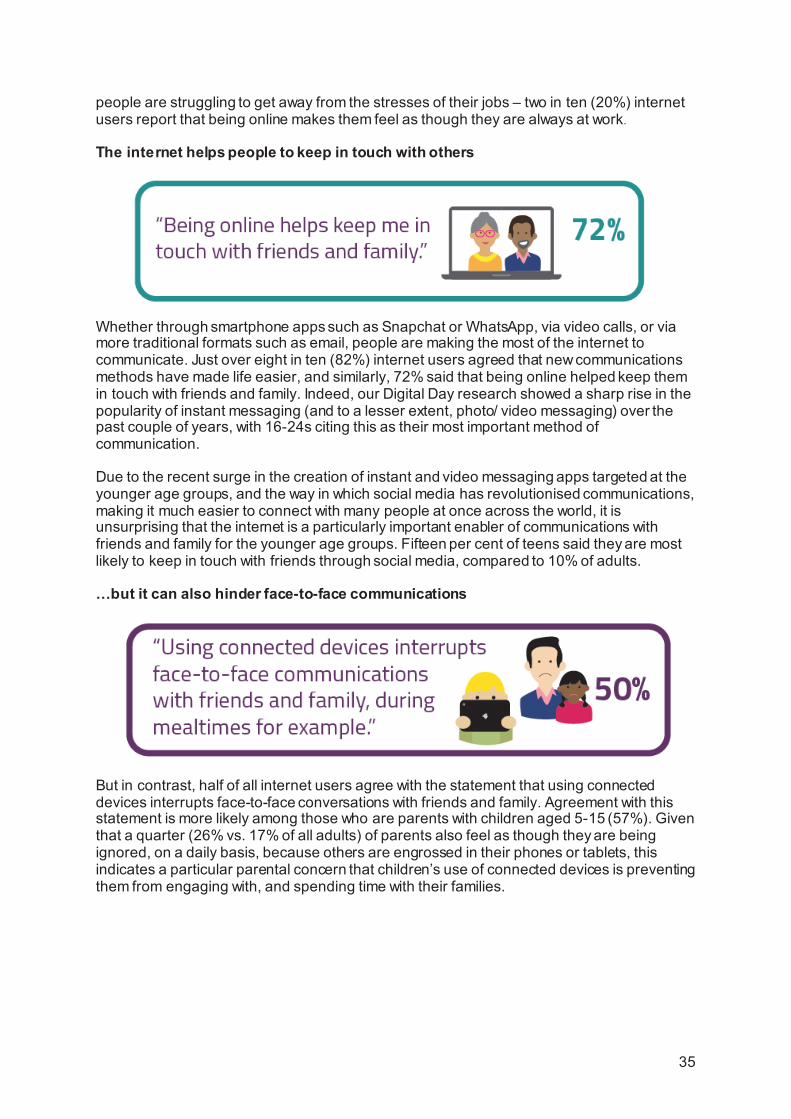
Many internet users believe that connectivity is broadening people’s horizons: three-quarters (76%) say that being online enables them to have access to things they can’t do offline. Six in ten (63%) say that the internet inspires them to try new things such as travel, new restaurants or recipes, new experiences or entertainment.
The internet also encourages people to stay informed. Nearly eight in ten (78%) internet users agree that being online enables them to keep up-to-date and informed about current affairs and social issues, and a further 58% say that they would know a lot less about the world or their local area if they weren’t online.
People have contrasting feelings about their working lives and being connected
For those who have jobs which involve working on a computer and communicating with others online, greater connectivity has encouraged more working on-the-go in locations outside the workplace, such as at home or on public transport. Indeed, half (46%) of internet users said that being online has enabled them to work more flexibly.
However, if the traditional separation between home and work no longer applies, this can present challenges. As it becomes normal to check work emails while at home, or even finish off pieces of work there that didn’t quite get finished on a Friday afternoon, some
34
people are struggling to get away from the stresses of their jobs – two in ten (20%) internet users report that being online makes them feel as though they are always at work.
The internet helps people to keep in touch with others
Whether through smartphone apps such as Snapchat or WhatsApp, via video calls, or via more traditional formats such as email, people are making the most of the internet to communicate. Just over eight in ten (82%) internet users agreed that new communications methods have made life easier, and similarly, 72% said that being online helped keep them in touch with friends and family. Indeed, our Digital Day research showed a sharp rise in the popularity of instant messaging (and to a lesser extent, photo/ video messaging) over the past couple of years, with 16-24s citing this as their most important method of communication.
Due to the recent surge in the creation of instant and video messaging apps targeted at the younger age groups, and the way in which social media has revolutionised communications, making it much easier to connect with many people at once across the world, it is unsurprising that the internet is a particularly important enabler of communications with friends and family for the younger age groups. Fifteen per cent of teens said they are most likely to keep in touch with friends through social media, compared to 10% of adults.
…but it can also hinder face-to-face communications
But in contrast, half of all internet users agree with the statement that using connected devices interrupts face-to-face conversations with friends and family. Agreement with this statement is more likely among those who are parents with children aged 5-15 (57%). Given that a quarter (26% vs. 17% of all adults) of parents also feel as though they are being ignored, on a daily basis, because others are engrossed in their phones or tablets, this indicates a particular parental concern that children’s use of connected devices is preventing them from engaging with, and spending time with their families.
35
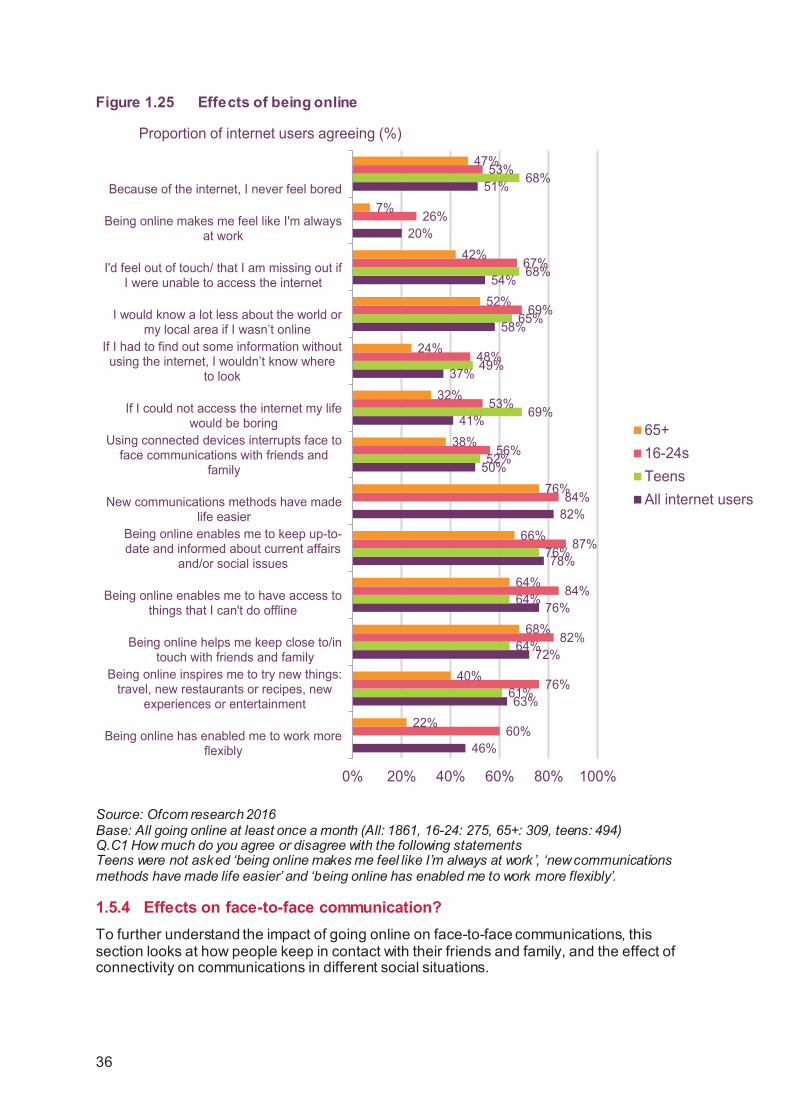
Figure 1.25 Effects of being online
Source: Ofcom research 2016 Base: All going online at least once a month (All: 1861, 16-24: 275, 65+: 309, teens: 494) Q.C1 How much do you agree or disagree with the following statements Teens were not asked ‘being online makes me feel like I’m always at work ’, ‘new communications methods have made life easier’ and ‘being online has enabled me to work more flexibly’.
1.5.4 Effects on face-to-face communication? To further understand the impact of going online on face-to-face communications, this section looks at how people keep in contact with their friends and family, and the effect of connectivity on communications in different social situations.
46%
63%
72%
76%
78%
82%
50%
41%
37%
58%
54%
20%
51%
61%
64%
64%
76%
52%
69%
49%
65%
68%
68%
60%
76%
82%
84%
87%
84%
56%
53%
48%
69%
67%
26%
53%
22%
40%
68%
64%
66%
76%
38%
32%
24%
52%
42%
7%
47%
0% 20% 40% 60% 80% 100%
Being online has enabled me to work moreflexibly
Being online inspires me to try new things:travel, new restaurants or recipes, new
experiences or entertainment
Being online helps me keep close to/intouch with friends and family
Being online enables me to have access tothings that I can't do offline
Being online enables me to keep up-to-date and informed about current affairs
and/or social issues
New communications methods have madelife easier
Using connected devices interrupts face toface communications with friends and
family
If I could not access the internet my lifewould be boring
If I had to find out some information without using the internet, I wouldn’t know where
to look
I would know a lot less about the world or my local area if I wasn’t online
I'd feel out of touch/ that I am missing out ifI were unable to access the internet
Being online makes me feel like I'm alwaysat work
Because of the internet, I never feel bored
65+16-24sTeensAll internet users
Proportion of internet users agreeing (%)
36
Digital devices are affecting face-to-face communications
As we saw earlier, many people believe that new communications methods have made life easier. Whether texting their partner to ask for a cup of tea, or instant messaging their friend in the cinema to avoid making a noise, they are using digital devices and connectivity in new and interesting ways. Just over a quarter (26%) of adults said they communicated with another person while in the same room as them at home, rising to 49% of teens. As with the earlier figures, 16-34s were more likely than all adults to say they had communicated, by any method other than face to face, with a friend or relative, in all the locations asked about.
Teens were asked about communicating with someone in the same place, via a device, in a different range of locations, and 32% said they had done so while at school. One in ten had done so at a sporting or music event.
Figure 1.26 Communication via a device with those in the same room/ space
Source: Ofcom research 2016 Base: All respondents (All: 2025, 16-24: 278, 65+: 421) Q.D10A Have you ever communicated, by any method other than face-to-face, with a friend or relative, in any of the following places while they are in the same room/space as you? *We asked teens ‘At a restaurant’
The results highlight popular online activities such as sharing life events on social media or using emojis
The most popular reason for communicating via a device with another person while in the same room as them at home was ‘because I was too lazy to walk over to them’ (27%), while the most common response for doing so at a friend’s house was ‘because I didn’t want other people to hear’. The main reasons for doing this in other locations are largely self-explanatory; e.g. the most popular reason at a nightclub was ‘because it was too crowded’, while at a cinema it was ‘because I didn’t want other people to hear’. There are other reasons for doing this that highlight online communication behaviours themselves; e.g. 23% of those who communicated through a device with others at a cinema said they did so ‘to express myself through emojis’, while 19% did so at a nightclub ‘because we wanted other people to see on social media’.
26%
16%13%
11%8%
6%
49%
32%
13%
19%
13%
45%
37%
27%23% 22%
16%
8%
3% 2% 2%
0%
10%
20%
30%
40%
50%
At home At a friend'shouse
At abar/restaurant*
On publictransport
At a nightclub At a cinema
All internetusersTeens
16-24s
65+
Proportion of respondents (%)
N/A
37
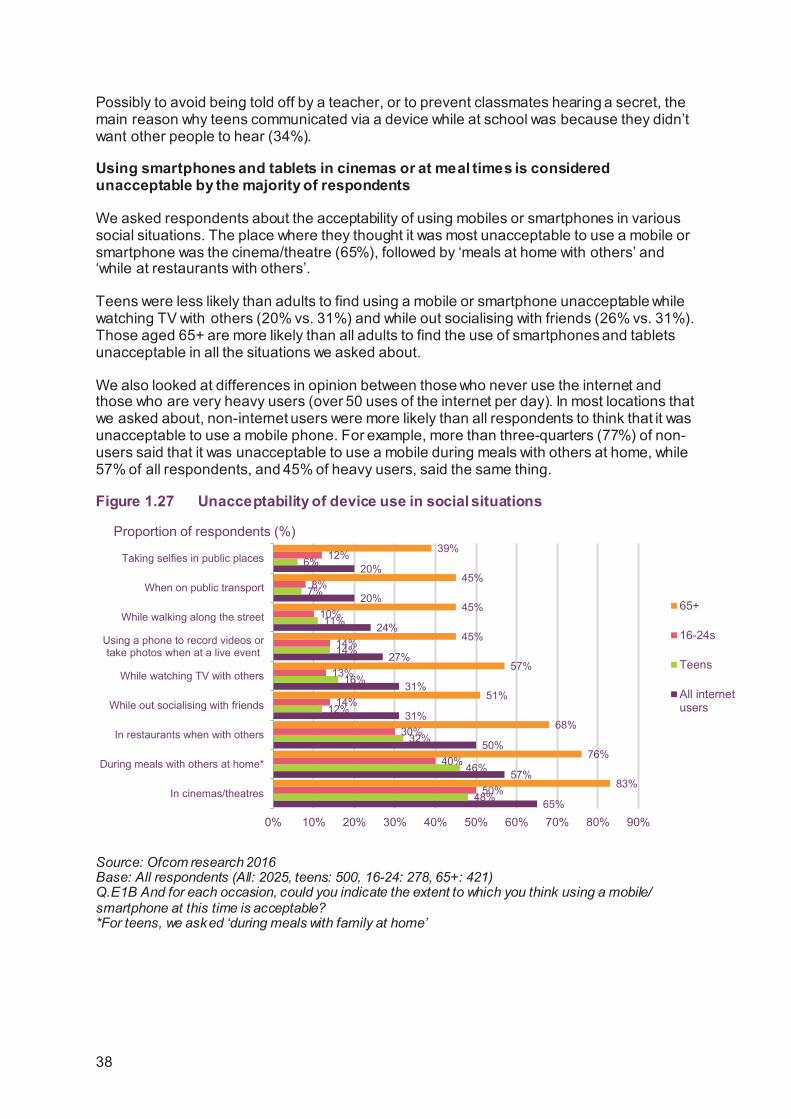
Possibly to avoid being told off by a teacher, or to prevent classmates hearing a secret, the main reason why teens communicated via a device while at school was because they didn’t want other people to hear (34%).
Using smartphones and tablets in cinemas or at meal times is considered unacceptable by the majority of respondents
We asked respondents about the acceptability of using mobiles or smartphones in various social situations. The place where they thought it was most unacceptable to use a mobile or smartphone was the cinema/theatre (65%), followed by ‘meals at home with others’ and ‘while at restaurants with others’.
Teens were less likely than adults to find using a mobile or smartphone unacceptable while watching TV with others (20% vs. 31%) and while out socialising with friends (26% vs. 31%). Those aged 65+ are more likely than all adults to find the use of smartphones and tablets unacceptable in all the situations we asked about.
We also looked at differences in opinion between those who never use the internet and those who are very heavy users (over 50 uses of the internet per day). In most locations that we asked about, non-internet users were more likely than all respondents to think that it was unacceptable to use a mobile phone. For example, more than three-quarters (77%) of non-users said that it was unacceptable to use a mobile during meals with others at home, while 57% of all respondents, and 45% of heavy users, said the same thing.
Figure 1.27 Unacceptability of device use in social situations
Source: Ofcom research 2016 Base: All respondents (All: 2025, teens: 500, 16-24: 278, 65+: 421) Q.E1B And for each occasion, could you indicate the extent to which you think using a mobile/ smartphone at this time is acceptable? *For teens, we asked ‘during meals with family at home’
65%
57%
50%
31%
31%
27%
24%
20%
20%
48%
46%
32%
12%
16%
14%
11%
7%
6%
50%
40%
30%
14%
13%
14%
10%
8%
12%
83%
76%
68%
51%
57%
45%
45%
45%
39%
0% 10% 20% 30% 40% 50% 60% 70% 80% 90%
In cinemas/theatres
During meals with others at home*
In restaurants when with others
While out socialising with friends
While watching TV with others
Using a phone to record videos ortake photos when at a live event
While walking along the street
When on public transport
Taking selfies in public places
65+
16-24s
Teens
All internetusers
Proportion of respondents (%)
38
While a third of teens had communicated via a device while in the same room as the other person at school, six in ten think it is unacceptable to do so in a lesson
Half (49%) of teens said they had communicated via a device with another person while in the same room at home, and a third (32%) had done so at school. However, most teens (62%) reported that they felt using a mobile or smartphone during a lesson at school was unacceptable.
Teens were also asked to what extent they agreed with various statements about the use of mobile phones or tablets during lessons, and generally, similar proportions agreed with the negative and positive statements: 45% said it made the time pass more quickly, while 49% said ‘it distracts me’, 35% said ‘it slows my learning’ and 37% said ‘it makes the lesson less boring’.
Four in ten adults feel as though they are being ignored by a friend or relative, at least once a week, because they are engrossed in their smartphone
We have seen that although many people think that using a device is unacceptable in certain social situations, a lot of people still do it. Therefore, we wanted to find out more about the direct effect of device use on relationships with others. Almost two in ten (17%) adults said that they feel as though they are being ignored by a friend or relative, on a daily basis, because that person is preoccupied with their phone or tablet. A further 23% said that they felt like this at least once a week. Those aged 16-34 are more likely to agree with this, perhaps because their peer group are also likely to be using their devices. Those aged 65+ are more likely to say this never happens, and again, this may be because this age group are the least likely to be using connected devices.
Being online, and being hooked on connected devices, may also have a negative effect on day-to-day relations with strangers. Eight per cent of all adults say that they have been bumped into on a daily basis while walking on the street, because the other person was looking at their phone, while a quarter said that this happens at least once a week.
However, 16-34s are the group most likely to say that they themselves bump into people (and things) while walking on the street, because they are looking at their phone. And again, this is likely to be because this age group are using their devices more frequently, and, as we saw earlier, are more likely to be using their phone while in the street. Just over one in ten (12%) of all adults bump into people or things on a weekly basis, while 24% of 16-24s and 25-34s admit to doing this.
39
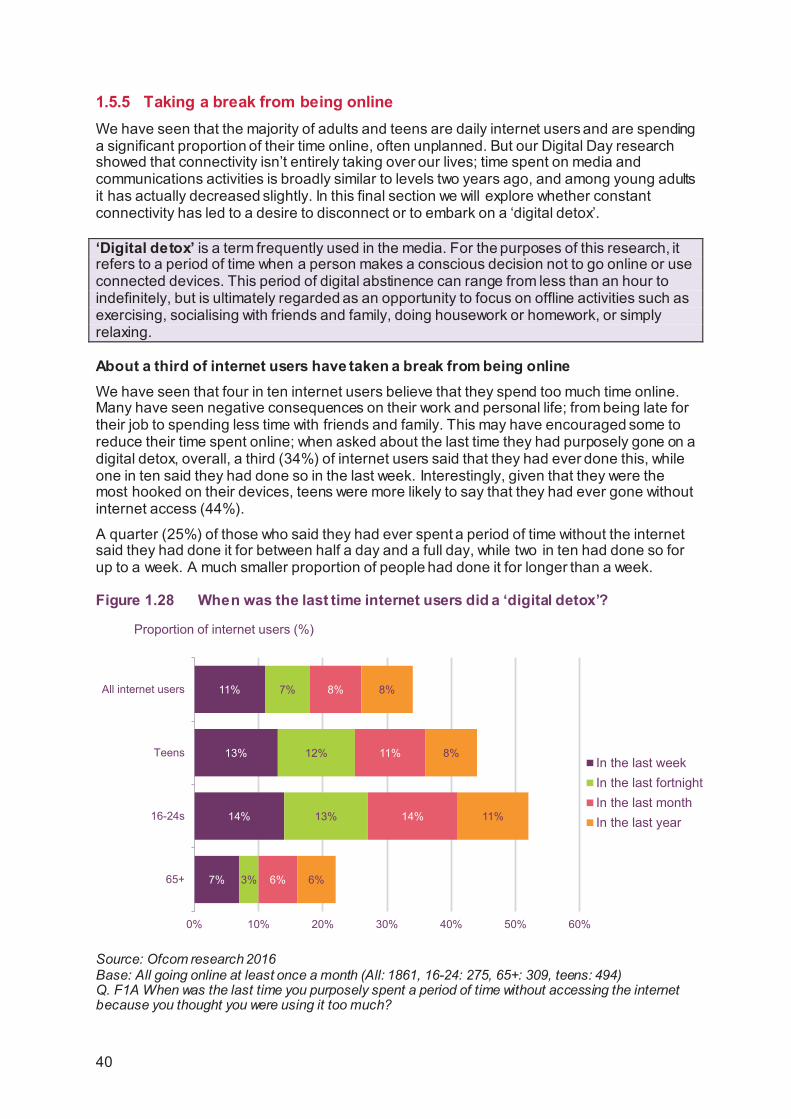
1.5.5 Taking a break from being online We have seen that the majority of adults and teens are daily internet users and are spending a significant proportion of their time online, often unplanned. But our Digital Day research showed that connectivity isn’t entirely taking over our lives; time spent on media and communications activities is broadly similar to levels two years ago, and among young adults it has actually decreased slightly. In this final section we will explore whether constant connectivity has led to a desire to disconnect or to embark on a ‘digital detox’.
‘Digital detox’ is a term frequently used in the media. For the purposes of this research, it refers to a period of time when a person makes a conscious decision not to go online or use connected devices. This period of digital abstinence can range from less than an hour to indefinitely, but is ultimately regarded as an opportunity to focus on offline activities such as exercising, socialising with friends and family, doing housework or homework, or simply relaxing.
About a third of internet users have taken a break from being online We have seen that four in ten internet users believe that they spend too much time online. Many have seen negative consequences on their work and personal life; from being late for their job to spending less time with friends and family. This may have encouraged some to reduce their time spent online; when asked about the last time they had purposely gone on a digital detox, overall, a third (34%) of internet users said that they had ever done this, while one in ten said they had done so in the last week. Interestingly, given that they were the most hooked on their devices, teens were more likely to say that they had ever gone without internet access (44%).
A quarter (25%) of those who said they had ever spent a period of time without the internet said they had done it for between half a day and a full day, while two in ten had done so for up to a week. A much smaller proportion of people had done it for longer than a week.
Figure 1.28 When was the last time internet users did a ‘digital detox’?
Source: Ofcom research 2016 Base: All going online at least once a month (All: 1861, 16-24: 275, 65+: 309, teens: 494) Q. F1A When was the last time you purposely spent a period of time without accessing the internet because you thought you were using it too much?
7%
14%
13%
11%
3%
13%
12%
7%
6%
14%
11%
8%
6%
11%
8%
8%
0% 10% 20% 30% 40% 50% 60%
65+
16-24s
Teens
All internet users
In the last weekIn the last fortnightIn the last monthIn the last year
Proportion of internet users (%)
40
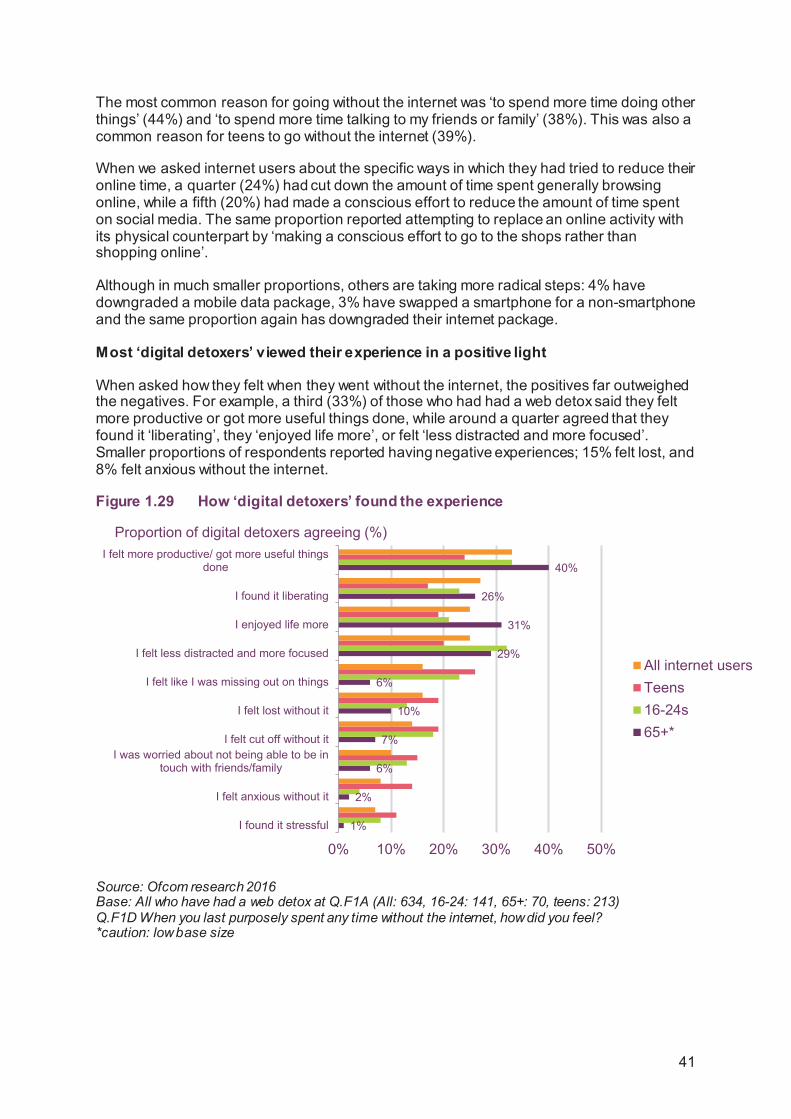
The most common reason for going without the internet was ‘to spend more time doing other things’ (44%) and ‘to spend more time talking to my friends or family’ (38%). This was also a common reason for teens to go without the internet (39%).
When we asked internet users about the specific ways in which they had tried to reduce their online time, a quarter (24%) had cut down the amount of time spent generally browsing online, while a fifth (20%) had made a conscious effort to reduce the amount of time spent on social media. The same proportion reported attempting to replace an online activity with its physical counterpart by ‘making a conscious effort to go to the shops rather than shopping online’.
Although in much smaller proportions, others are taking more radical steps: 4% have downgraded a mobile data package, 3% have swapped a smartphone for a non-smartphone and the same proportion again has downgraded their internet package.
Most ‘digital detoxers’ viewed their experience in a positive light
When asked how they felt when they went without the internet, the positives far outweighed the negatives. For example, a third (33%) of those who had had a web detox said they felt more productive or got more useful things done, while around a quarter agreed that they found it ‘liberating’, they ‘enjoyed life more’, or felt ‘less distracted and more focused’. Smaller proportions of respondents reported having negative experiences; 15% felt lost, and 8% felt anxious without the internet.
Figure 1.29 How ‘digital detoxers’ found the experience
Source: Ofcom research 2016 Base: All who have had a web detox at Q.F1A (All: 634, 16-24: 141, 65+: 70, teens: 213) Q.F1D When you last purposely spent any time without the internet, how did you feel? *caution: low base size
1%
2%
6%
7%
10%
6%
29%
31%
26%
40%
0% 10% 20% 30% 40% 50%
I found it stressful
I felt anxious without it
I was worried about not being able to be intouch with friends/family
I felt cut off without it
I felt lost without it
I felt like I was missing out on things
I felt less distracted and more focused
I enjoyed life more
I found it liberating
I felt more productive/ got more useful thingsdone
All internet usersTeens16-24s65+*
Proportion of digital detoxers agreeing (%)
41
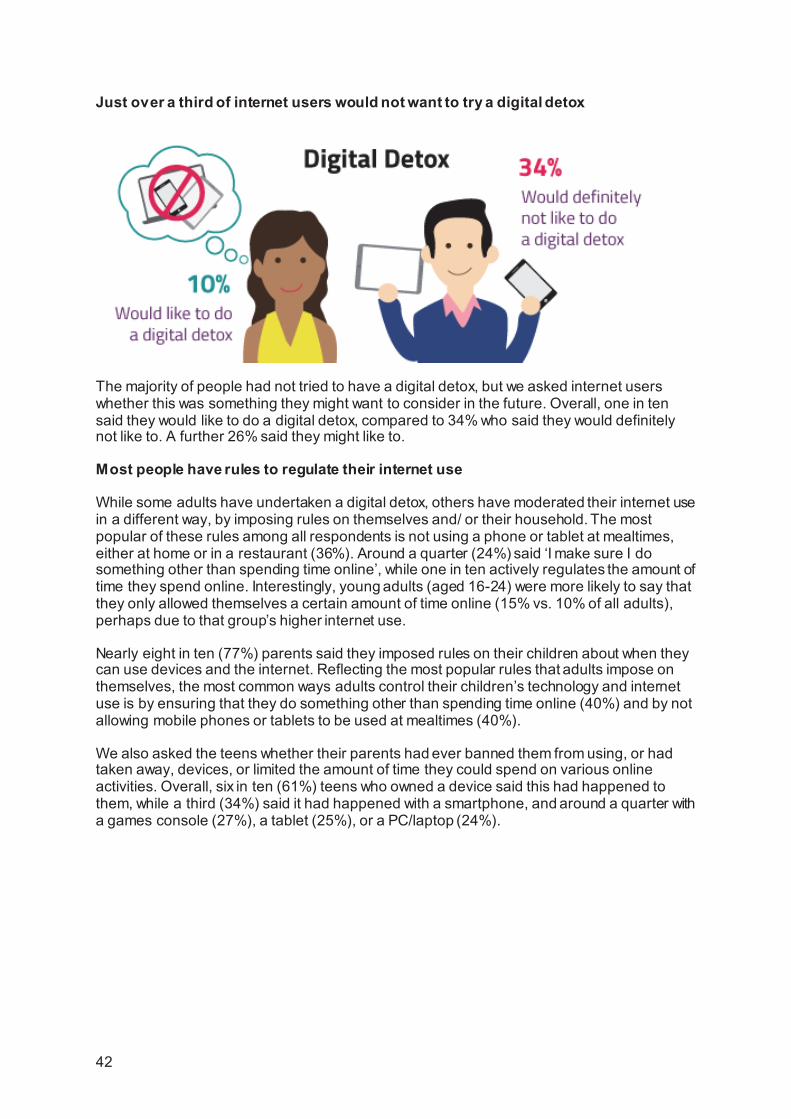
Just over a third of internet users would not want to try a digital detox
The majority of people had not tried to have a digital detox, but we asked internet users whether this was something they might want to consider in the future. Overall, one in ten said they would like to do a digital detox, compared to 34% who said they would definitely not like to. A further 26% said they might like to.
Most people have rules to regulate their internet use
While some adults have undertaken a digital detox, others have moderated their internet use in a different way, by imposing rules on themselves and/ or their household. The most popular of these rules among all respondents is not using a phone or tablet at mealtimes, either at home or in a restaurant (36%). Around a quarter (24%) said ‘I make sure I do something other than spending time online’, while one in ten actively regulates the amount of time they spend online. Interestingly, young adults (aged 16-24) were more likely to say that they only allowed themselves a certain amount of time online (15% vs. 10% of all adults), perhaps due to that group’s higher internet use.
Nearly eight in ten (77%) parents said they imposed rules on their children about when they can use devices and the internet. Reflecting the most popular rules that adults impose on themselves, the most common ways adults control their children’s technology and internet use is by ensuring that they do something other than spending time online (40%) and by not allowing mobile phones or tablets to be used at mealtimes (40%).
We also asked the teens whether their parents had ever banned them from using, or had taken away, devices, or limited the amount of time they could spend on various online activities. Overall, six in ten (61%) teens who owned a device said this had happened to them, while a third (34%) said it had happened with a smartphone, and around a quarter with a games console (27%), a tablet (25%), or a PC/laptop (24%).
42
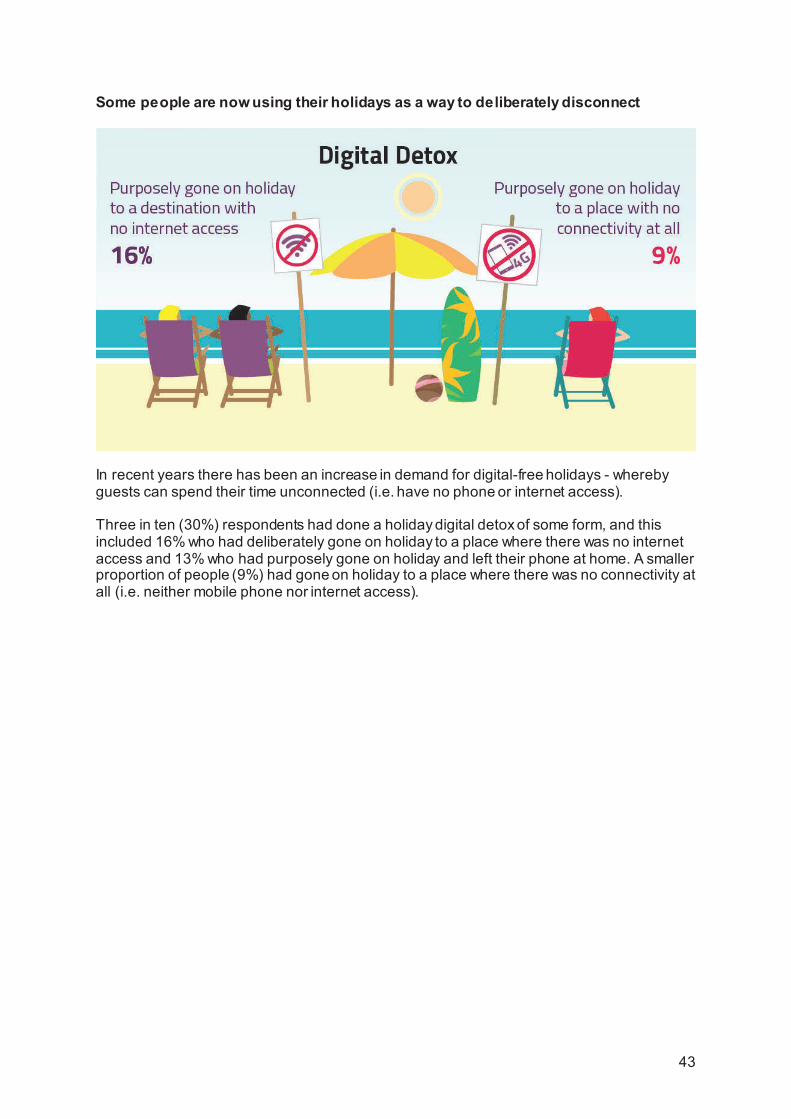
Some people are now using their holidays as a way to deliberately disconnect
In recent years there has been an increase in demand for digital-free holidays - whereby guests can spend their time unconnected (i.e. have no phone or internet access).
Three in ten (30%) respondents had done a holiday digital detox of some form, and this included 16% who had deliberately gone on holiday to a place where there was no internet access and 13% who had purposely gone on holiday and left their phone at home. A smaller proportion of people (9%) had gone on holiday to a place where there was no connectivity at all (i.e. neither mobile phone nor internet access).
43

1.6 A forward look: spectrum, innovations and technology 1.6.1 The future of spectrum ‘Spectrum’ is the airwaves over which all wireless communications operate, and Ofcom is responsible for its management. Mobile phone networks, TV and radio broadcasting, wireless internet, sat-nav, air traffic control, and the emergency services are just some of the services that use spectrum.
In this section, Philip Marnick, Ofcom’s Group Director, Spectrum, discusses how the increased take-up of devices and use of services affects the allocation of spectrum, and considers what the next generation of services that require the use of spectrum are likely to be.
Philip is responsible for setting and implementing Ofcom’s strategy for managing spectrum, which includes clearing, awarding and licensing it. He has 30 years’ experience in wireless communications and joined Ofcom from industry. He has worked in the wireless industry almost his entire career.
Spectrum – past and present
Spectrum is something you cannot see or touch, but it is the key ingredient that enables almost everything we do: opening our cars, the radar that keep aeroplanes safe as they take us on holiday, through to the mobile phones we use to keep in touch.
Heinrich Hertz was the first to prove, in the 1880s, that radio waves could be transmitted between two points. However, he did not believe it had any practical benefit. How wrong could he be? His discovery is central to our modern life, and units of radio frequency are named after him.
We have made a lot of progress since Hertz made his discovery and now so much of what we do – the way we communicate and entertain ourselves – uses wireless communication. For example, the roll-out of 4G mobile services has continued this year, and they are now available to almost 98% of UK premises. Take-up of 4G services has increased by 18pp, to reach almost half of the population. This has led to greater connectivity while on the move, and thanks to technology, including wireless technology, and multi-tasking, 16-24 year olds are now able to cram 13 hours 11 minutes of media and communication activity into just under 9 hours.
Even the humble radio – for so many years the bedrock of entertainment – has continued to evolve as more than half of households have digital radios (DAB).
Ofcom’s role in managing spectrum
One of Ofcom’s key jobs is to manage the UK’s spectrum to enable existing services to grow and new services to develop and come to the market. We often hear about the demands for more spectrum to support the increasing demand for mobile data, which is expected to increase by as much as 31 times by 2020 in Western Europe.
Growing smartphone take-up is a key driver of mobile data demand. Seventy-one per cent of people have a smartphone, and our Digital Day research shows that for 16-24 year olds this
45
is the device they use the most. People are also using more data-heavy applications on their devices – making video calls and streaming video and audio.
As most spectrum is occupied, we have to consider moving one service to make way for another; for example, squeezing up TV to make more spectrum (700MHz) available for mobile. As part of this, and given the high levels of use of wireless microphones, we are now enabling these to share with aeronautical services. We are already looking at the spectrum needs of 5G, which will provide higher capacity networks that are more responsive and can offer faster speeds. This will open up a new range of frequencies in the millimetric bands – an area of spectrum in which satellites provide TV, radio navigation services, support for emergency services, and broadband for very remote locations, on land, in the air and at sea.
The role of Ofcom is to look at how all services can work together without causing interference, but still have the spectrum they need to deliver. It is like a three-dimensional jigsaw where the picture is always changing. Spectrum is an area where international collaboration is essential; radio waves do not stop at international borders, so countries need to agree which services particular frequencies are most likely to be used for.
The future for spectrum: next generation services
Over the next few years we will hear a lot about ‘next generation services’ as an increasing number of the things that we use to support our lives go online. This will require access to spectrum. Some may be able to share spectrum, but others may need their own exclusive spectrum, as interference or delay could cause serious problems.
Examples of next generation services are:
• Connected cars – within the next ten years, cars will be able to communicate, both with other cars and with sensors on the road that will provide information on weather and road conditions, as well as the actions of other vehicles that the driver may or may not have seen. This information will help us drive (or maybe the car will drive itself), reducing the probability of accidents and improving fuel efficiency. Connected cars will also allow the car manufacturers to monitor the performance of the car, provide updates, and provide entertainment, communication and navigation services. This will require different types of spectrum – some very short range and others with high bandwidth. It will need to be harmonised spectrum, as cars are manufactured for the global market and, of course, travel across national borders.
• The supply of energy will be increasingly controlled and monitored wirelessly. Today, smart meters are being rolled out across the country – many of these are connected to the network by wireless technologies. The monitors in our homes and the new thermostats use licence-exempt spectrum to communicate. The energy companies make extensive use of telemetry (automated data collection and transmission) to monitor how energy is flowing and to support the many new types of small generators that are capable of supplying electricity to the grid. Wireless technologies will be used to manage supply and to control the generators that provide the electricity we use. While smart meters and the information we see in our homes can use licence-exempt spectrum, many argue that the control of electricity power stations and the grid – which moves electricity around the country – need a dedicated secure wireless network. This may require its own dedicated spectrum.
• For ships at sea, aircraft, and people in very remote locations, satellites have become increasingly central to supporting communications. Like everywhere else, there is increasing demand for more access, and higher-speed access, to the internet. This has driven demand for satellites that can deliver significantly more
46
capacity. Technology developments are also enabling smaller satellites; some people are talking about delivering networks of thousands of satellites, orbiting the earth at low altitude and offering broadband connectivity. These could provide internet access to remote areas of the world and, as they pass overhead, services in more developed areas as well. These new satellite networks are developing the capability to ‘hand over’ connections between satellites, as each satellite passes overhead. These new satellite technologies require Ofcom, working with its international partners, to carefully plan the spectrum needed and to ensure that the international rules allow the effective use of this scarce resource.
With the development of new mobile technology such as 5G, we will hear about millimetric waves, and new technology such as ‘massive MIMO’ (multiple input, multiple output), which comprises lots of aerials, all very small, that multiply the capacity of a wireless link. These developments are essential to deliver the faster speeds and higher capacity we will all need. But with all this - we must never forget that if you want to get into your car, you need your wireless key to work!
1.6.2 Innovations and technology In this section, David Harrison, Ofcom’s Director of Technology Strategy, sets out his views on technical innovation and what benefits new and forthcoming services are likely to bring.
David is responsible for leading Ofcom’s technical research programme and supporting Ofcom policy development across a wide range of areas including: the internet of things, fixed and mobile availability and performance, unlicensed Wi-Fi spectrum, future use of UHF spectrum, network neutrality and next generation broadband access.
Before joining Ofcom, David worked for the Independent Television Commission, where he held the position of Deputy Director of Technology, and before that led the high-frequency research and development activities in Thomson Multimedia, based in France.
Technical innovation continues to improve network connectivity and performance
A combination of technological innovation and investment in network infrastructure is leading to fixed and mobile broadband being available to more areas and more people. This is helping to extend reliable internet access to more consumers and businesses, some of whom currently have poor, or even no connectivity. These developments are, in turn fostering further innovation in online services including the Internet of Things (IoT), and ultra-high definition (UHD) television.
47
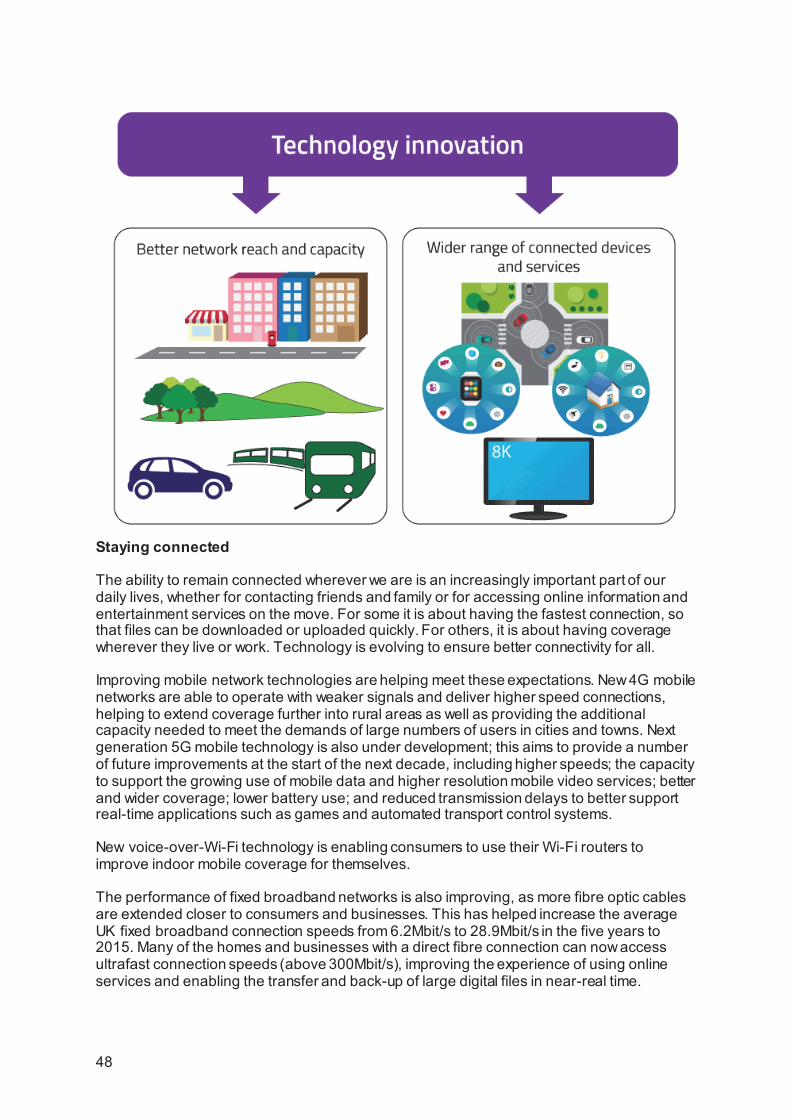
Staying connected
The ability to remain connected wherever we are is an increasingly important part of our daily lives, whether for contacting friends and family or for accessing online information and entertainment services on the move. For some it is about having the fastest connection, so that files can be downloaded or uploaded quickly. For others, it is about having coverage wherever they live or work. Technology is evolving to ensure better connectivity for all.
Improving mobile network technologies are helping meet these expectations. New 4G mobile networks are able to operate with weaker signals and deliver higher speed connections, helping to extend coverage further into rural areas as well as providing the additional capacity needed to meet the demands of large numbers of users in cities and towns. Next generation 5G mobile technology is also under development; this aims to provide a number of future improvements at the start of the next decade, including higher speeds; the capacity to support the growing use of mobile data and higher resolution mobile video services; better and wider coverage; lower battery use; and reduced transmission delays to better support real-time applications such as games and automated transport control systems.
New voice-over-Wi-Fi technology is enabling consumers to use their Wi-Fi routers to improve indoor mobile coverage for themselves.
The performance of fixed broadband networks is also improving, as more fibre optic cables are extended closer to consumers and businesses. This has helped increase the average UK fixed broadband connection speeds from 6.2Mbit/s to 28.9Mbit/s in the five years to 2015. Many of the homes and businesses with a direct fibre connection can now access ultrafast connection speeds (above 300Mbit/s), improving the experience of using online services and enabling the transfer and back-up of large digital files in near-real time.
48
In addition to delivering very high speeds, technology is evolving to connect those that currently cannot receive reliable broadband services. Last year we reported that around 2.4 million homes and small businesses could not receive an internet service with speeds in excess of 10Mbit/s and it is important that these consumers are not left behind. As well as wider optical fibre deployment, new extended-reach technologies are helping to deliver higher-speed connections over existing telephone lines.
Ofcom’s mobile coverage and fixed broadband checker provides an easy way for consumers and businesses to check the fixed broadband connection speeds available in different postcodes, and 4G and other mobile network coverage, at http://maps.ofcom.org.uk/check-coverage.
In addition to technical innovations, there are a range of other initiatives aimed at improving broadband coverage. For mobile broadband services these include the inclusion of coverage obligations in mobile licences, and making more low-frequency spectrum available to deliver better wide-area coverage. For fixed broadband, the Government is considering how to ensure that all UK households will be able to access a connection with a speed of at least 10Mbit/s by 2020.
An expanding range of new services
Looking further ahead to the next decade, technology innovation is set to enable us to move closer to a world in which we can remain connected wherever we are, with no apparent capacity constraints; with intelligent software automatically helping select for us the best available networks connection and services.
This improving connectivity, combined with new technologies that allow video to be sent using less capacity, are enabling the delivery of more lifelike immersive video services. For example, the next generation of 8K TV will offer even more detail than 4K televisions. These higher-definition formats, combined with 360º video camera developments, wrap-around screens and wearable gaming devices will help provide consumers with a greater sensation of ‘being there’ when watching future TV and video services. Higher-resolution video conferencing services, together with improving immersive screen technology are also set to provide a more realistic remote working experience.
Internet-connected TVs, mobile, portable and wearable devices will make it easier to watch a much wider range of content, whenever we want to, from anywhere in the world. Further, internet connectivity is being embedded into more consumer products supporting the development of the IoT. This has the potential to bring a wide range of future benefits to consumers. For example, at home, connected household appliances will offer the potential to enable the better use of electricity and to improve security. Connected cars are set to improve journey times, servicing and maintenance advice, and road safety, through the use of collision avoidance technology. In addition, connected cars will provide access to a wide range of streamed music and other online services.
Regulation will help to support the benefits of technology
Effective and flexible regulation is essential if consumers and UK businesses are to get the best possible benefits from future technological innovation. To help achieve this, Ofcom will continue to ensure that the way we regulate is underpinned by a strong understanding of current and emerging technologies. We will continue to liaise closely with industry and international standards bodies to keep abreast of the scope and impact of the latest technical developments, as well as commissioning our own technical research in key areas. The findings of previous technical research studies can be found here: http://stakeholders.ofcom.org.uk/market-data-research/other/technology-research/ .
49
