about icrisat - international crops research...
TRANSCRIPT

CYANMAGENTAYELLOWBLACK
327-07
Visit us at www.icrisat.org
®®
The International Crops Research Institute for the Semi-Arid Tropics (ICRISAT) is a nonprofi t,non-political organization that does innovative agricultural research and capacity building forsustainable development with a wide array of partners across the globe. ICRISAT’s mission is to help empower 600 million poor people to overcome hunger, poverty and a degraded environment in the dry tropics through better agriculture. ICRISAT belongs to the Alliance of Future Harvest Centers of the Consultative Group on International Agricultural Research (CGIAR).
Contact Information
ICRISAT-Patancheru(Headquarters)Patancheru 502 324Andhra Pradesh, IndiaTel +91 40 30713071Fax +91 40 [email protected]
Liaison Offi ceCG Centers BlockNASC ComplexDev Prakash Shastri MargNew Delhi 110 012, IndiaTel +91 11 32472306 to 08 Fax +91 11 25841294
ICRISAT-Nairobi(Regional hub ESA)PO Box 39063, Nairobi, KenyaTel +254 20 7224550Fax +254 20 [email protected]
ICRISAT-Niamey(Regional hub WCA)BP 12404Niamey, Niger (Via Paris)Tel +227 20 722529, 20 722725Fax +227 20 [email protected]
ICRISAT-BamakoBP 320Bamako, MaliTel +223 2223375Fax +223 [email protected]
ICRISAT-BulawayoMatopos Research StationPO Box 776,Bulawayo, ZimbabweTel +263 83 8311 to 15Fax +263 83 8253/[email protected]
ICRISAT-LilongweChitedze Agricultural Research StationPO Box 1096Lilongwe, MalawiTel +265 1 707297/071/067/057Fax +265 1 [email protected]
ICRISAT-Maputoc/o IIAM, Av. das FPLM No 2698Caixa Postal 1906Maputo, MozambiqueTel +258 21 461657Fax +258 21 [email protected]
About ICRISAT
j327CoverReportno34.indd 1j327CoverReportno34.indd 1 10/26/2007 4:33:31 PM10/26/2007 4:33:31 PM

CYANMAGENTAYELLOWBLACK
Citation: Ramkumar Bendapudi, Bekele Shiferaw, Wani SP, Nageswara Rao GD and Sreedevi TK. 2007. Socioeconomic profi les, production and resource use patterns in selected semi-arid Indian watershed villages. Global Theme on Agroecosystems Report no. 34. Patancheru 502 324, Andhra Pradesh, India: International Crops Research Institute for the Semi-Arid Tropics. 90 pp.
Abstract
The collaborative watershed research and development project between ICRISAT and the Andhra Pradesh Rural Livelihoods Programme (APRLP) was initiated with an overall objective of alleviating poverty through watershed-based interventions that enhance agricultural productivity and the sustainability of rural livelihoods. The initial phase of the project focused on participatory technology evaluation in selected watersheds for development of best practices and upscalable implementation models. Characterization of the biophysical and socioeconomic systems is an important aspect of this work. A detailed baseline socioeconomic farm household survey was conducted in 2003 in selected watershed villages of Mahabubnagar, Nalgonda and Kurnool districts. This report analyzes the socioeconomic conditions and resource endowment patterns of the watershed farmers. The report provides a snapshot of the structure of production in the villages, constraints and potential for increased productivity, social and political networks, and the distribution of assets across social groups. The net household incomes from diverse sources including crop, livestock and off-farm and their contribution to total household income in the selected villages are presented. The report also analyzes the income inequalities and the effect of different income sources on household income inequalities in the watershed villages using inequality decomposition techniques.
This publication is an output from a research project “Improved livelihood opportunities through watersheds” supported by the UK Department of International Development (DFID) through Andhra Pradesh Rural Livelihoods Programme (APRLP) to ICRISAT.
j327CoverReportno34.indd 2j327CoverReportno34.indd 2 10/26/2007 4:33:34 PM10/26/2007 4:33:34 PM

International Crops Research Institute for the Semi-Arid TropicsPatancheru 502 324, Andhra Pradesh, India
Socioeconomic Profi les, Production and Resource Use Patterns in Selected
Semi-arid Indian Watershed Villages
Ramkumar Bendapudi, Bekele Shiferaw, SP Wani,GD Nageswara Rao and TK Sreedevi
Global Theme on AgroecosystemsReport no. 34
Andhra Pradesh Rural Livelihoods ProgrammeRajendranagar, Hyderabad 500 030, Andhra Pradesh, India
2007
j327_2007Report34final.indd ij327_2007Report34final.indd i 10/26/2007 4:58:06 PM10/26/2007 4:58:06 PM

ii
CYANMAGENTAYELLOWBLACK
About the authors
Ramkumar Bendapudi Formerly Visiting Scientist, Global Theme on Agroecosystems, ICRISAT, Patancheru 502 324, Andhra Pradesh, India
Bekele Shiferaw Scientist (Economics), Global Theme on Institutions, Markets, Policy and Impacts, ICRISAT, PO Box 39063, Nairobi, Kenya
SP Wani Principal Scientist (Watersheds) and Regional Theme Coordinator (Asia), Global Theme on Agroecosystems, ICRISAT, Patancheru 502 324, Andhra Pradesh, India
GD Nageswara Rao Scientifi c Offi cer, Global Theme on Institutions, Markets, Policy and Impacts, ICRISAT, Patancheru 502 324, Andhra Pradesh, India
TK Sreedevi Scientist, Global Theme on Agroecosystems, ICRISAT, Patancheru 502 324, Andhra Pradesh, India
Acknowledgments
We express our deep appreciation to all the people who have contributed to this study. We are especially grateful to the survey households who spared their valuable time in responding to our comprehensive and far-reaching questions. We thank E Jagadeesh for his valuable assistance in verifying and analyzing data. Special thanks are due to Drs PG Chengappa of IFPRI, New Delhi and MG Chandrakanth of UAS, GKVK, Bangalore, India for reviewing the manuscript. We also thank all the fi eld investigators – Raju, Mahesh, Ajay and Karunakar – for their support under trying conditions. We are indebted to Ms Sheila Vijayakumar for editing the manuscript, KNV Satyanarayana for page-setting andMs N Sri Lakshmi for incorporating the editorial corrections.
The opinions expressed in this publication are those of the authors and do not necessarily refl ect those of ICRISAT or APRLP. The designations employed and the presentation of material in this publication do not imply the expression of any opinion whatsoever on the part of ICRISAT or APRLP concerning the legal status of any country, territory, city or area, or concerning the delimitation of its frontiers or boundaries. Where trade names are used, this does not constitute endorsement of or discrimination against any product by ICRISAT or APRLP.
j327_2007Report34final.indd iij327_2007Report34final.indd ii 10/26/2007 4:58:08 PM10/26/2007 4:58:08 PM

iii
CYANMAGENTAYELLOWBLACK
Contents
1. Introduction ................................................................................................................................. 1
Background .............................................................................................................................. 1About the study region ............................................................................................................. 2APRLP-ICRISAT partnership ................................................................................................... 3Objectives of the study ............................................................................................................ 4Sample characteristics .............................................................................................................. 6Structure of the study .............................................................................................................. 7
2. Socioeconomic Profi les and Resource Use Patterns in Watersheds of Mahabubnagar District ...... 8
District profi le ......................................................................................................................... 8General characteristics of the watershed villages ................................................................... 11Demographic characteristics .................................................................................................. 12Household activities ............................................................................................................... 14Caste composition .................................................................................................................. 15Land ownership ..................................................................................................................... 16Crop production ................................................................................................................... 20Livestock production .............................................................................................................. 23Other household assets .......................................................................................................... 25Income from other sources .................................................................................................... 26Household income ................................................................................................................. 27Groundwater resources .......................................................................................................... 28Common property resources ................................................................................................. 29Role of project implementing agencies in watershed management ......................................... 29Summary and conclusions ...................................................................................................... 30
3. Socioeconomic Profi les and Resource Use Patterns in Watersheds of Nalgonda District ............ 32
District profi le ....................................................................................................................... 32Village characteristics ............................................................................................................. 33Demographic characteristics .................................................................................................. 35Household activities ............................................................................................................... 36Caste composition .................................................................................................................. 36Land ownership ..................................................................................................................... 38Crop production ................................................................................................................... 40Livestock production ............................................................................................................. 42Other household assets .......................................................................................................... 45Income from other sources .................................................................................................... 45Household income ................................................................................................................. 46Groundwater resources .......................................................................................................... 47Institutional aspects ............................................................................................................... 47Summary and conclusions ...................................................................................................... 48
4. Socioeconomic Profi les and Resource Use Patterns in Watersheds of Kurnool District .............. 49
District profi le ....................................................................................................................... 49
j327_2007Report34final.indd iiij327_2007Report34final.indd iii 10/26/2007 4:58:08 PM10/26/2007 4:58:08 PM

iv
CYANMAGENTAYELLOWBLACK
Village characteristics ............................................................................................................. 51Demographic characteristics .................................................................................................. 52Household activities ............................................................................................................... 53Caste composition .................................................................................................................. 54Land ownership ...................................................................................................................... 54Crop production ................................................................................................................... 57Livestock production .............................................................................................................. 60Other household assets .......................................................................................................... 62Income from other sources .................................................................................................... 62Household income ................................................................................................................. 63Groundwater resources .......................................................................................................... 64Summary and conclusions ...................................................................................................... 64
5. Income Inequality and its Decomposition by Source in the Watersheds .................................... 65
Introduction ........................................................................................................................... 65Methodology .......................................................................................................................... 66
Inequality measures ........................................................................................................... 66Inequality decomposition ................................................................................................... 67
Watershed-wise analysis of income distribution ..................................................................... 68Major income sources and their role in income inequalities ............................................... 68Income inequalities and inequality decomposition ............................................................. 69
A more disaggregated analysis of the income sources ............................................................ 71Conclusions ............................................................................................................................ 73
6. Summary and Conclusions ......................................................................................................... 74
Watershed interventions ......................................................................................................... 74Demographic characteristics and social diversity .................................................................... 75Land ownership ...................................................................................................................... 75Major crops ............................................................................................................................ 76Livestock production .............................................................................................................. 77Other income sources ............................................................................................................ 77Diversifi cation of income sources ........................................................................................... 78Groundwater resources .......................................................................................................... 78Income inequalities ............................................................................................................... 79Implications for agricultural sustainability .............................................................................. 81
Participatory evaluation and cultivation of improved varieties ............................................ 81Community seed production and maintenance (Village Seed Banks) ................................. 81Integrated nutrient management activities ......................................................................... 81Integrated pest management activities ............................................................................... 81Informational linkages for rural development ..................................................................... 82Income generating micro-enterprises ................................................................................. 82
Strategies for the future ......................................................................................................... 82
References...................................................................................................................................... 83
Acronyms ...................................................................................................................................... 86
j327_2007Report34final.indd ivj327_2007Report34final.indd iv 10/26/2007 4:58:08 PM10/26/2007 4:58:08 PM

1
CYANMAGENTAYELLOWBLACK
1. Introduction
Background
Hunger, poverty, and deprivation remain acute constraints to sustainable development in many dryland areas of South Asia (ADB 2000). Increasing population growth only exacerbates the already depressing scenario in these marginal areas. The causes of poverty could be demographic, social, ecological degradation, water scarcity or lack of access to land and other natural resources.
Development in semi-arid regions is constrained by various socioeconomic, technological and institutional factors. Majority of the farmers in these regions are poor, illiterate and are not in a position to afford high cost and high input technologies. Lack of timely and limited availability of institutional credit to the rainfed farmers vitiates the situation even more. Increasing poverty coupled with frequent droughts has increased the strain on the natural resource base. Over exploitation of natural resources including depletion of forest cover and biodiversity resulting from increasing human and livestock pressure, has caused degradation of land, water and other essential ecosystem services in India (Samra and Narain 1995).
In India, rainfed areas constitute about 65% of arable land that are characterized by low productivity and about 70% of the population in this region is dependent on agriculture. These areas were bypassed with respect to investment on infrastructure and technology intervention as compared to irrigated areas due to a general misperception that investments in these areas would be less productive (Joshi et al. 2004). But an analysis into the government investments in India by Fan and Hazell (1999) showed that rainfed areas (less favored areas) offer greater growth for an additional unit of investment apart from having a much larger impact on poverty alleviation as compared to irrigated areas. As growth opportunities in more favorable zones are exhausted, the need to improve the productivity of less favored regions (rainfed areas) has become more compelling on the grounds of equity, effi ciency and sustainability (Shiferaw et al. 2003).
Inequalities in the distribution of land, water and access to other natural resources have signifi cant effect on poverty alleviation strategies and have to be taken into account when designing programs. Livelihood strategies of households vary depending on the extent of inequalities in a village. Tenant farmers and landless laborers are more in areas with more concentrated landholdings resulting in complementary livelihood activities such as livestock production and seasonal migration. Millennium development goals (1996–2015) include eradication of extreme poverty and hunger while ensuring environmental sustainability. The growing scarcity and competition for water, however, stands as a major threat to future advances in poverty alleviation.
Watershed development offers a unique approach to address these issues. A watershed is a hydrological unit that can serve as a biophysical unit and as a socioeconomic and socio-political unit for planning and implementing resource management activities (Springate-Baginski et al. 2002). Watershed development aims to ensure availability of drinking water, fuelwood and fodder and raise income and employment for farmers, landless laborers, women and other vulnerable groups through improvements in agricultural production and productivity in the areas with marginal lands that are prone to soil erosion and moisture stress (Hanumantha Rao 2000). The watershed program envisages a great opportunity for improving the productivity, profi tability and sustainability of dry farming areas through social mobilization. Integrated watershed management (IWM) forms an important strategy to attain these goals in the semi-arid regions, which are socioeconomically and environmentally vulnerable (Wani et al. 2003).
j327_2007Report34final.indd 1j327_2007Report34final.indd 1 10/26/2007 4:58:08 PM10/26/2007 4:58:08 PM

2
CYANMAGENTAYELLOWBLACK
About the study region
The state of Andhra Pradesh in India is situated in the tropical region between 12°14’ and 19°54’ N and 76°46’ and 84°50’ E. It is the fi fth largest state in the country both in terms of geographical area and population comprising 23 districts, 1,105 revenue mandals and 29,994 villages spreading over 276,814 km2. The total state population was 66.5 million according to the 1991 census. The sex ratio of females to 1000 males was 972 (1991 census). The population density of the state increased from 193 in 1981 to 242 persons km-2 in 1991.
Andhra Pradesh is classifi ed into three regions, viz, Rayalaseema, Telangana and Coastal Andhra based on social and cultural factors. The state has a tropical climate with moderate diffusion to subtropical weather. Humid to semi-humid conditions prevail in the coastal area while arid to semi-arid situations are frequent in the interior parts of the state, particularly Rayalaseema and some districts of Telangana. Droughts are quite common in the interior parts of the state especially in the Southern Telangana and Rayalaseema regions. On an average, at least one drought is reported every fi ve years.
The rainfall seasons in Andhra Pradesh are the Southwest monsoon period (June to September) and Northwest monsoon period (October to December). The total rainfall in the state in 2002–03 was only 612 mm as compared to 940 mm in normal years (decreased by about 35%). Figure 1 compares the actual monthly rainfall during the monsoon periods in 2002 with the rainfall during normal years (calculated as average of last 5 years). It can be seen that the rainfall was erratic, especially during the critical months of July to September where it was very low than the normal. The gross cropped area during 2002–03 declined by about 9.4% (from 12.7 million ha to 11.5 million ha). Consequently, the production of food grains decreased to 10.65 million t during 2002–03 from 14.83 million t in 2001–02 (a decrease of 28.2%).
To combat the frequent recurrence of drought in the state, the Drought Prone Area Programme (DPAP) was introduced during the year 1975, as a centrally sponsored scheme with a matching state funding share of 50%. The Integrated Wasteland Development Programme was introduced during 1991 with 100% central government assistance. The Department of Panchayati Raj and Rural Development under the central government implemented both programs.
Figure 1. Monsoon rainfall in Andhra Pradesh during 2002.
j327_2007Report34final.indd 2j327_2007Report34final.indd 2 10/26/2007 4:58:08 PM10/26/2007 4:58:08 PM

3
CYANMAGENTAYELLOWBLACK
A program was launched during 1997 for development of wastelands, degraded lands (ie, drylands which are being cultivated under rainfed conditions) and degraded reserve forests in Andhra Pradesh over a period of 10 years. It was envisaged to develop 10 million ha of degraded lands and wastelands, with an outlay of about US$ 0.88 billion from 1997 to 2007 at the rate of 1 million ha every year. About 2.7 million ha have already been covered through 5,472 watersheds, which is the largest number in the whole country (GoAP 2000).
The Andhra Pradesh Rural Livelihoods Programme (APRLP) was initiated by the state government in partnership with and the support of the Department for International Development (DFID), UK to reduce poverty through effective and sustainable livelihoods approach in the districts of Anantapur, Kurnool, Mahabubnagar, Nalgonda and Prakasam. The sustainable rural livelihood strategy was integrated with the IWM approach by supporting capacity building, livelihood support and convergence of other schemes and services (collectively called “watershed plus”) (Montagu and Reddy 2002).
The selection of APRLP watershed habitations involved a revised nine-point selection criteria thatincluded small and marginal farmers, scheduled caste/scheduled tribe (SC/ST) holdings, women self-help groups (SHGs) in a watershed, status of groundwater, Andhra Pradesh State Remote Sensing Application Centre (APSRAC) prioritization, livestock holdings, migration in the area, contiguity with treated/proposed watershed, and availability of fallow/wasteland and common property resources (CPR) for the poor and landless. Compared to the previous watershed activities, the focus of current watershed development activities expanded to include not only geo-hydrological details like sedimentation, evapo-transpiration and rainfall but also socioeconomic indexes like poverty, illiteracy, migration for wage labor, availability of drinking water, etc. There is also a new stress on the willingness of the community to involve themselves in all stages of watershed development. The concept of watershed development has moved from being a land-and-water program to that of community-centric program (APRLP guidelines). Integrated watershed management aims to improve the livelihood of farmers by increasing their income earning capacity through offering improved production and resource management practices required for sustainable agricultural intensifi cation (Wani et al. 2002). The important issues for watershed programs in rainfed areas typically aim to enhance crop production, increase household incomes and minimize degradation of natural resource base. Objectives of watershed programs combine a range of targets, which include production objectives, equity objectives and sustainability objectives (Turton et al. 1998).
The integrated watershed development program focuses on resource conservation, productivity growth and income diversifi cation to reduce household vulnerability to drought. In general, the watershed program activities include construction of check-dams (water storage structures), gully control structures, gabion structures, fi eld bunds and percolation tanks. The government supported watershed development program normally lacks the much needed technical support for building up the capacities of the primary and secondary stakeholders. This gap of resource pool is an important factor for bringing down the success probability of a watershed program. The IWM includes the critical elements of community mobilization, institutional development, capacity building and convergence of activities to restore ecological balance and enhanced livelihoods opportunities.
APRLP-ICRISAT partnership
The APRLP and ICRISAT (International Crops Research Institute for the Semi-Arid Tropics) collaboration was initiated in April 2002 with an overall objective to increase the impact of the
j327_2007Report34final.indd 3j327_2007Report34final.indd 3 10/26/2007 4:58:08 PM10/26/2007 4:58:08 PM

4
CYANMAGENTAYELLOWBLACK
DFID-APRLP watershed program in rural India to alleviate poverty through enhanced agricultural productivity and improved livelihoods opportunities.
ICRISAT and the national agricultural research system (NARS) and development partners have developed and evaluated the consortium model for integrated watershed development (Wani et al. 2002). The details of the consortium model and the results of its evaluation were recently reported (Wani et al. 2003). The priority of the consortium was to provide technical support for effi cient water storage, soil conservation and effi cient use of the conserved and available natural resources in the watershed to increase productivity, minimize land degradation and improve livelihoods.
Some of the on-farm technological interventions include introduction of new improved varieties, broad-bed and furrow (BBF) land form and contour planting to stimulate in-situ soil and water conservation; tropicultor usage for planting, balanced fertilizer application and intercultural operations; and in-situ generation of organic matter through Gliricidia planting on fi eld bunds. Apart from these, activities such as vermicomposting for producing biofertilizers, production of biopesticides using nuclear polyhedrosis virus (NPV), integrated nutrient management (INM) and integrated pest management (IPM) were being promoted in the watershed villages. The focus was also on scaling-up the innovative farmer-participatory consortium model from the selected villages to other neighboring villages.
The successful experience of ICRISAT regarding the innovative model with a consortium of actors, as opposed to interventions undertaken by a single organization, for technical backstopping in Adarsha watershed of Kothapally in Ranga Reddy district was used as a prototype model that can be adapted for other watersheds under the APRLP collaboration.
The ICRISAT-led consortium for technical backstopping is composed of the District Water Management Agency (DWMA), Central Research Institute for Dryland Agriculture (CRIDA), Acharya NG Ranga Agricultural University (ANGRAU), Krishi Vignan Kendras (KVKs), National Remote Sensing Agency (NRSA), APRLP, non-governmental organizations (NGOs), community-based organizations (CBOs) and watershed farmers. The consortium is working to test and develop technological, policy and institutional options for IWM in selected watersheds (Wani et al. 2003). All the stakeholders work in partnership with one another and with farmers and the watershed association to conserve rainwater, improve land and water productivity and enhance the sustainability of the resource base.
In the process of scaling-out the model, in each district 3–4 nucleus watersheds were selected as demonstration sites for putting together the IWM interventions. The nucleus watersheds selected are with different project implementing agencies (PIAs) so as to enable lateral/horizontal scaling on its own through the watersheds under each of the PIAs. The nucleus watersheds selected for this study in the districts of Mahabubnagar, Nalgonda and Kurnool are shown in Figure 2. The rainfall in these watersheds ranges between 500 and 800 mm.
Each nucleus watershed had four satellite (outreach) watershed villages and the farmers and SHG members from the nucleus watersheds became the facilitators of spillovers to the targeted satellite watersheds (Wani et al. 2002). The nucleus watersheds and their associated satellite villages are listed in Table 1.
Objectives of the study
The outcome and impact of a watershed program is likely to depend on various factors that include physical characteristics of the watershed, nature of property rights (existing institutions), social
j327_2007Report34final.indd 4j327_2007Report34final.indd 4 10/26/2007 4:58:08 PM10/26/2007 4:58:08 PM

5
CYANMAGENTAYELLOWBLACK
structure (size of community, history of collective action, extent and nature of social capital, etc.) and organization of the community (Turton et al. 1998). Regular impact monitoring and evaluation is critical for adaptive management of a watershed program that will enhance the capacity to attain stated objectives. Baseline data on biophysical and socioeconomic conditions in the watershed provides a useful check that would help compare future changes in cropping patterns, productivity and livelihood strategies of households after controlling other exogenous changes. There is a need
Table 1. Selected nucleus watersheds and associated satellite villages in Andhra Pradesh.
District Mandal Nuclear watershed PIA Satellite watershed villages
Mahabubnagar Jadcherla Malleboinpally Govt. Dept. GollapallyAllurGangapurBooreddypally
Wanaparthy Mentapally SDDPA PeddagudamKadukuntlaChandapurDattaipally
Nagarkurnool Sripuram Govt. Dept. UyyalawadaNaganoorNallavelliWanapatla
Mahabubnagar Appaipally BAIF KoduruMachenapallyNandipetGudibanda
Nalgonda Chintapally Tirumalapuram DASM NasarlapallyG GowraramNelvalpallyTheadedu
Yadagirigutta Kacharam ADDRESS DharmareddygudemSaduvallyKamatamvarigudemPamukunta
Atmakoor (S) Nemmikal DISHA PathasuryapetGattikalNaseempetAtmakoor
Kurnool Banaganapally Nandavaram Govt. Dept. TambadapalliRollakothuruBeeravoluJillela
Devanakonda Kanugulavanka RAIDS GundalakondaMK KottalaK VenkatapuramBurakunta, Gudimiralla
Devanakonda Karivemula APARD JillelabudakalaObhulapuramMadhapuramKaridikonda
j327_2007Report34final.indd 5j327_2007Report34final.indd 5 10/26/2007 4:58:08 PM10/26/2007 4:58:08 PM
6
CYANMAGENTAYELLOWBLACK
to understand more about the baseline conditions that affect the process and outcome of micro-watershed development.
Characterization of the watershed project villages through a baseline survey provides researchers and policy makers with a snapshot of the socioeconomic aspects, land characteristics, constraints and potential for increased productivity, social and political networks, cropping patterns, livelihood strategies and crop and livestock production activities. Knowledge of baseline conditions is necessary to identify the relationship between biophysical and socioeconomic characteristics and identify factors that condition the success of IWM interventions. This would also help in continued monitoring and evaluation of socioeconomic and environmental impacts of the watershed program.
As part of the project, a detailed baseline socioeconomic farm household survey was conducted in 2003 in selected nucleus watershed villages of Mahabubnagar, Nalgonda and Kurnool districts of Andhra Pradesh to identify the major socioeconomic, biophysical constraints for sustainable crop production in each village. The purpose of this study was to characterize and assess the baseline biophysical and socioeconomic conditions in these selected watersheds. The report documents the socioeconomic conditions and resource endowment patterns of the watershed farmers, along with net incomes for different household groups from alternative income sources (crop, livestock and off-farm). This would be a suitable benchmark for monitoring changes and to assess the impacts of watershed activities in the future. The specifi c objectives of this research report are to:
1. Understand better the production system and identify constraints, potential opportunities, farmer needs and priorities for IWM;
2. Identify the major livelihood strategies for different household groups and implications for the project;
3. Assess the level of inequality (in endowment of assets and income), social heterogeneity, access to resources in the community and implications for the project;
4. Generate baseline data for impact monitoring and evaluation.
Sample characteristics
The data was collected for the 2002–03 production year using a pre-tested structured questionnaire. A random sampling procedure was used to select the households in two watershed villages from each of the three districts (Mahabubnagar, Nalgonda and Kurnool). The watershed area and the number of households constituting the representative sample in the respective watersheds are given in Table 2.
Table 2. Watershed area and sample households in selected watershed project villages in Andhra Pradesh.
Watershed Watershed area
(ha)Total householdsin watershed area
No. of samplehouseholds
Malleboinapally 524 230 60Mentapally 425 235 65Tirumalapuram 518 72 72Kacharam 662 324 90Nandavaram 500 330 63Kanugulavanka 500 250 70
j327_2007Report34final.indd 6j327_2007Report34final.indd 6 10/26/2007 4:58:08 PM10/26/2007 4:58:08 PM

7
CYANMAGENTAYELLOWBLACK
The sample households were selected such that the land distribution and caste distribution closely matched that of the land and caste distribution of the entire village. Depending on the size of the village, the sample size varied between 19 and 100% of the total households in the watershed communities. Apart from the household survey, additional information was also collected through participatory methods such as focus group discussions, key informants and transect walks within the village.
Structure of the study
The research report is organized as follows. Sections two, three and four present district-wise results from analysis of sample survey data in the selected watershed villages. The analysis provides insights into the socioeconomic conditions in the watershed villages including demographics, social heterogeneity, distribution of resources, access rights, crop and livestock production activities,
Figure 2. Location of the selected nucleus watershed areas and rainfall zones in Andhra Pradesh.(Note: 6 = Nalgonda district; 9 = Mahabubnagar district; 10 = Kurnool district.)
j327_2007Report34final.indd 7j327_2007Report34final.indd 7 10/26/2007 4:58:08 PM10/26/2007 4:58:08 PM

8
CYANMAGENTAYELLOWBLACK
adoption of new technologies, yield and productivity levels, household vulnerability and incidence of droughts, diversifi cation of income sources, natural resource conditions (eg, groundwater and CPR). Section fi ve examines the income inequalities that exists within the study villages and analyzes how the different sources of income contribute to changes in household income inequalities. Section six provides a summary of the key results and policy implications for sustainable improvement of livelihoods and the agricultural resource base through the integrated community-based watershed management interventions in the study areas.
2. Socioeconomic Profi les and Resource Use Patterns in Watersheds of Mahabubnagar DistrictThis section characterizes and assesses the baseline biophysical and socioeconomic conditions in the selected watersheds of Malleboinpaly in Jadcherla mandal and Mentapally in Wanaparthy mandal of Mahabubnagar district.
District profi le
The principal food grain crops in the Mahabubnagar district are rice, sorghum, fi nger millet and pearl millet while the principal commercial crops are groundnut and castor. Pigeonpea and green gram were the major pulse crops. Mahabubnagar district had the largest acreage in the state under sorghum and castor during the 2002–03 cropping season (Fig. 3). It accounted for 71% of the total castor production in the state.
In Mahabubnagar district, the total rainfall in 2002–03 was only 536 mm as compared to 604 mm in normal years (decreased by about 24%). The rainfall data during the monsoon months in Mahabubnagar district is shown in Figure 4. The fi gure compares the actual monthly rainfall during the monsoon periods in 2002 with the rainfall during normal years (calculated as average of last 5 years). The rainfall was erratic, especially during July and September and was much less than the normal.
Figure 3. Area under major crops in 2002–03 in Mahabubnagar district.
j327_2007Report34final.indd 8j327_2007Report34final.indd 8 10/26/2007 4:58:09 PM10/26/2007 4:58:09 PM

9
CYANMAGENTAYELLOWBLACK
In Mahabubnagar district, signifi cant changes in cropping pattern were noticed in 2002, which was considered as a drought year. Paddy accounted for about 8% of total cropped area, sorghum accounted for 12% and cotton 4% of total cropped area in kharif (rainy season) 2002 (see Table 3 for more information). The same crops accounted for 12%, 17% and 9% of total cropped area, respectively in normal years. There was a decline in the areas sown under paddy, sorghum and cotton in kharif 2002 as compared to normal years (Fig. 5). There was considerable increase in the area under maize (an increase of 18,803 ha) and castor (an increase of 40,521 ha). In kharif 2002, maize and castor accounted for 8.78% and 31% of total cropped area, respectively whereas in normal years they accounted for 4.76% and 20.71% of total cropped area, respectively.
Figure 4. Monsoon rainfall during 2002 in Mahabubnagar district.
Table 3. Normal and actual area sown (ha) and deviations of major crops in Mahabubnagar district during kharif 2002.
Crop
Jadcherla mandal Wanaparthy mandal Mahabubnagar district
Normal Actual Change Normal Actual Change Normal Actual Change
Paddy 1826(14.14)1
546(4.72)
–1280 1197(17.52)
1318(15.56)
121 82174(12.00)
47236(8.07)
–34938
Sorghum 3078(23.84)
2502(21.62)
–576 1400(20.49)
914(10.79)
– 486 118351(17.28)
70165(11.99)
–48186
Finger millet 171(1.32)
964(8.33)
793 139(2.03)
192(2.27)
53 10345(1.51)
10433(1.78)
88
Maize 768(5.95)
1046(9.04)
278 218(3.19)
1115(13.16)
897 32587(4.76)
51390(8.78)
18803
Pigeonpea 919(7.12)
677(5.85)
–242 459(6.72)
680(8.03)
221 54038(7.89)
43276(7.40)
–10762
Castor 3341(25.87)
4554(39.34)
1213 2528(36.99)
3326(39.27)
798 141835(20.71)
182356(31.17)
40521
Cotton 1873(14.50)
465(4.02)
–1408 48(0.70)
4(0.05)
–44 62086(9.07)
22706(3.88)
–39380
Chili 126(0.98)
164(1.42)
38 18(0.26)
18(0.21)
0 9381(1.37)
14566(2.49)
5185
Total cropped area
12913(100)
11575(100)
–1338 6834(100)
8470(100)
1636 684891(100)
584980(100)
–99911
1. Figures in parentheses indicate percentage values and do not add up to total since only major crops were considered.Source: Joint Director of Agriculture, Mahabubnagar.
j327_2007Report34final.indd 9j327_2007Report34final.indd 9 10/26/2007 4:58:09 PM10/26/2007 4:58:09 PM

10
CYANMAGENTAYELLOWBLACK
Figure 5. Cropping pattern in kharif 2002 as compared to normal years in Mahabubnagar district.
In Jadcherla mandal, similar pattern was observed (Fig. 6). Maize and castor constituted about 9% and 39% of total cropped area, respectively in kharif 2002 whereas in normal years these accounted for about 6% and 26% of cropped area, respectively. In Wanaparthy mandal, there were considerable gains in area under maize and castor and there was also a small increase in area under paddy (121 ha). In particular maize accounted for about 13% of total cropped area in kharif 2002 as compared to only 3% of total cropped area in normal years.
Figure 6. Cropping pattern changes in kharif 2002 as compared with normal years in two mandals in Mahabubnagar district.
j327_2007Report34final.indd 10j327_2007Report34final.indd 10 10/26/2007 4:58:09 PM10/26/2007 4:58:09 PM

11
CYANMAGENTAYELLOWBLACK
General characteristics of the watershed villages
Malleboinpally (Jadcherla mandal) and Mentapally (Wanaparthy mandal) in Mahabubnagar district are the selected nuclear watershed villages for this study (Fig. 7). Malleboinpally is located between 78°09’ latitude and 16°77’ longitude and Mentapally, between 77°95’ latitude and 16°31’ longitude. Malleboinpally village is located 5 km from Jadcherla (mandal headquarters) and 12 km from Mahabubnagar (district headquarters). Apart from the village itself, surrounding hamlets (thandas) namely, Pochammagadda thanda, Mangalikunta thanda and Kotha thanda also come under this village panchayat. The village is spread over an area of about 524 ha. Cultivable land accounts for 61.4% of the total village area (524 ha) that includes both dryland and irrigated areas (Table 4).
Figure 7. Location of selected watershed villages of Mahabubnagar district.
j327_2007Report34final.indd 11j327_2007Report34final.indd 11 10/26/2007 4:58:09 PM10/26/2007 4:58:09 PM

12
CYANMAGENTAYELLOWBLACK
Out of the total cultivated area of 321.8 ha in Malleboinpally, nearly 91.5% was dryland and remaining 8.5% was irrigated. The major soil types (in local terminology) in the village were dubba, erra and nalla apart from other mixed soils. Dubba is a mixture of soil and sand, with a higher percentage of sand and a soil depth of 30–60 cm; erra are the red soils with depth between 45 and 90 cm; and nalla are the black soils with a depth of about 60 cm (Dvorak 1988). The major crops grown in 2002–03 were maize, castor and sorghum with pigeonpea as intercrop and maize being the most preferred crop. Livestock in 2002–03 consisted of approximately 212 buffaloes, 142 cattle, 800 sheep and 365 goats.
Mentapally is located 12 km from Wanaparthy (mandal headquarters). The village area is about 425 ha. Cultivable area was about 295.5 ha which accounts for 69.52% of total area. Dryland cultivation accounted for 84.92% of the total cultivated area and the remaining 15.08% consisted of irrigated land. The major soils in Mentapally are dubba or tuvva followed by erra and nalla.
The major crops grown in 2002–03 were castor, sorghum, and maize with pigeonpea as intercrop in kharif. Paddy was also grown depending on availability of water. Groundnut and paddy were the major rabi (postrainy season) crops. The livestock holdings in Mentapally were relatively low with 220 cattle, 60 buffaloes, 20 sheep and 45 goats.
Demographic characteristics
In Malleboinpally, the average age of the household head for the sample households was about 46 years with an average education of 4.25 years (Table 5). The average family size for the Malleboinpally sample was 5.63 persons with a standard deviation of 2.34. The family size varied between a minimum of 2 and a maximum of 13. Seventy percent of the sample households had a family size of 6 or less. About 38% of the households had a family size of 4 or less.
The work force was computed as a weighted sum of individuals in the age groups of 11–15 years, 16–55 years and 56–65 years with values of 0.25, 1.00 and 0.25, respectively (Shiferaw et al. 2002). The average weighted work force for Malleboinpally was 4.13 persons per household. About 22.57% of the sample population can be considered as dependents based on age criteria (less than 10 years and those above 65 years).
The dependency ratio was computed as the ratio of non-working members to working family members (Shiferaw et al. 2002). The average dependency ratio of 0.45 indicates that every working family member supported 0.45 persons.
Table 4. Land resources in the selected watershed villages in Mahabubnagar district.
Characteristics Malleboinpally Mentapally
Total cultivated land (ha) 321.8 (61.4)1 295.5 (69.4) - Irrigated cultivated area (ha) 27.1 44.5 - Dryland cultivated area (ha) 294.7 251Permanent fallow (private) (ha) 80.9 (15.4) 121.5 (28.6)CPR and forest area (ha) 91.1 (17.4) 4.1 (0.9) Other land (settlements, etc) (ha) 30.4 (5.8) 4.1 (0.9) Total village area (ha) 524.3 (100) 425.1 (100) 1. Figures in parentheses are percentage values.
j327_2007Report34final.indd 12j327_2007Report34final.indd 12 10/26/2007 4:58:10 PM10/26/2007 4:58:10 PM

13
CYANMAGENTAYELLOWBLACK
In Mentapally, the average age of household head was about 49 years with an average education of 2.63 years (Table 6). Even though education levels of the household heads were poor in both Malleboinpally and Mentapally, almost all the households were sending their children to the primary schools in the villages. The average family size of Mentapally was 5.64 persons with a standard deviation of 2.02. Family size ranged between 2 and 12. Seventy-two percent of the households had a family size of 6 or less. About 27.7% of households had a family size of 4 or less.
Bulk of the sample population comprised of individuals in the age group of 16–55 years (52.45%) which makes up for the major work force. The average weighted work force was 3.18. Nearly 29% of the population consisted of dependents. The majority of the dependents were children of below 11 years age. The average dependency ratio was 0.32.
Table 5. Demographic characteristics of Malleboinpally1.
Characteristics Mean SD Minimum Maximum
Age of household head (yr) 46.20 12.42 23 72Education of household head (yr) 4.25 5.08 0 19Education of family (yr) 3.97 4.41 0 16Persons below 5 years 0.52 0.77 0 3Persons 6–10 years 0.60 0.76 0 3Persons 11–15 years 0.65 0.90 0 3Persons 16–55 years 3.38 1.61 0 7Persons 56–65 years 0.37 0.55 0 2Persons above 65 years 0.17 0.38 0 1Family size 5.63 2.34 2 13Total work force 4.13 1.71 1 9Dependents 1.55 1.37 0 5Dependency ratio 0.45 0.51 0 31. Sample size (n) = 60; SD = Standard deviation.
Table 6. Demographic characteristics of Mentapally1.
Characterisitics Mean SD Minimum Maximum
Age of household head (yr) 48.83 12.41 23 75Education of household head (yr) 2.63 4.09 0 12Education of family (yr) 3.15 4.16 0 17Persons below 5 years 0.57 0.73 0 2Persons 6–10 years 0.77 0.88 0 3Persons 11–15 years 0.68 0.75 0 3Persons 16–55 years 2.97 1.24 0 6Persons 56–65 years 0.38 0.55 0 2Persons above 65 years 0.29 0.63 0 3Family size 5.65 2.03 2 12Total work force 3.18 1.28 0 6.5Dependents 1.06 1.10 0 5Dependency ratio 0.32 0.38 0 21. Sample size (n) = 65; SD = Standard deviation.
j327_2007Report34final.indd 13j327_2007Report34final.indd 13 10/26/2007 4:58:10 PM10/26/2007 4:58:10 PM

14
CYANMAGENTAYELLOWBLACK
Household activities
A detailed look into the distribution or combination of activities undertaken by the household members provides an insight into the distribution of workloads, major activities in the village and role of men and women in the household activities.
In general, women were involved in multiple tasks that include household chores apart from income generating activities whereas men were exclusively involved in income generating activities. In Malleboinpally, about 54% of total sample women performed household chores and 46% of them were involved in on-farm activities. Thirty-fi ve percent of the sample women worked as hired labor (Fig. 8). Similarly in Mentapally, 45.5% of sample women performed household chores, about 44% were involved in on-farm activities on their own land and 40.5% worked as hired labor (Fig. 9).
Men were mainly involved in on-farm activities, off-farm work and other income generating occupations. In Malleboinpally, the dominant activities for men were on-farm activities (about 42% of total men in the sample), hired labor (19%) and off-farm work (about 17% of total men in the sample) (Fig. 8). In Mentapally, almost 44% of total men in the sample were involved in on-farm work and 27% of men worked as hired labor (Fig. 9).
Figure 8. Major household activities in Malleboinpally.
Figure 9. Major household activities in Mentapally.
j327_2007Report34final.indd 14j327_2007Report34final.indd 14 10/26/2007 4:58:10 PM10/26/2007 4:58:10 PM

15
CYANMAGENTAYELLOWBLACK
Diversifi cation of income generating activities was noticed in both the watershed villages. A larger percentage of household members combined on-farm activities with one or more income generating activities to sustain the household needs and to overcome the drought conditions in the 2002 cropping season.
In Malleboinpally, there was an almost equal distribution of male and female students (21% and 20%, respectively) whereas in Mentapally, there was higher percentage of male students (30%) as compared to female students (24%). The household members with no role include small children and aged members. Owning of land assets gives the aged members the leeway to be looked after by the younger generation. It was observed that the immediate consequence of transfer of land property to the younger generation was abandonment of the old members in the household through family splits and therefore making them vulnerable to poverty due to changing patterns of family organization (Kabeer 2002).
Caste composition
Caste has been a dominant social factor historically and even in the present day. Even though caste has negative connotations it can still have a positive spin off when considered as a social capital. Caste has an important role from the perspective of social networking and social mobilization. It has implications for collective action in watershed development depending on the heterogeneity and homogeneity of the caste composition in the specifi c village. The scope for collective action may be more in villages where community composition is more homogeneous.
Traditionally, Reddys and Kammas are the politically dominant communities in Andhra Pradesh and specifi cally Reddys are dominant in the Telangana and Rayalaseema regions (Srinivasulu 2002). These are also the semi-arid tropical regions and areas of interest for the current study. In Malleboinpally, about 54% of the total households in the village belong to backward caste (BC) (Fig. 10). There were about 15 castes in Malleboinpally. The major castes in Malleboinpally were Madiga, Reddy, Kurva and Tenugu. The Madigas account for 23.5% of total households in the village, Reddys account for 20.3%, Tenugu 22.6%, Kurva about 15% and other minor castes constitute about 9% of total village households. The Madigas belong to the category of SC, Kurva and Tenugu were considered as BC and Reddys belong to forward caste (OC). The sample was composed of Madiga (23%), Reddy (20%),
Figure 10. Caste categories in Malleboinpally.
j327_2007Report34final.indd 15j327_2007Report34final.indd 15 10/26/2007 4:58:10 PM10/26/2007 4:58:10 PM

16
CYANMAGENTAYELLOWBLACK
Kurva (20%) and Tenugu (15%), which represents the caste composition of the entire village. In Mentapally, SC comprised about 45% of the total households in the village followed by BC (34%) (Fig. 11). There were only 5 castes in the entire village. The major castes in the village were Madiga, Reddy and Musti. The Mentapally sample households were composed of Madiga (41.5%), Musti (30.8%) and Reddy (24.6%). Mentapally had a relatively homogeneous caste structure as compared to Malleboinpally, which was more heterogeneous.
Land ownership
This section discusses the land ownership details, caste-wise land distribution and land equity issues in the watershed villages. The average land ownership for Malleboinpally sample was 1.58 ha with a standard deviation of 1.55. Landholdings ranged between 0 and 10.12 ha (Table 7). The mean wetland was about 0.38 ha and dryland 1.21 ha. Even though the average irrigable land was 0.38 ha, the actual irrigated land cultivated in kharif was only 0.16 ha indicating water scarcity. The average actual cultivated dryland (0.83 ha) too was very much lower than the mean total owned dryland (1.21 ha). The mean land under permanent fallow was 0.16 ha. The average per capita landholding was 0.32 ha. Majority of sample households in Malleboinpally had 1–2 ha of land (41.67%). About 33% of sample households had no land or less than 1 ha (Fig. 12).
The average land owned in Mentapally was 2.39 ha with a standard deviation of 1.71 and a maximum land ownership of 9.31 ha (Table 8). As can be expected in a semi-arid region, the average dryland ownership (1.86 ha) was more than the average wetland owned (0.53 ha). The mean actual irrigated land cultivated was only 0.16 ha and the actual dryland cultivated in kharif season 2002 was 1.27
Figure 11. Caste categories in Mentapally.
Table 7. Land ownership in Malleboinpally1.
Variable Mean SD Minimum Maximum
Total own land (ha) 1.58 1.55 0 10.12Irrigable land (ha) 0.38 0.70 0 4.05Dryland (ha) 1.21 1.08 0 6.07Irrigated own cultivated land (ha) 0.16 0.27 0 1.21Dryland own cultivated land (ha) 0.83 0.68 0 3.24Permanent fallow (ha) 0.16 0.48 0 2.83Per capita land (ha) 0.32 0.37 0 2.531. Sample size (n) = 60; SD = Standard deviation.
j327_2007Report34final.indd 16j327_2007Report34final.indd 16 10/26/2007 4:58:10 PM10/26/2007 4:58:10 PM

17
CYANMAGENTAYELLOWBLACK
ha. The average land under permanent fallow was 0.37 ha which was much higher than that found in Malleboinpally.
The mean per capita landholding was 0.49 ha, which was slightly higher than Malleboinpally. In Mentapally, more than 50% of the sample households had more than 2 ha of land whereas in Malleboinpally, only 25% of sample households owned more than 2 ha land. About 14% of the sample households had no land or less than 1 ha land (Fig. 13).
Figure 12. Landholding categories in Malleboinpally sample households.
Table 8. Land ownership in Mentapally1.
Variable Mean SD Minimum Maximum
Total own land (ha) 2.39 1.71 0 9.31Irrigable land (ha) 0.53 0.68 0 3.64Dryland (ha) 1.86 1.34 0 6.28Irrigated own cultivated land (ha) 0.16 0.31 0 1.62Dryland own cultivated land (ha) 1.27 1.10 0 5.26Permanent fallow (ha) 0.37 0.75 0 3.34Per capita land (ha) 0.49 0.47 0 3.241. Sample size (n) = 65; SD = Standard deviation.
Figure 13. Landholding categories in Mentapally sample households.
j327_2007Report34final.indd 17j327_2007Report34final.indd 17 10/26/2007 4:58:10 PM10/26/2007 4:58:10 PM

18
CYANMAGENTAYELLOWBLACK
Historically land ownership and political power were vested with the dominant communities like Reddys and Kammas. These communities have traditionally controlled the village political life (Srinivasulu 2002). In Malleboinpally, the average landholdings was highest for Reddys (3.02 ha), followed by Tenugu (1.83 ha) and Musti (1.72 ha) (Fig. 14). The average landholding of these castes was higher than the mean landholding of the village (1.58 ha). The average landholding of Madiga was 1.01 ha which was less than village average. Similarly, in Mentapally, the mean landholding (3.73 ha) and mean per capita land (0.81 ha) was highest for Reddys when compared with any other caste (Fig. 15). This distribution brings out the historical caste characteristics of villages in the region with Reddys having higher land ownership than Madigas. The per capita land is highest for Reddy caste (0.71 ha) with not much difference among rest of the castes.
Figure 14. Caste-wise land ownership in Malleboinpally.
Figure 15. Caste-wise land ownership in Mentapally.
j327_2007Report34final.indd 18j327_2007Report34final.indd 18 10/26/2007 4:58:10 PM10/26/2007 4:58:10 PM
19
CYANMAGENTAYELLOWBLACK
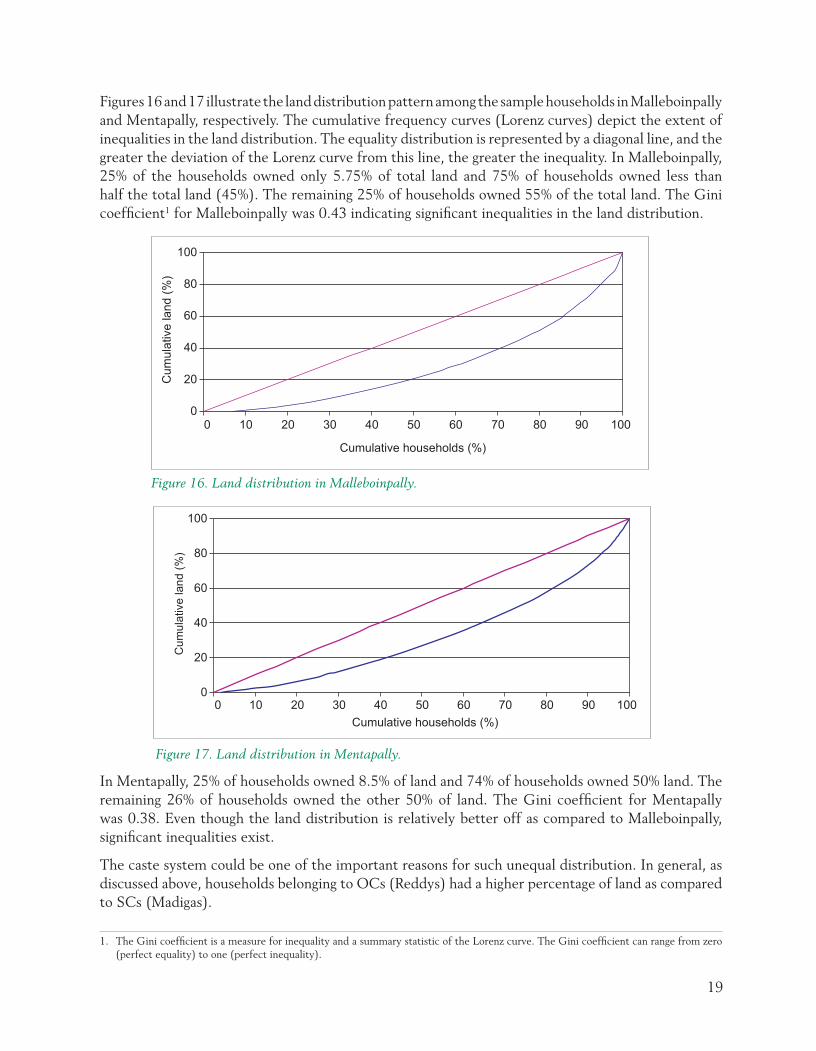
Figures 16 and 17 illustrate the land distribution pattern among the sample households in Malleboinpally and Mentapally, respectively. The cumulative frequency curves (Lorenz curves) depict the extent of inequalities in the land distribution. The equality distribution is represented by a diagonal line, and the greater the deviation of the Lorenz curve from this line, the greater the inequality. In Malleboinpally, 25% of the households owned only 5.75% of total land and 75% of households owned less than half the total land (45%). The remaining 25% of households owned 55% of the total land. The Gini coeffi cient1 for Malleboinpally was 0.43 indicating signifi cant inequalities in the land distribution.
In Mentapally, 25% of households owned 8.5% of land and 74% of households owned 50% land. The remaining 26% of households owned the other 50% of land. The Gini coeffi cient for Mentapally was 0.38. Even though the land distribution is relatively better off as compared to Malleboinpally, signifi cant inequalities exist.
The caste system could be one of the important reasons for such unequal distribution. In general, as discussed above, households belonging to OCs (Reddys) had a higher percentage of land as compared to SCs (Madigas).
1. The Gini coeffi cient is a measure for inequality and a summary statistic of the Lorenz curve. The Gini coeffi cient can range from zero (perfect equality) to one (perfect inequality).
Figure 16. Land distribution in Malleboinpally.
Figure 17. Land distribution in Mentapally.
j327_2007Report34final.indd 19j327_2007Report34final.indd 19 10/26/2007 4:58:10 PM10/26/2007 4:58:10 PM

20
CYANMAGENTAYELLOWBLACK
Crop production
Castor, sorghum, maize, fi nger millet, pigeonpea, paddy, cotton and chili accounted for 75% of the total cropped area in the district in kharif season of 2002. The major crops were dryland crops with castor being the dominant crop that accounted for about 31% of total cropped area in the district (Table 3). In Jadcherla mandal, the above crops accounted for 93.7% of total cropped area with castor and sorghum accounting for 39.3% and 21.6% of total cropped area, respectively. In Wanaparthy mandal, these crops accounted for 89.3% of total cropped area with castor being the main crop (39.3% of total cropped area) followed by maize (13.2%) and sorghum (10.8%) among dryland crops and paddy accounted for 15.5% of total cropped area.
The cropping patterns in Malleboinpally (Jadcherla mandal) and Mentapally (Wanaparthy mandal) were similar to that of the district and their respective mandals. In Malleboinpally, castor is mainly grown as sole crop with mean plot size of 0.19 ha (Table 9). The other important cropping system was sorghum intercropped with pigeonpea with mean plot area of 0.32 ha. Maize was equally grown as sole crop and as intercrop with pigeonpea with mean plot area of 0.10 ha.
Maize was a recent crop and has become a preferred crop by the farmers, which is in line with the overall trend in the district and mandal. Even with water scarcity, paddy was still the important irrigated crop with a mean plot area of 0.15 ha. There was only limited rabi cultivation with groundnut and paddy grown on a small area (<5 ha) depending on access to water.
In Mentapally, castor was mainly grown as an intercrop system with pigeonpea with a mean plot size of 0.49 ha (Table 10). This was followed by sorghum+pigeonpea intercropping system with a mean plot size of 0.23 ha. Maize+pigeonpea was also an important cropping system with a mean plot size of 0.12 ha. Paddy was grown to a considerable extent with mean plot size of 0.19 ha. Some other minor crops include cowpea, green gram, horsegram, groundnut and pearl millet.
Groundnut was the main rabi crop with mean plot size of 0.19 ha followed by paddy (mean plot size 0.06 ha). The advent of maize, castor and pigeonpea in the respective villages can be attributed in part if not whole to the efforts of the consortium. ICRISAT provided seeds of castor, maize and pigeonpea to some farmers during the 2002–03 cropping season as part of the IWM program.
Table 9. Mean area of major crops grown in Malleboinpally1.
Crop No. of plots Mean area (ha)
KharifCastor 21 0.19Castor+Pigeonpea 2 0.02Chili 2 0.01Finger millet 10 0.06Maize 12 0.10Maize+Pigeonpea 11 0.10Paddy 27 0.15Sorghum 6 0.05Sorghum+Pigeonpea 38 0.32
RabiGroundnut 6 0.05Paddy 9 0.031. Sample size (n) = 60.
j327_2007Report34final.indd 20j327_2007Report34final.indd 20 10/26/2007 4:58:10 PM10/26/2007 4:58:10 PM

21
CYANMAGENTAYELLOWBLACK
In Malleboinpally, fertilizer usage was higher in irrigated crops (paddy and groundnut) and lower in rainfed crops. The commonly used fertilizers were diammonium phosphate (DAP) [46% phosphorus (P) and 18% nitrogen (N)] and urea (46% N). Fertilizer application was highest for paddy. In the kharif season, DAP was applied at an average rate of about 142 kg ha-1, urea at 169 kg ha-1 and farmyard manure (FYM) at 1 t ha-1 (Table 11).
Table 10. Mean area of major crops grown in Mentapally1.
Crop No. of plots Mean area (ha)
KharifCastor 12 0.14Castor+Pigeonpea+Cowpea 2 0.03Castor+Pigeonpea 30 0.49Cotton 3 0.04Green gram 2 0.02Horsegram 2 0.01Maize 6 0.07Maize+Pigeonpea 9 0.12Paddy 25 0.19Pearl millet 2 0.01Sorghum 14 0.17Sorghum+Pigeonpea 20 0.23Pigeonpea 4 0.05
RabiGroundnut 15 0.19Horsegram 5 0.04Paddy 8 0.061. Sample size (n) = 65.
Table 11. Average fertilizer usage for major crops in Malleboinpally.
CropNo. ofplots
% plotsfertilized
DAP(kg ha-1)
Urea(kg ha-1)
FYM(t ha-1)
Castor 23 56.5 47.3 13.6 0.5Finger millet 10 60.0 45.0 4.9 0.7Maize 23 78.3 50.5 48.7 0.7Pigeonpea1 51 66.7 10.8 2.8 0.1Sorghum 44 61.4 42.2 9.5 0.5Paddy (Kharif) 27 96.3 142.6 169.4 1.0Paddy (Rabi) 9 100 153.7 208.6 0.2Groundnut (Rabi) 6 100 110.5 24.7 0.11. Grown as intercrop.
Fertilizer usage was more in rabi as compared to kharif. Application of FYM was higher in kharif as compared to that in rabi. This may be because of the practice of applying FYM during land preparation activities in the month of May.
In Mentapally, the highest fertilizer usage in kharif was in paddy where approximately 184 kg ha-1 of DAP and 144.5 kg ha-1 of urea were applied. Fertilizer use was also high for paddy (rabi) and groundnut (rabi) which are irrigated crops. FYM application was higher in kharif season for paddy at 0.7 t ha-1 as compared to 0.4 t ha-1 in rabi (Table 12).
j327_2007Report34final.indd 21j327_2007Report34final.indd 21 10/26/2007 4:58:10 PM10/26/2007 4:58:10 PM

22
CYANMAGENTAYELLOWBLACK
In Malleboinpally, the average yield of castor was 504 kg ha-1 (Table 13) which is higher than the average district yield (470 kg ha-1) for kharif season in 2002. Sorghum yield was 450 kg ha-1 which was much lower than the district average of 920 kg ha-1 and mandal average of 1765 kg ha-1. Eighty-fi ve percent of the sample plots with paddy were irrigated. In the remaining few cases, paddy was grown under dry conditions where paddy seeds were directly broadcasted without transplantation. The mean yields of paddy were 3076 kg ha-1 in kharif and 3048 kg ha-1 in rabi. The average yield of groundnut in Malleboinpally was 840 kg ha-1. Average yield of maize was about 1124 kg ha-1, which was lower than the average district yield (1175 kg ha-1). Pigeonpea was always grown as an intercrop with different crops namely castor, maize and sorghum with a mean yield of about 110 kg ha-1.
The coeffi cient of variation, computed as standard deviation as a percentage of mean, provides a measure for variability in the yields. Variability in yields was lower for irrigated crops such as paddy and groundnut.
In Mentapally, the mean yield of castor was 335 kg ha-1 which was lower than the district average (Table 14). The mean yield of maize (719 kg ha-1) was also lower than the mean district yield (1175 kg ha-1). The average sorghum yield was 431 kg ha-1, which was lower than the district average (921 kg ha-1) and also the mandal average (805 kg ha-1). Pigeonpea was mainly grown as an intercrop with castor, maize and sorghum with a mean yield of 90 kg ha-1.
Table 12. Average fertilizer usage for major crops in Mentapally.
CropNo. ofplots
% plotsfertilized
DAP(kg ha-1)
Urea(kg ha-1)
Triple 17(kg ha-1)
FYM(t ha-1)
Castor 44 90.9 25.2 6.6 27.7 0.2Sorghum 34 67.7 22.1 7.9 8.6 0.3Maize 15 80 22.8 30.6 20.2 0.6Pigeonpea1 67 82.1 7.1 5.1 4.9 0.1Paddy (Kharif) 25 100 184.1 144.6 19.8 0.7Paddy (Rabi) 8 100 138.9 154.4 0.0 0.4Groundnut (Rabi) 15 100 120.8 67.2 0.0 0.5Horsegram (Rabi) 5 20 0.0 0.0 3.0 0.7Pearl millet 3 66.7 31.1 0.0 0.0 0.0Cotton 3 100 192.1 82.3 0.0 0.6Cowpea 3 66.7 0.0 0.0 7.2 0.01. Grown as intercrop.
Table 13. Mean yield and variability for the major crops in Malleboinpally.
CropNo. ofplots
% plotsirrigated
Mean yield(kg ha-1) CV
District yield(kg ha-1)
(2002–03)
Castor 23 0 504 63 470Finger millet 10 0 913 72 1093Maize 23 8.7 1124 73 1175Paddy (Kharif) 27 85 3076 51 2025Pigeonpea1 51 0 108 90 –Sorghum 44 0 450 69 920Groundnut (Rabi) 6 83.3 840 49 950Paddy (Rabi) 9 100 3048 52 20021. Grown as intercrop.
j327_2007Report34final.indd 22j327_2007Report34final.indd 22 10/26/2007 4:58:10 PM10/26/2007 4:58:10 PM

23
CYANMAGENTAYELLOWBLACK
The mean yields of paddy were 3271 kg ha-1 in kharif and 3743 kg ha-1 in rabi and were higher than the district average yields. The mean yield of groundnut was 1067 kg ha-1. The variability is lower for both the irrigated crops (paddy and groundnut) when compared with rainfed crops.
Livestock production
Livestock has an important role in the livelihood strategies of rural households. The types of livestock include dairy animals (cows and buffaloes), draught animals (bullocks), other cattle for meat, small ruminants (sheep and goats) and chicken. The crop-livestock interactions are complementary in nature.
In Malleboinpally, 32% of the sample households did not own any livestock; 56.7% of the households had no milch animals and 73.3% of the households had no bullocks. The average ownership of different animals was 1.17 milching buffaloes, 0.38 other she-buffaloes, 0.18 milching cows, 0.28 bullocks, 2.23 sheep and 2.08 goats (Table 15).
Table 14. Mean yield and variability for the major crops in Mentapally.
CropNo. ofplots
% plotsirrigated
Mean yield(kg ha-1) CV
District yield (kg ha-1)
(2002–03)
Castor 44 0 335 62 471Maize 15 0 719 100 1175Paddy (Kharif) 25 88 3271 41 2025Sorghum 34 0 431 71 921Pigeonpea1 67 0 90 97 –Groundnut (Rabi) 15 87 1067 33 951Horsegram (Rabi) 5 0 285 73 127Paddy (Rabi) 8 100 3743 20 20021. Grown as intercrop.
Table 15. Livestock ownership (number household-1) in Malleboinpally.
Livestock1 Mean Minimum Maximum
Milching cows 0.18 (0.54)2 0 2Milching buffaloes 1.17 (1.89) 0 6Other cows 0.03 (0.18) 0 1Bullocks 0.28 (0.67) 0 2Heifers (cows) 0.02 (0.13) 0 1Bulls 0.12 (0.56) 0 3Calves 0.20 (0.51) 0 2Other she-buffaloes 0.38 (1.14) 0 5Heifers (buffaloes) 0.10 (0.40) 0 2Calves 0.72 (1.49) 0 6Sheep 2.23 (12.08) 0 80Goats 2.08 (5.55) 0 21Chicken 1.67 (3.51) 0 17TLU 2.68 (3.53) 0 151. Sample size (n) = 60; TLU = Tropical livestock unit.2. Figures in parentheses are standard deviation values.
j327_2007Report34final.indd 23j327_2007Report34final.indd 23 10/26/2007 4:58:10 PM10/26/2007 4:58:10 PM

24
CYANMAGENTAYELLOWBLACK
The animal populations were aggregated by taking the number of each kind and multiplied by a factor to convert into a standard tropical livestock unit (TLU). A TLU is an animal unit used to aggregate different classes of livestock. One TLU equals an animal of 250 kg live weight. Sheep, goats and cattle were assigned 0.1, 0.1 and 0.7 TLU per head, respectively and buffalo was counted as 1 TLU (Nordblom et al. 1997). The average TLU for Malleboinpally was 2.68 with maximum TLU of 15.
In Mentapally, 38.46% of the sample households did not have any livestock; 76.92% of the households were without any milch animals and 55.38% had no bullocks. The average ownership of animals was 0.97 for bullocks, 0.34 for milching buffaloes, 0.08 for sheep and 0.03 for goats (Table 16). The average TLU was 1.47 with a maximum of 8.95. In general, Mentapally had relatively lower livestock holdings when compared with Malleboinpally.
Table 16. Livestock ownership (number household-1) in Mentapally.
Livestock1 Mean Minimum Maximum
Milching cows 0.08 (0.37)2 0 2Milching buffaloes 0.34 (0.91) 0 6Other cows 0.11 (0.40) 0 2Bullocks 0.97 (1.16) 0 4Heifers (cows) 0.09 (0.34) 0 2Bulls 0.11 (0.36) 0 2Calves 0.12 (0.33) 0 1Other she-buffaloes 0.06 (0.30) 0 2Heifers (buffaloes) 0.06 (0.24) 0 1Calves 0.09 (0.29) 0 1Sheep 0.08 (0.51) 0 4Goats 0.03 (0.25) 0 2Chicken 1.51 (3.38) 0 14TLU 1.47 (1.79) 0 8.951. Sample size (n) = 65; TLU = Tropical livestock unit. 2. Figures in parentheses are standard deviation values.
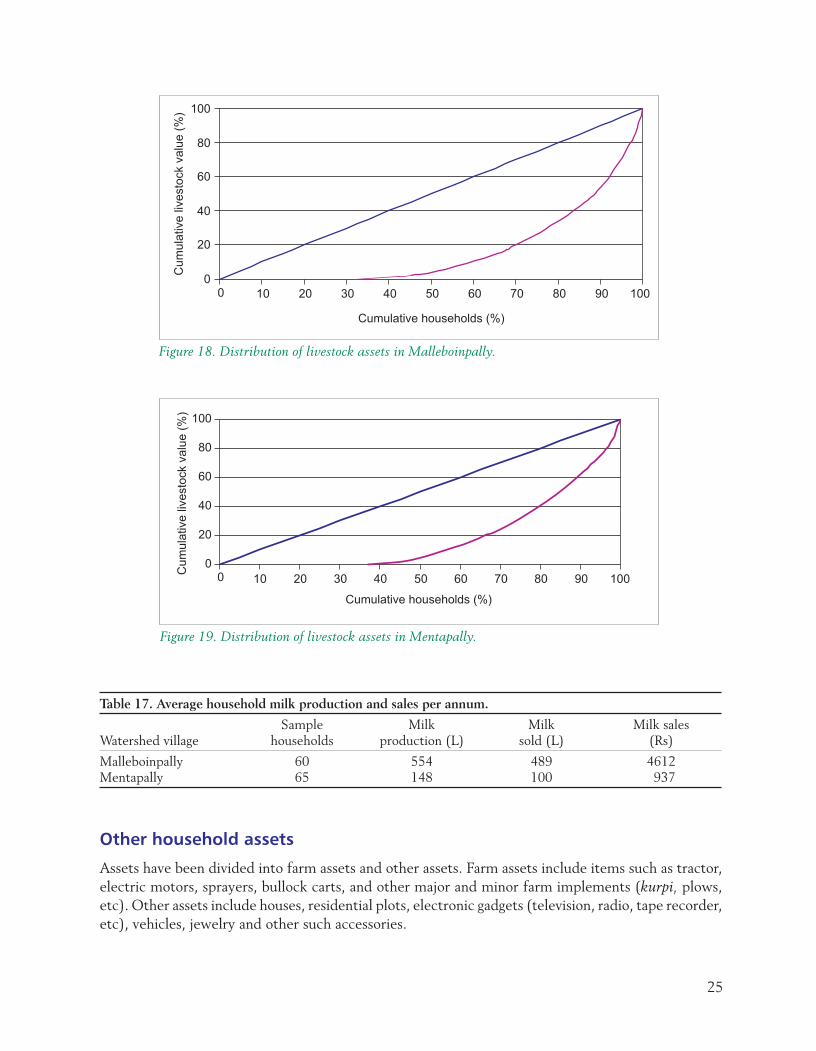
Figures 18 and 19 provide insights into the distribution of value of livestock assets among the sample households in the respective villages. Inequalities seem to exist regarding livestock assets among the sample households. In Malleboinpally, 85% of total sample households possess only 42% of the total value of livestock assets. In Mentapally, 81% of total sample households own 43% of total value of livestock assets.
Livestock assets owned by Madigas were low and relatively high among certain castes. Kurvas traditionally have livestock-based occupations and have the highest average livestock asset ownership valued at Rs 31271 per household. Reddy caste also has substantial livestock assets with an average value of Rs 25734 per household.
The important livestock products include milk, meat, FYM, draught power and transportation. The average milk production and sales per annum for a household were much higher in Malleboinpally as compared to Mentapally (Table 17). In Malleboinpally, the sample average of milk produced per annum was 554 L and milk sold was 489 L whereas in Mentapally, the sample average of milk produced per annum was only 148 L and milk sold was about 100 L.
j327_2007Report34final.indd 24j327_2007Report34final.indd 24 10/26/2007 4:58:10 PM10/26/2007 4:58:10 PM
25
CYANMAGENTAYELLOWBLACK
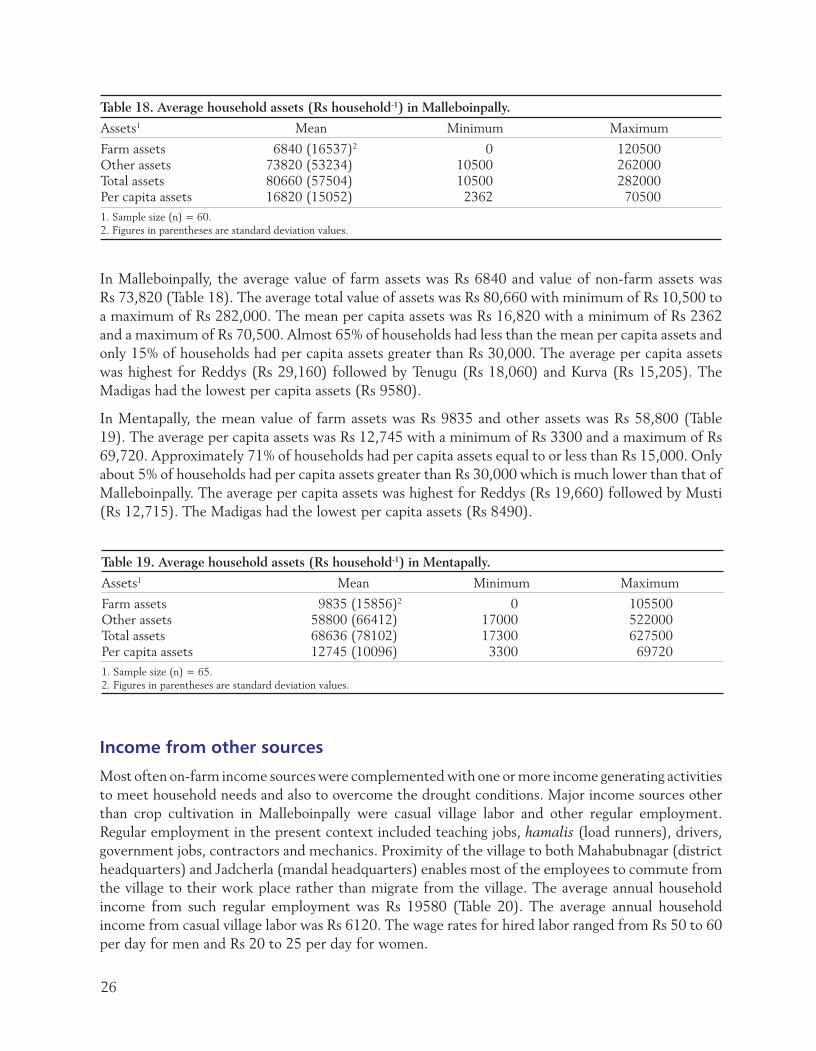
Other household assets
Assets have been divided into farm assets and other assets. Farm assets include items such as tractor, electric motors, sprayers, bullock carts, and other major and minor farm implements (kurpi, plows, etc). Other assets include houses, residential plots, electronic gadgets (television, radio, tape recorder, etc), vehicles, jewelry and other such accessories.
Figure 18. Distribution of livestock assets in Malleboinpally.
Figure 19. Distribution of livestock assets in Mentapally.
Table 17. Average household milk production and sales per annum.
Watershed villageSample
householdsMilk
production (L)Milk
sold (L)Milk sales
(Rs)
Malleboinpally 60 554 489 4612Mentapally 65 148 100 937
j327_2007Report34final.indd 25j327_2007Report34final.indd 25 10/26/2007 4:58:10 PM10/26/2007 4:58:10 PM
26
CYANMAGENTAYELLOWBLACK
In Malleboinpally, the average value of farm assets was Rs 6840 and value of non-farm assets wasRs 73,820 (Table 18). The average total value of assets was Rs 80,660 with minimum of Rs 10,500 to a maximum of Rs 282,000. The mean per capita assets was Rs 16,820 with a minimum of Rs 2362 and a maximum of Rs 70,500. Almost 65% of households had less than the mean per capita assets and only 15% of households had per capita assets greater than Rs 30,000. The average per capita assets was highest for Reddys (Rs 29,160) followed by Tenugu (Rs 18,060) and Kurva (Rs 15,205). The Madigas had the lowest per capita assets (Rs 9580).
In Mentapally, the mean value of farm assets was Rs 9835 and other assets was Rs 58,800 (Table 19). The average per capita assets was Rs 12,745 with a minimum of Rs 3300 and a maximum of Rs 69,720. Approximately 71% of households had per capita assets equal to or less than Rs 15,000. Only about 5% of households had per capita assets greater than Rs 30,000 which is much lower than that of Malleboinpally. The average per capita assets was highest for Reddys (Rs 19,660) followed by Musti (Rs 12,715). The Madigas had the lowest per capita assets (Rs 8490).
Table 18. Average household assets (Rs household-1) in Malleboinpally.
Assets1 Mean Minimum Maximum
Farm assets 6840 (16537)2 0 120500Other assets 73820 (53234) 10500 262000Total assets 80660 (57504) 10500 282000Per capita assets 16820 (15052) 2362 705001. Sample size (n) = 60.2. Figures in parentheses are standard deviation values.
Table 19. Average household assets (Rs household-1) in Mentapally.
Assets1 Mean Minimum Maximum
Farm assets 9835 (15856)2 0 105500Other assets 58800 (66412) 17000 522000Total assets 68636 (78102) 17300 627500Per capita assets 12745 (10096) 3300 697201. Sample size (n) = 65.2. Figures in parentheses are standard deviation values.
Income from other sources
Most often on-farm income sources were complemented with one or more income generating activities to meet household needs and also to overcome the drought conditions. Major income sources other than crop cultivation in Malleboinpally were casual village labor and other regular employment. Regular employment in the present context included teaching jobs, hamalis (load runners), drivers, government jobs, contractors and mechanics. Proximity of the village to both Mahabubnagar (district headquarters) and Jadcherla (mandal headquarters) enables most of the employees to commute from the village to their work place rather than migrate from the village. The average annual household income from such regular employment was Rs 19580 (Table 20). The average annual household income from casual village labor was Rs 6120. The wage rates for hired labor ranged from Rs 50 to 60 per day for men and Rs 20 to 25 per day for women.
j327_2007Report34final.indd 26j327_2007Report34final.indd 26 10/26/2007 4:58:10 PM10/26/2007 4:58:10 PM

27
CYANMAGENTAYELLOWBLACK
The types of varied sources of income were many in Mentapally as compared to Malleboinpally. The majority of households were involved in casual village labor with mean income of Rs 6130. The wage rates were Rs 50 for men and Rs 20 to 25 per day for women. Migration was the other important source of income with a mean income of Rs 5850. Migration was widely prevalent in Mentapally due to drought. Also a labor contract system exists in the village, wherein a village contractor hires the laborers to work on construction projects (roads, etc) within the state and sometimes outside the state. Other sources of income include rented out bullocks (Rs 745) and business income (Rs 4730) (Table 20).
Household income
Total income of a household is a combination of various income generating activities such as crop cultivation, livestock and other sources of income. The net returns from crop production were calculated by deducting the total crop expenditure from the total production value. Crop expenditure included hired labor expenses, expenditure on seed (own + bought), irrigation costs (own + bought), fertilizers, pesticides, sheep penning and FYM (own + bought). Other capital costs included expenditure on hired bullocks, tractor hiring cost, and expenditure on sprayers and threshing machine. Total production value is the total output from the crop multiplied by its harvest price. The harvest prices used were the average prices for the respective variety, crop and village.
Livestock income includes income from milk sales, value of own bullocks used for traction, value of FYM used from own livestock, income from sale of goats and sheep, income from sale of buffaloes, bullocks and cows (annualized using their life expectancies), and value of new born cattle. Maintenance expenditure of livestock includes value of green fodder and dry fodder (own + bought) and other costs such as medicines and labor. Net returns were computed by deducting the maintenance costs from total income from livestock. Income from other sources includes income from casual village labor, caste occupation, regular employment, migration income, business net income, sale from CPR and any other sources. Finally, the total income of a household is an aggregation of crop income, livestock income and income from all other sources.
The average net return from crop cultivation was Rs 3970 in Malleboinpally, which is much lower than that of Mentapally (Rs 7775). The average livestock income was higher in Malleboinpally (Rs 7650) as compared to Mentapally (Rs 2105) since livestock holdings were relatively high in Malleboinpally (Table 21).
Table 20. Other major sources of household income.
Village Source of income No. of
householdsMean annualincome (Rs)
Malleboinpally (n=60) Casual village labor 35 6120Other regular employment 31 19580Business net income 7 1240
Mentapally (n=65) Casual village labor 52 6130Migration income 19 5850Rented out bullocks 14 745Business net income 10 4730Other regular employment 8 2040
j327_2007Report34final.indd 27j327_2007Report34final.indd 27 10/26/2007 4:58:10 PM10/26/2007 4:58:10 PM

28
CYANMAGENTAYELLOWBLACK
Income from other sources was also higher in Malleboinpally, which can be expected because of its nearness to the mandal and district headquarters and since regular employment and remittances from migration were important sources of income as observed earlier. The average total income was also higher in Malleboinpally (Rs 41440) as compared to Mentapally (Rs 30630).
The contribution of different livelihood sources to the total household income is shown in Figure 20. Other sources of income were important in both the villages but more so in Malleboinpally (72% of total income). Crop income was more predominant in Mentapally (25% of total income) when compared with Malleboinpally.
Table 21. Average net returns from various sources.
Source of incomeMalleboinpally
(n=60)Mentapally
(n=65)
Crop income (Rs) 3970 7775Livestock income (Rs) 7650 2105Other income (Rs) 29820 20750Total income (Rs) 41440 30630
Figure 20. Sources of household income.
Mentapally was poor in livestock resources and hence livestock income was low. The contribution of livestock to the average household income was about 7% in Mentapally when compared to 18.5% in Malleboinpally. In general, Mentapally has more of an agricultural based economy whereas Malleboinpally economy was based on external sources of income.
Groundwater resources
Groundwater levels have been depleting over the period. Nearly 77% of open wells have dried up in Malleboinpally and about 98% dried up in Mentapally (Table 22). Even though tube wells were
j327_2007Report34final.indd 28j327_2007Report34final.indd 28 10/26/2007 4:58:10 PM10/26/2007 4:58:10 PM

29
CYANMAGENTAYELLOWBLACK
the main source of irrigation in both the villages (with 44% functional in Malleboinpally and 81% functional in Mentapally), the farmers noticed depleting groundwater reserves and had to go to greater depths to get suffi cient water. Most of the farmers felt that there should be some sort of restriction on the number of tube wells drilled. But the modalities of such regulations need to be studied in more detail, so that those already owning tube wells do not have an advantage over those not owning a tube well.
Common property resources
Common property resources are considered as a form of natural and social capital (Turton 2000). These act as a source of fuel and fodder for the rural poor in many cases. They also provide the raw material for different livelihood activities such as leaf-plate making, basket making and livestock grazing. Malleboinpally has about 91 ha under CPR whereas Mentapally has only 4.05 ha. The area under CPR was not signifi cant in Mentapally village.
At present access to CPR is not restricted in the concerned watershed villages. The landless and poor people depend on CPR for fi rewood, raw material for making leaf-plates and grazing of their livestock. For any decision on future restrictions on CPR, the opinion of those who will be directly affected by such decisions (landless and poor) should be considered.
Role of project implementing agencies in watershed management
The PIAs have much to contribute to institutional sustainability beyond the four-year implementation period and can assist with confl ict resolution and forge long-term development links (Turton and Farrington 1998). Some of the important criteria for selection of PIAs to support village organizations include the extent to which they have achieved recognition with organizations of the people and of government; and the length of time for which they have been active in the area (Farrington and Lobo 1997).
The guidelines for watershed development (1994–95) and the revised guidelines in 2001 in the past did not envisage a pivotal role for the Panchayat Raj institutions in the implementation of watershed projects and the concept of Watershed Association and Watershed Committee at the village level was prevalent. The Ministry of Rural Development modifi ed the existing provisions and brought out the new revised “Guidelines for Hariyali” in 2003 (GoI 2003). Under these guidelines, more power is vested in the Panchayat Raj institutions. According to these guidelines, at the fi eld level, the gram panchayats would implement the projects under the overall supervision and guidance of PIAs. Panchayat may be the PIA for all the projects sanctioned to a particular Block or Taluka. Under
Table 22. Number of wells in the watershed villages.
Wells Dried Functional Total
MalleboinpallyOpen wells 27 (77)1 8 (23) 35Tube wells 35 (56) 27 (44) 62MentapallyOpen wells 108 (98) 2 (2) 110Tube wells 14 (19) 60 (81) 741. Figures in parentheses are percentage values.Source: Focus group meetings.
j327_2007Report34final.indd 29j327_2007Report34final.indd 29 10/26/2007 4:58:10 PM10/26/2007 4:58:10 PM

30
CYANMAGENTAYELLOWBLACK
the circumstances where panchayats are not adequately empowered, Zilla Parishad/District Rural Development Agency (DRDA) may use its discretion to appoint an NGO as PIA if it meets the eligibility criteria. Eligibility criteria require that the NGO has been active in the fi eld of watershed development or any similar area in rural areas for some years. But Hariyali guidelines were not operational immediately on their release.
Some of the arguments for involving Panchayat Raj institutions in watershed management were that they could be the natural apex body for linking watershed development with other objectives and that the management of commons and wasteland is under the control of gram panchayat (Baumann 2000). They also have the powers to raise revenue and collect taxes.
In Andhra Pradesh, the watershed activities were initiated prior to the Hariyali guidelines and the district line departments and the DRDAs managed most of the rural development activities through watershed associations. Springate-Baginski et al. (2002) suggested that active involvement of panchayat bodies or legalizing the existence of these watershed institutions through legislation might be important from the point of watershed program sustainability, which was also refl ected in the current revised guidelines.
In Malleboinpally, the PIA was Bharatiya Agro Industries Foundation (BAIF) which was a non-local NGO with headquarters at Pune. The watershed activities such as construction of check-dams and other soil and water conservation structures were delayed since the NGO was not able to discharge its duties due to confl ict of interest with the local political leaders. In Mentapally, the PIA entrusted with the watershed development activities was Society for Development of Drought Prone Area (SDDPA) with headquarters at Wanaparthy (mandal headquarters). But the awareness among the villagers about SDDPA was limited.
Selection of an NGO-PIA is an important issue and should be based on its suitability to a specifi c location. Sometimes, even though the overall capacity and track record of implementing watershed projects of an NGO in the district may be good it is possible that political and other cultural environment may not be conducive.
Summary and conclusions
The baseline analysis of the watershed villages, Malleboinpally and Mentapally, provides information on the major income generating activities in the villages, land ownership and distribution aspects, cropping patterns, agricultural practices, livestock holdings, water availability for irrigation and other constraints or problems in the villages. This serves as a baseline in the process of monitoring and evaluation of socioeconomic and environmental impacts of the watershed interventions.
A thorough understanding of the village social structure ensures the realization of watershed development goals especially the equity and sustainability objectives. The caste structure in the village is closely associated with landholdings, livestock holdings, assets and livelihood strategies. Malleboinpally had a more heterogeneous caste structure with about 15 castes as compared to only 5 castes in Mentapally. The major castes in Malleboinpally were Madiga, Reddy, Kurva and Tenugu. The minor castes were Kammari, Gowda and Erukula. In Mentapally, the major castes were Madiga, Reddy and Musti and other minor castes were Vysya and Gowda.
In Malleboinpally, about 91% of the cultivated area was dryland and remaining 9% was irrigated and in Mentapally, dryland cultivation accounted for about 85% of the total cultivated area and the remaining
j327_2007Report34final.indd 30j327_2007Report34final.indd 30 10/26/2007 4:58:10 PM10/26/2007 4:58:10 PM

31
CYANMAGENTAYELLOWBLACK
15% consisted of irrigated land. The average land ownership in Malleboinpally was 1.58 ha and in Mentapally it was 2.39 ha. There was an unequal distribution of land in both the villages and the Gini coeffi cients computed indicate that the land inequality was relatively higher in Malleboinpally.
The major crops cultivated in the villages were dryland crops such as castor, sorghum, maize and pigeonpea. Pigeonpea was mainly grown as an intercrop with castor, sorghum or maize. In spite of water scarcity, paddy was still the popular crop. The cropping pattern was broadly similar in both the villages. There has been a shift towards castor and maize in both the villages in the 2002 cropping season. Cotton was low on the farmer’s priority because of pest incidence and the costs associated with their control. Crop yields, in general, have been low in both the villages when compared to the district averages. In Malleboinpally, the average yields of castor (504 kg ha-1), sorghum (449.5 kg ha-1), maize (1124 kg ha-1) and groundnut (840 kg ha-1) were lower than their respective district averages. Similarly in Mentapally also, the average yields of castor (334.5 kg ha-1), sorghum (431 kg ha-1) and maize (719 kg ha-1) were lower than the district averages. Yields were low due to poor rainfall in these areas. In the irrigated crops such as paddy, the yields were higher than the district averages in both Malleboinpally and Mentapally villages.
Even though agriculture was an important occupation, the majority of farmers were supplementing their livelihoods through other activities such as hired labor and off-farm activities. A larger percentage of household members combined on-farm activities with one or more income generating activities to sustain the household needs and to overcome the drought conditions in the previous cropping season. In Malleboinpally, regular employment in neighboring towns was one of the major livelihood strategies. In Mentapally, migration was an important livelihood avenue. Therefore, there may always be a possibility that short-term strategies to cope with drought such as migration might as well become an adaptive strategy in the long run that could undermine the role of agriculture as a sustainable livelihood strategy. In such a scenario watershed development that enhances land and water productivity as well as sustainability will have a greater signifi cance.
On the gender issue, women play an important role in supporting their households. Women performed multiple tasks that include working on own farm, and working in local labor markets apart from the usual household activities. In Malleboinpally, about 54% of total sample women performed household chores and 46% of them were involved in on-farm activities. Thirty-fi ve percent of the sample women worked as hired labor. Similarly in Mentapally, 45.5% of sample women performed household chores, about 44% were involved in on-farm activities on their own land and 40.5% worked as hired labor.
Households in rural areas derive their livelihoods from various sources that include crop cultivation, livestock rearing and other non-farm activities. The average total annual household income was higher in Malleboinpally (Rs 41438) as compared to Mentapally (Rs 30631). Other non-farm sources of income were important in both the villages but more so in Malleboinpally (72% of total income). In Malleboinpally, because of its proximity to both mandal and district headquarters, opportunities for non-farm activities like regular government or private employment were more and therefore contribution of these activities to the total household income was signifi cant. Crop income was more predominant in Mentapally (about 25% of total income) when compared with Malleboinpally (about 10% of total income). Mentapally was poor in livestock resources and hence income from livestock was very small.
Groundwater reserves have been depleting over the period as was seen from the number of dried up open wells. Nearly 77% of open wells have dried up in Malleboinpally and about 98% dried up in Mentapally. Dependence on tube wells for irrigation has increased. Even though most of the tube
j327_2007Report34final.indd 31j327_2007Report34final.indd 31 10/26/2007 4:58:10 PM10/26/2007 4:58:10 PM

32
CYANMAGENTAYELLOWBLACK
wells appeared to be functional, farmers opine that the groundwater levels were declining and that they had to go to greater depths for adequate water supply.
Since watershed activities were initiated only recently in the villages, watershed related constructions such as check-dams, percolation tanks, etc have not been undertaken at the time of the survey. ICRISAT, as part of the consortium, provided castor, maize, sorghum and pigeonpea seed to some farmers for participatory evaluation and best-bet options. Apart from seed, the farmers also benefi ted from the technical support provided by ICRISAT-led consortium partners, in the form of IPM, INM, training for tropicultor use and other such activities. A dhal mill was initially put up at Mentapally (but recently moved to a nearby village, Kadukuntla, so that it could be easily accessible to the surrounding satellite villages including Mentapally). The dhal mill seems to have evoked a good response from the villagers and has the potential to be a viable income generating option.
The need for more participatory approach in watershed development involving all classes of people to promote collective action is required at this stage. The contribution of NGOs in the form of capacity building in their respective villages is a prerequisite for successful watershed development interventions and sustainability of the community assets created and their benefi ts. Therefore, selection of appropriate PIA in consultation with local population would be more effective. Since these were the nucleus watershed villages, the emphasis on promoting collective action is all the more important for scaling up and replicating the innovative farmer participatory consortium model to other neighboring and satellite villages.
3. Socioeconomic Profi les and Resource Use Patterns in Watersheds of Nalgonda DistrictThis section characterizes and assesses the baseline biophysical and socioeconomic conditions in the selected watersheds of Tirumalapuram in Chintapally mandal and Kacharam in Yadagirigutta mandal of Nalgonda district.
District profi le
Nalgonda is located at 17º03’ N and 79º02’ E in the state of Andhra Pradesh and spread over an area of 14,240 km2 with a population of about 3,238,440 (based on 2001 census). About 87% of the population was concentrated in the rural areas. Mining was the major activity in the district. Even though agriculture may not be comparable with mining activity, it is a major income generating and subsistence activity at the household level.
Major crops during 2002–03 cropping season in Nalgonda district were paddy, cotton, castor and green gram accounting for about 28%, 16%, 13% and 9% of gross cropped area, respectively(Fig. 21).
There was a decline in the total rainfall in Andhra Pradesh during 2002–03 by about 35% as compared to normal years. Consequently, the crop area also declined by 11.19%. The standing crops were badly affected in all the districts of the state due to prolonged dry spells in July and September 2002. Figure 22 compares the actual monthly rainfall during the monsoon period in 2002 in Nalgonda with the rainfall during normal years. In Nalgonda district, the total rainfall during June 2002 to May 2003 was only 447 mm as compared to 751 mm in normal years (decreased by about 40%).
j327_2007Report34final.indd 32j327_2007Report34final.indd 32 10/26/2007 4:58:10 PM10/26/2007 4:58:10 PM

33
CYANMAGENTAYELLOWBLACK
One of the major problems and constraint that affects the labor productivity in Nalgonda district is excess fl ourine in the drinking water that causes fl ourosis. Flourosis is a physically debilitating disease that leaves the affected person totally disabled. Nearly 500 villages in the district were affected by the problem. The normal fl ourine content in the drinking water was about 1 ppm whereas in the affected villages fl ourine content was about 10 ppm. In the watershed villages of Tirumalapuram and Kacharam, dental fl ourosis was more widely prevalent and villagers complained about their inability to do physical work in their farms due to joint pains.
Village characteristics
Tirumalapuram is located in Chintapally mandal at 78°87′ longitude and 16°81′ latitude. The distance to the mandal headquarters is about 5 km. Kacharam is located in Yadagirigutta mandal at 78°99′ longitude and 17°65′ latitude (Fig. 23). The distance to mandal headquarters is about 11 km and the nearest market town is Aleru (about 7 km). There were about 5 castes in Tirumalapuram with major
Figure 21. Area under major crops in 2002–03 in Nalgonda district.
Figure 22. Monsoon rainfall in 2002 in Nalgonda district.
j327_2007Report34final.indd 33j327_2007Report34final.indd 33 10/26/2007 4:58:10 PM10/26/2007 4:58:10 PM

34
CYANMAGENTAYELLOWBLACK
castes being Madiga and Velama. In Kacharam, there were about 18 castes with Reddy, Madiga and Kurma being the major castes.
The total village area of Tirumalapuram was 518 ha of which 81% consisted of cultivated area and 16% was under permanent fallow (Table 23). About 86% of cultivated area was under dryland agriculture and 14% under irrigated cultivation.
The area of Kacharam village was about 662 ha. Cultivated area accounted for 78% of total area and 15.6% was under permanent fallow; 71% of the cultivated area was under dryland agriculture and 29% was irrigated. The CPR were more in Kacharam (about 35 ha) as compared to Tirumalapuram (12 ha). In Kacharam, the CPR consisted of Acacia trees (sarkar thumma) on about 29.5 ha that were protected by the village panchayat.
Figure 23. Watershed locations in Nalgonda district.
j327_2007Report34final.indd 34j327_2007Report34final.indd 34 10/26/2007 4:58:10 PM10/26/2007 4:58:10 PM

35
CYANMAGENTAYELLOWBLACK
The major soil types in both the villages were red soils, deep black soils (nalla regadi) and sodic soils (choudu). The major crops in Tirumalapuram were paddy, sorghum, castor and pigeonpea (grown as an intercrop). The main crops in Kacharam were paddy, maize, cotton, sesame, green gram, castor and sorghum.
Demographic characteristics
The average age of household head in Tirumalapuram was 48 years with mean education level of 3 years (Table 24); 80.5% of household heads had education of less than 5 years. The average family size was 4.79. Sixty-fi ve percent of sample households had a family size of more than 4. The work force was computed as a weighted sum of individuals in the age groups of 11–15 years, 16–55 years and 56–65 years with weights of 0.25, 1.00 and 0.25, respectively (Shiferaw et al. 2002). The average weighted work force for Tirumalapuram was 2.94 persons per household. Household members below 10 years of age and those above 65 years were considered as dependents. The dependency ratio was computed as the ratio of non-working members to working family members (Shiferaw et al. 2002). The average dependency ratio of 0.28 indicates that every working family member supported 0.28 persons.
Table 23. General characteristics of the selected villages in Nalgonda district.
Characteristics Tirumalapuram Kacharam
Total cultivated area (ha) 421.9 (81.4)1 518.6 (78.3)- Irrigated cultivated (ha) 60.7 149.8- Dryland cultivated (ha) 364.4 368.8Permanent fallow (private) (ha) 84.2 (16.3) 103.2 (15.6)CPR and forest area (ha) 12.1 (2.3) 35.2 (5.3)Other land (settlements, etc) (ha) 4.0 (0.8) 5.3 (0.8)Total village area (ha) 518.2 (100) 662.3 (100)1. Figures in parentheses are percentage values.Source: Focus group meetings.
Table 24. Demographic details of Tirumalapuram1.
Characteristics Mean SD Minimum Maximum
Age of household head (yr) 48.18 13.75 25 75Education of household head (yr) 2.9 4.31 0 19Education of family (yr) 2.89 2.79 0 10.25Persons below 5 years 0.56 0.87 0 3Persons 6–10 years 0.58 0.78 0 3Persons 11–15 years 0.39 0.64 0 3Persons 16–55 years 2.74 1.52 0 8Persons 56–65 years 0.43 0.53 0 2Persons above 65 years 0.29 0.52 0 2Family size 4.79 1.99 1 10Total work force 2.94 1.50 0 8.25Dependents 0.76 0.80 0 3Dependency ratio 0.28 0.33 0 11. Sample size (n) = 72; SD = Standard deviation.
j327_2007Report34final.indd 35j327_2007Report34final.indd 35 10/26/2007 4:58:11 PM10/26/2007 4:58:11 PM

36
CYANMAGENTAYELLOWBLACK
The average age and education of household head in Kacharam was 47 years and 4 years of education (Table 25). About 70% of the household heads had less than 5 years of education. The average family size (4.83) was almost same as in Tirumalapuram. The dependency ratio was 0.19.
Table 25. Demographic details of Kacharam1.
Characteristics Mean SD Minimum Maximum
Age of household head (yr) 46.94 11.76 23 76Education of household head (yr) 4.03 4.08 0 15Education of family (yr) 5.19 2.67 0 12.5Persons below 5 years 0.20 0.52 0 2Persons 6–10 years 0.51 0.71 0 3Persons 11–15 years 0.59 0.70 0 2Persons 16–55 years 3.00 1.25 0 7Persons 56–65 years 0.40 0.63 0 2Persons above 65 years 0.17 0.43 0 2Family size 4.83 1.71 2 12Total work force 3.25 1.23 0.5 7.5Dependents 0.58 0.72 0 3Dependency ratio 0.19 0.28 0 1.51. Sample size (n) = 90; SD = Standard deviation.
Figure 24. Household activities in Tirumalapuram.
Household activities
In Tirumalapuram, 52% of the women were involved in household chores, 41% worked as hired labor and 37% of them were involved in their own farm work (Fig. 24). Often, women from the SC category usually work as hired labor. Men were mainly involved in on-farm activities (41%). In Kacharam, 61% of women were involved in household chores and 45% in on-farm work. Men were mainly involved in on-farm activities (46%) and other income-generating activities (28%) (Fig. 25).
Caste composition
Caste system still forms the basis of the social structure in the Indian villages. Even though rigid social demarcation does not exist anymore, families and individuals are still identifi ed on the basis of their respective castes. In Tirumalapuram, SC constituted the major caste category (about 61% of total
j327_2007Report34final.indd 36j327_2007Report34final.indd 36 10/26/2007 4:58:11 PM10/26/2007 4:58:11 PM

37
CYANMAGENTAYELLOWBLACK
households) followed by OC category (35%). The two major castes in the village were Vellamas (OC) and Madigas (SC) (Fig. 26).
In Kacharam, BC constituted the major caste category (about 52% of total households) with almost equal representation of OC and SC (22% and 21%, respectively) (Fig. 27). The major castes in the village were Reddys (OC), Kurma (BC) and Madigas (SC). The caste structure in Kacharam was more heterogenous than in Tirumalapuram.
Figure 25. Household activities in Kacharam.
Figure 26. Caste categories in Tirumalapuram.
Figure 27. Caste categories in Kacharam.
j327_2007Report34final.indd 37j327_2007Report34final.indd 37 10/26/2007 4:58:11 PM10/26/2007 4:58:11 PM

38
CYANMAGENTAYELLOWBLACK
Land ownership
The average land ownership was 3.67 ha in Tirumalapuram with a standard deviation of 5.61 and 2.76 ha in Kacharam with a standard deviation of 2.59 (Tables 26 and 27). The average per capita land in Tirumalapuram was almost double that of Kacharam. The average irrigated cultivated land was relatively higher in Tirumalapuram (0.70 ha) as compared to Kacharam (0.15 ha). This may be due to the existence of several tanks in the village that become the major source of irrigation with the advent of adequate rains. In both the villages the average dryland cultivated land was higher than the irrigated cultivated land.
Table 27. Land ownership in Kacharam1.
Variable Mean SD Minimum Maximum
Total own land (ha) 2.76 2.59 0 11.74Irrigable land (ha) 0.61 0.69 0 3.64Dryland (ha) 2.15 2.13 0 9.72Irrigated own cultivated land (ha) 0.15 0.29 0 1.42Dryland own cultivated land (ha) 1.36 1.31 0 7.29Permanent fallow (ha) 0.78 1.44 0 8.06Per capita land (ha) 0.56 0.41 0 2.221. Sample size (n) = 90; SD= Standard deviation.
Table 26. Land ownership in Tirumalapuram1.
Variable Mean SD Minimum Maximum
Total own land (ha) 3.67 5.61 0 30.36Irrigable land (ha) 0.80 1.66 0 10.93Dryland (ha) 2.87 4.66 0 27.94Irrigated own cultivated land (ha) 0.70 1.64 0 10.93Dryland own cultivated land (ha) 1.21 1.47 0 7.09Permanent fallow (ha) 0.80 1.86 0 11.34Per capita land (ha) 1.08 2.22 0 15.181. Sample size (n) = 72; SD= Standard deviation.
Even though the average landholdings appear to be higher in Tirumalapuram, analysis of the land distribution provides better insights into the landholding patterns in the villages. The OC category had larger landholdings in both villages. In Tirumalapuram, on average, OC, BC and SC hold about 8.22 ha, 2.85 ha and 1.14 ha of land, respectively (Fig. 28). The average landholdings and per capita landholdings of OC were very much higher than other categories indicating considerable inequalities in land distribution. The average landholding of OC was almost 3 times that of BC and 7 times that of SC. In Kacharam, the average land ownership was 4.37 ha for OC, 2.49 ha for BC and 1.91 ha for SC and 0.43 ha for muslims (Fig. 29). The OC category had a higher average land ownership. But the difference in land ownership between OC and other categories was not as prominent as in the case of Tirumalapuram. The per capita landholdings also show similar pattern.
The land distribution patterns can be illustrated through Lorenz curves. The 45 degrees angle straight line shows the land distribution under perfect equality conditions. The curved line shows the actual distribution of land. Greater the distance from the straight line, greater the inequalities in the land distribution. Figures 30 and 31 show that land inequalities were higher in Tirumalapuram as compared to Kacharam. In Tirumalapuram, about 75% of land was owned by 25% of households. Velamas who form the dominant caste own higher per capita land as compared to other categories in the
j327_2007Report34final.indd 38j327_2007Report34final.indd 38 10/26/2007 4:58:11 PM10/26/2007 4:58:11 PM

39
CYANMAGENTAYELLOWBLACK
Figure 28. Caste-wise landholdings in Tirumalapuram.
Figure 29. Caste-wise landholdings in Kacharam.
Figure 30. Land distribution in Tirumalapuram.
j327_2007Report34final.indd 39j327_2007Report34final.indd 39 10/26/2007 4:58:11 PM10/26/2007 4:58:11 PM

40
CYANMAGENTAYELLOWBLACK
village. In Kacharam, 20% of households own about 50% of land. The Gini coeffi cient was 0.65 in Tirumalapuram and 0.47 in Kacharam indicating higher land inequalities in Tirumalapuram.
Crop production
The major dryland crops in Tirumalapuram were castor, sorghum and pearl millet, which are grown with pigeonpea as intercrop. Paddy was also grown to a considerable extent depending on the availability of water. In kharif, castor and pigeonpea intercrop system was relatively more common with a mean plot size of 0.56 ha followed by paddy with mean plot size of 0.30 ha (Table 28).
Figure 31. Land distribution in Kacharam.
Table 28. Mean area of major crops grown in Tirumalapuram1.
Crop No. of plots Mean area (ha)
KharifCastor+Pigeonpea 41 0.56Green gram 5 0.07Green gram+Pigeonpea 1 0.04Paddy 28 0.30Pearl millet 10 0.07Pearl millet+Pigeonpea 11 0.06Pigeonpea (sole) 2 0.08Sorghum 2 0.01Sorghum+Pigeonpea 11 0.08
RabiPaddy 9 0.05
PerennialSweet lemon 8 0.191. Sample size (n) = 72.
In Kacharam, the major crops were maize, sesame, sorghum, cotton and green gram. Maize, sesame and sorghum were mainly grown with pigeonpea as intercrop (Table 29). Paddy was also an important irrigated crop in kharif and rabi seasons. Maize was a recent crop (since last two years) and currently popular among the farmers. Tobacco was popular in the past but now it was grown by only a few farmers. In general, more crops were grown in Kacharam as compared to Tirumalapuram.
j327_2007Report34final.indd 40j327_2007Report34final.indd 40 10/26/2007 4:58:11 PM10/26/2007 4:58:11 PM

41
CYANMAGENTAYELLOWBLACK
Fertilizer usage and FYM application were more for irrigated crops such as paddy. In Tirumalapuram, about 141 kg ha-1 of DAP and 222 kg ha-1 of urea were applied in kharif (Table 30). In rabi also fertilizer application was almost similar. Fertilizer and FYM usage was relatively higher in Kacharam as compared to Tirumalapuram. In Kacharam, about 171 kg ha-1 of DAP and 224 kg ha-1 of urea were applied for paddy in kharif and 210 kg ha-1 of DAP and 230.5 kg ha-1 of urea in rabi season (Table 31). About 88.5 kg ha-1 of DAP was applied for castor in Kacharam as compared to only 18.4 kg ha-1 in Tirumalapuram. Even though the average quantity of commonly used fertilizers such as DAP and urea were lower in Tirumalapuram, other fertilizers such as triple 17, superphosphate and micronutrients were more frequently used as compared to Kacharam.
The average yields of almost all the major crops in Tirumalapuram were higher than the district average of the 2002–03 cropping season (Table 32). The average yield of castor was 390 kg ha-1 as compared to the district mean of 206 kg ha-1. The yields of paddy and sorghum were almost double that of the district mean yields. This may be due to good quality soils coupled with adequate groundwater
Table 29. Mean area of major crops grown in Kacharam1.
Crop No. of plots Mean area (ha)
KharifCastor 4 0.02Castor+Pigeonpea 6 0.06Cotton 19 0.16Cotton+Pigeonpea 1 0.02Green gram 13 0.02Maize 10 0.08Maize+Pigeonpea 49 0.45Paddy 39 0.13Pigeonpea (sole) 5 0.03Sesame 9 0.04Sesame+Pigeonpea 38 0.27Sorghum 13 0.08Sorghum+Pigeonpea 18 0.10Sorghum fodder 9 0.03Tobacco 10 0.07
RabiPaddy 13 0.03Sorghum fodder 8 0.041. Sample size (n) = 90.
Table 30. Fertilizer usage for major crops in Tirumalapuram.
Crop
No.of
plots
% plots fertilized(kg ha-1)
DAP(kg ha-1)
Urea(kg ha-1)
Triple 17(kg ha-1)
Micro-nutrients(kg ha-1)
Zinc(kg ha-1)
Superphosphate(kg ha-1)
Potash(kg ha-1)
FYM(t ha-1)
Castor 42 92.86 18.4 1.1 14.4 0.3 0.7Green gram 6 100 25.5 14.7Paddy (Kharif) 28 92.86 140.7 222.3 39.0 0.9 1.6 9.7 2.9 3.4Paddy (Rabi) 9 100 144.1 248.4 77.8 0.0 8.2 13.7Pearl millet 21 90.48 38.7 2.4 2.2Sorghum 13 76.92 20.0 8.5Sweet lemon 8 87.5 0.0 0.0 32.4 6.2 61.0 228.5 37.1 2.3
j327_2007Report34final.indd 41j327_2007Report34final.indd 41 10/26/2007 4:58:11 PM10/26/2007 4:58:11 PM

42
CYANMAGENTAYELLOWBLACK
resources. Most of the farmers opined that majority of the tube wells yielded adequate water. The only constraint was the availability of continuous power supply.
In Kacharam also, the average yields of castor, paddy, sesame and sorghum were almost twice higher than the district mean yields (Table 33). But maize, which appeared to be popular in recent years among the farmers had lower average yield (850.6 kg ha-1) as compared to the district mean (2311 kg ha-1).
Livestock production
Livestock has an important role in the livelihood strategies of rural households. It includes dairy animals (cows and buffaloes), draught animals (bullocks), other cattle for meat, small ruminants (sheep and goats) and chicken. The crop-livestock interactions are complementary in nature.
In Tirumalapuram, 30.5% of the sample households did not own any livestock; 62.5% of the households had no milch animals and 68% of the households had no bullocks. The average ownership of different animals was 0.75 milching buffaloes, 0.15 other she-buffaloes, 0.21 milching cows, 0.81 bullocks, 0.35 other cows and 1.24 goats (Table 34).
Table 31. Fertilizer usage for major crops in Kacharam.
Crop
No.of
plots
% plots fertilized(kg ha-1)
DAP(kg ha-1)
Urea(kg ha-1)
Triple 17(kg ha-1)
Micro-nutrients(kg ha-1)
Zinc(kg ha-1)
Potash(kg ha-1)
FYM (t ha-1)
Castor 11 100 88.5 3.6 2.7Chili 3 100 301.9 54.9 43.9 6.6Cotton 20 100 148.6 111.6 18.5 3.0Green gram 13 53.85 58.9 5.7 2.4Maize 59 100 76.9 49.5 0.3 0.5 1.1Paddy (Kharif) 39 100 171.3 223.8 0.6 3.0 9.1Paddy (Rabi) 13 100 210.3 230.5 0.4 1.5Sesame 47 97.87 73.6 10.4 1.7Sorghum 31 87.1 49.4 15.7 1.1Sorghum fodder (Kharif)
9 88.89 43.9 140.0 9.5
Sorghum fodder (Rabi)
8 100 70.0 144.1 1.2
Tobacco 10 100 166.7 113.2 12.4 6.0
Table 32. Crop yields in Tirumalapuram during 2002–03.
CropNo. ofplots
% plots irrigated
Meanyield
(kg ha-1)
Minimumyield
(kg ha-1)
Maximumyield
(kg ha-1) CV
District yield
(kg ha-1)
Castor 42 0 390.2 0.0 906.1 46.2 206Green gram 6 0 289.2 197.7 494.2 41.2 347Paddy (Kharif) 28 88 4793.1 0.0 6054.1 28.4 2244Paddy (Rabi) 9 100 5039.1 3459.5 5765.8 13.8 2301Pearl millet 21 0 570.5 173.0 2471.1 92.5 413Pigeonpea1 62 0 118.3 0.0 370.7 79.8 –Sorghum 13 0 498.1 0.0 1235.5 73.4 2461. Intercrop.
j327_2007Report34final.indd 42j327_2007Report34final.indd 42 10/26/2007 4:58:11 PM10/26/2007 4:58:11 PM

43
CYANMAGENTAYELLOWBLACK
In Kacharam, 27.8% of the sample households did not have any livestock. About 43% of the households were without any milch animals and 69% had no bullocks. The average ownership of animals was 0.71 for bullocks, 1.07 for milching buffaloes, 0.54 for milching cows, 2.39 for sheep, 0.41 for goats and 6.1 for chicken (Table 35).
Figures 32 and 33 depict the distribution of value of livestock assets among the sample households in the respective villages. Inequalities seem to exist regarding livestock assets among the sample households. In Tirumalapuram, 75% of total sample households possess only 24% of the total value of livestock assets. In Kacharam, 75% of total sample households own 31% of total value of livestock assets. A caste-wise distribution of livestock assets provides some insights into such inequalities. Livestock assets owned by the SC category was less and relatively high among OC category in both the watershed villages.
The important livestock products include milk, meat, FYM, draught power and transportation. The average milk production and sales per annum for a household were much higher in Kacharam as compared to Tirumalapuram (Table 36). In Kacharam, the sample average of milk produced per
Table 33. Crop yields in Kacharam during 2002–03.
CropNo. of plots
% plots irrigated
Meanyield
(kg ha-1)
Minimumyield
(kg ha-1)
Maximumyield
(kg ha-1) CV
District yield
(kg ha-1)
Castor 11 0 489.0 123.6 1482.6 76.0 206Cotton 20 0 859.7 370.7 1976.8 43.4 –Green gram 13 0 252.0 0.0 988.4 111.6 347Maize 59 0 850.6 0.0 3088.8 72.8 2311Paddy (Kharif) 39 95 4880.2 0.0 7495.5 32.0 2244Paddy (Rabi) 13 100 5367.9 2965.3 9044.0 32.3 2301Pigeonpea1 110 0 147.7 0.0 794.3 88.3 –Sesame 47 0 238.2 0.0 593.1 67.8 62Sorghum 31 0 416.6 0.0 1647.4 101.2 246Tobacco 10 10 1021.8 148.3 1729.7 48.0 25251. Intercrop.
Table 34. Average livestock ownership (number household-1) in Tirumalapuram.
Variable1 Mean Minimum Maximum
Milching cows 0.21 (0.56)2 0 3Milching buffaloes 0.75 (1.93) 0 13Other cows 0.35 (0.65) 0 2Bullocks 0.81 (1.56) 0 8Heifers (cows) 0.21 (0.60) 0 3Bulls 0.19 (0.49) 0 2Calves 0.31 (0.66) 0 3Other she-buffaloes 0.15 (0.76) 0 6Heifers (buffaloes) 0.40 (1.32) 0 6Calves 0.35 (0.95) 0 6Sheep 0.00 (0.00) 0 0Goats 1.24 (3.00) 0 14Chicken 1.61 (2.53) 0 101. Sample size (n) = 72.2. Figures in parentheses are standard deviation values.
j327_2007Report34final.indd 43j327_2007Report34final.indd 43 10/26/2007 4:58:11 PM10/26/2007 4:58:11 PM

44
CYANMAGENTAYELLOWBLACK
Table 35. Average livestock ownership (number household-1) in Kacharam.
Variable1 Mean Minimum Maximum
Milching cows 0.54 (1.18)2 0 7Milching buffaloes 1.07 (1.32) 0 6Other cows 0.01 (0.11) 0 1Bullocks 0.71 (1.13) 0 4Heifers (cows) 0.14 (0.55) 0 4Bulls 0.02 (0.21) 0 2Calves 0.60 (1.16) 0 5Other she-buffaloes 0.11 (0.46) 0 3Heifers (buffaloes) 0.26 (0.63) 0 3Calves 0.49 (1.07) 0 6Sheep 2.39 (9.72) 0 60Goats 0.41 (3.20) 0 30Chicken 6.10 (52.66) 0 5001. Sample size (n) = 90.2. Figures in parentheses are standard deviation values.
Table 36. Average household milk production and sales per annum.
VillageSample
households Milk production
(L)Milk sold
(L)Milk sales
(Rs)
Tirumalapuram 72 318 228 2148Kacharam 90 1259 1124 10023
Figure 32. Distribution of livestock assets in Tirumalapuram.
Figure 33. Distribution of livestock assets in Kacharam.
j327_2007Report34final.indd 44j327_2007Report34final.indd 44 10/26/2007 4:58:11 PM10/26/2007 4:58:11 PM

45
CYANMAGENTAYELLOWBLACK
annum was 1259 L and milk sold was 1124 L, whereas in Tirumalapuram, the sample average of milk produced per annum was only 318 L and milk sold was 228 L. Even though one of the farmers’ group voluntarily performs milk testing and acts as a collecting point in the village, it was not as well organized as in Kacharam. In Kacharam, there was a dairy association that was politically strong and well organized. Many households also own Jersey cows, which yield higher milk than the conventional cows. The fodder for livestock was catered by the paragrass supply from Uppal, which is about 40 km from the village.
Other household assets
The average household assets in Tirumalapuram was Rs 127,653 (Table 37) with average per capita assets of Rs 35048. Ninety percent of the sample households had per capita assets less than the mean. This relatively large value of per capita assets may be due to the large assets of a few households.
The mean value of household assets in Kacharam was Rs 69179 and the average per capita value of assets was Rs 14424 (Table 38). About 62% of the sample households had assets less than the mean per capita assets. Even though the average value of total assets appeared to be much higher in Tirumalapuram, it was mainly due to a few economically well-off OC (Velama) community households that had large landholdings along with high household incomes from regular employment in government service.
Table 37. Average household assets (Rs household-1) in Tirumalapuram.
Variable1 Mean Minimum Maximum
Farm assets 27932 (92346)2 0 495000Other assets 99721 (322806) 1500 2466500Total assets 127653 (352567) 5800 2491400Per capita assets 35048 (101450) 1545 5777501. Sample size (n) = 72.2. Figures in parentheses are standard deviation values.
Table 38. Average household assets (Rs household-1) in Kacharam.
Variable1 Mean Minimum Maximum
Farm assets 12992 (35746)2 0 331800Other assets 56188 (48835) 2825 281000Total assets 69179 (65236) 2975 405400Per capita assets 14424 (11270) 595 633001. Sample size (n) = 90.2. Figures in parentheses are standard deviation values.
Income from other sources
The major income sources other than the crop and livestock incomes in Tirumalapuram were casual village labor, regular employment and migration income. The mean annual income from casual village labor was Rs 5912 (Table 39). Households belonging to the SC category are mainly dependent on this income source. Income from shared land was also relatively common in the village mainly due to large landholdings of absentee landlords and aged landowners who reside in the village and are unable to cultivate land by themselves.
j327_2007Report34final.indd 45j327_2007Report34final.indd 45 10/26/2007 4:58:12 PM10/26/2007 4:58:12 PM

46
CYANMAGENTAYELLOWBLACK
In Kacharam also, casual village labor was an important source of income (with a mean annual income of Rs 4855). Income from regular employment was higher in Kacharam as compared to Tirumalapuram as opportunities were higher due to its proximity to all the major market towns like Yadagirigutta(11 km), Bhongir (20 km) and Aler (7 km). Other important sources of income include migration income, business income and caste occupation (such as toddy tapping).
Household income
The average per capita net returns from crop cultivation was Rs 3544 in Tirumalapuram, which was much higher than that of Kacharam (Rs 1742). But the average per capita livestock income was higher in Kacharam (Rs 2296) as compared to Tirumalapuram (Rs 1138) (Table 40).
The per capita average income from non-farm sources was also higher in Tirumalapuram and this may be because of a few households with persons holding high ranking government jobs. The average per capita total income was also higher in Tirumalapuram (Rs 10352) as compared to Kacharam (Rs 7444).
The contribution of different livelihood sources to the total household income is shown in Figure 34. Non-farm income sources were important sources of income in both Tirumalapuram and Kacharam villages (55% and 46% of total income, respectively). Crop income contribution to total household income was relatively high in Tirumalapuram (34%) as compared to Kacharam (23%). Livestock was
Table 39. Other non-farm household income sources.
Village ActivityNo. of
householdsMean annualincome (Rs)
Tirumalapuram(n=72)
Shared land 12 1147Other regular employment 20 4763Wage employment in watershed project 13 320Casual village labor 48 5912Migration income 17 3326Remittances 7 8037Business income 11 1569
Kacharam(n=90)
Rented-out bullock 6 216Other regular employment 28 4406Wage employment in watershed project 7 56Casual village labor 56 4855Migration income 13 1665Caste occupation 12 1324Sales from CPR 7 294Business income 12 1690
Table 40. Average per capita net returns from various sources.
Source of incomeTirumalapuram
(n=72)Kacharam(n=90)
Crop income (Rs) 3544 1742Livestock income (Rs) 1138 2296Non-farm income (Rs) 5670 3406Total income (Rs) 10352 7444
j327_2007Report34final.indd 46j327_2007Report34final.indd 46 10/26/2007 4:58:12 PM10/26/2007 4:58:12 PM

47
CYANMAGENTAYELLOWBLACK
an important source of income in Kacharam and contributes more than the crop cultivation (about 31%) whereas in Tirumalapuram its contribution was limited.
Groundwater resources
In general, groundwater levels were relatively better in Tirumalapuram when compared with Kacharam as can be seen from the number of functional open wells (34% in Tirumalapuram and 0% in Kacharam) (Table 41). The number of tube wells was also higher in Tirumalapuram (70) as compared to Kacharam (54) and almost 76% of them were functional. In Kacharam, about 67% of the tube wells were functional. One reason for better groundwater availability in Tirumalapuram could be the large number of tanks in the village that get fi lled during rains and facilitate groundwater recharge.
Figure 34. Sources of household income.
Table 41. Number of wells in the watershed villages.
Wells Functional Dried Total
TirumalapuramOpen wells 12 (34.3)1 23 (65.7) 35 Tube wells 53 (75.7) 17 (24.3) 70
KacharamOpen wells 0 (0.0) 85 (100.0) 85 Tube wells 36 (66.7) 18 (33.3) 54 1. Figures in parentheses are percentage values.
Institutional aspects
Tirumalapuram had a more homogeneous community with clear demarcations. Groups were associated through familial relations. The Velama caste constituted the single dominant community that was affl uent and politically well connected. The Madiga was the other concentrated group. The watershed
j327_2007Report34final.indd 47j327_2007Report34final.indd 47 10/26/2007 4:58:12 PM10/26/2007 4:58:12 PM

48
CYANMAGENTAYELLOWBLACK
committee was formed with proper representations but there was a sentiment among certain sections that involvement in decision-making process was limited to certain members only. The PIA in the village was an NGO called Deena Daya Abhyudaya Seva Samithi. So far four percolation tanks have been dug and other construction activities have yet to be completed.
Social networks and political lineage was more pronounced in Kacharam as compared to Tirumalapuram. Almost all the villagers were strongly associated with one political party or the other in Kacharam. Any elections including that of the dairy cooperative, etc were keenly contested. The watershed in Kacharam was named as Jalsagar watershed. There were 8 watershed user groups that were formed based on the clusters of landholdings. A watershed committee was constituted with appropriate representations in accordance with the specifi ed guidelines. The chairperson of the watershed committee was a woman as it was reserved for women. But there was unhappiness among certain big farmers regarding a woman leading the committee as they felt that women lacked farm experience and questioned their ability to make any decisions regarding watershed activities. The PIA was an NGO called Action for Development of Rural Education and Service Society (ADDRESS). It carries a fair amount of recognition among the villagers and watershed activities were currently underway.
Summary and conclusions
The purpose of this study was to characterize and assess the baseline biophysical and socioeconomic conditions in the selected watershed villages of Tirumalapuram and Kacharam in Nalgonda district of Andhra Pradesh. Knowledge of such conditions helps us in understanding and identifying the factors that contribute to the success of the watershed development approach.
The two villages had similar characteristics in terms of age, education and household activities even though Kacharam was a much bigger village in terms of population (330 households as compared to 72 households in Tirumalapuram). The caste structure in Kacharam was more heterogeneous than in Tirumalapuram. The average per capita land in Tirumalapuram was almost double that of Kacharam. The Gini coeffi cient was 0.65 in Tirumalapuram and 0.47 in Kacharam indicating higher land inequalities in Tirumalapuram.
More number of crops were grown in Kacharam as compared to Tirumalapuram. The major crops in Tirumalapuram were paddy, castor, sorghum and pearl millet whereas in Kacharam the major crops were paddy, maize, sesame, sorghum, cotton and green gram. Pigeonpea was grown as an intercrop in both the villages. Maize was the popular crop since past two years in Kacharam. In general, the average yields for almost all the major crops were higher than the district averages of the 2002–03 cropping season in both the villages. The yields of castor, sorghum, pearl millet and paddy (kharif) in Tirumalapuram were 390, 498, 570 and 4793 kg ha-1, respectively. In Kacharam, the average yields of maize, sesame, sorghum, cotton, green gram and paddy (kharif) were 851, 238, 417, 860, 252 and 4880 kg ha-1, respectively.
The average milk production and sales per annum for a household were much higher in Kacharam as compared to Tirumalapuram. Milk cooperatives were better organized in Kacharam. Casual village labor was an important livelihood strategy, especially in the case of SC category in both watershed villages. Other important sources of income include regular employment, migration income and business income.
The average per capita total income was also higher in Tirumalapuram (Rs 10352) as compared to Kacharam (Rs 7444). Non-farm income and crop income constituted the important components of
j327_2007Report34final.indd 48j327_2007Report34final.indd 48 10/26/2007 4:58:12 PM10/26/2007 4:58:12 PM

49
CYANMAGENTAYELLOWBLACK
the total per capita household income in Tirumalapuram (55% and 34% of total per capita income, respectively). In Kacharam, non-farm income and livestock income were the important components (46% and 31%, respectively).
In general, groundwater levels were relatively better in Tirumalapuram when compared with Kacharam. The number of tanks that get fi lled during rains and facilitate recharge was more in Tirumalapuram and could be the reason for better groundwater levels.
On the whole there were distinct differences among the two villages that could have an impact on the implementation process of watershed activities. Tirumalapuram was a relatively smaller village with a more homogenous social structure as compared to Kacharam. Tirumalapuram was also better endowed with groundwater resources. There was less diversifi cation in the type of crops grown and number of non-farm activities in Tirumalapuram as compared to Kacharam. Any technological intervention is expected to have a better chance to succeed in Tirumalapuram for crop productivity enhancement through increased water use effi ciency. But a single caste (Velama) dominates the political and economic aspects of the village and involvement of this community in any program process becomes imperative for its success. Therefore, a proper balance by including the community without alienating other weaker communities in the decision-making process is a must to achieve the equity objectives. Kacharam presents a different picture with a bigger size in terms of population, heterogeneous community and strong political affi liations within the community. This entails greater knowledge and persuasion about the different political groups and their sensitivities for better cooperation in adoption of technological interventions.
4. Socioeconomic Profi les and Resource Use Patterns in Watersheds of Kurnool DistrictThis section characterizes and assesses the baseline biophysical and socioeconomic conditions in the selected micro-watersheds of Nandavaram in Banaganapally mandal and Kanugulavanka (Gadderalla-II) in Devanakonda mandal of Kurnool district.
District profi le
Kurnool is located at latitude of 15°50’ N and longitude of 78°05’ E in the state of Andhra Pradesh and spread over an area of 17658 km2 with a population of about 3,512,260 (based on 2001 census). About 77% of the population is concentrated in the rural areas; 75% of the population is dependent on agriculture and allied activities in the district.
Major crops during 2002–03 cropping season in Kurnool district were sunfl ower, groundnut, chickpea, sorghum, paddy and cotton accounting for about 21%, 20%, 16%, 11%, 6.5% and 6% of gross cropped area, respectively (Fig. 35). Kurnool accounts for about 55% of total sunfl ower seed production and 41% of chickpea production in Andhra Pradesh. Even though onion accounts for only 1% of the gross cropped area in Kurnool, it accounts for 31.5% of total production in Andhra Pradesh.
The standing crops were badly affected in all the districts of the state due to prolonged dry spells in July and September 2002. In Kurnool district, the total rainfall in 2002–03 was only 506 mm as compared to 670 mm in normal years (decreased by about 24%). Figure 36 compares the actual monthly rainfall during 2002 with the rainfall during normal years (calculated as average of last 5 years). The rainfall was erratic, especially during the critical months of July to September and was very much less than the normal.
j327_2007Report34final.indd 49j327_2007Report34final.indd 49 10/26/2007 4:58:12 PM10/26/2007 4:58:12 PM

50
CYANMAGENTAYELLOWBLACK
Figure 35. Area under major crops in Kurnool district (Source: Directorate of Economics and Statistics, Government of Andhra Pradesh).
Figure 36. Monsoon rainfall in 2002 in Kurnool district (Source: Directorate of Economics and Statistics, Government of Andhra Pradesh).
j327_2007Report34final.indd 50j327_2007Report34final.indd 50 10/26/2007 4:58:12 PM10/26/2007 4:58:12 PM

51
CYANMAGENTAYELLOWBLACK
Village characteristics
Nandavaram is located in Banganapally mandal at 78°28’ longitude and 15°37’ latitude (Fig. 37). The distance to the mandal headquarters is about 10 km. There were about 21 castes in Nandavaram with major communities being Reddys, Vaddera, Madiga, Mala and Muslims. The total village area of Nandavaram was 3177 ha of which 83% consisted of cultivated area and 4.7% was under permanent fallow (Table 42). The CPR accounted for about 180 ha. Since last 4 years, about 94% of the cultivated area has been under rainfed agriculture. Since Nandavaram is a fairly large village it was divided into micro-watersheds of about 500 ha each. ICRISAT was associated with one micro-watershed that lies in the western part of the village and is called Nandavaram (West).
Figure 37. Watershed locations in Kurnool district.
j327_2007Report34final.indd 51j327_2007Report34final.indd 51 10/26/2007 4:58:12 PM10/26/2007 4:58:12 PM

52
CYANMAGENTAYELLOWBLACK
Devanakonda is located at 77°55’ longitude and 15°54’ latitude. Devanakonda itself is the mandal headquarters and also the market town. In Devanakonda mandal, the villages earmarked for watershed program were divided into 12 micro-watersheds and ICRISAT was associated with Kanugulavanka (Gadderalla-II). Kanugulavanka village area was about 1766 ha. About 78% of total area was under cultivation and 8.6% under permanent fallow. About 93% of the cultivated area consisted of dryland agriculture and 7% was under irrigation. The CPR accounted for 53 ha. In Kanugulavanka, there were about 32 castes with Dudekula, Muslims, Katika and Padmashalis being the major castes.
The Kanugulavanka watershed was part of the integrated watershed program during the period 1995–99. This is a completed watershed and the soil and water conservation structures were in place at the time of data collection. The water harvesting structures included four masonry check-dams and one farm pond. Soil and moisture conservation measures included contour bunds (covering about 365 ha), strengthening of border beds with agave suckers, gabion structures (17 units) and wrist weirs (25 units). Other activities included forestry, horticulture, animal husbandry and income generating activities such as beekeeping, vermicompost, etc.
The major soil types in Nandavaram were garugu nelalu, deep black soils (nalla regadi) and sodic soils (choudu). Red soils dominated the Kanugulavanka watershed. The major crops were cotton intercropped with pigeonpea and sole crop of pigeonpea in the kharif season and coriandar, chickpea and sorghum in the rabi season. The main kharif crops in Kanugulavanka were groundnut, tomato, sunfl ower, pearl millet and korra. The major rabi crops included groundnut and sunfl ower.
Demographic characteristics
The average age of household head in Nandavaram watershed was 48 years with mean education level of 5 years (Table 43). About 62% of household heads had education of less than or equal to 5 years. The average family size was 5.52. Sixty-two percent of sample households had a family size of more than 4. The average weighted work force for Nandavaram was 3.67 persons per household. About 15.7% of the sample population can be considered as dependents based on age criteria (less than 10 years and those above 65 years). The dependency ratio was computed as the ratio of non-working members to working family members (Shiferaw et al. 2002). The average dependency ratio of 0.23 indicates that every working family member supported 0.23 persons.
The average age and education of household head in Kanugulavanka was 46 years and 5 years of education (Table 44). About 53% of the household heads had less than or equal to 5 years of education. The average family size of 6.54 was higher than that of Nandavaram watershed. About
Table 42. General characteristics of the selected villages in Kurnool district.
Characteristics Nandavaram Kanugulavanka
Total cultivated area (ha) 2631.6 (82.83)1 1372.1 (77.68)- Irrigated cultivated (ha) 144.7 95.1- Dryland cultivated (ha) 2486.8 1276.9Permanent fallow (private) (ha) 150.6 (4.74) 152.2 (8.62)CPR and forest area (ha) 179.8 (5.66) 52.6 (2.98)Other land (settlements, etc) (ha) 215.0 (6.77) 189.5 (10.73)Total village area (ha) 3176.9 (100) 1766.4 (100)1. Figures in parentheses are percentage values.Source: Focus group meetings.
j327_2007Report34final.indd 52j327_2007Report34final.indd 52 10/26/2007 4:58:12 PM10/26/2007 4:58:12 PM

53
CYANMAGENTAYELLOWBLACK
86% of the households had a family size of greater than 4. About 13.6% of the sample households can be considered as dependents. The dependency ratio was 0.23 which is same as in Nandavaram watershed.
Household activities
In Nandavaram, 59% of the women were involved in household chores and 55% of them were involved in their own farm work (Fig. 38). Men were mainly involved in on-farm activities (52%). Agriculture is the predominant activity in which both women and men were almost equally involved. Casual labor and other activities were limited as most of the households in this watershed belong to OC and were relatively land owners. In Kanugulavanka, 47% of women were involved in household chores, 48% in on-farm work and 25% worked as hired labor. Men were mainly involved in on-farm activities (49%) and other income generating activities (27%) (Fig. 39). Agriculture was once again a major livelihood activity. Since Kanugulavanka watershed is part of Devanakonda, which is the mandal headquarters,
Table 43. Demographic details of Nandavaram (West)1.
Characteristics Mean SD Minimum Maximum
Age of household head (yr) 48.32 10.84 25 73Education of household head (yr) 5.4 5.4 0 18Education of family (yr) 4.99 5.25 0 20Persons below 5 years 0.14 0.35 0 1Persons 6–10 years 0.59 0.89 0 3Persons 11–15 years 0.43 0.73 0 3Persons 16–55 years 3.51 1.63 1 10Persons 56–65 years 0.24 0.56 0 2Persons above 65 years 0.05 0.28 0 2Family size 5.52 2.51 2 15Total work force 3.67 1.58 1.25 10Dependents 0.78 1.20 0 4Dependency ratio 0.23 0.40 0 21. Sample size (n) = 63; SD = Standard deviation.
Table 44. Demographic details of Kanugulavanka watershed1.
Characteristics Mean SD Minimum Maximum
Age of household head (yr) 45.89 12.17 26 70Education of household head (yr) 5.3 4.7 0 15Education of family (yr) 3.80 4.47 0 17Persons below 5 years 0.11 0.36 0 2Persons 6–10 years 0.60 0.97 0 4Persons 11–15 years 0.66 0.81 0 3Persons 16–55 years 3.89 1.88 1 9Persons 56–65 years 0.27 0.48 0 2Persons above 65 years 0.04 0.20 0 1Family size 6.54 2.30 2 15Total work force 4.12 1.89 1.25 9.75Dependents 0.76 1.04 0 4Dependency ratio 0.23 0.37 0 1.51. Sample size (n) = 70; SD = Standard deviation.
j327_2007Report34final.indd 53j327_2007Report34final.indd 53 10/26/2007 4:58:12 PM10/26/2007 4:58:12 PM

54
CYANMAGENTAYELLOWBLACK
opportunities existed for the households to involve in various other income generating activities such as regular employment and small businesses.
Caste composition
The major caste categories in Nandavaram micro-watershed were OC and BC constituting about 51% and 43% of the sample households, respectively (Fig. 40). Among the OCs, Reddy was the dominant caste and among the BCs, Golla was the prominent caste. In Kanugulavanka micro-watershed, BC was the dominant category accounting for 79% of the sample households (Fig. 41). Among the BCs, Dudekula was the important caste.
Land ownership
The average landholding of the sample households in Nandavaram watershed was about 5.94 ha, which was about twice that of Kanugulavanka watershed (mean landholding of 2.86 ha) (Tables 45 and 46). Dryland constituted the major cultivated land tracts in both the micro-watersheds with average household ownership of 5.5 ha in Nandavaram and 2.44 ha in Kanugulavanka. Per capita landholdings were also much higher in Nandavaram watershed at 1.21 ha as compared to 0.46 ha in Kanugulavanka watershed.
Figure 38. Household activities in Nandavaram watershed.
Figure 39. Household activities in Kanugulavanka watershed.
j327_2007Report34final.indd 54j327_2007Report34final.indd 54 10/26/2007 4:58:12 PM10/26/2007 4:58:12 PM
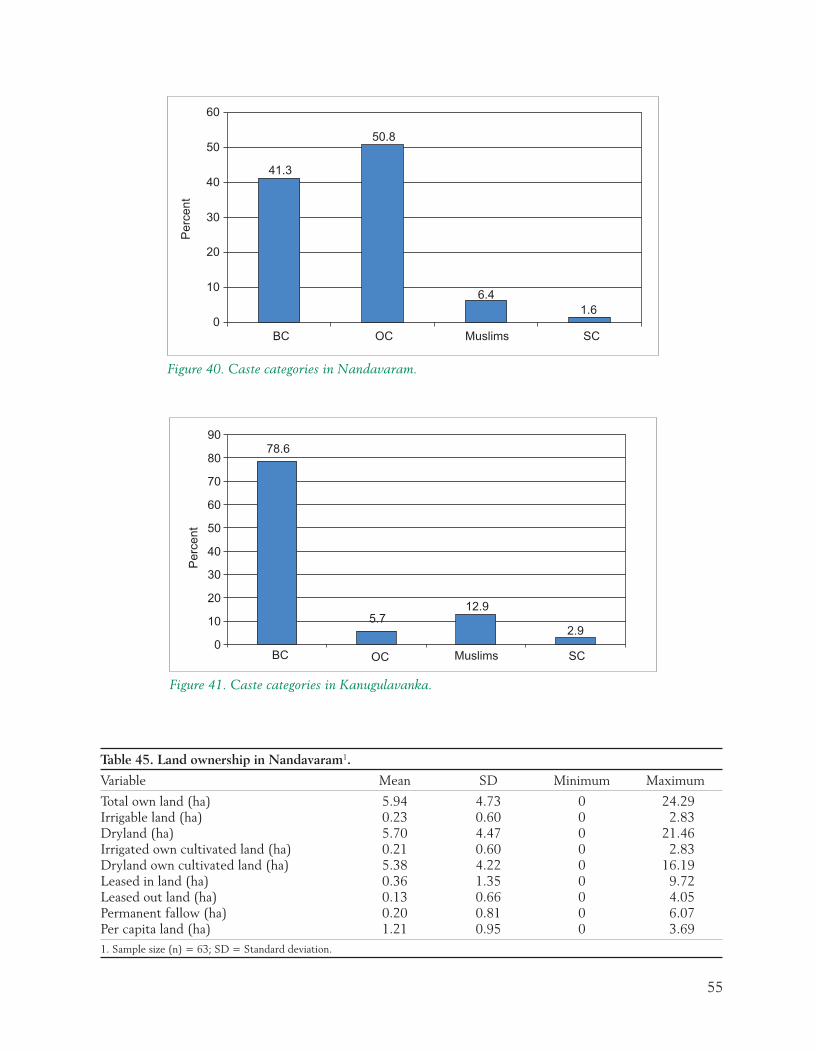
55
CYANMAGENTAYELLOWBLACK
Figure 40. Caste categories in Nandavaram.
Figure 41. Caste categories in Kanugulavanka.
Table 45. Land ownership in Nandavaram1.
Variable Mean SD Minimum Maximum
Total own land (ha) 5.94 4.73 0 24.29Irrigable land (ha) 0.23 0.60 0 2.83Dryland (ha) 5.70 4.47 0 21.46Irrigated own cultivated land (ha) 0.21 0.60 0 2.83Dryland own cultivated land (ha) 5.38 4.22 0 16.19Leased in land (ha) 0.36 1.35 0 9.72Leased out land (ha) 0.13 0.66 0 4.05Permanent fallow (ha) 0.20 0.81 0 6.07Per capita land (ha) 1.21 0.95 0 3.691. Sample size (n) = 63; SD = Standard deviation.
j327_2007Report34final.indd 55j327_2007Report34final.indd 55 10/26/2007 4:58:12 PM10/26/2007 4:58:12 PM

56
CYANMAGENTAYELLOWBLACK
In Nandavaram, the average land ownership of households belonging to OC category was much higher than the rest of the communities at 7.6 ha with mean per capita landholding of 1.66 ha (Fig. 42). In Devanakonda, the average landholding of households belonging to BCs and Muslims (3 ha and 2.9 ha respectively) was higher than that of the households belonging to OC category (2.2 ha) (Fig. 43). The per capita landholdings were more or less similar across the communities.
Table 46. Land ownership in Kanugulavanka1.
Variable Mean SD Minimum Maximum
Total own land (ha) 2.86 3.16 0 20.81Irrigable land (ha) 0.42 0.76 0 3.85Dryland (ha) 2.44 3.14 0 20.81Irrigated own cultivated land (ha) 0.38 0.73 0 3.85Dryland own cultivated land (ha) 2.38 3.77 0 27.28Leased in land (ha) 0.34 1.56 0 11.34Leased out land (ha) 0.29 1.08 0 4.86Permanent fallow (ha) 0.04 0.19 0 1.21Per capita land (ha) 0.46 0.42 0 2.311. Sample size (n) = 70; SD = Standard deviation.
Figure 42. Caste-wise landholdings in Nandavaram.
Figure 43. Caste-wise landholdings in Kanugulavanka.
j327_2007Report34final.indd 56j327_2007Report34final.indd 56 10/26/2007 4:58:13 PM10/26/2007 4:58:13 PM

57
CYANMAGENTAYELLOWBLACK
Land distribution among the sample households has the inherent land inequalities in both micro-watersheds that are common in the rural areas in India. Lorenz curves show that land distribution is more or less similar in both the micro-watersheds (Figs. 44 and 45). For example, in Nandavaram, about 80% of the sample households own about 56% of the land and in Devanakonda, 80% of the households own about 51% of the land.
Crop production
The major crops grown in Nandavaram watershed in kharif season were cotton intercropped with pigeonpea (with an average plot size of 1.06 ha) and pigeonpea as sole crop (mean plot size of 0.37 ha) (Table 47). Major rabi crops were chickpea, coriander and sorghum (with average plot size of 1.27 ha, 1.9 ha and 0.77 ha, respectively).
The major kharif crops in Kanugulavanka watershed were groundnut and tomato (with average plot size of 0.8 ha and 0.46 ha, respectively) (Table 48). The other important crops were onion, paddy, pearl millet (grown as both sole and intercropped with pigeonpea) and sunfl ower. The major rabi crop was sunfl ower with an average plot size of 0.17 ha. Since Devanakonda is itself the mandal headquarters and market center, vegetable crops such as tomato, okra, onion, etc were commonly
Figure 44. Land distribution in Nandavaram.
Figure 45. Land distribution in Kanugulavanka.
j327_2007Report34final.indd 57j327_2007Report34final.indd 57 10/26/2007 4:58:13 PM10/26/2007 4:58:13 PM

58
CYANMAGENTAYELLOWBLACK
grown in this watershed. Crops grown in the watershed were much diversifi ed as compared to Nandavaram watershed.
The most commonly used fertilizer was DAP in all the crops in both the watersheds. In general, fertilizer usage (specifi cally DAP and urea), was more for crops such as paddy and high value vegetable crops (Tables 49 and 50). For example, in Nandavaram watershed, average fertilizer usage in paddy was about 118 kg ha-1 of DAP, 158 kg ha-1 of urea in rabi and 113 kg ha-1 DAP and 105 kg ha-1 urea in kharif season. In Kanugulavanka, 142 kg ha-1 of DAP and 147 kg ha-1 of urea were used in kharif paddy. Potash was commonly applied in paddy in both the watersheds. Along with DAP and urea, other fertilizers such as Triple 17 and f28 were used in the vegetable crops such as coriander, onion and okra. In general, more fertilizer usage was observed in irrigated and commercial crops as compared to other crops.
The average yields in both the watersheds for all the major crops are given in Tables 51 and 52. In Nandavaram watershed, the average yield of chickpea (1262 kg ha-1) was higher as compared to the
Table 47. Mean area of major crops grown in Nandavaram1.
Crop No. of plots Mean area (ha)
KharifCotton+Pigeonpea 57 1.06Cotton 15 0.21Castor 12 0.13Paddy 12 0.15Pigeonpea (sole) 27 0.37
RabiChickpea 66 1.27Coriander 91 1.90Paddy 7 0.09Sorghum 39 0.771. Sample size (n) = 63.
Table 48. Mean area of major crops grown in Kanugulavanka1.
Crop No. of plots Mean area (ha)
KharifCotton 8 0.09Cotton+Pigeonpea 4 0.07Groundnut 39 0.80Groundnut+Pigeonpea 12 0.38Korra 10 0.11Okra 7 0.05Onion 10 0.06Paddy 12 0.05Pearl millet 11 0.12Pearl millet+Pigeonpea 10 0.22Sunfl ower 15 0.37Tomato 48 0.46
RabiSunfl ower 11 0.171. Sample size (n) = 70.
j327_2007Report34final.indd 58j327_2007Report34final.indd 58 10/26/2007 4:58:13 PM10/26/2007 4:58:13 PM

59
CYANMAGENTAYELLOWBLACK
district mean of 1091 kg ha-1 for the 2002–03 cropping season (Table 51). The yields of paddy and castor were also much higher than the district yields.
In the Kanugulavanka watershed, yields of majority of the crops were higher as compared to the district yields. The average yields of groundnut (822 kg ha-1), korra (891 kg ha-1), onion (15765 kg ha-1) and paddy (2912 kg ha-1) were all higher than the average district yields (Table 52). The yields of sunfl ower crop during kharif and rabi (845 kg ha-1 and 1253 kg ha-1, respectively) were also higher than the district yields. This could be due to the improved water availability since Kanugulavanka
Table 49. Fertilizer usage for major crops in Nandavaram.
Crop
No.of
plots
% of plots
fertilizedDAP
(kg ha-1)Urea
(kg ha-1)Triple 17(kg ha-1)
f28(kg ha-1)
Potash(kg ha-1)
f20(kg ha-1)
FYM(t ha-1)
Castor 12 100 77.1 0.0 0.0 20.8 0.0 11.9 0.2Chickpea (Rabi) 66 100 118.1 3.0 1.3 9.4 0.0 0.0 1.2Coriander (Rabi) 91 98.9 78.9 9.1 2.5 33.6 0.0 0.8 0.7Cotton 72 100 57.6 3.2 41.9 3.0 0.6 0.0 0.5Paddy (Rabi) 7 100 118.2 157.6 0.0 0.0 26.3 17.5 0.2Paddy (Kharif) 12 100 112.8 104.7 0.0 32.2 15.0 0.0 1.9Pigeonpea 83 98.8 31.8 2.5 4.2 1.0 0.0 0.0 0.2Sorghum (Rabi) 39 97.4 74.3 4.1 0.0 22.5 0.0 0.0 0.5
Table 50. Fertilizer usage for major crops in Kanugulavanka.
CropNo. of plots
% of plotsfertilized
DAP(kg ha-1)
Urea(kg ha-1)
Triple 17(kg ha-1)
f28(kg ha-1)
Potash(kg ha-1)
FYM(t ha-1)
Cotton 12 83.3 93.2 18.3 11.4 0.0 31.7 1.6Groundnut 51 96.1 70.8 5.2 16.6 0.0 5.4 1.7Korra 11 54.5 30.3 0.6 0.0 0.0 0.0 1.2Okra 7 100 110.9 91.9 63.4 0.0 0.0 1.5Onion 10 100 145.4 100.6 28.0 22.4 11.2 2.6Paddy (Kharif) 12 83.3 141.8 147.4 0.0 14.0 21.1 3.2Pearl millet 21 90.5 31.4 6.0 1.3 0.0 0.0 0.5Pigeonpea 25 84.0 7.2 1.3 0.9 0.0 0.3 0.1Sunfl ower (Rabi) 11 100 70.4 21.5 4.3 0.0 0.0 0.4Sunfl ower (Kharif) 16 93.8 56.9 27.3 1.7 0.0 1.9 0.4Tomato 49 95.9 85.5 9.7 20.8 5.9 0.1 2.0
Table 51. Crop yields in Nandavaram during 2002–03.
CropNo. of plots
% plots irrigated
Meanyield
(kg ha-1)
Minimumyield
(kg ha-1)
Maximumyield
(kg ha-1) CV
Districtyield
(kg ha-1)
Castor 12 0 723 371 1647 45.4 203Chickpea (Rabi) 66 0 1262 494 1977 26.1 1091Coriander (Rabi) 91 0 567 237 1236 29.4Cotton 72 2.8 723 247 1730 38.4 153Paddy (Kharif) 12 91.7 3964 0 6487 58.2 2096Paddy (Rabi) 7 100 4312 1426 6487 45.8 2265Pigeonpea 83 0 401 0 1853 91.5 420Sorghum (Rabi) 39 0 1215 0 2471 40.4 1341
j327_2007Report34final.indd 59j327_2007Report34final.indd 59 10/26/2007 4:58:13 PM10/26/2007 4:58:13 PM

60
CYANMAGENTAYELLOWBLACK
watershed is a completed watershed with all the water conservation structures in place. This can be seen from the number of plots irrigated for the major commercial crops.
Livestock production
The livestock holdings were relatively higher in Nandavaram watershed as compared to Kanugulavanka watershed. In Nandavaram, 25.4% of the sample households did not own any livestock; 47.6% of the households had no milch animals and 46% of the households had no bullocks. The average ownership of different animals was 1.02 milching buffaloes, 0.1 milching cows, 1.13 bullocks, 0.02 other cows, 3.37 sheep and 0.37 goats (Table 53).
In Kanugulavanka watershed, about 53% of the sample households did not have any livestock. About 65.7% of the households were without any milch animals and 77% had no bullocks. The average ownership of animals was 0.54 for bullocks, 0.4 for milching buffaloes, 0.17 for milching cows, 0.01 for sheep and 0.16 for goats (Table 54).
Table 52. Crop yields in Kanugulavanka during 2002–03.
CropNo. of plots
% plots irrigated
Meanyield
(kg ha-1)
Minimumyield
(kg ha-1)
Maximumyield
(kg ha-1) CV
Districtyield
(kg ha-1)
Cotton 12 41.7 859 185 1730 48.0 153Groundnut 51 11.8 822 267 2681 56.7 575Korra 11 0.0 891 412 1483 44.1 623Okra 7 85.7 6328 3212 9637 38.4Onion 10 90.0 15765 0 24711 48.4 12548Paddy 12 91.7 2912 0 5535 59.1 2096Pearl millet 21 0.0 664 82 1483 66.5 663Pigeonpea 25 0.0 202 0 741 95.7 420Sunfl ower (Kharif) 16 12.5 845 0 1606 43.0 695Sunfl ower (Rabi) 11 54.5 1253 494 2281 49.1 855Tomato 49 10.2 7258 1977 12541 37.1
Table 53. Average livestock ownership (number household-1) in Nandavaram.
Variable1 Mean Minimum Maximum
Milching cows 0.10 (0.47)2 0 3Milching buffaloes 1.02 (1.30) 0 4Other cows 0.02 (0.13) 0 1Bullocks 1.13 (1.08) 0 4Heifers (cows) 0.08 (0.33) 0 2Bulls 0.06 (0.40) 0 3Calves (cows) 0.19 (0.53) 0 3He-buffaloes 0.02 (0.13) 0 1Heifers (buffaloes) 0.13 (0.46) 0 3Calves (buffaloes) 0.30 (0.61) 0 3Sheep 3.37 (21.92) 0 170Goats 0.37 (2.77) 0 22Chicken 0.35 (1.89) 0 141. Sample size (n) = 63.2. Figures in parentheses are standard deviation values.
j327_2007Report34final.indd 60j327_2007Report34final.indd 60 10/26/2007 4:58:13 PM10/26/2007 4:58:13 PM

61
CYANMAGENTAYELLOWBLACK
The distribution of value of livestock assets among the sample households in the respective villages reveals inequalities in livestock assets (Figs. 46 and 47). In Nandavaram, about 75% of the households own about 40% of total value of livestock assets. Similarly, in Kanugulavanka watershed, 75% of the sample households own only about 24% of total value of livestock assets. This shows that livestock inequalities were much higher in Kanugulavanka watershed as compared to Nandavaram watershed.
Table 54. Average livestock ownership (number household-1) in Kanugulavanka.
Variable1 Mean Minimum Maximum
Milching cows 0.17 (0.61)2 0 4Milching buffaloes 0.40 (0.79) 0 4Other cows 0.01 (0.12) 0 1Bullocks 0.54 (1.07) 0 4Bulls 0.10 (0.59) 0 4Calves (cows) 0.39 (0.84) 0 4Other she-buffaloes 0.09 (0.37) 0 2Calves (buffaloes) 0.16 (0.47) 0 2Sheep 0.01 (0.12) 0 1Goats 0.16 (1.02) 0 8Chicken 0.07 (0.60) 0 51. Sample size (n) = 70.2. Figures in parentheses are standard deviation values.
Figure 46. Distribution of livestock assets in Nandavaram.
Figure 47. Distribution of livestock assets in Kanugulavanka.
j327_2007Report34final.indd 61j327_2007Report34final.indd 61 10/26/2007 4:58:13 PM10/26/2007 4:58:13 PM

62
CYANMAGENTAYELLOWBLACK
Other household assets
The average household assets in Nandavaram watershed was Rs 127,462 (Table 56) with average per capita assets of Rs 25,101. About 67% of the sample households had per capita assets less than the mean. The mean value of household assets in Kanugulavanka watershed was Rs 70,556 and the average per capita value of assets was Rs 11178 (Table 57). About 70% of the sample households had assets less than the mean per capita assets.
Table 55. Average household milk production and sales per annum.
VillageSample
householdsMilk
production Milksold
Milk sales(Rs)
Nandavaram 63 343 233 1889Kanugulavanka 70 324 263 2535
One of the important livestock products has always been milk used for own consumption as well as for commercial sales. In Nandavaram, the sample average of milk produced per annum was 343 L and milk sold was about 233 L, whereas in Kanugulavanka, the sample average of milk produced per annum was 324 L and milk sold was 263 L (Table 55).
Table 56. Average household assets (Rs household-1) in Nandavaram.
Variable1 Mean Minimum Maximum
Farm assets 15102 (27748.2)2 0 212800Other assets 112360 (90937.4) 18000 479200Total assets 127462 (106912.1) 24500 618300Per capita assets 25101 (19441.4) 4600 1028401. Sample size (n) = 63.2. Figures in parentheses are standard deviation values.
Income from other sources
The major income sources other than the crop and livestock incomes in Nandavaram were casual village labor, regular employment, rented out bullocks and small businesses. The average annual income was Rs 11985 from regular employment and Rs 4616 from casual village labor (Table 58). Income from rented out bullocks was also common indicating the dominance of agriculture as livelihood in the watershed.
In Kanugulavanka also, casual village labor, small businesses and regular employment were important sources of income with a mean annual income of Rs 5208, Rs 4857 and 6104, respectively. Other important sources of income include rented out bullocks and leased out land.
Table 57. Average household assets (Rs household-1) in Kanugulavanka.
Variable1 Mean Minimum Maximum
Farm assets 12792 (35136.3)2 0 276000Other assets 57764 (54742.5) 5750 341000Total assets 70556 (82520.3) 6150 574000Per capita assets 11178 (11196.9) 1025 637781. Sample size (n) = 70.2. Figures in parentheses are standard deviation values.
j327_2007Report34final.indd 62j327_2007Report34final.indd 62 10/26/2007 4:58:13 PM10/26/2007 4:58:13 PM

63
CYANMAGENTAYELLOWBLACK
Household income
The average per capita net returns from crop cultivation was Rs 16,411 in Nandavaram, which was much higher than that of Kanugulavanka (Rs 3906). Even the average per capita livestock income and non-farm income were higher in Nandavaram as compared to Kanugulavanka (Table 59). On the whole, the average per capita total income was higher by almost three times in Nandavaram as compared to Kanugulavanka. This may be due to the larger landholdings in the Nandavaram micro-watershed and also cultivation of commercial crops such as coriander (as spice) on large tracts by majority of farmers.
The contribution of different livelihood sources to the total household income is shown in Figure 48. Crop income was the important source of income in both Nandavaram and Kanugulavanka watersheds (77% and 52% of total per capita income, respectively). Contribution of non-farm income sources to total household income was relatively high in Kanugulavanka (40%) as compared to Nandavaram (18%). Livestock was not a signifi cant contributor in both the watersheds.
Table 58. Other non-farm income sources.
Village ActivityNo. of
householdsMean annualincome (Rs)
Nandavaram (n = 63) Rented out bullocks 9 649Other regular employment 16 11985Casual village labor 14 4616Business net income 7 1860
Kanugulavanka (n = 70) Wage employment from watershed project 7 434Other regular employment 20 6104Casual village labor 40 5208Business net income 23 4857Leased out land 6 323Rented out bullock 6 350Migration income 5 880
Table 59. Average per capita net returns from various sources.
Source of incomeNandavaram
(n=63)Devanakonda
(n=70)
Crop income (Rs) 16411 3906Livestock income (Rs) 964 540Non-farm income (Rs) 3907 2996Total income (Rs) 21282 7442
Figure 48. Sources of household income.
j327_2007Report34final.indd 63j327_2007Report34final.indd 63 10/26/2007 4:58:13 PM10/26/2007 4:58:13 PM
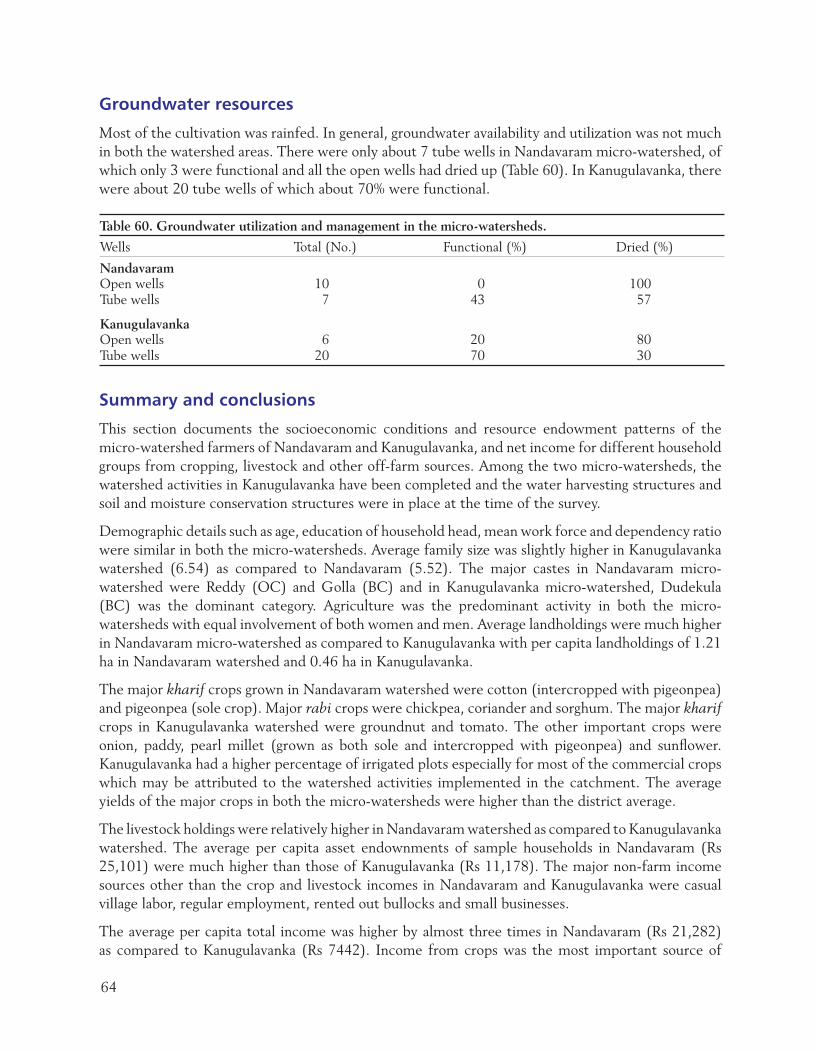
64
CYANMAGENTAYELLOWBLACK
Groundwater resources
Most of the cultivation was rainfed. In general, groundwater availability and utilization was not much in both the watershed areas. There were only about 7 tube wells in Nandavaram micro-watershed, of which only 3 were functional and all the open wells had dried up (Table 60). In Kanugulavanka, there were about 20 tube wells of which about 70% were functional.
Summary and conclusions
This section documents the socioeconomic conditions and resource endowment patterns of the micro-watershed farmers of Nandavaram and Kanugulavanka, and net income for different household groups from cropping, livestock and other off-farm sources. Among the two micro-watersheds, the watershed activities in Kanugulavanka have been completed and the water harvesting structures and soil and moisture conservation structures were in place at the time of the survey.
Demographic details such as age, education of household head, mean work force and dependency ratio were similar in both the micro-watersheds. Average family size was slightly higher in Kanugulavanka watershed (6.54) as compared to Nandavaram (5.52). The major castes in Nandavaram micro-watershed were Reddy (OC) and Golla (BC) and in Kanugulavanka micro-watershed, Dudekula (BC) was the dominant category. Agriculture was the predominant activity in both the micro-watersheds with equal involvement of both women and men. Average landholdings were much higher in Nandavaram micro-watershed as compared to Kanugulavanka with per capita landholdings of 1.21 ha in Nandavaram watershed and 0.46 ha in Kanugulavanka.
The major kharif crops grown in Nandavaram watershed were cotton (intercropped with pigeonpea) and pigeonpea (sole crop). Major rabi crops were chickpea, coriander and sorghum. The major kharif crops in Kanugulavanka watershed were groundnut and tomato. The other important crops were onion, paddy, pearl millet (grown as both sole and intercropped with pigeonpea) and sunfl ower. Kanugulavanka had a higher percentage of irrigated plots especially for most of the commercial crops which may be attributed to the watershed activities implemented in the catchment. The average yields of the major crops in both the micro-watersheds were higher than the district average.
The livestock holdings were relatively higher in Nandavaram watershed as compared to Kanugulavanka watershed. The average per capita asset endownments of sample households in Nandavaram (Rs 25,101) were much higher than those of Kanugulavanka (Rs 11,178). The major non-farm income sources other than the crop and livestock incomes in Nandavaram and Kanugulavanka were casual village labor, regular employment, rented out bullocks and small businesses.
The average per capita total income was higher by almost three times in Nandavaram (Rs 21,282) as compared to Kanugulavanka (Rs 7442). Income from crops was the most important source of
Table 60. Groundwater utilization and management in the micro-watersheds.
Wells Total (No.) Functional (%) Dried (%)
NandavaramOpen wells 10 0 100Tube wells 7 43 57
KanugulavankaOpen wells 6 20 80Tube wells 20 70 30
j327_2007Report34final.indd 64j327_2007Report34final.indd 64 10/26/2007 4:58:13 PM10/26/2007 4:58:13 PM

65
CYANMAGENTAYELLOWBLACK
income in both Nandavaram and Kanugulavanka watersheds contributing to 77% and 52% of total per capita income, respectively. The income from crops was much higher in Nandavaram watershed due to the large per capita landholdings, good soils and large-scale cultivation of commercial crops such as coriander, cotton and chickpea. Non-farm sources formed an important component in the total household income in Kangulavanka (40% of total per capita income) due to its proximity to the mandal headquarters and enhanced employment opportunities.
5. Income Inequality and its Decomposition by Source in the Watersheds
Introduction
Sustainable livelihoods are achieved through access to a range of livelihood resources (natural, economic, human and social capitals) which are combined in the pursuit of different livelihood strategies (agricultural intensifi cation, livelihood diversifi cation and migration) (Scoones 1998). But access to these resources is constrained by various forms of inequalities prevalent in the society.
Inequality exists in various forms in the society. It could be unequal distribution of land, income and assets, gender inequality or social inequality due to caste system or any other such delineation. Inequality measures have indicated an increase in inequality in rural areas. For example, the rural Gini coeffi cient (a measure of inequality) in the state of Andhra Pradesh in India increased from 28.42 in 1996 (NSS 52nd round) to 29.61 in 1997 (NSS 53rd round) (Jha 2000).
Watershed development programs while exhibiting signifi cant impacts in terms of increased crop production and productivity due to improved groundwater availability and its use by large farm holders have accentuated the inter-household inequalities, by ignoring or sometimes negatively affecting small and marginal landholders (Wani et al. 2003). Therefore, benefi ts of the watershed program can be further enhanced through a better understanding of the inequalities prevalent in the watersheds and the major sources of these inequalities by using decomposition techniques.
In general, decomposition of aggregate inequality value into component contributions generally fall into two broad categories (Shorrocks 1982). The fi rst category constitutes infl uence of population subgroups (eg, age, sex or race) and the second category includes examination of different components of total income. In the later category, income inequality is analyzed to measure the contribution of different sources of income (agricultural income, non-agricultural income, etc) to overall income inequality and to determine whether any particular source contributes to increase or decrease in income inequality (Sadoulet and de Janvry 1995). For example, Adams (1996) used income decomposition techniques to demonstrate the importance of livestock income in improving rural income distribution. The total income was decomposed among fi ve sources: agricultural, non-farm, livestock, rental and transfers. Livestock income continued to decrease in inequality and that made the smallest contribution to overall inequality.
The objective of this section is to analyze the effect of different income sources on household income inequalities in all the selected watershed villages. Income inequality decomposition techniques are used to assess the contribution of different sources of household income towards the total income inequality. This helps in understanding the structure of inequality by income source. Such decomposition of the overall inequality illustrates the relative importance of various sources in respect to overall inequality and draws attention to potential areas of research (Fields 1979). Gini decomposition method is the
j327_2007Report34final.indd 65j327_2007Report34final.indd 65 10/26/2007 4:58:13 PM10/26/2007 4:58:13 PM

66
CYANMAGENTAYELLOWBLACK
commonly used procedure for such analysis (Fields 1979, Adams 1996) and helps in constructing factor inequality weights that can be broken down into factor shares, factor Gini and correlational components.
In the fi rst part of the section, a village-wise analysis was undertaken for three major categories of income sources, namely, crop income, livestock income and non-farm income sources in the six watersheds of Malleboinpally, Mentapally, Tirumalapuram, Kacharam, Nandavaram and Kanugulavanka. In the later part, the decomposition techniques were applied to the entire dataset comprising of all sample households from all the watersheds, for a more detailed classifi cation of income sources.
Methodology
In the fi rst part, a watershed-wise analysis was undertaken for a broader classifi cation of income sources (crop, livestock and non-farm income). In the later part, income sources were classifi ed based on the commonality of income sources across the different watersheds. The crop income source categories included income from dryland cereals, pulses, paddy and commercial crops (cotton, oilseed crops such as castor and groundnut, vegetables and other high-value crops). The other categories included income from milk sales, other livestock income (traction, FYM, etc) employment (labor and regular), business income (caste occupations and small businesses) and other non-farm sources (remittances, migration, etc).
Total income of a household was a combination of various income-generating activities such as crop cultivation and livestock and other non-farm sources of income. Computation of income from the different sources is described in section 2.
Inequality measures
Some of the inequality measures include coeffi cient of variation, Theil index, income shares, Atkinson index and the Gini coeffi cient and Lorenz curves. Coeffi cient of variation is simply the ratio of the standard deviation of income σ(y) to mean income⎯y (Sadoulet and de Janvry, 1995). Theil index is used to decompose the overall increase in inequality occurring due to changes between and within different social groups. Income shares involves arranging the income of households from the lowest to the highest, then dividing the distribution into equal parts (fi fths or quantiles). Then, the percentage of total income received by each quantile or fi fth was calculated. Atkinson index was developed to overcome the problem when Lorenz curves intersect. The basic notion was one of “inequality aversion”. It is the price that society is willing to pay in order to decrease income inequality (Osberg 1984). Thus, if one specifi es a high value of “inequality aversion”, it implies that one is most concerned with changes occurring in the lower end of the income distribution, whereas a relatively low value refl ects one’s sensitivity to changes in the upper end of the distribution.
Gini is defi ned as the summary statistic of the Lorenz curve of the income distribution (Dorfman 1979) or as being equal to one minus twice the relative area under the Lorenz curve, as defi ned by Corrado in 1914 (Kakwani 1980). The Gini coeffi cient can range from zero (perfect equality) to one (perfect inequality). If yi is the total income of the ith family, the Gini coeffi cient for family income is given by (Pyatt et al. 1980):
r(y)))cov(y,y(2/nG(y) =
j327_2007Report34final.indd 66j327_2007Report34final.indd 66 10/26/2007 4:58:13 PM10/26/2007 4:58:13 PM

67
CYANMAGENTAYELLOWBLACK
where r(y) is the rank of ith family when families are ranked according to yi. The convention for ranking was that r(yi) = 1 for the family with smallest yi and r(yi) = n for the family with largest yi. If two or more families have the same value for yi, they are each given the average of the ranks that they would get if there were an infi nitesimal difference between them.
Inequality decomposition
Some of the decomposition methodologies in current use include Gini decompositions, Theil decompositions, analysis of variance and decomposition of Atkinson index (Fields 1979). For decomposition of inequality by source, inequality measures of coeffi cient of variation and Gini coeffi cient were considered as appropriate (Adams 1996).
Following Sadoulet and de Janvry (1995), the decomposition of coeffi cient of variation was given by the following expression:
where ρ(ys, y) is the coeffi cient of correlation between ys and y.
An income source s was defi ned as income inequality increasing (decreasing) if enlarging its share in total income increases (decreases) total inequality. Based on the decomposition of the coeffi cient of variation, the sth income source was inequality increasing if ρ(ys, y) cv(ys) / cv(y) was larger than unity.
The Gini coeffi cient decomposition was given by the expression:
where Gs is the Gini coeffi cient of the ith income source and Rs is the correlation ratio expressed as:
The components of the decomposition corresponding to each type of factor income were the product of: (i) the share of the factor in total income; (ii) a rank correlation ratio (Rs); and (iii) the Gini coeffi cient for the distribution of income of the given factor type (Pyatt et al. 1980).
Alternatively, the decomposition of the Gini coeffi cient can be written as (Sadoulet and de Janvry 1995)
Σwsgs =1, where ws = ⎯ys / ⎯y and gs = RsGs / G
Contribution of the sth source of income to total inequality was hence measured by the factor inequality weight, wsgs. From the Gini coeffi cient decomposition, the sth source of income is inequality increasing (decreasing) if its concentration coeffi cient gs was greater (less) than unity.
)y)cv(y,ρ(yyycv(y) ss
s
s
∑=
sss
s
GRyyG ∑=
)r,cov(yr),cov(yR ss
s
s =
j327_2007Report34final.indd 67j327_2007Report34final.indd 67 10/26/2007 4:58:13 PM10/26/2007 4:58:13 PM

68
CYANMAGENTAYELLOWBLACK
To understand how changes in particular income sources affect overall inequality, Lerman and Yitzhaki (1985) considered a change in each person’s income from sources equal to eYs, where e is close to 1 and derived the expressions:
G)G(RSeG/ ssss −=∂∂
sssss S
GRGS
GeG/
−=∂∂
The above equation shows that the income source’s marginal effect relative to overall Gini can be written as the source’s inequality contribution as a percentage of the overall Gini minus the source’s share of total income.
Watershed-wise analysis of income distribution
A watershed-wise analysis was undertaken to examine the effect of major income sources on the total income inequalities. The income sources were broadly classifi ed into three categories, namely, crop income, livestock income and non-farm income.
Major income sources and their role in income inequalities
Income from crops was the most important source of income in Nandavaram and Kanugulavanka of Kurnool district accounting for 77 and 52.5% of total per capita household income, respectively. Livestock was important in Kacharam and Malleboinpally (accounting for 31 and 22.5% of total per capita household income, respectively). Non-farm sources of income were important in all the villages except in Nandavaram. In Nandavaram, majority of the farmers were mainly dependent on agriculture for their livelihood rather than any other non-farm sources.
Crop income was signifi cantly correlated (at 0.01 level) with the total household income in all the villages except in Malleboinpally (Table 61). The correlation coeffi cients between crop income and total income were relatively higher in Tirumalapuram and Nandavaram as compared to other villages. Livestock was signifi cantly correlated with total income in all villages with highest correlation in Kacharam (0.69). Non-farm income was also signifi cantly correlated with total income in all villages except in Kacharam.
Table 61. Correlation of different sources of income with total household income.
Sources of income1
Village Crop income Livestock income Non-farm income
Malleboinpally 0.14 0.50** 0.82**Mentapally 0.57** 0.40** 0.70**Tirumalapuram 0.80** 0.41** 0.69**Kacharam 0.72** 0.69** 0.06Nandavaram 0.94** 0.50** 0.32*Kanugulavanka 0.76** 0.24* 0.42**1. * = Signifi cant at 0.05 level; ** = Signifi cant at 0.01 level.
Land was considered as one of the most important forms of capital in the rural economy. Rural households depend on land for most of their income needs. Therefore, total income and income from crops were signifi cantly positively correlated with land ownership as expected (Table 62).
j327_2007Report34final.indd 68j327_2007Report34final.indd 68 10/26/2007 4:58:13 PM10/26/2007 4:58:13 PM

69
CYANMAGENTAYELLOWBLACK
Non-farm income can be expected to have a negative association with land ownership since large landholders tend to depend more on agricultural activities and less on non-farm income. But, in Tirumalapuram and Malleboinpally non-farm income was signifi cantly positively correlated with land ownership. One reason could be the presence of several large landowners who complement their incomes through well paid government jobs in these villages. For such households, even though agriculture was one of the important sources of income, contribution from non-farm income was much higher towards the total household income. In Kacharam, non-farm income was signifi cantly negatively correlated with land ownership indicating that households with small landholdings and landless households were supplementing their household incomes with non-farm activities such as casual village labor. Livestock income was positively signifi cantly correlated with land ownership in Tirumalapuram, Kacharam and Nandavaram indicating a close crop-livestock association.
Income inequalities and inequality decomposition
Inequalities were relatively higher in Tirumalapuram (Gini coeffi cient of 0.5) of Nalgonda district and Nandavaram (0.45) of Kurnool district as compared to the other villages (Table 63). The average per capita incomes in these two watersheds were also higher when compared with the other watersheds. In general, inequalities varied between villages of same district. Income inequality was lowest in Kacharam (0.29) of Nalgonda district.
The concentration coeffi cients based on coeffi cient of variation and Gini indicate that crop income had an inequality increasing effect on overall income inequality in all villages except in Malleboinpally (Tables 64 and 65). Even though crop income has an inequality decreasing effect on overall income, its contribution to overall inequality was only 2–6 percent whereas the contribution was highest in Nandavaram watershed (85%) (Table 66). The inequality increasing effect of crop income may be because of the inherent inequalities in the land distribution in the villages. Therefore, if the benefi ciaries of the improved variety seed, new technologies or any other interventions are not
Table 62. Correlation of income sources with land ownership1.
Village Crop income Livestock income Non-farm income Total income
Malleboinpally 0.3792** 0.1333 0.5680** 0.6334**Mentapally 0.7114** 0.1477 0.1164 0.5511**Tirumalapuram 0.3859** 0.5909** 0.6426** 0.7095**Kacharam 0.5202** 0.5635** -0.3322** 0.5364**Nandavaram 0.7864** 0.4457** 0.0321 0.7592**Kanugulavanka 0.6062** 0.25 -0.018 0.5796**1. ** = Signifi cant at 0.01 level.
Table 63. Gini coeffi cients of total household incomes.
Village Gini coeffi cient
Malleboinpally 0.40Mentapally 0.36Tirumalapuram 0.50Kacharam 0.29Nandavaram 0.45Kanugulavanka 0.32
j327_2007Report34final.indd 69j327_2007Report34final.indd 69 10/26/2007 4:58:13 PM10/26/2007 4:58:13 PM

70
CYANMAGENTAYELLOWBLACK
properly identifi ed, inequalities in the watersheds could increase even if the average income of the watersheds increases.
Livestock was an income inequality increasing source in Malleboinpally, Mentapally and Kacharam villages. It implies that any additional increment of livestock will increase inequalities. But this observation is too generic and a further analysis based on type of animal could provide better insights. The effect would be more pronounced in Kacharam where livestock income accounts for about 50–54% of overall inequality (Table 66). In Mentapally, livestock income accounts for only 9–13% of overall inequality. Even though livestock income had an inequality decreasing effect in Tirumalapuram, Nandavaram and Kanugulavanka watersheds, livestock accounts for only 4–9%, 4% and 5–7% of overall inequality, respectively.
Non-farm income was a representative of inequality decreasing source in all villages except Malleboinpally where there is some ambiguity. The concentration coeffi cient based on Gini (gi) does indicate non-farm income as inequality decreasing source even for Malleboinpally (Table 64). In Malleboinpally, Mentapally and Tirumalapuram villages non-farm income accounts for a signifi cant share (65–72%, 43–52% and 41–42%, respectively) in overall inequality and hence has a more
Table 64. Concentration coeffi cients of source incomes in total inequality.
Village
Crop income Livestock income Non-farm income
ci gi ci gi ci gi
Malleboinpally 0.26 0.68 1.16 1.62 1.05 0.95Mentapally 1.71 1.34 1.18 1.62 0.67 0.80Tirumalapuram 1.58 1.41 0.39 0.84 0.76 0.76Kacharam 1.98 1.82 1.61 1.75 0.09 0.08Nandavaram 1.11 1.10 0.89 0.91 0.57 0.59Kanugulavanka 1.27 1.27 0.76 0.94 0.69 0.66
Table 66. Factor inequality weights of source incomes in total income inequality.
Village
Crop income Livestock income Non-farm incomeciwi giwi ciwi giwi ciwi giwi
Malleboinpally 0.02 0.06 0.26 0.36 0.72 0.65Mentapally 0.47 0.37 0.09 0.13 0.43 0.52Tirumalapuram 0.54 0.48 0.04 0.09 0.42 0.41Kacharam 0.46 0.43 0.50 0.54 0.04 0.04Nandavaram 0.85 0.85 0.04 0.04 0.10 0.11Kanugulavanka 0.67 0.67 0.05 0.07 0.28 0.27
Table 65. Effect of different sources of income to overall income inequality1.
Village Crop income Livestock income Non-farm income
Malleboinpally - + +Mentapally + + -Tirumalapuram + - -Kacharam + + -Nandavaram + - -Kanugulavanka + - -1. + indicates inequality increasing; - indicates inequality decreasing.
j327_2007Report34final.indd 70j327_2007Report34final.indd 70 10/26/2007 4:58:13 PM10/26/2007 4:58:13 PM

71
CYANMAGENTAYELLOWBLACK
pronounced effect (Table 66). It accounts for only 4% in Kacharam and 10–11% in Nandavaram and 27–28% in Kanugulavanka.
A more disaggregated analysis of the income sources
Even though classifi cation of household income into crop, livestock and non-farm income provides a general idea about the importance of each category of income source in each watershed, it does not elaborate on the type of specifi c crop or livestock or non-farm activity that contributes towards inequality. One limitation for such analysis for each watershed was the varied sources of income that were characteristic to a particular watershed. A specifi c source of income could be important in a particular watershed but may not contribute much to the household income in some other watershed. For example, vegetables and oilseeds (groundnut and sunfl ower) were more predominant in Kanugulavanka watershed whereas pulse crops (pigeonpea and chickpea), cotton and coriander were dominant in Nandavaram watershed of Kurnool district. Sorghum, paddy and pigeonpea were some of the commonly grown crops in all the watershed areas. In such a case, a blanket categorization of income sources across all the watersheds may not give an accurate insight. Too many zeros under a specifi c category due to absence of an activity in a watershed along with cases of negative returns causes an upward bias in source Gini, which in turn may distort the results.
Therefore, a more disaggregated analysis of the income sources was done for a combined dataset of all the watersheds. The income sources consisted of income from dryland cereals, pulses, paddy, commercial crops, milk sales, other livestock income, employment, business and other non-farm sources. Similar type of analysis with such detailed classifi cation for each watershed separately is beyond the purview of this paper.
The average per capita total income for the combined dataset of 420 households across the six watershed villages was Rs 9269 (Fig. 49). Among the different categories of income sources, employment (which includes regular employment and casual village labor) had the highest per capita income of Rs 2731 and accounted for 29% of the total per capita household income (Fig. 50).
This was followed by commercial crops (that included cotton, castor, vegetables and other high- value crops) with a mean per capita income of Rs 1990 and accounted for 21% of the average per capita total income of the household. Dryland cereals (sorghum, pearl millet, etc) had the lowest per capita income among all the categories (Rs 248) accounting for only 3% of the total income of the household.
Figure 49. Average per capita income from different sources (n = 420).
j327_2007Report34final.indd 71j327_2007Report34final.indd 71 10/26/2007 4:58:13 PM10/26/2007 4:58:13 PM

72
CYANMAGENTAYELLOWBLACK
The source Gini correlations (Gi) show that income from crops (dryland cereals, pulses and paddy) and livestock were more unequally distributed than most of the non-farm income sources. But thetotal household income is less unequal than any of the individual sources of income (Table 67). Income from employment category (regular employment and casual village labor) had a more equal distribution. Even though the source Gini coeffi cients were high for income from some sources, their contribution to overall inequality was not signifi cant. For example, the contribution of dryland cereals to total income inequality was not much even though its source Gini was high whereas employment category had a relatively low source Gini but its contribution towards total inequality was high (Table 68).
The Rs value in Table 67 refl ects correlation between each source of income and total income. A high positive value of Rs, ceteris paribus, implies that income source s contributes importantly to total income inequality (Boisvert and Ranney 1990). Crop incomes had higher correlations as compared to livestock related incomes and non-farm income sources.
Figure 50. Contribution of different income sources to the total per capita income (n = 420).
Table 67. Gini decomposition of inequality for different sources.
Income source Si Ri Gi 2 Ei
Dryland cereals 0.027 0.550 1.090 0.010Pulses 0.092 0.800 0.908 0.062Paddy 0.092 0.700 0.935 0.047Commercial crops 0.215 0.707 0.798 0.065Milk income 0.080 0.571 0.857 0.010Other livestock 0.053 0.517 0.827 -0.001Employment 0.295 0.396 0.638 -0.123Business income 0.065 0.316 0.892 -0.023Other non-farm 0.083 0.204 0.849 -0.0501. Si = Source’s share of total income; Ri = Correlations between each source of income and total income; Gi = Source Ginis; Ei =
Elasticity of total income inequality. 2. Source Ginis may be high when households with zero and negative incomes from different income sources were included and it may
be possible to get source Gini values of greater than 1 (Findeis and Reddy 1987, Adams 1996).
j327_2007Report34final.indd 72j327_2007Report34final.indd 72 10/26/2007 4:58:13 PM10/26/2007 4:58:13 PM

73
CYANMAGENTAYELLOWBLACK
The elasticity of total income inequality due to a small change in income from a given source (Ei) was computed for each source. These elasticities provide an initial indication of how changes in economic conditions and policies that effect income from a source are translated into the effects on income inequality. For example, 1% increase in profi tability from pulse crops would also increase the disparity in the total household income by 0.062 of 1%. For employment category, the decrease in inequality would be 0.123 of 1%.
All the crop categories were inequality increasing sources based on the gi (Table 68). The contribution of commercial crops category to total income inequality was 19–28%. Paddy accounted for about 14–27% of total income inequality. The results were ambiguous regarding income from milk and other livestock sources. Concentration coeffi cients based on Gini (gi) showed these sources as inequality increasing whereas those based on coeffi cient of variation showed them as inequality decreasing sources. But in both cases, the contribution of these sources to the total inequality was not that signifi cant (4–9% and 3–5%, respectively).
Table 68. Factor inequality weights of source incomes in total income inequality.
Income source ci cisi gi gisi
Dryland cereals 1.19 0.03 1.39 0.04Pulses 1.61 0.15 1.68 0.15Paddy 2.91 0.27 1.51 0.14Commercial crops 0.87 0.19 1.30 0.28Milk income 0.48 0.04 1.13 0.09Other livestock 0.56 0.03 0.99 0.05Employment 0.71 0.21 0.58 0.17Business income 0.28 0.02 0.65 0.04Other non-farm 0.84 0.07 0.40 0.03Total 1.00 1.00
All the non-farm income sources were found to be inequality decreasing sources with employment category being the most important source of inequality (accounting for 17–21% of the total inequality). This may be due to inclusion of regular salaried employment in this category that contributes to relatively higher incomes in a household. The other two non-farm categories did not have signifi cant contributions in the total inequality even though they had an inequality decreasing effect.
Conclusions
The watershed-level analysis showed that income from crop cultivation had an inequality increasing effect on overall income inequality in all the watershed areas. This could be because of the close association between crops and land ownership and a manifestation of unequal land distribution. This implies that there is a need for deliberate interventions that are targeted towards small and marginal landholders.
Livestock income was also an inequality increasing source in the watershed areas of Malleboinpally, Mentapally and Kacharam, with the effect being more pronounced in Kacharam. Livestock income was an inequality decreasing source in the watershed areas of Tirumalapuram, Nandavaram and Kanugulavanka but livestock does not account for any signifi cant share in the overall inequality in these watersheds.
j327_2007Report34final.indd 73j327_2007Report34final.indd 73 10/26/2007 4:58:13 PM10/26/2007 4:58:13 PM
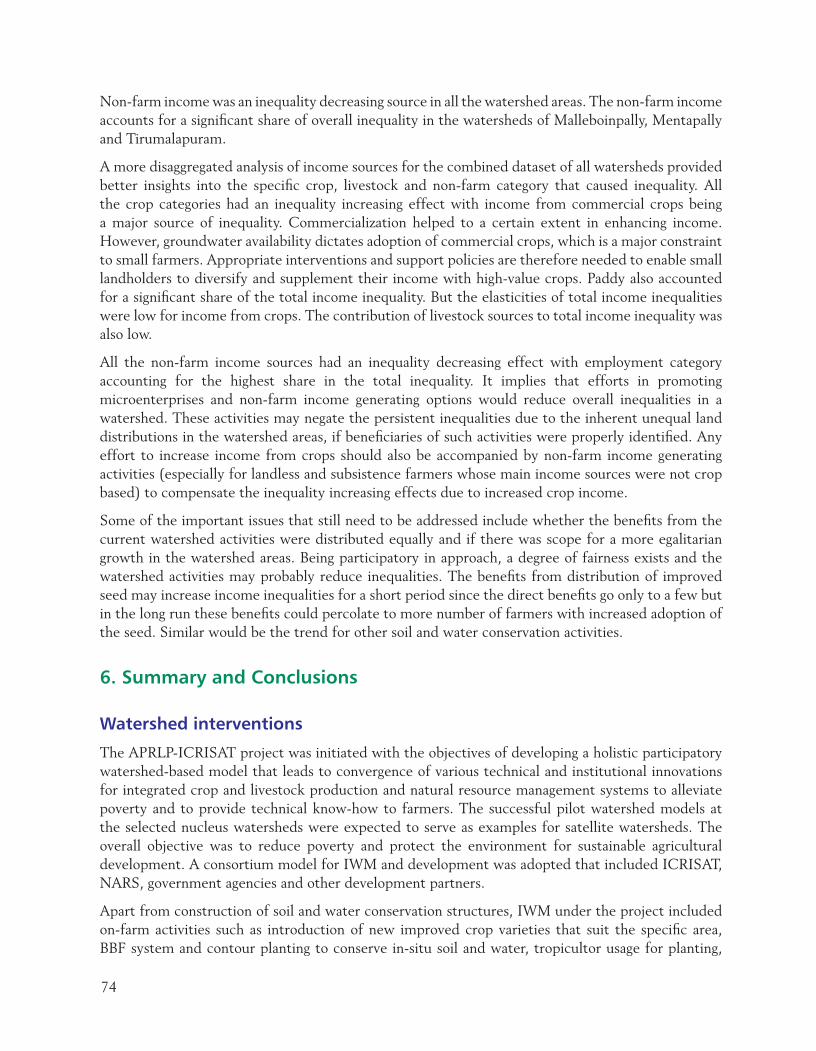
74
CYANMAGENTAYELLOWBLACK
Non-farm income was an inequality decreasing source in all the watershed areas. The non-farm income accounts for a signifi cant share of overall inequality in the watersheds of Malleboinpally, Mentapally and Tirumalapuram.
A more disaggregated analysis of income sources for the combined dataset of all watersheds provided better insights into the specifi c crop, livestock and non-farm category that caused inequality. All the crop categories had an inequality increasing effect with income from commercial crops being a major source of inequality. Commercialization helped to a certain extent in enhancing income. However, groundwater availability dictates adoption of commercial crops, which is a major constraint to small farmers. Appropriate interventions and support policies are therefore needed to enable small landholders to diversify and supplement their income with high-value crops. Paddy also accounted for a signifi cant share of the total income inequality. But the elasticities of total income inequalities were low for income from crops. The contribution of livestock sources to total income inequality was also low.
All the non-farm income sources had an inequality decreasing effect with employment category accounting for the highest share in the total inequality. It implies that efforts in promoting microenterprises and non-farm income generating options would reduce overall inequalities in a watershed. These activities may negate the persistent inequalities due to the inherent unequal land distributions in the watershed areas, if benefi ciaries of such activities were properly identifi ed. Any effort to increase income from crops should also be accompanied by non-farm income generating activities (especially for landless and subsistence farmers whose main income sources were not crop based) to compensate the inequality increasing effects due to increased crop income.
Some of the important issues that still need to be addressed include whether the benefi ts from the current watershed activities were distributed equally and if there was scope for a more egalitarian growth in the watershed areas. Being participatory in approach, a degree of fairness exists and the watershed activities may probably reduce inequalities. The benefi ts from distribution of improved seed may increase income inequalities for a short period since the direct benefi ts go only to a few but in the long run these benefi ts could percolate to more number of farmers with increased adoption of the seed. Similar would be the trend for other soil and water conservation activities.
6. Summary and Conclusions
Watershed interventions
The APRLP-ICRISAT project was initiated with the objectives of developing a holistic participatory watershed-based model that leads to convergence of various technical and institutional innovations for integrated crop and livestock production and natural resource management systems to alleviate poverty and to provide technical know-how to farmers. The successful pilot watershed models at the selected nucleus watersheds were expected to serve as examples for satellite watersheds. The overall objective was to reduce poverty and protect the environment for sustainable agricultural development. A consortium model for IWM and development was adopted that included ICRISAT, NARS, government agencies and other development partners.
Apart from construction of soil and water conservation structures, IWM under the project included on-farm activities such as introduction of new improved crop varieties that suit the specifi c area, BBF system and contour planting to conserve in-situ soil and water, tropicultor usage for planting,
j327_2007Report34final.indd 74j327_2007Report34final.indd 74 10/26/2007 4:58:13 PM10/26/2007 4:58:13 PM

75
CYANMAGENTAYELLOWBLACK
balanced fertilizer application and interculture operations, and in-situ generation of organic matter through planting of fertilizer trees on fi eld bunds. Activities such as seed banks, vermicomposting for producing biofertilizers, NPV for producing biopesticides, INM and IPM methods were also promoted in the watershed villages.
A detailed baseline socioeconomic household survey was conducted during the 2002–03 cropping season in selected nucleus watersheds in Mahabubnagar, Nalgonda and Kurnool districts. A random sampling procedure was used to select the households in the watershed villages such that the land distribution and caste distribution closely matched that of the land and caste distribution of the entire village. The sample size varied between 19 and 100% of the total households in the watershed communities across the watersheds. The overall objective of the survey was to provide a suitable benchmark for monitoring changes and to assess the impacts of watershed activities in the future. This report is a product of analysis of survey data and it provides a comprehensive snapshot of the socioeconomic conditions, social and political networks, cropping patterns, crop and livestock production, land characteristics, constraints and potential for increased productivity in the watershed areas. It offers careful insights into the existing production systems, resource use patterns, major livelihood strategies and the prevailing socioeconomic inequalities and distributional issues in the watershed communities. It also helps researchers and policy makers to understand the constraints, potential opportunities, farmer perceptions and priorities in the watersheds.
Demographic characteristics and social diversity
The average age of the household head and educational levels in the households were almost similar in all the watersheds and was 47–48 and about 5 years, respectively. The average family size was 5–6 persons and the mean work force was 3 to 4 workers. In general, women were mainly involved in tasks that included household chores and on-farm activities on their own land. Men were exclusively involved in income generating activities that included on-farm activities and other small businesses. Casual hired labor was one of the major income generating activities among the socially and economically disadvantaged groups of the community where both men and women were equally involved.
Social heterogeneity has implications for collective action in watershed management and development. The scope for collective action can be expected to be more in a watershed with relatively homogeneous community composition. Communities were more homogeneous in villages such as Mentapally and Tirumalapuram. They were relatively heterogeneous in Malleboinpally and Kacharam. Nandavaram and Kanugulavanka micro-watersheds were only a small part of large villages and collective action in such cases is complex as compared to other watershed areas where entire villages were considered as watershed.
Land ownership
The average land ownership was highest in Nandavaram in Kurnool district (5.94 ha) followed by Tirumalapuram in Nalgonda district (3.67 ha) (Fig. 51). The per capita land was also highest in these two villages compared to other villages (1.21 ha and 1.08 ha, respectively).
Dryland agriculture was the main cropping practice in all the villages which is a common characteristic of a semi-arid region. But a look into the irrigated cultivated area gives an idea about the agricultural potential in the watersheds. For example, the average irrigable land was highest in Tirumalapuram (0.80 ha) and the mean cultivated area under irrigation was also highest (0.79 ha) accounting for about
j327_2007Report34final.indd 75j327_2007Report34final.indd 75 10/26/2007 4:58:13 PM10/26/2007 4:58:13 PM
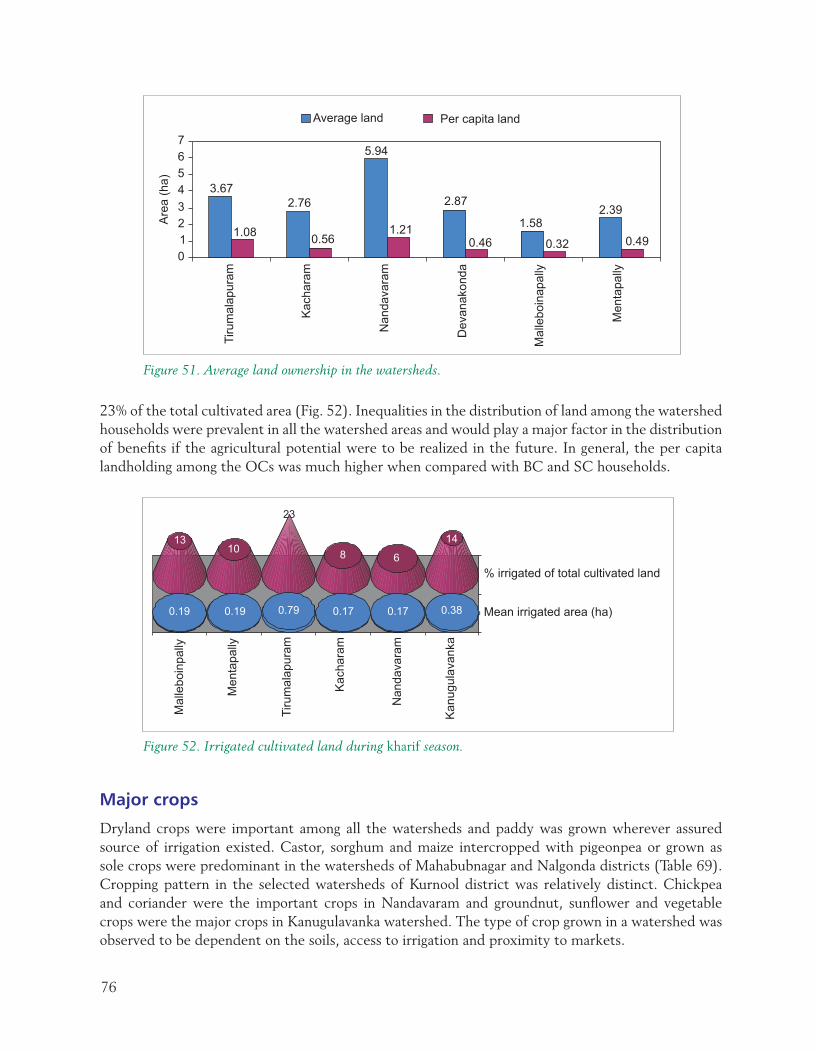
76
CYANMAGENTAYELLOWBLACK
23% of the total cultivated area (Fig. 52). Inequalities in the distribution of land among the watershed households were prevalent in all the watershed areas and would play a major factor in the distribution of benefi ts if the agricultural potential were to be realized in the future. In general, the per capita landholding among the OCs was much higher when compared with BC and SC households.
Figure 51. Average land ownership in the watersheds.
Figure 52. Irrigated cultivated land during kharif season.
Major crops
Dryland crops were important among all the watersheds and paddy was grown wherever assured source of irrigation existed. Castor, sorghum and maize intercropped with pigeonpea or grown as sole crops were predominant in the watersheds of Mahabubnagar and Nalgonda districts (Table 69). Cropping pattern in the selected watersheds of Kurnool district was relatively distinct. Chickpea and coriander were the important crops in Nandavaram and groundnut, sunfl ower and vegetable crops were the major crops in Kanugulavanka watershed. The type of crop grown in a watershed was observed to be dependent on the soils, access to irrigation and proximity to markets.
j327_2007Report34final.indd 76j327_2007Report34final.indd 76 10/26/2007 4:58:13 PM10/26/2007 4:58:13 PM

77
CYANMAGENTAYELLOWBLACK
Livestock production
Major livestock found in all the watersheds were milch buffaloes even though average ownership varied from 1.17 per household in Malleboinpally to 0.34 per household in Mentapally. Average milk sale per annum was highest in Kacharam at Rs 10,023. Small ruminant ownership varied across the watersheds with sheep being more in Malleboinpally, Kacharam and Nandavaram. The average ownership of goats was highest in Tirumalapuram (1.29 per household). Inequalities existed in the value of livestock assets owned in all the watersheds. In general, large farmers owned milch animals while small farmers and landless households owned small ruminants. Sometimes, rearing of small ruminants is considered an exclusive caste activity (occupation, eg, Gollas). Any livestock development intervention needs to consider the prevailing inequalities and the capacity of the farmers belonging to different socioeconomic groups to maintain livestock. For example, technological interventions that improve dairy farming have to be accompanied by specifi c strategies for feed and fodder supply, especially in the case of small farmers and landless.
Paddy straw is the major source of dry fodder. In watersheds where dry fodder shortage occurred, it was supplied by the state government. Major source of green fodder was crop residue from sorghum as the crop is easy to maintain and relatively drought resistant. Sorghum was exclusively grown as a fodder crop in Kacharam watershed which also leads in per capita livestock holdings. In watersheds such as Mentapally where crops failed due to drought and large-scale seasonal migration occurred, livestock holdings were also very small due to fodder and feed constraints.
Other income sources
The major income sources other than the crop and livestock incomes in the watershed areas were casual village labor, regular employment and migration income. In general, casual village labor was especially an important source of income for the BC and SC communities. In Mentapally watershed, seasonal migration through contract labor arrangements was widely prevalent. Under this arrangement, a local contractor in the village hires members of small and landless households as casual labor for a lump sum amount to work on construction activities in cities. In the micro-watersheds of Kurnool district, apart from casual village labor, regular employment, rented out bullocks and small businesses were also important sources of income. Regular employment was more common in watersheds that were nearer to the mandal headquarters, where some part time farmers also worked as teachers, etc.
Table 69. Major crops grown in the watershed areas.
Watershed Major crops grown
Malleboinpally Paddy, castor, sorghum, maize, pigeonpea (intercropped with sorghum and maize)Mentapally Castor, paddy, sorghum, pigeonpea (intercrop), groundnut (rabi)Tirumalapuram Castor, paddy, pearl millet, pigeonpea (intercrop), sweet lemonKacharam Maize, paddy, cotton, green gram, sesame, sorghum, sorghum (fodder), castor,
tobaccoNandavaram Cotton, castor, pigeonpea (intercrop and sole), chickpea (rabi), coriander (rabi),
sorghum (rabi)Kanugulavanka Groundnut, tomato, sunfl ower (kharif and rabi), pearl millet, korra, onion, cotton,
paddy
j327_2007Report34final.indd 77j327_2007Report34final.indd 77 10/26/2007 4:58:14 PM10/26/2007 4:58:14 PM

78
CYANMAGENTAYELLOWBLACK
Small farmers and landless households supplement their incomes through casual labor. These categories also rely on CPR for their subsistence (fi rewood and thatched houses) as well as livelihoods (example, making of leaf-plates and baskets).
Diversifi cation of income sources
Income from crops was the most important source of income in Nandavaram and Devanakonda of Kurnool district accounting for about 77 and 53% of total per capita household income, respectively (Fig. 53). Livestock as a source of income was important in Kacharam and Malleboinpally (accounting for about 31 and 23% of the total household income, respectively). Non-farm sources of income were important in all the villages except in Nandavaram. In Nandavaram all the landholders of the micro-watershed were agriculturists with large landholdings cultivating coriander, chickpea and cotton that signifi cantly contributed to the household income. In the other watersheds, most of the small farmers and landless relied on off-farm income sources such as casual labor to cope with the drought situation.
Figure 53. Major income sources in the watersheds.
Figure 54 shows the percentage of households below and above poverty line (assumed to be Rs 20,000 per annum) in the watershed areas. The household incomes in Nandavaram watershed are relatively higher as compared to those in other watersheds with almost 93% of the sample households above the poverty line. In Mentapally, about 40% of the sample households were below poverty line indicating the widespread backwardness of the village.
Groundwater resources
Groundwater levels have been declining in all the watersheds due to reduced recharge and renewal capacities because of frequent droughts and also due to excess groundwater abstraction. In all the watersheds majority of the open wells dried up (up to 100% in Mentapally, Kacharam and Nandavaram) and pressure on the groundwater has increased through tube wells (Fig. 55). Even though dryland crops were predominant in the region, water intensive crops such as paddy were very popular wherever irrigation was available. The effect of water scarcity was more pronounced in Mentapally where large number of households had migrated out of the village in search of alternative livelihoods outside of agriculture.
j327_2007Report34final.indd 78j327_2007Report34final.indd 78 10/26/2007 4:58:14 PM10/26/2007 4:58:14 PM
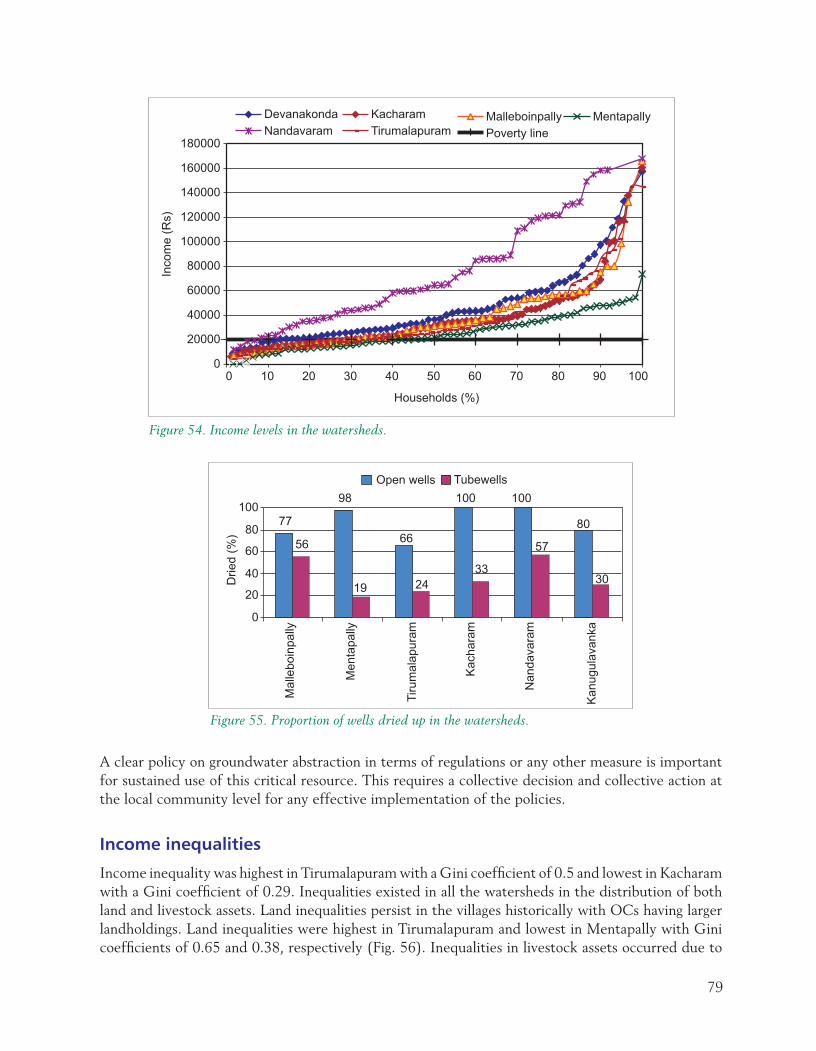
79
CYANMAGENTAYELLOWBLACK
A clear policy on groundwater abstraction in terms of regulations or any other measure is important for sustained use of this critical resource. This requires a collective decision and collective action at the local community level for any effective implementation of the policies.
Income inequalities
Income inequality was highest in Tirumalapuram with a Gini coeffi cient of 0.5 and lowest in Kacharam with a Gini coeffi cient of 0.29. Inequalities existed in all the watersheds in the distribution of both land and livestock assets. Land inequalities persist in the villages historically with OCs having larger landholdings. Land inequalities were highest in Tirumalapuram and lowest in Mentapally with Gini coeffi cients of 0.65 and 0.38, respectively (Fig. 56). Inequalities in livestock assets occurred due to
Figure 54. Income levels in the watersheds.
Figure 55. Proportion of wells dried up in the watersheds.
j327_2007Report34final.indd 79j327_2007Report34final.indd 79 10/26/2007 4:58:14 PM10/26/2007 4:58:14 PM

80
CYANMAGENTAYELLOWBLACK
concentration of high-value milch animals with large farmers and concentration of low value small ruminants with small farmers and landless.
Income inequality decomposition techniques were used to assess the contribution of different sources of household income towards the total income inequality. The analysis on the effect of different income sources on household income inequalities in all the watershed villages showed that income from crop cultivation had an inequality increasing effect on overall income inequality since profi ts accrue to those households that own large tracts of land. The increase in inequality was more predominant in Nandavaram where income from crop cultivation accounted for a major share of the total household income.
Livestock income was an inequality increasing source in some watersheds (Malleboinpally, Mentapally and Kacharam) and was an inequality decreasing source in Tirumalapuram, Nandavaram and Devanakonda. The effect was more pronounced in Kacharam as income from livestock was an important contributor to the total household income. Non-farm income was an inequality decreasing source in all the watershed areas. Non-farm income accounts for a signifi cant share of overall inequality in the watersheds of Malleboinpally, Mentapally and Tirumalapuram (65–72%, 43–52%, and 41–42%, respectively).
Therefore, when land and livestock resources are unequally distributed, land- and livestock-based watershed interventions may not necessarily generate equitable benefi ts to all households. Measures should be taken to ensure equity in sharing benefi ts from watershed development. For example, dairy is an important component of livestock income but it is mainly undertaken by large landowners. Most of the small landowners and landless cannot afford to maintain milch animals and rely more on small ruminants. In such situations, technology interventions (appropriate feed and fodder management) should aim to increase the productivity of these livestock resources which would contribute to income of these vulnerable sections and thereby reduce any inequality increasing effect due to livestock income.
Figure 56. Land inequalities in the watershed villages.
j327_2007Report34final.indd 80j327_2007Report34final.indd 80 10/26/2007 4:58:14 PM10/26/2007 4:58:14 PM

81
CYANMAGENTAYELLOWBLACK
Implications for agricultural sustainability
Productivity enhancement activities of the project have a number of positive implications for agricultural sustainability in the watershed villages. The watershed program envisages number ofon-farm and off-farm income generating activities that benefi t all the socioeconomic communities in the village.
Participatory evaluation and cultivation of improved varieties
ICRISAT introduced improved seed to the specifi c watershed villages according to the requirements of the watershed farmers and evaluated by the farmers themselves as part of the entry point activity. The farm trials showed that the yields from improved cultivar seeds were much higher than the local varieties. One good example is the pigeonpea variety, Asha wherein the yields were higher (by almost 30%) as compared to local variety because of its wilt resistance characteristic. Seed of the groundnut varieties, ICGS 11, ICGS 76 and ICGV 86590, was of superior quality. The pearl millet variety ICMV 221 was popular due to good quality grain and fodder. In Tirumalapuram, pearl millet and sorghum were grown as sole crops instead of the traditional mixed or intercropping systems. Spillover benefi ts from the lateral spread of the improved variety seed to neighboring farmers and villages would be one of the positive externalities from introducing improved seed in the nucleus watershed villages.
Community seed production and maintenance (Village Seed Banks)
A variation of the seed bank concept was introduced in selected watersheds of Tirumalapuram of Nalgonda district and Karivemula and Devanakonda of Kurnool district to encourage market-led village seed production and maintenance using true-to-type breeder seed as the foundation. Under this concept, a village seed purchasing committee was organized and technical aspects of seed production, seed health and storage management, sampling and seed quality analysis and supply of initial breeder seed were provided by ICRISAT. The key for the success of seed banks depends on the confi dence of the farmers on the seed from the seed bank. This would help the farmers to get reliable seed and avoid losses from low quality seed purchased from unscrupulous traders.
Integrated nutrient management activities
As part of the entry point activities in the watershed villages, soil samples were collected from the watersheds and analyzed and the macro and micronutrient status of soils was shared with the farmers. Defi ciency of N, P, boron, sulfur and zinc was observed in majority of the farms. In the on-farm experimental trials conducted by ICRISAT, balanced nutrient application increased yields of different crops by 30–120% over farmer practice. Some of the benefi ts from micronutrient application included increased yields, improvement on grain quality, and correspondingly higher prices for the product in the market.
Integrated pest management activities
The basic concept of IPM is the containment of a pest below economically damaging levels, using a combination of all feasible control measures. The primary components of IPM are monitoring of insect pest populations using pheromone traps, use of tolerant varieties for pests and diseases,
j327_2007Report34final.indd 81j327_2007Report34final.indd 81 10/26/2007 4:58:14 PM10/26/2007 4:58:14 PM

82
CYANMAGENTAYELLOWBLACK
manipulation of farming system to minimize pest infestation, enhanced natural control process and selective use of biopesticides and/or synthetic pesticides. Mainstreaming IPM in watershed villages could require collective action and coordination of pest control practices.
The use of botanicals like neem in a number of crops and cultural operations like manual shaking of the pigeonpea crop to escape the peak pest attacks were emphasized to minimize the use of toxic chemicals. Orientation about threshold population of pests and use of NPV as biopesticides was also given to farmers in these villages.
Field trials were conducted to show the effectiveness of seed treatment in controlling diseases. Seed treatment with Benlate+Captan (1:1) at 3 g kg-1 seed to control seedling root rot in groundnut crop was undertaken. Practices like host plant resistance, crop rotation, seed treatment and one timely spray of chorothalonil (Kavach) at 30–40 days after sowing has effectively controlled diseases and increased pod yield by 2–3 times and crop income by 3 times.
Informational linkages for rural development
An example of successful informational linkages is the Aadarsh Mahila Samaikya Community Information Center in Addakal of Mahabubnagar District, Andhra Pradesh. The center is managed by a federation of women SHGs. The objective of the resource center is to help its members and community in the areas of agriculture and other inputs and support them in marketing aspects, organize training programs to its member families in the areas of skill building and income generation activities and mobilize funds to lend to its member groups. The resource center caters to multiple purposes that include market building and super bazaar, training hall, informal bank and offi ce, dormitory, highway restaurant and milk chilling unit.
Income generating micro-enterprises
Some of the initiatives undertaken in the APRLP-ICRISAT project watersheds to improve income generating options in the rural areas include village-based seed banks, vermicomposting and pigeonpea dhal making unit. Vermicompost is used to improve soil fertility and crop productivity through eco-friendly farming and assistance was provided to women SHGs to set up viable vermiculture enterprise at household level. A dhal mill was set up on pilot basis in Mentapally to add value to the produce and to fetch higher price in the market and avoid middlemen.
Strategies for the future
Even though all the above productivity enhancement interventions aim to improve the performance of agriculture and allied activities, focus should also be on equity in the distribution of these benefi ts. Since most of the crop production activities are land based, inequity in land distribution results in inequities in distribution of technology benefi ts from crop production. This can be seen from the analysis in section 5, where crop income had inequality increasing effect and non-farm income had inequality decreasing effect. It is possible that farmers with large holdings would benefi t much more from crop production technologies than small and landless farmers. Therefore, crop technology interventions should be backed by livestock and non-farm income generating activities to create livelihood opportunities and incentives for landless and marginal farmers. Caution should be taken so that watershed interventions do not aggravate the existing inequalities in the watershed areas as this would create confl icts and undermine incentives for collective action.
j327_2007Report34final.indd 82j327_2007Report34final.indd 82 10/26/2007 4:58:14 PM10/26/2007 4:58:14 PM

83
CYANMAGENTAYELLOWBLACK
Development strategies should take into consideration the diverse geographical and biophysical characteristics of the watershed areas. It is diffi cult and also not possible to come up with a strategy that suits all conditions. Agricultural potential and access to markets are two of the important factors that determine the technical and also the comparative advantage of a specifi c location.
Malleboinpally and Mentapally watersheds were placed in low agricultural potential category but the constraints for agricultural production differ (Table 70). Major source of household income in Malleboinpally was through regular employment due to its nearness to the district and mandal headquarters and takes precedence over agriculture as primary occupation whereas in Mentapally, lack of irrigation water was the major reason for low agricultural production. Therefore, any production enhancing investments in Mentapally could yield higher marginal benefi ts than in Malleboinpally.
In Tirumalapuram and Kacharam watersheds, scope for improving crop production through improved varieties and management practices exists with market access being a constraint for Tirumalapuram. Agricultural potential in Tirumalapuram could be medium to high with its relatively better water tables. Suitable cropping patterns with proper management practices could increase the agricultural production signifi cantly. Both these watersheds have good potential for livestock production activities as long as proper strategies are devised to meet fodder and feed requirements. Sorghum for fodder and grasses such as Stylosanthes can be promoted in these watersheds. Interventions that improve the productivity of small ruminants could help in addressing the inequalities in the distribution of watershed benefi ts. Among the two watersheds, Kacharam has an advantage in terms of a well organized milk cooperative and relatively easy access to market towns.
Both Nandavaram and Kanugulavanka watersheds have high agricultural potential with good access to markets. Scope for increasing the production of high-value crops exists and with proper linkages to or establishment of agro-processing units, the potential for increasing the household income is vast.
ReferencesADB. 2000. Technical assistance for combating desertifi cation in Asia. Manila, Philippines: Asian Development Bank.
Adams RH Jr. 1996. Livestock income, male/female animals and inequality in rural Pakistan. Discussion Paper No. 21. Washington, DC, USA: International Food Policy Research Institute.
Baumann P. 2000. Democratising development? Panchayat Raj institutions in watershed development in India. In Participatory watershed development: Challenges for the twenty-fi rst century (Farrington J, Turton C and James AJ, eds). New Delhi, India: Oxford University Press.
Boisvert RN and Ranney C. 1990. Accounting for the importance of nonfarm income on farm family income inequality in New York. Northeastern Journal of Agriculture and Resource Economics 19(1):1–11.
Table 70. Agricultural potential in the watershed areas.
Agriculture potential
Market access Low Medium High
Low Mentapally Tirumalapuram
Medium Malleboinpally Kacharam Nandavaram,Kanugulavanka
j327_2007Report34final.indd 83j327_2007Report34final.indd 83 10/26/2007 4:58:14 PM10/26/2007 4:58:14 PM
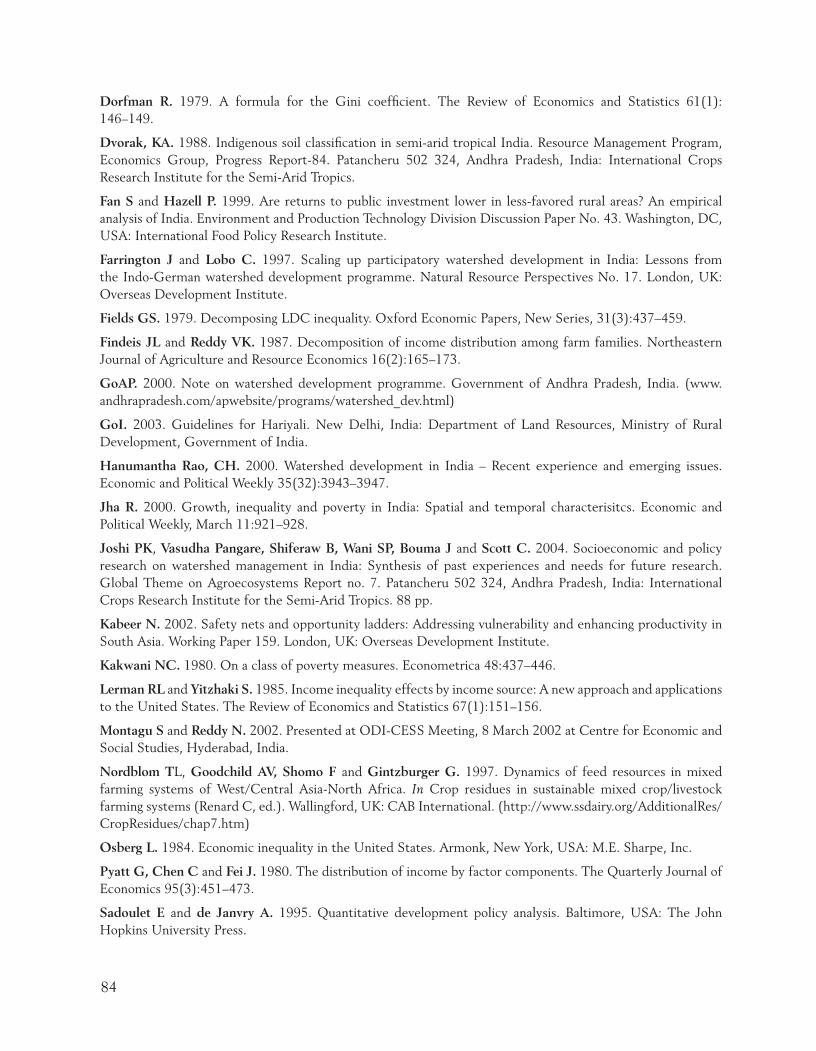
84
CYANMAGENTAYELLOWBLACK
Dorfman R. 1979. A formula for the Gini coeffi cient. The Review of Economics and Statistics 61(1):146–149.
Dvorak, KA. 1988. Indigenous soil classifi cation in semi-arid tropical India. Resource Management Program, Economics Group, Progress Report-84. Patancheru 502 324, Andhra Pradesh, India: International Crops Research Institute for the Semi-Arid Tropics.
Fan S and Hazell P. 1999. Are returns to public investment lower in less-favored rural areas? An empirical analysis of India. Environment and Production Technology Division Discussion Paper No. 43. Washington, DC, USA: International Food Policy Research Institute.
Farrington J and Lobo C. 1997. Scaling up participatory watershed development in India: Lessons from the Indo-German watershed development programme. Natural Resource Perspectives No. 17. London, UK: Overseas Development Institute.
Fields GS. 1979. Decomposing LDC inequality. Oxford Economic Papers, New Series, 31(3):437–459.
Findeis JL and Reddy VK. 1987. Decomposition of income distribution among farm families. Northeastern Journal of Agriculture and Resource Economics 16(2):165–173.
GoAP. 2000. Note on watershed development programme. Government of Andhra Pradesh, India. (www.andhrapradesh.com/apwebsite/programs/watershed_dev.html)
GoI. 2003. Guidelines for Hariyali. New Delhi, India: Department of Land Resources, Ministry of Rural Development, Government of India.
Hanumantha Rao, CH. 2000. Watershed development in India – Recent experience and emerging issues. Economic and Political Weekly 35(32):3943–3947.
Jha R. 2000. Growth, inequality and poverty in India: Spatial and temporal characterisitcs. Economic and Political Weekly, March 11:921–928.
Joshi PK, Vasudha Pangare, Shiferaw B, Wani SP, Bouma J and Scott C. 2004. Socioeconomic and policy research on watershed management in India: Synthesis of past experiences and needs for future research. Global Theme on Agroecosystems Report no. 7. Patancheru 502 324, Andhra Pradesh, India: International Crops Research Institute for the Semi-Arid Tropics. 88 pp.
Kabeer N. 2002. Safety nets and opportunity ladders: Addressing vulnerability and enhancing productivity in South Asia. Working Paper 159. London, UK: Overseas Development Institute.
Kakwani NC. 1980. On a class of poverty measures. Econometrica 48:437–446.
Lerman RL and Yitzhaki S. 1985. Income inequality effects by income source: A new approach and applications to the United States. The Review of Economics and Statistics 67(1):151–156.
Montagu S and Reddy N. 2002. Presented at ODI-CESS Meeting, 8 March 2002 at Centre for Economic and Social Studies, Hyderabad, India.
Nordblom TL, Goodchild AV, Shomo F and Gintzburger G. 1997. Dynamics of feed resources in mixed farming systems of West/Central Asia-North Africa. In Crop residues in sustainable mixed crop/livestock farming systems (Renard C, ed.). Wallingford, UK: CAB International. (http://www.ssdairy.org/AdditionalRes/CropResidues/chap7.htm)
Osberg L. 1984. Economic inequality in the United States. Armonk, New York, USA: M.E. Sharpe, Inc.
Pyatt G, Chen C and Fei J. 1980. The distribution of income by factor components. The Quarterly Journal of Economics 95(3):451–473.
Sadoulet E and de Janvry A. 1995. Quantitative development policy analysis. Baltimore, USA: The John Hopkins University Press.
j327_2007Report34final.indd 84j327_2007Report34final.indd 84 10/26/2007 4:58:14 PM10/26/2007 4:58:14 PM
85
CYANMAGENTAYELLOWBLACK
Samra JS and Narain P. 1995. Elements of successful implementation of watershed management. In Research for rainfed farming (Katyal JC and John Farrington, eds.). Hyderabad, India: Central Research Institute for Dryland Agriculture.
Scoones I. 1998. Sustainable rural livelihoods. A framework for analysis. IDS Working Paper No. 72. Brighton, UK: IDS.
Shiferaw B, Anupama GV, Nageswara Rao GD and Wani SP. 2002. Socioeconomic characterization and analysis of resource-use patterns in commumity watersheds in semi-arid India. Working Paper Series no. 12. Patancheru 502 324, Andhra Pradesh, India: International Crops Research Institute for the Semi-Arid Tropics. 44 pp.
Shiferaw BA, Wani SP and Nageswara Rao GD. 2003. Irrigation investments and groundwater depletion in Indian semi-arid villages: The effect of alternative water pricing regimes. Working Paper Series no. 17. Patancheru 502 324, Andhra Pradesh, India: International Crops Research Institute for the Semi-Arid Tropics. 24 pp.
Shorrocks AF. 1982. The impact of income components on the distribution of family incomes. Quarterly Journal of Economics 98:311–326.
Springate-Baginski O, Reddy RV, Reddy GM and Galab S. 2002. Watershed development in Andhra Pradesh: A policy review. Working Paper 5. London, UK: Department for International Development.
Srinivasulu K. 2002. Caste, class and social articulation in Andhra Pradesh: Mapping differential regional trajectories. Working Paper 179. London, UK: Overseas Development Institute.
Turton C. 2000. Enhancing livelihoods through participatory watershed development in India. Working Paper 131. London, UK: Overseas Development Institute.
Turton C and Farrington J. 1998. Enhancing rural livelihoods through participatory watershed development in India. Natural Resource Perspectives No. 34. London, UK: Overseas Development Institute.
Turton C, Warner M and Groom B. 1998. Scaling up participatory watershed development in India: A review of the literature. AgREN Network Paper No. 86. London, UK: Overseas Development Institute.
Wani SP, Pathak P and Rego TJ. (eds.) 2002. A training manual on integrated management of watersheds. Patancheru 502 324, Andhra Pradesh, India: International Crops Research Institute for the Semi-Arid Tropics. 44 pp.
Wani SP, Singh HP, Sreedevi TK, Pathak P, Rego TJ, Shiferaw B and Iyer SR. 2003. Farmer participatory integrated watershed management: Adarsha watershed, Kothapally, India, An innovative and upscalable approach. In Research towards integrated natural resources management: Examples of research problems, approaches and partnerships in action in the CGIAR (Harwood RR and Kassam AH, eds.). Rome, Italy: Interim Science Council and Center Directors Committee on Integrated Natural Resources Management.
j327_2007Report34final.indd 85j327_2007Report34final.indd 85 10/26/2007 4:58:14 PM10/26/2007 4:58:14 PM

CYANMAGENTAYELLOWBLACK
327-07
Visit us at www.icrisat.org
®®
The International Crops Research Institute for the Semi-Arid Tropics (ICRISAT) is a nonprofi t,non-political organization that does innovative agricultural research and capacity building forsustainable development with a wide array of partners across the globe. ICRISAT’s mission is to help empower 600 million poor people to overcome hunger, poverty and a degraded environment in the dry tropics through better agriculture. ICRISAT belongs to the Alliance of Future Harvest Centers of the Consultative Group on International Agricultural Research (CGIAR).
Contact Information
ICRISAT-Patancheru(Headquarters)Patancheru 502 324Andhra Pradesh, IndiaTel +91 40 30713071Fax +91 40 [email protected]
Liaison Offi ceCG Centers BlockNASC ComplexDev Prakash Shastri MargNew Delhi 110 012, IndiaTel +91 11 32472306 to 08 Fax +91 11 25841294
ICRISAT-Nairobi(Regional hub ESA)PO Box 39063, Nairobi, KenyaTel +254 20 7224550Fax +254 20 [email protected]
ICRISAT-Niamey(Regional hub WCA)BP 12404Niamey, Niger (Via Paris)Tel +227 20 722529, 20 722725Fax +227 20 [email protected]
ICRISAT-BamakoBP 320Bamako, MaliTel +223 2223375Fax +223 [email protected]
ICRISAT-BulawayoMatopos Research StationPO Box 776,Bulawayo, ZimbabweTel +263 83 8311 to 15Fax +263 83 8253/[email protected]
ICRISAT-LilongweChitedze Agricultural Research StationPO Box 1096Lilongwe, MalawiTel +265 1 707297/071/067/057Fax +265 1 [email protected]
ICRISAT-Maputoc/o IIAM, Av. das FPLM No 2698Caixa Postal 1906Maputo, MozambiqueTel +258 21 461657Fax +258 21 [email protected]
About ICRISAT
j327CoverReportno34.indd 1j327CoverReportno34.indd 1 10/26/2007 4:33:31 PM10/26/2007 4:33:31 PM

Acronyms
ADDRESS Action for Development of Rural Education and Service Society ANGRAU Acharya NG Ranga Agricultural University APSRAC Andhra Pradesh State Remote Sensing Application Centre BAIF Bharatiya Agro Industries Foundation BBF broad-bed and furrowBC backward caste CBO community-based organization CPR common property resources CRIDA Central Research Institute for Dryland AgricultureDAP diammonium phosphate DFID Department for International Development DPAP Drought Prone Area ProgrammeDRDA District Rural Development Agency DWMA District Water Management Agency FYM farmyard manure ICRISAT International Crops Research Institute for the Semi-arid TropicsINM integrated nutrient management IPM integrated pest management IWM integrated watershed management KVK Krishi Vigyan Kendra N nitrogen NARS national agricultural research system NGO non-governmental organization NPV nuclear polyhedrosis virus NRSA National Remote Sensing Agency OC forward caste P phosphorusPIA project implementing agency SC scheduled caste SDDPA Society for Development of Drought Prone Area SHG self-help group ST scheduled tribe
j327_2007Report34final.indd 86j327_2007Report34final.indd 86 10/26/2007 4:58:14 PM10/26/2007 4:58:14 PM

CYANMAGENTAYELLOWBLACK
327-07
Visit us at www.icrisat.org
®®
The International Crops Research Institute for the Semi-Arid Tropics (ICRISAT) is a nonprofi t,non-political organization that does innovative agricultural research and capacity building forsustainable development with a wide array of partners across the globe. ICRISAT’s mission is to help empower 600 million poor people to overcome hunger, poverty and a degraded environment in the dry tropics through better agriculture. ICRISAT belongs to the Alliance of Future Harvest Centers of the Consultative Group on International Agricultural Research (CGIAR).
Contact Information
ICRISAT-Patancheru(Headquarters)Patancheru 502 324Andhra Pradesh, IndiaTel +91 40 30713071Fax +91 40 [email protected]
Liaison Offi ceCG Centers BlockNASC ComplexDev Prakash Shastri MargNew Delhi 110 012, IndiaTel +91 11 32472306 to 08 Fax +91 11 25841294
ICRISAT-Nairobi(Regional hub ESA)PO Box 39063, Nairobi, KenyaTel +254 20 7224550Fax +254 20 [email protected]
ICRISAT-Niamey(Regional hub WCA)BP 12404Niamey, Niger (Via Paris)Tel +227 20 722529, 20 722725Fax +227 20 [email protected]
ICRISAT-BamakoBP 320Bamako, MaliTel +223 2223375Fax +223 [email protected]
ICRISAT-BulawayoMatopos Research StationPO Box 776,Bulawayo, ZimbabweTel +263 83 8311 to 15Fax +263 83 8253/[email protected]
ICRISAT-LilongweChitedze Agricultural Research StationPO Box 1096Lilongwe, MalawiTel +265 1 707297/071/067/057Fax +265 1 [email protected]
ICRISAT-Maputoc/o IIAM, Av. das FPLM No 2698Caixa Postal 1906Maputo, MozambiqueTel +258 21 461657Fax +258 21 [email protected]
About ICRISAT
j327CoverReportno34.indd 1j327CoverReportno34.indd 1 10/26/2007 4:33:31 PM10/26/2007 4:33:31 PM