aboriginal demographics from the 2011 national household survey
DESCRIPTION
Aboriginal Demographics From the 2011 National Household Survey Planning, Research and Statistics Branch. Aboriginal Demographics Overview. 1) Aboriginal Peoples Size Age Structure Geographic Distribution 2) Population Growth Population Growth Rate Components of the Demographic Explosion. - PowerPoint PPT PresentationTRANSCRIPT
Aboriginal DemographicsFrom the 2011 National Household Survey
Planning, Research and Statistics Branch
CIDM : 5242964 Last updated: May 2013
CIDM : 5242964 Last updated: May 2013
Aboriginal DemographicsOverview
1) Aboriginal PeoplesSizeAge StructureGeographic Distribution
2) Population GrowthPopulation Growth RateComponents of the Demographic Explosion
2
• In 2011, the Aboriginal Population was 1,400,685 according to the 2011 National Household Survey (NHS).
• The age structure of the Aboriginal population is much younger than the rest of the Canadian population.
• There is great variation in the geographic distribution across Aboriginal groups.
CIDM : 5242964 Last updated: May 2013
Part 1.Aboriginal Peoples : Highlights
3
CIDM : 5242964 Last updated: May 2013
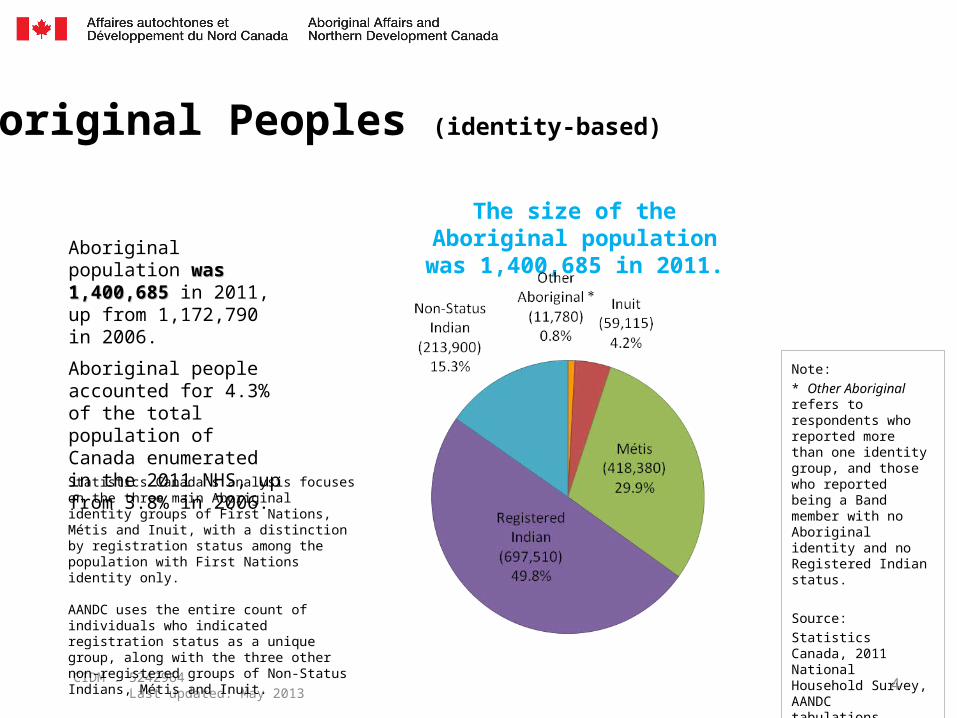
Aboriginal Peoples (identity-based)
Note:
* Other Aboriginalrefers to respondents who reported more than one identity group, and those who reported being a Band member with no Aboriginal identity and no Registered Indian status.
Source:
Statistics Canada, 2011 National Household Survey, AANDC tabulations.
Statistics Canada’s analysis focuses on the three main Aboriginal identity groups of First Nations, Métis and Inuit, with a distinction by registration status among the population with First Nations identity only.
AANDC uses the entire count of individuals who indicated registration status as a unique group, along with the three other non-registered groups of Non-Status Indians, Métis and Inuit.
The size of the Aboriginal populationwas 1,400,685 in 2011.
4
Aboriginal population was was 1,400,685 1,400,685 in 2011, up from 1,172,790 in 2006.
Aboriginal people accounted for 4.3% of the total population of Canada enumerated in the 2011 NHS, up from 3.8% in 2006.
CIDM : 5242964 Last updated: May 2013
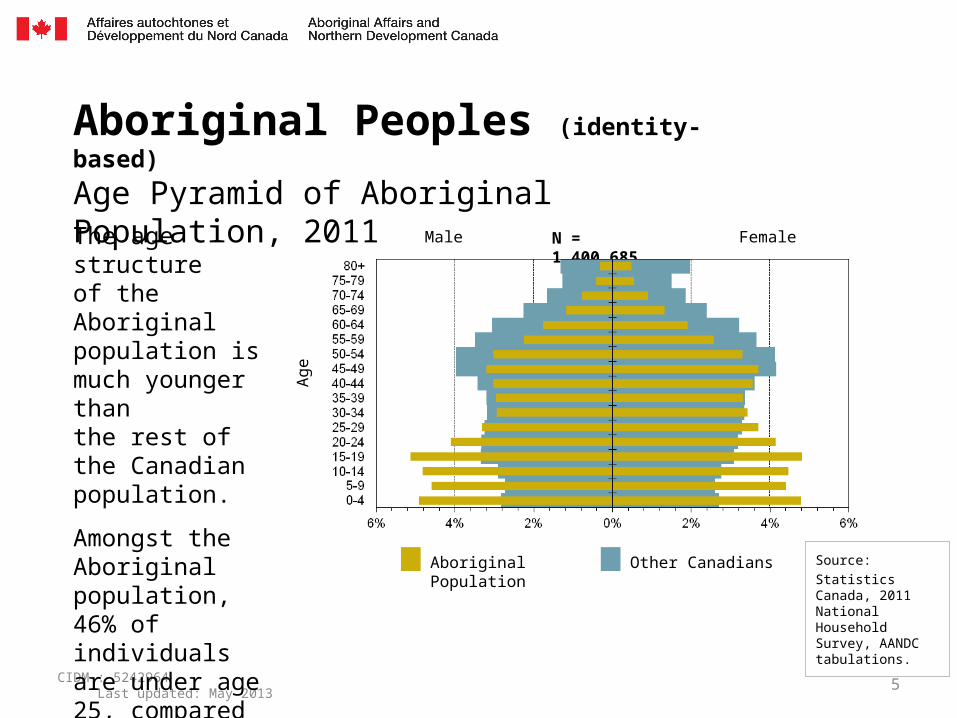
Aboriginal Peoples (identity-based)
Age Pyramid of Aboriginal Population, 2011
Aboriginal Population Other Canadians
Male Female
Ag
e
N = 1,400,685
The age structureof the Aboriginal population is much younger thanthe rest of the Canadian population.
Amongst the Aboriginal population, 46% of individuals are under age 25, compared to 29% for the rest of the Canadian population. Source:
Statistics Canada, 2011 National Household Survey, AANDC tabulations.
5
CIDM : 5242964 Last updated: May 2013
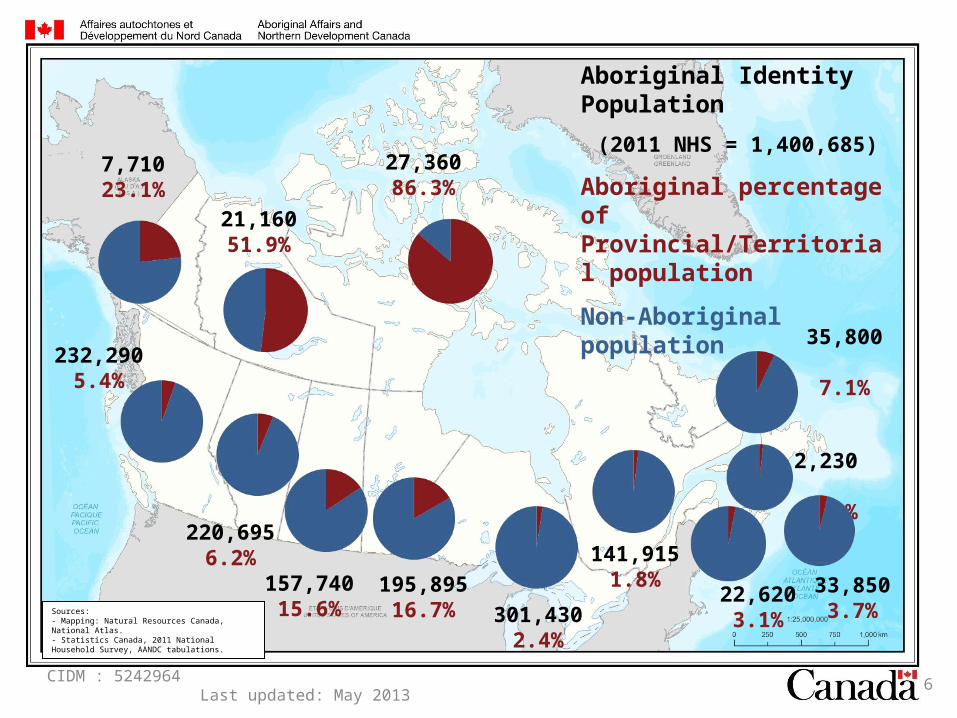
Aboriginal Identity Population
(2011 NHS = 1,400,685)
Aboriginal percentage of Provincial/Territorial population
Non-Aboriginal population
7,710 23.1%
21,160 51.9%
220,695 6.2%
232,290 5.4%
157,740 15.6%
195,895 16.7% 301,430
2.4%
27,360 86.3%
141,915 1.8%
35,800 7.1%
22,620 3.1%
33,850 3.7%
2,230 1.6%
Sources:- Mapping: Natural Resources Canada, National Atlas.- Statistics Canada, 2011 National Household Survey, AANDC tabulations.
6
.
CIDM :5242964 Last updated: May 2013
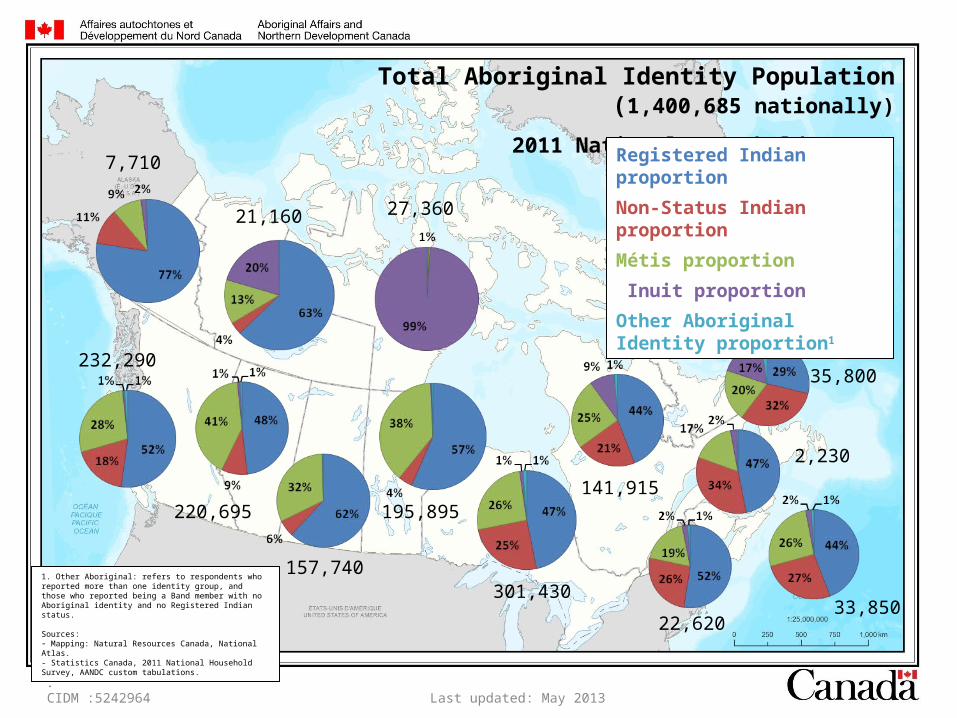
Total Aboriginal Identity Population (1,400,685 nationally)
2011 National Household Survey
7,710
21,160
220,695
232,290
157,740
195,895
301,430
27,360
141,915
35,800
22,62033,850
2,230
1. Other Aboriginal: refers to respondents who reported more than one identity group, and those who reported being a Band member with no Aboriginal identity and no Registered Indian status.
Sources:- Mapping: Natural Resources Canada, National Atlas.- Statistics Canada, 2011 National Household Survey, AANDC custom tabulations.
Registered Indian proportion
Non-Status Indian proportion
Métis proportion
Inuit proportion
Other Aboriginal Identity proportion1
CIDM : 5242964 Last updated: May 2013
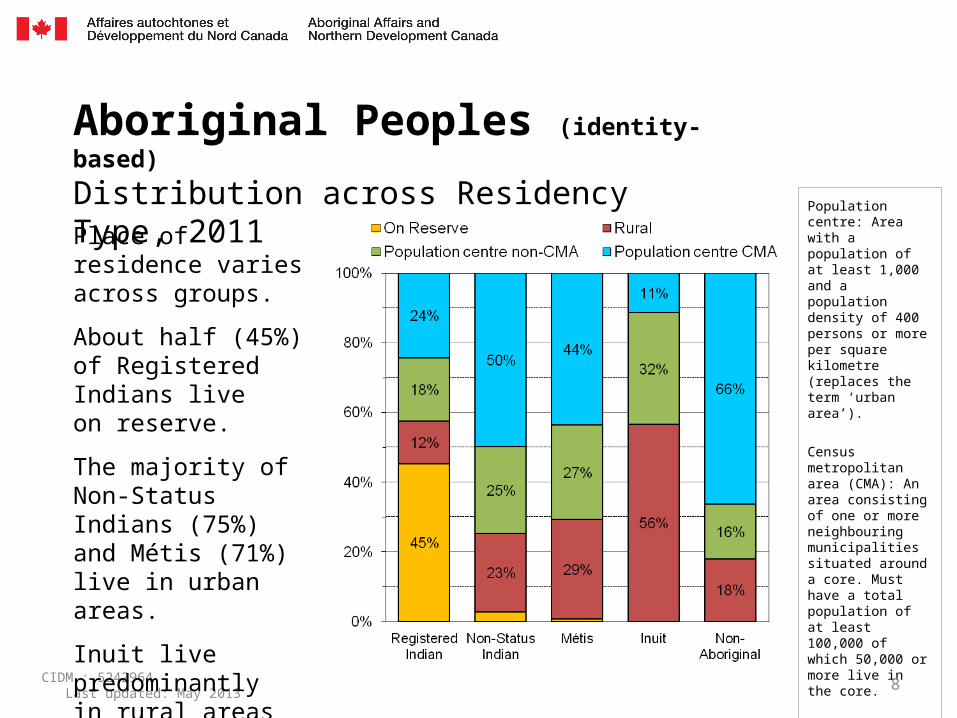
Aboriginal Peoples (identity-based)
Distribution across Residency Type, 2011
Place of residence varies across groups.
About half (45%) of Registered Indians liveon reserve.
The majority of Non-Status Indians (75%) and Métis (71%)live in urban areas.
Inuit live predominantlyin rural areas (56%).
Population centre: Area with a population of at least 1,000 and a population density of 400 persons or more per square kilometre (replaces the term ‘urban area’).
Census metropolitan area (CMA): An area consisting of one or more neighbouring municipalities situated around a core. Must have a total population of at least 100,000 of which 50,000 or more live in the core.
Source:
Statistics Canada, 2011 National Household Survey, AANDC tabulations.
8
CIDM : 5242964 Last updated: May 2013
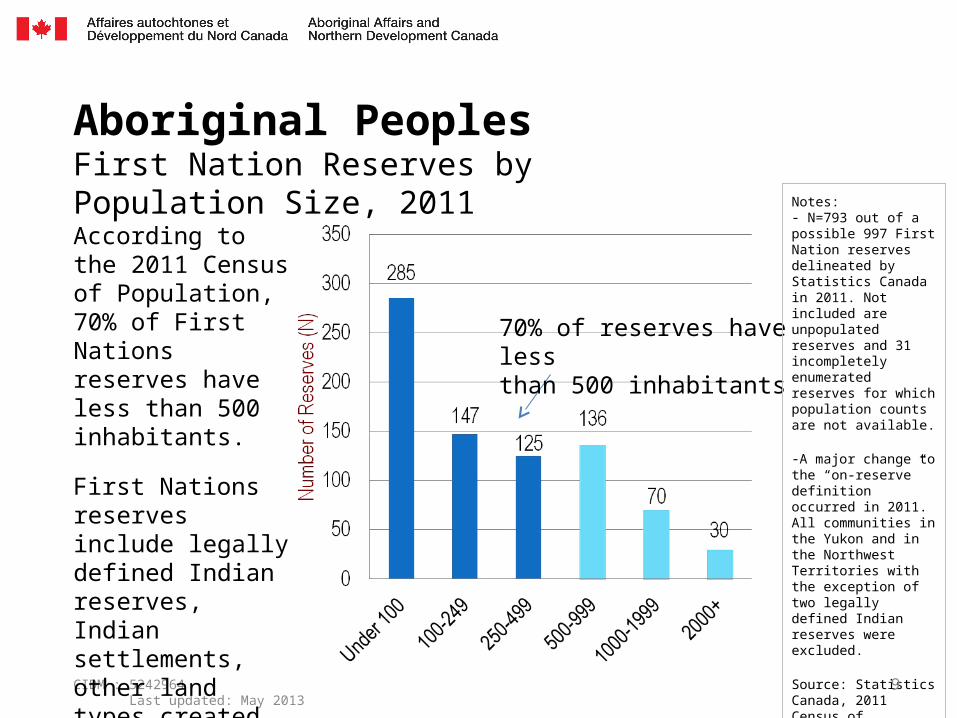
Aboriginal Peoples First Nation Reserves by Population Size, 2011
According to the 2011 Census of Population, 70% of First Nations reserves have less than 500 inhabitants.
First Nations reserves include legally defined Indian reserves, Indian settlements, other land types created by the ratification of Self-Government Agreements, and the northern village of Sandy Bay in Saskatchewan.
70% of reserves have less than 500 inhabitants
Notes: - N=793 out of a possible 997 First Nation reserves delineated by Statistics Canada in 2011. Not included are unpopulated reserves and 31 incompletely enumerated reserves for which population counts are not available.
-A major change to the “on-reserve” definition occurred in 2011. All communities in the Yukon and in the Northwest Territories with the exception of two legally defined Indian reserves were excluded.
Source: Statistics Canada, 2011 Census of Population, Geosuite.
9
CIDM : 5242964 Last updated: May 2013
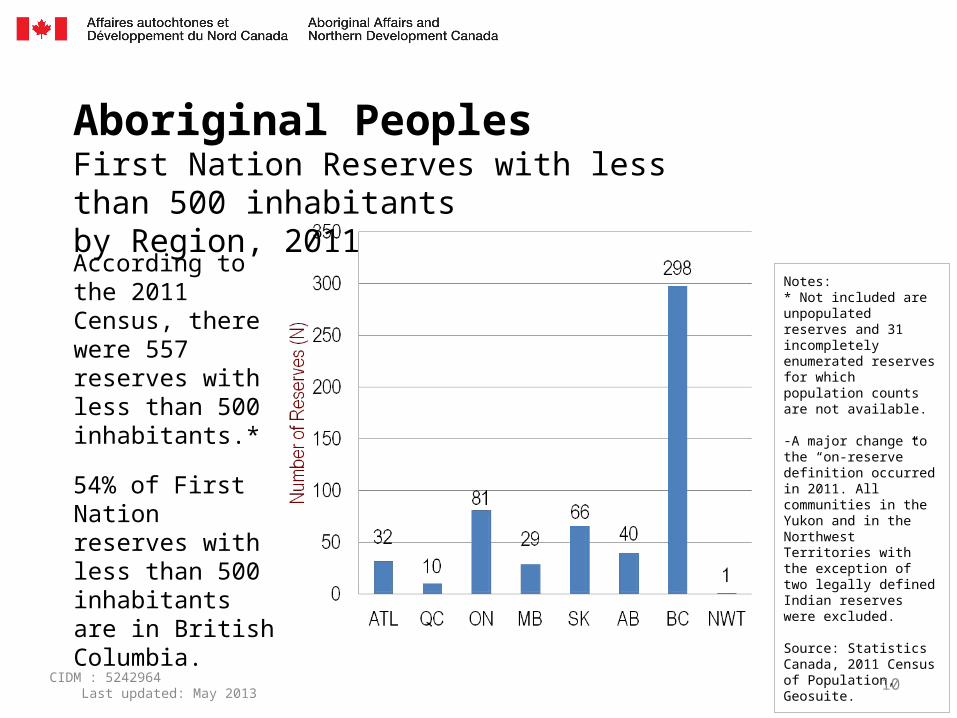
According to the 2011 Census, there were 557 reserves with less than 500 inhabitants.*
54% of First Nation reserves with less than 500 inhabitants are in British Columbia.
Aboriginal Peoples First Nation Reserves with less than 500 inhabitants by Region, 2011
Notes: * Not included are unpopulated reserves and 31 incompletely enumerated reserves for which population counts are not available.
-A major change to the “on-reserve” definition occurred in 2011. All communities in the Yukon and in the Northwest Territories with the exception of two legally defined Indian reserves were excluded.
Source: Statistics Canada, 2011 Census of Population, Geosuite.
10
• The Aboriginal population is growing substantially faster than the rest of the Canadian population.
• There is great variation in growth rates among Aboriginal groups.
• Fertility, migration and legislative changes can explain some of the growth in the Aboriginal Population.
• However, a significant portion of the population growth is attributable to ethnic mobility (changes in self-reporting of cultural affiliation).
CIDM : 5242964 Last updated: May 2013
Part 2.Population Growth: Highlights
11
CIDM : 5242964 Last updated: May 2013
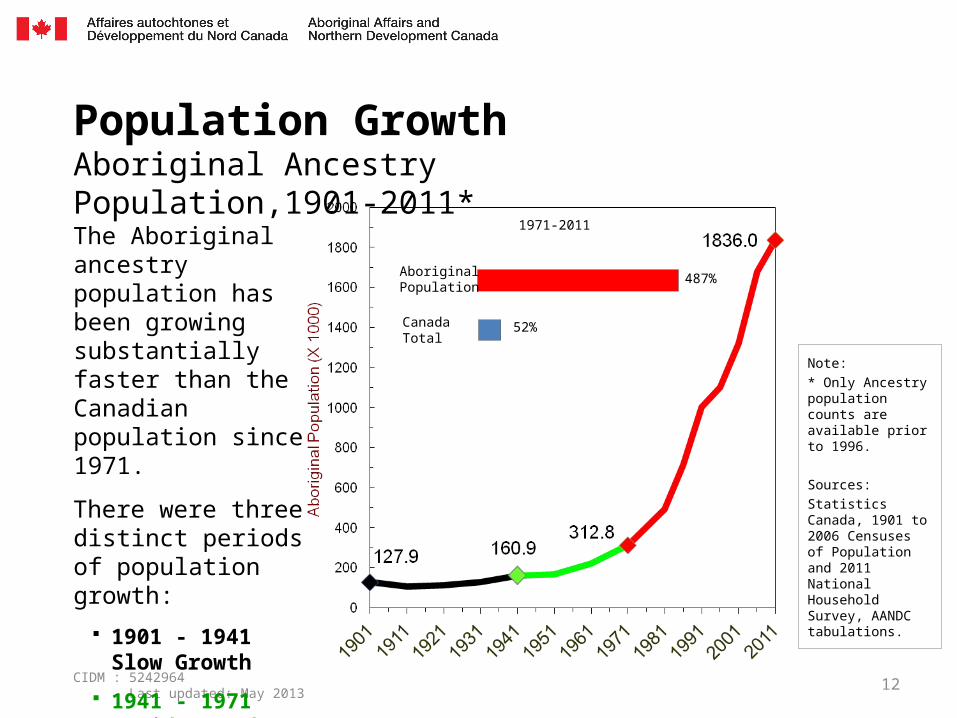
The Aboriginal ancestry population has been growing substantially faster than the Canadian population since 1971.
There were three distinct periods of population growth:
1901 - 1941Slow Growth
1941 - 1971Rapid Growth
1971 - 2011Explosion
Population Growth Aboriginal Ancestry Population,1901-2011*
Note:
* Only Ancestry population counts are available prior to 1996.
Sources:
Statistics Canada, 1901 to 2006 Censuses of Population and 2011 National Household Survey, AANDC tabulations.
12
487%
52%
Aboriginal Population
CanadaTotal
1971-2011
CIDM : 5242964 Last updated: May 2013
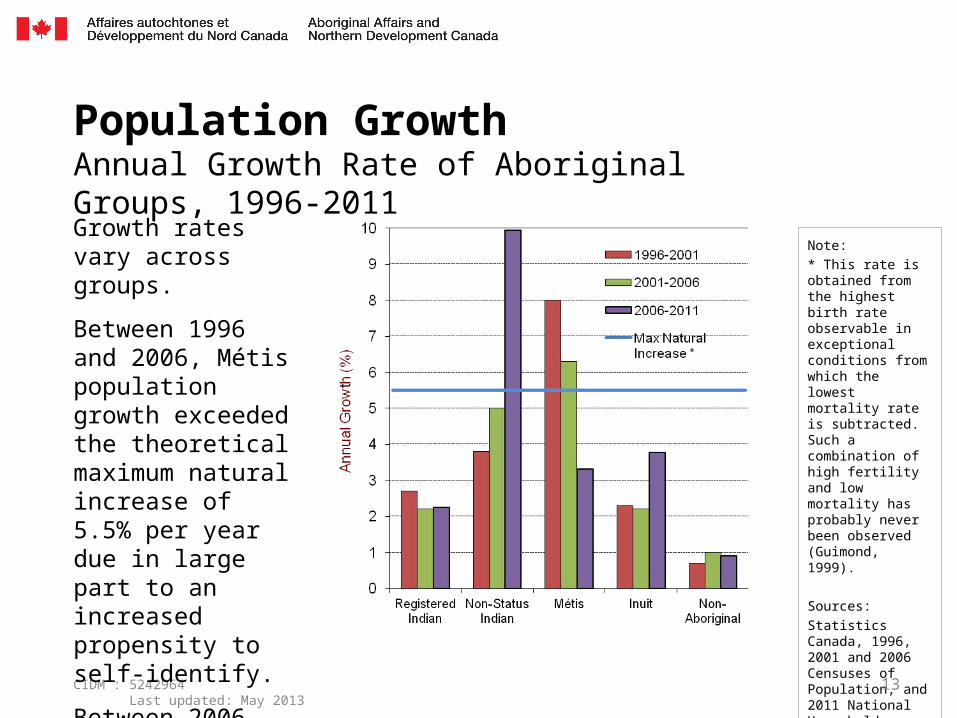
Growth rates vary across groups.
Between 1996 and 2006, Métis population growth exceeded the theoretical maximum natural increase of 5.5% per year due in large part to an increased propensity to self-identify.
Between 2006 and 2011 the Métis annual growth dropped to 3.3% while the Non-Status Indian growth rose to almost 10%.
Population Growth Annual Growth Rate of Aboriginal Groups, 1996-2011
Note:
* This rate is obtained from the highest birth rate observable in exceptional conditions from which the lowest mortality rate is subtracted. Such a combination of high fertility and low mortality has probably never been observed (Guimond, 1999).
Sources:
Statistics Canada, 1996, 2001 and 2006 Censuses of Population, and 2011 National Household Survey, AANDC tabulations.
13
CIDM : 5242964 Last updated: May 2013
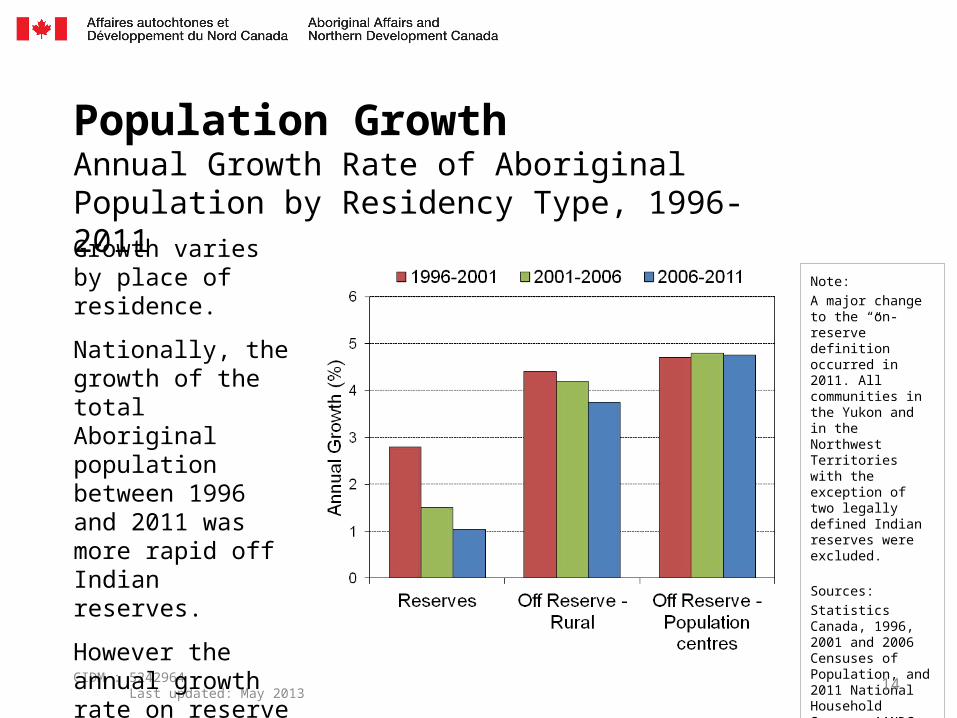
Growth varies by place of residence.
Nationally, the growth of the total Aboriginal population between 1996 and 2011 was more rapid off Indian reserves.
However the annual growth rate on reserve between 2006 and 2011 was slightly higher than the rate of the non-Aboriginal population off reserve .
Population Growth Annual Growth Rate of Aboriginal Population by Residency Type, 1996-2011
Note:
A major change to the “on-reserve” definition occurred in 2011. All communities in the Yukon and in the Northwest Territories with the exception of two legally defined Indian reserves were excluded.
Sources:
Statistics Canada, 1996, 2001 and 2006 Censuses of Population, and 2011 National Household Survey, AANDC tabulations.
14