abiotic and biotic compression of municipal solid...
TRANSCRIPT
Abiotic and Biotic Compression of Municipal Solid WasteChristopher A. Bareither1; Craig H. Benson2; Tuncer B. Edil3; and Morton A. Barlaz4
Abstract: This study focused on quantifying relative contributions of abiotic and biotic compression of municipal solid waste (MSW).Abiotic mechanisms include immediate compression, mechanical creep, and moisture-induced waste softening. The biotic mechanismis decomposition of the MSWorganic fraction, which when coupled with mechanical creep, yields biocompression. Three 610-mm-diameterlaboratory compression experiments were conducted for 1,150 days under the following conditions: (1) waste with no liquid addition (dry),(2) liquid addition spiked with biocide (abiotic), and (3) leachate recirculation (biotic). Immediate compression strain was similar in all threetests (24–27%). Mechanical creep, moisture-induced softening, and biocompression were compared via time-dependent compression ratios(C0
α). Moisture-induced softening occurred in both the abiotic and biotic cells in response to liquid addition and leachate recirculation.Moisture-induced softening accelerated the accumulation of mechanical creep (i.e., approximately doubled C0
α due to mechanical creeprelative to the dry cell), but did not increase the overall magnitude. C0
α, in the biotic cell, correlated with the methane flow rate when methano-genesis was controlled by the rate of solids hydrolysis. C0
α, due to mechanical creep in the dry cell and biocompression in the biotic cell,increased exponentially with temperature, and can be represented with an exponential model. C0
α, due to biocompression, was approximatelyone order of magnitude larger than C0
α due to mechanical creep.DOI: 10.1061/(ASCE)GT.1943-5606.0000660.© 2012 American Society ofCivil Engineers.
CE Database subject headings: Municipal wastes; Solid wastes; Settlement; Biological processes; Methane; Recirculation.
Author keywords:Municipal solid waste; Settlement; Bioreactor landfills; Methane generation; Leachate; Recirculation; Biocompression.
Introduction
Settlement of municipal solid waste (MSW) typically consists ofthree phases: (1) immediate compression, (2) mechanical creep,and (3) biocompression (Bjarngard and Edgers 1990; El-Fadeland Khoury 2000; Park and Lee 1997; Marques et al. 2003;Sharma and De 2007; Sivakumar Babu et al. 2010; Gourc et al.2010). Immediate compression is an abiotic mechanical processthat occurs rapidly in response to an increase in stress. Mechanicalcreep involves the slow time-dependent abiotic yielding and reor-ientation of MSW constituents under constant stress, whereas bio-compression involves abiotic mechanical creep coupled with bioticdecomposition of the MSW organic fraction. Biocompression isprimarily associated with anaerobic decomposition of the biode-gradable organic fraction of the waste, which depends on the or-ganic content, moisture content, and temperature (Farquhar andRovers 1973; Barlaz et al. 1990; Chugh et al. 1998; Rao and Singh2004).
The relative contributions of abiotic and biotic mechanismsare expected to differ depending on how a landfill is operated.In conventional landfills that are operated to minimize moistureinfiltration, abiotic mechanical processes are expected to controlsettlement. In bioreactor landfills, where leachate is recirculatedand supplemental liquids are added, both abiotic and biotic proc-esses are expected to contribute to settlement. Predictions of MSWsettlement are typically made using models that include parametersrepresentative of these abiotic and biotic processes (Sowers 1973;Bjarngard and Edgers 1990; Edil et al. 1990; El-Fadel and Khoury2000; Marques et al. 2003; Sivakumar Babu et al. 2010; Gourc et al.2010).
The primary biodegradable constituents in MSW are cellulose(C) and hemicellulose (H), which comprise approximately 40–60%of MSW by dry weight and account for greater than 90% of itsmethane potential (Barlaz et al. 1990). MSW decomposition is amicrobially mediated process that occurs in sequential phasesreferred to as hydrolysis, fermentation, acetogenesis, and methano-genesis (Farquhar and Rovers 1973; Zehnder 1978; Barlaz et al.1989; Pohland and Kim 1999; Levén et al. 2007). The initial stepis hydrolysis of complex polymers (e.g., C, H, starch, protein) tolower molecular weight monomers (e.g., sugars, amino acids).Fermentation of these monomers to alcohols, carboxylic acids(e.g., acetate, propionate, butyrate), hydrogen, and carbon dioxide,combined with acetogenesis of hydrogen and carbon dioxide toacetate, yields the substrates and chemical and microbial equilib-rium necessary for methanogenesis (Zehnder 1978). In the overallanaerobic decomposition process, hydrolysis is the rate-limitingstep when the substrate is complex solid organic material(e.g., C and H), whereas methanogenesis is rate-limiting whenthe substrate is solubilized (Noike et al. 1985; Pavlostathis andGiraldo-Gomez 1991; Vavilin et al. 1996).
The decomposition phases of MSW have unique leachatechemistry and biogas characteristics that have been linked totime-dependent compression phases of mechanical creep and
1Research Associate, Geological Engineering, Univ. of Wisconsin-Madison, Madison, WI 53706 (corresponding author). E-mail: [email protected]
2Wisconsin Distinguished Professor, Director of SustainabilityResearch and Education, and Chair, Civil and Environmental Engineering,Geological Engineering, Univ. of Wisconsin-Madison, Madison, WI53706. E-mail: [email protected]
3Professor, Geological Engineering, Univ. of Wisconsin-Madison,Madison, WI 53706. E-mail: [email protected]
4Professor and Head, Dept. of Civil, Construction, and EnvironmentalEngineering, North Carolina State Univ., Raleigh, NC 27695-7908. E-mail:[email protected]
Note. This manuscript was submitted on February 15, 2011; approvedon November 1, 2011; published online on December 10, 2011. Discussionperiod open until January 1, 2013; separate discussions must be submittedfor individual papers. This paper is part of the Journal of Geotechnical andGeoenvironmental Engineering, Vol. 138, No. 8, August 1, 2012.©ASCE, ISSN 1090-0241/2012/8-877–888/$25.00.
JOURNAL OF GEOTECHNICAL AND GEOENVIRONMENTAL ENGINEERING © ASCE / AUGUST 2012 / 877
J. G
eote
ch. G
eoen
viro
n. E
ng. 2
012.
138:
877-
888.
Dow
nloa
ded
from
asc
elib
rary
.org
by
Wis
cons
in U
niv
Of
Mad
ison
on
08/0
3/12
. For
per
sona
l use
onl
y.N
o ot
her
uses
with
out p
erm
issi
on. C
opyr
ight
(c)
201
2. A
mer
ican
Soc
iety
of
Civ
il E
ngin
eers
. All
righ
ts r
eser
ved.
biocompression (Hossain et al. 2003; Olivier and Gourc 2007;Ivanova et al. 2008; Gourc et al. 2010). During initial hydrolysis,fermentation, and acetogenesis (i.e., acid formation phase), carbox-ylic acids accumulate in the leachate and the leachate hydrogen ionconcentration (pH) decreases (Barlaz et al. 1989; Pohland and Kim1999). Mechanical creep is dominant during the acid formationphase (Wall and Zeiss 1995; Ivanova et al. 2008). Biocompressioncoincides with methanogenesis, which is characterized by methanegeneration, acid consumption, and increasing leachate pH. Thetransition from dominant mechanical creep to dominant biocom-pression has been linked to the onset of methane generation andacid consumption (Olivier and Gourc 2007; Ivanova et al. 2008;Bareither et al. 2010; Gourc et al. 2010).
Laboratory investigations evaluating the effect of mechanicalcreep and biocompression on MSW settlement are described inTable 1. These studies included temperature control (Wall and Zeiss1995), water addition (Kang et al. 1997), and acid addition(Hossain et al. 2003; Ivanova et al. 2008) to isolate the effectsof moisture addition and biological activity on MSW settlement.Time-dependent compression rates are represented by a mechanicalcreep ratio (C0
αM) and biocompression ratio (C0αB), which are
defined as the change in strain per change in logarithm of time(Bjarngard and Edgers 1990; El-Fadel and Khoury 2000; Hossainand Gabr 2005).
C0αM ranges from 0.015 to 0.07 regardless of experimental con-
ditions (Table 1). The largest C0αM (0.05–0.07) is reported for Kang
et al. (1997), and attributed to aggressive liquid addition/leachaterecirculation. Wall and Zeiss (1995) also identified a larger contri-bution of physical compression due to initial liquid addition andpresumed softening of waste constituents.
C0αB ranges from 0.10 to 0.35 (Table 1), with the higher end
being indicative of enhanced refuse decomposition during metha-nogenesis. Experiments by Olivier and Gourc (2007) and Ivanovaet al. (2008) with leachate recirculation exhibited a transition frommechanical creep to biocompression concurrent with a decrease involatile fatty acids or chemical oxygen demand (COD), increase inpH, and onset of methane generation.
Of the studies compiled in Table 1, only Olivier and Gourc(2007) and Ivanova et al. (2008) identified immediate compression,mechanical creep, and biocompression on single test specimenswith corresponding leachate chemistry and gas generation data.These experiments illustrated abiotic and biotic compressionmechanisms, and the chemical and biological characteristics ofthe MSW. However, controls without leachate addition and recir-culation (to simulate conventional cells) and with liquid additionand inhibited biological activity (to separate physical and bio-chemical compression mechanisms) were not conducted.
In this study, experiments were conducted to quantify abiotic andbiotic contributions to MSW settlement, and to relate biotic com-pression to temperature, leachate chemistry, methane generation,and solids decomposition. Three large-scale laboratory compres-sion tests were conducted under the following conditions: (1) wastewith no liquid addition (dry), (2) liquid addition spiked with biocide(abiotic), and (3) leachate recirculation (biotic). The dry and abioticexperiments identified mechanical settlements that can be attributedto physical softening of the waste particles due to moisture addition.The biotic test illustrated the relative magnitudes of mechanicalcreep in softened MSWand biocompression. The compression testswere operated for 1,150 days. Settlement, gas production and com-position, and leachate chemistry were monitored.
Methods and Materials
Municipal Solid Waste
The waste used was collected from a transfer station in WakeCounty, North Carolina, and contained the following material com-position: 56.8% paper, 16.1% plastic, 11.8% food waste, 5.4% soil,3.5% metal, 3.4% glass, 2.3% textiles, 0.5% miscellaneous, and0.2% yard waste on a wet mass basis. Each waste fraction wasshredded in a high-torque slow-speed shredder to particles sizes≤ 100 mm. Shredded waste was then recombined proportionatelyto the initial waste composition.
Composite waste samples recovered at the end of the compres-sion experiments were analyzed for water content; C, H, and
Table 1. Laboratory Experiments Evaluating Effects of Mechanical Creep and Biocompression on Waste Settlement
Reference Experiment description
Testduration
(d)
Celldiameter(mm)
Verticalstress(kPa)
Watercontent(%)
Temperature(°C)
Weeklyliquid dose(L∕Mg) C0
αM C0αB
Wall and Zeiss (1995) Leachate recirculation,
hydrogen ion concentation
buffering, and sewage
sludge addition
225 570 10 53.6 25 58 0.033–0.056 —
Conventional 225 570 10 53.6 4 — 0.037–0.049 —Kang et al. (1997) Water addition 320 400 — 96 28 7 0.045 —
Leachate recirculation 320 400 — 96 28 7, 35, and
161
0.050–0.070 0.10–0.14
Hossain et al. (2003) Active biodegradation 70 64 95 122 39 — 0.020–0.030 0.05–0.19Saturated with 6%
acetic acid
20 64 95 122 39 — 0.015–0.030 —
Olivier and Gourc (2007) Leachate recirculation 660 1,000 130 51 34 6–48 0.046 0.35
Ivanova et al. (2008) Nutrient/sludge addition
and leachate recirculation
919 480 50 — 30 17.2a 0.044 0.13
10 g∕L acetic and propionic
acid addition
919 480 50 — 30 17.2a 0.054 0.19
Note: Water content on dry weight basis; C0αM = mechanical creep ratio; C0
αB = biocompression ratio.aDose in L∕Mg∕h when in use.
878 / JOURNAL OF GEOTECHNICAL AND GEOENVIRONMENTAL ENGINEERING © ASCE / AUGUST 2012
J. G
eote
ch. G
eoen
viro
n. E
ng. 2
012.
138:
877-
888.
Dow
nloa
ded
from
asc
elib
rary
.org
by
Wis
cons
in U
niv
Of
Mad
ison
on
08/0
3/12
. For
per
sona
l use
onl
y.N
o ot
her
uses
with
out p
erm
issi
on. C
opyr
ight
(c)
201
2. A
mer
ican
Soc
iety
of
Civ
il E
ngin
eers
. All
righ
ts r
eser
ved.
lignin (L) contents; volatile solids (VS); and biochemical methanepotential (BMP). Water content was determined by oven drying at105°C for 24 h or until the change in mass loss was negligible. VSwere determined as the mass loss on combustion at 550°C for2-hour BMP assays were conducted following protocols describedin Wang et al. (1994). C, H, and L contents were measured usingprocedures described in Pettersen and Schwandt (1991) and Davis(1998). Sugars resulting from hydrolysis of C and H were analyzedby high-performance liquid chromatography using an electro-chemical detector. All chemical tests were conducted on materialground to pass a 1-mm screen.
Laboratory Reactors
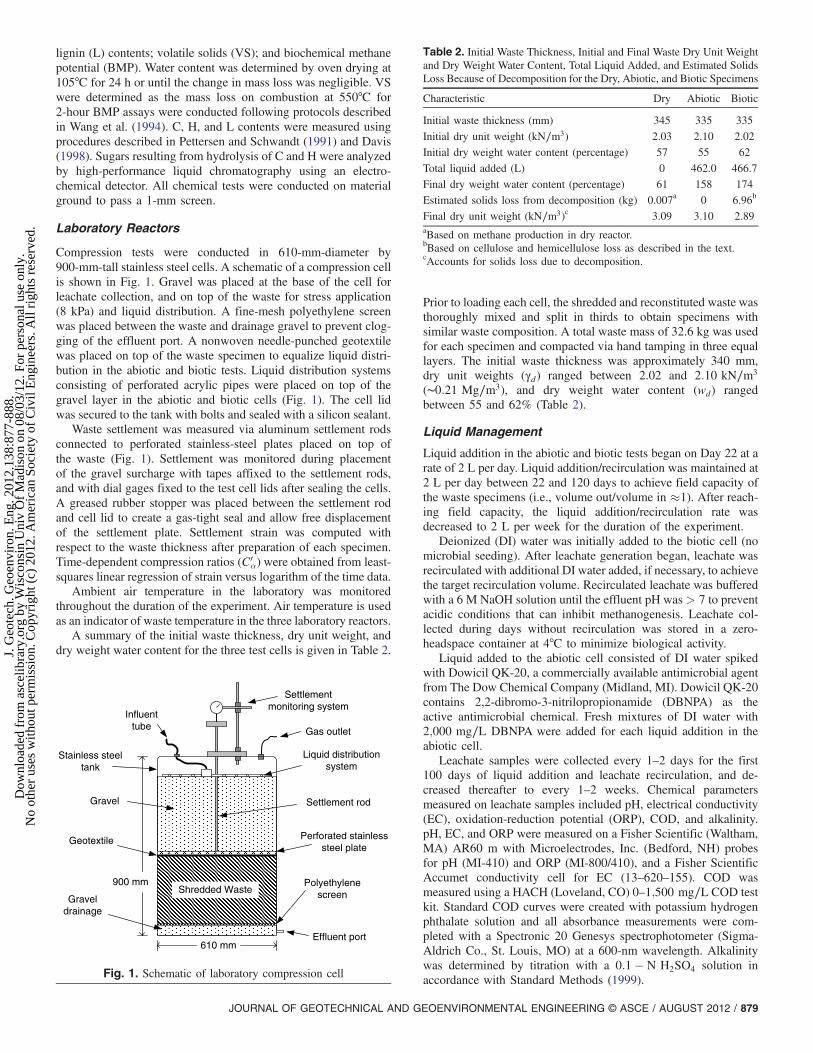
Compression tests were conducted in 610-mm-diameter by900-mm-tall stainless steel cells. A schematic of a compression cellis shown in Fig. 1. Gravel was placed at the base of the cell forleachate collection, and on top of the waste for stress application(8 kPa) and liquid distribution. A fine-mesh polyethylene screenwas placed between the waste and drainage gravel to prevent clog-ging of the effluent port. A nonwoven needle-punched geotextilewas placed on top of the waste specimen to equalize liquid distri-bution in the abiotic and biotic tests. Liquid distribution systemsconsisting of perforated acrylic pipes were placed on top of thegravel layer in the abiotic and biotic cells (Fig. 1). The cell lidwas secured to the tank with bolts and sealed with a silicon sealant.
Waste settlement was measured via aluminum settlement rodsconnected to perforated stainless-steel plates placed on top ofthe waste (Fig. 1). Settlement was monitored during placementof the gravel surcharge with tapes affixed to the settlement rods,and with dial gages fixed to the test cell lids after sealing the cells.A greased rubber stopper was placed between the settlement rodand cell lid to create a gas-tight seal and allow free displacementof the settlement plate. Settlement strain was computed withrespect to the waste thickness after preparation of each specimen.Time-dependent compression ratios (C0
α) were obtained from least-squares linear regression of strain versus logarithm of the time data.
Ambient air temperature in the laboratory was monitoredthroughout the duration of the experiment. Air temperature is usedas an indicator of waste temperature in the three laboratory reactors.
A summary of the initial waste thickness, dry unit weight, anddry weight water content for the three test cells is given in Table 2.
Prior to loading each cell, the shredded and reconstituted waste wasthoroughly mixed and split in thirds to obtain specimens withsimilar waste composition. A total waste mass of 32.6 kg was usedfor each specimen and compacted via hand tamping in three equallayers. The initial waste thickness was approximately 340 mm,dry unit weights (γd) ranged between 2.02 and 2:10 kN∕m3
(∼0:21 Mg∕m3), and dry weight water content (wd) rangedbetween 55 and 62% (Table 2).
Liquid Management
Liquid addition in the abiotic and biotic tests began on Day 22 at arate of 2 L per day. Liquid addition/recirculation was maintained at2 L per day between 22 and 120 days to achieve field capacity ofthe waste specimens (i.e., volume out/volume in ≈1). After reach-ing field capacity, the liquid addition/recirculation rate wasdecreased to 2 L per week for the duration of the experiment.
Deionized (DI) water was initially added to the biotic cell (nomicrobial seeding). After leachate generation began, leachate wasrecirculated with additional DI water added, if necessary, to achievethe target recirculation volume. Recirculated leachate was bufferedwith a 6 M NaOH solution until the effluent pH was> 7 to preventacidic conditions that can inhibit methanogenesis. Leachate col-lected during days without recirculation was stored in a zero-headspace container at 4°C to minimize biological activity.
Liquid added to the abiotic cell consisted of DI water spikedwith Dowicil QK-20, a commercially available antimicrobial agentfrom The Dow Chemical Company (Midland, MI). Dowicil QK-20contains 2,2-dibromo-3-nitrilopropionamide (DBNPA) as theactive antimicrobial chemical. Fresh mixtures of DI water with2;000 mg∕L DBNPA were added for each liquid addition in theabiotic cell.
Leachate samples were collected every 1–2 days for the first100 days of liquid addition and leachate recirculation, and de-creased thereafter to every 1–2 weeks. Chemical parametersmeasured on leachate samples included pH, electrical conductivity(EC), oxidation-reduction potential (ORP), COD, and alkalinity.pH, EC, and ORP were measured on a Fisher Scientific (Waltham,MA) AR60 m with Microelectrodes, Inc. (Bedford, NH) probesfor pH (MI-410) and ORP (MI-800/410), and a Fisher ScientificAccumet conductivity cell for EC (13–620–155). COD wasmeasured using a HACH (Loveland, CO) 0–1;500 mg∕L COD testkit. Standard COD curves were created with potassium hydrogenphthalate solution and all absorbance measurements were com-pleted with a Spectronic 20 Genesys spectrophotometer (Sigma-Aldrich Co., St. Louis, MO) at a 600-nm wavelength. Alkalinitywas determined by titration with a 0:1� N H2SO4 solution inaccordance with Standard Methods (1999).
610 mm
900 mm
Gravel drainage
Polyethylene screenShredded Waste
Perforated stainless steel plate
Geotextile
Liquid distribution system
Influent tube
Effluent port
Settlement monitoring system
Gas outlet
Stainless steel tank
Gravel Settlement rod
Fig. 1. Schematic of laboratory compression cell
Table 2. Initial Waste Thickness, Initial and Final Waste Dry Unit Weightand Dry Weight Water Content, Total Liquid Added, and Estimated SolidsLoss Because of Decomposition for the Dry, Abiotic, and Biotic Specimens
Characteristic Dry Abiotic Biotic
Initial waste thickness (mm) 345 335 335
Initial dry unit weight (kN∕m3) 2.03 2.10 2.02
Initial dry weight water content (percentage) 57 55 62
Total liquid added (L) 0 462.0 466.7
Final dry weight water content (percentage) 61 158 174
Estimated solids loss from decomposition (kg) 0.007a 0 6.96b
Final dry unit weight (kN∕m3)c 3.09 3.10 2.89aBased on methane production in dry reactor.bBased on cellulose and hemicellulose loss as described in the text.cAccounts for solids loss due to decomposition.
JOURNAL OF GEOTECHNICAL AND GEOENVIRONMENTAL ENGINEERING © ASCE / AUGUST 2012 / 879
J. G
eote
ch. G
eoen
viro
n. E
ng. 2
012.
138:
877-
888.
Dow
nloa
ded
from
asc
elib
rary
.org
by
Wis
cons
in U
niv
Of
Mad
ison
on
08/0
3/12
. For
per
sona
l use
onl
y.N
o ot
her
uses
with
out p
erm
issi
on. C
opyr
ight
(c)
201
2. A
mer
ican
Soc
iety
of
Civ
il E
ngin
eers
. All
righ
ts r
eser
ved.
Gas Collection and Composition
Gas composition was assessed weekly at the start of the experimentby sampling gas from the headspace of the reactors (Fig. 1) andanalyzing its composition with a Shimadzu Gas Chromatograph(GC-2014) equipped with flame ionization and thermal conduc-tivity detectors. Percentages of hydrogen, nitrogen, oxygen, carbondioxide, and methane were calculated with respect to standardgases (Scott Specialty Gases, Plumsteadville, PA; AGA Gas,Inc., Maumee, OH).
Problems encountered with the gas collection systems duringthe first 255 days rendered data from this period erroneous andunusable. The gas collection systems were then improved and re-liable data were subsequently obtained. Gas was captured in 40-Lflexfoil SKC Inc. (Eight Four, PA) gasbags, and volume was mea-sured via water displacement in calibrated 50-L (�0:5 L) or 10-L(�0:1 L) containers submerged in acidified water (pH ∼ 3:0). Gassamples for composition analysis were extracted from the gasbagsand stored in evacuated glass vials prior to analysis.
Results
Settlement
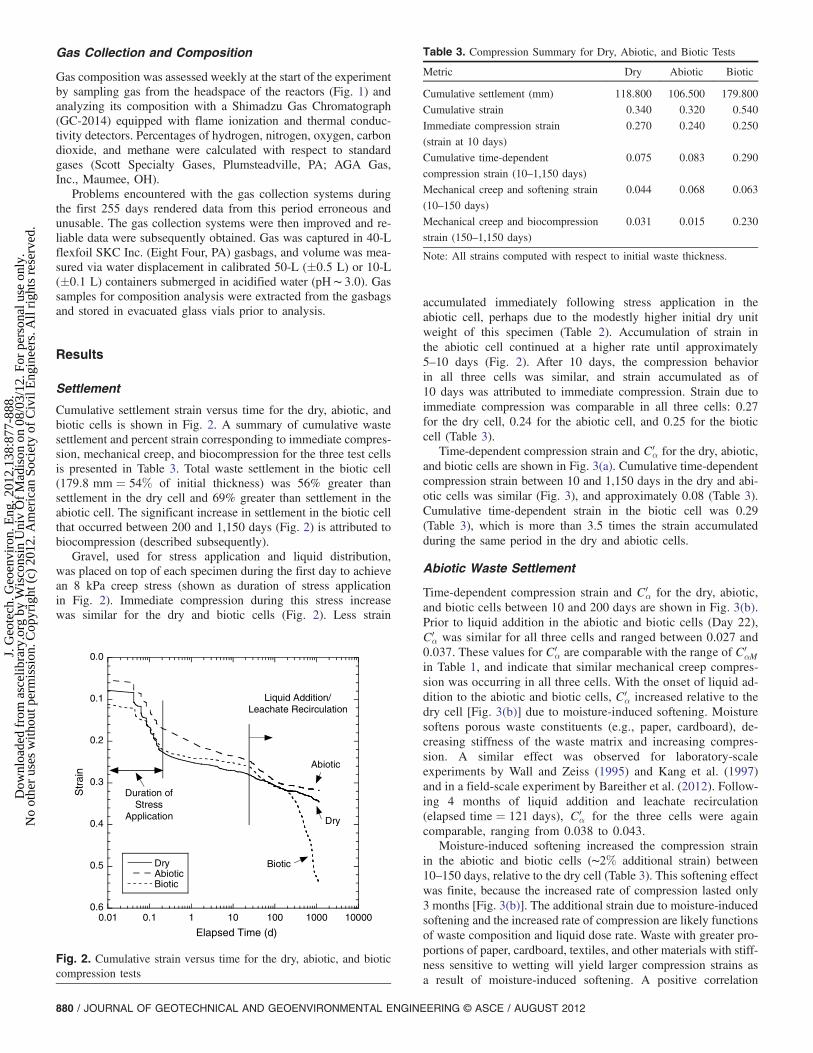
Cumulative settlement strain versus time for the dry, abiotic, andbiotic cells is shown in Fig. 2. A summary of cumulative wastesettlement and percent strain corresponding to immediate compres-sion, mechanical creep, and biocompression for the three test cellsis presented in Table 3. Total waste settlement in the biotic cell(179:8 mm ¼ 54% of initial thickness) was 56% greater thansettlement in the dry cell and 69% greater than settlement in theabiotic cell. The significant increase in settlement in the biotic cellthat occurred between 200 and 1,150 days (Fig. 2) is attributed tobiocompression (described subsequently).
Gravel, used for stress application and liquid distribution,was placed on top of each specimen during the first day to achievean 8 kPa creep stress (shown as duration of stress applicationin Fig. 2). Immediate compression during this stress increasewas similar for the dry and biotic cells (Fig. 2). Less strain
accumulated immediately following stress application in theabiotic cell, perhaps due to the modestly higher initial dry unitweight of this specimen (Table 2). Accumulation of strain inthe abiotic cell continued at a higher rate until approximately5–10 days (Fig. 2). After 10 days, the compression behaviorin all three cells was similar, and strain accumulated as of10 days was attributed to immediate compression. Strain due toimmediate compression was comparable in all three cells: 0.27for the dry cell, 0.24 for the abiotic cell, and 0.25 for the bioticcell (Table 3).
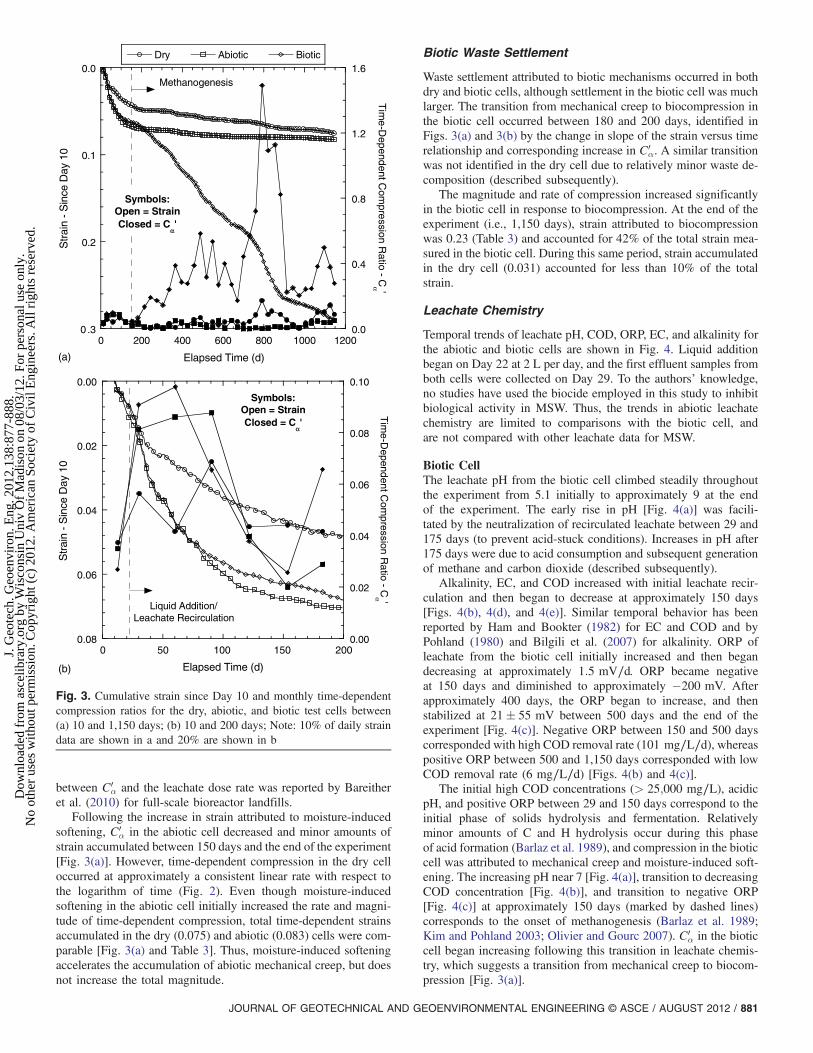
Time-dependent compression strain and C0α for the dry, abiotic,
and biotic cells are shown in Fig. 3(a). Cumulative time-dependentcompression strain between 10 and 1,150 days in the dry and abi-otic cells was similar (Fig. 3), and approximately 0.08 (Table 3).Cumulative time-dependent strain in the biotic cell was 0.29(Table 3), which is more than 3.5 times the strain accumulatedduring the same period in the dry and abiotic cells.
Abiotic Waste Settlement
Time-dependent compression strain and C0α for the dry, abiotic,
and biotic cells between 10 and 200 days are shown in Fig. 3(b).Prior to liquid addition in the abiotic and biotic cells (Day 22),C0α was similar for all three cells and ranged between 0.027 and
0.037. These values for C0α are comparable with the range of C0
αMin Table 1, and indicate that similar mechanical creep compres-sion was occurring in all three cells. With the onset of liquid ad-dition to the abiotic and biotic cells, C0
α increased relative to thedry cell [Fig. 3(b)] due to moisture-induced softening. Moisturesoftens porous waste constituents (e.g., paper, cardboard), de-creasing stiffness of the waste matrix and increasing compres-sion. A similar effect was observed for laboratory-scaleexperiments by Wall and Zeiss (1995) and Kang et al. (1997)and in a field-scale experiment by Bareither et al. (2012). Follow-ing 4 months of liquid addition and leachate recirculation(elapsed time ¼ 121 days), C0
α for the three cells were againcomparable, ranging from 0.038 to 0.043.
Moisture-induced softening increased the compression strainin the abiotic and biotic cells (∼2% additional strain) between10–150 days, relative to the dry cell (Table 3). This softening effectwas finite, because the increased rate of compression lasted only3 months [Fig. 3(b)]. The additional strain due to moisture-inducedsoftening and the increased rate of compression are likely functionsof waste composition and liquid dose rate. Waste with greater pro-portions of paper, cardboard, textiles, and other materials with stiff-ness sensitive to wetting will yield larger compression strains asa result of moisture-induced softening. A positive correlation
Table 3. Compression Summary for Dry, Abiotic, and Biotic Tests
Metric Dry Abiotic Biotic
Cumulative settlement (mm) 118.800 106.500 179.800
Cumulative strain 0.340 0.320 0.540
Immediate compression strain
(strain at 10 days)
0.270 0.240 0.250
Cumulative time-dependent
compression strain (10–1,150 days)
0.075 0.083 0.290
Mechanical creep and softening strain
(10–150 days)
0.044 0.068 0.063
Mechanical creep and biocompression
strain (150–1,150 days)
0.031 0.015 0.230
Note: All strains computed with respect to initial waste thickness.
0.0
0.1
0.2
0.3
0.4
0.5
0.60.01 0.1 1 10 100 1000 10000
DryAbioticBiotic
Str
ain
Elapsed Time (d)
Liquid Addition/Leachate Recirculation
Duration ofStress
Application
Abiotic
Dry
Biotic
Fig. 2. Cumulative strain versus time for the dry, abiotic, and bioticcompression tests
880 / JOURNAL OF GEOTECHNICAL AND GEOENVIRONMENTAL ENGINEERING © ASCE / AUGUST 2012
J. G
eote
ch. G
eoen
viro
n. E
ng. 2
012.
138:
877-
888.
Dow
nloa
ded
from
asc
elib
rary
.org
by
Wis
cons
in U
niv
Of
Mad
ison
on
08/0
3/12
. For
per
sona
l use
onl
y.N
o ot
her
uses
with
out p
erm
issi
on. C
opyr
ight
(c)
201
2. A
mer
ican
Soc
iety
of
Civ
il E
ngin
eers
. All
righ
ts r
eser
ved.
between C0α and the leachate dose rate was reported by Bareither
et al. (2010) for full-scale bioreactor landfills.Following the increase in strain attributed to moisture-induced
softening, C0α in the abiotic cell decreased and minor amounts of
strain accumulated between 150 days and the end of the experiment[Fig. 3(a)]. However, time-dependent compression in the dry celloccurred at approximately a consistent linear rate with respect tothe logarithm of time (Fig. 2). Even though moisture-inducedsoftening in the abiotic cell initially increased the rate and magni-tude of time-dependent compression, total time-dependent strainsaccumulated in the dry (0.075) and abiotic (0.083) cells were com-parable [Fig. 3(a) and Table 3]. Thus, moisture-induced softeningaccelerates the accumulation of abiotic mechanical creep, but doesnot increase the total magnitude.
Biotic Waste Settlement
Waste settlement attributed to biotic mechanisms occurred in bothdry and biotic cells, although settlement in the biotic cell was muchlarger. The transition from mechanical creep to biocompression inthe biotic cell occurred between 180 and 200 days, identified inFigs. 3(a) and 3(b) by the change in slope of the strain versus timerelationship and corresponding increase in C0
α. A similar transitionwas not identified in the dry cell due to relatively minor waste de-composition (described subsequently).
The magnitude and rate of compression increased significantlyin the biotic cell in response to biocompression. At the end of theexperiment (i.e., 1,150 days), strain attributed to biocompressionwas 0.23 (Table 3) and accounted for 42% of the total strain mea-sured in the biotic cell. During this same period, strain accumulatedin the dry cell (0.031) accounted for less than 10% of the totalstrain.
Leachate Chemistry
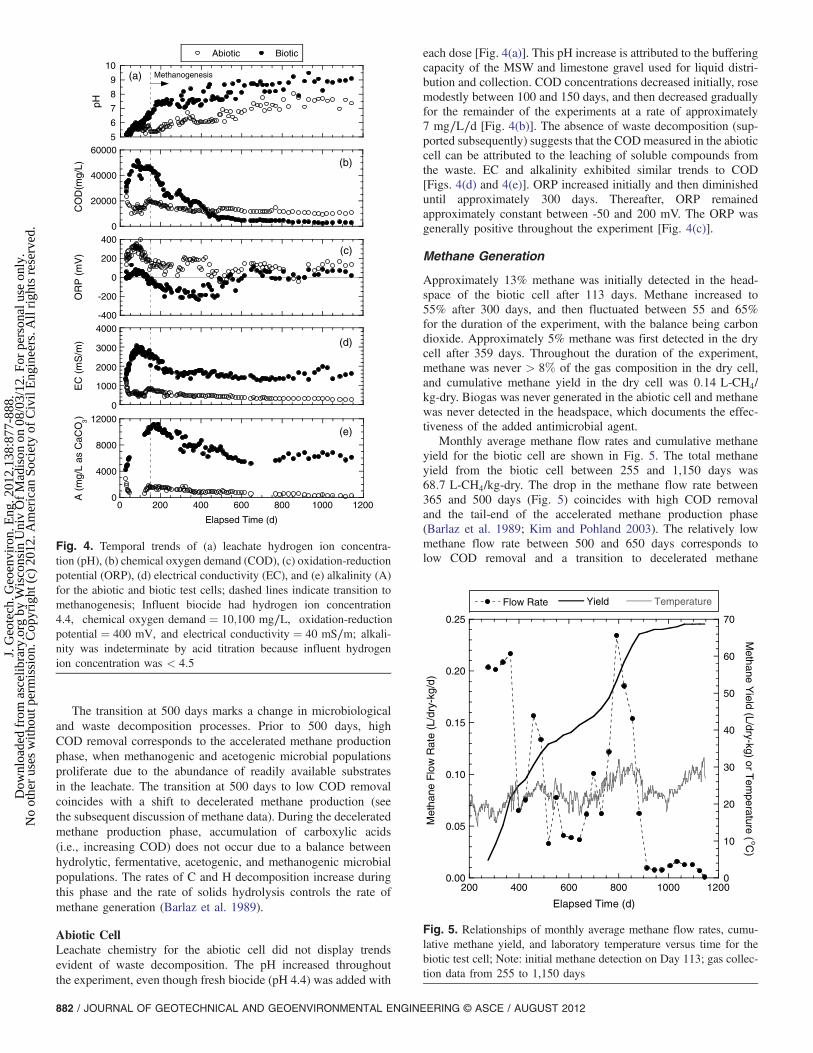
Temporal trends of leachate pH, COD, ORP, EC, and alkalinity forthe abiotic and biotic cells are shown in Fig. 4. Liquid additionbegan on Day 22 at 2 L per day, and the first effluent samples fromboth cells were collected on Day 29. To the authors’ knowledge,no studies have used the biocide employed in this study to inhibitbiological activity in MSW. Thus, the trends in abiotic leachatechemistry are limited to comparisons with the biotic cell, andare not compared with other leachate data for MSW.
Biotic CellThe leachate pH from the biotic cell climbed steadily throughoutthe experiment from 5.1 initially to approximately 9 at the endof the experiment. The early rise in pH [Fig. 4(a)] was facili-tated by the neutralization of recirculated leachate between 29 and175 days (to prevent acid-stuck conditions). Increases in pH after175 days were due to acid consumption and subsequent generationof methane and carbon dioxide (described subsequently).
Alkalinity, EC, and COD increased with initial leachate recir-culation and then began to decrease at approximately 150 days[Figs. 4(b), 4(d), and 4(e)]. Similar temporal behavior has beenreported by Ham and Bookter (1982) for EC and COD and byPohland (1980) and Bilgili et al. (2007) for alkalinity. ORP ofleachate from the biotic cell initially increased and then begandecreasing at approximately 1:5 mV∕d. ORP became negativeat 150 days and diminished to approximately �200 mV. Afterapproximately 400 days, the ORP began to increase, and thenstabilized at 21� 55 mV between 500 days and the end of theexperiment [Fig. 4(c)]. Negative ORP between 150 and 500 dayscorresponded with high COD removal rate (101 mg∕L∕d), whereaspositive ORP between 500 and 1,150 days corresponded with lowCOD removal rate (6 mg∕L∕d) [Figs. 4(b) and 4(c)].
The initial high COD concentrations (> 25;000 mg∕L), acidicpH, and positive ORP between 29 and 150 days correspond to theinitial phase of solids hydrolysis and fermentation. Relativelyminor amounts of C and H hydrolysis occur during this phaseof acid formation (Barlaz et al. 1989), and compression in the bioticcell was attributed to mechanical creep and moisture-induced soft-ening. The increasing pH near 7 [Fig. 4(a)], transition to decreasingCOD concentration [Fig. 4(b)], and transition to negative ORP[Fig. 4(c)] at approximately 150 days (marked by dashed lines)corresponds to the onset of methanogenesis (Barlaz et al. 1989;Kim and Pohland 2003; Olivier and Gourc 2007). C0
α in the bioticcell began increasing following this transition in leachate chemis-try, which suggests a transition from mechanical creep to biocom-pression [Fig. 3(a)].
0.0
0.1
0.2
0.03.0
0.4
0.8
1.2
1.6
0 200 400 600 800 1000 1200
Dry Abiotic Biotic
DryAbioticBiotic
Str
ain
- S
ince
Day
10
Tim
e-Dependent C
ompression R
atio - Cα '
Elapsed Time (d)
Symbols:Open = StrainClosed = C
α'
Methanogenesis
(a)
0.00
0.02
0.04
0.06
00.00.08
0.02
0.04
0.06
0.08
0.10
0 50 100 150 200
Str
ain
- S
ince
Day
10
Tim
e-Dependent C
ompression R
atio - Cα '
Elapsed Time (d)
Symbols:Open = StrainClosed = C
α'
(b)
Liquid Addition/Leachate Recirculation
Fig. 3. Cumulative strain since Day 10 and monthly time-dependentcompression ratios for the dry, abiotic, and biotic test cells between(a) 10 and 1,150 days; (b) 10 and 200 days; Note: 10% of daily straindata are shown in a and 20% are shown in b
JOURNAL OF GEOTECHNICAL AND GEOENVIRONMENTAL ENGINEERING © ASCE / AUGUST 2012 / 881
J. G
eote
ch. G
eoen
viro
n. E
ng. 2
012.
138:
877-
888.
Dow
nloa
ded
from
asc
elib
rary
.org
by
Wis
cons
in U
niv
Of
Mad
ison
on
08/0
3/12
. For
per
sona
l use
onl
y.N
o ot
her
uses
with
out p
erm
issi
on. C
opyr
ight
(c)
201
2. A
mer
ican
Soc
iety
of
Civ
il E
ngin
eers
. All
righ
ts r
eser
ved.
The transition at 500 days marks a change in microbiologicaland waste decomposition processes. Prior to 500 days, highCOD removal corresponds to the accelerated methane productionphase, when methanogenic and acetogenic microbial populationsproliferate due to the abundance of readily available substratesin the leachate. The transition at 500 days to low COD removalcoincides with a shift to decelerated methane production (seethe subsequent discussion of methane data). During the deceleratedmethane production phase, accumulation of carboxylic acids(i.e., increasing COD) does not occur due to a balance betweenhydrolytic, fermentative, acetogenic, and methanogenic microbialpopulations. The rates of C and H decomposition increase duringthis phase and the rate of solids hydrolysis controls the rate ofmethane generation (Barlaz et al. 1989).
Abiotic CellLeachate chemistry for the abiotic cell did not display trendsevident of waste decomposition. The pH increased throughoutthe experiment, even though fresh biocide (pH 4.4) was added with
each dose [Fig. 4(a)]. This pH increase is attributed to the bufferingcapacity of the MSW and limestone gravel used for liquid distri-bution and collection. COD concentrations decreased initially, rosemodestly between 100 and 150 days, and then decreased graduallyfor the remainder of the experiments at a rate of approximately7 mg∕L∕d [Fig. 4(b)]. The absence of waste decomposition (sup-ported subsequently) suggests that the CODmeasured in the abioticcell can be attributed to the leaching of soluble compounds fromthe waste. EC and alkalinity exhibited similar trends to COD[Figs. 4(d) and 4(e)]. ORP increased initially and then diminisheduntil approximately 300 days. Thereafter, ORP remainedapproximately constant between -50 and 200 mV. The ORP wasgenerally positive throughout the experiment [Fig. 4(c)].
Methane Generation
Approximately 13% methane was initially detected in the head-space of the biotic cell after 113 days. Methane increased to55% after 300 days, and then fluctuated between 55 and 65%for the duration of the experiment, with the balance being carbondioxide. Approximately 5% methane was first detected in the drycell after 359 days. Throughout the duration of the experiment,methane was never > 8% of the gas composition in the dry cell,and cumulative methane yield in the dry cell was 0:14 L-CH4/kg-dry. Biogas was never generated in the abiotic cell and methanewas never detected in the headspace, which documents the effec-tiveness of the added antimicrobial agent.
Monthly average methane flow rates and cumulative methaneyield for the biotic cell are shown in Fig. 5. The total methaneyield from the biotic cell between 255 and 1,150 days was68:7 L-CH4/kg-dry. The drop in the methane flow rate between365 and 500 days (Fig. 5) coincides with high COD removaland the tail-end of the accelerated methane production phase(Barlaz et al. 1989; Kim and Pohland 2003). The relatively lowmethane flow rate between 500 and 650 days corresponds tolow COD removal and a transition to decelerated methane
0.00
0.05
0.10
0.15
0.20
0.25
0
10
20
30
40
50
60
70
200 400 600 800 1000 1200
Flow Rate Yield Temperature
Met
hane
Flo
w R
ate
(L/d
ry-k
g/d)
Methane Y
ield (L/dry-kg) or Tem
perature (oC
)
Elapsed Time (d)
Fig. 5. Relationships of monthly average methane flow rates, cumu-lative methane yield, and laboratory temperature versus time for thebiotic test cell; Note: initial methane detection on Day 113; gas collec-tion data from 255 to 1,150 days
5
6
7
8
9
10Abiotic Biotic
pH
(a) Methanogenesis
0
20000
40000
60000
CO
D(m
g/L) (b)
-400
-200
0
200
400
OR
P (
mV
) (c)
0
1000
2000
3000
4000
EC
(m
S/m
) (d)
0
4000
8000
12000
0 200 400 600 800 1000 1200
A (
mg/
L as
CaC
O3)
Elapsed Time (d)
(e)
Fig. 4. Temporal trends of (a) leachate hydrogen ion concentra-tion (pH), (b) chemical oxygen demand (COD), (c) oxidation-reductionpotential (ORP), (d) electrical conductivity (EC), and (e) alkalinity (A)for the abiotic and biotic test cells; dashed lines indicate transition tomethanogenesis; Influent biocide had hydrogen ion concentration4.4, chemical oxygen demand ¼ 10;100 mg∕L, oxidation-reductionpotential ¼ 400 mV, and electrical conductivity ¼ 40 mS∕m; alkali-nity was indeterminate by acid titration because influent hydrogenion concentration was < 4:5
882 / JOURNAL OF GEOTECHNICAL AND GEOENVIRONMENTAL ENGINEERING © ASCE / AUGUST 2012
J. G
eote
ch. G
eoen
viro
n. E
ng. 2
012.
138:
877-
888.
Dow
nloa
ded
from
asc
elib
rary
.org
by
Wis
cons
in U
niv
Of
Mad
ison
on
08/0
3/12
. For
per
sona
l use
onl
y.N
o ot
her
uses
with
out p
erm
issi
on. C
opyr
ight
(c)
201
2. A
mer
ican
Soc
iety
of
Civ
il E
ngin
eers
. All
righ
ts r
eser
ved.
production. A second spike in methane flow rate was recorded onDay 791, which coincided with an increase in laboratory temper-ature (Fig. 5). This spike in methane generation diminished whenthe room temperature decreased. Similar correspondence betweenmethane generation and temperature has been reported by others(Hartz et al. 1982; Cecchi et al. 1992; Hao et al. 2008). Room tem-perature increased again after Day 1,000; however, the methaneflow rate continued to diminish, indicating depletion of degradablesolids.
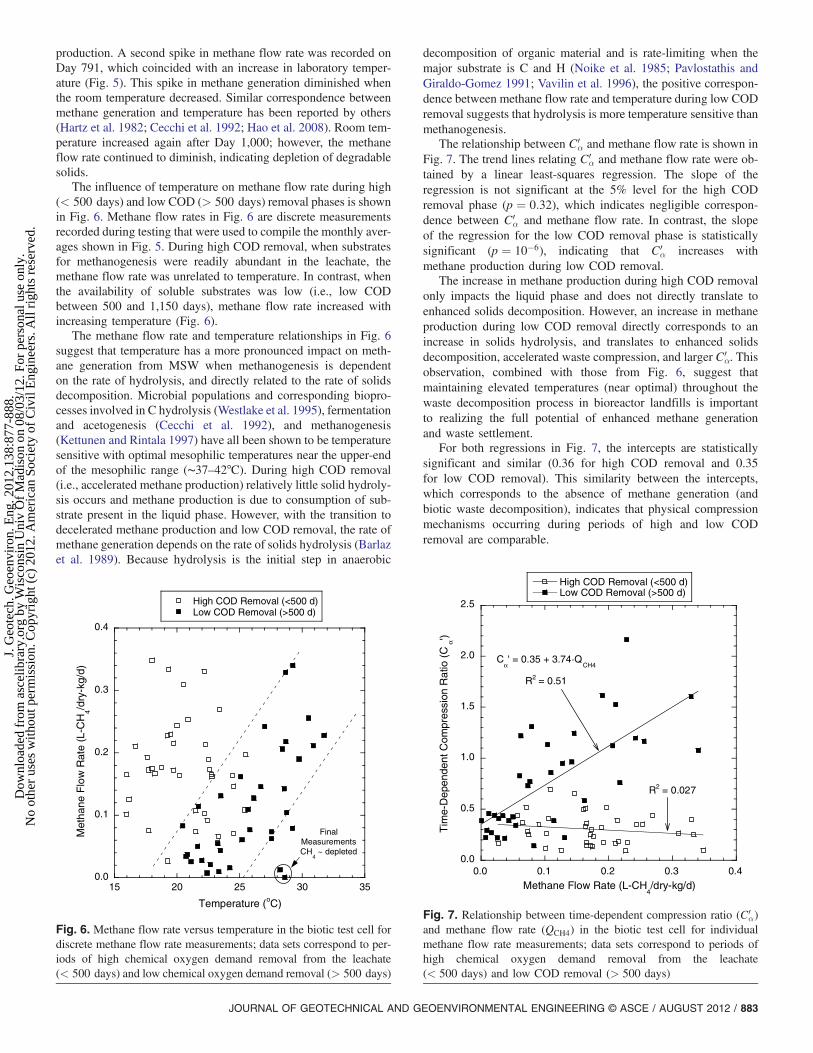
The influence of temperature on methane flow rate during high(< 500 days) and low COD (> 500 days) removal phases is shownin Fig. 6. Methane flow rates in Fig. 6 are discrete measurementsrecorded during testing that were used to compile the monthly aver-ages shown in Fig. 5. During high COD removal, when substratesfor methanogenesis were readily abundant in the leachate, themethane flow rate was unrelated to temperature. In contrast, whenthe availability of soluble substrates was low (i.e., low CODbetween 500 and 1,150 days), methane flow rate increased withincreasing temperature (Fig. 6).
The methane flow rate and temperature relationships in Fig. 6suggest that temperature has a more pronounced impact on meth-ane generation from MSW when methanogenesis is dependenton the rate of hydrolysis, and directly related to the rate of solidsdecomposition. Microbial populations and corresponding biopro-cesses involved in C hydrolysis (Westlake et al. 1995), fermentationand acetogenesis (Cecchi et al. 1992), and methanogenesis(Kettunen and Rintala 1997) have all been shown to be temperaturesensitive with optimal mesophilic temperatures near the upper-endof the mesophilic range (∼37–42°C). During high COD removal(i.e., accelerated methane production) relatively little solid hydroly-sis occurs and methane production is due to consumption of sub-strate present in the liquid phase. However, with the transition todecelerated methane production and low COD removal, the rate ofmethane generation depends on the rate of solids hydrolysis (Barlazet al. 1989). Because hydrolysis is the initial step in anaerobic
decomposition of organic material and is rate-limiting when themajor substrate is C and H (Noike et al. 1985; Pavlostathis andGiraldo-Gomez 1991; Vavilin et al. 1996), the positive correspon-dence between methane flow rate and temperature during low CODremoval suggests that hydrolysis is more temperature sensitive thanmethanogenesis.
The relationship between C0α and methane flow rate is shown in
Fig. 7. The trend lines relating C0α and methane flow rate were ob-
tained by a linear least-squares regression. The slope of theregression is not significant at the 5% level for the high CODremoval phase (p ¼ 0:32), which indicates negligible correspon-dence between C0
α and methane flow rate. In contrast, the slopeof the regression for the low COD removal phase is statisticallysignificant (p ¼ 10�6), indicating that C0
α increases withmethane production during low COD removal.
The increase in methane production during high COD removalonly impacts the liquid phase and does not directly translate toenhanced solids decomposition. However, an increase in methaneproduction during low COD removal directly corresponds to anincrease in solids hydrolysis, and translates to enhanced solidsdecomposition, accelerated waste compression, and larger C0
α. Thisobservation, combined with those from Fig. 6, suggest thatmaintaining elevated temperatures (near optimal) throughout thewaste decomposition process in bioreactor landfills is importantto realizing the full potential of enhanced methane generationand waste settlement.
For both regressions in Fig. 7, the intercepts are statisticallysignificant and similar (0.36 for high COD removal and 0.35for low COD removal). This similarity between the intercepts,which corresponds to the absence of methane generation (andbiotic waste decomposition), indicates that physical compressionmechanisms occurring during periods of high and low CODremoval are comparable.
0.0
0.1
0.2
0.3
0.4
15 20 25 30 35
High COD Removal (<500 d)Low COD Removal (>500 d)
Met
hane
Flo
w R
ate
(L-C
H4/d
ry-k
g/d)
Temperature (oC)
FinalMeasurementsCH
4 ~ depleted
Fig. 6. Methane flow rate versus temperature in the biotic test cell fordiscrete methane flow rate measurements; data sets correspond to per-iods of high chemical oxygen demand removal from the leachate(< 500 days) and low chemical oxygen demand removal (> 500 days)
0.0
0.5
1.0
1.5
2.0
2.5
0.0 0.1 0.2 0.3 0.4
High COD Removal (<500 d)Low COD Removal (>500 d)
Tim
e-D
epen
dent
Com
pres
sion
Rat
io (
Cα')
Methane Flow Rate (L-CH4/dry-kg/d)
Cα' = 0.35 + 3.74·Q
CH4
R2 = 0.51
R2 = 0.027
Fig. 7. Relationship between time-dependent compression ratio (C0α)
and methane flow rate (QCH4) in the biotic test cell for individualmethane flow rate measurements; data sets correspond to periods ofhigh chemical oxygen demand removal from the leachate(< 500 days) and low COD removal (> 500 days)
JOURNAL OF GEOTECHNICAL AND GEOENVIRONMENTAL ENGINEERING © ASCE / AUGUST 2012 / 883
J. G
eote
ch. G
eoen
viro
n. E
ng. 2
012.
138:
877-
888.
Dow
nloa
ded
from
asc
elib
rary
.org
by
Wis
cons
in U
niv
Of
Mad
ison
on
08/0
3/12
. For
per
sona
l use
onl
y.N
o ot
her
uses
with
out p
erm
issi
on. C
opyr
ight
(c)
201
2. A
mer
ican
Soc
iety
of
Civ
il E
ngin
eers
. All
righ
ts r
eser
ved.
Waste Composition and Characteristics
A summary of the final γd and wd, total liquid added, and solids lossdue to waste decomposition for the dry, abiotic, and biotic test cellsis in Table 2. Total liquid addition to the abiotic and bioticcells was similar; 462.0 L was added to the abiotic cell and466.7 L was added to the biotic cell. This liquid addition amountedto approximately 14;240 L∕Mg of MSW, which is approximately14 times greater than the upper-end of liquid addition realized infull-scale bioreactor landfills (Bareither et al. 2010). The final wd
for the abiotic and biotic cells increased by more than 100%(Table 2) due to liquid addition and leachate recirculation. In con-trast, the initial and final wd for waste in the dry cell differed byonly 4%, which is within the variability commonly associated withMSWwater content measurements (Hull et al. 2005; Bareither et al.2010).
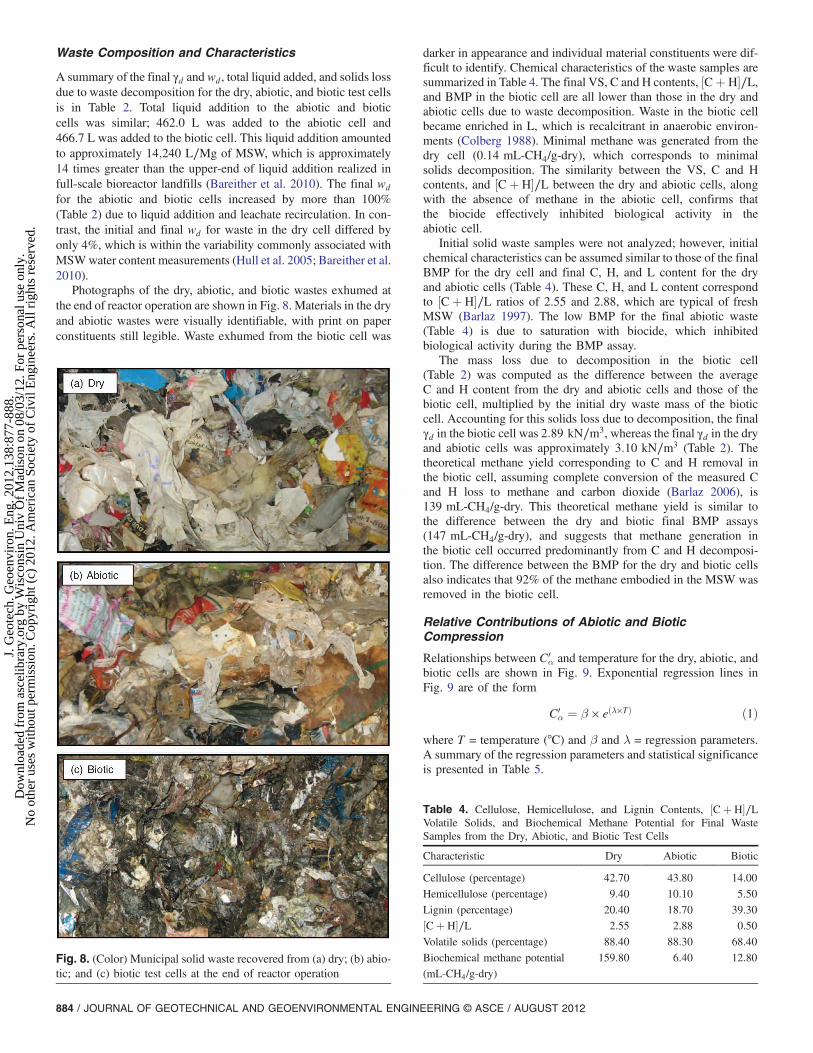
Photographs of the dry, abiotic, and biotic wastes exhumed atthe end of reactor operation are shown in Fig. 8. Materials in the dryand abiotic wastes were visually identifiable, with print on paperconstituents still legible. Waste exhumed from the biotic cell was
darker in appearance and individual material constituents were dif-ficult to identify. Chemical characteristics of the waste samples aresummarized in Table 4. The final VS, C and H contents, ½Cþ H�∕L,and BMP in the biotic cell are all lower than those in the dry andabiotic cells due to waste decomposition. Waste in the biotic cellbecame enriched in L, which is recalcitrant in anaerobic environ-ments (Colberg 1988). Minimal methane was generated from thedry cell (0:14 mL-CH4/g-dry), which corresponds to minimalsolids decomposition. The similarity between the VS, C and Hcontents, and ½Cþ H�∕L between the dry and abiotic cells, alongwith the absence of methane in the abiotic cell, confirms thatthe biocide effectively inhibited biological activity in theabiotic cell.
Initial solid waste samples were not analyzed; however, initialchemical characteristics can be assumed similar to those of the finalBMP for the dry cell and final C, H, and L content for the dryand abiotic cells (Table 4). These C, H, and L content correspondto ½Cþ H�∕L ratios of 2.55 and 2.88, which are typical of freshMSW (Barlaz 1997). The low BMP for the final abiotic waste(Table 4) is due to saturation with biocide, which inhibitedbiological activity during the BMP assay.
The mass loss due to decomposition in the biotic cell(Table 2) was computed as the difference between the averageC and H content from the dry and abiotic cells and those of thebiotic cell, multiplied by the initial dry waste mass of the bioticcell. Accounting for this solids loss due to decomposition, the finalγd in the biotic cell was 2:89 kN∕m3, whereas the final γd in the dryand abiotic cells was approximately 3:10 kN∕m3 (Table 2). Thetheoretical methane yield corresponding to C and H removal inthe biotic cell, assuming complete conversion of the measured Cand H loss to methane and carbon dioxide (Barlaz 2006), is139 mL-CH4/g-dry. This theoretical methane yield is similar tothe difference between the dry and biotic final BMP assays(147 mL-CH4/g-dry), and suggests that methane generation inthe biotic cell occurred predominantly from C and H decomposi-tion. The difference between the BMP for the dry and biotic cellsalso indicates that 92% of the methane embodied in the MSW wasremoved in the biotic cell.
Relative Contributions of Abiotic and BioticCompression
Relationships between C0α and temperature for the dry, abiotic, and
biotic cells are shown in Fig. 9. Exponential regression lines inFig. 9 are of the form
C0α ¼ β × eðλ×TÞ ð1Þ
where T = temperature (°C) and β and λ = regression parameters.A summary of the regression parameters and statistical significanceis presented in Table 5.
Table 4. Cellulose, Hemicellulose, and Lignin Contents, ½Cþ H�∕LVolatile Solids, and Biochemical Methane Potential for Final WasteSamples from the Dry, Abiotic, and Biotic Test Cells
Characteristic Dry Abiotic Biotic
Cellulose (percentage) 42.70 43.80 14.00
Hemicellulose (percentage) 9.40 10.10 5.50
Lignin (percentage) 20.40 18.70 39.30
½Cþ H�∕L 2.55 2.88 0.50
Volatile solids (percentage) 88.40 88.30 68.40
Biochemical methane potential
(mL-CH4/g-dry)
159.80 6.40 12.80Fig. 8. (Color) Municipal solid waste recovered from (a) dry; (b) abio-tic; and (c) biotic test cells at the end of reactor operation
884 / JOURNAL OF GEOTECHNICAL AND GEOENVIRONMENTAL ENGINEERING © ASCE / AUGUST 2012
J. G
eote
ch. G
eoen
viro
n. E
ng. 2
012.
138:
877-
888.
Dow
nloa
ded
from
asc
elib
rary
.org
by
Wis
cons
in U
niv
Of
Mad
ison
on
08/0
3/12
. For
per
sona
l use
onl
y.N
o ot
her
uses
with
out p
erm
issi
on. C
opyr
ight
(c)
201
2. A
mer
ican
Soc
iety
of
Civ
il E
ngin
eers
. All
righ
ts r
eser
ved.
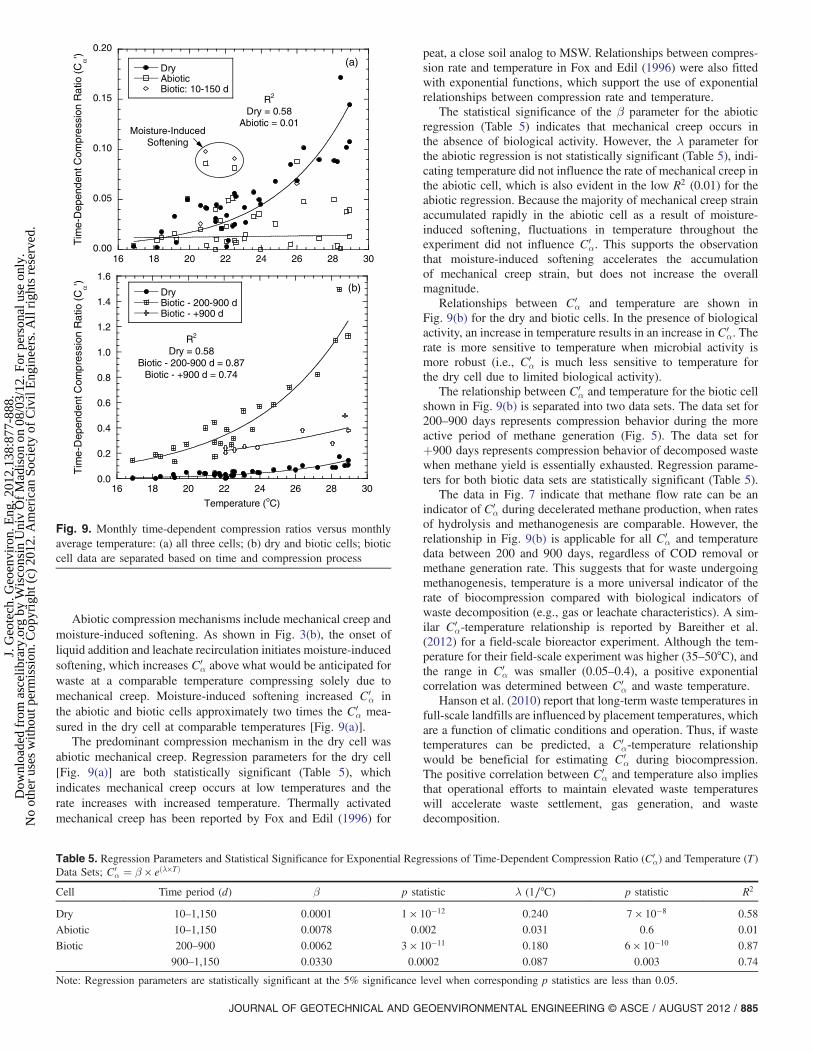
Abiotic compression mechanisms include mechanical creep andmoisture-induced softening. As shown in Fig. 3(b), the onset ofliquid addition and leachate recirculation initiates moisture-inducedsoftening, which increases C0
α above what would be anticipated forwaste at a comparable temperature compressing solely due tomechanical creep. Moisture-induced softening increased C0
α inthe abiotic and biotic cells approximately two times the C0
α mea-sured in the dry cell at comparable temperatures [Fig. 9(a)].
The predominant compression mechanism in the dry cell wasabiotic mechanical creep. Regression parameters for the dry cell[Fig. 9(a)] are both statistically significant (Table 5), whichindicates mechanical creep occurs at low temperatures and therate increases with increased temperature. Thermally activatedmechanical creep has been reported by Fox and Edil (1996) for
peat, a close soil analog to MSW. Relationships between compres-sion rate and temperature in Fox and Edil (1996) were also fittedwith exponential functions, which support the use of exponentialrelationships between compression rate and temperature.
The statistical significance of the β parameter for the abioticregression (Table 5) indicates that mechanical creep occurs inthe absence of biological activity. However, the λ parameter forthe abiotic regression is not statistically significant (Table 5), indi-cating temperature did not influence the rate of mechanical creep inthe abiotic cell, which is also evident in the low R2 (0.01) for theabiotic regression. Because the majority of mechanical creep strainaccumulated rapidly in the abiotic cell as a result of moisture-induced softening, fluctuations in temperature throughout theexperiment did not influence C0
α. This supports the observationthat moisture-induced softening accelerates the accumulationof mechanical creep strain, but does not increase the overallmagnitude.
Relationships between C0α and temperature are shown in
Fig. 9(b) for the dry and biotic cells. In the presence of biologicalactivity, an increase in temperature results in an increase in C0
α. Therate is more sensitive to temperature when microbial activity ismore robust (i.e., C0
α is much less sensitive to temperature forthe dry cell due to limited biological activity).
The relationship between C0α and temperature for the biotic cell
shown in Fig. 9(b) is separated into two data sets. The data set for200–900 days represents compression behavior during the moreactive period of methane generation (Fig. 5). The data set forþ900 days represents compression behavior of decomposed wastewhen methane yield is essentially exhausted. Regression parame-ters for both biotic data sets are statistically significant (Table 5).
The data in Fig. 7 indicate that methane flow rate can be anindicator of C0
α during decelerated methane production, when ratesof hydrolysis and methanogenesis are comparable. However, therelationship in Fig. 9(b) is applicable for all C0
α and temperaturedata between 200 and 900 days, regardless of COD removal ormethane generation rate. This suggests that for waste undergoingmethanogenesis, temperature is a more universal indicator of therate of biocompression compared with biological indicators ofwaste decomposition (e.g., gas or leachate characteristics). A sim-ilar C0
α-temperature relationship is reported by Bareither et al.(2012) for a field-scale bioreactor experiment. Although the tem-perature for their field-scale experiment was higher (35–50°C), andthe range in C0
α was smaller (0.05–0.4), a positive exponentialcorrelation was determined between C0
α and waste temperature.Hanson et al. (2010) report that long-term waste temperatures in
full-scale landfills are influenced by placement temperatures, whichare a function of climatic conditions and operation. Thus, if wastetemperatures can be predicted, a C0
α-temperature relationshipwould be beneficial for estimating C0
α during biocompression.The positive correlation between C0
α and temperature also impliesthat operational efforts to maintain elevated waste temperatureswill accelerate waste settlement, gas generation, and wastedecomposition.
0.00
0.05
0.10
0.15
0.20
16 18 20 22 24 26 28 30
DryAbioticBiotic: 10-150 d
Tim
e-D
epen
dent
Com
pres
sion
Rat
io (
Cα')
Moisture-InducedSoftening
R2
Dry = 0.58Abiotic = 0.01
(a)
0.0
0.2
0.4
0.6
0.8
1.0
1.2
1.4
1.6
16 18 20 22 24 26 28 30
DryBiotic - 200-900 dBiotic - +900 d
Tim
e-D
epen
dent
Com
pres
sion
Rat
io (
Cα') (b)
R2
Dry = 0.58Biotic - 200-900 d = 0.87
Biotic - +900 d = 0.74
Temperature (oC)
Fig. 9. Monthly time-dependent compression ratios versus monthlyaverage temperature: (a) all three cells; (b) dry and biotic cells; bioticcell data are separated based on time and compression process
Table 5. Regression Parameters and Statistical Significance for Exponential Regressions of Time-Dependent Compression Ratio (C0α) and Temperature (T)
Data Sets; C0α ¼ β × eðλ×TÞ
Cell Time period (d) β p statistic λ (1∕°C) p statistic R2
Dry 10–1,150 0.0001 1 × 10�12 0.240 7 × 10�8 0.58
Abiotic 10–1,150 0.0078 0.002 0.031 0.6 0.01
Biotic 200–900 0.0062 3 × 10�11 0.180 6 × 10�10 0.87
900–1,150 0.0330 0.0002 0.087 0.003 0.74
Note: Regression parameters are statistically significant at the 5% significance level when corresponding p statistics are less than 0.05.
JOURNAL OF GEOTECHNICAL AND GEOENVIRONMENTAL ENGINEERING © ASCE / AUGUST 2012 / 885
J. G
eote
ch. G
eoen
viro
n. E
ng. 2
012.
138:
877-
888.
Dow
nloa
ded
from
asc
elib
rary
.org
by
Wis
cons
in U
niv
Of
Mad
ison
on
08/0
3/12
. For
per
sona
l use
onl
y.N
o ot
her
uses
with
out p
erm
issi
on. C
opyr
ight
(c)
201
2. A
mer
ican
Soc
iety
of
Civ
il E
ngin
eers
. All
righ
ts r
eser
ved.
Engineering Implications
Predictions of time-dependent compression strain (εtd) can beobtained with the following equation (Bjarngard and Edgers1990; El-Fadel and Khoury 2000; Hossain and Gabr 2005):
εtdðtÞ ¼ C0αM log
ttM
þ C0αB log
ttB
þ C0αMF log
ttF
ð2Þ
where tM = transition time from immediate compression tomechanical creep, tB = transition time from mechanical creep tobiocompression, tF = time for completion of biocompression,C0αM and C0
αB are defined previously, and C0αMF = compression
parameter for final mechanical creep following completion of bio-compression. Time in the temporal terms on the right-hand side ofEq. (2) is limited to the period in which each process is active(e.g., tB ≤ t ≤ tF for biocompression).
The applicability of simulating settlement data for the dry andbiotic cells using Eq. (2), with C0
α estimated from temperatureregressions, was assessed for two scenarios: (1) single C0
α, wherea single C0
αM and C0αB were computed from average temperatures
and (2) monthly C0α, where monthly C0
α was computed based onmonthly average temperatures. The C0
α-temperature regressionfor the dry data were assumed representative of C0
αM , and used
for all dry cell data and biotic data between 10 and 200 days.The C0
α-temperature regressions for the biotic data were assumedrepresentative of C0
αB. A single C0αB was obtained for the first
scenario by temporally weighting C0α, computed from average
temperatures between 200 and 900 and 900 and 1,150 days andthe corresponding regression equations (Table 5).
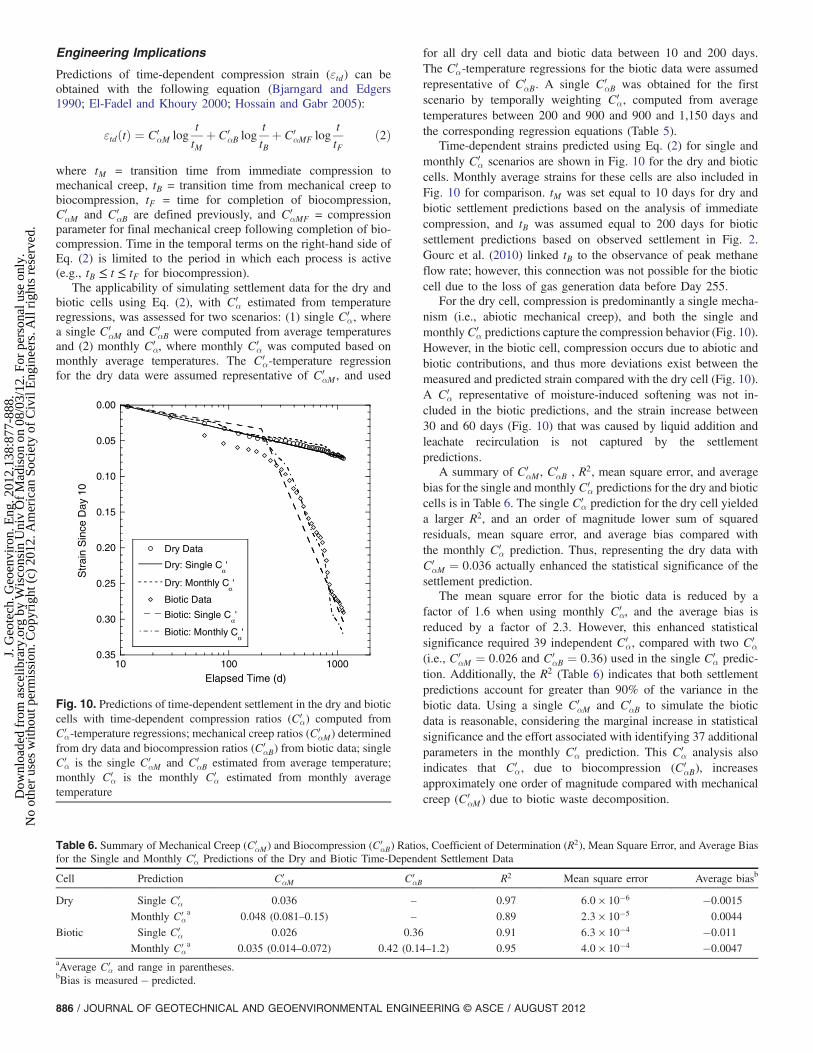
Time-dependent strains predicted using Eq. (2) for single andmonthly C0
α scenarios are shown in Fig. 10 for the dry and bioticcells. Monthly average strains for these cells are also included inFig. 10 for comparison. tM was set equal to 10 days for dry andbiotic settlement predictions based on the analysis of immediatecompression, and tB was assumed equal to 200 days for bioticsettlement predictions based on observed settlement in Fig. 2.Gourc et al. (2010) linked tB to the observance of peak methaneflow rate; however, this connection was not possible for the bioticcell due to the loss of gas generation data before Day 255.
For the dry cell, compression is predominantly a single mecha-nism (i.e., abiotic mechanical creep), and both the single andmonthlyC0
α predictions capture the compression behavior (Fig. 10).However, in the biotic cell, compression occurs due to abiotic andbiotic contributions, and thus more deviations exist between themeasured and predicted strain compared with the dry cell (Fig. 10).A C0
α representative of moisture-induced softening was not in-cluded in the biotic predictions, and the strain increase between30 and 60 days (Fig. 10) that was caused by liquid addition andleachate recirculation is not captured by the settlementpredictions.
A summary of C0αM , C
0αB , R2, mean square error, and average
bias for the single and monthly C0α predictions for the dry and biotic
cells is in Table 6. The single C0α prediction for the dry cell yielded
a larger R2, and an order of magnitude lower sum of squaredresiduals, mean square error, and average bias compared withthe monthly C0
α prediction. Thus, representing the dry data withC0αM ¼ 0:036 actually enhanced the statistical significance of the
settlement prediction.The mean square error for the biotic data is reduced by a
factor of 1.6 when using monthly C0α, and the average bias is
reduced by a factor of 2.3. However, this enhanced statisticalsignificance required 39 independent C0
α, compared with two C0α
(i.e., C0αM ¼ 0:026 and C0
αB ¼ 0:36) used in the single C0α predic-
tion. Additionally, the R2 (Table 6) indicates that both settlementpredictions account for greater than 90% of the variance in thebiotic data. Using a single C0
αM and C0αB to simulate the biotic
data is reasonable, considering the marginal increase in statisticalsignificance and the effort associated with identifying 37 additionalparameters in the monthly C0
α prediction. This C0α analysis also
indicates that C0α, due to biocompression (C0
αB), increasesapproximately one order of magnitude compared with mechanicalcreep (C0
αM) due to biotic waste decomposition.
0.00
0.05
0.10
0.15
0.20
0.25
0.30
0.3510 100 1000
Dry Data
Dry: Single Cα'
Dry: Monthly Cα'
Biotic Data
Biotic: Single Cα'
Biotic: Monthly Cα'
Str
ain
Sin
ce D
ay 1
0
Elapsed Time (d)
Fig. 10. Predictions of time-dependent settlement in the dry and bioticcells with time-dependent compression ratios (C0
α) computed fromC0α-temperature regressions; mechanical creep ratios (C0
αM) determinedfrom dry data and biocompression ratios (C0
αB) from biotic data; singleC0α is the single C0
αM and C0αB estimated from average temperature;
monthly C0α is the monthly C0
α estimated from monthly averagetemperature
Table 6. Summary of Mechanical Creep (C0αM) and Biocompression (C0
αB) Ratios, Coefficient of Determination (R2), Mean Square Error, and Average Biasfor the Single and Monthly C0
α Predictions of the Dry and Biotic Time-Dependent Settlement Data
Cell Prediction C0αM C0
αB R2 Mean square error Average biasb
Dry Single C0α 0.036 – 0.97 6:0 × 10�6 �0:0015
Monthly C0αa 0.048 (0.081–0.15) – 0.89 2:3 × 10�5 0.0044
Biotic Single C0α 0.026 0.36 0.91 6:3 × 10�4 �0:011
Monthly C0αa 0.035 (0.014–0.072) 0.42 (0.14–1.2) 0.95 4:0 × 10�4 �0:0047
aAverage C0α and range in parentheses.
bBias is measured� predicted.
886 / JOURNAL OF GEOTECHNICAL AND GEOENVIRONMENTAL ENGINEERING © ASCE / AUGUST 2012
J. G
eote
ch. G
eoen
viro
n. E
ng. 2
012.
138:
877-
888.
Dow
nloa
ded
from
asc
elib
rary
.org
by
Wis
cons
in U
niv
Of
Mad
ison
on
08/0
3/12
. For
per
sona
l use
onl
y.N
o ot
her
uses
with
out p
erm
issi
on. C
opyr
ight
(c)
201
2. A
mer
ican
Soc
iety
of
Civ
il E
ngin
eers
. All
righ
ts r
eser
ved.
Summary and Conclusions
Abiotic and biotic compression of MSW was assessed in threelarge-scale laboratory experiments. These experiments wereoperated under the following conditions: (1) no liquid addition(dry), (2) liquid addition spiked with biocide (abiotic), and(3) leachate recirculation (biotic). Experiments were conductedfor 1,150 days; settlement, gas composition and production, andleachate chemistry were monitored. The following conclusionsare drawn from this study:• The biocide used in the abiotic cell effectively inhibited biolo-
gical activity.• Decomposition of C and H was the predominant pathway for
methane generation in the biotic cell; approximately 95% ofthe difference between BMPs for waste recovered from thedry and biotic cells was accounted for in C and H loss.
• Time-dependent compression strain at the end of the test periodin the biotic cell was> 3:5 times the strain in the dry and abioticcells due to biotic waste decomposition.
• Moisture-induced softening in the abiotic and biotic cellsdoubled the time-dependent compression ratio (C0
α ), represen-tative of mechanical creep in the dry cell. This softening processis finite (lasting only 3 months), accelerates the accumulation ofmechanical creep, but does not increase the total strain due tomechanical creep.
• Methane flow rate was unrelated to temperature when substratesfor methanogenesis were abundant in the leachate, i.e., duringhigh rates of COD removal. However, the methane flow rate wasdependent on temperature when COD removal was low andmethanogenesis was dependent on the rate of solids hydrolysis.
• During low COD removal, C0α was related to the methane flow
rate, indicating that elevated waste temperatures during anaero-bic MSW decomposition enhanced solids decomposition,methane generation, and waste settlement, and yield a larger C0
α.• C0
α, due to mechanical creep in the absence of liquidaddition, and C0
α, due to biocompression, increased exponen-tially with temperature. Temperature was found to be amore universal indicator of C0
α during biocompression com-pared with biological indicators of waste decomposition(e.g., gas or leachate characteristics).
• C0α, due to biocompression, is approximately an order of mag-
nitude larger than C0α due to mechanical creep.
Acknowledgments
Financial support was provided by the University of Wisconsin-North Carolina State University bioreactor partnership (www.bioreactorpartnership.org), which was sponsored by the U.S.National Science Foundation (Grant No. EEC-0538500) and aconsortium of industry partners (CH2MHill, Geosyntec Consul-tants, Republic Services, Veolia Environmental Services, WasteConnections Inc., and Waste Management) through the NationalScience Foundation’s Partnerships for Innovation Program. Addi-tional thanks are extended to Ronald Breitmeyer (Exponent Inc.,USA) and Suna Erses (Sakarya University, Turkey) for assistancewith laboratory testing.
References
Bareither, C. A., Benson, C. H., Barlaz, M. A., Edil, T. B., andTolaymat, T. M. (2010). “Performance of North American bioreactorlandfills: I. leachate hydrology and waste settlement.” J. Environ.Eng., 136(8), 824–838.
Bareither, C. A., Breitmeyer, R. J., Benson, C. H., Barlaz, M. A., and Edil,T. B. (2012). “Deer Track Bioreactor Experiment: A field-scale evalu-ation of municipal solid waste bioreactor performance.” J. Geotech.Geoenviron. Eng., 138(6), 658–670.
Barlaz, M. A. (1997). “Microbial studies of landfills and anaerobic refusedecomposition.” Manual for environmental microbiology, AmericanSociety of Microbiology, Washington, D.C., 541–557.
Barlaz, M. A. (2006). “Forest products decomposition in municipal solidwaste landfills.” Waste Manage., 26(4), 321–333.
Barlaz, M. A., Ham, R. K., and Schaefer, D. M. (1990). “Methane produc-tion from municipal refuse: A review of enhancement techniquesand microbial dynamics.” Manual for environmental microbiology,American Society of Microbiology, Washington, D.C., 541–557.
Barlaz, M. A., Schaefer, D. M., and Ham, R. K. (1989). “Bacterial pop-ulation development and chemical characteristics of refuse decomposi-tion in a simulated sanitary landfill.” Appl. Environ. Microbiol., 55(1),55–65.
Bilgili, M. S., Demir, A., and Özkaya, B. (2007). “Influence of leachaterecirculation on aerobic and anaerobic decomposition of solid wastes.”J. Hazard. Mater., 143(1–2), 177–183.
Bjarngard, A., and Edgers, L. (1990). “Settlement of municipal solid wastelandfills.” Proc., 13th Annual Madison Waste Conf., Dept. of Engineer-ing, Professional Development, Univ. of Wisconsin, Madison, Madison,WI, 192–205.
Cecchi, F., Mata-Alvarez, J., Pavan, P., Vallini, G., and De Poli, F. (1992).“Seasonal effects on anaerobic digestion of the source sorted organicfraction of municipal solid waste.” Waste Manage. Res., 10(5),435–443.
Chugh, S., Clarke, W., Pullammanappallil, P., and Rudolph, V. (1998).“Effect of recirculated leachate volume on MSW degradation.” WasteManage. Res., 16(6), 564–573.
Clescerl, L. S., Greenberg, A. E. and Eaton, A. D., eds. (1999). Standardmethods for the examination of water and wastewater, 20th Ed.,American Public Health Association, Washington, DC.
Colberg, P. J. (1988). “Anaerobic microbial degradation of cellulose, lignin,oligolignols, and monoaromatic lignin derivatives.” Biology of anaero-bic microorganisms, A. J. B. Zehnder, ed., Wiley-Liss, New York,333–372.
Davis, M. W. (1998). “A rapid modified method for compositional carbo-hydrate analysis of lignocellulosics by high pH anion-exchangechromatography with pulsed amperometric detection (HPAEC/PAD).”J. Wood Chem. Technol., 18(2), 235–252.
Edil, T., Ranguette, V., and Wuellner, W. (1990). “Settlement of municipalrefuse.” Geotechnics of Waste Fills-Theory and Practice, STP 1070,A. O. Landva and G. D. Knowles, eds., ASTM, West Conshohocken,PA, 225–239.
El-Fadel, M., and Khoury, R. (2000). “Modeling settlement in MSWlandfills: A critical review.” Crit. Rev. Environ. Sci. Technol., 30(3),327–361.
Farquhar, G. J., and Rovers, F. A. (1973). “Gas production during refusedecomposition.” Water Air Soil Pollut., 2(4), 483–495.
Fox, P. J., and Edil, T. B. (1996). “Effects of stress and tempera-ture on secondary compression of peat.” Can. Geotech. J., 33(3),405–415.
Gourc, J. P., Staub, M. J., and Conte, M. (2010). “DecouplingMSW settlement into mechanical and biochemical processes–modelingand validation on large-scale setups.” Waste Manage., 30(8–9),1556–1568.
Ham, R. K., and Bookter, T. J. (1982). “Decomposition of solid waste intest lysimeters.” J. Environ. Eng. Div., 108(6), 1147–1170.
Hanson, J. L., Yesiller, N., and Oettle, N. K. (2010). “Spatial and temporaltemperature distributions in municipal solid waste landfills.” J. Environ.Eng., 136(8), 804–814.
Hao, Y. J., Wu, W. X., Wu, S. W., Sun, H., and Chen, Y. X. (2008).“Municipal solid waste decomposition under oversaturated conditionin comparison with leachate recirculation.” Process Biochem., 43(1),108–112.
Hartz, K. E., Klink, R. E., and Ham, R. K. (1982). “Temperature effects:Methane generation from landfill samples.” J. Environ. Eng. Div.,108(4), 629–638.
JOURNAL OF GEOTECHNICAL AND GEOENVIRONMENTAL ENGINEERING © ASCE / AUGUST 2012 / 887
J. G
eote
ch. G
eoen
viro
n. E
ng. 2
012.
138:
877-
888.
Dow
nloa
ded
from
asc
elib
rary
.org
by
Wis
cons
in U
niv
Of
Mad
ison
on
08/0
3/12
. For
per
sona
l use
onl
y.N
o ot
her
uses
with
out p
erm
issi
on. C
opyr
ight
(c)
201
2. A
mer
ican
Soc
iety
of
Civ
il E
ngin
eers
. All
righ
ts r
eser
ved.
Hossain, M. S., and Gabr, M. A. (2005). “Prediction of municipalsolid waste landfill settlement with leachate recirculation.” Proc.Geo-Frontiers, GSP No. 142, Waste Containment and Remediation,ASCE, Austin, TX, 1–14.
Hossain, M. S., Gabr, M. A., and Barlaz, M. A. (2003). “Relationship ofcompressibility parameters to municipal solid waste decomposition.”J. Geotech. Geoenviron. Eng., 129(12), 1151–1158.
Hull, R. M., Krogmann, U., and Strom, P. F. (2005). “Composition andcharacteristics of excavation materials from a New Jersey landfill.”J. Environ. Eng., 131(3), 478–490.
Ivanova, L. K., Richards, D. J., and Smallman, D. J. (2008). “The long-term settlement of landfill waste.” Water Resour. Manage., 161(3),121–133.
Kang, S. T., Hang, S. S., Lee, C. Y., and Lee, N. H. (1997). “Relationshipbetween biological decomposition and landfill settlement at variousleachate recirculation rates.” Proc., 7th KAIST-NTU-KU Tri-LateralSeminar/Workshop on Environ. Eng., Kyoto, Japan, 29–31.
Kettunen, R. H., and Rintala, J. A. (1997). “The effect of low temperature(5–29°C) and adaptation on the methanogenic activity of biomass.”Appl. Microbiol. Biotechnol., 48(4), 570–576.
Kim, J., and Pohland, F. G. (2003). “Process enhancement in anaerobicbioreactor landfills.” Water Sci. Technol., 48(4), 29–36.
Levén, L., Eriksson, A. R. B., and Schnürer, A. (2007). “Effect of processtemperature on bacterial and archaeal communities in two methano-genic bioreactors treating organic household waste.” FEMS Microbiol.Ecol., 59(3), 683–693.
Marques, A. C. M., Filz, G. M., and Vilar, O. M. (2003). “Composite com-pressibility model for municipal solid waste.” J. Geotech. Geoenviron.Eng., 129(4), 372–378.
Noike, T., Endo, G., Chang, J., Yaguchi, J., and Matsumoto, J. (1985).“Characteristics of carbohydrate degradation and the rate-limiting stepin anaerobic digestion.” Biotechnol. Bioeng., 27(10), 1482–1489.
Olivier, F., and Gourc, J. P. (2007). “Hydro-mechanical behavior of munici-pal solid waste subject to leachate recirculation in a large-scalecompression reactor cell.” Waste Manage., 27(1), 44–58.
Park, H. I., and Lee, S. R. (1997). “Long-term settlement behavior oflandfills with refuse decomposition.” J. Solid Waste Technol.
Manage., 24(4), 159–165.Pavlostathis, S. G., and Giraldo-Gomez, E. (1991). “Kinetics of anaerobic
treatment.” Water Sci. Technol., 24(8), 35–59.Pettersen, R. C., and Schwandt, V. (1991). “Wood sugar analysis by anion
chromatography.” J. Wood Chem. Technol., 11(4), 495–501.Pohland, F. G. (1980). “Leachate recycle as landfill management option.”
J. Environ. Eng. Div., 106(6), 1057–1069.Pohland, F. G., and Kim, J. C. (1999). “In situ anaerobic treatment
of leachate in landfill bioreactors.” Water Sci. Technol., 40(8),203–210.
Rao, M. S., and Singh, S. P. (2004). “Bioenergy conversion studies oforganic fraction of MSW: Kinetic studies and gas yield-organic loadingrelationships for process optimization.” Bioresour. Technol., 95(2),173–185.
Sharma, H. D., and De, A. (2007). “Municipal solid waste landfill settle-ment: Postclosure perspectives.” J. Geotech. Geoenviron. Eng., 133(6),619–629.
Sivakumar Babu, G. L. S., Reddy, K. R., Chouskey, S. K., and Kulkarni,H. S. (2010). “Prediction of long-term municipal solid waste landfillsettlement using constitutive model.” Pract. Period. Hazard. ToxicRadioact. Waste Manage., 14(2), 139–150.
Sowers, G. (1973). “Settlement of waste disposal fills.” Proc., 8th Int.Conf. on Soil Mech. and Foundation Eng., Balkema, Rotterdam, 22,207–210.
Vavilin, V. A., Rytov, S. V., and Lokshina, L. Ya. (1996). “A description ofhydrolysis kinetics in anaerobic degradation of particulate organic mat-ter.” Bioresour. Technol., 56(2–3), 229–237.
Wall, D., and Zeiss, C. (1995). “Municipal landfill biodegradation and set-tlement.” J. Environ. Eng., 121(3), 214–224.
Wang, Y. S., Byrd, C. S., and Barlaz, M. A. (1994). “Anaerobic biodegrad-ability of cellulose and hemicellulose in excavated refuse samples.”J. Ind. Microbiol., 13(3), 147–153.
Westlake, K., Archer, D. B., and Boone, D. R. (1995). “Diversity of cel-lulolytic bacteria in landfill.” J. Appl. Bacteriol., 79(1), 73–78.
Zehnder, A. J. B. (1978). “Ecology of methane formation.”Water pollutionmicrobiology, R. Mitchell, ed., Vol. 2, Wiley, New York, 349–376.
888 / JOURNAL OF GEOTECHNICAL AND GEOENVIRONMENTAL ENGINEERING © ASCE / AUGUST 2012
J. G
eote
ch. G
eoen
viro
n. E
ng. 2
012.
138:
877-
888.
Dow
nloa
ded
from
asc
elib
rary
.org
by
Wis
cons
in U
niv
Of
Mad
ison
on
08/0
3/12
. For
per
sona
l use
onl
y.N
o ot
her
uses
with
out p
erm
issi
on. C
opyr
ight
(c)
201
2. A
mer
ican
Soc
iety
of
Civ
il E
ngin
eers
. All
righ
ts r
eser
ved.