abigail stefaniw room acoustics for classrooms: measurement techniques university of georgia...
TRANSCRIPT
Abigail Stefaniw
Room Acoustics for Classrooms: measurement techniques
University of Georgia Classroom Acoustics Seminar
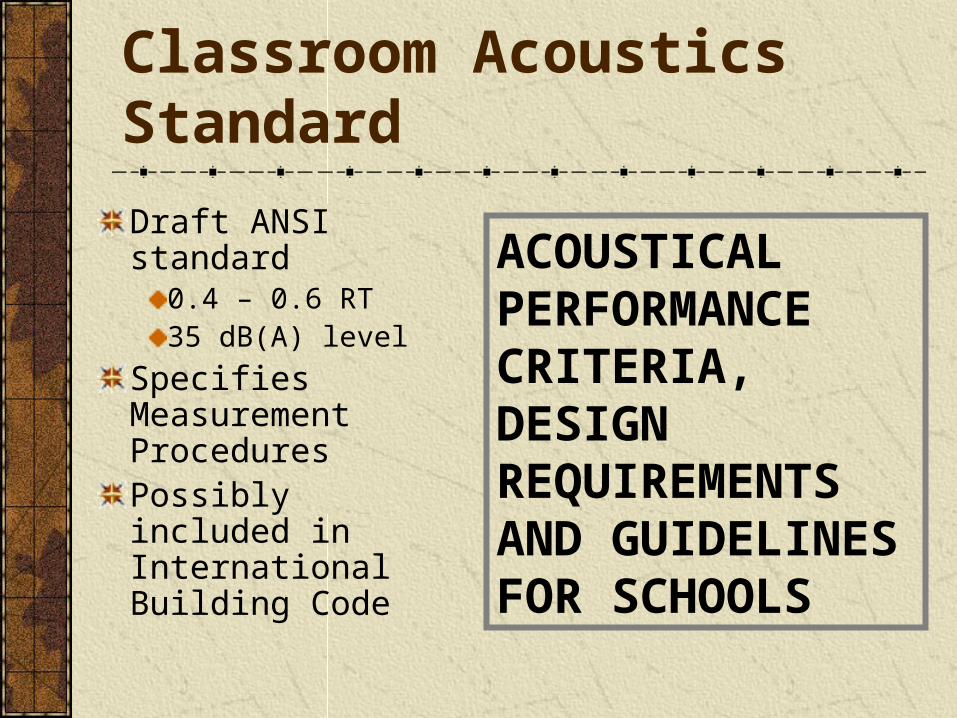
Classroom Acoustics Standard
Draft ANSI standard0.4 – 0.6 RT35 dB(A) level
Specifies Measurement ProceduresPossibly included in International Building Code
ACOUSTICAL PERFORMANCE CRITERIA, DESIGN REQUIREMENTS AND GUIDELINES FOR SCHOOLS
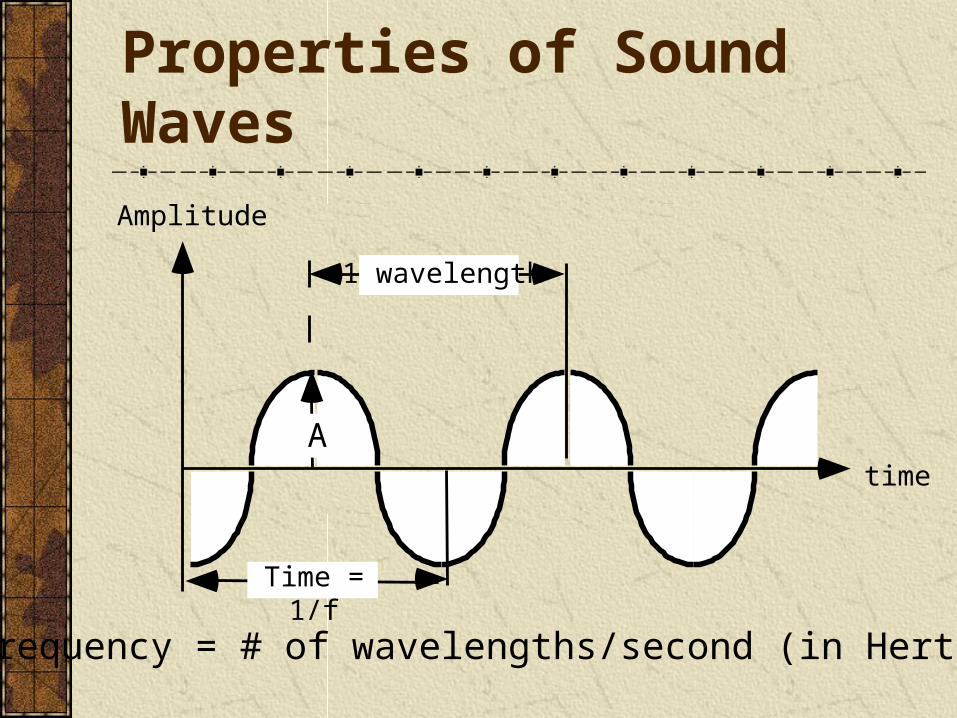
Properties of Sound Waves
Amplitude
time
1 wavelength
Time = 1/f
A
Frequency = # of wavelengths/second (in Hertz)
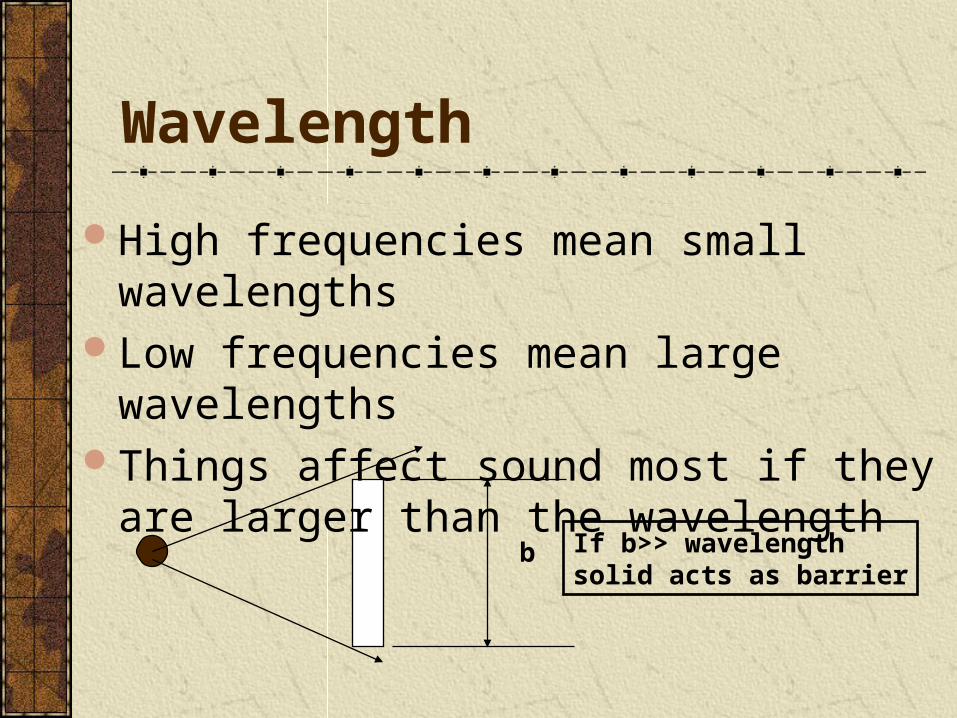
Wavelength
b If b>> wavelengthsolid acts as barrier
High frequencies mean small wavelengthsLow frequencies mean large wavelengthsThings affect sound most if they are larger
than the wavelength
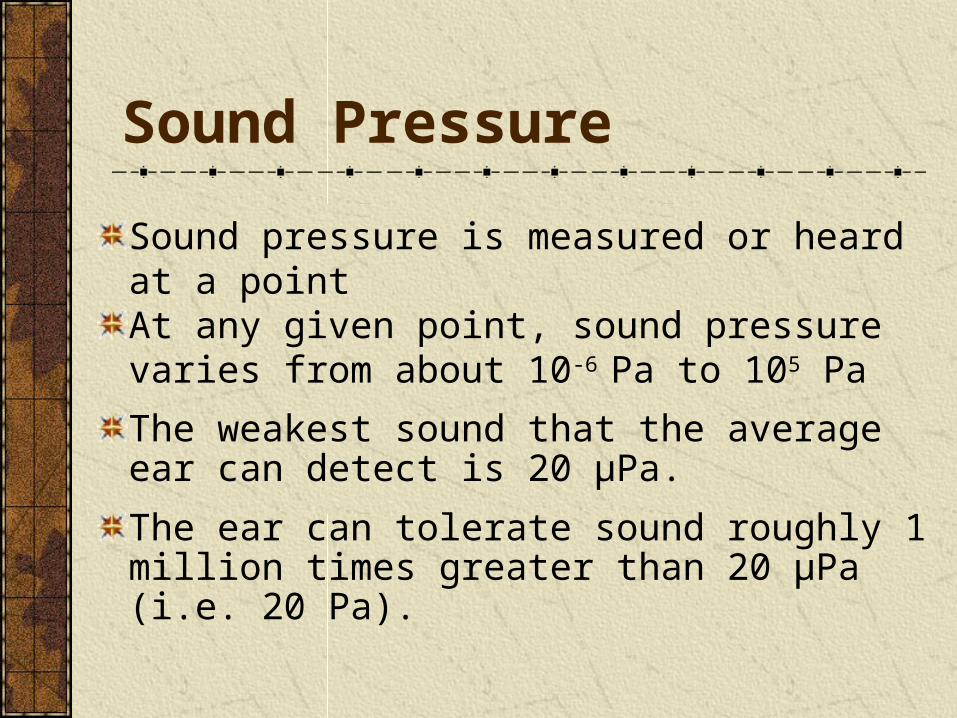
Sound Pressure
Sound pressure is measured or heard at a pointAt any given point, sound pressure varies from about 10-6 Pa to 105 Pa
The weakest sound that the average ear can detect is 20 µPa.
The ear can tolerate sound roughly 1 million times greater than 20 µPa (i.e. 20 Pa).
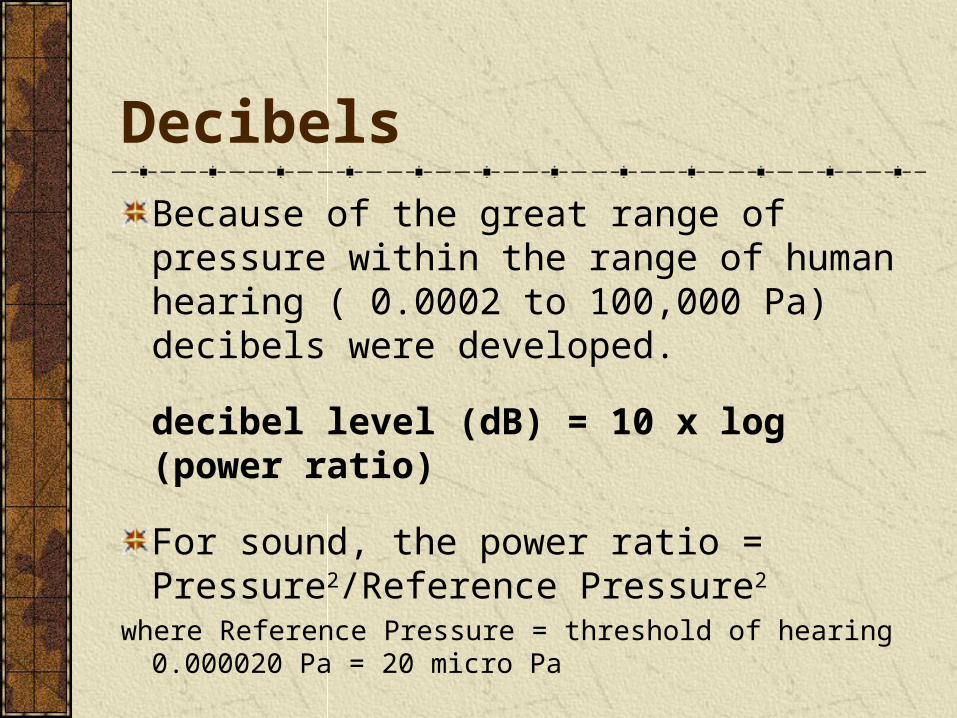
Decibels
Because of the great range of pressure within the range of human hearing ( 0.0002 to 100,000 Pa) decibels were developed.
decibel level (dB) = 10 x log (power ratio)
For sound, the power ratio = Pressure2/Reference Pressure2
where Reference Pressure = threshold of hearing 0.000020 Pa = 20 micro Pa
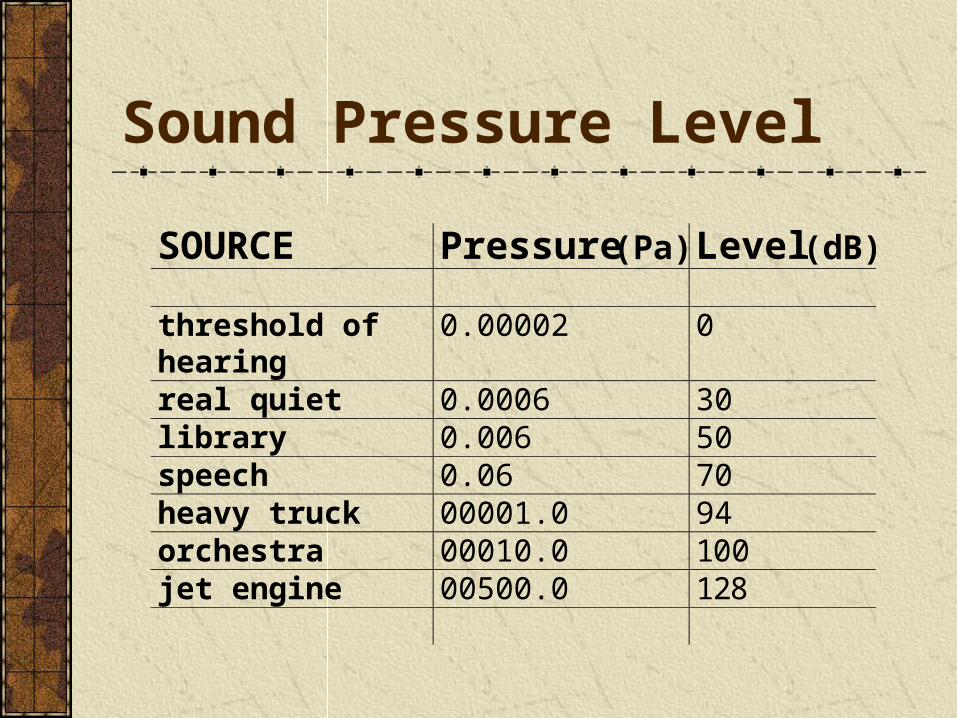
Sound Pressure Level
SOURCE Pressure (Pa) Level (dB) threshold of hearing
0.00002 0
real quiet 0.0006 30 library 0.006 50 speech 0.06 70 heavy truck 00001.0 94 orchestra 00010.0 100 jet engine 00500.0 128
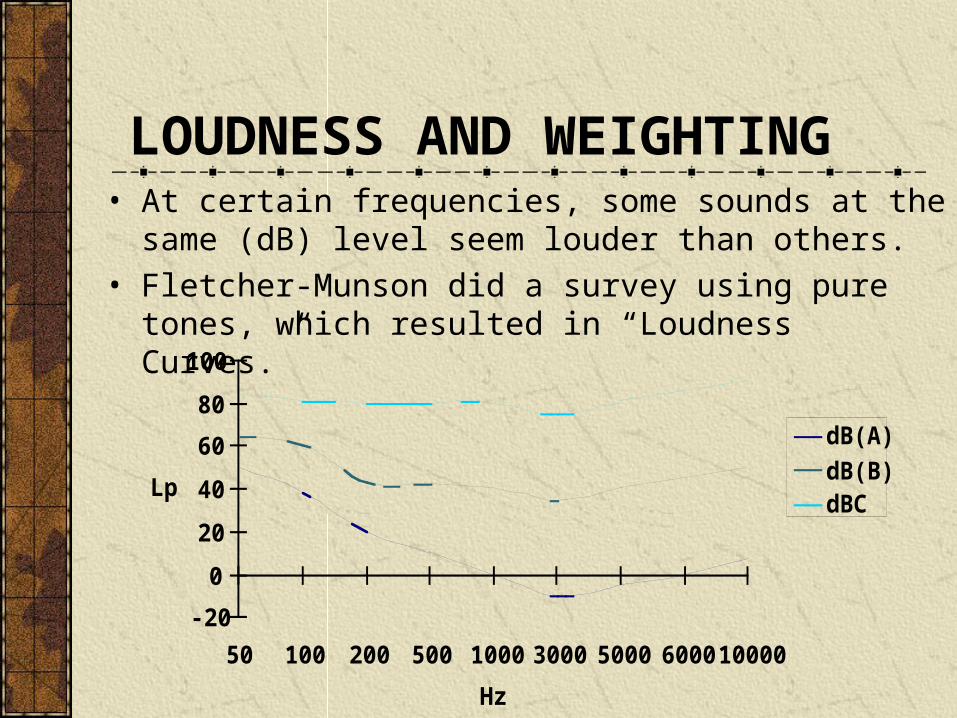
LOUDNESS AND WEIGHTING• At certain frequencies, some sounds at the same (dB) level
seem louder than others.
• Fletcher-Munson did a survey using pure tones, which resulted in “Loudness Curves.”
-20
0
20
40
60
80
100
50 100 200 500 1000 3000 5000 6000 10000
Hz
Lp
dB(A)
dB(B)dBC
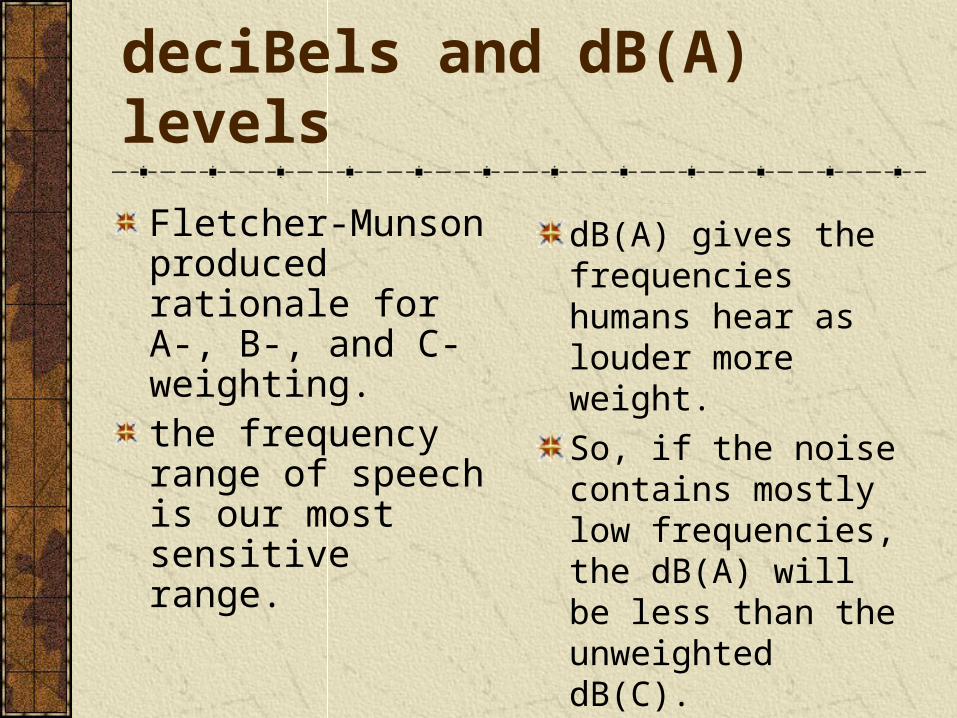
deciBels and dB(A) levels
dB(A) gives the frequencies humans hear as louder more weight.
So, if the noise contains mostly low frequencies, the dB(A) will be less than the unweighted dB(C).
Fletcher-Munson produced rationale for A-, B-, and C-weighting.the frequency range of speech is our most sensitive range.
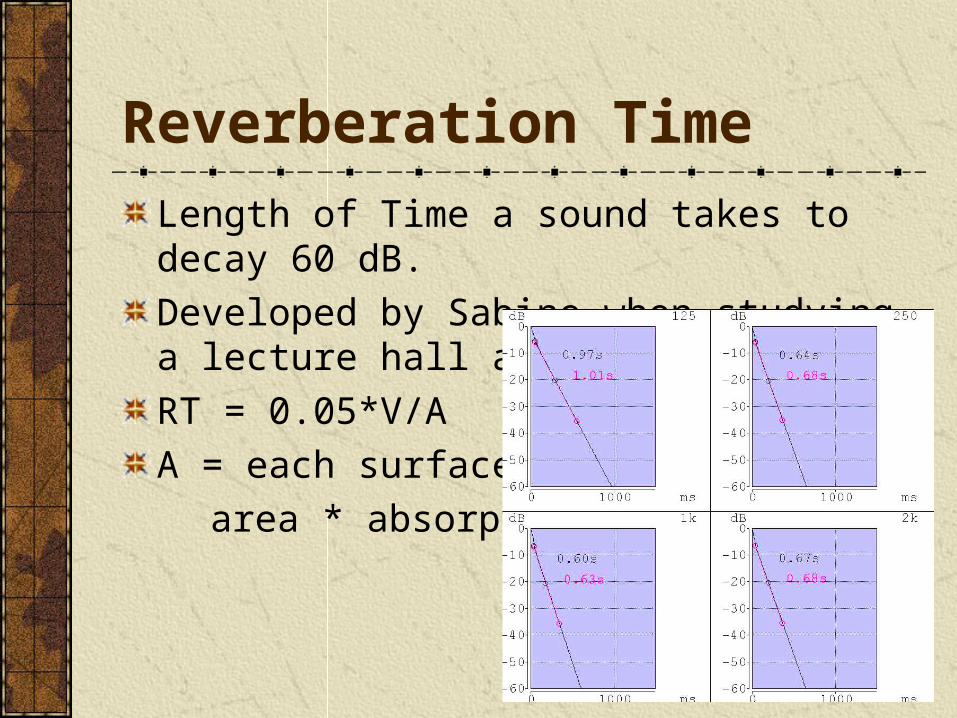
Reverberation Time
Length of Time a sound takes to decay 60 dB.
Developed by Sabine when studying a lecture hall at Harvard.
RT = 0.05*V/A
A = each surface’s
area * absorption
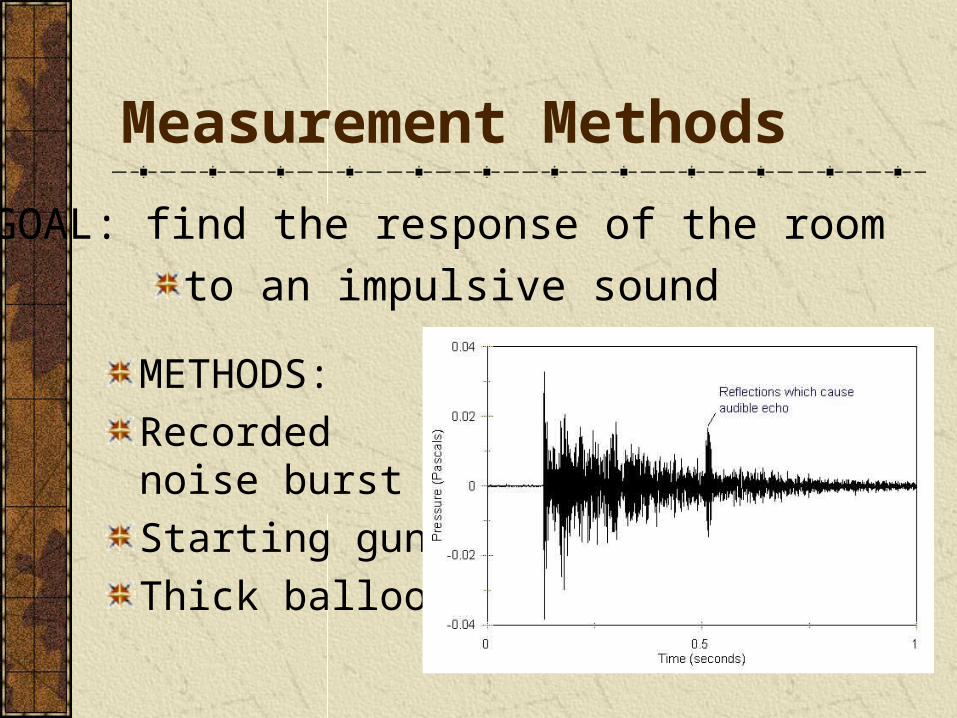
Measurement Methods
METHODS:
Recorded noise burst
Starting gun
Thick balloon
GOAL: find the response of the room
to an impulsive sound
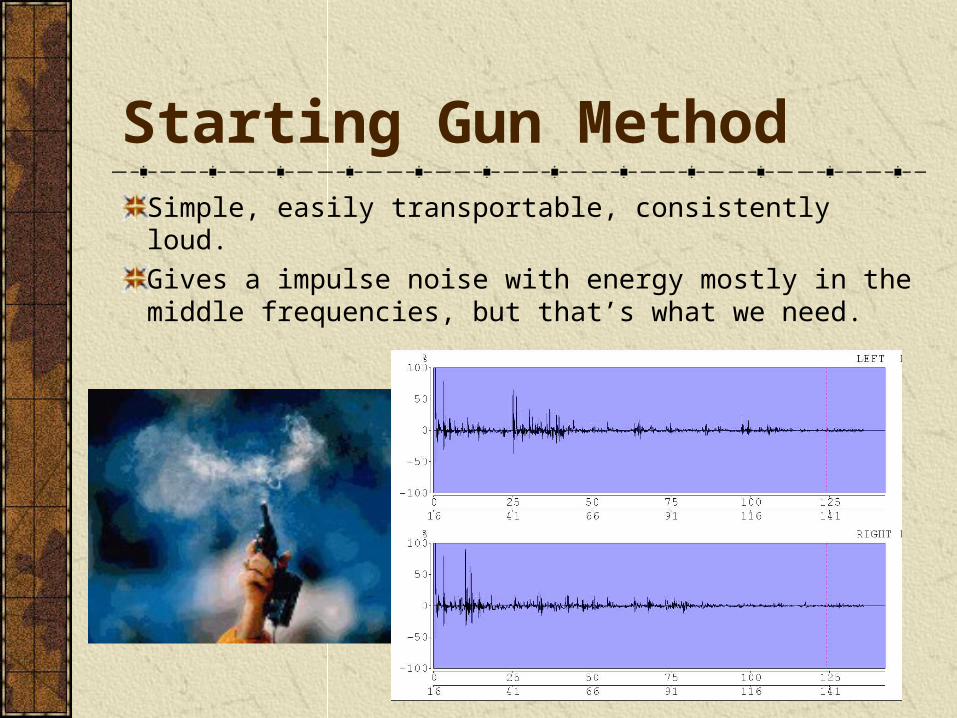
Starting Gun Method
Simple, easily transportable, consistently loud.
Gives a impulse noise with energy mostly in the middle frequencies, but that’s what we need.
Extech Sound Level Meters
Accurate, detachable microphone
Built-in storage and computer interface.
So, how noisy is THIS room?
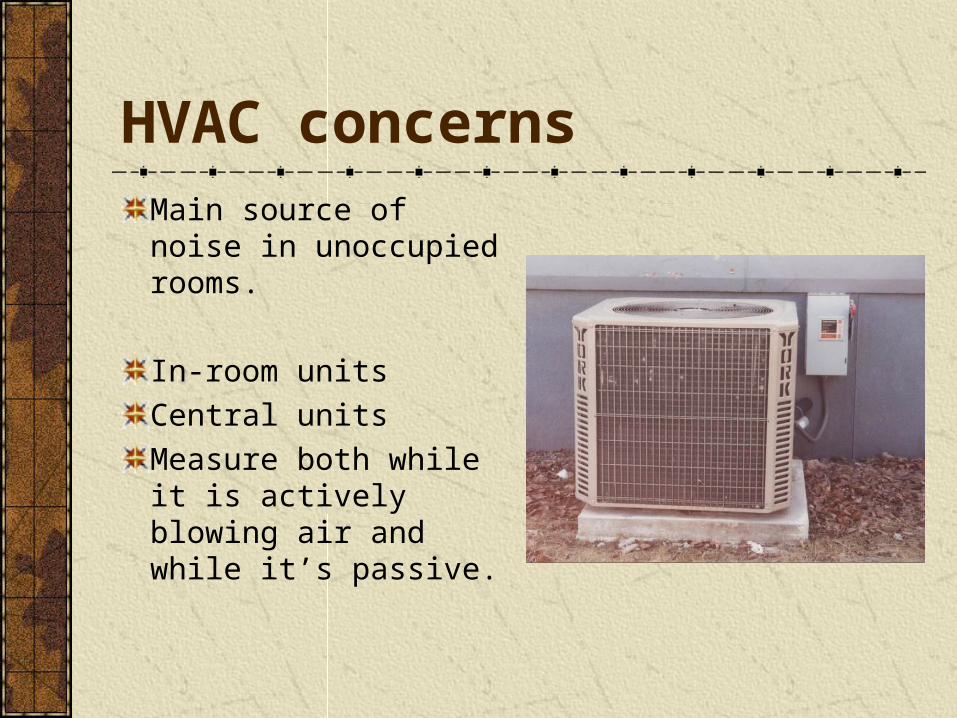
HVAC concerns
Main source of noise in unoccupied rooms.
In-room units
Central units
Measure both while it is actively blowing air and while it’s passive.
Speech Intelligibility Tests
Modified Rhyme Test (MRT)Standardized
Hearing Comfort SurveyAnswer three questions after each MRT test
Classroom Acoustics Goals
High Speech IntelligibilityRequires proper Reverberation Time,
• Low volume, high sound absorption
Requires low background noise level.
High Hearing ComfortRequires proper overall geometry
Indicated by detailed acoustical metrics
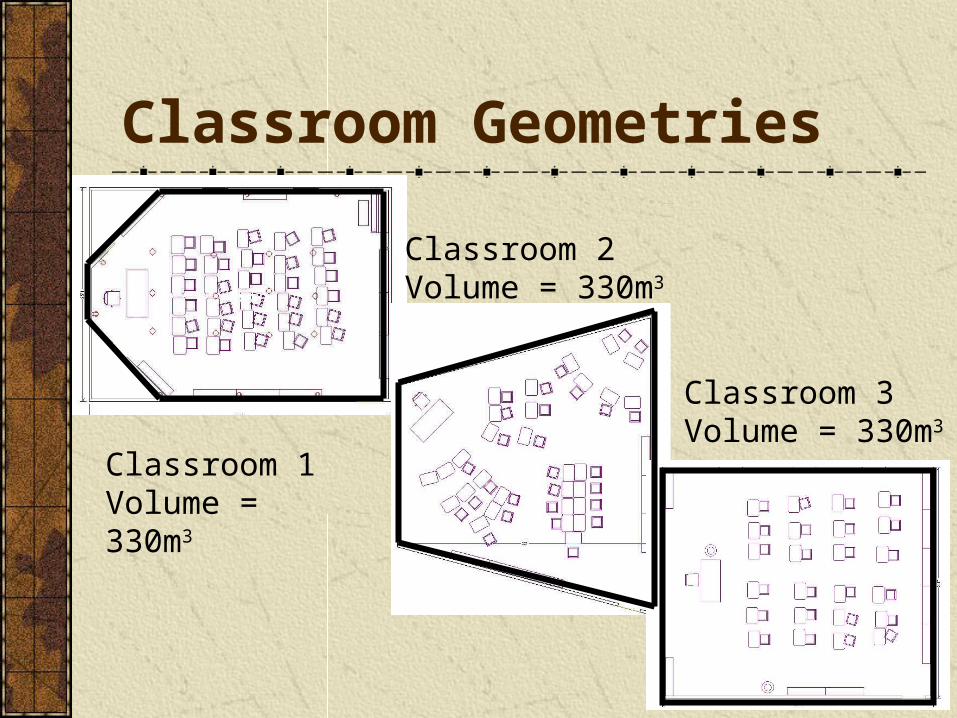
Classroom Geometries
Classroom 1Volume = 330m3
Classroom 2Volume = 330m3
Classroom 3Volume = 330m3
1 2 3
Intelligibility Test Results
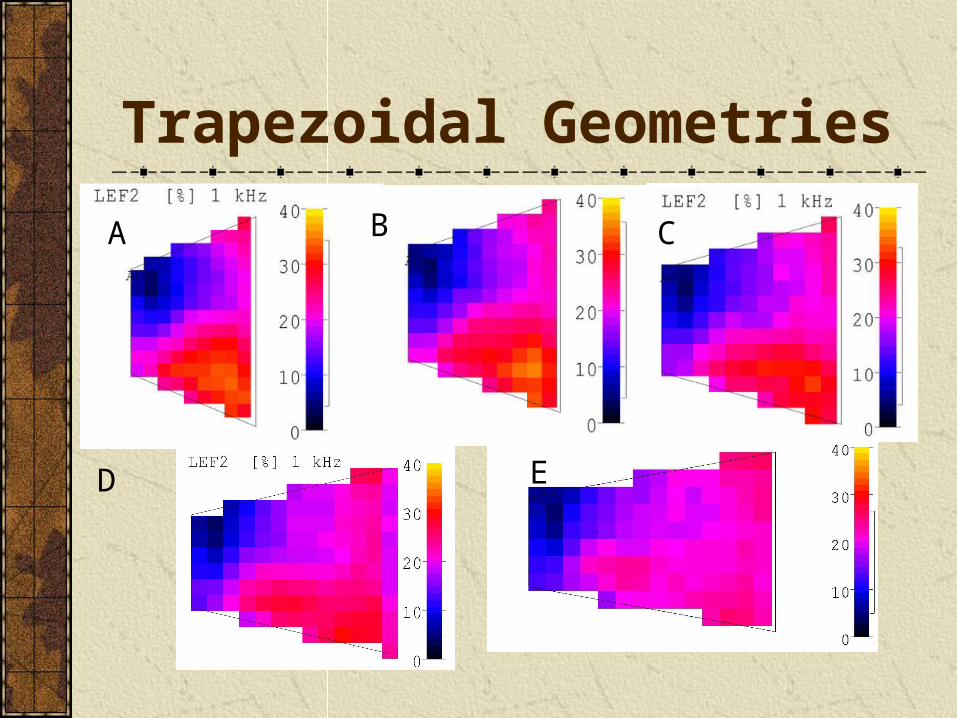
Trapezoidal Geometries
BA C
D E
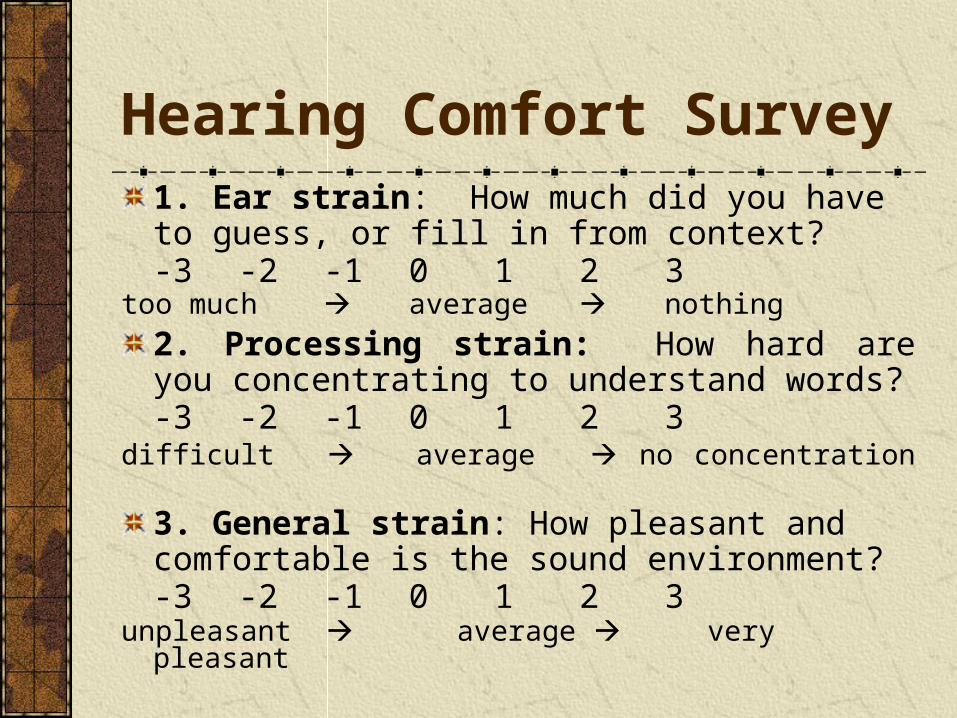
Hearing Comfort Survey1. Ear strain: How much did you have to guess, or fill in from context?-3 -2 -1 0 1 2 3
too much average nothing
2. Processing strain: How hard are you concentrating to understand words?-3 -2 -1 0 1 2 3
difficult average no concentration 3. General strain: How pleasant and comfortable is the sound environment?-3 -2 -1 0 1 2 3
unpleasant average very pleasant
Hearing Comfort Results
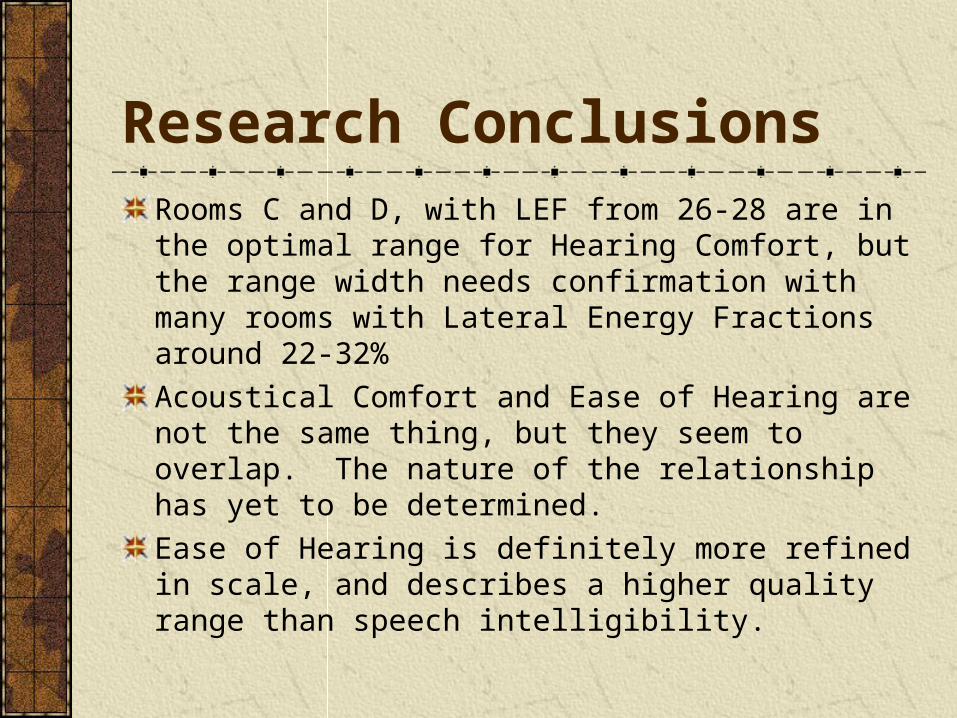
Research ConclusionsRooms C and D, with LEF from 26-28 are in the optimal range for Hearing Comfort, but the range width needs confirmation with many rooms with Lateral Energy Fractions around 22-32%
Acoustical Comfort and Ease of Hearing are not the same thing, but they seem to overlap. The nature of the relationship has yet to be determined.
Ease of Hearing is definitely more refined in scale, and describes a higher quality range than speech intelligibility.
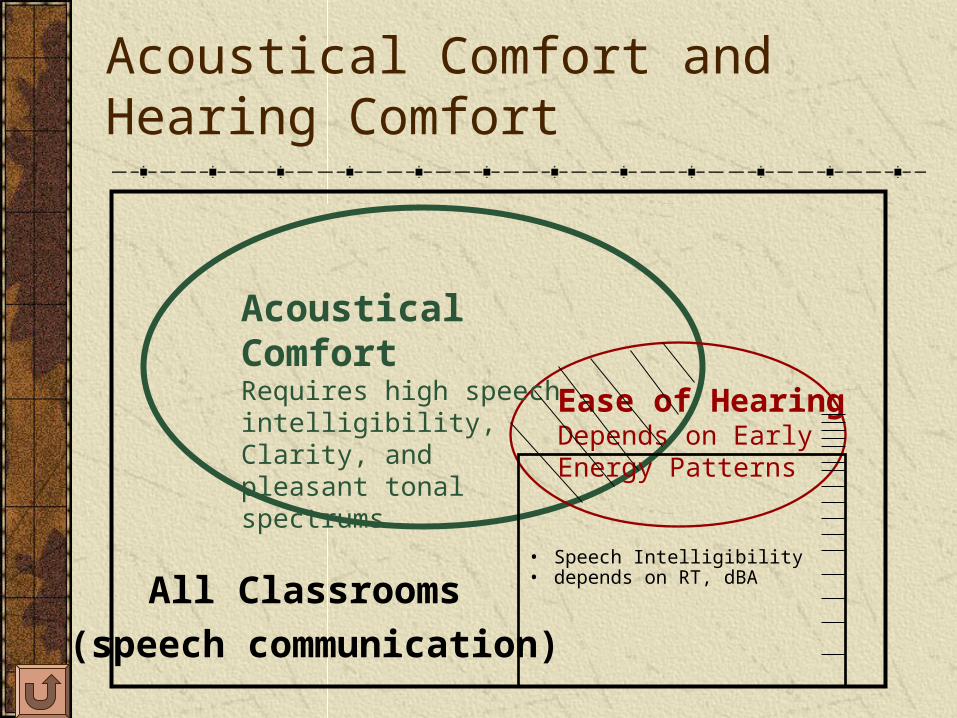
Acoustical Comfort and Hearing Comfort
Ease of HearingDepends on Early Energy Patterns
• Speech Intelligibility• depends on RT, dBA
Acoustical ComfortRequires high speech intelligibility, Clarity, and pleasant tonal spectrums
All Classrooms
(speech communication)
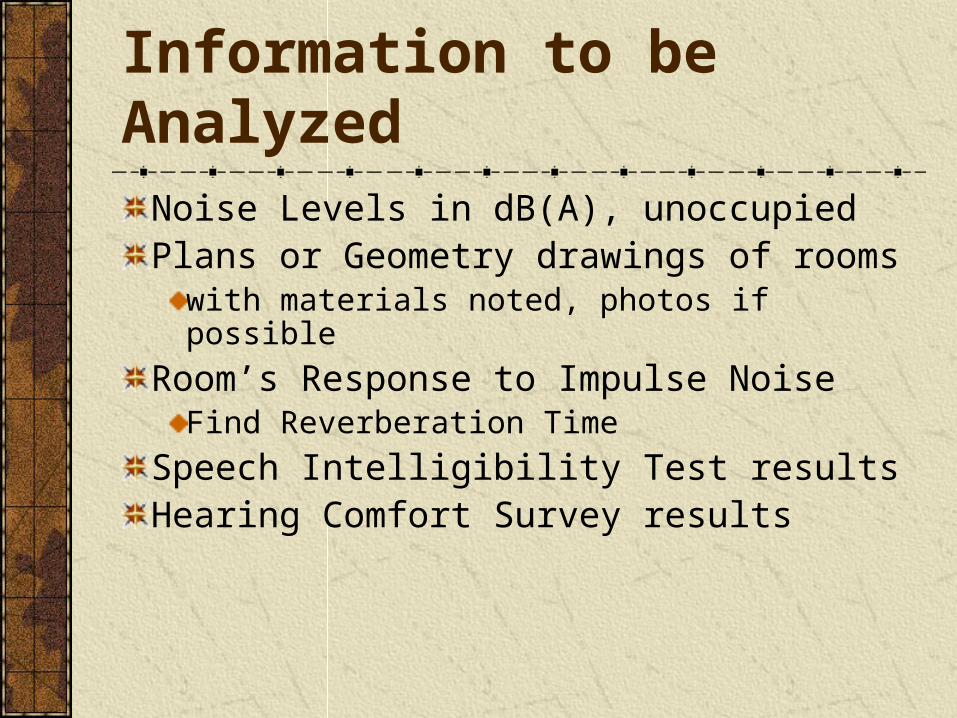
Information to be Analyzed
Noise Levels in dB(A), unoccupiedPlans or Geometry drawings of rooms
with materials noted, photos if possible
Room’s Response to Impulse NoiseFind Reverberation Time
Speech Intelligibility Test resultsHearing Comfort Survey results