aberdeen sales effectiveness study
DESCRIPTION
Sales effectiveness studyTRANSCRIPT
Sales Effectiveness: Getting Sales Back to Selling
July 2007
Sales Effectiveness: Getting Sales Back to Selling Page 2
© 2007 Aberdeen Group, Inc. Telephone: 617 723 7890 www.aberdeen.com
Executive Summary The pressures of longer sales cycles and declining sales productivity are forcing Best-in-Class companies to streamline and automate how sales information is processed and the mechanics by which deals get done. In June 2007, Aberdeen surveyed over 200 companies to identify the strategies, capabilities and enablers that Best-in-Class companies use to improve sales effectiveness and productivity. The research reveals that leading companies have focused on both the sales management process, as well as tools designed for the individual sales representative, to increase the ability of their sales organizations to hit quotas and ultimately remain competitive.
Best-in-Class Performance Aberdeen used four key performance criteria to distinguish Best-in-Class companies. The key performance indicators (KPIs) are:
• 96% reported year/year improvements in Bid-to-Win performance • 80% reported year/year improvements in Order/Quote Quality performance • 86% reported year/year improvements in Lead-to-Opportunity conversion rate
performance
Competitive Maturity Assessment Survey results show that the firms enjoying Best-in-Class performance enable, or are planning to enable, several key process, performance and organizational capabilities:
• Implement a structured approach to competitive, market and sales intelligence (91%) • Create a central repository of account, contact, and opportunity information (96%) • Utilize formal and documented sales processes (95%)
Required Actions In addition to the specific recommendations in Chapter 3 of this report, companies must take the following steps to achieve Best-in-Class status:
• Stop using spreadsheets and shadow accounting – too much sales information is scattered throughout the organization and many complex tasks are managed in an ad hoc manner. Organizations must streamline processes and invest in centralizing sales information to eliminate “multiple versions of the truth.”
• Integrate sales processes into the back-office – pricing, product configuring and order/quote generation are cross-functional issues. Organizations should plan on integrating these sales touch-points to eliminate administrative overheads.
• Invest in formal sales methodologies and information-based processes – with the wide adoption of sales management processes and planned future adoption of information-based individual enablers, organizations must now focus on developing information-based sales processes as a competitive differentiator.
The sales process is a team effort, not a one person show. The key to making the sales team more productive is follow up, follow up, follow up… staying tuned in, and listening… Of course, a CRM/SFA solution that supports opportunities, multiple contacts, and is available for online collaboration also helps.
~ VP Sales and Business Development
Sales Effectiveness: Getting Sales Back to Selling Page 3
© 2007 Aberdeen Group, Inc. Telephone: 617 723 7890 www.aberdeen.com
Table of Contents Executive Summary....................................................................................................... 2
Best-in-Class Performance......................................................................... 2 Competitive Maturity Assessment........................................................... 2 Required Actions ......................................................................................... 2
Chapter One: Benchmarking the Best-in-Class ..................................................... 4 Maturity Class Framework ........................................................................ 5 Best-in-Class PACE Model......................................................................... 5
Chapter Two: Benchmarking Requirements for Success .................................... 8 Competitive Assessment............................................................................ 8 Organizational Capabilities and Technology Enablers ......................... 9 Impact of Sales Effectiveness Technologies..........................................10
Chapter Three: Required Actions .........................................................................13 Laggard Steps to Success.......................................................................... 13 Industry Norm Steps to Success ............................................................ 13 Best-in-Class Steps to Success ................................................................ 14
Appendix A: Research Methodology.....................................................................17 Appendix B: Related Aberdeen Research............................................................19
Figures Figure 1: Top Challenges to Increase Sales Effectiveness.................................... 4 Figure 2: BIC’s Current/Planned Investment in Sales Process Enablers........... 7 Figure 3: BIC’s Current/Planned Investment in Managing Sales Data............... 7 Figure 4: BIC Achieve Superior Results in Financial Metrics ............................11 Figure 5: BIC Achieve Superior Results in Operational Metrics......................11
Tables Table 1: Companies With Top Performance Earn “Best-in-Class” Status: .....5 Table 2: Best-in-Class PACE Framework................................................................ 6 Table 3: Best-in-Class Strategic Actions/Capabilities............................................ 6 Table 4: Competitive Framework ............................................................................. 9 Table 5: PACE Framework .......................................................................................18 Table 6: Maturity Framework...................................................................................18 Table 7: Relationship Between PACE and Competitive Framework..............18
Sales Effectiveness: Getting Sales Back to Selling Page 4
© 2007 Aberdeen Group, Inc. Telephone: 617 723 7890 www.aberdeen.com
Chapter One: Benchmarking the Best-in-Class
Aberdeen research reveals that companies are increasingly challenged in their sales performance by longer sales cycles and low sales productivity. Specifically, sales teams are missing revenue targets, not hitting quota and facing stalled opportunities as organizations strive to remain competitive and service increasingly discerning customers. In response to these business challenges, the Best-in-Class (BIC) deploy a combination of actions, capabilities and enablers to their sales representatives to better equip them to effectively manage and execute the sales process.
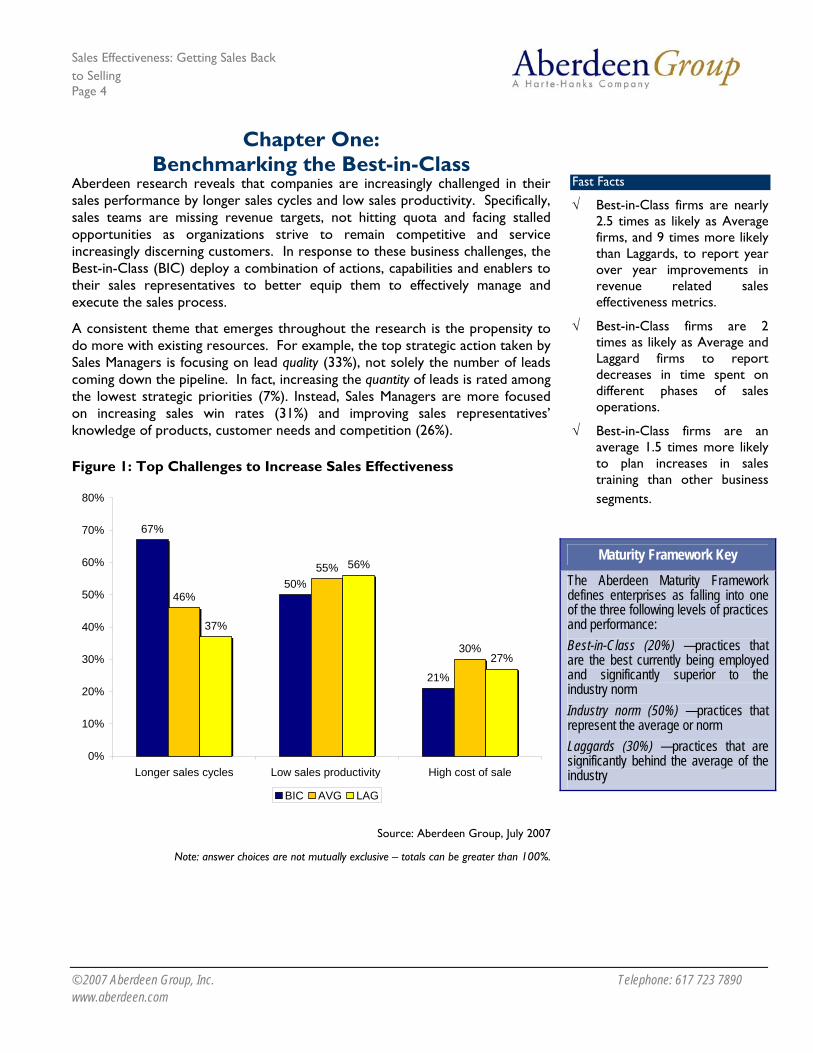
A consistent theme that emerges throughout the research is the propensity to do more with existing resources. For example, the top strategic action taken by Sales Managers is focusing on lead quality (33%), not solely the number of leads coming down the pipeline. In fact, increasing the quantity of leads is rated among the lowest strategic priorities (7%). Instead, Sales Managers are more focused on increasing sales win rates (31%) and improving sales representatives’ knowledge of products, customer needs and competition (26%).
Figure 1: Top Challenges to Increase Sales Effectiveness
67%
50%
21%
46%
55%
30%
37%
56%
27%
0%
10%
20%
30%
40%
50%
60%
70%
80%
Longer sales cycles Low sales productivity High cost of sale
BIC AVG LAG
Source: Aberdeen Group, July 2007
Note: answer choices are not mutually exclusive – totals can be greater than 100%.
Maturity Framework Key The Aberdeen Maturity Framework defines enterprises as falling into one of the three following levels of practices and performance: Best-in-Class (20%) —practices that are the best currently being employed and significantly superior to the industry norm Industry norm (50%) —practices that represent the average or norm Laggards (30%) —practices that are significantly behind the average of the industry
Fast Facts
√ Best-in-Class firms are nearly 2.5 times as likely as Average firms, and 9 times more likely than Laggards, to report year over year improvements in revenue related sales effectiveness metrics.
√ Best-in-Class firms are 2 times as likely as Average and Laggard firms to report decreases in time spent on different phases of sales operations.
√ Best-in-Class firms are an average 1.5 times more likely to plan increases in sales training than other business segments.
Sales Effectiveness: Getting Sales Back to Selling Page 5
© 2007 Aberdeen Group, Inc. Telephone: 617 723 7890 www.aberdeen.com
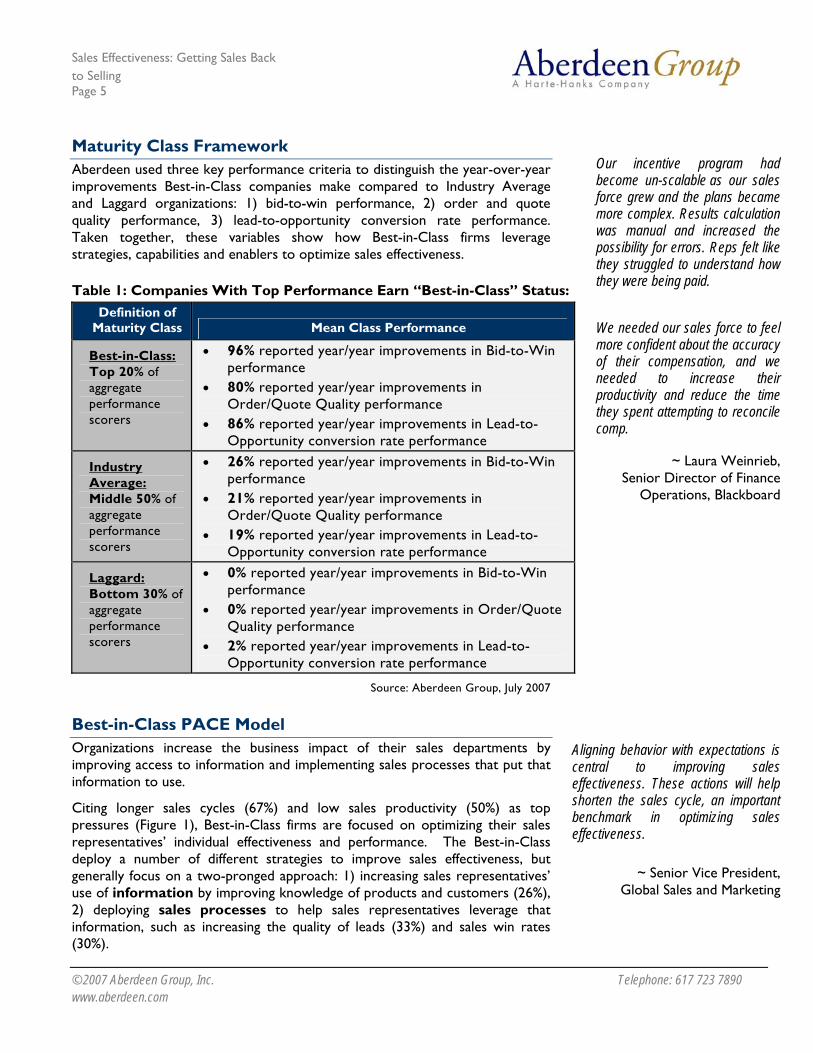
Maturity Class Framework Aberdeen used three key performance criteria to distinguish the year-over-year improvements Best-in-Class companies make compared to Industry Average and Laggard organizations: 1) bid-to-win performance, 2) order and quote quality performance, 3) lead-to-opportunity conversion rate performance. Taken together, these variables show how Best-in-Class firms leverage strategies, capabilities and enablers to optimize sales effectiveness.
Table 1: Companies With Top Performance Earn “Best-in-Class” Status: Definition of
Maturity Class Mean Class Performance
Best-in-Class: Top 20% of aggregate performance scorers
• 96% reported year/year improvements in Bid-to-Win performance
• 80% reported year/year improvements in Order/Quote Quality performance
• 86% reported year/year improvements in Lead-to-Opportunity conversion rate performance
Industry Average: Middle 50% of aggregate performance scorers
• 26% reported year/year improvements in Bid-to-Win performance
• 21% reported year/year improvements in Order/Quote Quality performance
• 19% reported year/year improvements in Lead-to-Opportunity conversion rate performance
Laggard: Bottom 30% of aggregate performance scorers
• 0% reported year/year improvements in Bid-to-Win performance
• 0% reported year/year improvements in Order/Quote Quality performance
• 2% reported year/year improvements in Lead-to-Opportunity conversion rate performance
Source: Aberdeen Group, July 2007
Best-in-Class PACE Model Organizations increase the business impact of their sales departments by improving access to information and implementing sales processes that put that information to use.
Citing longer sales cycles (67%) and low sales productivity (50%) as top pressures (Figure 1), Best-in-Class firms are focused on optimizing their sales representatives’ individual effectiveness and performance. The Best-in-Class deploy a number of different strategies to improve sales effectiveness, but generally focus on a two-pronged approach: 1) increasing sales representatives’ use of information by improving knowledge of products and customers (26%), 2) deploying sales processes to help sales representatives leverage that information, such as increasing the quality of leads (33%) and sales win rates (30%).
Our incentive program had become un-scalable as our sales force grew and the plans became more complex. Results calculation was manual and increased the possibility for errors. Reps felt like they struggled to understand how they were being paid. We needed our sales force to feel more confident about the accuracy of their compensation, and we needed to increase their productivity and reduce the time they spent attempting to reconcile comp.
~ Laura Weinrieb, Senior Director of Finance
Operations, Blackboard
Aligning behavior with expectations is central to improving sales effectiveness. These actions will help shorten the sales cycle, an important benchmark in optimizing sales effectiveness.
~ Senior Vice President, Global Sales and Marketing
Sales Effectiveness: Getting Sales Back to Selling Page 6
© 2007 Aberdeen Group, Inc. Telephone: 617 723 7890 www.aberdeen.com
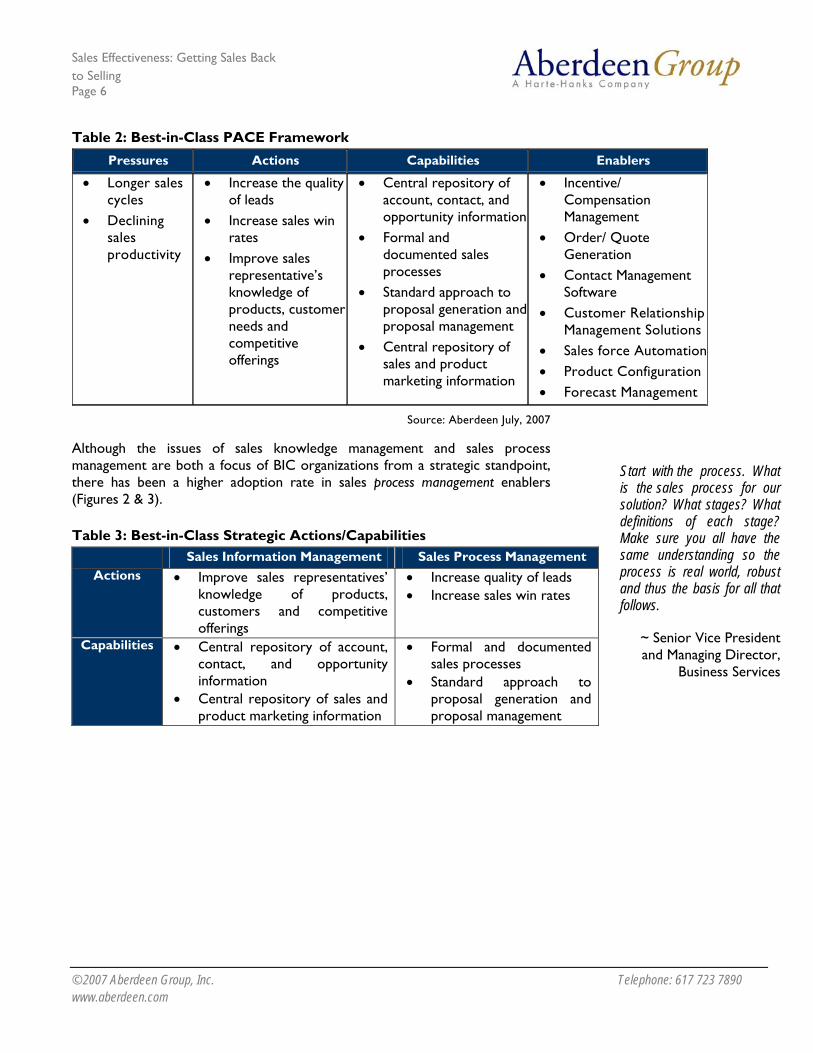
Table 2: Best-in-Class PACE Framework Pressures Actions Capabilities Enablers
• Longer sales cycles
• Declining sales productivity
• Increase the quality of leads
• Increase sales win rates
• Improve sales representative’s knowledge of products, customer needs and competitive offerings
• Central repository of account, contact, and opportunity information
• Formal and documented sales processes
• Standard approach to proposal generation and proposal management
• Central repository of sales and product marketing information
• Incentive/ Compensation Management
• Order/ Quote Generation
• Contact Management Software
• Customer Relationship Management Solutions
• Sales force Automation• Product Configuration • Forecast Management
Source: Aberdeen July, 2007
Although the issues of sales knowledge management and sales process management are both a focus of BIC organizations from a strategic standpoint, there has been a higher adoption rate in sales process management enablers (Figures 2 & 3).
Table 3: Best-in-Class Strategic Actions/Capabilities Sales Information Management Sales Process Management
Actions • Improve sales representatives’ knowledge of products, customers and competitive offerings
• Increase quality of leads • Increase sales win rates
Capabilities • Central repository of account, contact, and opportunity information
• Central repository of sales and product marketing information
• Formal and documented sales processes
• Standard approach to proposal generation and proposal management
Start with the process. What is the sales process for our solution? What stages? What definitions of each stage? Make sure you all have the same understanding so the process is real world, robust and thus the basis for all that follows.
~ Senior Vice President and Managing Director,
Business Services
Sales Effectiveness: Getting Sales Back to Selling Page 7
© 2007 Aberdeen Group, Inc. Telephone: 617 723 7890 www.aberdeen.com
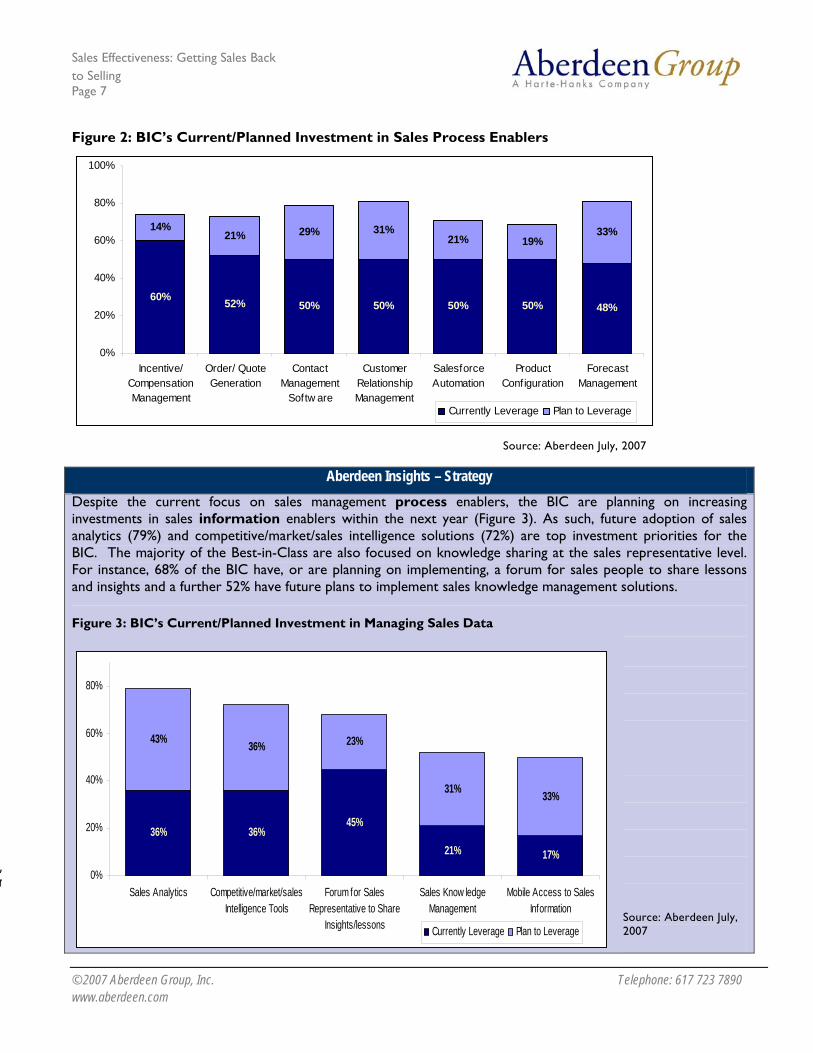
Figure 2: BIC’s Current/Planned Investment in Sales Process Enablers
60% 52% 50% 50% 50% 50% 48%
14%21% 29% 31%
21% 19%33%
0%
20%
40%
60%
80%
100%
Incentive/CompensationManagement
Order/ QuoteGeneration
ContactManagement
Softw are
CustomerRelationshipManagement
SalesforceAutomation
ProductConfiguration
ForecastManagement
Currently Leverage Plan to Leverage
Source: Aberdeen July, 2007
Aberdeen Insights – Strategy Despite the current focus on sales management process enablers, the BIC are planning on increasing investments in sales information enablers within the next year (Figure 3). As such, future adoption of sales analytics (79%) and competitive/market/sales intelligence solutions (72%) are top investment priorities for the BIC. The majority of the Best-in-Class are also focused on knowledge sharing at the sales representative level. For instance, 68% of the BIC have, or are planning on implementing, a forum for sales people to share lessons and insights and a further 52% have future plans to implement sales knowledge management solutions.
Figure 3: BIC’s Current/Planned Investment in Managing Sales Data
Source: Aberdeen July, 2007
, r
36% 36%45%
21% 17%
43% 36% 23%
31% 33%
0%
20%
40%
60%
80%
Sales Analytics Competitive/market/salesIntelligence Tools
Forum for SalesRepresentative to Share
Insights/lessons
Sales Know ledgeManagement
Mobile Access to SalesInformation
Currently Leverage Plan to Leverage
Sales Effectiveness: Getting Sales Back to Selling Page 8
© 2007 Aberdeen Group, Inc. Telephone: 617 723 7890 www.aberdeen.com
Chapter Two: Benchmarking Requirements for Success
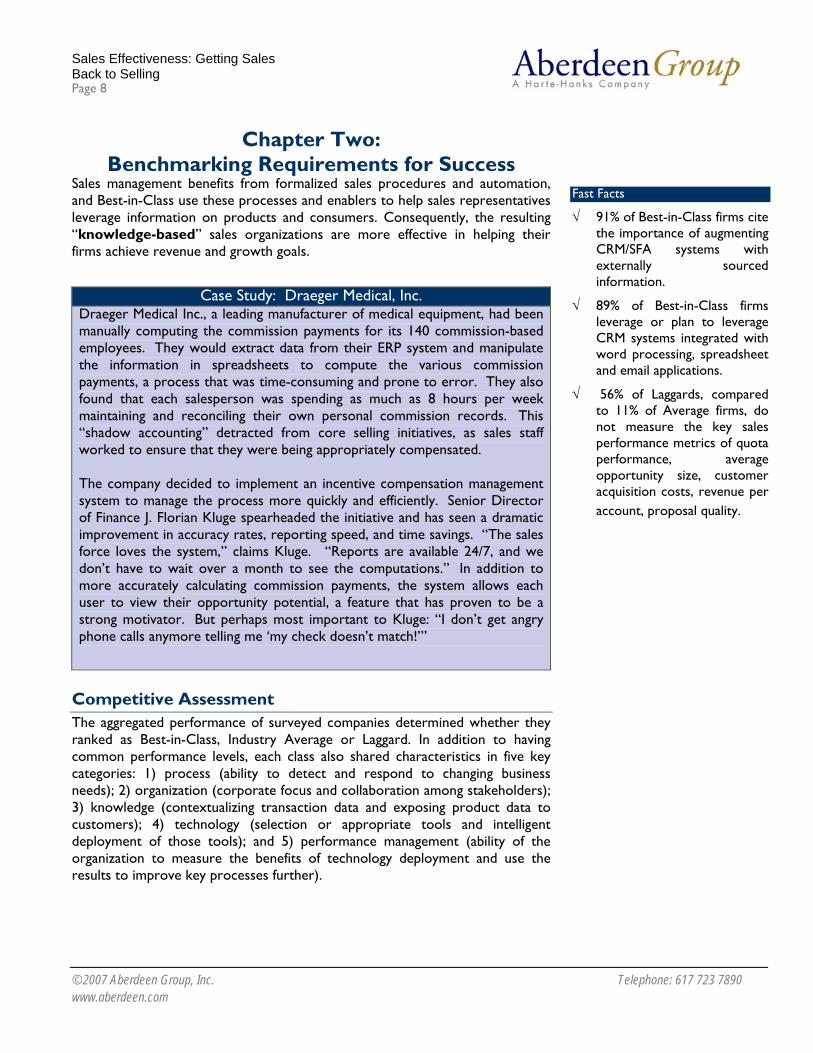
Sales management benefits from formalized sales procedures and automation, and Best-in-Class use these processes and enablers to help sales representatives leverage information on products and consumers. Consequently, the resulting “knowledge-based” sales organizations are more effective in helping their firms achieve revenue and growth goals.
Case Study: Draeger Medical, Inc. Draeger Medical Inc., a leading manufacturer of medical equipment, had been manually computing the commission payments for its 140 commission-based employees. They would extract data from their ERP system and manipulate the information in spreadsheets to compute the various commission payments, a process that was time-consuming and prone to error. They also found that each salesperson was spending as much as 8 hours per week maintaining and reconciling their own personal commission records. This “shadow accounting” detracted from core selling initiatives, as sales staff worked to ensure that they were being appropriately compensated. The company decided to implement an incentive compensation management system to manage the process more quickly and efficiently. Senior Director of Finance J. Florian Kluge spearheaded the initiative and has seen a dramatic improvement in accuracy rates, reporting speed, and time savings. “The sales force loves the system,” claims Kluge. “Reports are available 24/7, and we don’t have to wait over a month to see the computations.” In addition to more accurately calculating commission payments, the system allows each user to view their opportunity potential, a feature that has proven to be a strong motivator. But perhaps most important to Kluge: “I don’t get angry phone calls anymore telling me ‘my check doesn’t match!’”
Competitive Assessment The aggregated performance of surveyed companies determined whether they ranked as Best-in-Class, Industry Average or Laggard. In addition to having common performance levels, each class also shared characteristics in five key categories: 1) process (ability to detect and respond to changing business needs); 2) organization (corporate focus and collaboration among stakeholders); 3) knowledge (contextualizing transaction data and exposing product data to customers); 4) technology (selection or appropriate tools and intelligent deployment of those tools); and 5) performance management (ability of the organization to measure the benefits of technology deployment and use the results to improve key processes further).
Fast Facts
√ 91% of Best-in-Class firms cite the importance of augmenting CRM/SFA systems with externally sourced information.
√ 89% of Best-in-Class firms leverage or plan to leverage CRM systems integrated with word processing, spreadsheet and email applications.
√ 56% of Laggards, compared to 11% of Average firms, do not measure the key sales performance metrics of quota performance, average opportunity size, customer acquisition costs, revenue per account, proposal quality.
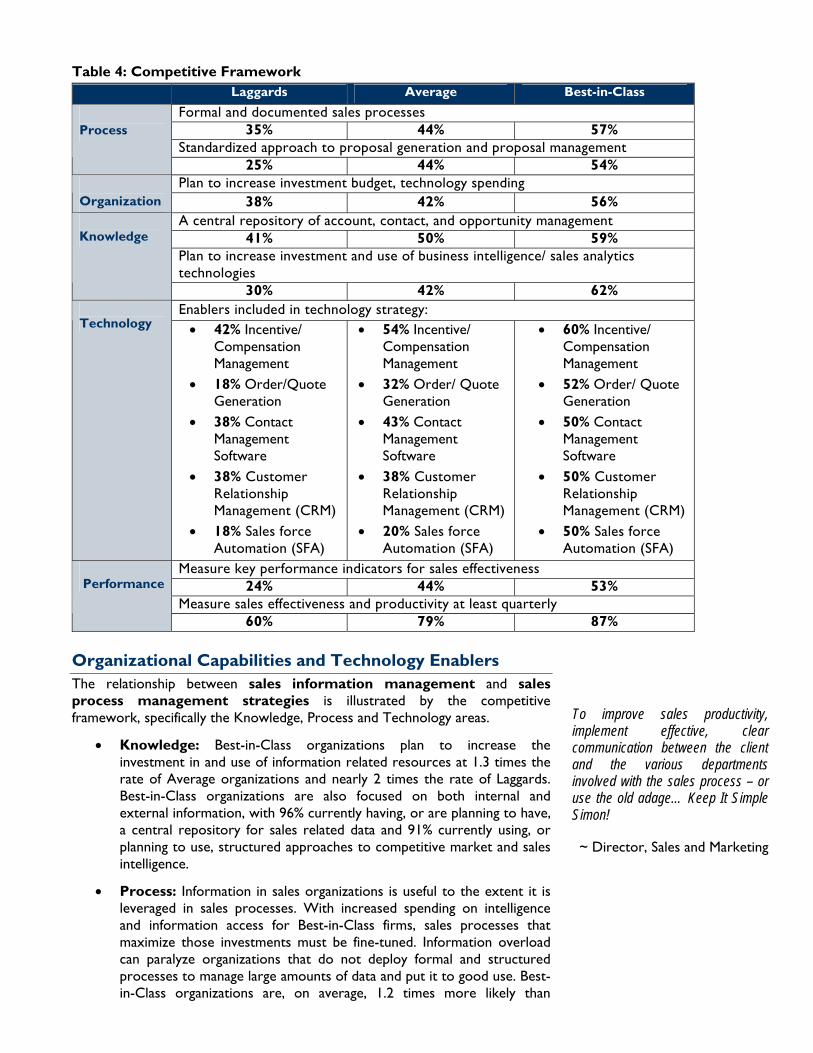
Table 4: Competitive Framework Laggards Average Best-in-Class
Formal and documented sales processes 35% 44% 57%
Standardized approach to proposal generation and proposal management
Process
25% 44% 54% Plan to increase investment budget, technology spending
Organization 38% 42% 56% A central repository of account, contact, and opportunity management
41% 50% 59% Plan to increase investment and use of business intelligence/ sales analytics technologies
Knowledge
30% 42% 62% Enablers included in technology strategy:
Technology • 42% Incentive/ Compensation Management
• 18% Order/Quote Generation
• 38% Contact Management Software
• 38% Customer Relationship Management (CRM)
• 18% Sales force Automation (SFA)
• 54% Incentive/ Compensation Management
• 32% Order/ Quote Generation
• 43% Contact Management Software
• 38% Customer Relationship Management (CRM)
• 20% Sales force Automation (SFA)
• 60% Incentive/ Compensation Management
• 52% Order/ Quote Generation
• 50% Contact Management Software
• 50% Customer Relationship Management (CRM)
• 50% Sales force Automation (SFA)
Measure key performance indicators for sales effectiveness 24% 44% 53%
Measure sales effectiveness and productivity at least quarterly
Performance
60% 79% 87%
Organizational Capabilities and Technology Enablers The relationship between sales information management and sales process management strategies is illustrated by the competitive framework, specifically the Knowledge, Process and Technology areas.
• Knowledge: Best-in-Class organizations plan to increase the investment in and use of information related resources at 1.3 times the rate of Average organizations and nearly 2 times the rate of Laggards. Best-in-Class organizations are also focused on both internal and external information, with 96% currently having, or are planning to have, a central repository for sales related data and 91% currently using, or planning to use, structured approaches to competitive market and sales intelligence.
• Process: Information in sales organizations is useful to the extent it is leveraged in sales processes. With increased spending on intelligence and information access for Best-in-Class firms, sales processes that maximize those investments must be fine-tuned. Information overload can paralyze organizations that do not deploy formal and structured processes to manage large amounts of data and put it to good use. Best-in-Class organizations are, on average, 1.2 times more likely than
To improve sales productivity, implement effective, clear communication between the client and the various departments involved with the sales process – or use the old adage… Keep It Simple Simon! ~ Director, Sales and Marketing
Sales Effectiveness: Getting Sales Back to Selling Page 10
© 2007 Aberdeen Group, Inc. Telephone: 617 723 7890 www.aberdeen.com
Average organizations, and 1.4 times more likely than Laggards, to take more formal approaches to proposal generation-management and sales processes.
• Technology: Tools leveraged by Best-in-Class knowledge-based sales organizations optimize the collection, management and use of information. Best-in-Class firms are 1.3 times more likely than Average organizations to provide, or plan to provide, competitive-market-sales intelligence tools for each sales representative and 2.2 times more likely than Laggards. Best-in-Class firms are also 1.3 times more likely than the other business segments to incorporate CRM software strategies to manage information in the sales process.
• Performance Management: Best-in-Class firms’ focus on sales performance measurement suggests that they can address the causes of lagging sales effectiveness while continuing practices that lend to productivity. Eighty-seven percent (87%) of Best-in-Class organizations measure sales effectiveness and productivity at least quarterly, one and a half times the rate of Laggards. Best-in-Class firms also deploy key performance indicators (KPIs) to maintain a view of their sales departments’ sales effectiveness performance, with 53% current adoption and an additional 42% planned adoption. Sales performance metrics and key performance indicators are especially important to sales effectiveness as organizations adapt and refine their sales information-process management programs.
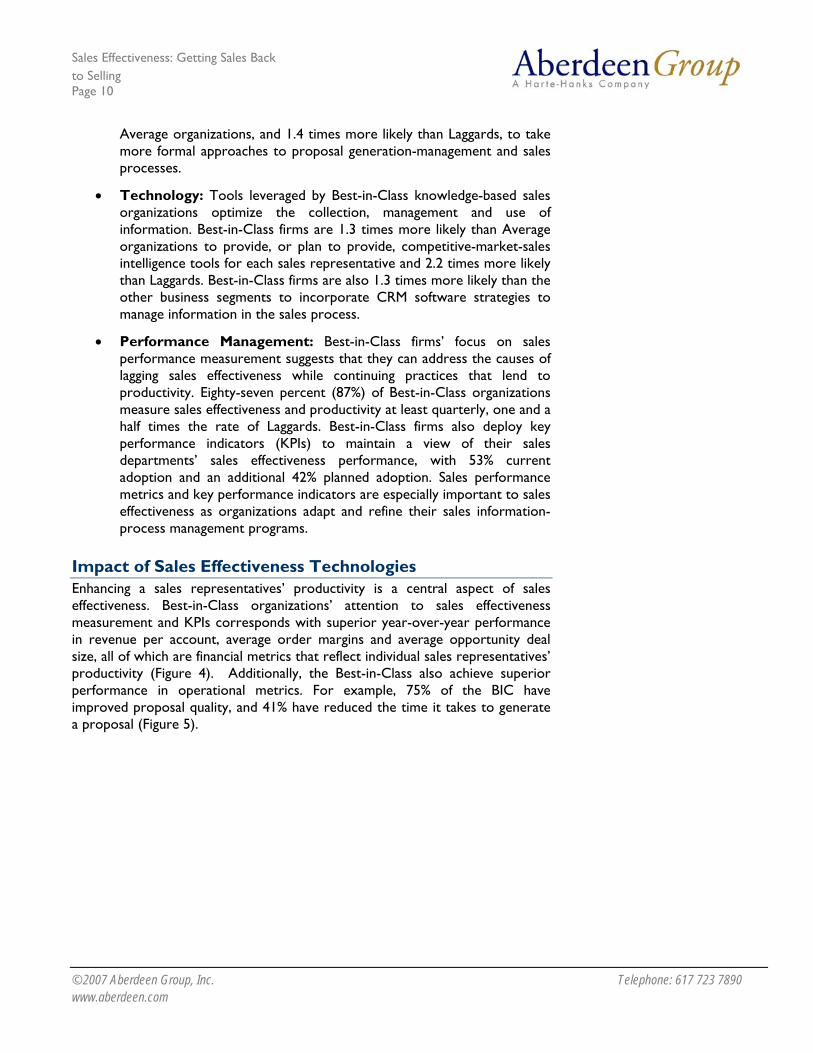
Impact of Sales Effectiveness Technologies Enhancing a sales representatives’ productivity is a central aspect of sales effectiveness. Best-in-Class organizations’ attention to sales effectiveness measurement and KPIs corresponds with superior year-over-year performance in revenue per account, average order margins and average opportunity deal size, all of which are financial metrics that reflect individual sales representatives’ productivity (Figure 4). Additionally, the Best-in-Class also achieve superior performance in operational metrics. For example, 75% of the BIC have improved proposal quality, and 41% have reduced the time it takes to generate a proposal (Figure 5).
Figure 4: BIC Achieve Superior Results in Financial Metrics
Source: Aberdeen Group, July 2007
Figure 5: BIC Achieve Superior Results in Operational Metrics
Source: Aberdeen Group, July 2007
41%
34%
27% 27%
19% 20%
14% 15%
0%
10%
20%
30%
40%
Time to generate aproposal
Time to generate andapprove a quote
Time to book an order Administrative time
BIC All Others
81%
72% 72% 70%
39%
29%
17%
32%
0%
10%
20%
30%
40%
50%
60%
70%
80%
Revenue per account Average Order Margins Quota Performance Average opportunity dealsize
BIC All Others
Sales Effectiveness: Getting Sales Back to Selling Page 12
© 2007 Aberdeen Group, Inc. Telephone: 617 723 7890 www.aberdeen.com
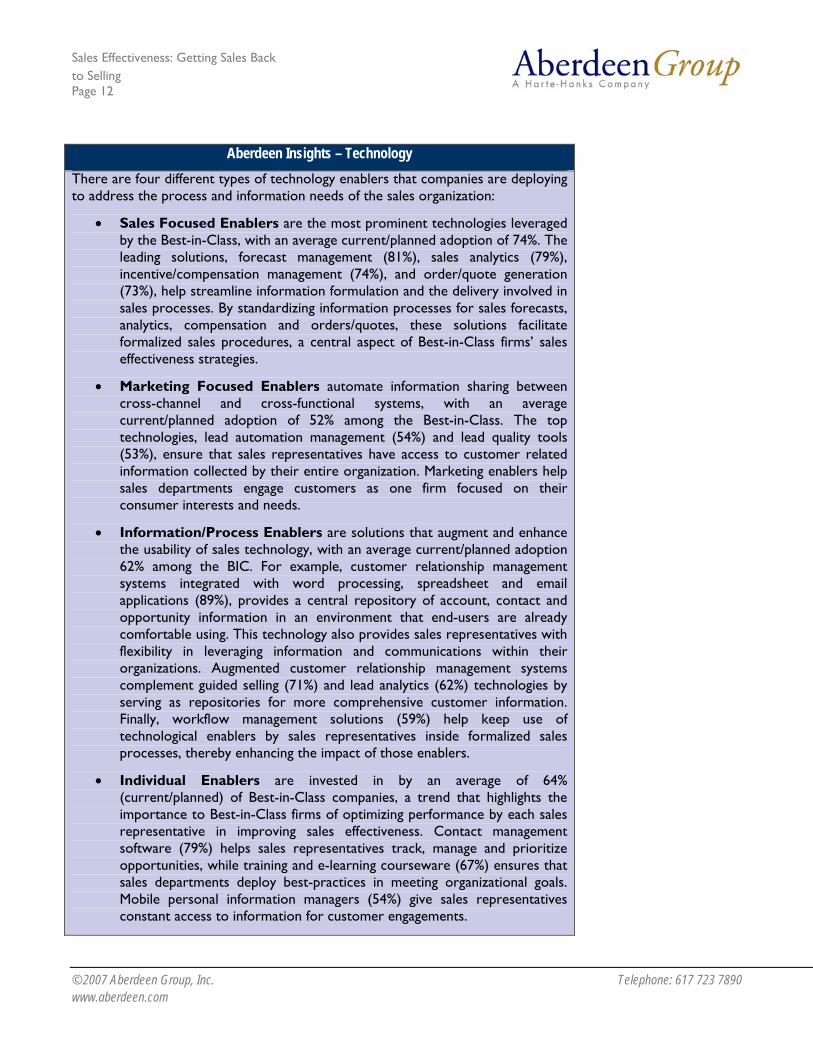
Aberdeen Insights – Technology There are four different types of technology enablers that companies are deploying to address the process and information needs of the sales organization:
• Sales Focused Enablers are the most prominent technologies leveraged by the Best-in-Class, with an average current/planned adoption of 74%. The leading solutions, forecast management (81%), sales analytics (79%), incentive/compensation management (74%), and order/quote generation (73%), help streamline information formulation and the delivery involved in sales processes. By standardizing information processes for sales forecasts, analytics, compensation and orders/quotes, these solutions facilitate formalized sales procedures, a central aspect of Best-in-Class firms’ sales effectiveness strategies.
• Marketing Focused Enablers automate information sharing between cross-channel and cross-functional systems, with an average current/planned adoption of 52% among the Best-in-Class. The top technologies, lead automation management (54%) and lead quality tools (53%), ensure that sales representatives have access to customer related information collected by their entire organization. Marketing enablers help sales departments engage customers as one firm focused on their consumer interests and needs.
• Information/Process Enablers are solutions that augment and enhance the usability of sales technology, with an average current/planned adoption 62% among the BIC. For example, customer relationship management systems integrated with word processing, spreadsheet and email applications (89%), provides a central repository of account, contact and opportunity information in an environment that end-users are already comfortable using. This technology also provides sales representatives with flexibility in leveraging information and communications within their organizations. Augmented customer relationship management systems complement guided selling (71%) and lead analytics (62%) technologies by serving as repositories for more comprehensive customer information. Finally, workflow management solutions (59%) help keep use of technological enablers by sales representatives inside formalized sales processes, thereby enhancing the impact of those enablers.
• Individual Enablers are invested in by an average of 64% (current/planned) of Best-in-Class companies, a trend that highlights the importance to Best-in-Class firms of optimizing performance by each sales representative in improving sales effectiveness. Contact management software (79%) helps sales representatives track, manage and prioritize opportunities, while training and e-learning courseware (67%) ensures that sales departments deploy best-practices in meeting organizational goals. Mobile personal information managers (54%) give sales representatives constant access to information for customer engagements.
Sales Effectiveness: Getting Sales Back to Selling Page 13
© 2007 Aberdeen Group, Inc. Telephone: 617 723 7890 www.aberdeen.com
Chapter Three: Required Actions
Whether a company is trying to move its performance in sales effectiveness from “Laggard” to “Industry Average,” or “Industry Average” to “Best-in-Class,” the following actions will help spur the necessary performance improvements:
Laggard Steps to Success • Start measuring sales effectiveness KPI’s and metrics
On average, the BIC are more than twice as likely as Laggards to measure sales effectiveness KPIs and metrics (53% vs. 24%) and do so on a more frequent basis; 82% of BIC measure sales effectiveness at least on a monthly vs. 54% of Laggards. As such, Laggards must begin to measure Best-in-Class determining KPIs (such as Bid-to-Win Ratio, Order/Quote Quality and Opportunity Conversion Rates) before implementing technological solutions to address sales process and sales information deficiencies.
• Implement and document standardized and repeatable sales processes
Prior to implementing knowledge-based sales solutions, the organization must put standardized sales processes in place that ensure the steps taken to achieve success are repeatable. Nearly all of the BIC (95%) implement, or are planning on implementing, documented and formal sales processes (vs. 84% of the Laggards). Without such processes, the recipe for success cannot be repeated and actions leading to failure will not be clearly understood or preventable. However, it is not necessary for Laggards to implement a formal sales methodology (only 36% of the BIC have currently adopted this enabler).
• Invest in a structured approach to managing accounts, contacts and opportunities
With less than a third (29%) managing accounts, contacts and opportunities in a structured way, Laggards currently under-invest in core sales effectiveness technologies such as Customer Relationship Management (38% vs. 51% BIC), Salesforce Automation (17% vs. 51% BIC) and contact management solutions (38% vs. 50% BIC). Whether they take an organizational (CRM), departmental (SFA) or individual/team approach (contact management software) to account, contact and opportunity management, Laggards should immediately invest in these capabilities, or plan to do so, in the next budget period.
Industry Norm Steps to Success • Invest in and develop a standardized approach to lead management and sales prospecting
With lead quality identified as a primary driver for improving sales productivity, it is not surprising that top performing organizations are focused on lead management and sales prospecting tools. On the sales side, more than nine out of ten (91% vs. 73% of the Average) BIC firms have implemented, or are planning on implementing, a structured
Fast Facts
• 93% of Best-in-Class firms measure time on administrative tasks spent by sales representatives, compared to 70% of Average and 49% of Laggard firms.
• 55% of Average firms plan to increase investment in dedicated sales effectiveness personnel in the two next years.
• 46% of Laggards have no plans to leverage Workflow Management Solutions, while 41% have no plans to adopt Business Process Management Solutions.
Sales Effectiveness: Getting Sales Back to Selling Page 14
© 2007 Aberdeen Group, Inc. Telephone: 617 723 7890 www.aberdeen.com
approach to competitive, market and sales intelligence; more than half of the BIC (vs. 32% of the Average) are planning on increasing investments in competitive intelligence solutions. Additionally, 95% (vs. 79% of the Average) are making similar investments in standardized tools for sales prospecting.
On the marketing side, the BIC are also disproportionately investing in automated lead management (72% vs. 57% of Average), lead distribution (74% vs. 53% of Average) and lead information augmentation (76% vs. 51% of Average) solutions. Average firms should invest in tools that both increase the overall quality of leads coming from marketing, as well enable the individual sales representative get a deeper understanding of the opportunity at hand.
• Invest in a standardized approach to sales collateral and proposal management
The BIC’s second most prevalent strategic action is to improve the sales representative’s knowledge of products, customer needs and competitive offerings. Average companies are comfortable in the knowledge and capabilities of their sales organizations; however, there is room for improvement. For example, only 38% of the Average felt that their sales team is “extremely effective” at understanding customers’ and prospects’ business challenges and 34% felt that their sales team was “extremely effective” at mapping products and services to the prospects’ business challenge. The BIC are addressing this problem through the adoption of sales collateral (90% vs. 81% of the Average) and proposal generation (87% vs. 60% of the Average) solutions. To keep pace with the BIC, Average companies should immediately accelerate and increase investments in collateral and proposal management processes.
• Develop and invest in a knowledge-based sales culture
The Best-in-Class have already taken steps to address both the information needs of individual sales representatives, as well as the process needs of their managers. For example, while only 31% of the BIC currently conduct win/loss on every deal, 52% currently plan on implementing this capability. Furthermore, 83% of the BIC have future plans to implement sales knowledge management solutions, whereas only 58% of the Average has made this commitment. Lastly, 90% of the BIC are planning on implementing a forum for sales people to share insights and lessons learned (contrasted to 74% of the Average). Prior to investing in sophisticated best-of-breed sales enablement and technological solutions, Average should first take steps to implement and support a knowledge-based sales culture.
Best-in-Class Steps to Success • Stop Using Spreadsheets and “Shadow Accounting”
In forecasting and sales commission tracking, it is not uncommon for there to be several versions of the truth at both the manager and individual levels. A consistent characteristic of the BIC is the propensity to adopt solutions that minimize the use of spreadsheets and “ad hoc
We created 100+ individual compensation plans every year with revisions every quarter. We then had to support daily calls from the field from people wanting to know where they stood at any given moment in a quarter and then there was the reconciliation that took place at the end of each quarter. Now, [with our incentive and compensation management system] we’re able to move more quickly and resolve discrepancies and disputes in real-time rather than waiting for quarter close. The result is that sales can focus on selling knowing that they are being paid correctly and consistently. ~ Jeff Williams, Vice President
of Sales, IronPort Systems
Sales Effectiveness: Getting Sales Back to Selling Page 15
© 2007 Aberdeen Group, Inc. Telephone: 617 723 7890 www.aberdeen.com
accounting” on the individual or sales manager level. For example, 60% of the BIC currently leverage incentive/compensation management solutions (and another 30% have future adoption plans). And further, 90% of the BIC have included forecast management solutions in their technology strategies. The BIC recognize that the adoption of these solutions will reduce administrative time associated with non-selling tasks, as well as eliminate intra-departmental conflict that arises from “shadow” accounting activities. The BIC should continue to aggressively eliminate spreadsheet-based and other ad hoc reporting from the sales management process.
• Integrate sales into back-office systems
Nearly nine out of ten (88%) BIC companies have currently implemented, or are planning on implementing, order/quote generation solutions, and another 78% have included price optimization solutions in their future sales management strategies. Considering the integration required for these efforts, it is not surprising that roughly half of the BIC are increasing their focus on data integration (49%), and that there is a corresponding planned increase in technology budget/spending (57%). To maximize the impact of these sales-focused investments, the BIC will more than likely need to integrate with back-office systems. The BIC should immediately conduct an audit of their back-office systems, integration capabilities and available personnel to evaluate the impact and viability of these initiatives.
• Invest in and implement a formal sales methodology
As illustrated above, a baseline investment in a formal and documented sales process is a prerequisite for building an effective sales organization. However, with these processes in place, the BIC realize that it is increasingly important to understand and adopt best practices from outside the organization. Even though only 36% of the BIC have implemented a formal sales methodology, the remaining 64% plan on implementing this enabler over the next year (i.e. there is 100% planned adoption of formal sales methodologies by the BIC). Thirty-nine percent (39%) of the BIC plan on increasing the use of external sales methodology providers. While evaluating sales methodologies and options, organizations should carefully consider the culture of their sales organization and the sales style that is appropriate in their industry.
Aberdeen Insights – Summary Today, BIC sales managers are struggling to attract and hire new salespeople, on-board and train new staff and retain top sales talent (only 23%, 19% and 30% respectively rated themselves extremely effective in these areas). In an ever-changing business environment, it is important for sales management to use all of the tools at their disposal to create a learning organization and knowledge based culture. The research reveals that organizations are developing knowledge-based cultures through the combination of process and information enablers. Historically, these two different types of enablers have
Sales Effectiveness: Getting Sales Back to Selling Page 16
© 2007 Aberdeen Group, Inc. Telephone: 617 723 7890 www.aberdeen.com
Aberdeen Insights – Summary been mutually exclusive; however, the research also suggests that there is currently a convergence of the two underway.
For example, in implementing formal sales methodologies, 92% of the BIC have included guided selling in their future sales management strategies and 63% of the BIC plan on increasing the use of “in-product training” – that is, sales methodologies and mentoring within a CRM or SFA system. These types of enablers are information-based, yet process driven. As process enablers move to ubiquity, and information enablers become more prevalent, leading organizations will undoubtedly develop new and differentiating information processes.
Sales Effectiveness: Getting Sales Back to Selling Page 17
© 2007 Aberdeen Group, Inc. Telephone: 617 723 7890 www.aberdeen.com
Appendix A: Research Methodology
Between June and July 2007, Aberdeen Group examined the sales effectiveness of nearly 200 enterprises in a diverse set of industries.
Respondents completed an online survey that included questions designed to determine:
• The degree to which sales effectiveness solutions and technologies are deployed and the performance implications of the technology
• Current and planned use of sales effectiveness technologies
• The benefits, if any, that have been derived from sales effectiveness initiatives.
Aberdeen supplemented this online survey effort with telephone interviews with select survey respondents, gathering additional information on sales effectiveness strategies, experiences, and results.
The study aimed to identify emerging best practices for sales effectiveness and provide a framework by which readers could assess their own practices and strategies.
Responding enterprises included the following:
• Job title/function: 35% Senior Management (CEO,COO, President), 14% Vice Presidents, 19% Directors, 17% Managers, 6% Consultants, 4% Staff, 5% Other.
• Industry: The research sample included respondents from: 57% High Technology, 26% Telecommunications, 19% Finance Related Industries, 12% Industrial Manufacturing, 11% Engineering, 11% Health Related Industry, 11% Retail, 11% Transportation, 10% Distribution.
• Geography: Respondents came from: 55% North America, 21% Europe, 16% APAC, 5% Middle East/Africa, 3% Latin America.
• Company size: Based on revenue, organizations were 66% small firms (under $50 million annual revenue), 24% medium sized businesses ($50 million to $1 billion annual revenue) and 10% large enterprises (over $1 billion annual revenue).
Solution providers recognized as sponsors of this report were solicited after the fact and had no substantive influence on the direction of the Benchmark Report. Their sponsorship has made it possible for Aberdeen Group to make these findings available to readers at no charge.
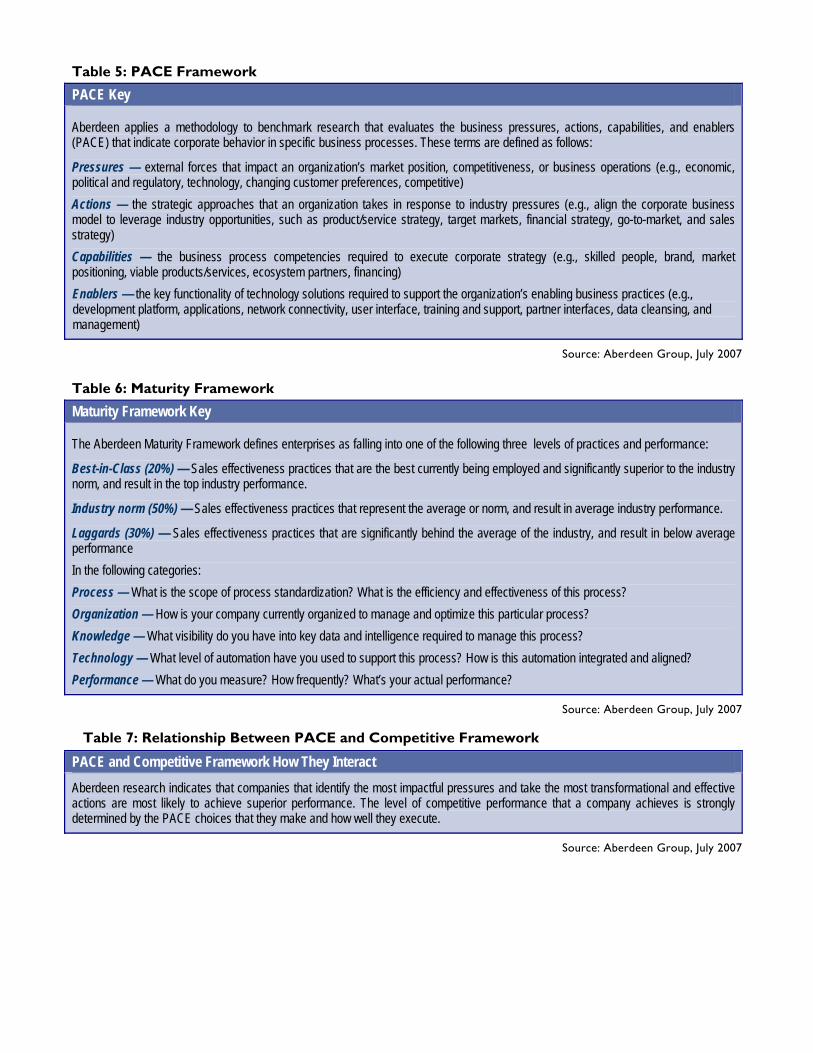
Table 5: PACE Framework
PACE Key
Aberdeen applies a methodology to benchmark research that evaluates the business pressures, actions, capabilities, and enablers (PACE) that indicate corporate behavior in specific business processes. These terms are defined as follows:
Pressures — external forces that impact an organization’s market position, competitiveness, or business operations (e.g., economic, political and regulatory, technology, changing customer preferences, competitive) Actions — the strategic approaches that an organization takes in response to industry pressures (e.g., align the corporate business model to leverage industry opportunities, such as product/service strategy, target markets, financial strategy, go-to-market, and sales strategy) Capabilities — the business process competencies required to execute corporate strategy (e.g., skilled people, brand, market positioning, viable products/services, ecosystem partners, financing) Enablers — the key functionality of technology solutions required to support the organization’s enabling business practices (e.g., development platform, applications, network connectivity, user interface, training and support, partner interfaces, data cleansing, and management)
Source: Aberdeen Group, July 2007
Table 6: Maturity Framework
Maturity Framework Key
The Aberdeen Maturity Framework defines enterprises as falling into one of the following three levels of practices and performance:
Best-in-Class (20%) — Sales effectiveness practices that are the best currently being employed and significantly superior to the industry norm, and result in the top industry performance.
Industry norm (50%) — Sales effectiveness practices that represent the average or norm, and result in average industry performance.
Laggards (30%) — Sales effectiveness practices that are significantly behind the average of the industry, and result in below average performance In the following categories: Process — What is the scope of process standardization? What is the efficiency and effectiveness of this process? Organization — How is your company currently organized to manage and optimize this particular process? Knowledge — What visibility do you have into key data and intelligence required to manage this process? Technology — What level of automation have you used to support this process? How is this automation integrated and aligned? Performance — What do you measure? How frequently? What’s your actual performance?
Source: Aberdeen Group, July 2007
Table 7: Relationship Between PACE and Competitive Framework
PACE and Competitive Framework How They Interact Aberdeen research indicates that companies that identify the most impactful pressures and take the most transformational and effective actions are most likely to achieve superior performance. The level of competitive performance that a company achieves is strongly determined by the PACE choices that they make and how well they execute.
Source: Aberdeen Group, July 2007
Sales Effectiveness: Getting Sales Back to Selling Page 19
© 2007 Aberdeen Group, Inc. Telephone: 617 723 7890 www.aberdeen.com
Appendix B: Related Aberdeen Research
Related Aberdeen research that forms a companion or reference to this report includes:
• Sales Effectiveness: Helping Companies Sell (June 2004)
• Sales Productivity Tools: Closing the CRM Gap (December 2005)
• Automating Leads to Sales (March 2007)
• Mobile Sales Force Effectiveness (March 2007)
Information on these and any other Aberdeen publications can be found at www.aberdeen.com.
Founded in 1988, Aberdeen Group is the technology- driven research destination of choice for the global business executive. Aberdeen Group has over 100,000 research members in over 36 countries around the world that both participate in and direct the most comprehensive technology-driven value chain research in the market. Through its continued fact-based research, benchmarking, and actionable analysis, Aberdeen Group offers global business and technology executives a unique mix of actionable research, KPIs, tools, and services. This document is the result of research performed by Aberdeen Group. Aberdeen Group believes its findings are objective and represent the best analysis available at the time of publication. Unless otherwise noted, the entire contents of this publication are copyrighted by Aberdeen Group, Inc. and may not be reproduced, stored in a retrieval system, or transmitted in any form or by any means without prior written consent by Aberdeen Group, Inc.
Authors: Andrew Boyd, Sr. VP & Research Director – CRM ([email protected]) Noel Le, Research Analyst – CRM ([email protected])