a usability study on electronic document …etd.lib.metu.edu.tr/upload/12616524/index.pdf · tarz...
TRANSCRIPT
A USABILITY STUDY ON ELECTRONIC DOCUMENT MANAGEMENT
SYSTEM IN MIDDLE EAST TECHNICAL UNIVERSITY
A THESIS SUBMITTED TO
THE GRADUATE SCHOOL OF INFORMATICS
OF
MIDDLE EAST TECHNICAL UNIVERSITY
BY
ALPAY KARAGÖZ
IN PARTIAL FULFILLMENT OF THE REQUIREMENTS
FOR
THE DEGREE OF MASTER OF SCIENCE
IN
THE DEPARTMENT OF INFORMATION SYSTEMS
SEPTEMBER 2013
A USABILITY STUDY ON ELECTRONIC DOCUMENT MANAGEMENT
SYSTEM IN MIDDLE EAST TECHNICAL UNIVERSITY
Submitted by Alpay KARAGÖZ in partial fulfillment of the requirements for the
degree of Master of Science in the Department of Information Systems,
Middle East Technical University by,
Prof. Dr. Nazife Baykal ___________________
Director, Informatics Institute
Prof. Dr. Yasemin Yardımcı Çetin ___________________
Head of Department, Information Systems
Assoc. Prof. Dr. Sevgi Özkan Yıldırım ___________________
Supervisor, Information Systems, METU
Examining Committee Members
Prof. Dr. Kürşat Çağıltay ___________________
CEIT, METU
Assoc. Prof. Dr. Sevgi Özkan Yıldırım ___________________
IS, METU
Assist. Prof. Dr. Murat Perit Çakır ___________________
IS, METU
Assist. Prof. Dr. Pekin Erhan Eren ___________________
IS, METU
Assist. Prof. Dr. Banu Günel ___________________
IS, METU
Date: 03.09.2013
iii
I hereby declare that all information in this document has been obtained
and presented in accordance with academic rules and ethical conduct. I also
declare that, as required by these rules and conduct, I have fully cited and
referenced all material and results that are not original to this work.
Name, Last Name : ALPAY KARAGÖZ
Signature :
iv
ABSTRACT
A USABILITY STUDY ON ELECTRONIC DOCUMENT MANAGEMENT SYSTEM IN
MIDDLE EAST TECHNICAL UNIVERSITY
KARAGÖZ, Alpay
M.S., Department of Information Systems
Supervisor: Assoc. Prof. Dr. Sevgi Özkan Yıldırım
SEPTEMBER 2013, 150 pages
The development of information technologies (IT) in recent years has started to affect the
daily routines of the people. These technologies have changed the way that the things are
done. One of these technologies is Electronic Document Management System. Considering
the increasing amount of documents needed for the institutions, it could be said that there
was a need for a system to manage this complexity. However, usability of such technologies
depend on the people who would use the system. Usability problems of such systems and
websites have been an important topic for Human Computer Interaction. In this study,
usability tests were conducted about Middle East Technical University’s Electronic
Document Management System. The main purpose of this study is to conduct three-step
usability tests using eye tracker device and questionnaires and offer recommendations that
would refine the problematic issues by analyzing the obtained data. Several usability issues
were identified with the results of the study. Recommendations for further development were
offered based on the findings of the study. There were two main usability issues identified.
These issues were complexity and inconsistency of the system. For the solution of these
problems it is recommended that the home page of the system should be simplified and the
actions to be taken on a document should show consistency.

v
Keywords: Electronic Document Management System, Usability, Eye Tracking,
Human Computer Interaction

vi
ÖZ
ORTA DOĞU TEKNİK ÜNİVERSİTESİ ELEKTRONİK DOKÜMAN YÖNETİM
SİSTEMİ ÜZERİNE BİR KULLANILABİLİRLİK ÇALIŞMASI
KARAGÖZ, Alpay
Yüksek Lisans, Bilişim Sistemleri Bölümü
Tez Yöneticisi: Doç. Dr. Sevgi Özkan Yıldırım
EYLÜL 2013, 150 sayfa
Son yıllarda bilgi teknolojilerinin (BT) gelişmesi insanların günlük rutinlerini etkilemeye
başladı. Bu teknolojiler işlerin yapılış şeklini değiştirdi. Bu teknolojilerden biri de Elektronik
Doküman Yönetim Sistemi’dir. Kurumlar için gerekli belgelerin miktarındaki artışı göz
önünde bulundurursak bu karmaşıklığı yönetecek bir sisteme ihtiyaç duyulduğu söylenebilir.
Fakat bu tarz teknolojilerin kullanılabilirliği sistemi kullanan insanlara bağlı olmaktadır. Bu
tarz sistemlerin ve internet sitelerinin kullanılabilirlik problemleri İnsan Bilgisayar
Etkileşimi (İBE) için önemli bir konu olmuştur. Bu çalışmada, Orta Doğu Teknik
Üniversitesi Elektronik Doküman Yönetim Sistemi üzerine kullanılabilirlik çalışmaları
yürütülmüştür. Bu çalışmanın ana amacı EDYS için göz hareketlerini izleme cihazı ve
anketler kullanarak üç aşamalı kullanılabilirlik testleri uygulamak ve elde edilen verileri
inceleyerek problemli konuları düzeltmeye yarayacak tavsiyeler önermektir. Çalışmanın
sonuçları ile çeşitli kullanılabilirlik sorunları tespit edilmiştir. Çalışmanın bulguları temel
alınarak gelecekteki gelişmeler için tavsiyelerde bulunulmuştur. Belirlenen iki temel
kullanılabilirlik sorunu vardır. Bu sorunlar sistemin karmaşıklığı ve tutarsızlığıdır. Bu

vii
sorunların çözümü için sistemin ana sayfasının basitleştirilmesi ve bir evrak üzerinde
yapılacak işlemlerin tutarlı olması önerilmiştir.
Anahtar Kelimeler: Elektronik Doküman Yönetim Sistemi, Kullanılabilirlik, Göz
İzleme, İnsan Bilgisayar Etkileşimi
viii
DEDICATION
This thesis is dedicated to
My family
&
My beautiful fiancée
Ceren Leymun.
ix
ACKNOWLEDGEMENTS
First of all, I would like to thank and express my gratitude to my advisor Assoc.
Prof. Dr. Sevgi Özkan Yıldırım for her comments, suggestions, ideas and patience
through my thesis study.
I would like to thank my fiancée Ceren Leymun for her endless support and
motivation for everything in my life. Words can’t express my feelings for your
support, thank you so much for being with me under all circumstances.
My special thanks are for my family members Orhan Karagöz, Emine Karagöz and
Emrah Karagöz for their precious support and faith through each step of my life. I
will be grateful forever for your love, thank you so much.
I would like to express my appreciation to my colleagues Önder Çağlar and Yaver
Cansız for their great support and help for thesis writing process. They helpfully
shared their experiences with me.
I would also like to thank my colleagues Onur Ozan Koçak, Selim Yayla, Güldane
Öcal and Bahar Şengün for their patience, support and tolerance through the thesis
study. I’m very lucky to have such colleagues and good friends.
And my dear friends Esra Karataş and Ahmet Cemil Karataş deserve my gratitude
and thanks for their friendship and support. I’m proud of having friends like you.
I would like to thank to study subjects for participating in the system tests. Moreover,
special thanks to Oya Sertel for helping to analyze the test data for the first stage and
to Özge Alaçam and Nihan Ocak for their contribution for the preparation and
arrangement of the HCI Laboratory in METU Computer Center.
x
TABLE OF CONTENTS
ABSTRACT ................................................................................................................ iv
ÖZ ............................................................................................................................... vi
DEDICATION .......................................................................................................... viii
ACKNOWLEDGEMENTS ........................................................................................ ix
TABLE OF CONTENTS ............................................................................................. x
LIST OF TABLES ..................................................................................................... xv
LIST OF FIGURES ................................................................................................ xviii
CHAPTERS ................................................................................................................. 1
1 INTRODUCTION ................................................................................................ 1
1.1 Introduction ................................................................................................... 1
1.2 Background of the Problem ........................................................................... 1
1.3 Statement of the Problem .............................................................................. 2
1.4 Purpose of the Study ...................................................................................... 2
1.5 Significance of the Study .............................................................................. 2
1.6 Assumptions .................................................................................................. 3
1.7 Definitions of the Terms ................................................................................ 3
1.8 Summary ....................................................................................................... 3
1.8.1 Organization of the study ....................................................................... 3
2 LITERATURE REVIEW ..................................................................................... 4
2.1 Human Computer Interaction Concepts ........................................................ 4
2.1.1 User Interface ......................................................................................... 4
xi
2.1.2 Usability ................................................................................................. 5
2.1.3 Learnability ............................................................................................ 6
2.1.4 Flexibility ............................................................................................... 6
2.1.5 Robustness ............................................................................................. 7
2.1.6 Usability Testing .................................................................................... 7
2.1.7 Summative and Formative Evaluation ................................................... 8
2.1.8 Usability Testing Tasks .......................................................................... 8
2.2 Usability Evaluation Phases .......................................................................... 9
2.2.1 Phase 1: Identification of Evaluation Objectives ................................... 9
2.2.2 Phase 2: Sample Selection and Study Design ........................................ 9
2.2.3 Phase 3: Selection of Representative Experimental Tasks and Context 9
2.2.4 Phase 4: Selection of Background Questionnaires............................... 10
2.2.5 Phase 5: Selection of Evaluation Environment .................................... 10
2.2.6 Phase 6: Data Collection, Video Recording and Recording of Thought
Process 10
2.2.7 Phase7: Analysis of Process Data ........................................................ 11
2.2.8 Phase 8: Interpretation of Findings ...................................................... 11
2.2.9 Phase 9: Iterative Input into Design ..................................................... 12
2.3 Usability Evaluation Methods ..................................................................... 12
2.3.1 Interviews ............................................................................................. 12
2.3.2 Task Analysis ....................................................................................... 13
2.3.3 Think Aloud Method ............................................................................ 13
2.3.4 Eye Tracking Methodology.................................................................. 13
2.4 Usability Studies about Online Systems in Turkey ..................................... 14

xii
2.5 Electronic Document Management System ................................................ 15
2.5.1 The Usage of Electronic Document Management Systems ................. 16
3 METHODOLOGY ............................................................................................. 18
3.1 Research Questions ..................................................................................... 18
3.2 Design of the Study ..................................................................................... 19
3.3 Materials, Instruments and Software ........................................................... 19
3.3.1 Eye Tracking System ........................................................................... 19
3.3.2 Tobii Studio Software .......................................................................... 20
3.3.3 Electronic Document Management System (EDMS) .......................... 21
3.3.4 Questionnaires ...................................................................................... 22
3.4 Procedure ..................................................................................................... 23
3.4.1 Designing Test Environment................................................................ 23
3.4.2 Task Analysis ....................................................................................... 23
3.4.3 Eye Tracking Study .............................................................................. 30
4 Results ................................................................................................................. 32
4.1 Demographics .............................................................................................. 32
4.2 Pretest Questionnaire Results ...................................................................... 35
4.3 Posttest Questionnaire Results .................................................................... 35
4.3.1 System Experience (1 question) ........................................................... 35
4.3.2 General User Reaction (6 questions).................................................... 37
4.3.3 Appearance of the METU EDMS Pages (15 questions) ...................... 37
4.3.4 Terms Used in METU EDMS Pages (7 questions) .............................. 39
4.3.5 Learning System Usage (10 questions) ................................................ 40
4.4 Eye Tracking Results ................................................................................... 41
xiii
4.4.1 Eye Tracking Results for Managers ..................................................... 43
4.4.2 Eye Tracking Results for Personnel / Workers .................................... 64
4.5 Heat Maps and Gaze Plots ........................................................................... 96
4.6 Task Success Rate ....................................................................................... 99
4.6.1 Task Success Rate for Managers.......................................................... 99
4.6.2 Task Success Rate for Personnel / Workers ....................................... 101
4.6.3 The Effect of Gender and Educational Level on Task Success Rates
and Completion Time ....................................................................................... 102
4.7 Summary of Results .................................................................................. 109
5 DISCUSSION AND CONCLUSION .............................................................. 111
5.1 RQ 1. What are the most significant tasks performed by managers and
personnel on METU EDMS? ............................................................................... 112
5.2 RQ 2. Which usability issues are present on the current METU EDMS
interface with respect to the significant tasks? ..................................................... 112
5.2.1 RQ 2.1. What are the task success rates of the users for each task? .. 112
5.2.2 RQ 2.2. Which tasks are the most difficult for the users to accomplish?
What kinds of errors/problems do they experience when they were not able to
accomplish a task? ............................................................................................ 113
5.2.3 RQ 2.3. Is there a positive change in terms of using the system
effectively for the users of first and second stages who took the system test one
year ago? ........................................................................................................... 113
5.2.4 RQ 2.4. How long does it take for the users to complete each task? . 114
5.2.5 RQ 2.5. How many mouse clicks do the users execute to finalize each
task? 116
5.2.6 RQ 2.6. How long do the users stare at the task-related and non-task-
related areas?..................................................................................................... 117
5.2.7 RQ 2.7. How do the users evaluate the perceived usefulness of METU
EDMS? 118
xiv
5.2.8 RQ 2.8. What kind of interpretations do the users make about the
interface of METU EDMS? .............................................................................. 119
5.3 RQ 3. How can METU EDMS interface be developed in the light of
usability issues determined? ................................................................................. 120
5.4 Conclusion ................................................................................................. 120
5.5 Recommendations to Improve Usability of METU EDMS ...................... 121
5.5.1 Recommendations for the First Stage ................................................ 121
5.5.2 Recommendations for the Second and Third Stages.......................... 122
5.6 Limitations of the Study ............................................................................ 122
5.7 Contributions of the Study ........................................................................ 123
5.8 Future Studies ............................................................................................ 123
REFERENCES ......................................................................................................... 124
APPENDIX A: PRETEST QUESTIONNAIRE ...................................................... 130
ÇALIŞMA ÖNCESİ KATILIM ANKETİ ........................................................... 130
APPENDIX B .......................................................................................................... 132
ODTÜ EDYS Web Sayfası .................................................................................. 132
APPENDIX C .......................................................................................................... 136
TASK ANALYSIS RESULTS ............................................................................ 136
Tasks for Managers ........................................................................................... 136
Tasks for Personnel / Workers .......................................................................... 143
APPENDIX D .......................................................................................................... 148
TASKS FOR MANAGERS ................................................................................. 148
APPENDIX E .......................................................................................................... 149
TASKS FOR WORKERS / PERSONNEL .......................................................... 149

xv
LIST OF TABLES
Table 4.1 : General User Reaction Results for First Stage........................................ 37
Table 4.2: General User Reaction Results for Second Stage .................................... 37
Table 4.3: General User Reaction Results for Third Stage ....................................... 37
Table 4.4: Appearance of the METU EDMS Pages Results for First Stage ............. 38
Table 4.5: Appearance of the METU EDMS Pages Results for Second Stage ........ 38
Table 4.6: Appearance of the METU EDMS Pages Results for Third Stage ........... 39
Table 4.7: Terms Used in METU EDMS Pages Results for First Stage ................... 39
Table 4.8: Terms Used in METU EDMS Pages Results for Second Stage .............. 40
Table 4.9: Terms Used in METU EDMS Pages Results for Third Stage ................. 40
Table 4.10: Learning System Usage Results for First Stage ..................................... 40
Table 4.11: Learning System Usage Results for Second Stage ................................ 41
Table 4.12: Learning System Usage Results for Third Stage ................................... 41
Table 4.13: Ideal Completion Time of Managers ..................................................... 42
Table 4.14: Ideal Completion Time of Personnel ..................................................... 42
Table 4.15: Ideal Mouse Click Count of Managers .................................................. 43
Table 4.16: Ideal Mouse Click Count of Personnel .................................................. 43
Table 4.17: Task 1 Fixation Durations for First Stage .............................................. 46
Table 4.18: Task 1 Fixation Durations for Second Stage ......................................... 46
Table 4.19: Task 1 Fixation Durations for Third Stage ............................................ 47
Table 4.20: Task 2 Fixation Durations for First Stage .............................................. 50
Table 4.21: Task 2 Fixation Durations for Second Stage ......................................... 50

xvi
Table 4.22: Task 2 Fixation Durations for Third Stage ............................................ 51
Table 4.23: Task 3 Fixation Durations for First Stage .............................................. 54
Table 4.24: Task 3 Fixation Durations for Second Stage ......................................... 54
Table 4.25: Task 3 Fixation Durations for Third Stage ............................................ 55
Table 4.26: Task 4 Fixation Durations for First Stage .............................................. 58
Table 4.27: Task 4 Fixation Durations for Second Stage ......................................... 58
Table 4.28: Task 4 Fixation Durations for Third Stage ............................................ 58
Table 4.29: Task 5 Fixation Durations for First Stage ............................................. 62
Table 4.30: Task 5 Fixation Durations for Second Stage ......................................... 62
Table 4.31: Task 5 Fixation Durations for Third Stage ............................................ 62
Table 4.32: Task 1 Fixation Durations for First Stage .............................................. 66
Table 4.33: Task 1 Fixation Durations for Second Stage ......................................... 67
Table 4.34: Task 1 Fixation Durations for Third Stage ............................................ 67
Table 4.35: Task 2 Fixation Durations for First Stage ............................................. 71
Table 4.36: Task 2 Fixation Durations for Second Stage ......................................... 71
Table 4.37: Task 2 Fixation Durations for Third Stage ............................................ 72
Table 4.38: Task 3 Fixation Durations for First Stage ............................................. 76
Table 4.39: Task 3 Fixation Durations for Second Stage ......................................... 76
Table 4.40: Task 3 Fixation Durations for Third Stage ............................................ 77
Table 4.41: Task 4 Fixation Durations for First Stage .............................................. 81
Table 4.42: Task 4 Fixation Durations for Second Stage ......................................... 81
Table 4.43: Task 4 Fixation Durations for Third Stage ............................................ 82
Table 4.44: Task 5 Fixation Durations for First Stage .............................................. 85
Table 4.45: Task 5 Fixation Durations for Second Stage ........................................ 86
xvii
Table 4.46: Task 5 Fixation Durations for Third Stage ............................................ 86
Table 4.47: Task 6 Fixation Durations for First Stage .............................................. 89
Table 4.48: Task 6 Fixation Durations for Second Stage ......................................... 90
Table 4.49: Task 6 Fixation Durations for Third Stage ............................................ 90
Table 4.50: Task 7 Fixation Durations for First Stage .............................................. 94
Table 4.51: Task 7 Fixation Durations for Second Stage ......................................... 94
Table 4.52: Task 7 Fixation Durations for Third Stage ............................................ 95
Table 4.53: Task Success Rates of Managers for First Stage ................................. 100
Table 4.54: Task Success Rates of Managers for Second Stage ............................ 100
Table 4.55: Task Success Rates of Managers for Third Stage ................................ 100
Table 4.56: Task Success Rates of Personnel / Workers for First Stage ................ 101
Table 4.57: Task Success Rates of Personnel / Workers for Second Stage ............ 101
Table 4.58: Task Success Rates of Personnel / Workers for Third Stage ............... 102
Table 4.59: Average Completion Time Results of Managers for Each Stage Based
on Gender (Sec)........................................................................................................ 106
Table 4.60: Average Completion Time Results of Personnel for Each Stage Based
on Gender (Sec)........................................................................................................ 107
Table 4.61: Average Completion Time Results of Managers for Each Stage Based
on Educational Level................................................................................................ 108
Table 4.62: Average Completion Time Results of Personnel for Each Stage Based
on Educational Level................................................................................................ 109
xviii
LIST OF FIGURES
Figure 3.1: TOBII T120 Device in METU HCI Lab ................................................ 20
Figure 3.2: TOBII Studio Software (Version 3.1.3) Interface .................................. 21
Figure 3.3: Home Page of METU EDMS ................................................................. 25
Figure 4.1: Age Distribution of Participants for Each Stage .................................... 32
Figure 4.2: Gender Distribution of Participants for Each Stage ............................... 33
Figure 4.3: Education Level Distribution of Participants for Each Stage ................. 34
Figure 4.4: Administrative Duties of Participants for Each Stage ............................ 34
Figure 4.5: Frequency of System Visits of Participants for First and Second Stages
.................................................................................................................................... 36
Figure 4.6: Frequency of System Visits of Participants for Third Stage .................. 36
Figure 4.7: Task 1 Completion Time Graph for Managers ....................................... 44
Figure 4.8: Task 1 Mouse Clicks for Managers ........................................................ 45
Figure 4.9: Areas of Interest for Task 1 .................................................................... 45
Figure 4.10: Total Fixation Durations and Fixation Counts Percentages of Task 1 . 47
Figure 4.11: Task 2 Completion Time Graph for Managers..................................... 48
Figure 4.12: Task 2 Mouse Clicks for Managers ...................................................... 49
Figure 4.13: Areas of Interest for Task 2 .................................................................. 50
Figure 4.14: Total Fixation Durations and Fixation Counts Percentages of Task 2 . 51
Figure 4.15: Task 3 Completion Time Graph for Managers..................................... 52
Figure 4.16: Task 3 Mouse Clicks for Managers ...................................................... 53
Figure 4.17: Areas of Interest for Task 3 ................................................................. 54
xix
Figure 4.18: Total Fixation Durations and Fixation Counts Percentages of Task 3 . 55
Figure 4.19: Task 4 Completion Time Graph for Managers..................................... 56
Figure 4.20: Task 4 Mouse Clicks for Managers ..................................................... 57
Figure 4.21: Areas of Interest for Task 4 .................................................................. 57
Figure 4.22: Total Fixation Durations and Fixation Counts Percentages of Task 4 . 59
Figure 4.23: Task 5 Completion Time Graph for Managers..................................... 60
Figure 4.24: Task 5 Mouse Clicks for Managers ...................................................... 61
Figure 4.25: Areas of Interest for Task 5 .................................................................. 61
Figure 4.26: Total Fixation Durations and Fixation Counts Percentages of Task 5 . 63
Figure 4.27: Task 1 Completion Time Graph for Personnel / Workers .................... 64
Figure 4.28: Task 1 Mouse Clicks for Personnel / Workers ..................................... 65
Figure 4.29: Areas of Interest for Task 1 ................................................................. 66
Figure 4.30: Total Fixation Durations and Fixation Counts Percentages of Task 1 . 68
Figure 4.31: Task 2 Completion Time Graph for Personnel / Workers .................... 69
Figure 4.32: Task 2 Mouse Clicks for Personnel / Workers ..................................... 70
Figure 4.33: Areas of Interest for Task 2 .................................................................. 70
Figure 4.34: Total Fixation Durations and Fixation Counts Percentages of Task 2 . 72
Figure 4.35: Task 3 Completion Time Graph for Personnel / Workers .................... 74
Figure 4.36: Task 3 Mouse Clicks for Personnel / Workers ..................................... 74
Figure 4.37: Areas of Interest for Task 3 .................................................................. 75
Figure 4.38: Total Fixation Durations and Fixation Counts Percentages of Task 3 . 77
Figure 4.39: Task 4 Completion Time Graph for Personnel / Workers .................... 79
Figure 4.40: Task 4 Mouse Clicks for Personnel / Workers ..................................... 79
Figure 4.41: Areas of Interest for Task 4 .................................................................. 80
xx
Figure 4.42: Total Fixation Durations and Fixation Counts Percentages of Task 4 . 82
Figure 4.43: Task 5 Completion Time Graph for Personnel / Workers .................... 84
Figure 4.44: Task 5 Mouse Clicks for Personnel / Workers ..................................... 84
Figure 4.45: Areas of Interest for Task 5 .................................................................. 85
Figure 4.46: Total Fixation Durations and Fixation Counts Percentages of Task 5 . 87
Figure 4.47: Task 6 Completion Time Graph for Personnel / Workers .................... 88
Figure 4.48: Task 6 Mouse Clicks for Personnel / Workers ..................................... 88
Figure 4.49: Areas of Interest for Task 6 .................................................................. 89
Figure 4.50: Total Fixation Durations and Fixation Counts Percentages of Task 6 . 91
Figure 4.51: Task 7 Completion Time Graph for Personnel / Workers .................... 92
Figure 4.52: Task 7 Mouse Clicks for Personnel / Workers ..................................... 93
Figure 4.53: Areas of Interest for Task 7 .................................................................. 93
Figure 4.54: Total Fixation Durations and Fixation Counts Percentages of Task 7 . 95
Figure 4.55: Heat Map of Task 1 (Assigning Delegation) ........................................ 96
Figure 4.56: Gaze Plot of Task 1 (Assigning Delegation) ........................................ 97
Figure 4.57: Heat Map of Task 5 for Managers and Task 7 for Workers (Finding
Help Menus) ............................................................................................................... 98
Figure 4.58: Gaze Plot of Task 5 for Managers and Task 7 for Workers (Finding
Help Menus) ............................................................................................................... 99
Figure 4.59: Task Success Rates of Managers for Each Stage ............................... 103
Figure 4.60: Task Success Rates of Personnel for Each Stage ............................... 103
Figure 4.61: Task Success Rates of Managers for Each Stage Based on Educational
Level ......................................................................................................................... 104
Figure 4.62: Task Success Rates of Personnel for Each Stage Based on Educational
Level ......................................................................................................................... 105
xxi
Figure 5.1: Average Completion Time of Managers for Each Task (Sec) ............. 115
Figure 5.2: Average Completion Time of Personnel for Each Task (Sec) ............. 115
Figure 5.3: Average Mouse Clicks of Managers for Each Task ............................. 116
Figure 5.4: Average Mouse Clicks of Personnel for Each Task ............................. 117
Figure C.0.1: Steps of Completin Task 1 (First way) ............................................. 137
Figure C.0.2: Steps of Completing Task1 (Second way) ........................................ 138
Figure C.0.3: Steps of Completing Task 2 ............................................................. 139
Figure C.0.4: Steps of Completing Task 3 ............................................................. 140
Figure C.0.5: Steps of Completing Task 4 ............................................................. 141
Figure C.0.6: Steps of Completing Task 5 (First way) ........................................... 142
Figure C.0.7: Steps of Completing Task 5 (Second way) ...................................... 142
Figure C.0.8: Steps of Completing Task 2 ............................................................. 143
Figure C.0.9: Steps of Completing Task 3 ............................................................. 144
Figure C.0.10: Steps of Completing Task 4 ........................................................... 145
Figure C.0.11: Steps of Completing Task 5 ............................................................ 146
Figure C.0.12: Steps of Completing Task 6 ........................................................... 147

1
CHAPTERS
CHAPTER 1
1 INTRODUCTION
1.1 Introduction
The development of information technology (IT) in recent years has started to affect the
daily routines of the people. These technologies have changed the way that the things are
done. One of these technologies is electronic document management systems (EDMS).
Applying new technologies like EDMS to make the life easier for people is important.
However, the effectiveness and usefulness of such technologies depend on the people who
would use the system. Moreover, usability problems of such systems and websites have been
an important topic for Human Computer Interaction (HCI).
1.2 Background of the Problem
International Organization for Standardization (ISO) defines usability as “the extent to which
the product can be used by specified users to achieve specified goals with effectiveness,
efficiency and satisfaction in a specified context of use” (ISO 9241-11). As it can be
understood from this definition effectiveness, efficiency and satisfaction are important terms
for usability context. In addition to these terms, simplicity, ease of use and predictability are
some other important concepts for usability as Nielsen (2000) offered. All of these terms are
taken into account during usability tests. When a formal usability test is applied, the users
who test the system are observed while trying to achieve the given tasks (Battleson, Booth &
Weintrop, 2001).
Different methods of usability tests show the importance of integration for usability concept
in the institutions. People who have management and administrative duties in these
institutions can support the system used but they might not have the chance to decide about
the design of the system (Gulliksen, Boivie & Goransson, 2006). Even if Nielsen’s 10
usability heuristics (Nielsen, 1994) is helpful to evaluate the systems which work on web,
usability tests about the design of the website with the real users provide important findings.
Usability of a system together with the aesthetics issues affects users’ preferences (Lee &
Koubek, 2010). Therefore, usability should be assessed carefully while considering the
system design process (Kay, 2009). Another aspect of the usability concept could be the type
of the users. Being a novice or expert user affects the evaluation of the system but in our
context it is difficult to categorize the system user based on their system knowledge because
there are potential thousands of users in the campus and most of them have been using the
system more than a year.
2
The effectiveness and usefulness of such technologies depend on the people who would use
the system. Therefore, the users play an important role for the system. Considering the users
for such a system working online like EDMS, it could be said that providing feedback to the
users is an important issue (Dutta, Jarvenpaa & Tomak, 2003). Error messages can be
perceived as one way of giving feedback to the users. Therefore, these error messages are
supposed to be correct and appropriate for the related situation. Moreover, the error
messages should guide the user so that the user should be able to solve the problem.
Furthermore, consistency of an electronic document management system is an important
feature. The system should be consistent through all the pages it has (Nielsen, 1992). If the
system is not consistent within itself, it would make the users confused and they would not
feel comfortable with the system. The users should be informed about where they are in the
system as it was stated in one of the Nielsen’s Heuristics (Nielsen, 1994). Considering the
points stated above, the thesis aims to show the general usability picture of EDMS through
the usability tests which have three stages and draw conclusions using the analyzed data via
eye tracker records and questionnaires.
1.3 Statement of the Problem
Different kinds of technologies have been developed and applied in recent years. Middle
East Technical University (METU) has introduced a new technology recently, electronic
document management system (EDMS), for the academic and administrative to reduce the
costs and the risk associated with the paper records management. The attitude and the
resistance of the end users toward new technologies have been the subject to many studies.
New approaches need to be found for the users to make them contribute more to the system.
Moreover, the benefits of EDMS would develop when the users know and learn how to use
the new technology. Therefore, there is a need to conduct usability tests for EDMS used in
METU so as to understand the usability problems of the system and make the necessary
changes to the system based on the data collected by the tests and users’ questionnaires.
1.4 Purpose of the Study
New technologies are being applied in universities in order to facilitate the daily routines.
The main purpose of this study is to conduct a three-step usability tests using eye tracker and
questionnaires for the EDMS and analyze the obtained data in order to offer
recommendations and refine the problematic issues.
1.5 Significance of the Study
There have been several studies attempting to identify the usability problems of the websites
and systems like EDMS for new technologies. However, one important reason for this study
is that examining and testing the EDMS will help METU understand the problematic
usability issues with the current system. Moreover, this study will help to revise these
problematic points by the administrators and designers of the EDMS. Furthermore, the
administrators of EDMS in METU will be able to find valuable information about what
kinds of factors related with the design of the system or components prevent the users from
using the system more effectively.
3
1.6 Assumptions
For this study, following assumptions are made:
1. The participants will answer correctly to all measures which will be used in the
study.
2. Reliability and validity of all measures of the study are accurate to let accurate
assumptions be measured.
3. The data which will be collected during the study will be accurately analyzed.
1.7 Definitions of the Terms
Electronic document management (EDM): Sprague (1995) defines EDM as ‗the
application of technology to save paper, speed up communications, and increase the
productivity of business processes.
Usability: The extent to which the product can be used by specified users to achieve
specified goals with effectiveness, efficiency and satisfaction in a specified context of use.
Information technology (IT): The development, installation, and implementation of
computer systems and applications.
Human computer interaction (HCI): A discipline concerned with the study, design,
construction and implementation of human-centric interactive computer systems.
1.8 Summary
1.8.1 Organization of the study
Chapter 1 of the study includes the introduction, the background of the study, the statement
of the problem, the purpose of the study, the significance of the study, the definitions of
terms, the assumptions, limitations and organization of the study.
Chapter 2 contains the review of the literature related with the human computer interaction
(HCI). The literature review in this chapter is explained considering the historical progress of
HCI. Then, it continues with the definitions of fundamental terms in association with the
HCI and usability. Moreover, this chapter includes the stages of usability evaluation, the
information about the usability techniques that will be used for the usability tests and a
review of similar studies applied to different kinds of systems.
Chapter 3 contains information about the research questions, design of the study, instruments
of the study, procedures of the study, participants and sampling, and analysis of data. The
results of the data obtained are presented in Chapter 4. Chapter 5 contains the discussion of
the results and the conclusion parts together with the recommendations for further
improvement.
4
CHAPTER 2
2 LITERATURE REVIEW
Baker, Greenberg, and Gutwin, (2002) define Human–Computer Interaction (HCI) as the
study, planning, as well as design of the interaction existing between individuals and
computers. In a number of cases, it is considered as the connection of behavioral science,
computer science, design and other study fields (Diaper & Sanger, 2006). Dix, Finlay,
Abowd and Beale (1993), on the other hand, refer to human computer interaction as a
discipline that deals with designing, assessing and implementing interactive computer
systems for the use of humans.
From the perspective of computer scientists, the emphasis is on the interaction between
humans, as well as computational machines. Since human–computer interaction involves the
study of the combination of human beings and machines, the knowledge that supports it is
drawn on the side of humans, as well as machines. On the side of machines, some of the
techniques that are involved include operating systems, computer graphics, programming
languages and development environments (Dey, 2001). Additionally, on the side of the
humans some of the areas that are relevant include linguistics, communication theory,
cognitive psychology, industrial design and human factors like computer user satisfaction. In
addition, design methods and engineering designs are also very relevant in this field of study.
Karam and Schraefel (2005) state that HCI is multidisciplinary in nature. Therefore
individuals with diverse backgrounds are able of contributing to its success. In some cases,
HCI is called as computer-human interaction (CHI) or man–machine interaction (MMI).
2.1 Human Computer Interaction Concepts
2.1.1 User Interface
Shneiderman and Ben (2003) define user interface as the point where the interaction between
the computer and the human takes place. It is aimed that there is effective control and
operation of the computer by the end user and effective feedback from the computer is
provided. This will significantly help the operator when operational decisions are being
made. The design considerations that can be applied in the creation of user interfaces are
linked to disciplines such as psychology and ergonomics.
Strijbos, Martens, Prins and Jochems, (2006) on the other hand, define the user interface as
the system through which individuals (users) interact with computers. The user interface
entails software, and hardware elements. Additionally, various systems use the user
interfaces. They offer means of inputting that makes the use be able to influence the system
and outputting that enables the system to illustrate the effects of manipulation by the user.
5
The aim of human-machine interaction engineering is to create a user interface that makes it
efficient, enjoyable and easy in order to interact with the computer. Moreover, the desired
results should be achieved with the help of this interaction. This generally implies that there
is a need for the user to offer minimal input in order to attain the output that is desired. The
machine should also minimize the possible outputs that are not desired (Wald, 2005).
Savidis and Stephanidis (2006) define human–computer interface as the communication
point between the computer and the human user. Information flow between the computer and
the human is referred to as interaction loop. There are several aspects of the loop of
interaction. These include;
i. The task environment, which entails goals and conditions that are set on the user.
ii. Machine environment, which refers to the environment to which the computer is
connected
iii. Interface area: areas that are not overlapping. It involves the processes of the
computer and the human that does not pertain to their relation.
iv. Input flow: refers to the information flow that commences within the task
environment, where the user completes tasks.
v. Output: refers to information flow originating within the machine environment.
vi. Feedback: refers to the loops within the interface. It includes evaluating,
moderating, and confirming processes when they flow from the human via the
interface up to the computer and back (Daniels, 1992; Raskin, 2000).
2.1.2 Usability
Faconti (1996) considers user interfaces as the prime element of computer user satisfaction.
The user interface influences the effort needed by the user in order to provide input to the
system. Besides, it influences the efforts needed for the interpretation of the output provided
by the system. Additionally, it affects the efforts needed to comprehend how this is done.
Wild and Johnson (2004) define usability as the extent to which the user interface design
takes the human psychology and physiology into consideration. Baker, Greenberg, and
Gutwin (2002) define it as the degree to which the user interface makes it effective, efficient
and satisfying to use the system’s process.
Usability is majorly a feature of the user interface; however, it is also linked to the
functionalities of the process and the product to design it. Additionally, usability describes
how sound a given product may be applied for its projected purpose by its ultimate users
with effectiveness, efficiency, as well as satisfaction (Baker, Greenberg & Gutwin, 2002).
Diaper and Sanger (2006) state that usability involves techniques with which usability can be
measured such as need analysis. It also entails studying the principles behind the elegance or
efficiency of the human computer interaction. In computer science, as well as human-
computer interaction, usability studies the clarity and elegance with which the relation with a
computer program is designed (Dix et al., 1993). Usability is different from the satisfaction
of the user, as well as the experience of the user since usability also takes usefulness into
consideration.
There are a number of principles of usability design. The three major ones include
learnability which refers to the ease with which HCI can be learnt, flexibility which refers to
the several ways through which the HCI can be interacted with and the third major principle
6
of human computer interaction is robustness which refers to the level of support for the
handling of errors.
2.1.3 Learnability
Learnability entails the following concepts:
Predictability: the application ought to produce results, which are in line with the pervious
commands, as well as states. Predictability entails being aware of the present state or every
previous orders and states only. Predictability makes it very easy for users to know whether
they are able to predicate the system’s result from the history of the system (Karam &
Schraefel, 2005).
Synthesizability: it entails exploring whether the user of the product is capable of
constructing the right model for the system. Besides, it explores whether the system displays
the right signs for the construction of proper models (Kligyte, 2001).
Familiarity: it entails exploring whether new users are capable of getting good clues in
order to use the system properly. Because of the creative use of WIMPI, as well as
metaphors, users who are native are always capable of using the applications without having
to study (Lindgaard et al., 2006).
Generalizability: it entails exploring whether the user is capable of guessing the working of
new commands.
Consistency on the other hand, entails exploring whether the operation performs alike for
similar inputs.
2.1.4 Flexibility
Flexibility on the contrary entails the following:
Dialog initiative: This entails assessing whether the dialog boxes are capable of holding the
users as prisoners. The old dialogue boxes, which were modal, barred the users from
interrelating with other system’s parts referred to as system pre-emptive. On the other hand,
modern dialog boxes are generally user pre-emptive.
Multi-threading: it entails establishing whether the user is capable of performing
simultaneous tasks. The tasks in question symbolize threads, whereas multi-threading allows
the user to execute simultaneous tasks (Macleod, 1994).
Task migratability entails establishing whether the user is capable of performing the given
task. It also entails establishing whether the user is capable of controlling the tasks that are
automated by the computer.
Subsitutivity: it entails establishing whether a command’s output can be embodied
differently.

7
Customizability entails establishing whether the user is capable of modifying the interface
to enhance efficiency. It also entails establishing whether the customizing features can easily
be accessed.
2.1.5 Robustness
Robustness contains the following concepts:
Observability entails exploring whether the user is capable of evaluating the application’s
state.
Recoverability: involves exploring whether the occurrence of mistakes that are made by the
user can be corrected. It also entails assessing whether mistakes made by the application
failure can make the user recover the task.
Responsiveness on the other hand, entails exploring whether the system always responds at
the right time.
Task conformance entails exploring whether the system carries out every tasks needed by
the user. The application ought to cover every domain tasks (Cory & Hessler, 1994).
2.1.6 Usability Testing
A significant element of design processes that is user centered is the integration of usability
testing when the system is being designed and evaluated or when the interface is being
developed. Lipponen (2002) defines usability as the simplicity of information technology.
Useful information technologies have to be helpful, functional, and can easily be learnt by
humans.
Maxwell (2001) states that there are various need for usability testing. For instance, it
demonstrates the weakness and strengths of the design process. Usability testing entails
collection of data, which may be applied in order to redesign and enhance the interface. As
Myers (1998) on the other side notes, it is vital since it helps in the evaluation of the design,
as well as the specific features of the system. For instance, HCI workers might test whether
users like a menu interface or command line.
Nemirovsky (2003) states that usability is very important in order to assess the functionality
of a system for a specific group of users. Additionally, it is beneficial in validating the
efficiency, as well as the effectiveness of the system, together with probable productivity
gains. On the same note, usability testing provides the designers of the system with the
outcome on user satisfaction. Likewise, errors, as well as mistakes can easily be identified
within the systems design (Brewster, 2002; Eastwood, 1993).
Usability workers iteratively and systematically test every element of the system in order to
enhance the design of the systems. Usability testing is a significant part of iterative design
method. In a number of cases, systems are tested in order to check whether they meet the
goals of the users and to communicate the results to the user concerning the actions they
have taken (Nielsen, 1994). A number of the accidents that takes place within the industry
occur because information technologies are poorly designed. It is aimed that usability testing
8
identifies the problems that the users of the system may encounter while using it. Besides, it
ensures that users provide beneficial feedback to the designers of the system. The system’s
performance is evaluated with the help of the usability tests’ data (Oulasvirta & Tamminen,
2004).
2.1.7 Summative and Formative Evaluation
Preece, Rogers, Benyon, Holland and Carey (1994) state that usability testing may take place
at any time of the design process, whereas user testing ought to be conducted early enough
and in a number of cases with the real users of the systems. There are numerous terms and
approaches that relate to user testing. Formative evaluation is the first one. It takes place in
order to help the designers of IT in refining and forming their designs. During the design
processes, specific problems may be identified. The stage of formative evaluation may entail
a session where users are allowed to verbalize their questions, thoughts, as well as choices to
the assessor. In a number of cases, evaluation is highly likely to be conducted individually
with straight observation. On the same note, audio or video recording of the interactions of
the user may be conducted (Preece, et al, 1994).
Summative evaluation on the other hand, is applied after usability testing. The complete
impact and effectiveness of the given system are reviewed. This might entail a test between a
numbers of alternatives. Additionally, statistical differences between the features might be
compared and summarized, and evaluation may be done remotely (Savidis & Stephanidis,
2006).
Alpha Testing is in a number of cases an internal testing. The prototype that is developed is
assessed by the internal users. Beta Testing on the other hand, is often available for the
external users, besides the model is assessed by the external users (Shneiderman, 1998).
2.1.8 Usability Testing Tasks
Strijbos et al., (2006) states that usability testing tasks entails the analysis of the interaction
that exists between the user and the system, for instance, the interaction of the user and
keystrokes movements of the eye, history , as well as user patterns.
Another usability-testing task is measuring the time taken by users for every given task, their
rates of error, as well as their satisfaction levels with the system. Additionally, it entails
recording the interactions of the user with the system through audio taping, paper forms, or
through videotaping in order to assess the errors, problems, as well as interaction
effectiveness of the user. Besides, the other task involves surveying the users using an
interview, questionnaire concerning their levels of satisfaction with the given system (Wald,
2005; Medlock, Wixon, Terrano, Romero & Fulton, 2002).
Usability testing entails ethical concerns of showing respect to the user's physical and mental
well-being, as well as privacy. The assessing workers have to get the volunteer participant’
consents before commencing usability testing. Additionally, usability workers should never
be biased during the process (Wild & Johnson, 2004).
9
2.2 Usability Evaluation Phases
Usability evaluation is a process entailing a number of activities detailed below. Usability
evaluation requires some stages to be followed (Kushniruk & Patel, 2004). This section
provides information about these stages.
2.2.1 Phase 1: Identification of Evaluation Objectives
This phase entails the definition of the purpose, goals, as well as the aims of the user
evaluation. It is undoubtedly one of the highly significant steps within the whole process. It
states why, what, and how an individual intends to apply the usability study in order to attain
the goals. It is very significant, as it makes sure that the intended questions are addressed.
Besides, it makes it very easy for additional insights to be gained (Bratthall & Jorgensen,
2002).
Usability evaluation is relevant at every stage of the user interface life cycle (like design,
redesign or implementation). In this stage, user interface requirements are detailed. Besides,
the design alternatives are evaluated. The specific usability problems are also detailed. The
evaluator has to specify the usability evaluation goals at the beginning of the study clearly
(Brewster, 2002).
2.2.2 Phase 2: Sample Selection and Study Design
Technicians ought to be selected in order to offer enough sample of the given group, which
will be applying the manual. The background of the technicians ought to be described. It
should have pertinent information like levels of experience, education job functions, as well
as skills. The vital differences between technicians ought to be established before selecting
the participants to be tested (Abowd et al., 1999).
Participants ought to be selected carefully in order to reflect the wide array of characteristics
that were determined during the evaluation of the target audience. Additionally, the kinds of
the characteristics of the technician needed will depend on the kind of task to be assessed
(Dey, 2001; Crockett, 1993).
2.2.3 Phase 3: Selection of Representative Experimental Tasks and Context
After the completion of the previously stages, there is need for the evaluator to design
experiments aimed at gathering usability data. Specifically, there is need for the evaluator to
choose participant’s number (users and evaluators), the procedure for evaluation, as well as
the system and environment setup. The kinds of experiments are dependent on the method of
evaluation. Experiments might entail the accomplishment of tasks in a controlled way,
providing response to specified questions, as well as comparing optional designs. In this
phase, the evaluator should carry out pilot runs (Dix, Finlay, Abowd & Beale, 2003). The
application of experiments in order to establish usability is beneficial. Experimenters should
study users from the target audience whereas the users should conduct representative tasks
through the use of prototype or a product.
Every objective of usability test ought to be elucidated prior to the actual testing. When there
are very clear objectives, the developers of the product will be able to select the test
10
methods, test participants, as well as user tasks, which are highly suited to look into the
questions or objectives of interest.
2.2.4 Phase 4: Selection of Background Questionnaires
The questionnaires should be designed in order to detail some if the desired outcomes of the
evaluation. It contains the various questions that will be administered to the respondents in
order to obtain information that concerns the evaluation. It is also very significant, as it
makes sure that the intended questions are addressed. Besides, it makes it very easy for
additional insights to be gained (Goodman, Brewster & Gray, 2004).
Additionally, the background questionnaires are designed in order to evaluate prior
knowledge of the participants concerning the product prior to the test, the backgrounds, as
well as their initial impressions with the given product.
Background questionnaire offers historical information concerning the participants. It helps
in making individuals to comprehend the behavior as well as the performance of the
participants during the test. It is made up of questions, which disclose the attitudes,
experience and preferences of the participants in the areas which may influence their
performance. For instance, when an individual is testing a DBMS, it will be beneficial to
know whether the pa DBMS has been used by the participants before, and, if they have used
it, which DBMS and the length of time they have used it. Whereas individuals might not
know whether that experience will influence their performance positively or negatively, they
almost surely know that it is capable of influencing their performance in a different way than
an individual without the experience of a DBMS.
The background questionnaire is usually filled out before the test. In some cases, majorly
when it is very long, it may be sent to participants via e-mail before the usability test is
conducted.
2.2.5 Phase 5: Selection of Evaluation Environment
The selection of the evaluation environment is also a very crucial phase of the evaluation
process. A given interface might be planned for a bigger user community; however, it is
significant to determine user characteristics that are highly applicable for the evaluation and
for the user interface aspects (Kjeldskov, Skov, Als & Hoegh, 2004). Together with the user,
as well as task analysis, there is the need for third analysis like proper comprehension of the
environments of the user such as the social, physical, cultural and technological
environments.
The evaluation environment ought to represent the bigger user community. A given interface
might be proposed for the bigger user community; however, it is significant to establish the
user characteristics that are highly applicable for the given study, as well as for the user
interface aspects in specific. When users are entailed in the study, they should represent the
bigger user community (Kjeldskov et al., 2005).
2.2.6 Phase 6: Data Collection, Video Recording and Recording of Thought Process
Data collection is done using various methods like video recording, as well as recording of
data during the thought process. The collected data can then be evaluated and analyzed at
later stages (Kim, Kim, Lee, Chae & Choi, 2002).
11
Equipment like audio and video recorders, cameras, and video feeds may be applied in
monitoring the comments and actions of participants when testing the usability. Cameras
may be used in order to record participants’ actions.
Equipment for videotaping without camera may be applied in monitoring the tasks that are
performed on computer.
Test monitors may see all interactions of the user; they can observe onscreen events.
Through cameraless videotaping, onscreen information can be captured. However, it leaves
the participants of the test out of the picture. This method is advantageous since participants
of the test are usually less self-conscious or more comfortable when no camera is aimed at
them. Besides, in comparison to camera recording, camera less videotaping is less expensive
since it does not need cameras as well as camera operators.
Audio recorders assist the researcher during interviews in recording the comments of test
participants during the usability test. Through audio recorders, test monitors are enabled to
pay attention on several other observational tasks rather than noting down comments.
2.2.7 Phase7: Analysis of Process Data
The major aim of the analysis of usability data is to ensure that results are summarized. This
summarization might involve statistical tools founded on the usability evaluation goals. It
might also involve the creation of a list detailing the exact usability problems. Actual
interpretation of the study’s results forms a major element of the evaluation. It involves the
use of the data in order to come up with conclusions as guided by the goals of evaluation.
For instance, it might imply making the conclusion that a design is superior to another. It can
also state whether usability needs are met (Kim et al., 2002).
Besides, it entails the identification of participation errors as well as the difficulties that the
participants faced with. It also helps to analyze the origin of errors and difficulties. The
origin could be related with the technical sources, procedural sources, grammatical sources
and graphical sources. The identification of the corrective action to be taken on the
difficulties, as well as the errors. Besides, the phase entails prioritization of problems
through criticality. They can be prioritized as severe, unusable, moderate irritant among
others. In addition, the phase involves the analysis of the differences that exist between the
levels of experiences of the participants (Kim et al., 2002).
2.2.8 Phase 8: Interpretation of Findings
Communication and interpretation of findings fall among the last stages of the evaluation
process. They also form part of the most important stages of the evaluation process. It entails
communicating the results to the concerned stakeholders and interpreting the findings to
them. The results may be presented by the evaluator through the use graphs, as well as
providing the severity ratings for actions to be made (Kim et al., 2002).
Data analysis entails transforming raw quantitative and qualitative data into summative
results which can be applied in to making recommendations that may be used to enhance the
product’s usability. Interpretation of findings makes it very easy for the stakeholders to
understand the results of the entire process. Interpretation of data is done in order to
12
comprehend the findings, and to know the problems that the tested product may have.
Researchers are able to interpret data by reporting the things that they established in the
study.
2.2.9 Phase 9: Iterative Input into Design
This is the last phase of the process. It enables designers to note usability issues which may
be experienced before the user interface is put into use. It is very difficult to design a
faultless user interfaces in one single attempt. Therefore, this process is vital.
1. The archetypal iterative design phases in user interfaces include:
2. Completing the original interface design
3. Presenting the design to numerous test users
4. Noting the problems experienced by the test user
5. Refining the interface in order to account fix the noted problems
6. Repeating steps until all the problems are solved.
This phase is highly beneficial since it makes sure that the produced product is the best.
When effectively conducted, it can make significantly save on costs. Several other benefits
that are associated with this phase are as follows:
1. Misunderstandings are revealed in the early stages of the lifecycle when they can
easily be responded to
2. It provides room for user feedback thereby making the users to bring out the real
requirements of the system.
3. Continuous, iterative testing ensures that there is objective assessment of the status
of the project.
4. Discrepancies among designs, requirements as well as implementations will be
detected early.
2.3 Usability Evaluation Methods
2.3.1 Interviews
Interviews entail finding about the experiences, as well as the expectations of users through
conducting of interviews. Through this method, questions are formulated, and they are asked
to obtain the desired information. During the interviews, questions are read as the user
responds verbally. The responses are then recorded by the interviewer. Two types of
interviews may be used. These include structured interviewing and unstructured interviewing
(Card, Moran, & Newell, 1983).
With unstructured interviewing, methods are applied during the initial phases of usability
evaluation. At this stage, the investigator is aimed at gathering much information concerning
the experience of the user. With unstructured interviewing, interviewers do not have fixed
agendas. On the same note, the interviewer does not look at any specific element of the
system. The major aim is to get information on the procedures that are adopted by the users,
as well as information concerning what they expect from the system (Gould & Lewis, 1985).
On the other hand, structured interviews have predetermined and specific agenda.
Additionally, they have given set of questions aimed at guiding and directing the interview.

13
Structured interviews are more interrogations than the unstructured interviewing that is very
close to a conversation (Kim et al., 2002).
There are advantages and disadvantages of using interviews. For instance, it is capable of
enhancing the relations with the customers. Besides, it is very applicable when detailed
information is being explored. On the same note, it entails very few participants. On the
contrary, interviews cannot be carried out remotely. In addition, the usability issue of
efficiency is not addressed (Tognazzini, 1992).
2.3.2 Task Analysis
Task analysis refers to learning more about the goals of users, as well as their manners of
working. Through task analysis, individuals are able to establish the tasks that they are
supposed to do to accomplish given goals. Additionally, it entails the steps that users have to
take in order to accomplish the tasks.
Task analysis assesses the cognitive processes or the actions of users that are aimed at
accomplishing a given task. A thorough task analysis is conducted in order to comprehend
the present system and the flow of information within it. The flow of information is
significant in the maintaining the existing system and it has to be integrated or substituted
with new systems. With task analysis, it is very possible to allocate and design tasks properly
in the new system. In addition, the function that is to be put within the system, as well as
within the user interface may then be specified accurately. Tasks analysis is beneficial since
it offers knowledge of the various tasks the user intends to perform. Therefore, through it,
functions, as well as the features of the systems can be established.
2.3.3 Think Aloud Method
Through this method, the participants in through tests convey their opinion concerning the
given application as they execute the set tasks. It also has its advantages, as well as its
disadvantages. For instance, it is less expensive, and besides, the results are very near to
what others experience. On the other hand, the surrounding may not be ordinary to the user
(Lund, 1997).
The Think aloud protocol is a technique of collecting data, which is applied in psychology,
as well as usability studies. It entails obtaining a user to express their thinking processes
while performing a given task. In a number of cases, instructors are always present in order
to encourage the user to be extra vocal in work. The technique is vital in indicating
problems. Besides, it is comparatively simple to establish. Additionally, it is capable of
providing insight into the attitude of the user (Medlock et al., 2002).
2.3.4 Eye Tracking Methodology
Eye tracking methodology is a tool whereby the eye movements of individuals are measured
for the researcher to know where an individual is looking at a given time. Through it, the
researcher is also capable of knowing the progression in which the eyes shift from a location
to the other. When the eyes of individuals are tracked by HCI researchers, they will be able
to comprehend visual, as well as information processing that are display-based. Besides,
14
through eye tracking, HCI researchers are able to understand the factors that are capable of
influencing system interfaces’ usability (Kuniavsky, 2003). Moreover, eye-movement
recordings are capable of providing an idea source of data used in interface evaluation. The
data is capable of informing the design of enhanced interfaces. Additionally, eye movements
may be captured besides being applied as control signals to allow individuals to interact
directly with interfaces without using keyboard input or mouse, which may be a big
advantage for some groups of users like disabled individuals.
Several diverse techniques have been applied in tracking eye movements. Electro-
oculographic techniques, for instance, depended on electrodes placed on the skin
surrounding the eye, which was able to note differences in electric potential in order to
notice eye movements. Some other historical techniques needed wearing of huge contact
lenses, which enveloped the sclera and cornea with a metal coil entrenched around the lens’
edges.
These techniques proved to be quite invasive, and several current eye tracking systems make
use of eye’s video images to establish where an individual is looking. A number of
distinctive characteristics of the eye may be applied in order to deduce point-of-regard such
as corneal reflections, the boundary of iris-sclera and the apparent pupil shape.
A number of commercial eye-tracking systems that are available nowadays measure the
point-of-regard through the “pupil-centre/ corneal-reflection” technique. These types of
trackers generally entail a uniform desktop computer having an infrared camera placed
beneath or near display monitor having software for processing images to identify and locate
the characteristics of the eye that is used for tracking. In action, infrared light coming from
the LED that is entrenched within the infrared camera is initially guided into the eye in order
to generate strong reflections in the features of the target eye in order to make them very
easy to track. The light gets into the retina and a big percentage of it is echoed back, thereby
making the pupil to appear like a bright and well defined disc. Corneal reflection is also
produced by the infrared light that appears as a diminutive, yet sharp, glint.
2.4 Usability Studies about Online Systems in Turkey
Usability can be defined as the simplicity of use, as well as the learnability of the objects that
are made by man. The objects are wide and include websites, software application, tools,
book, process, machine, or any other thing with which human interacts. Usability studies are
primarily carried out by usability analyst or as secondarily by the designers marketing
personnel, and several others. It is majorly applied in communication, consumer electronics
and knowledge transfer items (McKeown, 2007).
Usability has become popular and highly recognized in the recent decades. This situation has
brought numerous benefits. Through researching and understanding the interaction between
the user and the product, usability experts are capable of offering insights that are
unachievable by conventional market research. For instance, after observing, as well as
interviewing the users, usability experts are capable of identifying needed functionalities and
design flaws that were not expected.
Several studies have been conducted in Turkey as well as the world. Mentes and Turan
(2012) studied on usability of university websites. This is an empirical study on Namık
Kemal University and it emphasizes the importance of fulfilling web site users’ requirements
15
and anticipations. The purpose of the study is to recover and discover the usability of the
web site of Namık Kemal University. Study employs WAMMAI which is an assessment tool
for web sites and focuses on five elements attractiveness, controllability, efficiency,
helpfulness and learnability. 339 questionnaires were responded by students, faculty
members and the administrative staff. The research reveals that website usability is
affirmatively related with its attractiveness, helpfulness, efficiency and learnability.
Another study on usability testing was conducted by Sengel and Oncu (2010). The study is
about examining the website of the Uludag University and it aims to carry out a future work
on usability of the website to enhance the site with the help of HCI guidelines. Data of this
study were collected from 445 students which were enrolled from several faculties of Uludag
University. Students answered a questionnaire which had 22 units and five-point likert type
questions. Results showed that gender was an important aspect on sensation of web usability.
Female students were more captivated with website then male students. The study revealed
that information on the website should be updated frequently. Moreover, more than half of
the students compared their websites with other universities’ websites and they did not find
their site pleaser or more practical.
Another usability study titled “An eye-tracking study of how color coding affects multimedia
learning” questions the impacts of color schemas on usability and learning (Ozcelik,
Karakus, Kursun & Cagiltay, 2009). According to the article, eye tracking methods give
unique chances to understand the effects of color coding on learning process. The authors
state that color-coded materials are more successful than conventional ones. They justify
their arguments with the results of experiments including 52 students which show that
students easily map, organize and understand the documents with the color-coded format.
Participants easily found the related items in the documents and spent less time to achieve
objectives. The study shows the importance of usability studies in education and gives clues
about the possible improvements on education with the help of usability studies.
A recent usability study of a system widely used in Turkey which named as “e-okul” is the
main topic of the article titled “Evaluation of Turkish “E-Okul” System in Terms of
Usability” (Tufekci, 2013). 10 high school teachers, 95 students and their parents
participated in the study. Nearly 15 million students use the system named “e-okul”.
Participants filled an attitude questionnaire. The data gathered from this questionnaire was
examined based on effectiveness, efficiency and satisfaction criteria. As a result of the study,
some design and navigation problems were identified especially related with the pages
having access to student information.
A recent usability titled “A Case Study for the Usability of Public Institutions: Turkish State
Meteorological Service web site” investigates one of the e-government web sites (Tekin &
Tufekci, 2013). The methods used to evaluate the usability are survey, observation and
think-aloud. The study emphasizes importance of the usability studies on a critical issue,
government services, and tries to explain how to make government services better. It is also
implied in the study that such usability studies might increase the quality and penetration of
the given e-government services.
2.5 Electronic Document Management System
Barry (1993) defines document management system as a computer system (several computer
programs) applied in order to store and to track electronic documents. It is also capable of
16
doing history tracking. In a number of cases, document management systems offer
versioning, storage, metadata, indexing retrieval, as well as security capabilities.
Electronic Document Management Systems (EDMS) refer to the software collections that
are capable of digitizing documents. A number of the systems are capable of storing
documents images though software solutions entailing optical character recognition that are
capable of translating document scans to texts that can be edited. EDMS is also applied as a
database of a kind that allows for sorting and searching of the numerous documents that are
collected (Bearman, 1993; Du Rea & Pemberton, 1992).
Electronic document management is also defined as the systems for inputting, tracking,
routing, and processing documents. The documents may have been electronically created
through online forms or e-mail. Document management system is division of workflow
systems, although they might also have different emphasis lacking the groupware taste of
workflow (Bearman, 1993; Bearman, 1994).
Document management systems may be applied in the maintenance of huge archives like
legal documents, libraries, credit card receipts and cancelled checks. It may be used as a
system for processing forms (Bearman, 1993; Bearman, 1994).
EDMS organizes and stores several types of documents. It is a highly particular type of
document management system, and besides, it is a highly general kind of storage system
helping users to sort and to store digital documents or paper. EDMS refers more directly to a
software system handling digital documents, instead of paper documents. However, in a
number of instances, the system is also capable of handling digitally scanned forms of the
original paper documents (Bearman, 1993). A number of the systems also have features that
are capable of ensuring affective and efficient retrieval of documents (Bearman, 1994; Cox,
1992; Emmerson, 1993).
Electronic document management offers a means of centrally storing huge amounts of digital
documents. A number of EDMS also entail features for efficient and effective retrieval of
documents (Bearman, 1993; Bearman, 1994; Cox, 1994).
2.5.1 The Usage of Electronic Document Management Systems
There are numerous obvious applications of EDMS. However, the major use entails
digitizing and storing paper document collections. Generally, this is a highly efficient way of
information storage, and can significantly diminish the quantity of labor required in order to
conduct very simple tasks. Additionally, it averts paper documents loss and makes sure that
the entire historical document may be altered or modified without making copies. Besides,
EDMS simplifies the document transmission. In addition, the EDMS enhances the security
of the computer system (Bellyuk, 1993; Bruns, 1992; Campbell, 1994; Cory & Hessler,
1994; Davidson & Moscato, 1994).
A number of experts opine that electronic document management system is highly very
similar to content management system (CMS). However, one big difference, between the
two is that a number of CMS systems entail dealing with a wide array of web contents from
a single site, whereas document management systems are primarily applied in archiving
17
(Bikson, 1994; Bikson & Frinking, 1994; Bikson & Law, 1993; Branger & Duisterhout,
1991; Brown, 1993).
For the provision of a good classification for digital documents, numerous EDMS depend on
a highly detailed procedure for the storage of documents, including some elements referred
to as metadata. Metadata around the document offers very easy access to major details
capable of helping the individuals searching the archives to obtain the things that they
require, whether through topic, chronology, keywords or through other strategies. EDMS is
useful for businesses or organizations because of its capacity to store original documents
(Brown, 1993).
EDMS can be used in human resources. Groenewald (2004) investigated the implementation
of an EDMS in human resources. This study showed that if an organization implies EDMS
without a groundwork, it would not secure the corporate memory. Another application field
of EDMS could be public administration (Tiitinen, Lyytikainen, Paivarinta & Salminen,
2000). In their study which is a part of the research related to SGML standardization in the
Finnish Parliament and ministries, there are two cases that studied EDMS. In the first case,
they focused on the creation of state budget of Finland and second case concerns
participation of Finnish in EU legislative work. Both of the cases address different aspects of
electronic document management such as documents, information technology, and work
with documents. After user need analysis, an efficient structured documents and electronic
document management systems are implemented to solve many problems raised.
E-government services can take advantage of EDMS (Hung, Tang, Chang & Ke, 2009). This
study has examined the factors influencing the acceptance of EDMS in e-Government
project in Taiwan. Data are collected from 186 users of e-government’s EDMS in Taiwan.
Findings of this study indicated that “perceived usefulness, perceived ease of use, training,
compatibility, external influence, interpersonal influence, self-efficacy, and facilitating
conditions” are really important for users' intention to use EDMS.

18
CHAPTER 3
3 METHODOLOGY
Different methods have been applied in order to examine the usability of METU EDMS. A
test system environment was formed in order not to affect the real records and the usability
tests were conducted by using this environment. A pretest questionnaire was given to the
participants in order to record and analyze demographic information. Task analysis was
performed so as to decide the basic tasks and to illustrate how these tasks are accomplished
step by step. Thereafter, the usability tests were performed with two groups of real system
users at three steps. In the first step, the first group took usability test and this test was
repeated after one year for the second step. Then, another usability study was conducted with
the second group for the third step. An eye tracker device was used during the usability
studies to record and monitor the eye movement and the gaze direction of the participants.
The participants were chosen among METU’s administrative personnel, workers and
managers who had been working in the institution at least for a year. Test sessions conducted
with the users were recorded to measure how much time each task took and to observe
whether they focused on the relevant part of the screens or objects. Moreover, think aloud
method was applied to encourage the participants to express their feelings and opinions
during the usability studies. Participants’ opinion, explanations and advices were acquired
with the help of this method. Finally, a post-test questionnaire was conducted with the
participants so as to evaluate the system, METU EDMS. The following sections of this
chapter provide detailed information about the research questions, design of the study,
materials, instruments and software used, EDMS, questionnaires and the procedure of the
study.
3.1 Research Questions
This study mainly will attempt to answer the following questions:
RQ1: What are the most significant tasks performed by managers and personnel on
METU EDMS?
RQ2: Which usability issues are present on the current METU EDMS interface with
respect to the significant tasks?
RQ2.1: What are the task success rates of the users for each task?
RQ2.2: Which tasks are the most difficult for the users to accomplish?
What kinds of errors/problems do they experience when they
were not able to accomplish a task?

19
RQ2.3: Is there a positive change in terms of using the system effectively
for the users of first and second stages who took the system test
one year ago?
RQ2.4: How long does it take for the users to complete each task?
RQ2.5: How many mouse clicks do the users execute to finalize each
task?
RQ2.6: How long do the users stare at the task-related and non-task-
related areas?
RQ2.7: How do the users evaluate the perceived usefulness of METU
EDMS?
RQ2.8: What kind of interpretations do the users make about the
interface of METU EDMS?
RQ3: How can METU EDMS interface be developed in the light of usability issues?
3.2 Design of the Study
This study contains certain phases. The first phase is the selection of the Electronic
Document Management System (EDMS) for usability testing. One of the basic reasons why
EDMS is chosen for this study is that it will be a mandatory system for the affairs of state in
the near future and there is not too many studies about the usability of EDMS. After this
phase, it was important to determine the tasks that would be given to the users. Two different
task lists were prepared based on the user’s administrative duty with the help of task
analysis. Detailed information about the tasks is stated in the procedure section. Selection of
the users who would test the system was another phase. Users were chosen based on their
administrative duties in order to fit the predefined tasks. Then, usability tests were conducted
with the chosen users in METU HCI Lab. The procedure followed for the usability tests is
that the EDMS was tested with ten users firstly. After that, the results were analyzed and
applied to the system. Then, the system was tested with the same ten users again so as to see
the effect of the changes made and compare the results. Moreover, one more usability test
was conducted with another group of ten users who had not participated in the first two
usability tests. The aim for this was to see and compare the results with the first group. All of
these phases are explained in the following sections.
3.3 Materials, Instruments and Software
EDMS was chosen for this study because it is commonly used in METU and this system will
be mandatory in the near future. Users, chosen based on the characteristic, were invited to
the METU HCI lab for the usability study. A pretest questionnaire was given to the users in
order to identify the demographic information (see Appendix A). Then, the usability study
was conducted with the users. After the usability study, users took a post-test questionnaire
and filled it in. The questionnaire mainly included likert type and open-ended questions (see
Appendix B). Now, detailed information about the materials will be provided in this section.
3.3.1 Eye Tracking System
Eye tracker is a device that collects the gaze direction or eye movements and it allows
researchers to track and monitor this data. Hence, researchers are able to analyze where the

20
subjects mainly focus on the screen with the help of this data. Moreover, the data acquired
with this device provides some statistical information such as mouse click count, click
proportion of the objects and heat maps. The model of the eye tracker device used for this
study is TOBII T120. The picture of this device can be seen below in Figure 3.1. The data
rate of this instrument is 120 Hz. In other words, this device gathers the eye-gaze data of the
test subjects with a rate of 120 Hz.
Figure 3.1: TOBII T120 Device in METU HCI Lab
3.3.2 Tobii Studio Software
The software that was used to analyze the data gathered from the eye tracker is Tobii Studio.
The version of the software is 3.0.3. The software provides many benefits to researchers.
One of these benefits is that the software allows researchers for the analysis of the raw data
gathered during the usability tests. Moreover, the software enables evaluators to examine the
raw data with different options. One of these options is the replay property. Researchers can
watch every second of the recorded session again with the help of Tobii Studio. Another
option is the event logs. Researchers can use the event logs provided by the software to
calculate the mouse click count, starting and ending point of a task and to see the gaze path
video. Evaluators can listen the environment’s and participant’s sound with the help of
replay property and analyze the participant’s behavior with think aloud method. Another
benefit of this software is the visualization feature. This feature enables researchers to create
gaze plot, heat map or clusters. Gaze plot reflects the order and the location of fixations for
the related record. Heat map indicates the number of fixations made by the participant in a
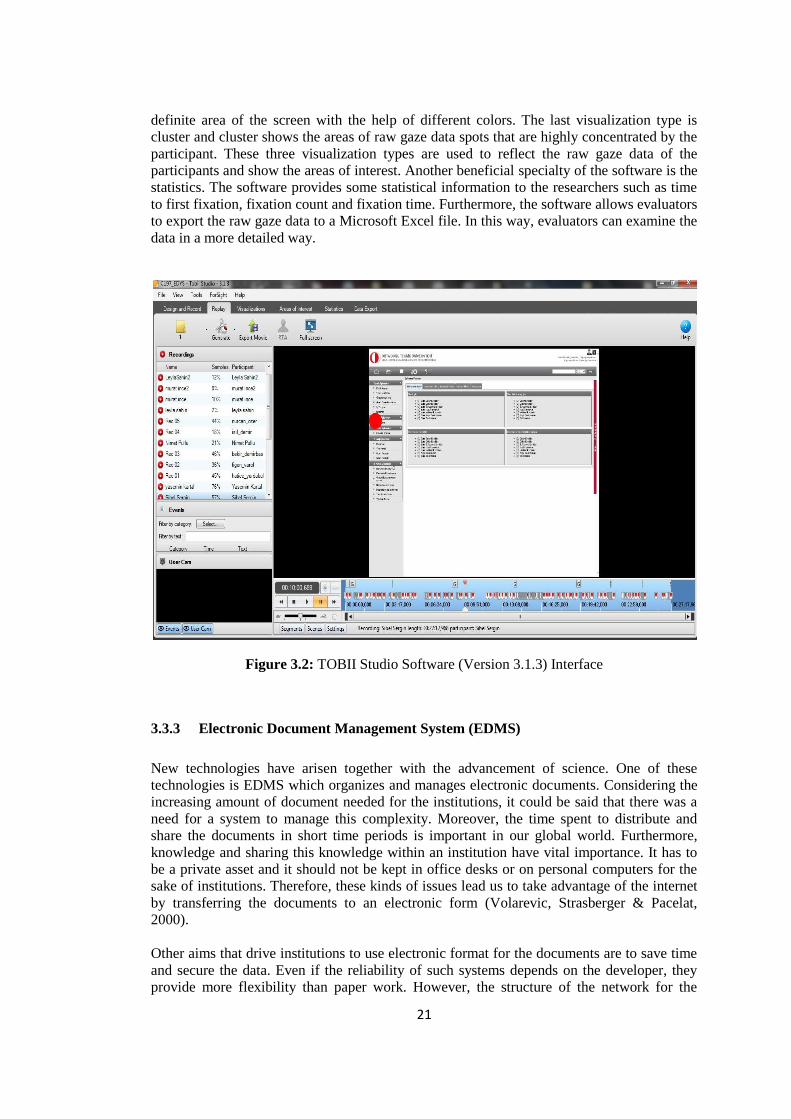
21
definite area of the screen with the help of different colors. The last visualization type is
cluster and cluster shows the areas of raw gaze data spots that are highly concentrated by the
participant. These three visualization types are used to reflect the raw gaze data of the
participants and show the areas of interest. Another beneficial specialty of the software is the
statistics. The software provides some statistical information to the researchers such as time
to first fixation, fixation count and fixation time. Furthermore, the software allows evaluators
to export the raw gaze data to a Microsoft Excel file. In this way, evaluators can examine the
data in a more detailed way.
Figure 3.2: TOBII Studio Software (Version 3.1.3) Interface
3.3.3 Electronic Document Management System (EDMS)
New technologies have arisen together with the advancement of science. One of these
technologies is EDMS which organizes and manages electronic documents. Considering the
increasing amount of document needed for the institutions, it could be said that there was a
need for a system to manage this complexity. Moreover, the time spent to distribute and
share the documents in short time periods is important in our global world. Furthermore,
knowledge and sharing this knowledge within an institution have vital importance. It has to
be a private asset and it should not be kept in office desks or on personal computers for the
sake of institutions. Therefore, these kinds of issues lead us to take advantage of the internet
by transferring the documents to an electronic form (Volarevic, Strasberger & Pacelat,
2000).
Other aims that drive institutions to use electronic format for the documents are to save time
and secure the data. Even if the reliability of such systems depends on the developer, they
provide more flexibility than paper work. However, the structure of the network for the
22
system, the amount of the documents that need to be collected and the maintenance of those
documents and the system are not easy (Zhao, et al., 2010).
There are various technologies for document generation and management. However, as
Gilani, Ahmed and Abbas (2009) offered that there should be a single software unit running
to ease the necessary processes for creating and sharing the document. This kind of software
would facilitate the regulation of the documents and it would make the documents to manage
easily for the institution.
The EDMS in METU has been used more than three years. The administrative staff has been
using the system since the beginning of the project. However, the academic staff has started
to use the system almost a year ago. The system enables the users manage different types of
operations such as:
filling a form and tracking it
searching and previewing document/form
assigning deputation and cancelling it
learning the result and the stage of a document
dispatching a document to the next level
editing and cancelling document
archiving documents
issuing reports
sending message
scanning document and transmitting it into the system
sharing documents with other users
creating private folders
checking the documents previously created by the related department
approving and signing documents
In addition to these main functions, EDMS is also capable of providing special reports to the
managers and heads of the departments based on their needs. Moreover, the performance of
the workers can be evaluated with the help of the EDMS since the system shows when a
document is sent to the related worker and when the worker sends the document to other
people or departments.
3.3.4 Questionnaires
Two questionnaires were conducted with the users: pretest questionnaire and post-test
questionnaire. Pretest questionnaire was given to the users before the usability test. This
questionnaire mainly includes information concerning demographics (age, gender, education
level) and computer usage. This questionnaire can be seen in Appendix A. After the usability
study, subjects took post-test questionnaire. This questionnaire is more detailed than the
pretest questionnaire. Post-test questionnaire was prepared with the help of a questionnaire
tool called QUIS (Questionnaire for User Interaction Satisfaction). This questionnaire tool
was developed by a team of researchers in the Human Computer Interaction Lab (HCIL) at
the University of Maryland. The license of this tool was bought for academic purposes. Post-
test questionnaire is consisted of five sections. These sections are system experience,
common user reactions, the appearance of EDMS’s pages, terms used in EDMS pages and
learning the system usage. 9 point likert scale was used in this questionnaire except the
23
system experience section. Moreover, there is one open-ended question after the third, fourth
and fifth sections of the questionnaire. This questionnaire can be seen in Appendix B.
3.4 Procedure
3.4.1 Designing Test Environment
The system tested is Electronic Document Management System (EDMS). University
personnel can reach the system on web with the following address:
https://edys.metu.edu.tr. Users can only reach the test system inside the campus. For this
usability test, a test environment which was the same with the real system had been
developed in order not to affect the real records. Participants’ behaviors were observed and
their eye movements were recorded in the HCI lab with the help of an eye tracker device.
Before applying the test with the participants, a pilot study was conducted in order to
measure how much time it would take to complete the test and see the possible difficulties
that may be faced during the test. The trial system test took about half an hour and filling the
questionnaires took around 15 minutes.
3.4.2 Task Analysis
Before the usability tests, a brief information was given to the participants. Participants were
told that they could leave the experiment any moment they want because of a health or
personal problem. Besides, they were informed that the tests would be performed in a test
environment which is the same of the real system and they should not be afraid of making
mistakes since it would not affect the real system records. Then, the participants sit in front
of the computer having eye tracker. After that, eye calibration of the participants was
adjusted with the help of the Tobii Studio software. Before starting the experiment,
participants need to know some button combinations in order to start and end the tasks. They
were told that they should press space bar so as to start the related task after reading the text
on the screen. Moreover, they should press F10 button after completing the task or when
they think that they completed the task. A task list was also provided in case the participants
forget the task that they try to accomplish. Task analysis method was implemented to
identify the most frequently used tasks and see the flow while accomplishing these tasks.
This method is beneficial so as to understand how the related task is accomplished and see in
how many steps the related task can be accomplished. As the result of the system tests
conducted by the administrators of METU EDMS, 5 tasks for managers and 7 tasks for
personnel / workers were identified for the task analysis by the administrators of METU
EDMS. Moreover, the ideal cases for the completion time and mouse clicks were revealed
with the help of task analysis. The ideal cases are important since the divergence from the
ideal cases can be visualized via graphs. The tasks chosen for the task analysis are clarified
in the next two sections for managers and personnel respectively together with the scenario
presented to the participants during the test sessions.
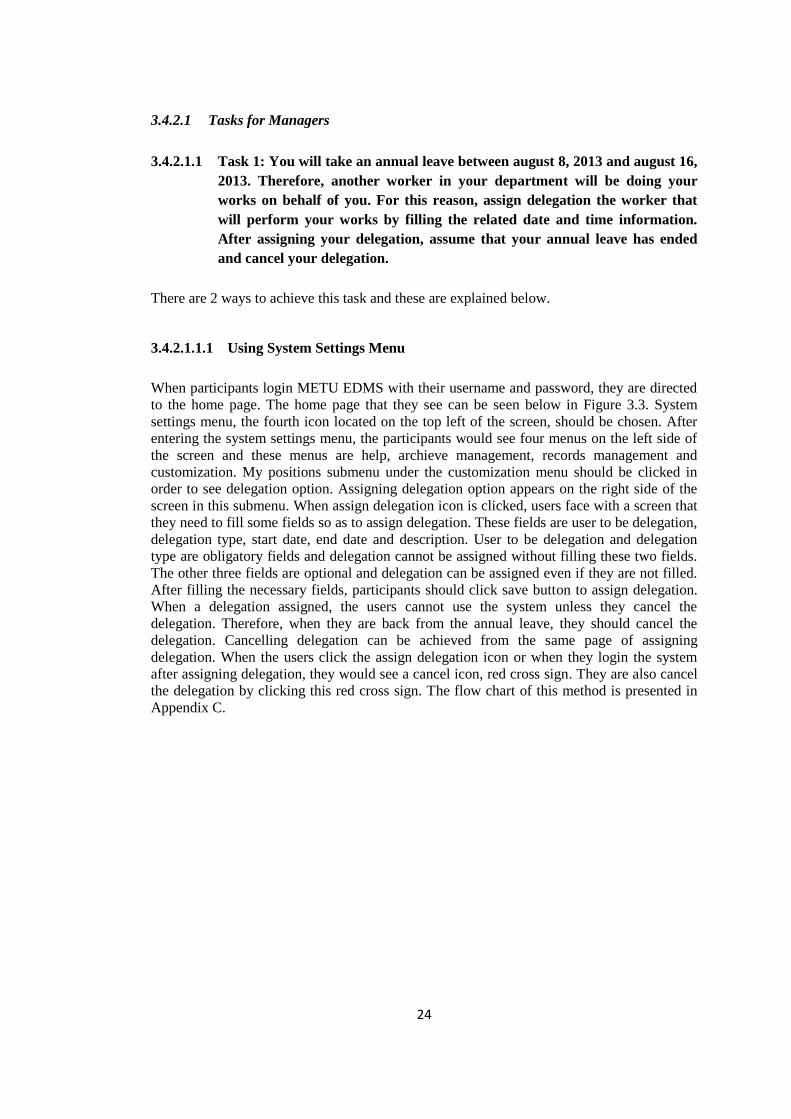
24
3.4.2.1 Tasks for Managers
3.4.2.1.1 Task 1: You will take an annual leave between august 8, 2013 and august 16,
2013. Therefore, another worker in your department will be doing your
works on behalf of you. For this reason, assign delegation the worker that
will perform your works by filling the related date and time information.
After assigning your delegation, assume that your annual leave has ended
and cancel your delegation.
There are 2 ways to achieve this task and these are explained below.
3.4.2.1.1.1 Using System Settings Menu
When participants login METU EDMS with their username and password, they are directed
to the home page. The home page that they see can be seen below in Figure 3.3. System
settings menu, the fourth icon located on the top left of the screen, should be chosen. After
entering the system settings menu, the participants would see four menus on the left side of
the screen and these menus are help, archieve management, records management and
customization. My positions submenu under the customization menu should be clicked in
order to see delegation option. Assigning delegation option appears on the right side of the
screen in this submenu. When assign delegation icon is clicked, users face with a screen that
they need to fill some fields so as to assign delegation. These fields are user to be delegation,
delegation type, start date, end date and description. User to be delegation and delegation
type are obligatory fields and delegation cannot be assigned without filling these two fields.
The other three fields are optional and delegation can be assigned even if they are not filled.
After filling the necessary fields, participants should click save button to assign delegation.
When a delegation assigned, the users cannot use the system unless they cancel the
delegation. Therefore, when they are back from the annual leave, they should cancel the
delegation. Cancelling delegation can be achieved from the same page of assigning
delegation. When the users click the assign delegation icon or when they login the system
after assigning delegation, they would see a cancel icon, red cross sign. They are also cancel
the delegation by clicking this red cross sign. The flow chart of this method is presented in
Appendix C.

25
Figure 3.3: Home Page of METU EDMS
3.4.2.1.1.2 Clicking on My Positions Information
Another way of assigning delegation is clicking on my positions information located at the
top right of the home page screen. When users login to the system, they see their name, title
and department information at the top right-hand corner. This text area is called as my
positions and it is clickable. When the participants click on the text, they are directed to my
positions submenu under the customization menu. Therefore, this way is a shortcut of
assigning delegation. Assigning delegation option appears on the right side of the screen in
this screen. The rest process of this method is the same with the first one. The flow of this
method can be seen in a detailed way in Appendix C.
3.4.2.1.2 Task 2: You need some information related with a maintenance and repair
form that you had filled before. Find this form whose subject is “Eğitim
Deneme Formu” (Education Test Form) by using Electronic Form Search
option and preview it in order to get essential information. After previewing
the document, learn where and on which phase this document is.
METU EDMS provides different search options to the users. One of them is electronic form
search. Users should click desktop menu after logging in the system. Then, they would see
menus on the left side of the screen. They should click E-Form Processes menu in order to
see the Electronic Form Search submenu. After clicking the submenu, they are required to
select the type of electronic form that they will search. They should click Bakım Onarım
Formu (Maintenance and Repair Form) for this task. When they choose the related form,
they would see the search criteria such as reference number, subject, ID, registered by (unit)
and registered by (user). The system offers different criteria to search for the desirable form.
Participants are required to fill the subject criterion as “Eğitim Deneme Formu” (Education
Test Form) and click the search button. The system would provide the matching form(s) after
26
this process. Participants should preview the document by clicking processes box and
selecting the preview option. They need to be sure that they find the required form and this is
achieved with preview option. Then, they should close the preview screen and click the
processes box again so as to select dispatch history. Dispatch history gives information about
where and on which phase this document is. The flow chart of this task can be found in
Appendix C.
3.4.2.1.3 Task 3: Preview the maintenance and repair form whose subject is “Eğitim
Deneme” (Education Test) sent by the related personnel and make the
essential changes by using Edit Text option. Send the document to the
related personnel after you make the desired changes.
The user should click on the pending tasks at the home page after logging in the system.
Then, the system would direct the user to the desktop menu where all the pending tasks can
be seen. There are five different task tabs at the desktop menu. These are pending tasks, my
tasks, my started tasks, my sent and my messages. The user should click on the related tab
and find the maintenance and repair form whose subject is “Eğitim Deneme” (Education
Test). The participant should click on the processes box and select preview option in order to
control the document. When the user previews the document, the system provides different
options for the document. These options are edit text, document information, dispatch,
dispatch history, dispatch back and note / comment. The user should click edit text button in
order to make essential changes. The participant is required to refine the document and make
the related changes. After that, save button should be clicked to send the document back to
the related personnel. The flow of this task is visualized in Appendix C.
3.4.2.1.4 Task 4: Review the maintenance and repair form, which was filled and sent
to you, related with central heating problem of a department and process it
to the next phase (Sending it to the next department / manager or archiving).
The user should click on the pending tasks at the home page after logging in the system.
Then, the user would be directed to the desktop menu where all the pending tasks can be
seen. The user needs to click processes box and select preview option in order to check the
document. If there is more than one document, the user should preview the documents to
find the related one. After finding the document, the user should check whether the
document was filled correctly. The user should click dispatch button after controlling the
document so as to send it to the next department / manager or archieve the document.
Thereafter, the user would see a list of departments and people that the document can be sent
to. Moreover, the user would see archieve button on the same screen, too. If the user decides
to send the document to a department or a person, the related department or person should be
selected. After selecting to where the document would be sent, the user should click dispatch
button. If the user wants to archieve the document, archieve button should be clicked. After
that, file code should be chosen and added at this page in order to specify under which file
the document will be archieved. Finally, the user should click archieve button. The flow
chart of this task can be seen in Appendix C.
3.4.2.1.5 Task 5: You want to make some changes on a repair and maintenance
form’s text. However, you do not know how to make these changes and
27
direct it to the related personnel. Find the help menus inside the system so as
to get help and get information about the related situation from these menus.
There are 2 ways to reach help menus in the system. These ways are clarified below.
3.4.2.1.5.1 Clicking Help Menu Icon
The user should click on the help menu icon at the home page after logging in the system.
Help menu icon is represented with a question mark. Moreover, five main menus seen at the
home page of the system are constant. In other words, the users are able to see these main
menus in any page of the system. Therefore, they can click the help menu icon at any
moment. The visualization of this task can be found in Appendix C.
3.4.2.1.5.2 Using System Settings Menu
The user should click on the system settings menu icon at the home page after logging in the
system. Then, the user would see four menus at the left side of the screen. These menus are
help, archieve management, record management and customization. The user should click
help menu and select the application manuals submenu. Thereafter, the user would see the
related topics and should click on the related title that s/he wants to receive support. The
flow of this task is visualized in Appendix C.
3.4.2.2 Tasks for Personnel / Workers
3.4.2.2.1 Task 1: You will take an annual leave between august 8, 2013 and august 16,
2013. Therefore, another worker in your department will be doing your
works on behalf of you. For this reason, give your procuration to the worker
that will perform your works by filling the related date and time
information. After giving procuration, assume that your annual leave has
ended and cancel your procuration.
There are 2 ways to achieve this task and the ways of assigning delegation for personnel or
workers is exactly the same with the managers’. Therefore, the flow charts of the ways of
achieving this task and the explanation are the same with 3.4.2.1.1.
3.4.2.2.2 Task 2: You need some information related with a maintenance and repair
form that you had filled before. Find this form whose subject is “Eğitim
Deneme Formu” (Education Test Form) by using Electronic Form Search
option and preview it in order to get essential information.
This task for personnel is partially similar with 3.4.2.1.2. Users should click desktop menu
after logging in the system. Then, they should click E-Form Processes menu in order to see
28
the Electronic Form Search submenu. After clicking the submenu, they are required to select
the type of electronic form that they will search. They should click Bakım Onarım Formu
(Maintenance and Repair Form) for this task. When they choose the related form, they would
see the search criteria. Participants are required to fill the subject criterion as “Eğitim
Deneme Formu” (Education Test Form) and click the search button. The system would
provide the matching form(s) after this process. Participants should preview the document by
clicking processes box and selecting the preview option so as to get the essential
information. The flow chart of this task can be found in Appendix C.
3.4.2.2.3 Task 3: Since you had another work to do, you left a repair and maintenance
form that you were filling incomplete. You want to continue filling your
form after you completed the other work. Hence, find the shortcomings of
the document whose subject is “Eksik Bilgileri Giriniz” (Enter Incomplete
Information) in My New Records and send it to the related personnel by
completing it.
The user should click desktop menu after logging in the system. Then, record processes
menu should be clicked and my new records submenu should be selected. When the user
selects my new records submenu, a categorization appears at the top of this screen. These
categories are unsent records, draft records and electronic forms. Draft records are listed on
this screen by default. Therefore, electronic forms check box should be clicked so as to see
incomplete electronic forms. Then, the document whose subject is “Eksik Bilgileri Giriniz”
(Enter Incomplete Information) would appear. The user should click processes box and
select the preview option after finding the document. The document should be controlled and
the missing information should be found on the preview screen. Edit text button should be
clicked to make the necessary changes. Thereafter, save button should be clicked to save the
changes and dispatch button should be clicked to send the document to the related personnel.
The user would see a list of departments and people that the document can be sent to. The
related department or person should be selected from this list. After selecting to where the
document would be sent, the user should click dispatch button. The flow of this method can
be seen in a detailed way in Appendix C.
3.4.2.2.4 Task 4: A malfunction has occurred for a room’s heating system in your
department or agency. Your head of department or manager demanded you
to fill a repair and maintenance form related with this situation. Complete
the repair and maintenance form by filling the essential information and
dispatch it to the appropriate personnel.
The user should click desktop menu after logging in the system. Then, e-form processes
menu should be clicked and Bakım Onarım Formu (Maintenance and Repair form) should be
selected. Then, the user would see the related form. There are different fields in this form but
four of them are obligatory. The obligatory fields are telephone number, request type,
request order and detail. The document cannot be sent unless these obligatory fields are
filled. The user should fill the essential fields in addition to the obligatory fields. After filling
the necessary fields, the document should be saved and dispatch button should be clicked.
Thereafter, the user would see a list of departments and people that the document can be sent
to. The related department or person should be selected from this list. After selecting to
29
where the document would be sent, the user should click dispatch button. The flow chart of
this task is shown in Appendix C.
3.4.2.2.5 Task 5: Your head of department or manager wanted information about
where and on which phase the repair and maintenance form that you had
dispatched is after some time. For this reason, learn where and on which
phase the repair and maintenance form that you had dispatched is by
finding your document.
Users should click desktop menu after logging in the system. Then, they should click E-
Form Processes menu and select Electronic Form Search submenu. After clicking the
submenu, they are required to select the type of electronic form that they will search. They
should click Bakım Onarım Formu (Maintenance and Repair Form) for this task. When they
choose the related form, they would see the search criteria. The users should enter the
necessary information about the document that they had prepared during the previous task
and click the search button. The system would provide the matching form(s) after this
process. Participants should click processes box and select dispatch history option so as to
learn where and on which phase the repair and maintenance form that they had dispatched is.
The flow chart of this task is visualized in Appendix C.
3.4.2.2.6 Task 6: You realized that you had sent the Repair and Maintenance form
that you had filled based on your head of department or manager demand to
a wrong personnel. Take your document back before the personnel that you
had sent wrongly makes a change on your document.
Users should click desktop menu after logging in the system. They would see five different
task tabs at the desktop menu and they should click my sent tab. After that, they would see
two different categories which are time-bound tasks and transitory tasks. They should click
on the appropriate category that the document belongs to. The system would provide the
related forms that match this category. Then, the users should click the processes box and
select take back option. The system would ask the users whether they are sure to cancel the
dispatch with a dialog box. The users should click yes / ok option in order to take the
document back.
3.4.2.2.7 Task 7: You could not guess what to write to some text fields that exist in
Maintenance and Repair Form and you have difficulty in filling the form.
Find the help menus inside the system so as to get help and get information
about the related situation from these menus.
There are 2 ways to reach help menus in the system and the way of achieving these tasks are
the same with 3.4.2.1.5. Therefore, the flow charts of this task are also the same with
3.4.2.1.5.
30
3.4.3 Eye Tracking Study
3.4.3.1 Subjects
There have been 20 participants who took the system test in HCI lab in METU Computer
Center. These participants were divided into two groups and each group consists of ten
participants. The first group tested the system twice. Firstly, a usability study was conducted
with the first group. The necessary changes based on the results of this test were
implemented to the system. After the implementation of the first test findings, another
usability study was conducted with the first group in order to see the effect of the
implementation. Moreover, one more usability study was conducted with the second group
so as to compare the results with the first group. Participants were chosen randomly among
the system users. They were chosen based on the general characteristics and duties of the
system users.
Subjects were informed about the aims of this test and what they were supposed to do during
the test before they started the test. Participants took the system test based on the tasks that
were identified beforehand. The lists of these tasks based on the duty of the worker are
provided in Appendix D and Appendix E. These tasks were identified by considering the
current version and usage of the system. These tasks were appropriate for the users with the
current version. Some of the tasks require some operations on documents. These documents
had been created for the test users’ accounts before the test. When the users log in the test
environment with their username and password, they were able to see these documents.
People who have academic duties are ignored for this test because what they do with the
current version of the system is only to preview the documents and send them to necessary
person. Therefore, the tasks which will be tested are not appropriate for the role that they
have in the system for now.
3.4.3.2 Think Aloud Method
Think aloud method was applied during the usability test sessions. The participants were
encouraged to speak and express their feelings and ideas verbally. Applying this method
helps to understand the feelings of the participants while performing the tasks. Their
comments give clues about at which tasks they face with difficulties, what they think about
the design and functionality of the system and how they react to the errors or feedbacks of
the system. Moreover, when the users talk loudly during the usability study, they are
unaware that they offer beneficial solutions for a problematic component or item. Therefore,
this method assists to find different and user friendly solutions.
Sound records of the participants were monitored and investigated after the test sessions. The
statements and expression of the participants were identified by watching the video records
and listening to the sound records again. After the identification of the related expressions,
these expressions were classified into 11 categories. These categories help to identify
potential problems for user interface or the design of the system (Kushniruk & Patel, 2004).
11 categories that were used for the expression classification are explained below:
Navigation: Coded when participant makes a comment about navigation or states can’t act
through interface.
Graphics: Coded if participant refers to the graphics of the system.

31
Layout / Screen Organization: Coded if participant expresses a feeling about the layout or
screen organization.
Color: Coded if participant refers to the usage of color.
Resolution: Coded if participant makes a comment about the resolution of the information
Meaning of Labels: Coded if participant comments on the elements of the interface.
Understanding of System Instructions / Error Messages: Coded if participant mentions
understanding of instructions or errors.
Consistency of Operations: Coded if participant makes an interpretation about the
consistency of operations.
Overall Ease of Use: Coded if participant states an opinion about the overall ease of use for
the system.
Response Time: Coded if participant make a comment about the response time of the system.
Visibility of System Status: Coded if participant mentions about visibility of the system
status.
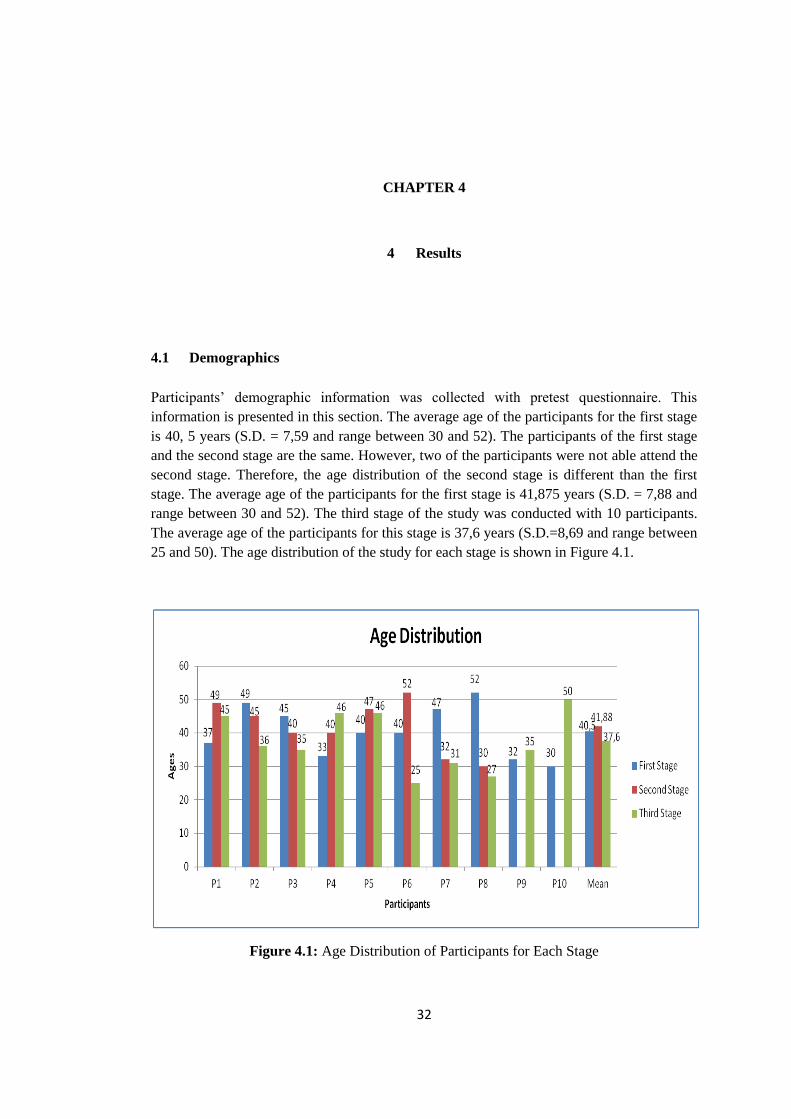
32
CHAPTER 4
4 Results
4.1 Demographics
Participants’ demographic information was collected with pretest questionnaire. This
information is presented in this section. The average age of the participants for the first stage
is 40, 5 years (S.D. = 7,59 and range between 30 and 52). The participants of the first stage
and the second stage are the same. However, two of the participants were not able attend the
second stage. Therefore, the age distribution of the second stage is different than the first
stage. The average age of the participants for the first stage is 41,875 years (S.D. = 7,88 and
range between 30 and 52). The third stage of the study was conducted with 10 participants.
The average age of the participants for this stage is 37,6 years (S.D.=8,69 and range between
25 and 50). The age distribution of the study for each stage is shown in Figure 4.1.
Figure 4.1: Age Distribution of Participants for Each Stage
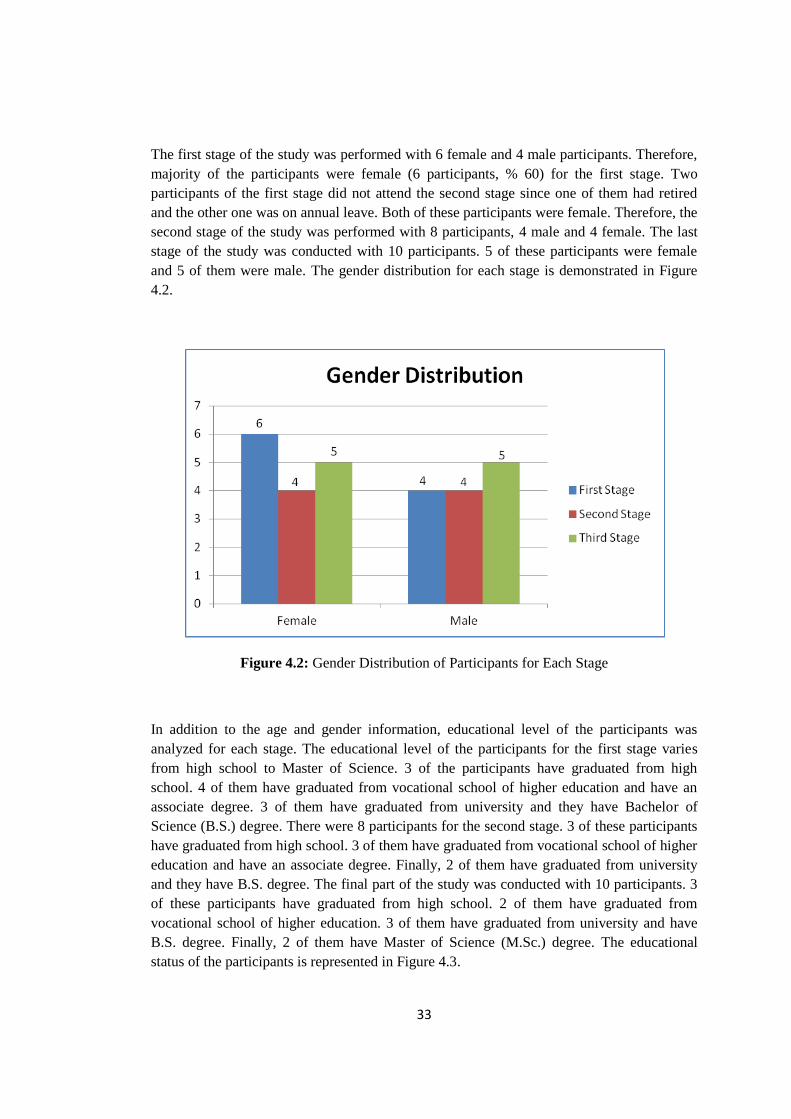
33
The first stage of the study was performed with 6 female and 4 male participants. Therefore,
majority of the participants were female (6 participants, % 60) for the first stage. Two
participants of the first stage did not attend the second stage since one of them had retired
and the other one was on annual leave. Both of these participants were female. Therefore, the
second stage of the study was performed with 8 participants, 4 male and 4 female. The last
stage of the study was conducted with 10 participants. 5 of these participants were female
and 5 of them were male. The gender distribution for each stage is demonstrated in Figure
4.2.
Figure 4.2: Gender Distribution of Participants for Each Stage
In addition to the age and gender information, educational level of the participants was
analyzed for each stage. The educational level of the participants for the first stage varies
from high school to Master of Science. 3 of the participants have graduated from high
school. 4 of them have graduated from vocational school of higher education and have an
associate degree. 3 of them have graduated from university and they have Bachelor of
Science (B.S.) degree. There were 8 participants for the second stage. 3 of these participants
have graduated from high school. 3 of them have graduated from vocational school of higher
education and have an associate degree. Finally, 2 of them have graduated from university
and they have B.S. degree. The final part of the study was conducted with 10 participants. 3
of these participants have graduated from high school. 2 of them have graduated from
vocational school of higher education. 3 of them have graduated from university and have
B.S. degree. Finally, 2 of them have Master of Science (M.Sc.) degree. The educational
status of the participants is represented in Figure 4.3.
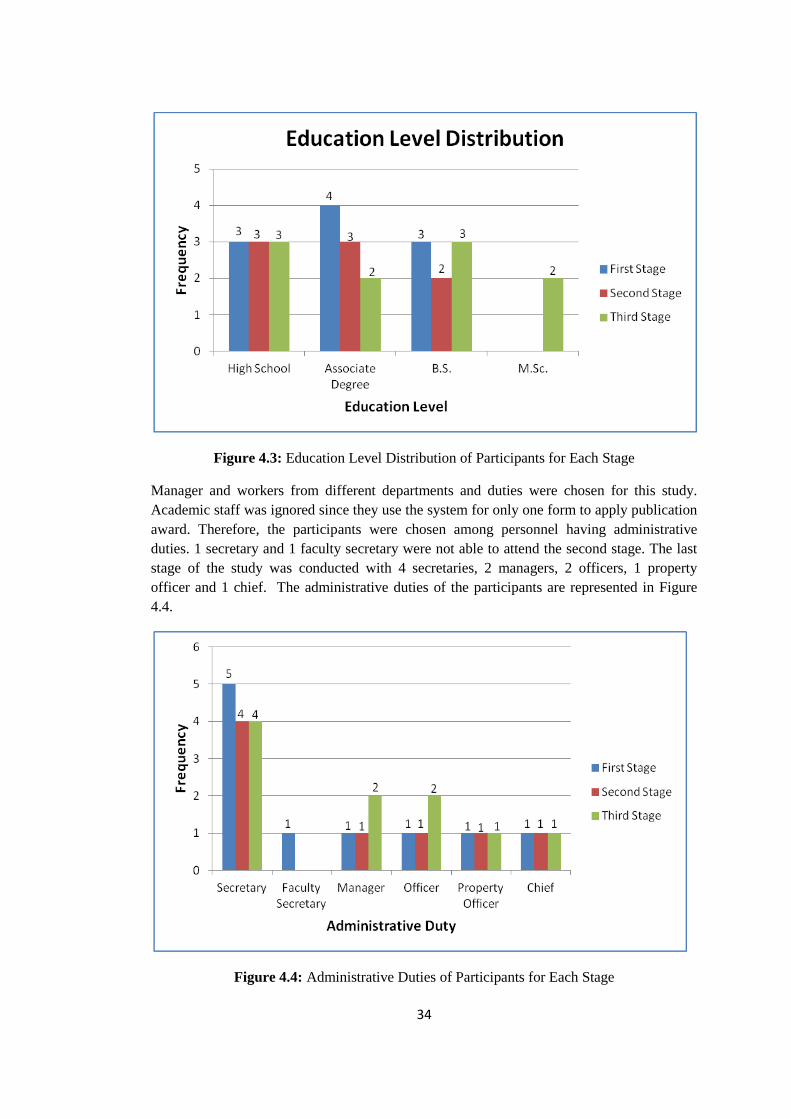
34
Figure 4.3: Education Level Distribution of Participants for Each Stage
Manager and workers from different departments and duties were chosen for this study.
Academic staff was ignored since they use the system for only one form to apply publication
award. Therefore, the participants were chosen among personnel having administrative
duties. 1 secretary and 1 faculty secretary were not able to attend the second stage. The last
stage of the study was conducted with 4 secretaries, 2 managers, 2 officers, 1 property
officer and 1 chief. The administrative duties of the participants are represented in Figure
4.4.
Figure 4.4: Administrative Duties of Participants for Each Stage
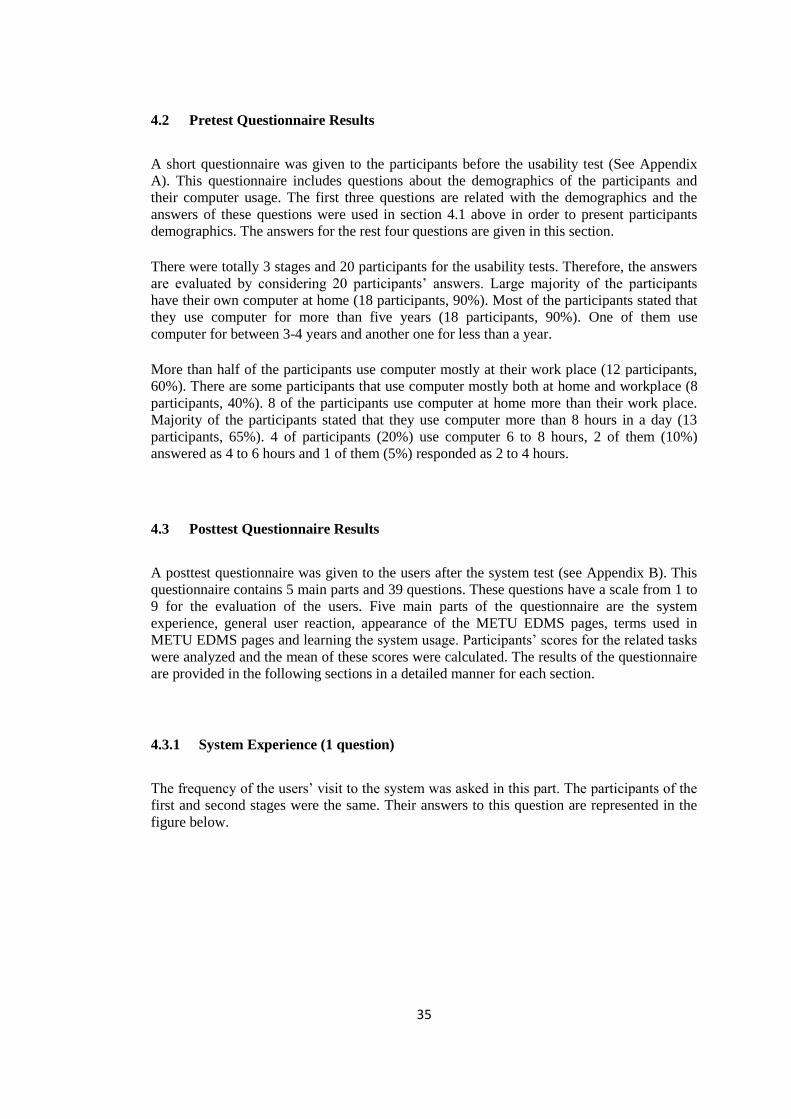
35
4.2 Pretest Questionnaire Results
A short questionnaire was given to the participants before the usability test (See Appendix
A). This questionnaire includes questions about the demographics of the participants and
their computer usage. The first three questions are related with the demographics and the
answers of these questions were used in section 4.1 above in order to present participants
demographics. The answers for the rest four questions are given in this section.
There were totally 3 stages and 20 participants for the usability tests. Therefore, the answers
are evaluated by considering 20 participants’ answers. Large majority of the participants
have their own computer at home (18 participants, 90%). Most of the participants stated that
they use computer for more than five years (18 participants, 90%). One of them use
computer for between 3-4 years and another one for less than a year.
More than half of the participants use computer mostly at their work place (12 participants,
60%). There are some participants that use computer mostly both at home and workplace (8
participants, 40%). 8 of the participants use computer at home more than their work place.
Majority of the participants stated that they use computer more than 8 hours in a day (13
participants, 65%). 4 of participants (20%) use computer 6 to 8 hours, 2 of them (10%)
answered as 4 to 6 hours and 1 of them (5%) responded as 2 to 4 hours.
4.3 Posttest Questionnaire Results
A posttest questionnaire was given to the users after the system test (see Appendix B). This
questionnaire contains 5 main parts and 39 questions. These questions have a scale from 1 to
9 for the evaluation of the users. Five main parts of the questionnaire are the system
experience, general user reaction, appearance of the METU EDMS pages, terms used in
METU EDMS pages and learning the system usage. Participants’ scores for the related tasks
were analyzed and the mean of these scores were calculated. The results of the questionnaire
are provided in the following sections in a detailed manner for each section.
4.3.1 System Experience (1 question)
The frequency of the users’ visit to the system was asked in this part. The participants of the
first and second stages were the same. Their answers to this question are represented in the
figure below.

36
Figure 4.5: Frequency of System Visits of Participants for First and Second Stages
8 participants from the first and second stages are the same. Moreover, their answers’ to this
question are the same, too. Two of the participants from the first stage did not attend the
second stage. Their answers to this question were never used the system and once in a day.
There were totally 10 participants for the third stage. Their answers to this question are
shown in figure below.
Figure 4.6: Frequency of System Visits of Participants for Third Stage
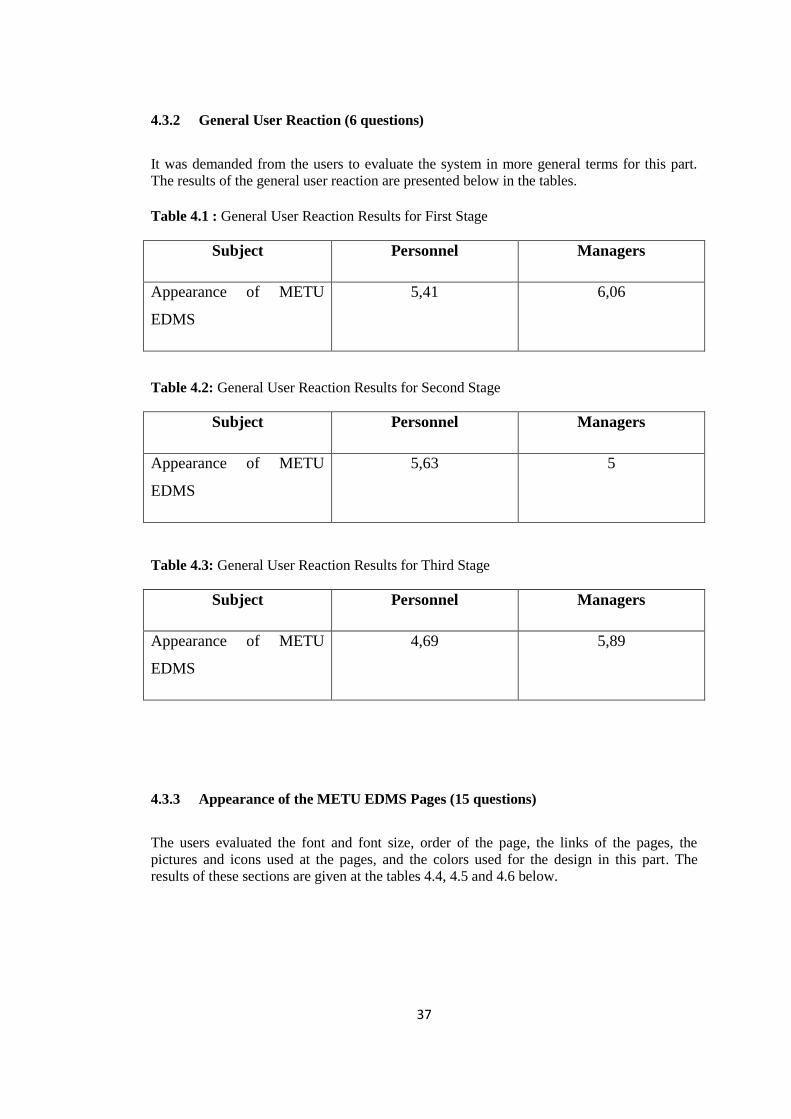
37
4.3.2 General User Reaction (6 questions)
It was demanded from the users to evaluate the system in more general terms for this part.
The results of the general user reaction are presented below in the tables.
Table 4.1 : General User Reaction Results for First Stage
Subject Personnel Managers
Appearance of METU
EDMS
5,41 6,06
Table 4.2: General User Reaction Results for Second Stage
Subject Personnel Managers
Appearance of METU
EDMS
5,63 5
Table 4.3: General User Reaction Results for Third Stage
Subject Personnel Managers
Appearance of METU
EDMS
4,69 5,89
4.3.3 Appearance of the METU EDMS Pages (15 questions)
The users evaluated the font and font size, order of the page, the links of the pages, the
pictures and icons used at the pages, and the colors used for the design in this part. The
results of these sections are given at the tables 4.4, 4.5 and 4.6 below.
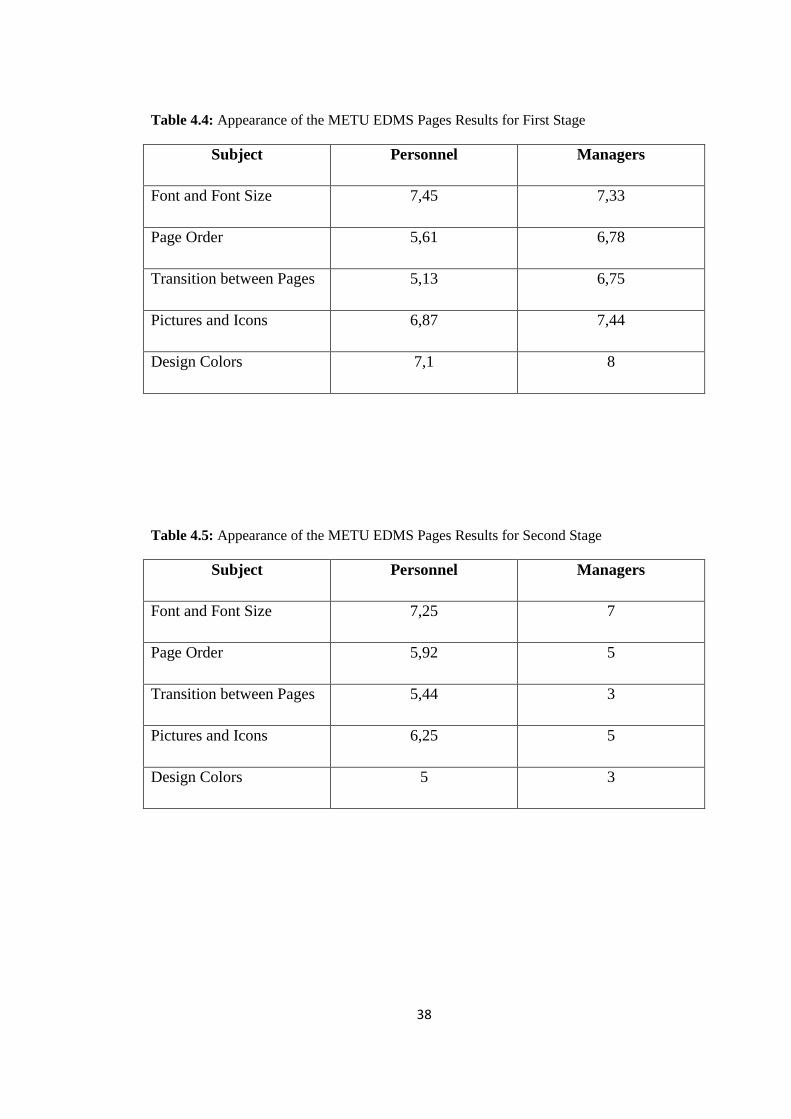
38
Table 4.4: Appearance of the METU EDMS Pages Results for First Stage
Subject Personnel Managers
Font and Font Size 7,45 7,33
Page Order 5,61 6,78
Transition between Pages 5,13 6,75
Pictures and Icons 6,87 7,44
Design Colors 7,1 8
Table 4.5: Appearance of the METU EDMS Pages Results for Second Stage
Subject Personnel Managers
Font and Font Size 7,25 7
Page Order 5,92 5
Transition between Pages 5,44 3
Pictures and Icons 6,25 5
Design Colors 5 3
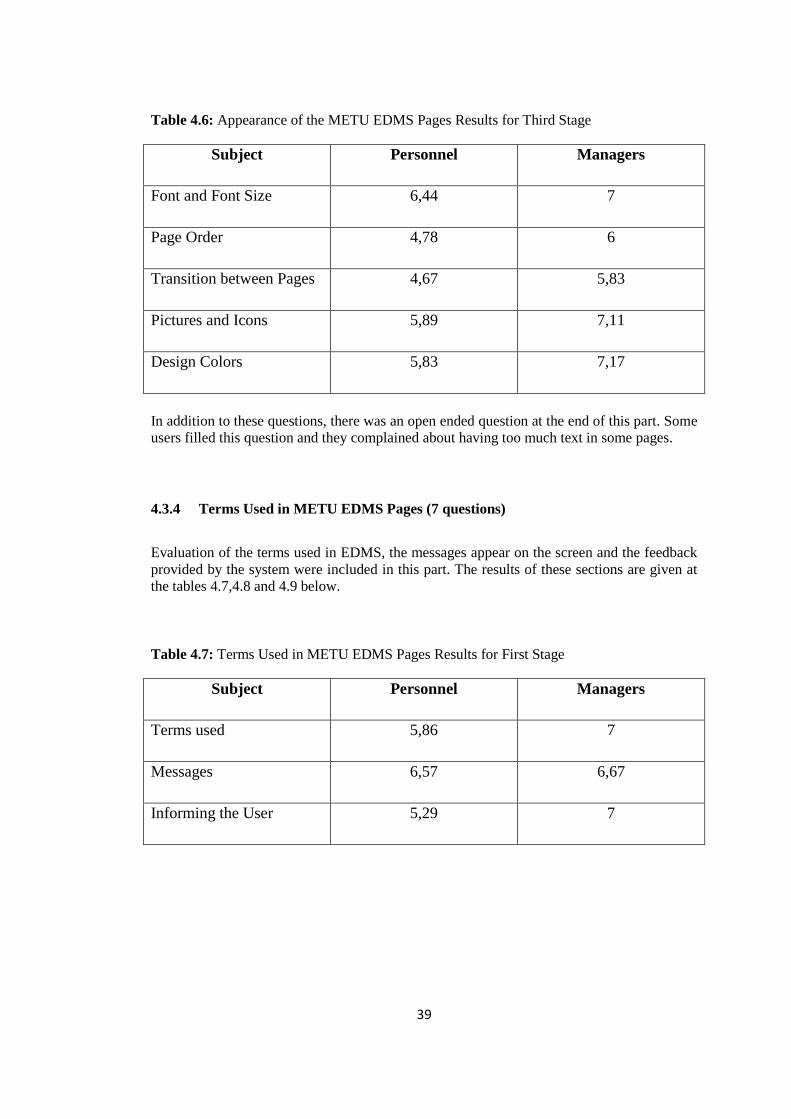
39
Table 4.6: Appearance of the METU EDMS Pages Results for Third Stage
Subject Personnel Managers
Font and Font Size 6,44 7
Page Order 4,78 6
Transition between Pages 4,67 5,83
Pictures and Icons 5,89 7,11
Design Colors 5,83 7,17
In addition to these questions, there was an open ended question at the end of this part. Some
users filled this question and they complained about having too much text in some pages.
4.3.4 Terms Used in METU EDMS Pages (7 questions)
Evaluation of the terms used in EDMS, the messages appear on the screen and the feedback
provided by the system were included in this part. The results of these sections are given at
the tables 4.7,4.8 and 4.9 below.
Table 4.7: Terms Used in METU EDMS Pages Results for First Stage
Subject Personnel Managers
Terms used 5,86 7
Messages 6,57 6,67
Informing the User 5,29 7
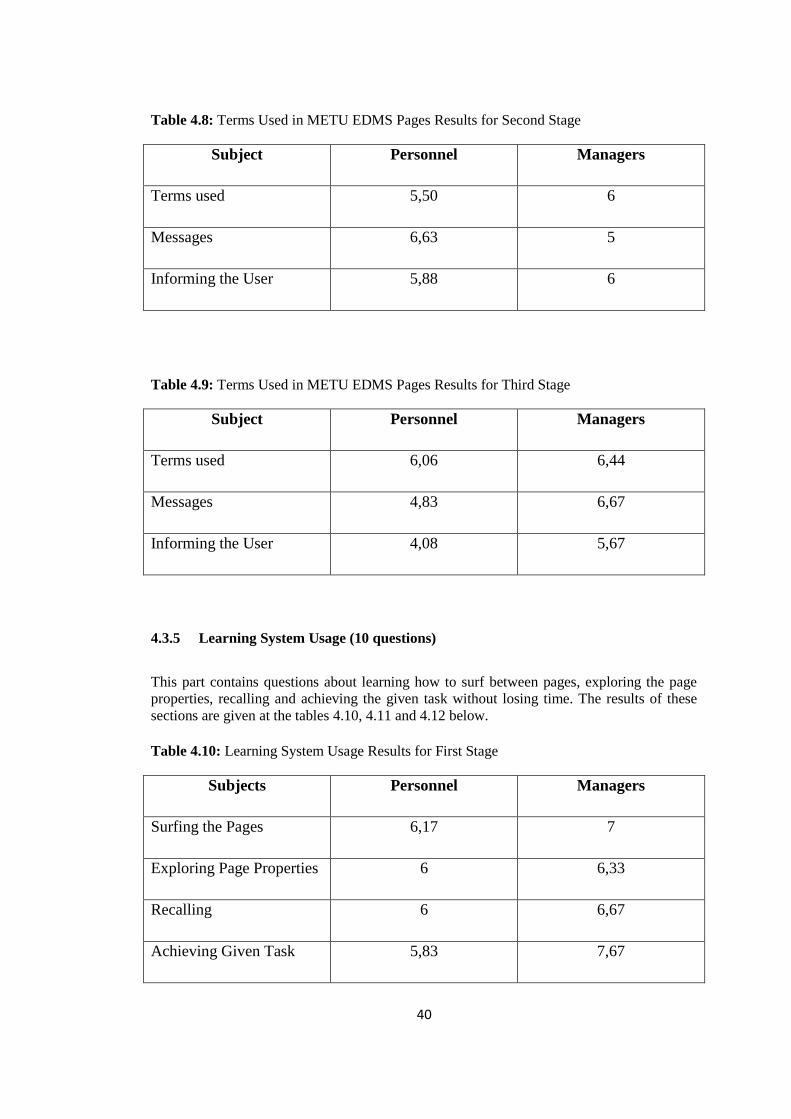
40
Table 4.8: Terms Used in METU EDMS Pages Results for Second Stage
Subject Personnel Managers
Terms used 5,50 6
Messages 6,63 5
Informing the User 5,88 6
Table 4.9: Terms Used in METU EDMS Pages Results for Third Stage
Subject Personnel Managers
Terms used 6,06 6,44
Messages 4,83 6,67
Informing the User 4,08 5,67
4.3.5 Learning System Usage (10 questions)
This part contains questions about learning how to surf between pages, exploring the page
properties, recalling and achieving the given task without losing time. The results of these
sections are given at the tables 4.10, 4.11 and 4.12 below.
Table 4.10: Learning System Usage Results for First Stage
Subjects Personnel Managers
Surfing the Pages 6,17 7
Exploring Page Properties 6 6,33
Recalling 6 6,67
Achieving Given Task 5,83 7,67
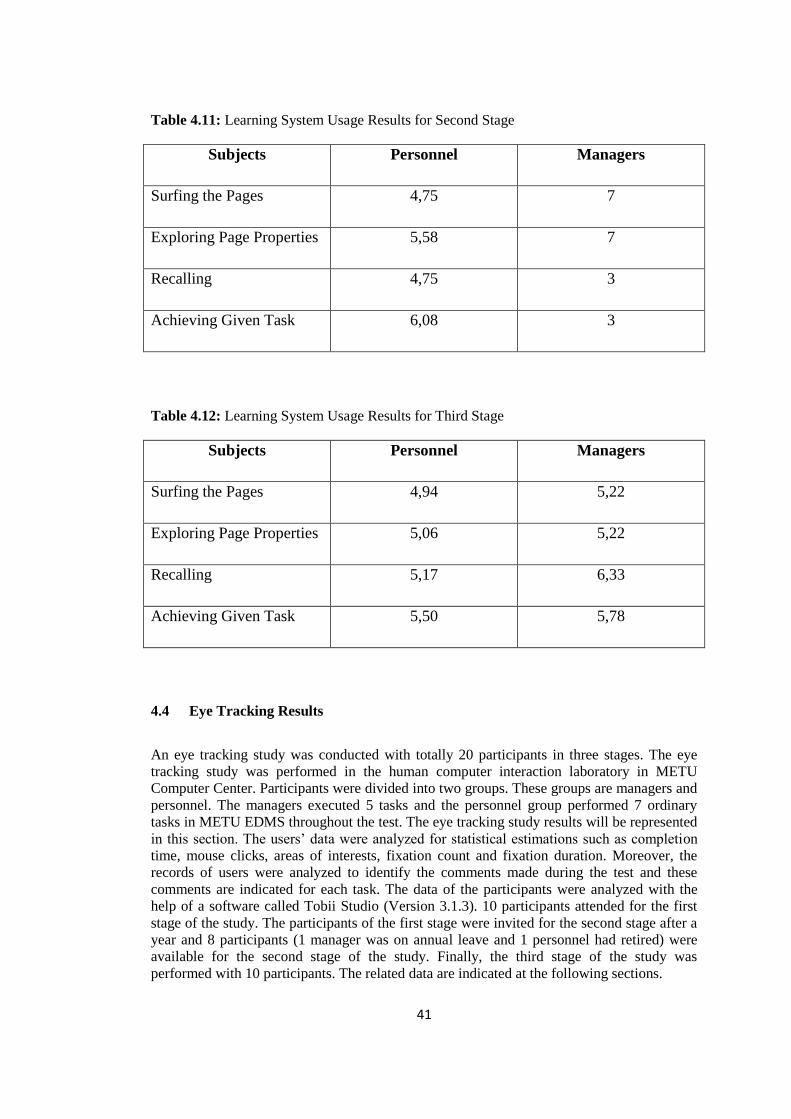
41
Table 4.11: Learning System Usage Results for Second Stage
Subjects Personnel Managers
Surfing the Pages 4,75 7
Exploring Page Properties 5,58 7
Recalling 4,75 3
Achieving Given Task 6,08 3
Table 4.12: Learning System Usage Results for Third Stage
Subjects Personnel Managers
Surfing the Pages 4,94 5,22
Exploring Page Properties 5,06 5,22
Recalling 5,17 6,33
Achieving Given Task 5,50 5,78
4.4 Eye Tracking Results
An eye tracking study was conducted with totally 20 participants in three stages. The eye
tracking study was performed in the human computer interaction laboratory in METU
Computer Center. Participants were divided into two groups. These groups are managers and
personnel. The managers executed 5 tasks and the personnel group performed 7 ordinary
tasks in METU EDMS throughout the test. The eye tracking study results will be represented
in this section. The users’ data were analyzed for statistical estimations such as completion
time, mouse clicks, areas of interests, fixation count and fixation duration. Moreover, the
records of users were analyzed to identify the comments made during the test and these
comments are indicated for each task. The data of the participants were analyzed with the
help of a software called Tobii Studio (Version 3.1.3). 10 participants attended for the first
stage of the study. The participants of the first stage were invited for the second stage after a
year and 8 participants (1 manager was on annual leave and 1 personnel had retired) were
available for the second stage of the study. Finally, the third stage of the study was
performed with 10 participants. The related data are indicated at the following sections.

42
A task analysis was conducted as stated in section 3.4.2. The ideal completion time and
mouse click count were identified. The ideal completion time and mouse click count
information are important so as to see the divergence from the ideal cases. This information
is presented below at the tables 4.13, 4.14, 4.15 and 4.16 for managers and personnel. The
information presented at these tables is used for the graphs that demonstrate the eye tracking
results.
Table 4.13: Ideal Completion Time of Managers
Tasks Completion Time (Expert User)
First Way Second Way Mean
Task 1 57,72 42,88 50,30
Task 2 31,95 31,95
Task 3 46,41 46,41
Task 4 51,74 51,74
Task 5 7,12 14,94 11,03
Table 4.14: Ideal Completion Time of Personnel
Tasks Completion Time (Expert User)
First Way Second Way Mean
Task 1 57,72 42,88 50,30
Task 2 24,72 24,72
Task 3 41,28 41,28
Task 4 54,75 54,75
Task 5 17,52 17,52
Task 6 15,47 15,47
Task 7 7,12 14,94 11,03
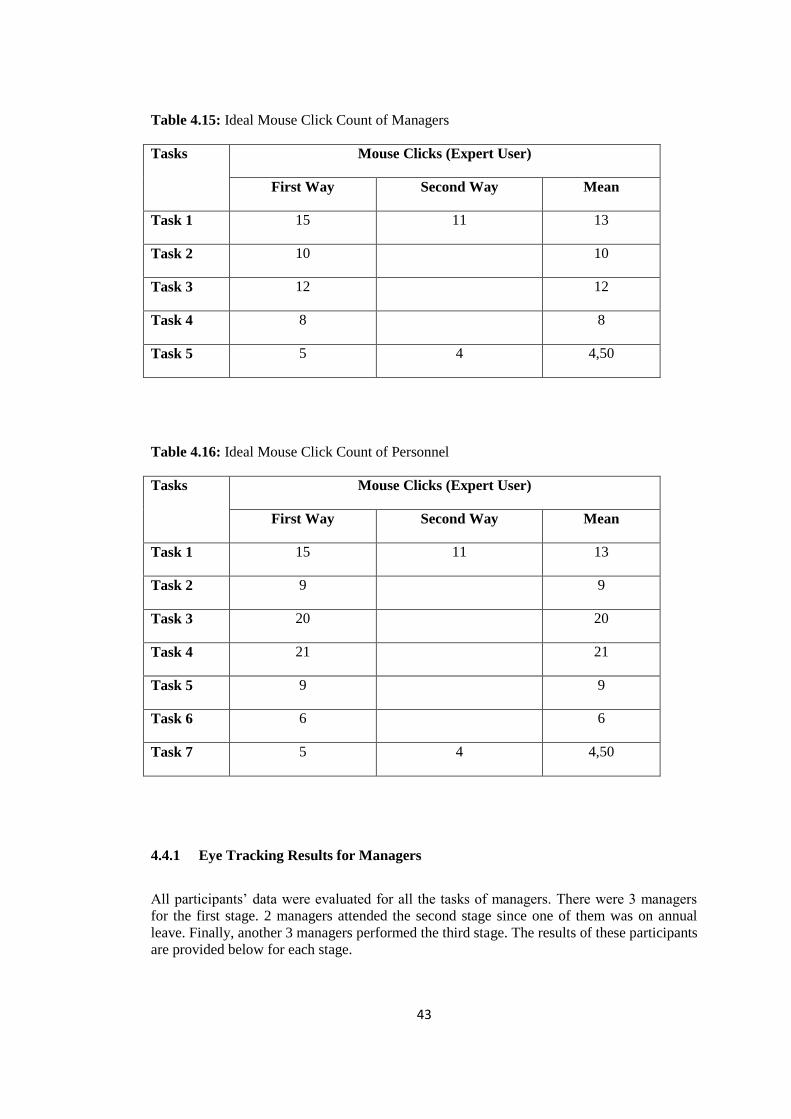
43
Table 4.15: Ideal Mouse Click Count of Managers
Tasks Mouse Clicks (Expert User)
First Way Second Way Mean
Task 1 15 11 13
Task 2 10 10
Task 3 12 12
Task 4 8 8
Task 5 5 4 4,50
Table 4.16: Ideal Mouse Click Count of Personnel
Tasks Mouse Clicks (Expert User)
First Way Second Way Mean
Task 1 15 11 13
Task 2 9 9
Task 3 20 20
Task 4 21 21
Task 5 9 9
Task 6 6 6
Task 7 5 4 4,50
4.4.1 Eye Tracking Results for Managers
All participants’ data were evaluated for all the tasks of managers. There were 3 managers
for the first stage. 2 managers attended the second stage since one of them was on annual
leave. Finally, another 3 managers performed the third stage. The results of these participants
are provided below for each stage.
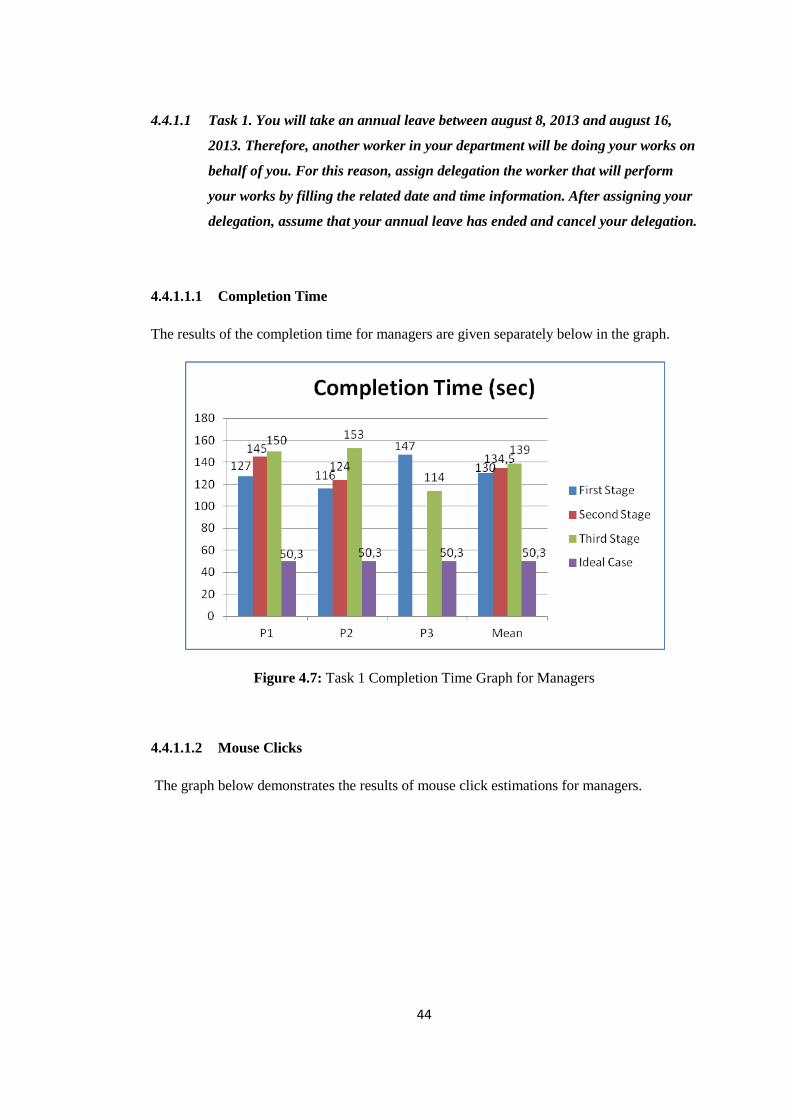
44
4.4.1.1 Task 1. You will take an annual leave between august 8, 2013 and august 16,
2013. Therefore, another worker in your department will be doing your works on
behalf of you. For this reason, assign delegation the worker that will perform
your works by filling the related date and time information. After assigning your
delegation, assume that your annual leave has ended and cancel your delegation.
4.4.1.1.1 Completion Time
The results of the completion time for managers are given separately below in the graph.
Figure 4.7: Task 1 Completion Time Graph for Managers
4.4.1.1.2 Mouse Clicks
The graph below demonstrates the results of mouse click estimations for managers.
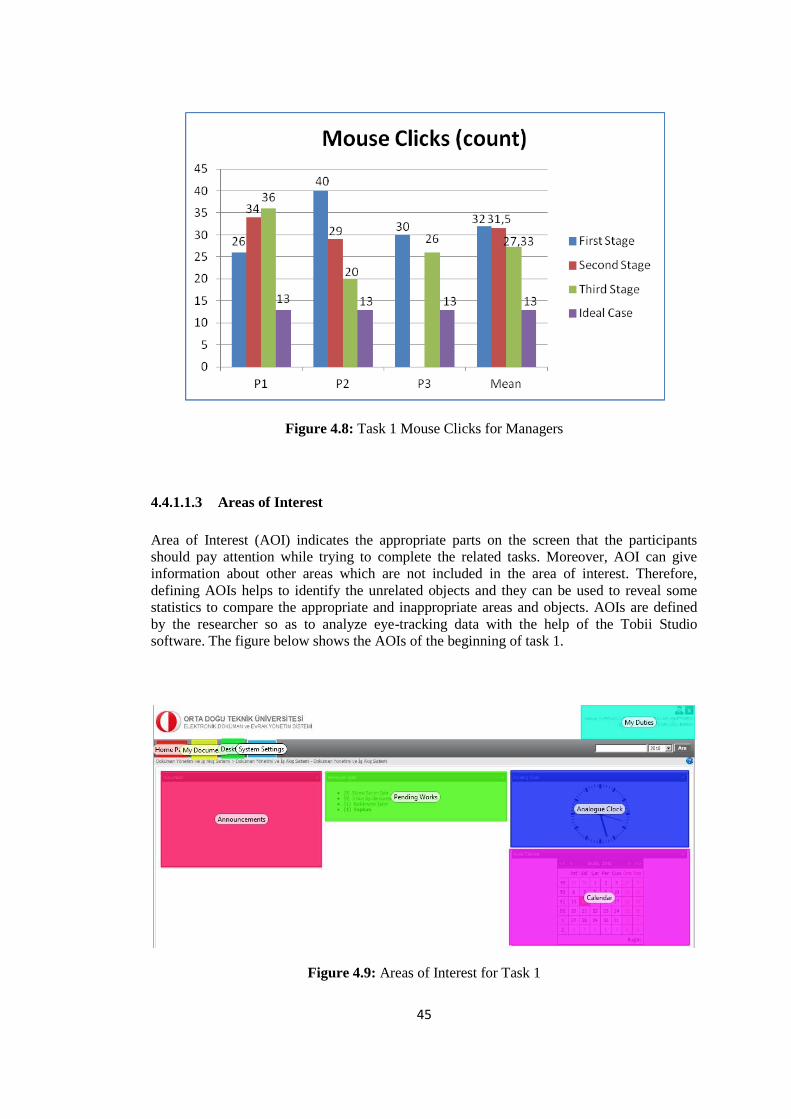
45
Figure 4.8: Task 1 Mouse Clicks for Managers
4.4.1.1.3 Areas of Interest
Area of Interest (AOI) indicates the appropriate parts on the screen that the participants
should pay attention while trying to complete the related tasks. Moreover, AOI can give
information about other areas which are not included in the area of interest. Therefore,
defining AOIs helps to identify the unrelated objects and they can be used to reveal some
statistics to compare the appropriate and inappropriate areas and objects. AOIs are defined
by the researcher so as to analyze eye-tracking data with the help of the Tobii Studio
software. The figure below shows the AOIs of the beginning of task 1.
Figure 4.9: Areas of Interest for Task 1
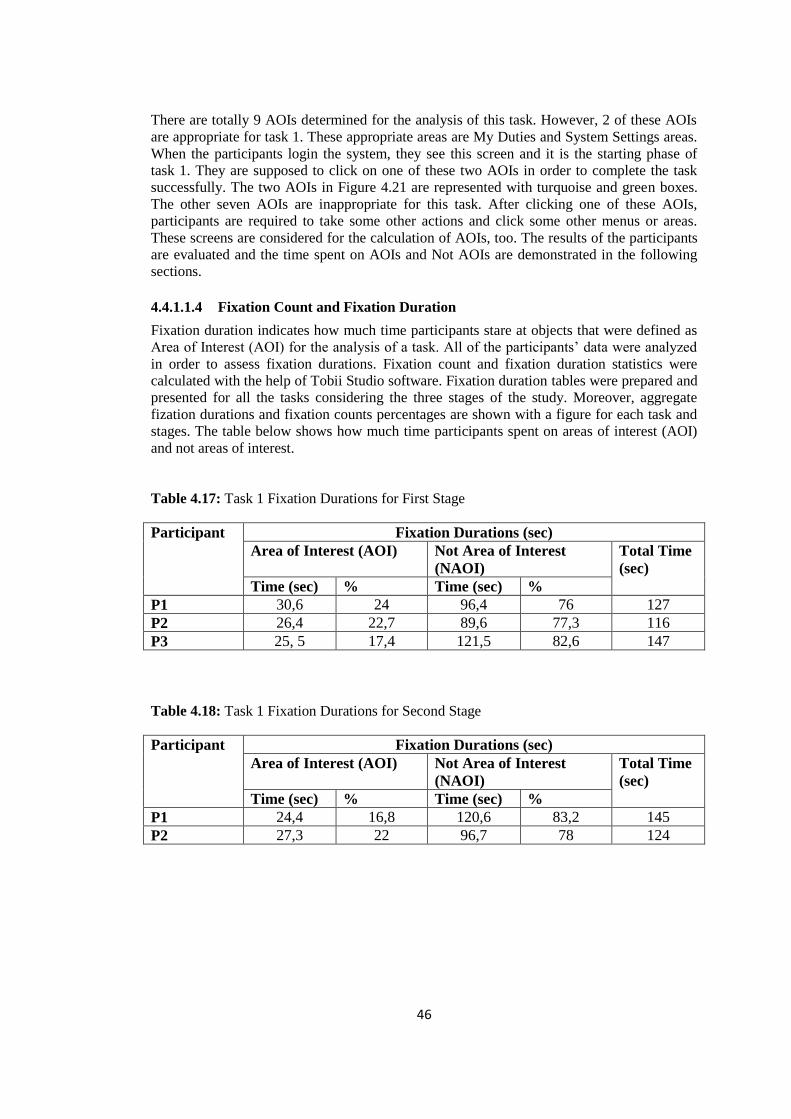
46
There are totally 9 AOIs determined for the analysis of this task. However, 2 of these AOIs
are appropriate for task 1. These appropriate areas are My Duties and System Settings areas.
When the participants login the system, they see this screen and it is the starting phase of
task 1. They are supposed to click on one of these two AOIs in order to complete the task
successfully. The two AOIs in Figure 4.21 are represented with turquoise and green boxes.
The other seven AOIs are inappropriate for this task. After clicking one of these AOIs,
participants are required to take some other actions and click some other menus or areas.
These screens are considered for the calculation of AOIs, too. The results of the participants
are evaluated and the time spent on AOIs and Not AOIs are demonstrated in the following
sections.
4.4.1.1.4 Fixation Count and Fixation Duration
Fixation duration indicates how much time participants stare at objects that were defined as
Area of Interest (AOI) for the analysis of a task. All of the participants’ data were analyzed
in order to assess fixation durations. Fixation count and fixation duration statistics were
calculated with the help of Tobii Studio software. Fixation duration tables were prepared and
presented for all the tasks considering the three stages of the study. Moreover, aggregate
fization durations and fixation counts percentages are shown with a figure for each task and
stages. The table below shows how much time participants spent on areas of interest (AOI)
and not areas of interest.
Table 4.17: Task 1 Fixation Durations for First Stage
Participant Fixation Durations (sec)
Area of Interest (AOI) Not Area of Interest
(NAOI)
Total Time
(sec)
Time (sec) % Time (sec) %
P1 30,6 24 96,4 76 127
P2 26,4 22,7 89,6 77,3 116
P3 25, 5 17,4 121,5 82,6 147
Table 4.18: Task 1 Fixation Durations for Second Stage
Participant Fixation Durations (sec)
Area of Interest (AOI) Not Area of Interest
(NAOI)
Total Time
(sec)
Time (sec) % Time (sec) %
P1 24,4 16,8 120,6 83,2 145
P2 27,3 22 96,7 78 124
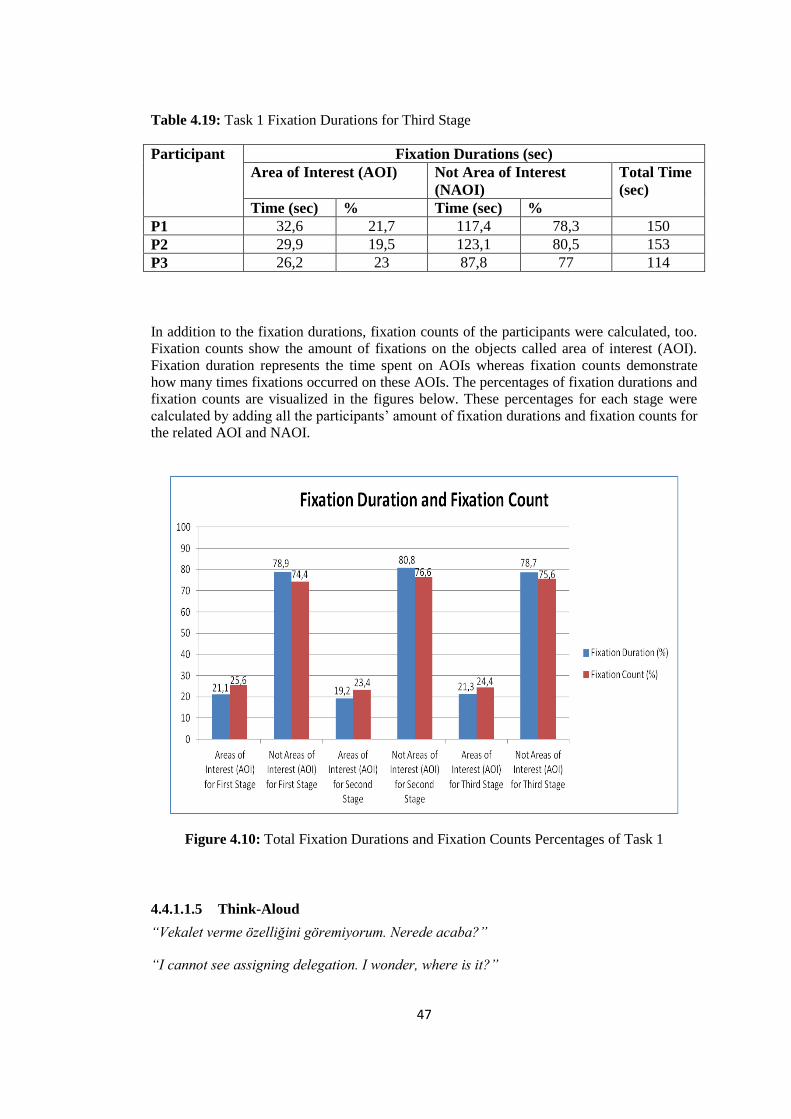
47
Table 4.19: Task 1 Fixation Durations for Third Stage
Participant Fixation Durations (sec)
Area of Interest (AOI) Not Area of Interest
(NAOI)
Total Time
(sec)
Time (sec) % Time (sec) %
P1 32,6 21,7 117,4 78,3 150
P2 29,9 19,5 123,1 80,5 153
P3 26,2 23 87,8 77 114
In addition to the fixation durations, fixation counts of the participants were calculated, too.
Fixation counts show the amount of fixations on the objects called area of interest (AOI).
Fixation duration represents the time spent on AOIs whereas fixation counts demonstrate
how many times fixations occurred on these AOIs. The percentages of fixation durations and
fixation counts are visualized in the figures below. These percentages for each stage were
calculated by adding all the participants’ amount of fixation durations and fixation counts for
the related AOI and NAOI.
Figure 4.10: Total Fixation Durations and Fixation Counts Percentages of Task 1
4.4.1.1.5 Think-Aloud
“Vekalet verme özelliğini göremiyorum. Nerede acaba?”
“I cannot see assigning delegation. I wonder, where is it?”
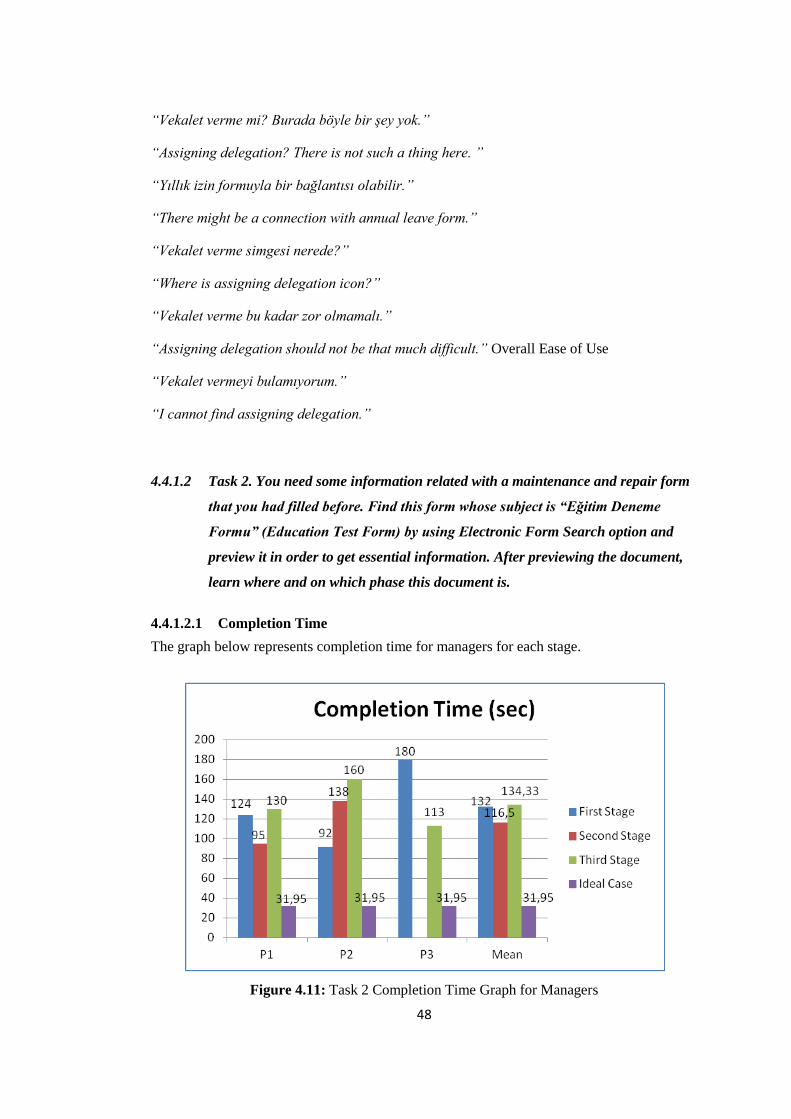
48
“Vekalet verme mi? Burada böyle bir şey yok.”
“Assigning delegation? There is not such a thing here. ”
“Yıllık izin formuyla bir bağlantısı olabilir.”
“There might be a connection with annual leave form.”
“Vekalet verme simgesi nerede?”
“Where is assigning delegation icon?”
“Vekalet verme bu kadar zor olmamalı.”
“Assigning delegation should not be that much difficult.” Overall Ease of Use
“Vekalet vermeyi bulamıyorum.”
“I cannot find assigning delegation.”
4.4.1.2 Task 2. You need some information related with a maintenance and repair form
that you had filled before. Find this form whose subject is “Eğitim Deneme
Formu” (Education Test Form) by using Electronic Form Search option and
preview it in order to get essential information. After previewing the document,
learn where and on which phase this document is.
4.4.1.2.1 Completion Time
The graph below represents completion time for managers for each stage.
Figure 4.11: Task 2 Completion Time Graph for Managers
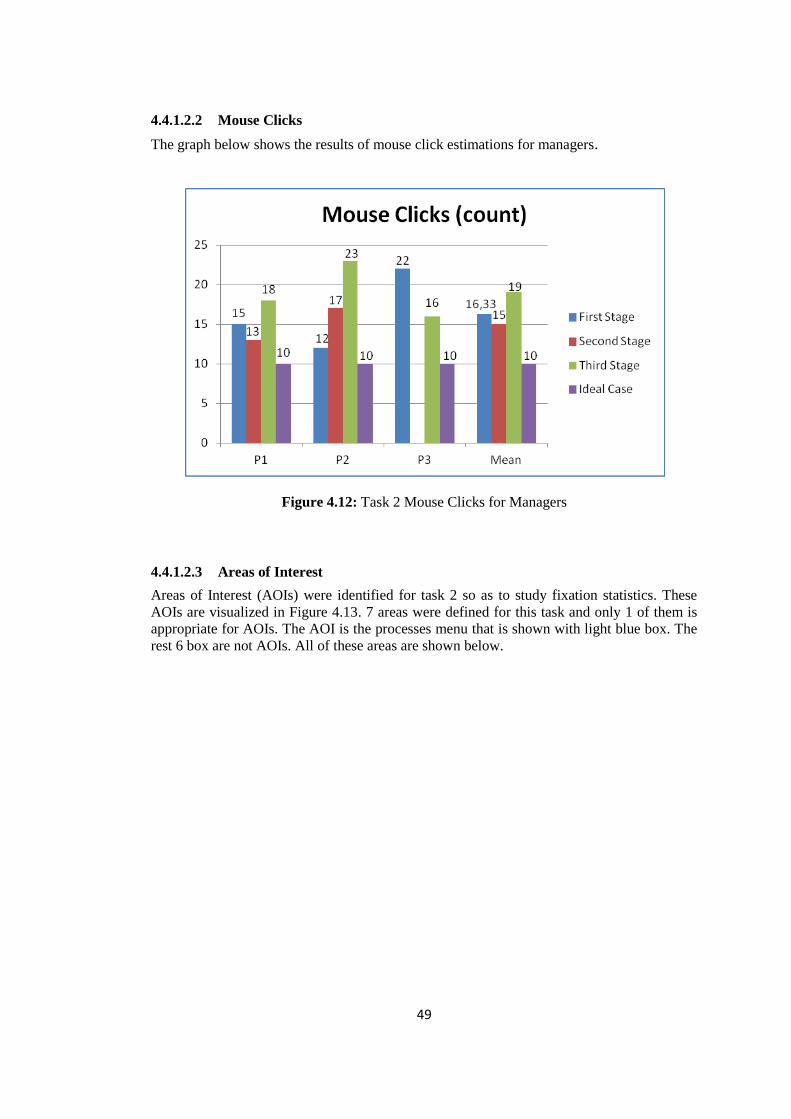
49
4.4.1.2.2 Mouse Clicks
The graph below shows the results of mouse click estimations for managers.
Figure 4.12: Task 2 Mouse Clicks for Managers
4.4.1.2.3 Areas of Interest
Areas of Interest (AOIs) were identified for task 2 so as to study fixation statistics. These
AOIs are visualized in Figure 4.13. 7 areas were defined for this task and only 1 of them is
appropriate for AOIs. The AOI is the processes menu that is shown with light blue box. The
rest 6 box are not AOIs. All of these areas are shown below.
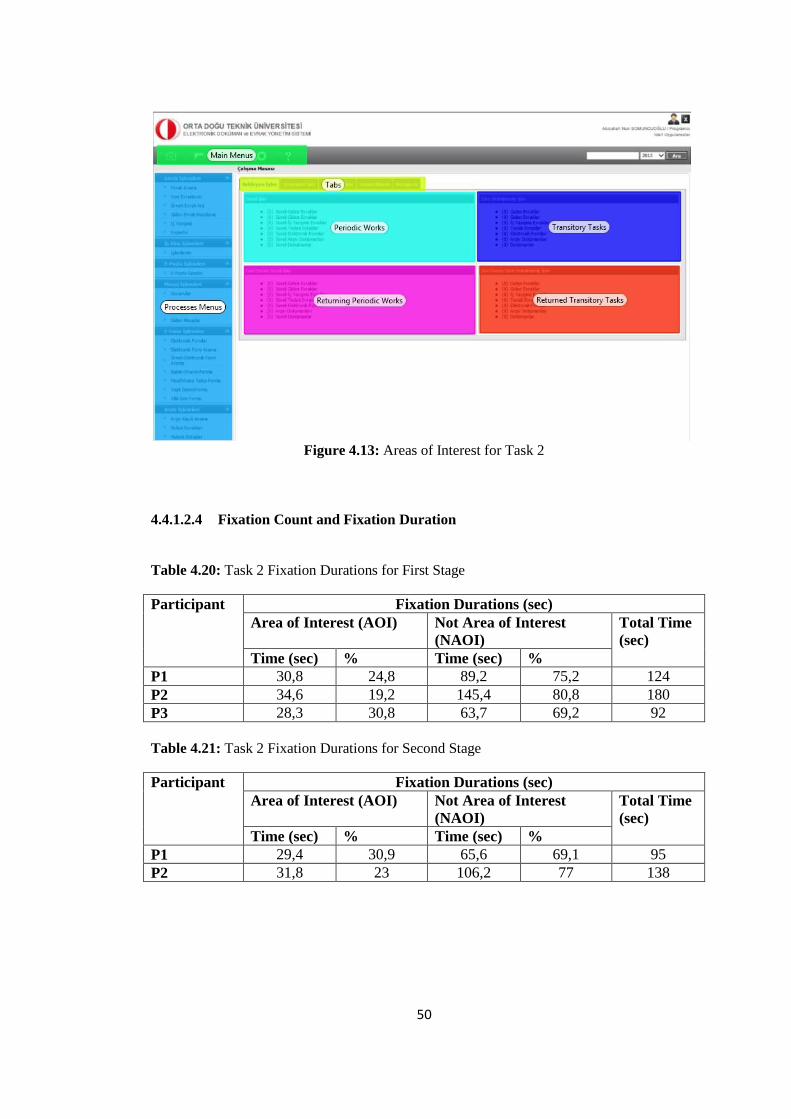
50
Figure 4.13: Areas of Interest for Task 2
4.4.1.2.4 Fixation Count and Fixation Duration
Table 4.20: Task 2 Fixation Durations for First Stage
Participant Fixation Durations (sec)
Area of Interest (AOI) Not Area of Interest
(NAOI)
Total Time
(sec)
Time (sec) % Time (sec) %
P1 30,8 24,8 89,2 75,2 124
P2 34,6 19,2 145,4 80,8 180
P3 28,3 30,8 63,7 69,2 92
Table 4.21: Task 2 Fixation Durations for Second Stage
Participant Fixation Durations (sec)
Area of Interest (AOI) Not Area of Interest
(NAOI)
Total Time
(sec)
Time (sec) % Time (sec) %
P1 29,4 30,9 65,6 69,1 95
P2 31,8 23 106,2 77 138
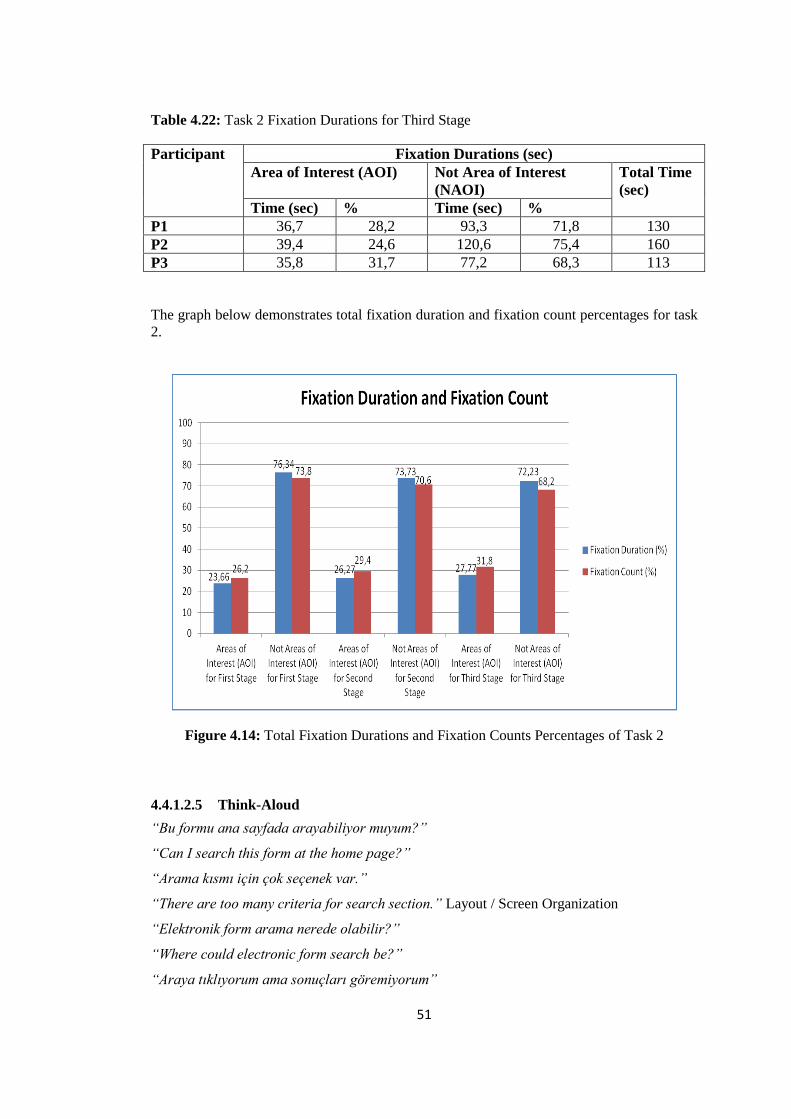
51
Table 4.22: Task 2 Fixation Durations for Third Stage
Participant Fixation Durations (sec)
Area of Interest (AOI) Not Area of Interest
(NAOI)
Total Time
(sec)
Time (sec) % Time (sec) %
P1 36,7 28,2 93,3 71,8 130
P2 39,4 24,6 120,6 75,4 160
P3 35,8 31,7 77,2 68,3 113
The graph below demonstrates total fixation duration and fixation count percentages for task
2.
Figure 4.14: Total Fixation Durations and Fixation Counts Percentages of Task 2
4.4.1.2.5 Think-Aloud
“Bu formu ana sayfada arayabiliyor muyum?”
“Can I search this form at the home page?”
“Arama kısmı için çok seçenek var.”
“There are too many criteria for search section.” Layout / Screen Organization
“Elektronik form arama nerede olabilir?”
“Where could electronic form search be?”
“Araya tıklıyorum ama sonuçları göremiyorum”
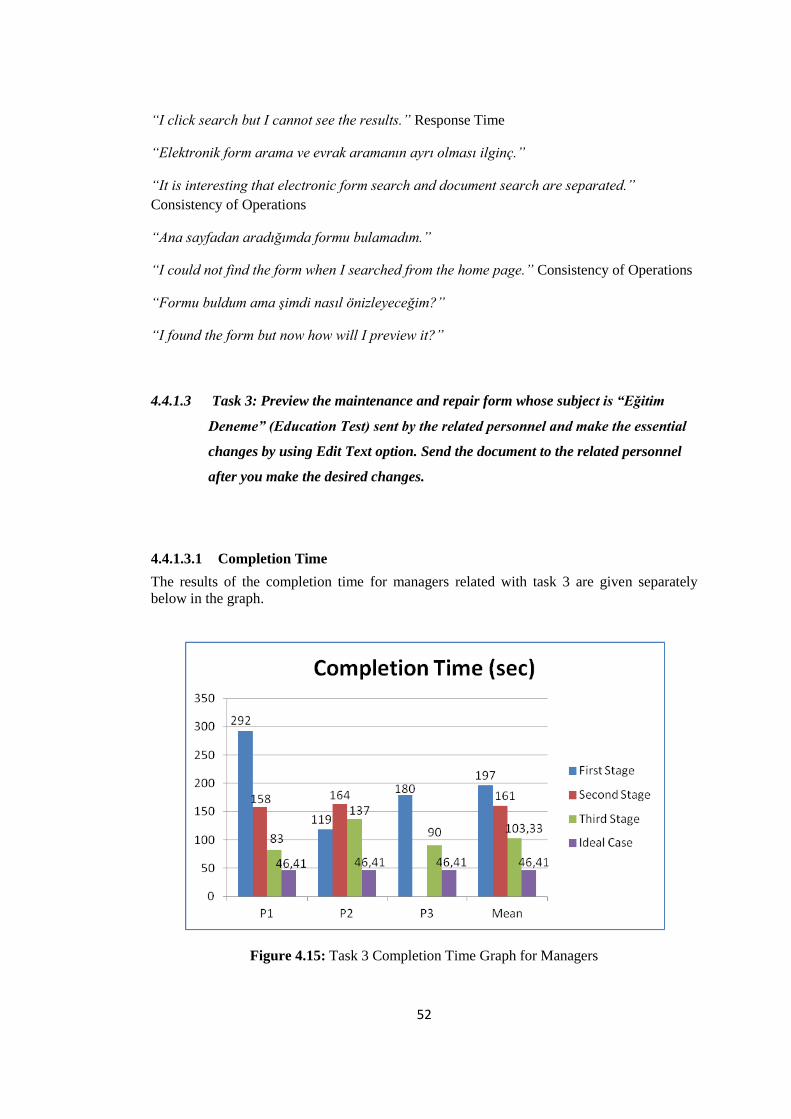
52
“I click search but I cannot see the results.” Response Time
“Elektronik form arama ve evrak aramanın ayrı olması ilginç.”
“It is interesting that electronic form search and document search are separated.”
Consistency of Operations
“Ana sayfadan aradığımda formu bulamadım.”
“I could not find the form when I searched from the home page.” Consistency of Operations
“Formu buldum ama şimdi nasıl önizleyeceğim?”
“I found the form but now how will I preview it?”
4.4.1.3 Task 3: Preview the maintenance and repair form whose subject is “Eğitim
Deneme” (Education Test) sent by the related personnel and make the essential
changes by using Edit Text option. Send the document to the related personnel
after you make the desired changes.
4.4.1.3.1 Completion Time
The results of the completion time for managers related with task 3 are given separately
below in the graph.
Figure 4.15: Task 3 Completion Time Graph for Managers
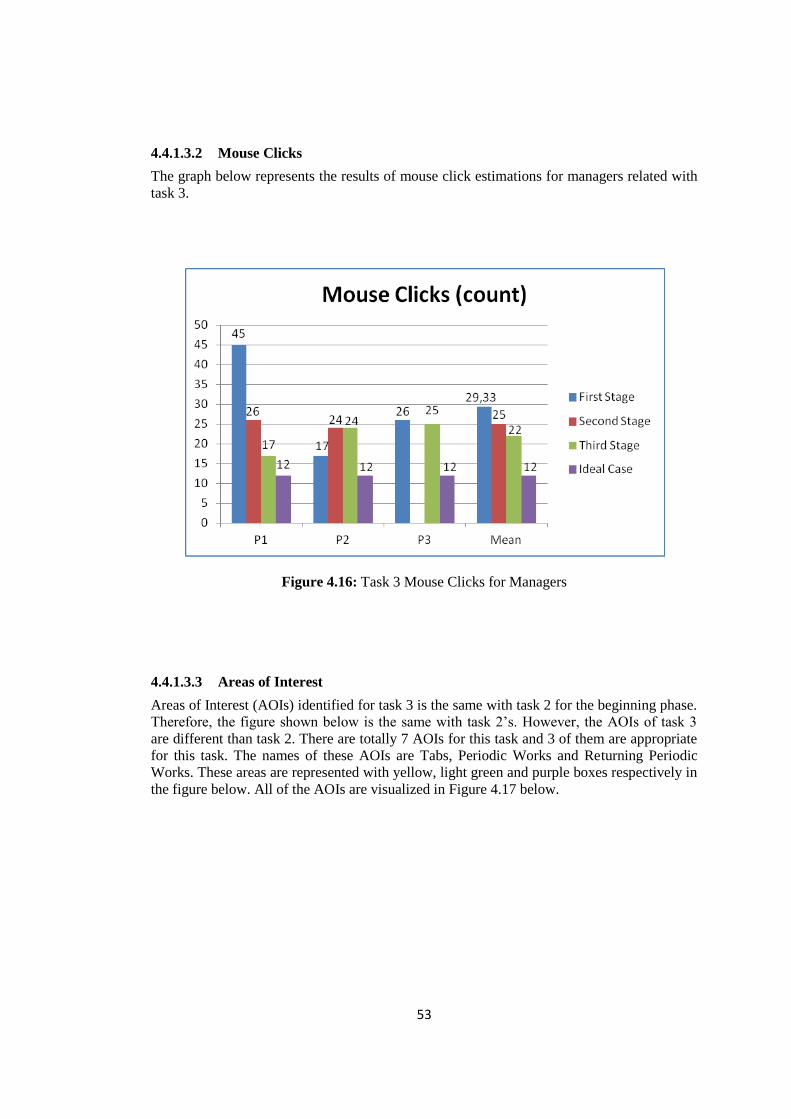
53
4.4.1.3.2 Mouse Clicks
The graph below represents the results of mouse click estimations for managers related with
task 3.
Figure 4.16: Task 3 Mouse Clicks for Managers
4.4.1.3.3 Areas of Interest
Areas of Interest (AOIs) identified for task 3 is the same with task 2 for the beginning phase.
Therefore, the figure shown below is the same with task 2’s. However, the AOIs of task 3
are different than task 2. There are totally 7 AOIs for this task and 3 of them are appropriate
for this task. The names of these AOIs are Tabs, Periodic Works and Returning Periodic
Works. These areas are represented with yellow, light green and purple boxes respectively in
the figure below. All of the AOIs are visualized in Figure 4.17 below.
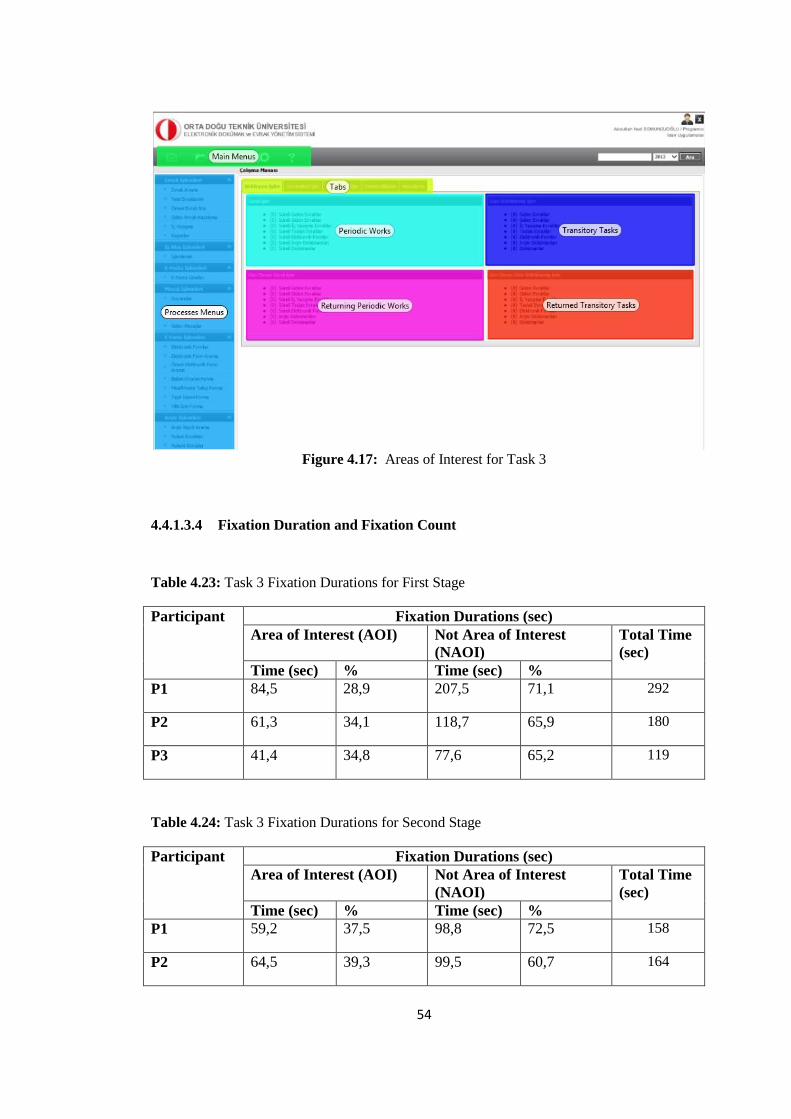
54
Figure 4.17: Areas of Interest for Task 3
4.4.1.3.4 Fixation Duration and Fixation Count
Table 4.23: Task 3 Fixation Durations for First Stage
Participant Fixation Durations (sec)
Area of Interest (AOI) Not Area of Interest
(NAOI)
Total Time
(sec)
Time (sec) % Time (sec) %
P1 84,5 28,9 207,5 71,1 292
P2 61,3 34,1 118,7 65,9 180
P3 41,4 34,8 77,6 65,2 119
Table 4.24: Task 3 Fixation Durations for Second Stage
Participant Fixation Durations (sec)
Area of Interest (AOI) Not Area of Interest
(NAOI)
Total Time
(sec)
Time (sec) % Time (sec) %
P1 59,2 37,5 98,8 72,5 158
P2 64,5 39,3 99,5 60,7 164
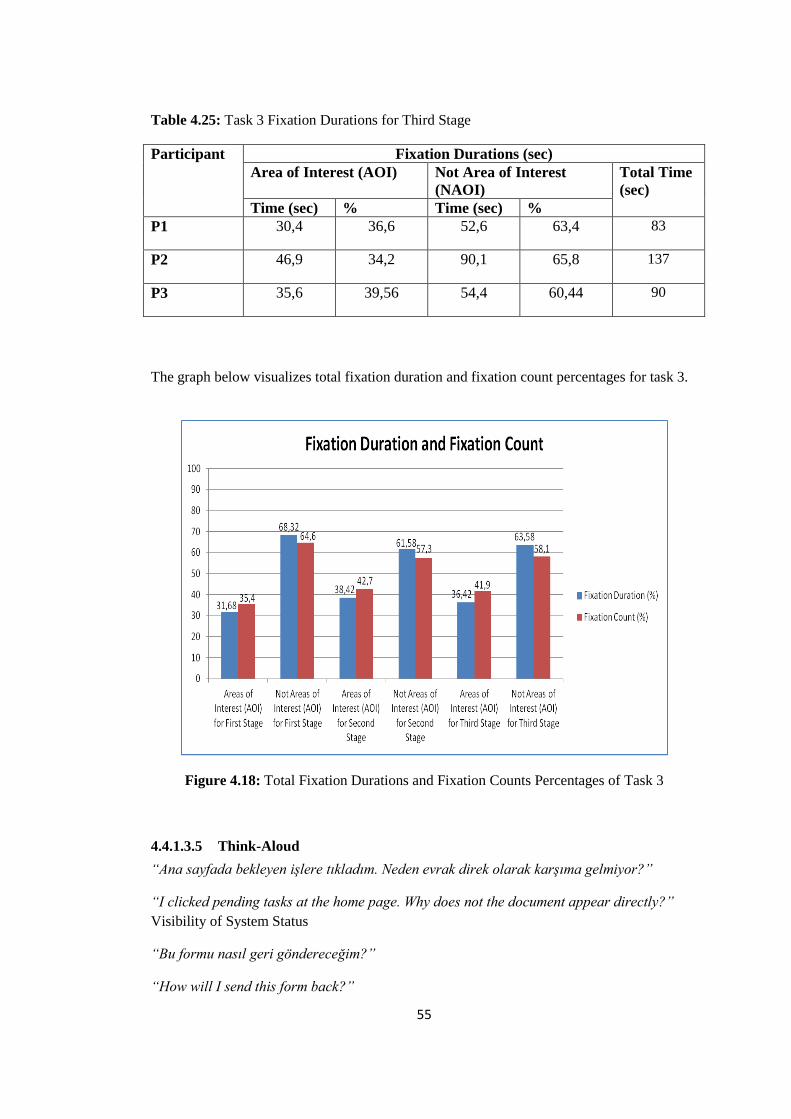
55
Table 4.25: Task 3 Fixation Durations for Third Stage
Participant Fixation Durations (sec)
Area of Interest (AOI) Not Area of Interest
(NAOI)
Total Time
(sec)
Time (sec) % Time (sec) %
P1 30,4 36,6 52,6 63,4 83
P2 46,9 34,2 90,1 65,8 137
P3 35,6 39,56 54,4 60,44 90
The graph below visualizes total fixation duration and fixation count percentages for task 3.
Figure 4.18: Total Fixation Durations and Fixation Counts Percentages of Task 3
4.4.1.3.5 Think-Aloud
“Ana sayfada bekleyen işlere tıkladım. Neden evrak direk olarak karşıma gelmiyor?”
“I clicked pending tasks at the home page. Why does not the document appear directly?”
Visibility of System Status
“Bu formu nasıl geri göndereceğim?”
“How will I send this form back?”
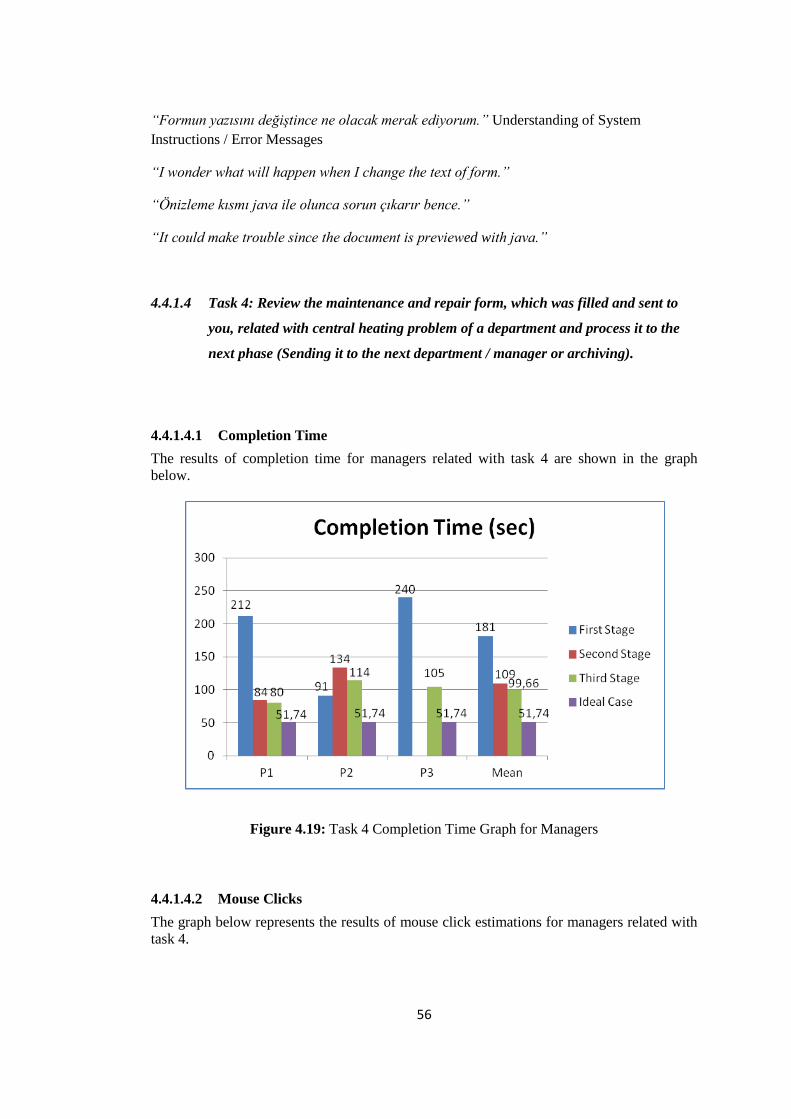
56
“Formun yazısını değiştince ne olacak merak ediyorum.” Understanding of System
Instructions / Error Messages
“I wonder what will happen when I change the text of form.”
“Önizleme kısmı java ile olunca sorun çıkarır bence.”
“It could make trouble since the document is previewed with java.”
4.4.1.4 Task 4: Review the maintenance and repair form, which was filled and sent to
you, related with central heating problem of a department and process it to the
next phase (Sending it to the next department / manager or archiving).
4.4.1.4.1 Completion Time
The results of completion time for managers related with task 4 are shown in the graph
below.
Figure 4.19: Task 4 Completion Time Graph for Managers
4.4.1.4.2 Mouse Clicks
The graph below represents the results of mouse click estimations for managers related with
task 4.
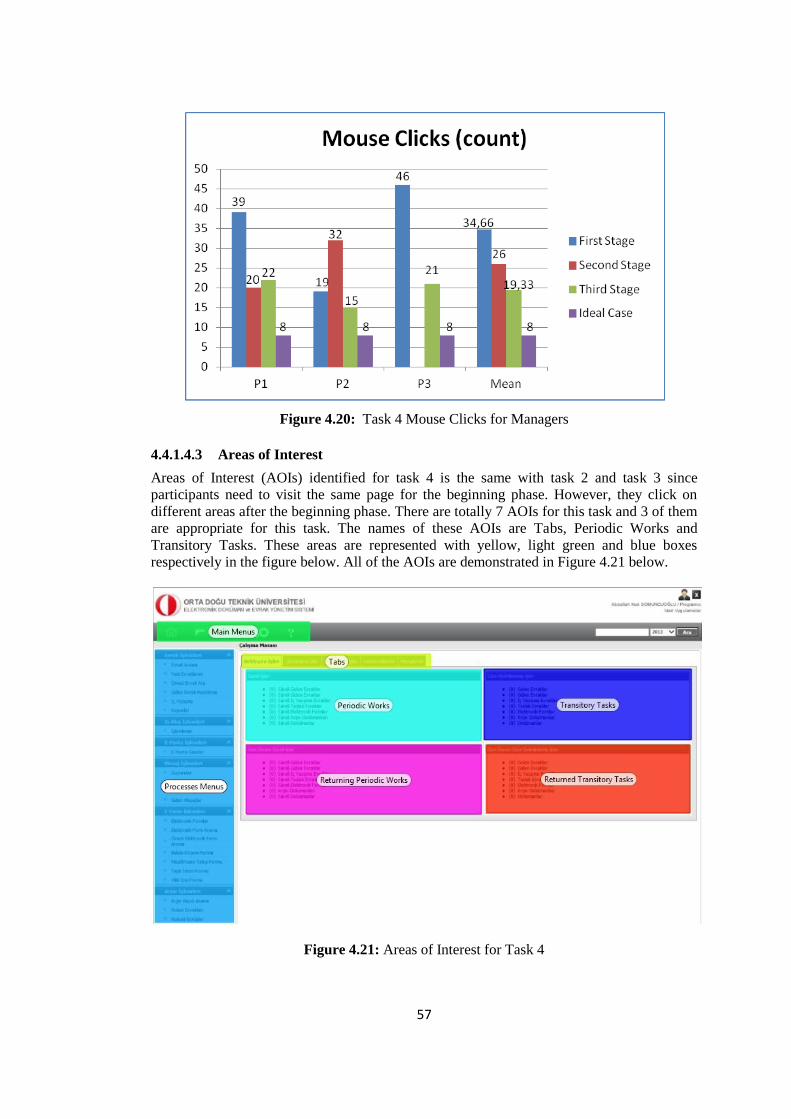
57
Figure 4.20: Task 4 Mouse Clicks for Managers
4.4.1.4.3 Areas of Interest
Areas of Interest (AOIs) identified for task 4 is the same with task 2 and task 3 since
participants need to visit the same page for the beginning phase. However, they click on
different areas after the beginning phase. There are totally 7 AOIs for this task and 3 of them
are appropriate for this task. The names of these AOIs are Tabs, Periodic Works and
Transitory Tasks. These areas are represented with yellow, light green and blue boxes
respectively in the figure below. All of the AOIs are demonstrated in Figure 4.21 below.
Figure 4.21: Areas of Interest for Task 4
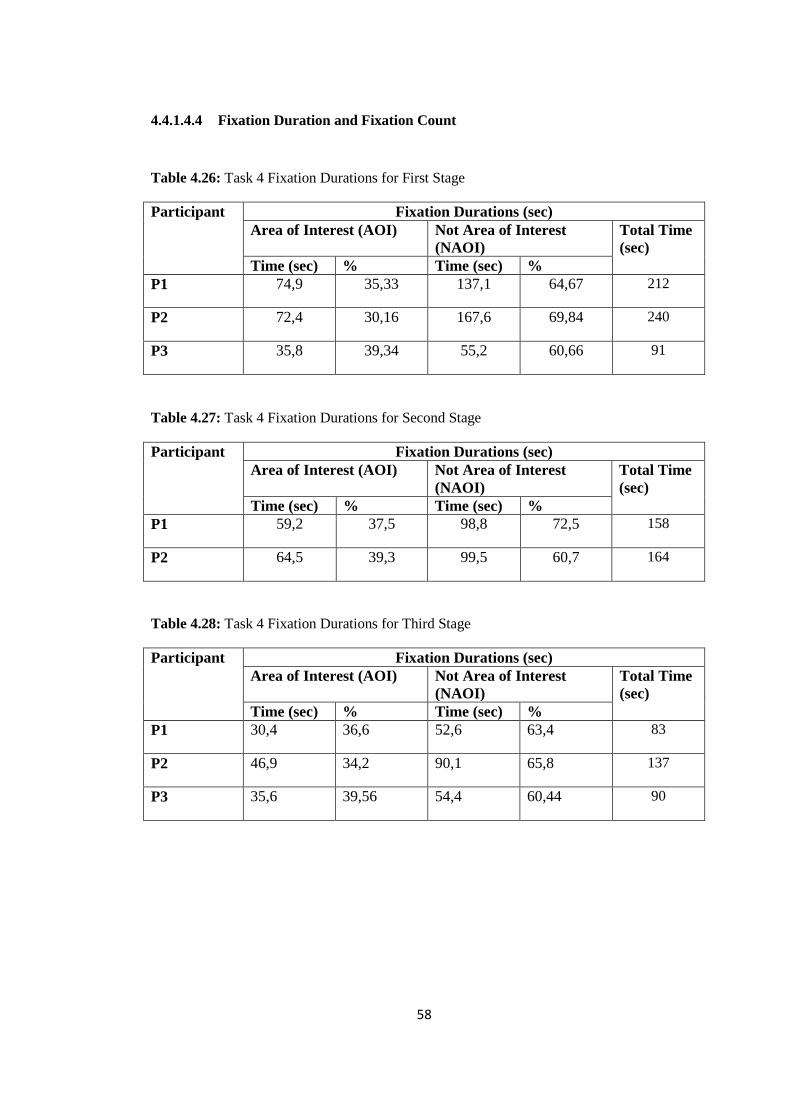
58
4.4.1.4.4 Fixation Duration and Fixation Count
Table 4.26: Task 4 Fixation Durations for First Stage
Participant Fixation Durations (sec)
Area of Interest (AOI) Not Area of Interest
(NAOI)
Total Time
(sec)
Time (sec) % Time (sec) %
P1 74,9 35,33 137,1 64,67 212
P2 72,4 30,16 167,6 69,84 240
P3 35,8 39,34 55,2 60,66 91
Table 4.27: Task 4 Fixation Durations for Second Stage
Participant Fixation Durations (sec)
Area of Interest (AOI) Not Area of Interest
(NAOI)
Total Time
(sec)
Time (sec) % Time (sec) %
P1 59,2 37,5 98,8 72,5 158
P2 64,5 39,3 99,5 60,7 164
Table 4.28: Task 4 Fixation Durations for Third Stage
Participant Fixation Durations (sec)
Area of Interest (AOI) Not Area of Interest
(NAOI)
Total Time
(sec)
Time (sec) % Time (sec) %
P1 30,4 36,6 52,6 63,4 83
P2 46,9 34,2 90,1 65,8 137
P3 35,6 39,56 54,4 60,44 90
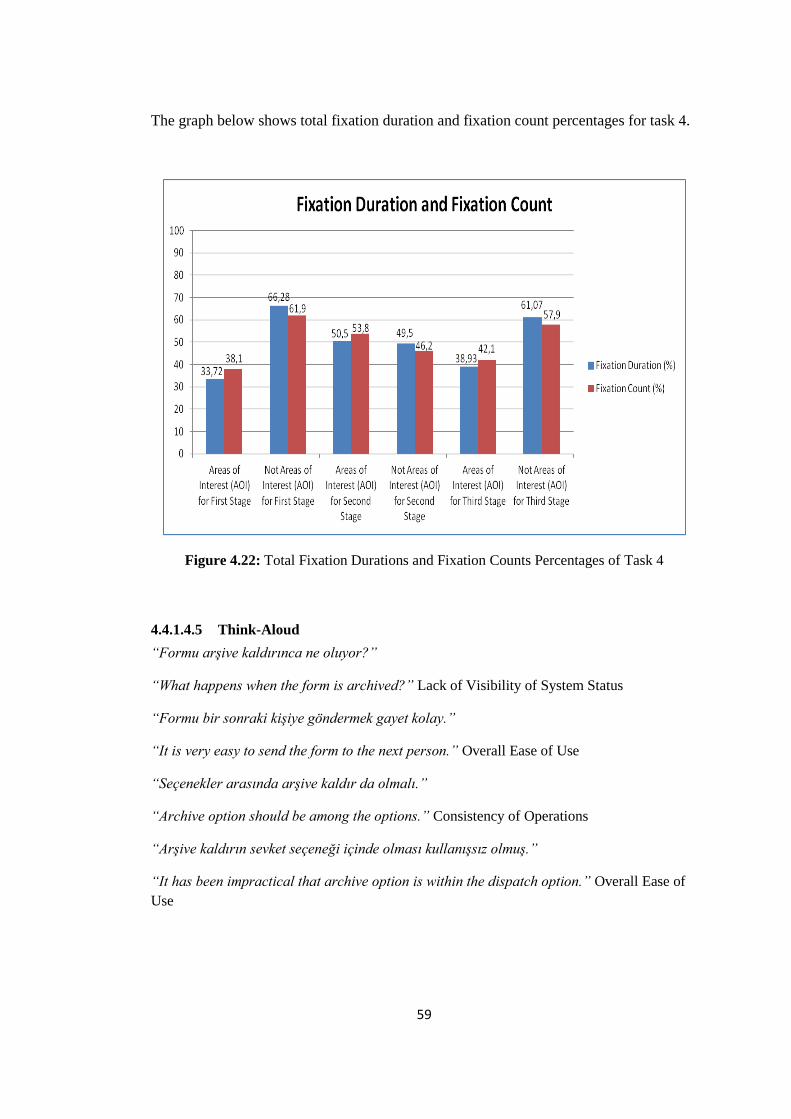
59
The graph below shows total fixation duration and fixation count percentages for task 4.
Figure 4.22: Total Fixation Durations and Fixation Counts Percentages of Task 4
4.4.1.4.5 Think-Aloud
“Formu arşive kaldırınca ne oluyor?”
“What happens when the form is archived?” Lack of Visibility of System Status
“Formu bir sonraki kişiye göndermek gayet kolay.”
“It is very easy to send the form to the next person.” Overall Ease of Use
“Seçenekler arasında arşive kaldır da olmalı.”
“Archive option should be among the options.” Consistency of Operations
“Arşive kaldırın sevket seçeneği içinde olması kullanışsız olmuş.”
“It has been impractical that archive option is within the dispatch option.” Overall Ease of
Use

60
4.4.1.5 Task 5: You want to make some changes on a repair and maintenance form’s
text. However, you do not know how to make these changes and direct it to the
related personnel. Find the help menus inside the system so as to get help and
get information about the related situation from these menus.
4.4.1.5.1 Completion Time
The results of completion time for managers related with task 5 are demonstrated in the
graph below.
Figure 4.23: Task 5 Completion Time Graph for Managers
4.4.1.5.2 Mouse Clicks
The graph below visualizes the results of mouse click estimations for managers related with
task 5.
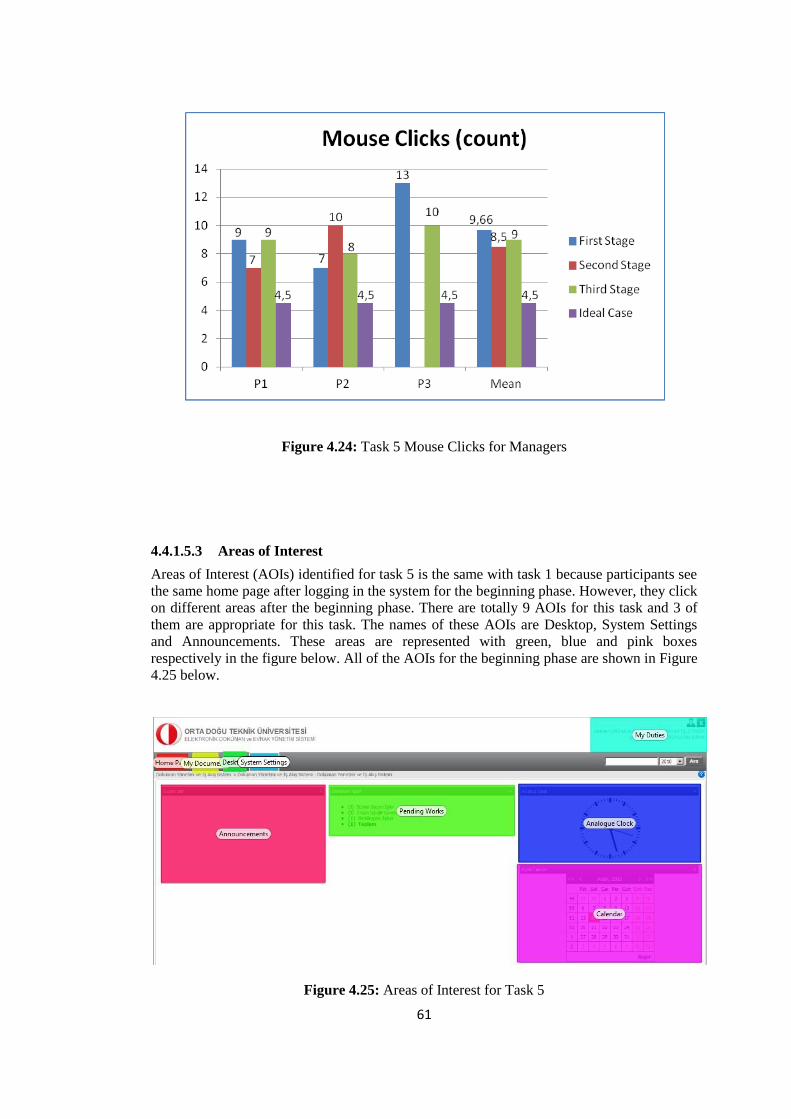
61
Figure 4.24: Task 5 Mouse Clicks for Managers
4.4.1.5.3 Areas of Interest
Areas of Interest (AOIs) identified for task 5 is the same with task 1 because participants see
the same home page after logging in the system for the beginning phase. However, they click
on different areas after the beginning phase. There are totally 9 AOIs for this task and 3 of
them are appropriate for this task. The names of these AOIs are Desktop, System Settings
and Announcements. These areas are represented with green, blue and pink boxes
respectively in the figure below. All of the AOIs for the beginning phase are shown in Figure
4.25 below.
Figure 4.25: Areas of Interest for Task 5
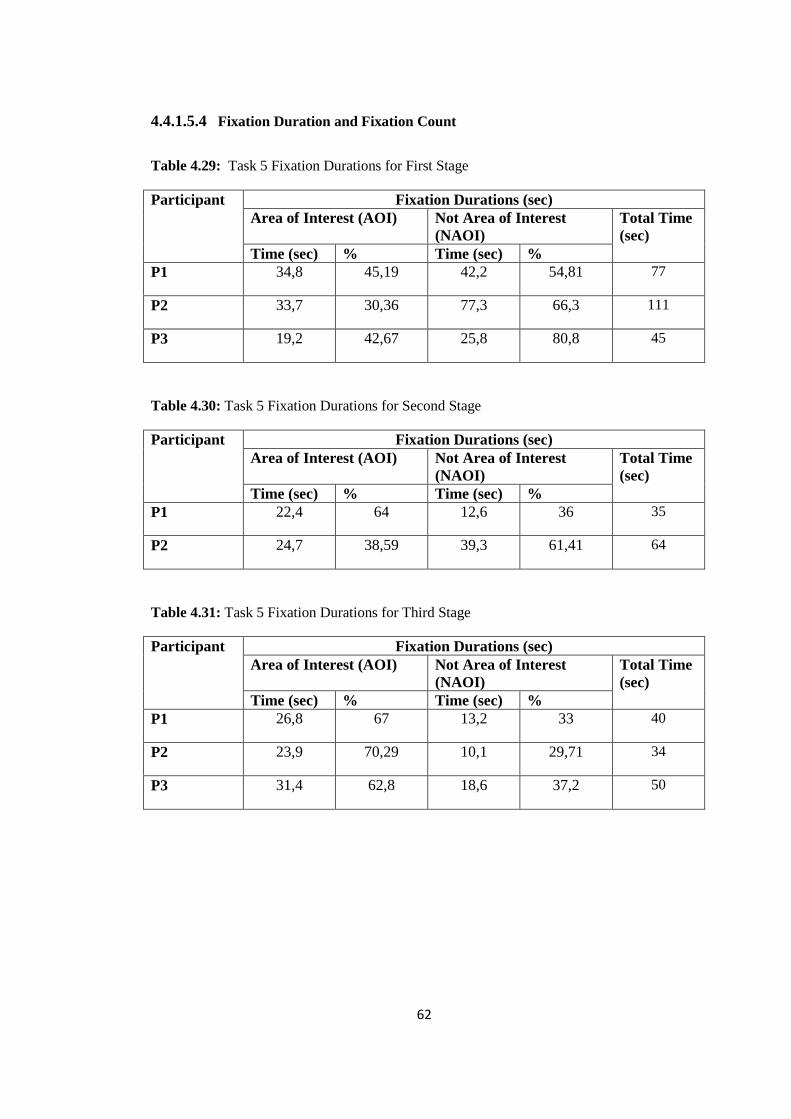
62
4.4.1.5.4 Fixation Duration and Fixation Count
Table 4.29: Task 5 Fixation Durations for First Stage
Participant Fixation Durations (sec)
Area of Interest (AOI) Not Area of Interest
(NAOI)
Total Time
(sec)
Time (sec) % Time (sec) %
P1 34,8 45,19 42,2 54,81 77
P2 33,7 30,36 77,3 66,3 111
P3 19,2 42,67 25,8 80,8 45
Table 4.30: Task 5 Fixation Durations for Second Stage
Participant Fixation Durations (sec)
Area of Interest (AOI) Not Area of Interest
(NAOI)
Total Time
(sec)
Time (sec) % Time (sec) %
P1 22,4 64 12,6 36 35
P2 24,7 38,59 39,3 61,41 64
Table 4.31: Task 5 Fixation Durations for Third Stage
Participant Fixation Durations (sec)
Area of Interest (AOI) Not Area of Interest
(NAOI)
Total Time
(sec)
Time (sec) % Time (sec) %
P1 26,8 67 13,2 33 40
P2 23,9 70,29 10,1 29,71 34
P3 31,4 62,8 18,6 37,2 50
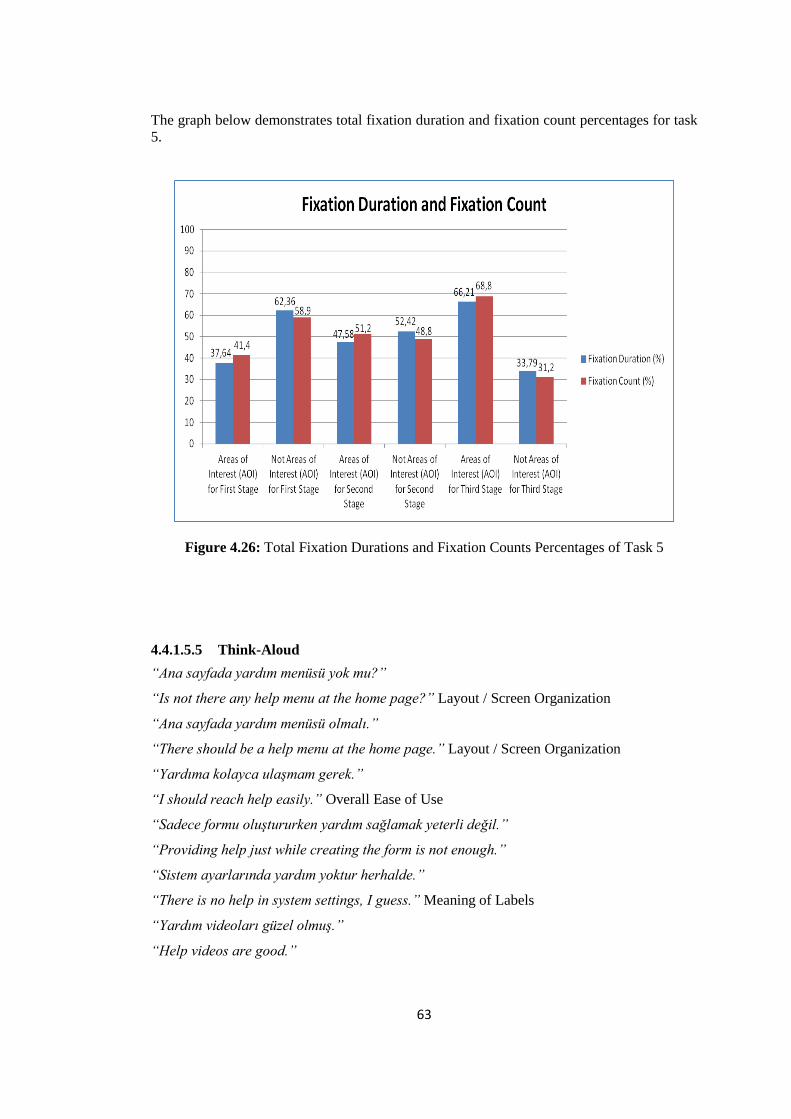
63
The graph below demonstrates total fixation duration and fixation count percentages for task
5.
Figure 4.26: Total Fixation Durations and Fixation Counts Percentages of Task 5
4.4.1.5.5 Think-Aloud
“Ana sayfada yardım menüsü yok mu?”
“Is not there any help menu at the home page?” Layout / Screen Organization
“Ana sayfada yardım menüsü olmalı.”
“There should be a help menu at the home page.” Layout / Screen Organization
“Yardıma kolayca ulaşmam gerek.”
“I should reach help easily.” Overall Ease of Use
“Sadece formu oluştururken yardım sağlamak yeterli değil.”
“Providing help just while creating the form is not enough.”
“Sistem ayarlarında yardım yoktur herhalde.”
“There is no help in system settings, I guess.” Meaning of Labels
“Yardım videoları güzel olmuş.”
“Help videos are good.”
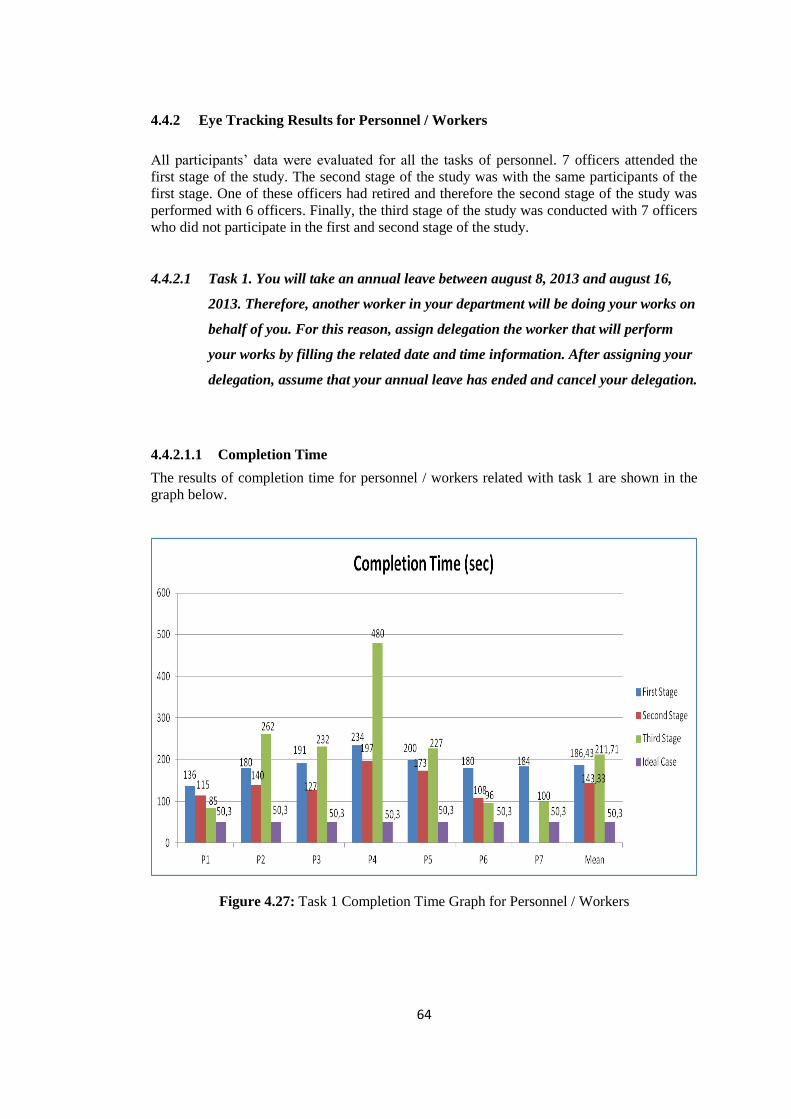
64
4.4.2 Eye Tracking Results for Personnel / Workers
All participants’ data were evaluated for all the tasks of personnel. 7 officers attended the
first stage of the study. The second stage of the study was with the same participants of the
first stage. One of these officers had retired and therefore the second stage of the study was
performed with 6 officers. Finally, the third stage of the study was conducted with 7 officers
who did not participate in the first and second stage of the study.
4.4.2.1 Task 1. You will take an annual leave between august 8, 2013 and august 16,
2013. Therefore, another worker in your department will be doing your works on
behalf of you. For this reason, assign delegation the worker that will perform
your works by filling the related date and time information. After assigning your
delegation, assume that your annual leave has ended and cancel your delegation.
4.4.2.1.1 Completion Time
The results of completion time for personnel / workers related with task 1 are shown in the
graph below.
Figure 4.27: Task 1 Completion Time Graph for Personnel / Workers
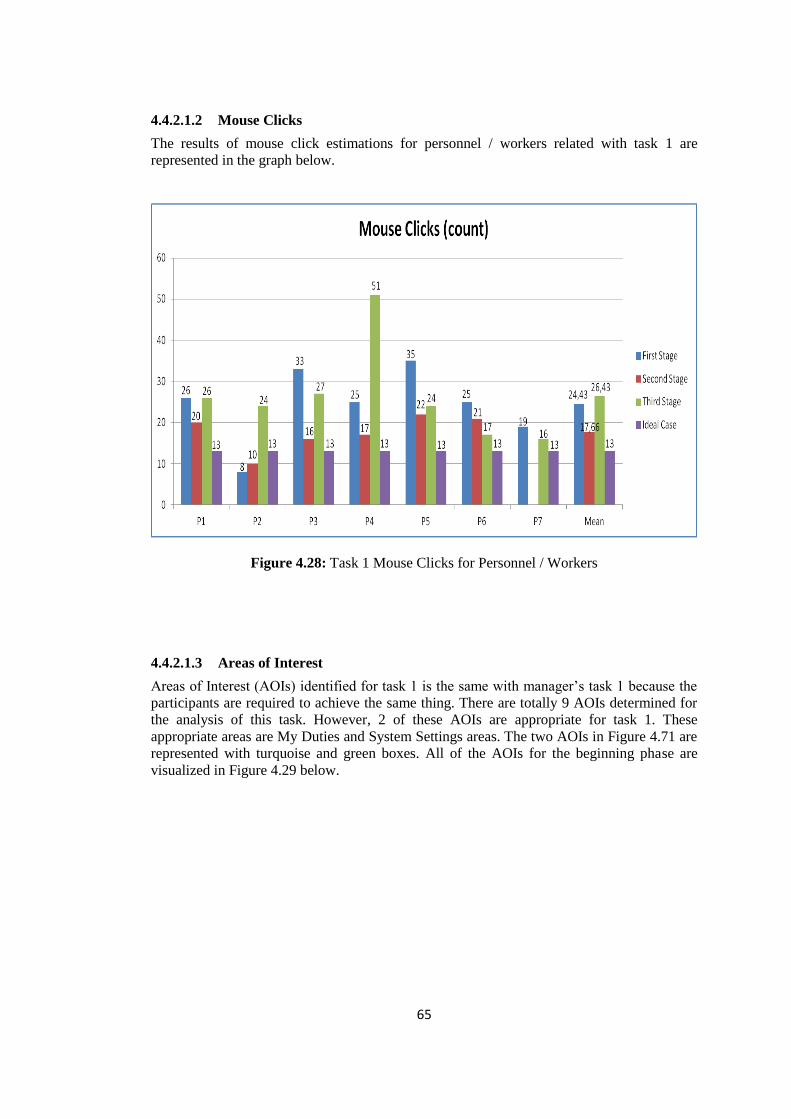
65
4.4.2.1.2 Mouse Clicks
The results of mouse click estimations for personnel / workers related with task 1 are
represented in the graph below.
Figure 4.28: Task 1 Mouse Clicks for Personnel / Workers
4.4.2.1.3 Areas of Interest
Areas of Interest (AOIs) identified for task 1 is the same with manager’s task 1 because the
participants are required to achieve the same thing. There are totally 9 AOIs determined for
the analysis of this task. However, 2 of these AOIs are appropriate for task 1. These
appropriate areas are My Duties and System Settings areas. The two AOIs in Figure 4.71 are
represented with turquoise and green boxes. All of the AOIs for the beginning phase are
visualized in Figure 4.29 below.
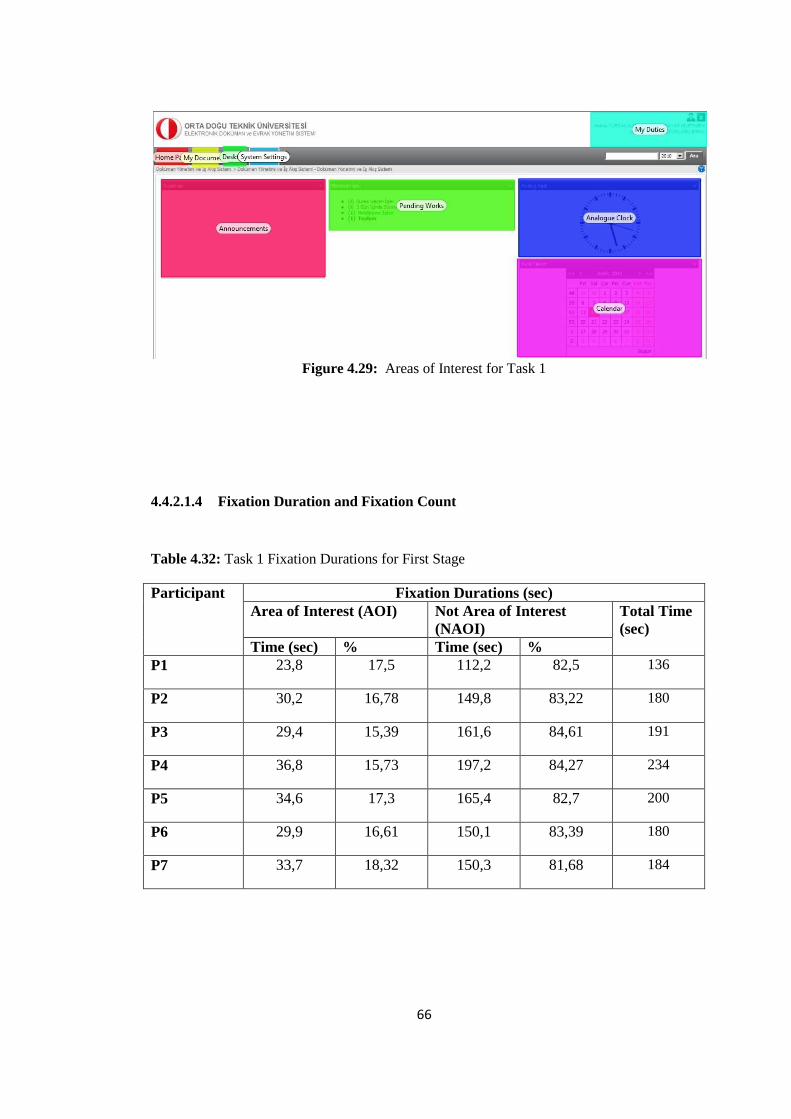
66
Figure 4.29: Areas of Interest for Task 1
4.4.2.1.4 Fixation Duration and Fixation Count
Table 4.32: Task 1 Fixation Durations for First Stage
Participant Fixation Durations (sec)
Area of Interest (AOI) Not Area of Interest
(NAOI)
Total Time
(sec)
Time (sec) % Time (sec) %
P1 23,8 17,5 112,2 82,5 136
P2 30,2 16,78 149,8 83,22 180
P3 29,4 15,39 161,6 84,61 191
P4 36,8 15,73 197,2 84,27 234
P5 34,6 17,3 165,4 82,7 200
P6 29,9 16,61 150,1 83,39 180
P7 33,7 18,32 150,3 81,68 184
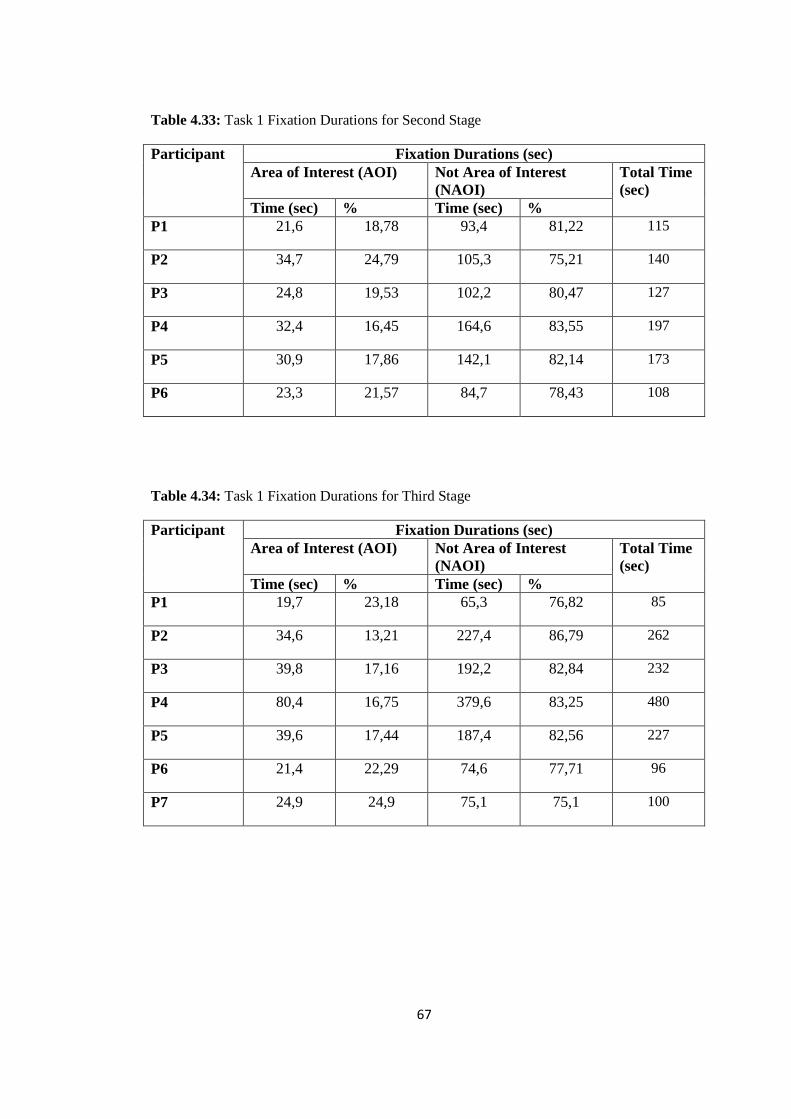
67
Table 4.33: Task 1 Fixation Durations for Second Stage
Participant Fixation Durations (sec)
Area of Interest (AOI) Not Area of Interest
(NAOI)
Total Time
(sec)
Time (sec) % Time (sec) %
P1 21,6 18,78 93,4 81,22 115
P2 34,7 24,79 105,3 75,21 140
P3 24,8 19,53 102,2 80,47 127
P4 32,4 16,45 164,6 83,55 197
P5 30,9 17,86 142,1 82,14 173
P6 23,3 21,57 84,7 78,43 108
Table 4.34: Task 1 Fixation Durations for Third Stage
Participant Fixation Durations (sec)
Area of Interest (AOI) Not Area of Interest
(NAOI)
Total Time
(sec)
Time (sec) % Time (sec) %
P1 19,7 23,18 65,3 76,82 85
P2 34,6 13,21 227,4 86,79 262
P3 39,8 17,16 192,2 82,84 232
P4 80,4 16,75 379,6 83,25 480
P5 39,6 17,44 187,4 82,56 227
P6 21,4 22,29 74,6 77,71 96
P7 24,9 24,9 75,1 75,1 100

68
The graph below shows total fixation duration and fixation count percentages for task 1.
Figure 4.30: Total Fixation Durations and Fixation Counts Percentages of Task 1
4.4.2.1.5 Think-Aloud
“Uzun zamandır vekalet vermediğim için unutmuşum.”
“I had forgotten since I have not assigned delegation for long time.”
“Vekalet verme özelliğini şu ana kadar hiç kullanmadım. Bu yüzden bulamıyorum.”
“I have never used assigning delegation property till now. Therefore, I cannot find it.”
“Yıllık izin formu doldurarak vekalet versem daha iyi olur.”
“It would be better if I assign delegation by filling annual leave form.”
“Vekalet verme seçeneğini bulmak çok zor.”
“It is very difficult to find assigning delegation property.” Overall Ease of Use
“Vekalet verme nerede?”
“Where is assigning delegation?”
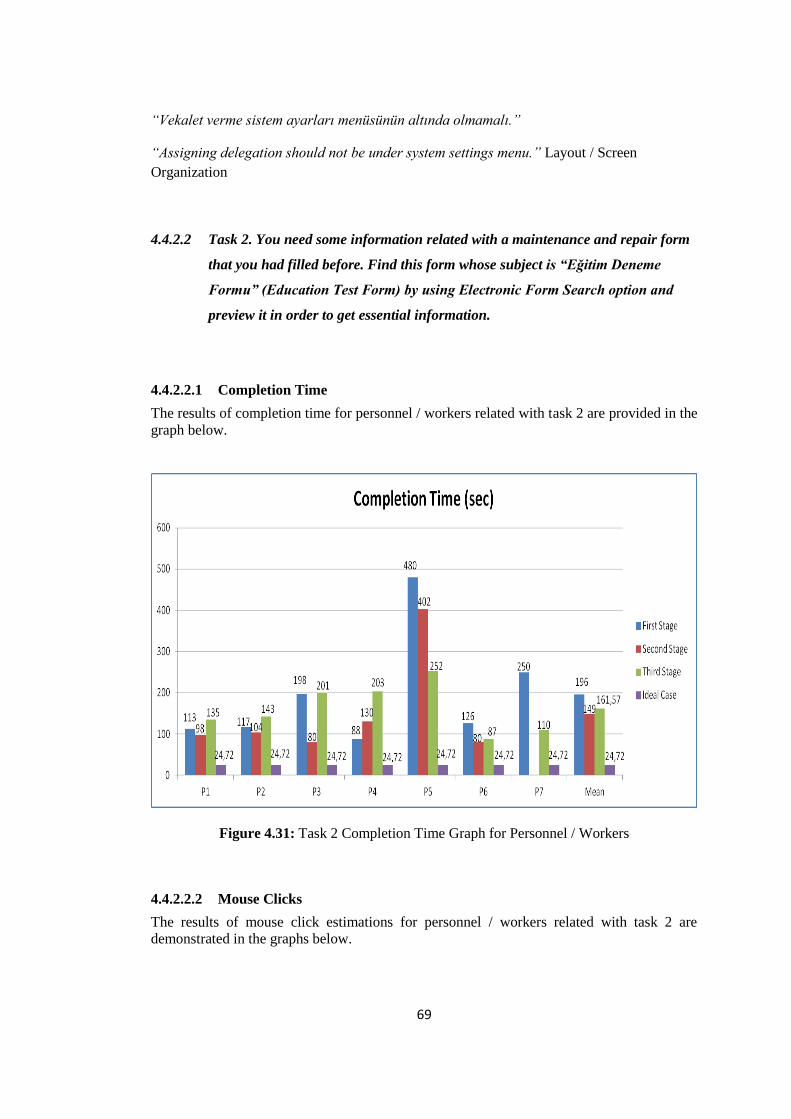
69
“Vekalet verme sistem ayarları menüsünün altında olmamalı.”
“Assigning delegation should not be under system settings menu.” Layout / Screen
Organization
4.4.2.2 Task 2. You need some information related with a maintenance and repair form
that you had filled before. Find this form whose subject is “Eğitim Deneme
Formu” (Education Test Form) by using Electronic Form Search option and
preview it in order to get essential information.
4.4.2.2.1 Completion Time
The results of completion time for personnel / workers related with task 2 are provided in the
graph below.
Figure 4.31: Task 2 Completion Time Graph for Personnel / Workers
4.4.2.2.2 Mouse Clicks
The results of mouse click estimations for personnel / workers related with task 2 are
demonstrated in the graphs below.
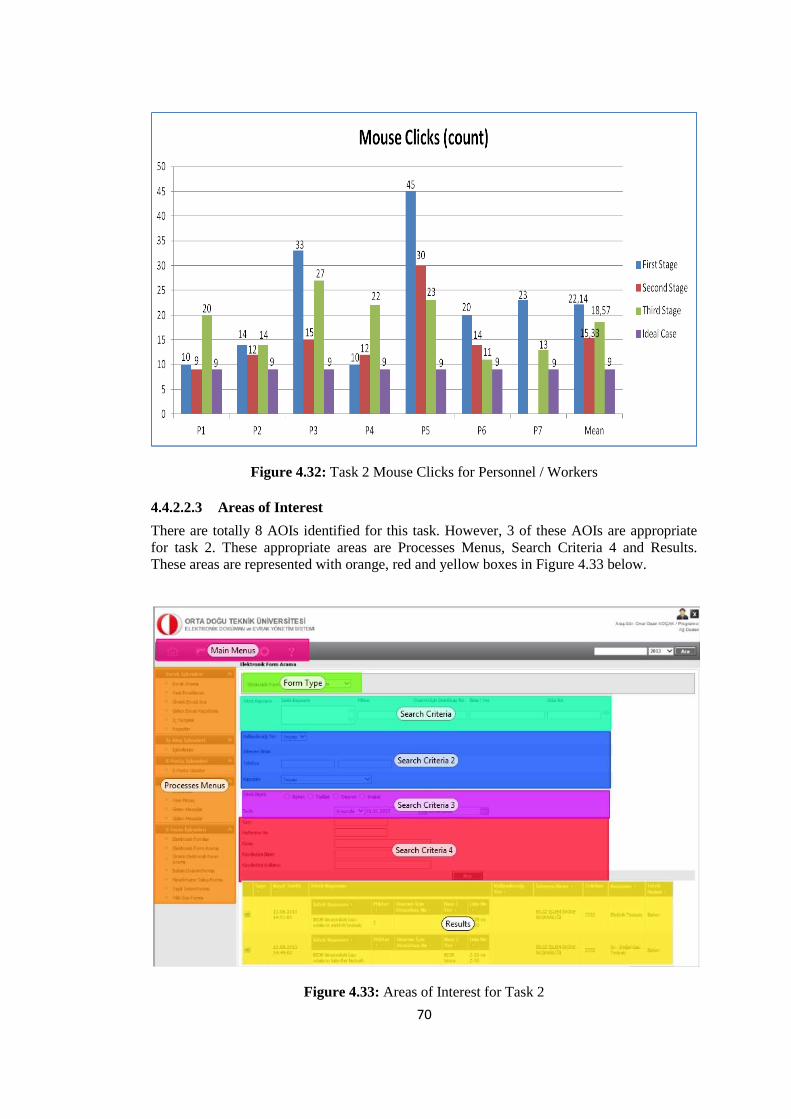
70
Figure 4.32: Task 2 Mouse Clicks for Personnel / Workers
4.4.2.2.3 Areas of Interest
There are totally 8 AOIs identified for this task. However, 3 of these AOIs are appropriate
for task 2. These appropriate areas are Processes Menus, Search Criteria 4 and Results.
These areas are represented with orange, red and yellow boxes in Figure 4.33 below.
Figure 4.33: Areas of Interest for Task 2
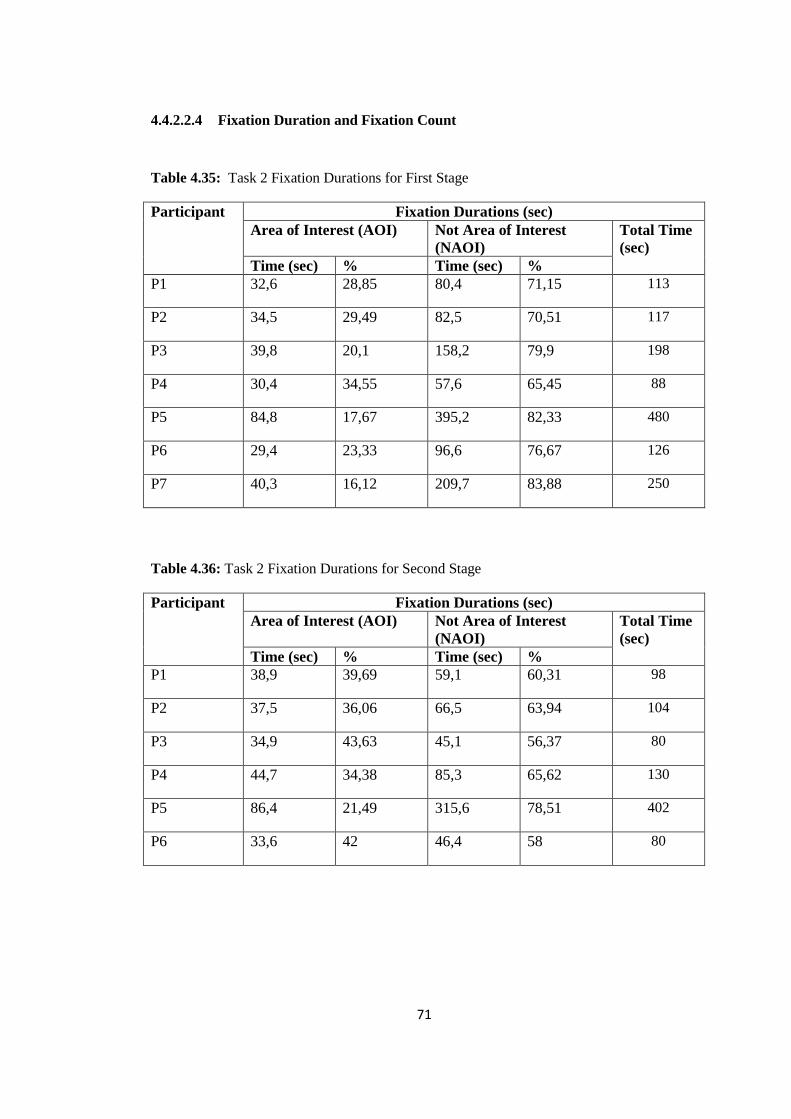
71
4.4.2.2.4 Fixation Duration and Fixation Count
Table 4.35: Task 2 Fixation Durations for First Stage
Participant Fixation Durations (sec)
Area of Interest (AOI) Not Area of Interest
(NAOI)
Total Time
(sec)
Time (sec) % Time (sec) %
P1 32,6 28,85 80,4 71,15 113
P2 34,5 29,49 82,5 70,51 117
P3 39,8 20,1 158,2 79,9 198
P4 30,4 34,55 57,6 65,45 88
P5 84,8 17,67 395,2 82,33 480
P6 29,4 23,33 96,6 76,67 126
P7 40,3 16,12 209,7 83,88 250
Table 4.36: Task 2 Fixation Durations for Second Stage
Participant Fixation Durations (sec)
Area of Interest (AOI) Not Area of Interest
(NAOI)
Total Time
(sec)
Time (sec) % Time (sec) %
P1 38,9 39,69 59,1 60,31 98
P2 37,5 36,06 66,5 63,94 104
P3 34,9 43,63 45,1 56,37 80
P4 44,7 34,38 85,3 65,62 130
P5 86,4 21,49 315,6 78,51 402
P6 33,6 42 46,4 58 80
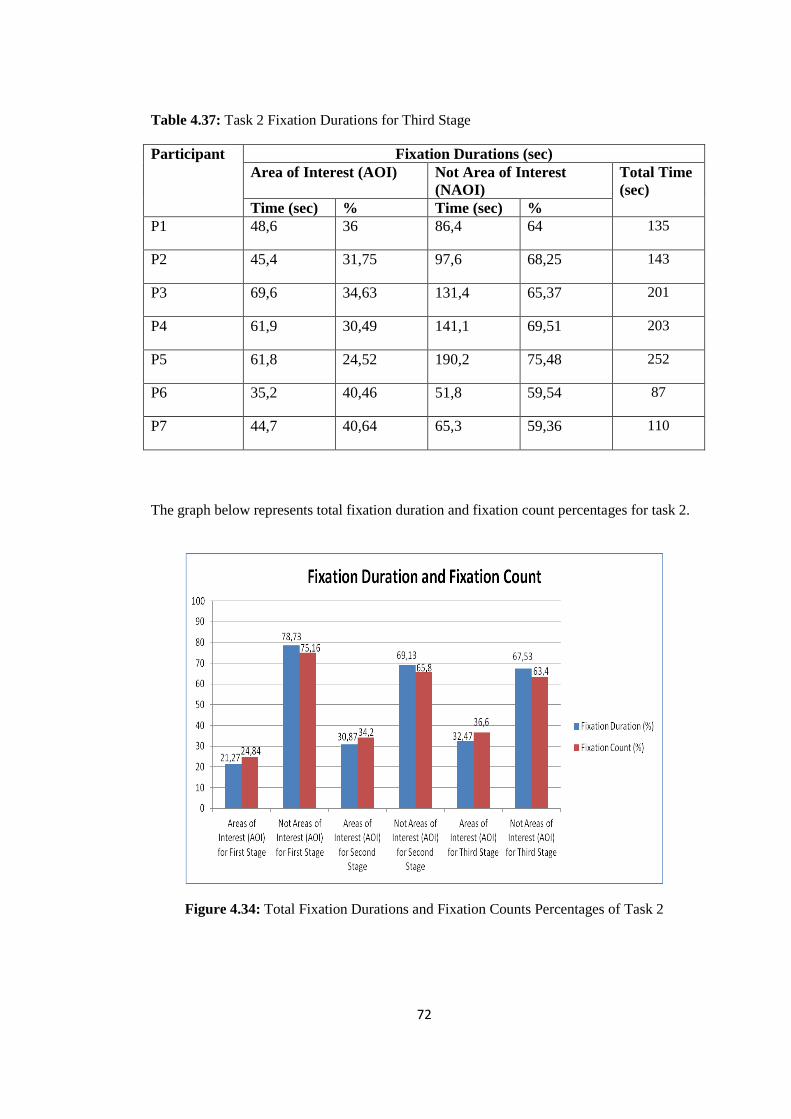
72
Table 4.37: Task 2 Fixation Durations for Third Stage
Participant Fixation Durations (sec)
Area of Interest (AOI) Not Area of Interest
(NAOI)
Total Time
(sec)
Time (sec) % Time (sec) %
P1 48,6 36 86,4 64 135
P2 45,4 31,75 97,6 68,25 143
P3 69,6 34,63 131,4 65,37 201
P4 61,9 30,49 141,1 69,51 203
P5 61,8 24,52 190,2 75,48 252
P6 35,2 40,46 51,8 59,54 87
P7 44,7 40,64 65,3 59,36 110
The graph below represents total fixation duration and fixation count percentages for task 2.
Figure 4.34: Total Fixation Durations and Fixation Counts Percentages of Task 2
73
4.4.2.2.5 Think-Aloud
“Formu önizlerken çok fazla java uyarısı geliyor.”
“Too many java warnings appear while previewing the form?” Understanding of System
Instructions
“Formları neden evrak arama seçeneğinden arayamıyorum?” Layout / Screen Organization
“Why cannot I search the forms with document search option?”
“Form arama seçeneğinde çok fazla seçenek olduğu için kafam karışıyor.”
“I get confused since there are too many options in form search option.” Layout / Screen
Organization
“Arama için ana sayfada kısa yol olmalı.”
“There should be a shortcut for searching at the home page” Layout / Screen Organization
4.4.2.3 Task 3. Since you had another work to do, you left a repair and maintenance
form that you were filling incomplete. You want to continue filling your form
after you completed the other work. Hence, find the shortcomings of the
document whose subject is “Eksik Bilgileri Giriniz” (Enter Incomplete
Information) in My New Records and send it to the related personnel by
completing it.
4.4.2.3.1 Completion Time
The results of completion time for personnel / workers related with task 3 are shown in the
graph below.
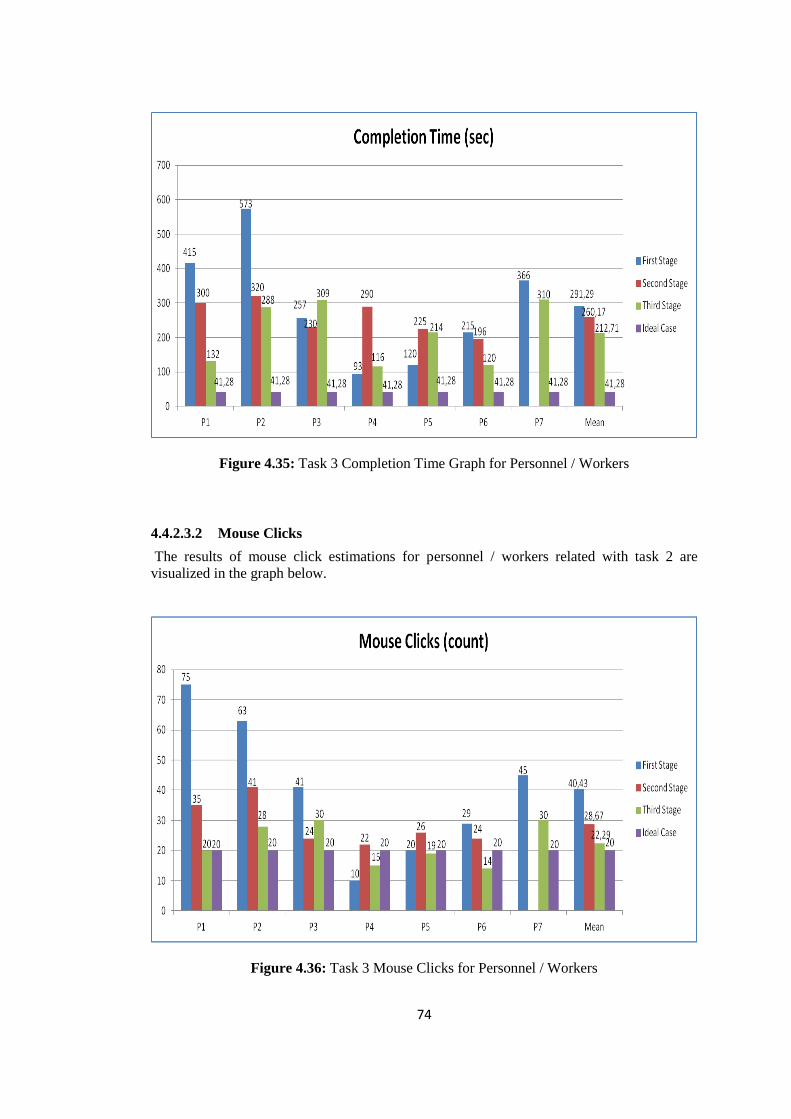
74
Figure 4.35: Task 3 Completion Time Graph for Personnel / Workers
4.4.2.3.2 Mouse Clicks
The results of mouse click estimations for personnel / workers related with task 2 are
visualized in the graph below.
Figure 4.36: Task 3 Mouse Clicks for Personnel / Workers

75
4.4.2.3.3 Areas of Interest
There are totally 7 AOIs identified for this task. However, only 1 of these AOIs are
appropriate for this task. The appropriate area is Processes Menus. Processes Menus is
represented with light blue box in Figure 4.37 below.
Figure 4.37: Areas of Interest for Task 3

76
4.4.2.3.4 Fixation Duration and Fixation Count
Table 4.38: Task 3 Fixation Durations for First Stage
Participant Fixation Durations (sec)
Area of Interest (AOI) Not Area of Interest
(NAOI)
Total Time
(sec)
Time (sec) % Time (sec) %
P1 64,8 15,61 350,2 84,39 415
P2 70,6 12,32 502,4 87,68 573
P3 40,8 15,88 216,2 84,12 257
P4 20,6 22,15 72,4 77,85 93
P5 24,9 20,75 95,1 79,25 120
P6 34,7 16,14 180,3 83,86 215
P7 43,3 11,83 322,7 88,17 366
Table 4.39: Task 3 Fixation Durations for Second Stage
Participant Fixation Durations (sec)
Area of Interest (AOI) Not Area of Interest
(NAOI)
Total Time
(sec)
Time (sec) % Time (sec) %
P1 59,4 19,8 240,6 80,2 300
P2 49,7 15,53 270,3 84,47 320
P3 36,4 15,83 193,6 84,17 230
P4 66,2 22,83 223,8 77,17 290
P5 41,3 18,36 183,7 81,64 225
P6 38,7 19,74 157,3 80,26 196

77
Table 4.40: Task 3 Fixation Durations for Third Stage
Participant Fixation Durations (sec)
Area of Interest (AOI) Not Area of Interest
(NAOI)
Total Time
(sec)
Time (sec) % Time (sec) %
P1 28,4 21,52 103,6 78,48 132
P2 56,2 19,51 231,8 80,49 288
P3 61,5 19,90 247,5 80,10 309
P4 28,3 24,4 87,7 75,6 116
P5 42,9 20,05 171,1 79,95 214
P6 23,7 19,75 96,3 80,25 120
P7 47,6 15,35 262,4 84,65 310
The figure below demonstrates the total fixation duration and fixation count percentages for
task 3.
Figure 4.38: Total Fixation Durations and Fixation Counts Percentages of Task 3
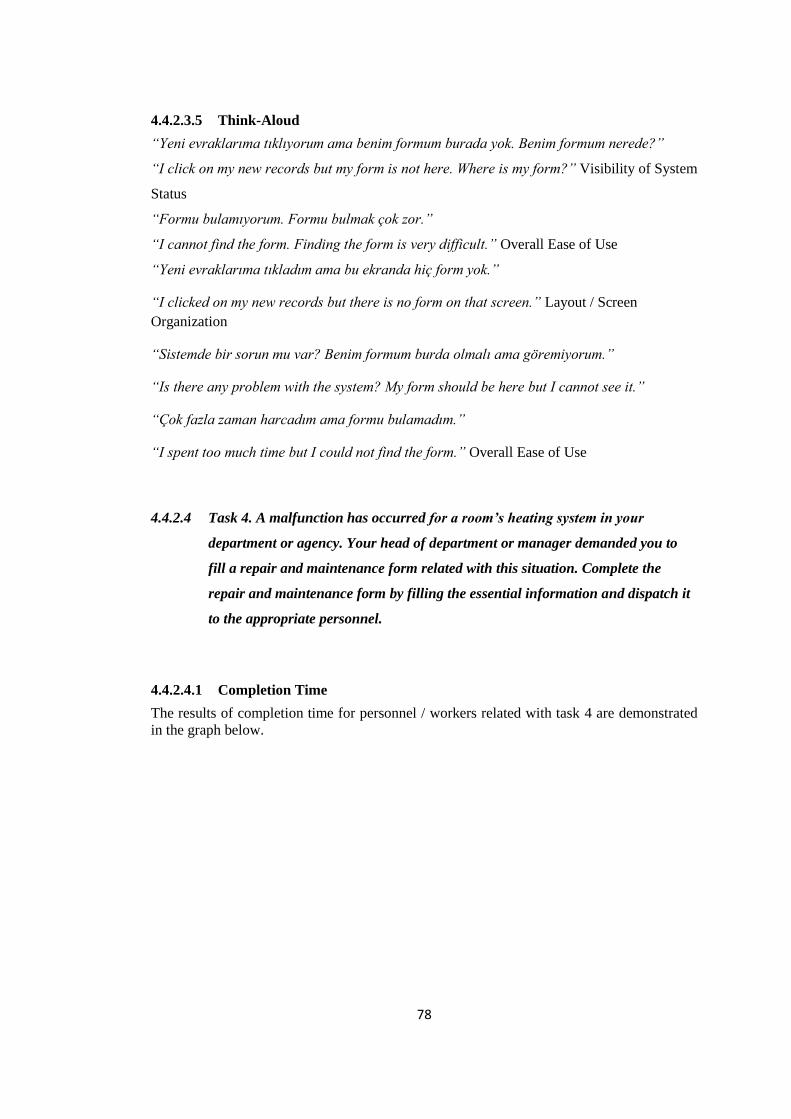
78
4.4.2.3.5 Think-Aloud
“Yeni evraklarıma tıklıyorum ama benim formum burada yok. Benim formum nerede?”
“I click on my new records but my form is not here. Where is my form?” Visibility of System
Status
“Formu bulamıyorum. Formu bulmak çok zor.”
“I cannot find the form. Finding the form is very difficult.” Overall Ease of Use
“Yeni evraklarıma tıkladım ama bu ekranda hiç form yok.”
“I clicked on my new records but there is no form on that screen.” Layout / Screen
Organization
“Sistemde bir sorun mu var? Benim formum burda olmalı ama göremiyorum.”
“Is there any problem with the system? My form should be here but I cannot see it.”
“Çok fazla zaman harcadım ama formu bulamadım.”
“I spent too much time but I could not find the form.” Overall Ease of Use
4.4.2.4 Task 4. A malfunction has occurred for a room’s heating system in your
department or agency. Your head of department or manager demanded you to
fill a repair and maintenance form related with this situation. Complete the
repair and maintenance form by filling the essential information and dispatch it
to the appropriate personnel.
4.4.2.4.1 Completion Time
The results of completion time for personnel / workers related with task 4 are demonstrated
in the graph below.
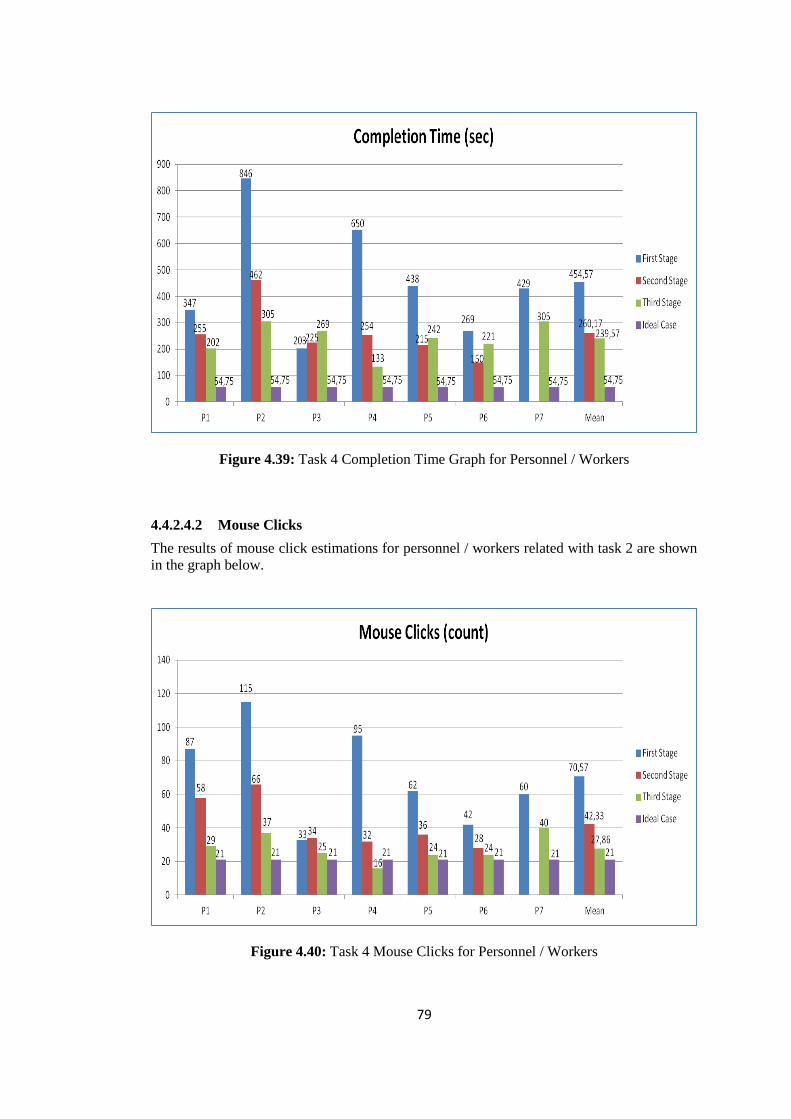
79
Figure 4.39: Task 4 Completion Time Graph for Personnel / Workers
4.4.2.4.2 Mouse Clicks
The results of mouse click estimations for personnel / workers related with task 2 are shown
in the graph below.
Figure 4.40: Task 4 Mouse Clicks for Personnel / Workers
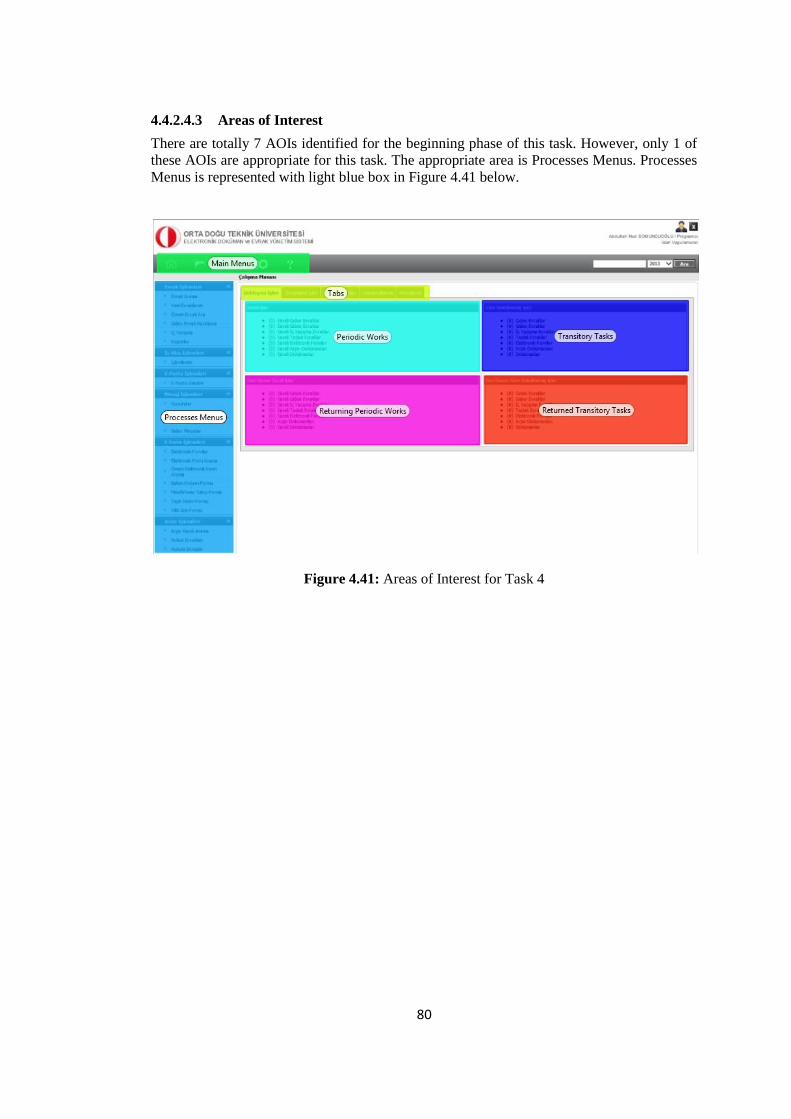
80
4.4.2.4.3 Areas of Interest
There are totally 7 AOIs identified for the beginning phase of this task. However, only 1 of
these AOIs are appropriate for this task. The appropriate area is Processes Menus. Processes
Menus is represented with light blue box in Figure 4.41 below.
Figure 4.41: Areas of Interest for Task 4
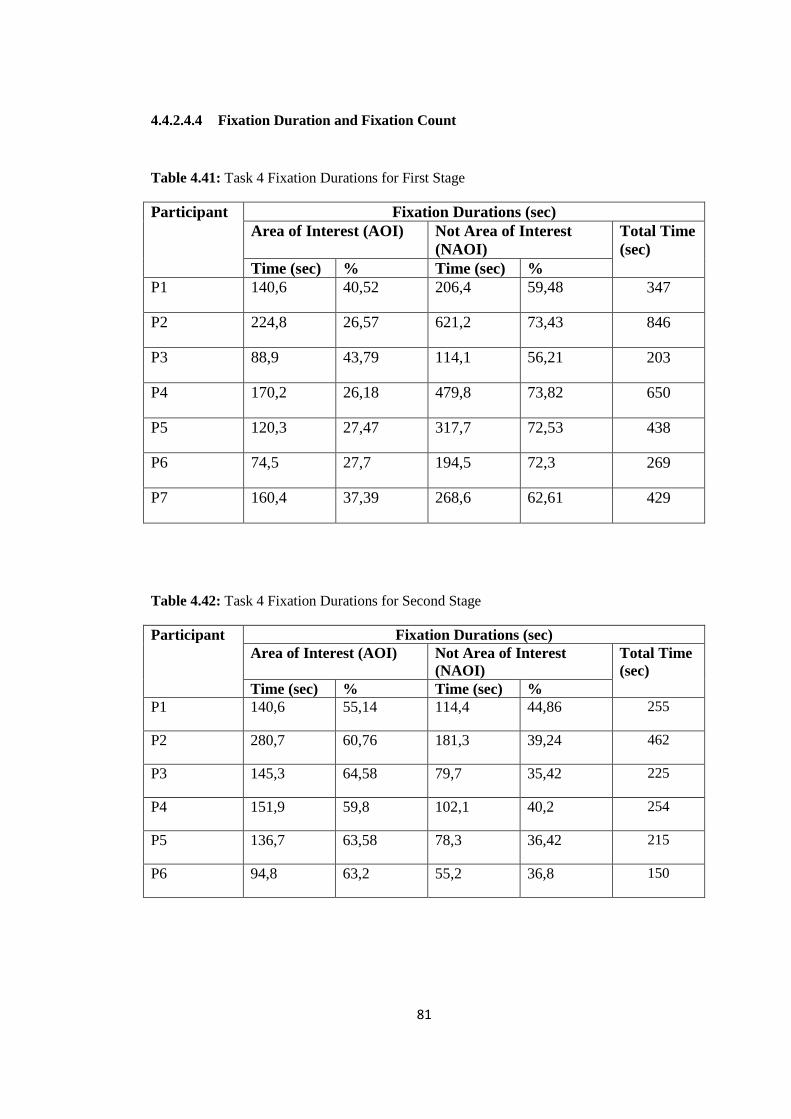
81
4.4.2.4.4 Fixation Duration and Fixation Count
Table 4.41: Task 4 Fixation Durations for First Stage
Participant Fixation Durations (sec)
Area of Interest (AOI) Not Area of Interest
(NAOI)
Total Time
(sec)
Time (sec) % Time (sec) %
P1 140,6 40,52 206,4 59,48 347
P2 224,8 26,57 621,2 73,43 846
P3 88,9 43,79 114,1 56,21 203
P4 170,2 26,18 479,8 73,82 650
P5 120,3 27,47 317,7 72,53 438
P6 74,5 27,7 194,5 72,3 269
P7 160,4 37,39 268,6 62,61 429
Table 4.42: Task 4 Fixation Durations for Second Stage
Participant Fixation Durations (sec)
Area of Interest (AOI) Not Area of Interest
(NAOI)
Total Time
(sec)
Time (sec) % Time (sec) %
P1 140,6 55,14 114,4 44,86 255
P2 280,7 60,76 181,3 39,24 462
P3 145,3 64,58 79,7 35,42 225
P4 151,9 59,8 102,1 40,2 254
P5 136,7 63,58 78,3 36,42 215
P6 94,8 63,2 55,2 36,8 150
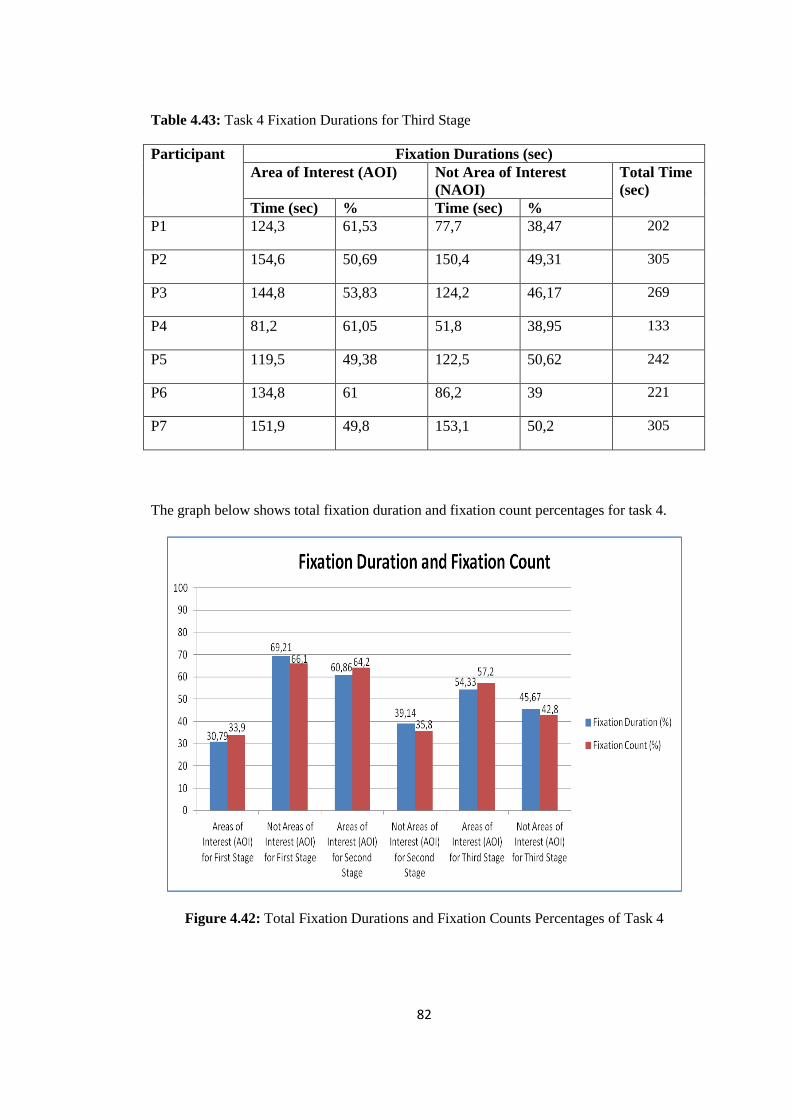
82
Table 4.43: Task 4 Fixation Durations for Third Stage
Participant Fixation Durations (sec)
Area of Interest (AOI) Not Area of Interest
(NAOI)
Total Time
(sec)
Time (sec) % Time (sec) %
P1 124,3 61,53 77,7 38,47 202
P2 154,6 50,69 150,4 49,31 305
P3 144,8 53,83 124,2 46,17 269
P4 81,2 61,05 51,8 38,95 133
P5 119,5 49,38 122,5 50,62 242
P6 134,8 61 86,2 39 221
P7 151,9 49,8 153,1 50,2 305
The graph below shows total fixation duration and fixation count percentages for task 4.
Figure 4.42: Total Fixation Durations and Fixation Counts Percentages of Task 4
83
4.4.2.4.5 Think-Aloud
“Formun bütün alanlarını doldurdum. O zaman, neden formu sevk edemiyorum?”
“I filled all the fields of the form. Then, why cannot I dispatch the form?”
“Formu kaydet butonuna tıkladım. Nasıl göndereceğim şimdi?”
“I clicked the save button. How will I send it now?”
“Bu verileri eklemek için neden ‘+’ işaretine tıklıyorum ki? Çok saçma olmuş.”
“Why do I click this ‘+’ sign in order to add the data? This is very nonsense.” Meaning of
Labels
“Çok fazla zorunlu alan yok. Form sade ve güzel olmuş.”
“There are not too many obligatory fields the form is simple and good.” Layout / Screen
Organization
“Önizleyince form güzel gözüküyor.”
“Form seems nice when it is previewed.” Graphics
“Formu doldururken çok fazla zaman harcadım. Formu doldurmak bu kadar zaman
almamalı.”
“I spent too much time while filling the form. It should not take this much time to fill the
form.” Overall Ease of Use
4.4.2.5 Task 5. Your head of department or manager wanted information about where
and on which phase the repair and maintenance form that you had dispatched is
after some time. For this reason, learn where and on which phase the repair and
maintenance form that you had dispatched is by finding your document.
4.4.2.5.1 Completion Time
The results of completion time for personnel / workers related with task 4 are given in the
graph below.
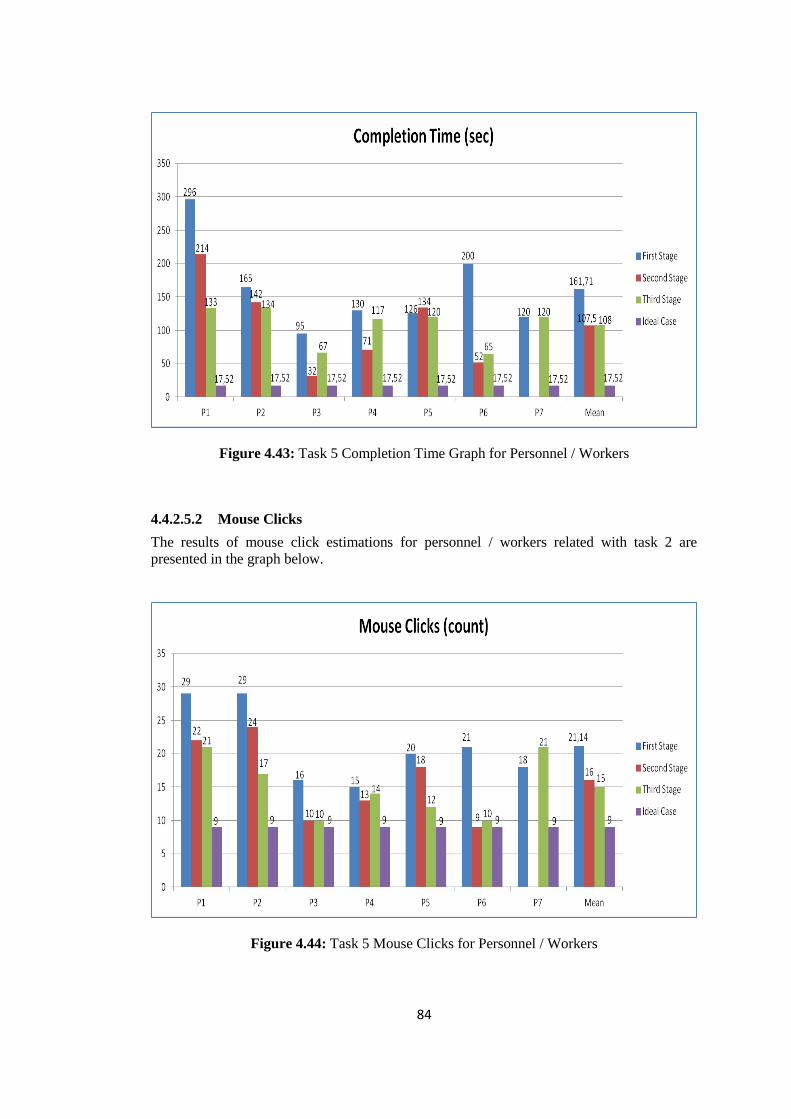
84
Figure 4.43: Task 5 Completion Time Graph for Personnel / Workers
4.4.2.5.2 Mouse Clicks
The results of mouse click estimations for personnel / workers related with task 2 are
presented in the graph below.
Figure 4.44: Task 5 Mouse Clicks for Personnel / Workers
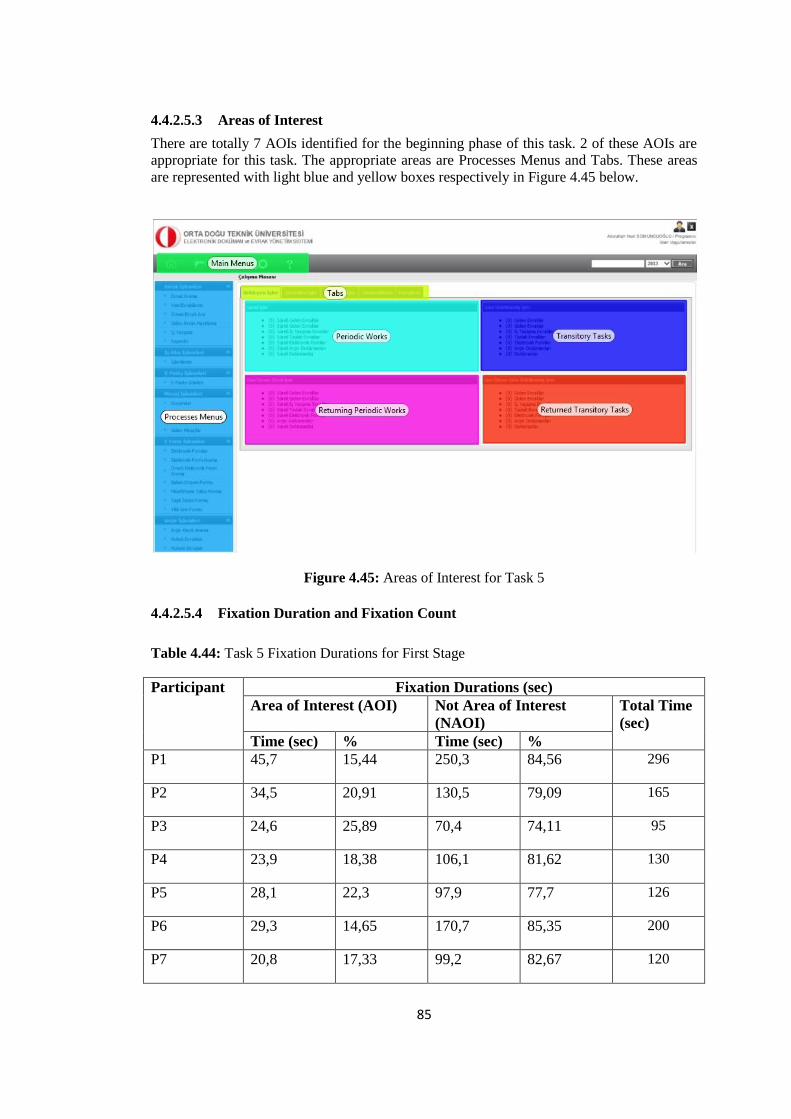
85
4.4.2.5.3 Areas of Interest
There are totally 7 AOIs identified for the beginning phase of this task. 2 of these AOIs are
appropriate for this task. The appropriate areas are Processes Menus and Tabs. These areas
are represented with light blue and yellow boxes respectively in Figure 4.45 below.
Figure 4.45: Areas of Interest for Task 5
4.4.2.5.4 Fixation Duration and Fixation Count
Table 4.44: Task 5 Fixation Durations for First Stage
Participant Fixation Durations (sec)
Area of Interest (AOI) Not Area of Interest
(NAOI)
Total Time
(sec)
Time (sec) % Time (sec) %
P1 45,7 15,44 250,3 84,56 296
P2 34,5 20,91 130,5 79,09 165
P3 24,6 25,89 70,4 74,11 95
P4 23,9 18,38 106,1 81,62 130
P5 28,1 22,3 97,9 77,7 126
P6 29,3 14,65 170,7 85,35 200
P7 20,8 17,33 99,2 82,67 120
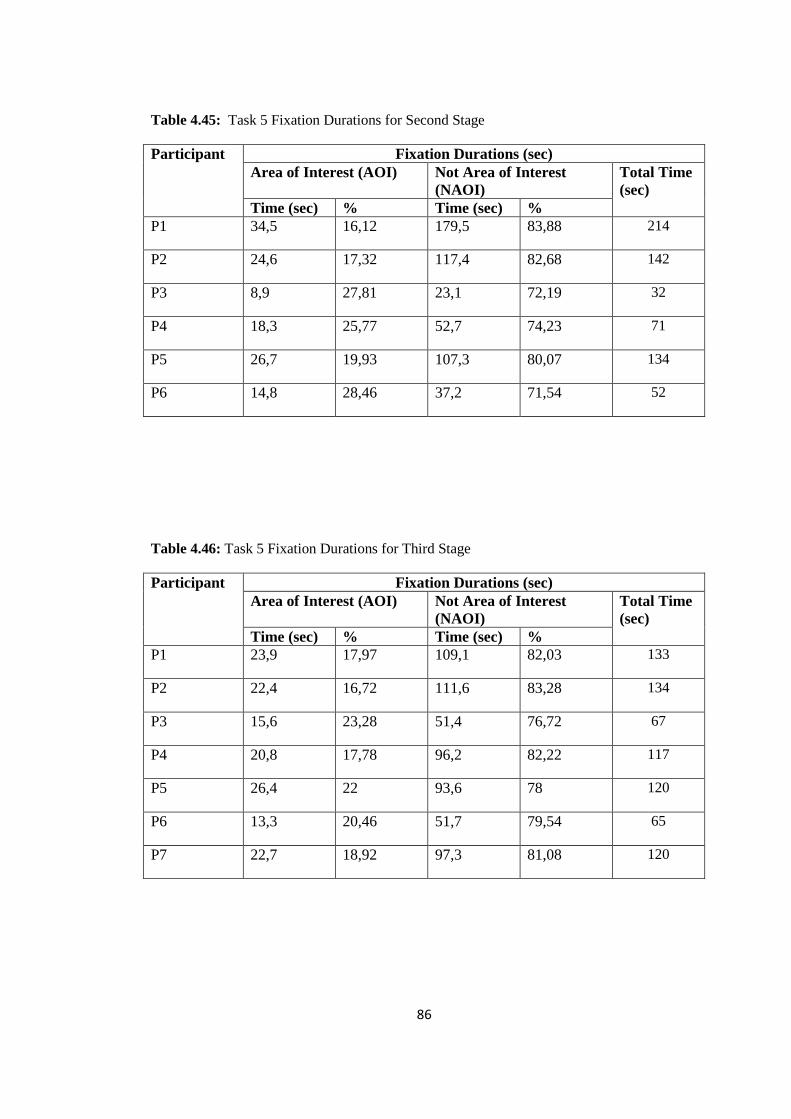
86
Table 4.45: Task 5 Fixation Durations for Second Stage
Participant Fixation Durations (sec)
Area of Interest (AOI) Not Area of Interest
(NAOI)
Total Time
(sec)
Time (sec) % Time (sec) %
P1 34,5 16,12 179,5 83,88 214
P2 24,6 17,32 117,4 82,68 142
P3 8,9 27,81 23,1 72,19 32
P4 18,3 25,77 52,7 74,23 71
P5 26,7 19,93 107,3 80,07 134
P6 14,8 28,46 37,2 71,54 52
Table 4.46: Task 5 Fixation Durations for Third Stage
Participant Fixation Durations (sec)
Area of Interest (AOI) Not Area of Interest
(NAOI)
Total Time
(sec)
Time (sec) % Time (sec) %
P1 23,9 17,97 109,1 82,03 133
P2 22,4 16,72 111,6 83,28 134
P3 15,6 23,28 51,4 76,72 67
P4 20,8 17,78 96,2 82,22 117
P5 26,4 22 93,6 78 120
P6 13,3 20,46 51,7 79,54 65
P7 22,7 18,92 97,3 81,08 120
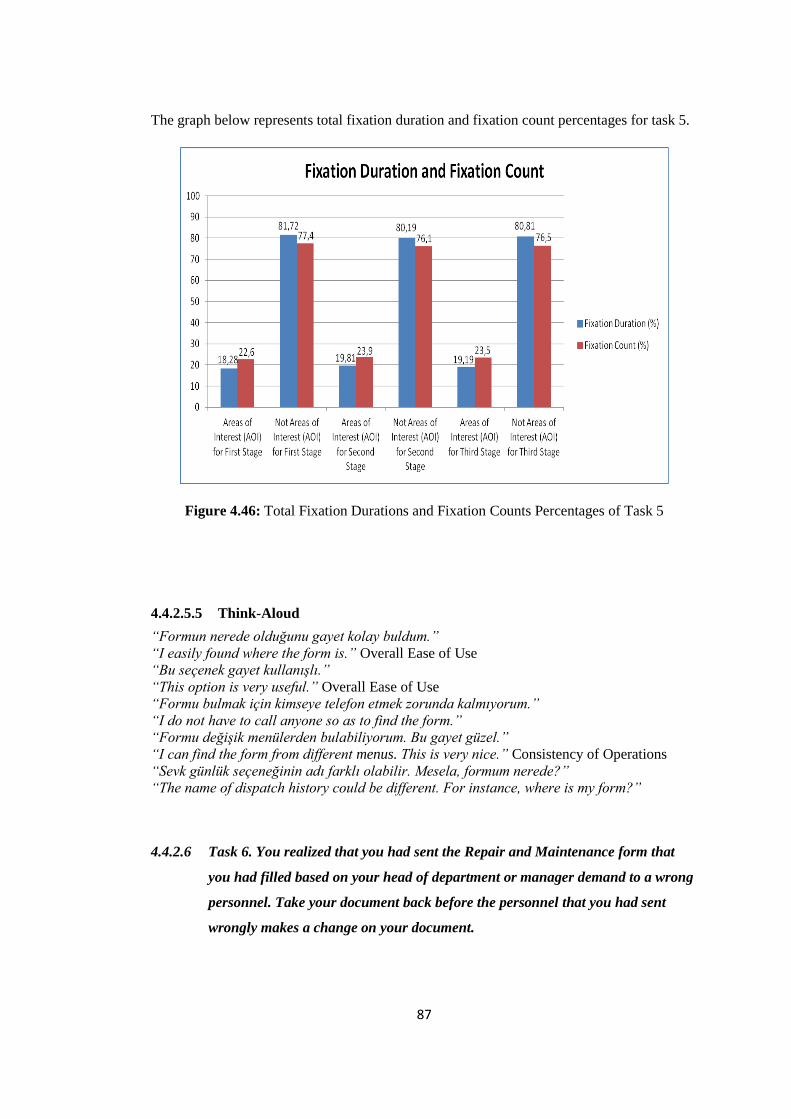
87
The graph below represents total fixation duration and fixation count percentages for task 5.
Figure 4.46: Total Fixation Durations and Fixation Counts Percentages of Task 5
4.4.2.5.5 Think-Aloud
“Formun nerede olduğunu gayet kolay buldum.”
“I easily found where the form is.” Overall Ease of Use
“Bu seçenek gayet kullanışlı.”
“This option is very useful.” Overall Ease of Use
“Formu bulmak için kimseye telefon etmek zorunda kalmıyorum.”
“I do not have to call anyone so as to find the form.”
“Formu değişik menülerden bulabiliyorum. Bu gayet güzel.”
“I can find the form from different menus. This is very nice.” Consistency of Operations
“Sevk günlük seçeneğinin adı farklı olabilir. Mesela, formum nerede?”
“The name of dispatch history could be different. For instance, where is my form?”
4.4.2.6 Task 6. You realized that you had sent the Repair and Maintenance form that
you had filled based on your head of department or manager demand to a wrong
personnel. Take your document back before the personnel that you had sent
wrongly makes a change on your document.
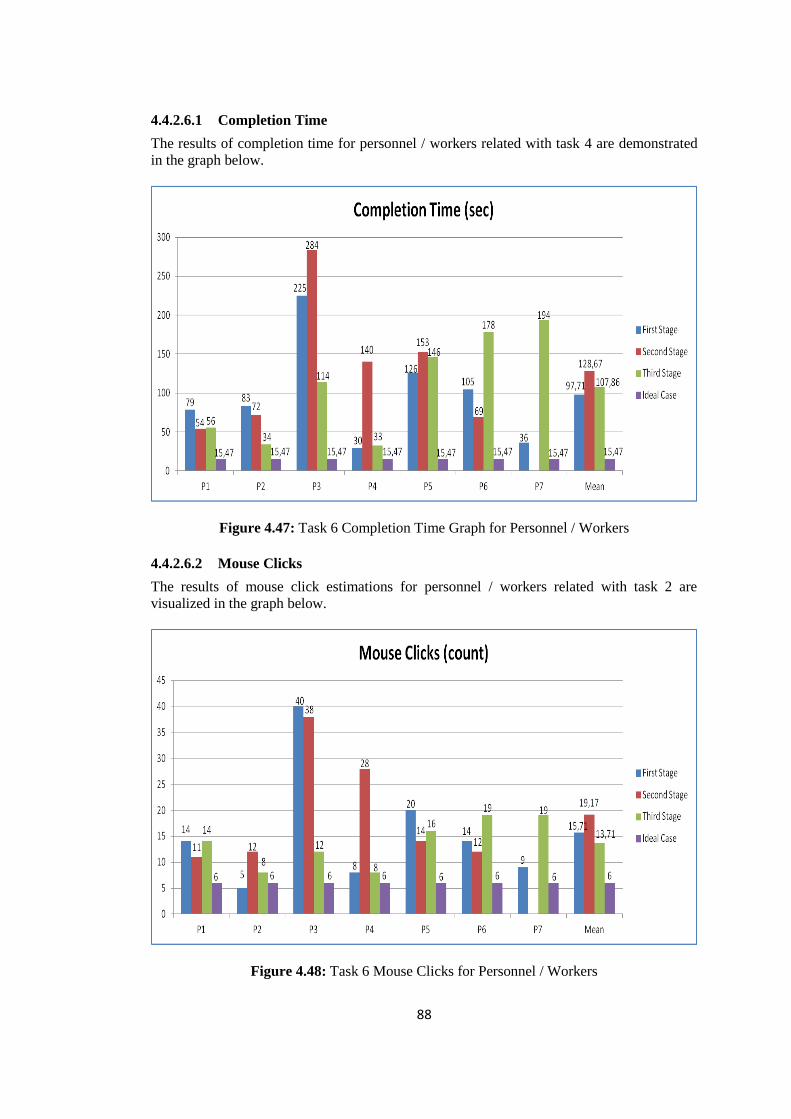
88
4.4.2.6.1 Completion Time
The results of completion time for personnel / workers related with task 4 are demonstrated
in the graph below.
Figure 4.47: Task 6 Completion Time Graph for Personnel / Workers
4.4.2.6.2 Mouse Clicks
The results of mouse click estimations for personnel / workers related with task 2 are
visualized in the graph below.
Figure 4.48: Task 6 Mouse Clicks for Personnel / Workers
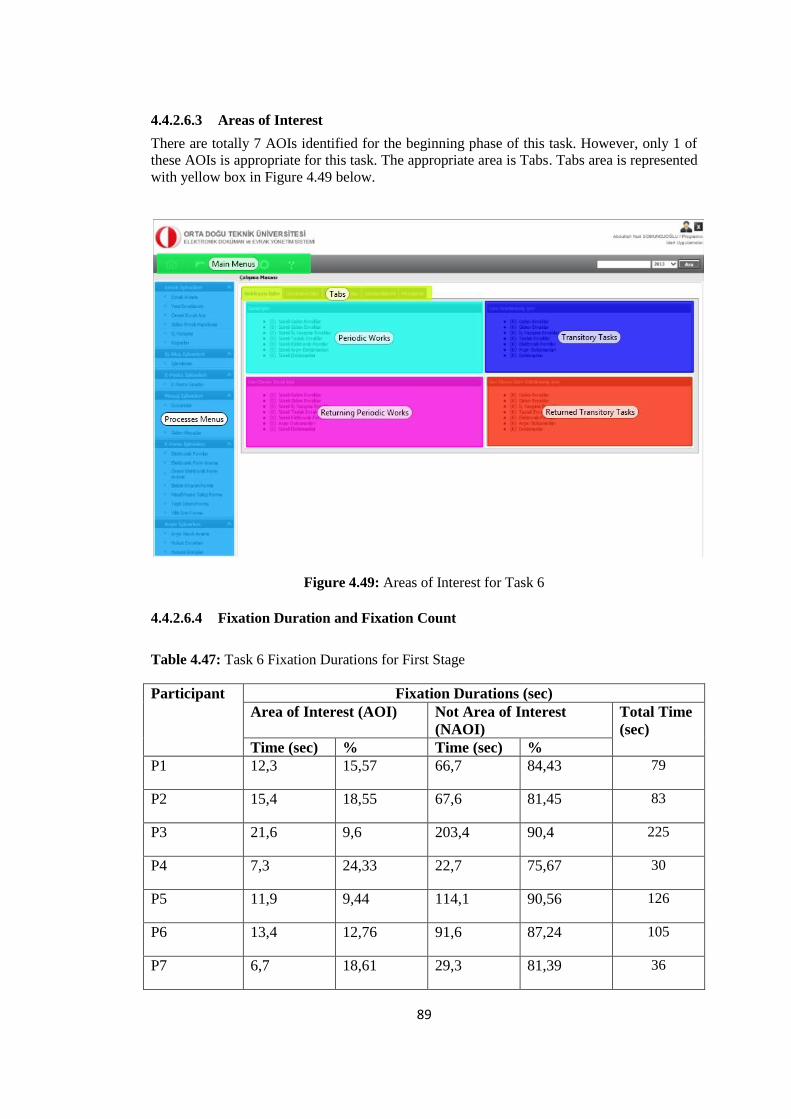
89
4.4.2.6.3 Areas of Interest
There are totally 7 AOIs identified for the beginning phase of this task. However, only 1 of
these AOIs is appropriate for this task. The appropriate area is Tabs. Tabs area is represented
with yellow box in Figure 4.49 below.
Figure 4.49: Areas of Interest for Task 6
4.4.2.6.4 Fixation Duration and Fixation Count
Table 4.47: Task 6 Fixation Durations for First Stage
Participant Fixation Durations (sec)
Area of Interest (AOI) Not Area of Interest
(NAOI)
Total Time
(sec)
Time (sec) % Time (sec) %
P1 12,3 15,57 66,7 84,43 79
P2 15,4 18,55 67,6 81,45 83
P3 21,6 9,6 203,4 90,4 225
P4 7,3 24,33 22,7 75,67 30
P5 11,9 9,44 114,1 90,56 126
P6 13,4 12,76 91,6 87,24 105
P7 6,7 18,61 29,3 81,39 36
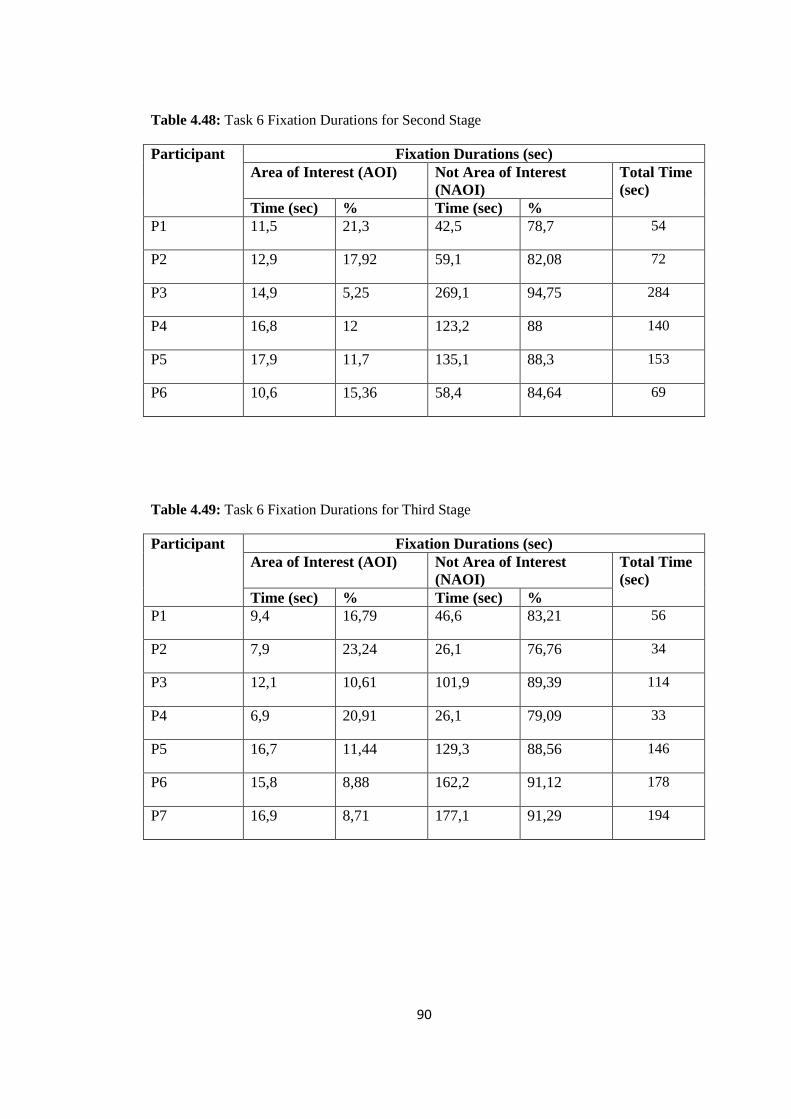
90
Table 4.48: Task 6 Fixation Durations for Second Stage
Participant Fixation Durations (sec)
Area of Interest (AOI) Not Area of Interest
(NAOI)
Total Time
(sec)
Time (sec) % Time (sec) %
P1 11,5 21,3 42,5 78,7 54
P2 12,9 17,92 59,1 82,08 72
P3 14,9 5,25 269,1 94,75 284
P4 16,8 12 123,2 88 140
P5 17,9 11,7 135,1 88,3 153
P6 10,6 15,36 58,4 84,64 69
Table 4.49: Task 6 Fixation Durations for Third Stage
Participant Fixation Durations (sec)
Area of Interest (AOI) Not Area of Interest
(NAOI)
Total Time
(sec)
Time (sec) % Time (sec) %
P1 9,4 16,79 46,6 83,21 56
P2 7,9 23,24 26,1 76,76 34
P3 12,1 10,61 101,9 89,39 114
P4 6,9 20,91 26,1 79,09 33
P5 16,7 11,44 129,3 88,56 146
P6 15,8 8,88 162,2 91,12 178
P7 16,9 8,71 177,1 91,29 194
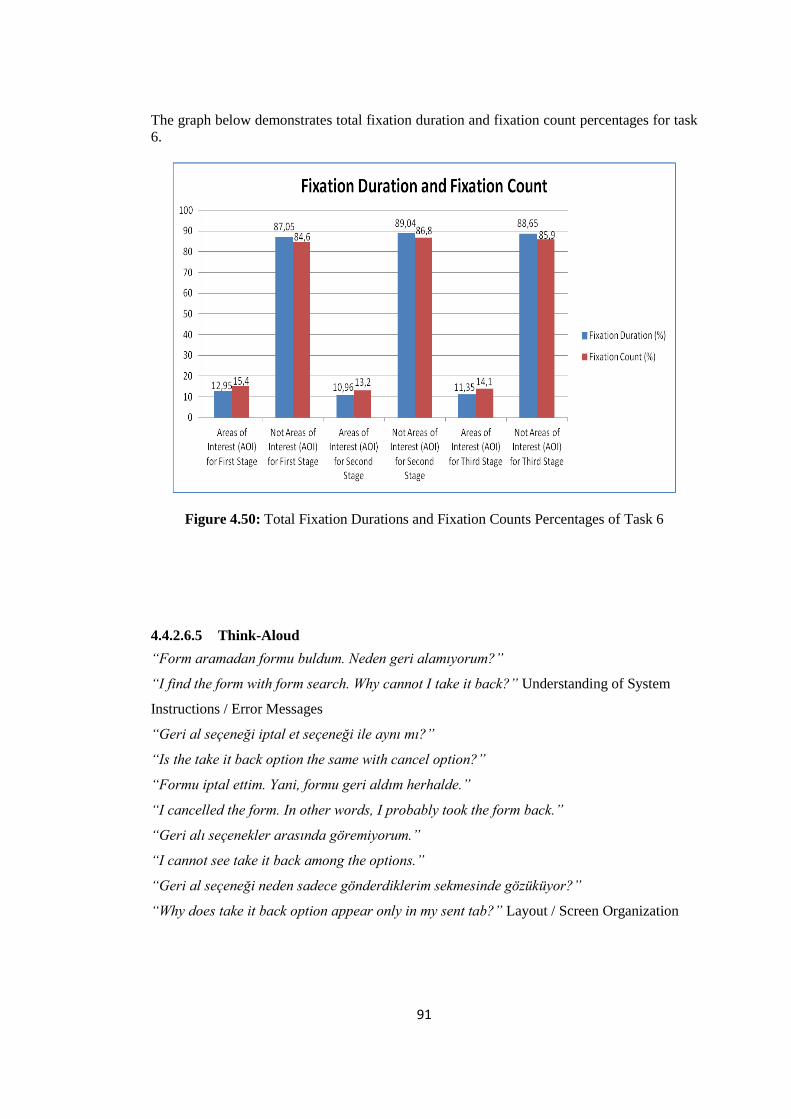
91
The graph below demonstrates total fixation duration and fixation count percentages for task
6.
Figure 4.50: Total Fixation Durations and Fixation Counts Percentages of Task 6
4.4.2.6.5 Think-Aloud
“Form aramadan formu buldum. Neden geri alamıyorum?”
“I find the form with form search. Why cannot I take it back?” Understanding of System
Instructions / Error Messages
“Geri al seçeneği iptal et seçeneği ile aynı mı?”
“Is the take it back option the same with cancel option?”
“Formu iptal ettim. Yani, formu geri aldım herhalde.”
“I cancelled the form. In other words, I probably took the form back.”
“Geri alı seçenekler arasında göremiyorum.”
“I cannot see take it back among the options.”
“Geri al seçeneği neden sadece gönderdiklerim sekmesinde gözüküyor?”
“Why does take it back option appear only in my sent tab?” Layout / Screen Organization
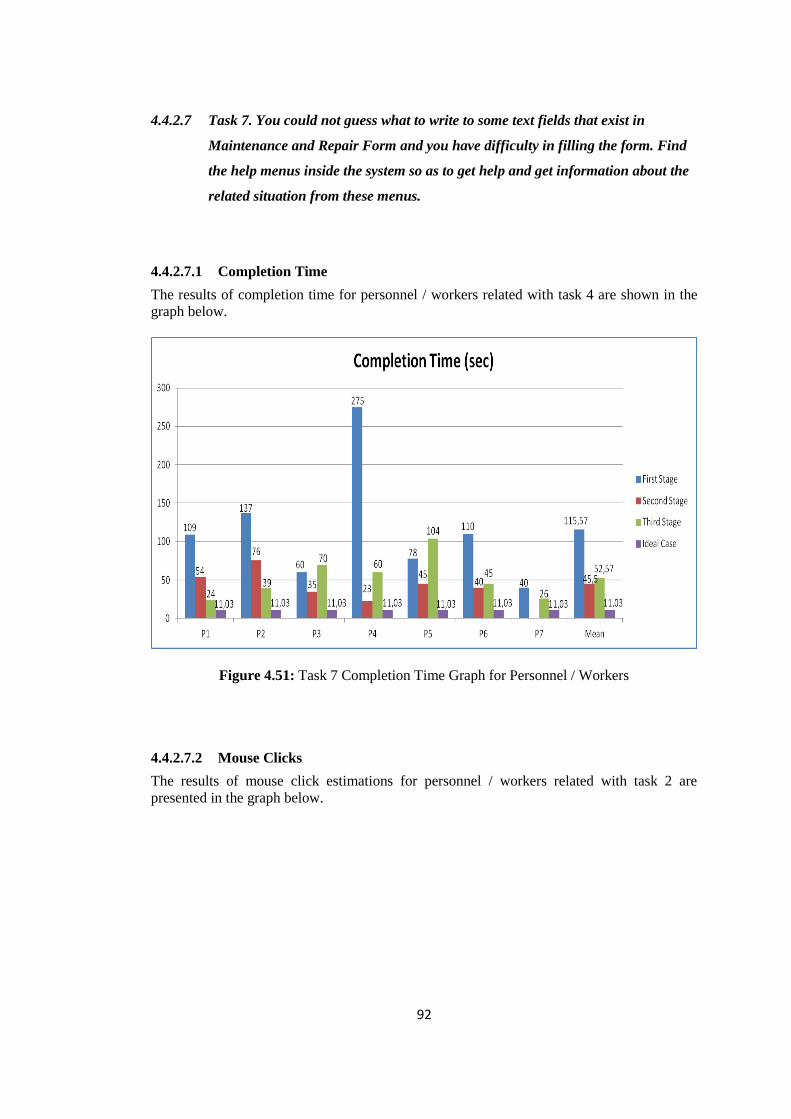
92
4.4.2.7 Task 7. You could not guess what to write to some text fields that exist in
Maintenance and Repair Form and you have difficulty in filling the form. Find
the help menus inside the system so as to get help and get information about the
related situation from these menus.
4.4.2.7.1 Completion Time
The results of completion time for personnel / workers related with task 4 are shown in the
graph below.
Figure 4.51: Task 7 Completion Time Graph for Personnel / Workers
4.4.2.7.2 Mouse Clicks
The results of mouse click estimations for personnel / workers related with task 2 are
presented in the graph below.
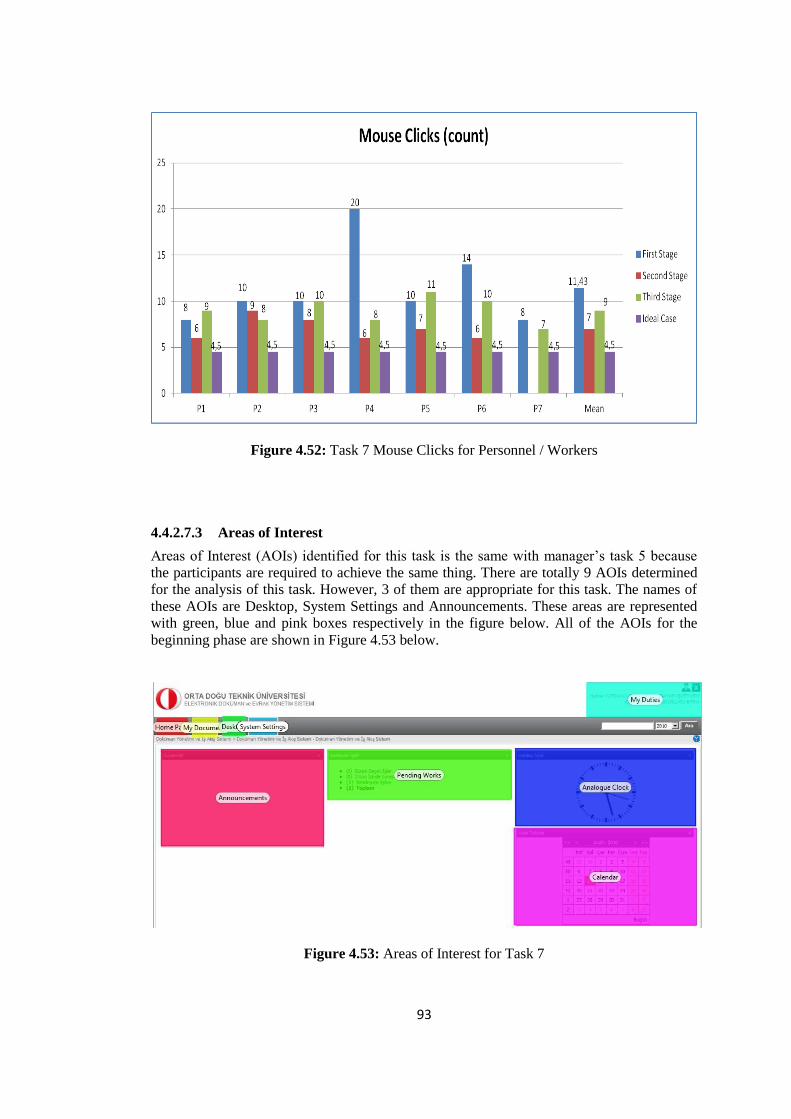
93
Figure 4.52: Task 7 Mouse Clicks for Personnel / Workers
4.4.2.7.3 Areas of Interest
Areas of Interest (AOIs) identified for this task is the same with manager’s task 5 because
the participants are required to achieve the same thing. There are totally 9 AOIs determined
for the analysis of this task. However, 3 of them are appropriate for this task. The names of
these AOIs are Desktop, System Settings and Announcements. These areas are represented
with green, blue and pink boxes respectively in the figure below. All of the AOIs for the
beginning phase are shown in Figure 4.53 below.
Figure 4.53: Areas of Interest for Task 7
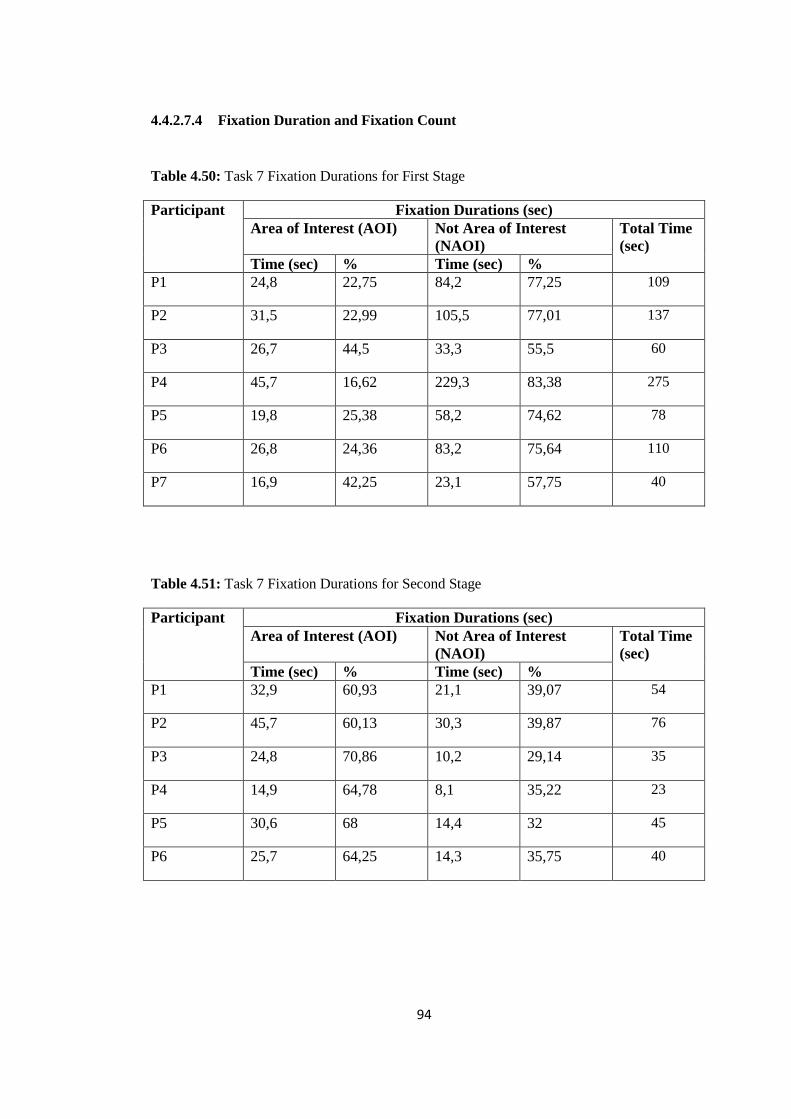
94
4.4.2.7.4 Fixation Duration and Fixation Count
Table 4.50: Task 7 Fixation Durations for First Stage
Participant Fixation Durations (sec)
Area of Interest (AOI) Not Area of Interest
(NAOI)
Total Time
(sec)
Time (sec) % Time (sec) %
P1 24,8 22,75 84,2 77,25 109
P2 31,5 22,99 105,5 77,01 137
P3 26,7 44,5 33,3 55,5 60
P4 45,7 16,62 229,3 83,38 275
P5 19,8 25,38 58,2 74,62 78
P6 26,8 24,36 83,2 75,64 110
P7 16,9 42,25 23,1 57,75 40
Table 4.51: Task 7 Fixation Durations for Second Stage
Participant Fixation Durations (sec)
Area of Interest (AOI) Not Area of Interest
(NAOI)
Total Time
(sec)
Time (sec) % Time (sec) %
P1 32,9 60,93 21,1 39,07 54
P2 45,7 60,13 30,3 39,87 76
P3 24,8 70,86 10,2 29,14 35
P4 14,9 64,78 8,1 35,22 23
P5 30,6 68 14,4 32 45
P6 25,7 64,25 14,3 35,75 40

95
Table 4.52: Task 7 Fixation Durations for Third Stage
Participant Fixation Durations (sec)
Area of Interest (AOI) Not Area of Interest
(NAOI)
Total Time
(sec)
Time (sec) % Time (sec) %
P1 16,8 70 7,2 30 24
P2 24,9 63,85 14,1 36,15 39
P3 30,6 43,71 39,4 56,29 70
P4 36,9 61,5 33,1 38,5 60
P5 50,3 48,37 53,7 51,63 104
P6 29,7 66 15,3 34 45
P7 19,4 74,62 6,6 25,38 26
The graph below visualizes total fixation duration and fixation count percentages for task 7.
Figure 4.54: Total Fixation Durations and Fixation Counts Percentages of Task 7
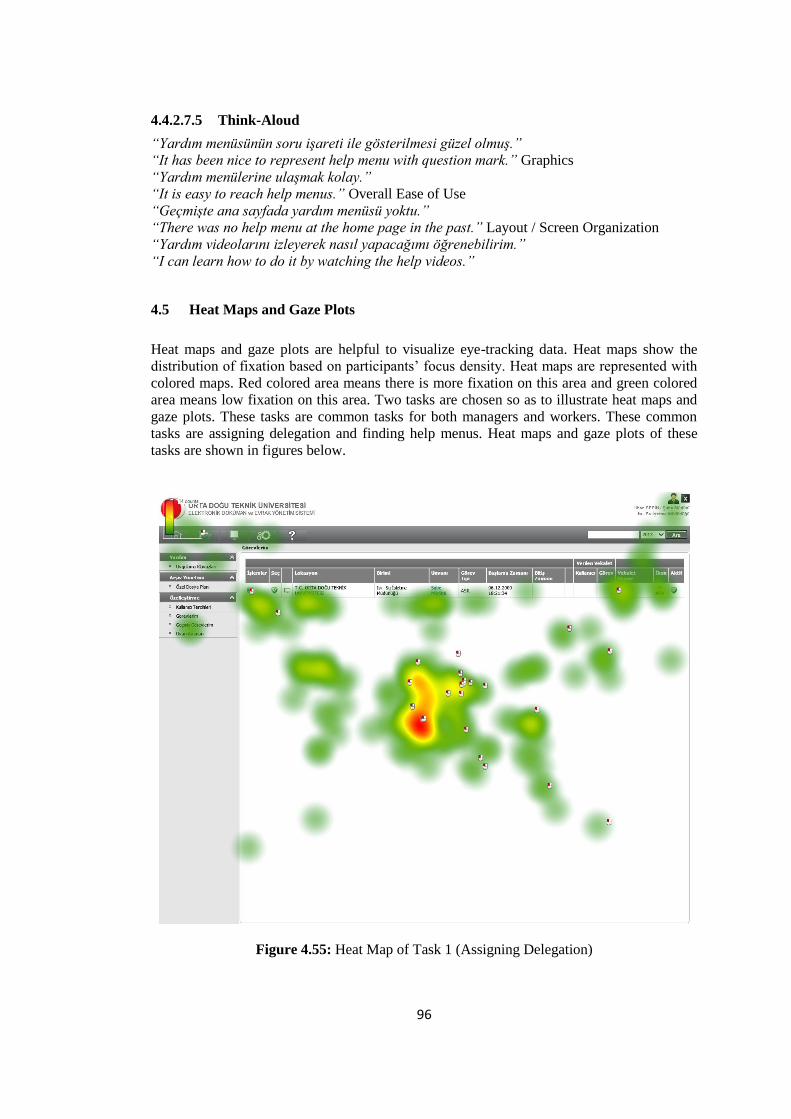
96
4.4.2.7.5 Think-Aloud
“Yardım menüsünün soru işareti ile gösterilmesi güzel olmuş.”
“It has been nice to represent help menu with question mark.” Graphics
“Yardım menülerine ulaşmak kolay.”
“It is easy to reach help menus.” Overall Ease of Use
“Geçmişte ana sayfada yardım menüsü yoktu.”
“There was no help menu at the home page in the past.” Layout / Screen Organization
“Yardım videolarını izleyerek nasıl yapacağımı öğrenebilirim.”
“I can learn how to do it by watching the help videos.”
4.5 Heat Maps and Gaze Plots
Heat maps and gaze plots are helpful to visualize eye-tracking data. Heat maps show the
distribution of fixation based on participants’ focus density. Heat maps are represented with
colored maps. Red colored area means there is more fixation on this area and green colored
area means low fixation on this area. Two tasks are chosen so as to illustrate heat maps and
gaze plots. These tasks are common tasks for both managers and workers. These common
tasks are assigning delegation and finding help menus. Heat maps and gaze plots of these
tasks are shown in figures below.
Figure 4.55: Heat Map of Task 1 (Assigning Delegation)
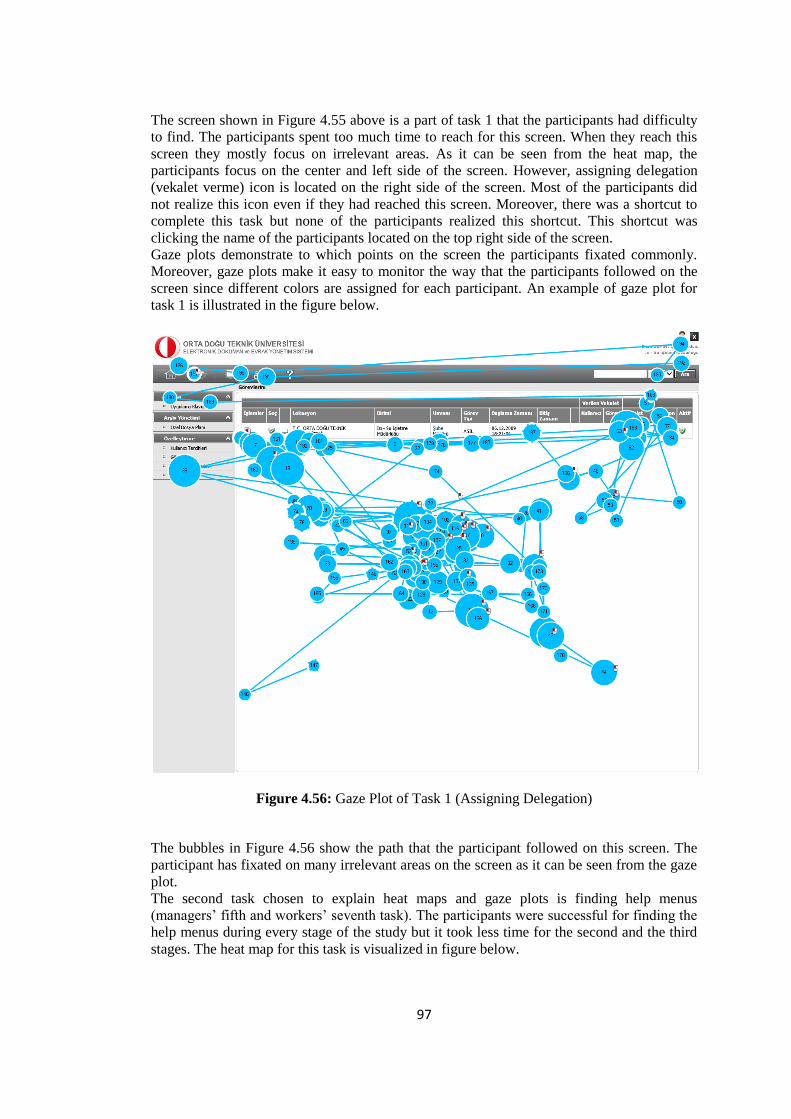
97
The screen shown in Figure 4.55 above is a part of task 1 that the participants had difficulty
to find. The participants spent too much time to reach for this screen. When they reach this
screen they mostly focus on irrelevant areas. As it can be seen from the heat map, the
participants focus on the center and left side of the screen. However, assigning delegation
(vekalet verme) icon is located on the right side of the screen. Most of the participants did
not realize this icon even if they had reached this screen. Moreover, there was a shortcut to
complete this task but none of the participants realized this shortcut. This shortcut was
clicking the name of the participants located on the top right side of the screen.
Gaze plots demonstrate to which points on the screen the participants fixated commonly.
Moreover, gaze plots make it easy to monitor the way that the participants followed on the
screen since different colors are assigned for each participant. An example of gaze plot for
task 1 is illustrated in the figure below.
Figure 4.56: Gaze Plot of Task 1 (Assigning Delegation)
The bubbles in Figure 4.56 show the path that the participant followed on this screen. The
participant has fixated on many irrelevant areas on the screen as it can be seen from the gaze
plot.
The second task chosen to explain heat maps and gaze plots is finding help menus
(managers’ fifth and workers’ seventh task). The participants were successful for finding the
help menus during every stage of the study but it took less time for the second and the third
stages. The heat map for this task is visualized in figure below.

98
Figure 4.57: Heat Map of Task 5 for Managers and Task 7 for Workers (Finding Help
Menus)
As it is stated above, the participants were successful for this task for all stages. The reason
why it took less for the second and the third stage is that there was no menu icon at the home
page for the first stage. A help menu, represented with a question mark, was added to the
main menus at the home page based on the findings of the first stage. The gaze plot of this
task is shown in the figure below.
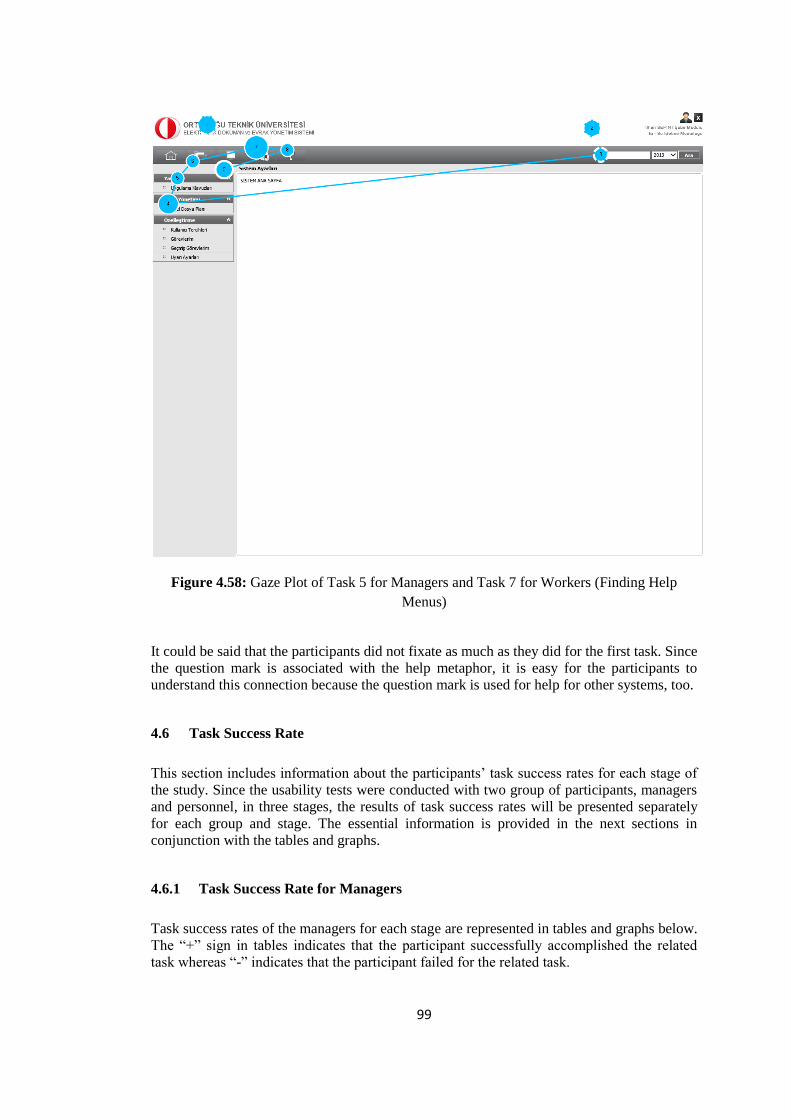
99
Figure 4.58: Gaze Plot of Task 5 for Managers and Task 7 for Workers (Finding Help
Menus)
It could be said that the participants did not fixate as much as they did for the first task. Since
the question mark is associated with the help metaphor, it is easy for the participants to
understand this connection because the question mark is used for help for other systems, too.
4.6 Task Success Rate
This section includes information about the participants’ task success rates for each stage of
the study. Since the usability tests were conducted with two group of participants, managers
and personnel, in three stages, the results of task success rates will be presented separately
for each group and stage. The essential information is provided in the next sections in
conjunction with the tables and graphs.
4.6.1 Task Success Rate for Managers
Task success rates of the managers for each stage are represented in tables and graphs below.
The “+” sign in tables indicates that the participant successfully accomplished the related
task whereas “-” indicates that the participant failed for the related task.
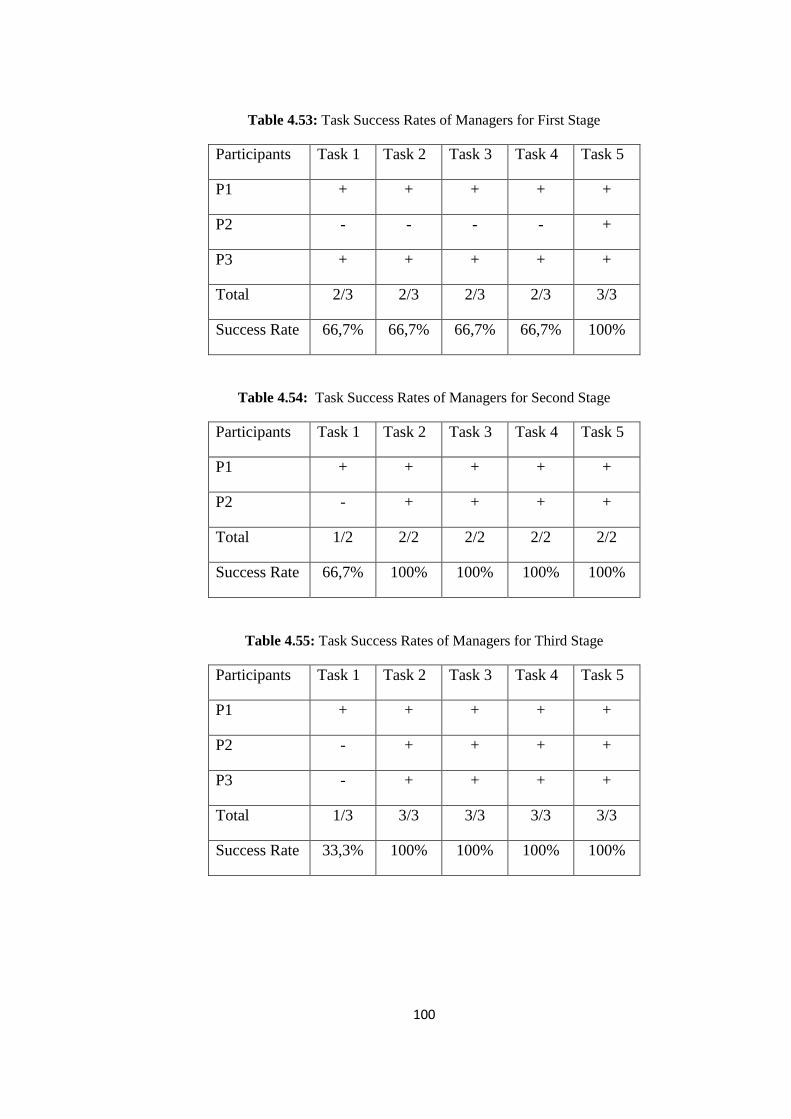
100
Table 4.53: Task Success Rates of Managers for First Stage
Participants Task 1 Task 2 Task 3 Task 4 Task 5
P1 + + + + +
P2 - - - - +
P3 + + + + +
Total 2/3 2/3 2/3 2/3 3/3
Success Rate 66,7% 66,7% 66,7% 66,7% 100%
Table 4.54: Task Success Rates of Managers for Second Stage
Participants Task 1 Task 2 Task 3 Task 4 Task 5
P1 + + + + +
P2 - + + + +
Total 1/2 2/2 2/2 2/2 2/2
Success Rate 66,7% 100% 100% 100% 100%
Table 4.55: Task Success Rates of Managers for Third Stage
Participants Task 1 Task 2 Task 3 Task 4 Task 5
P1 + + + + +
P2 - + + + +
P3 - + + + +
Total 1/3 3/3 3/3 3/3 3/3
Success Rate 33,3% 100% 100% 100% 100%
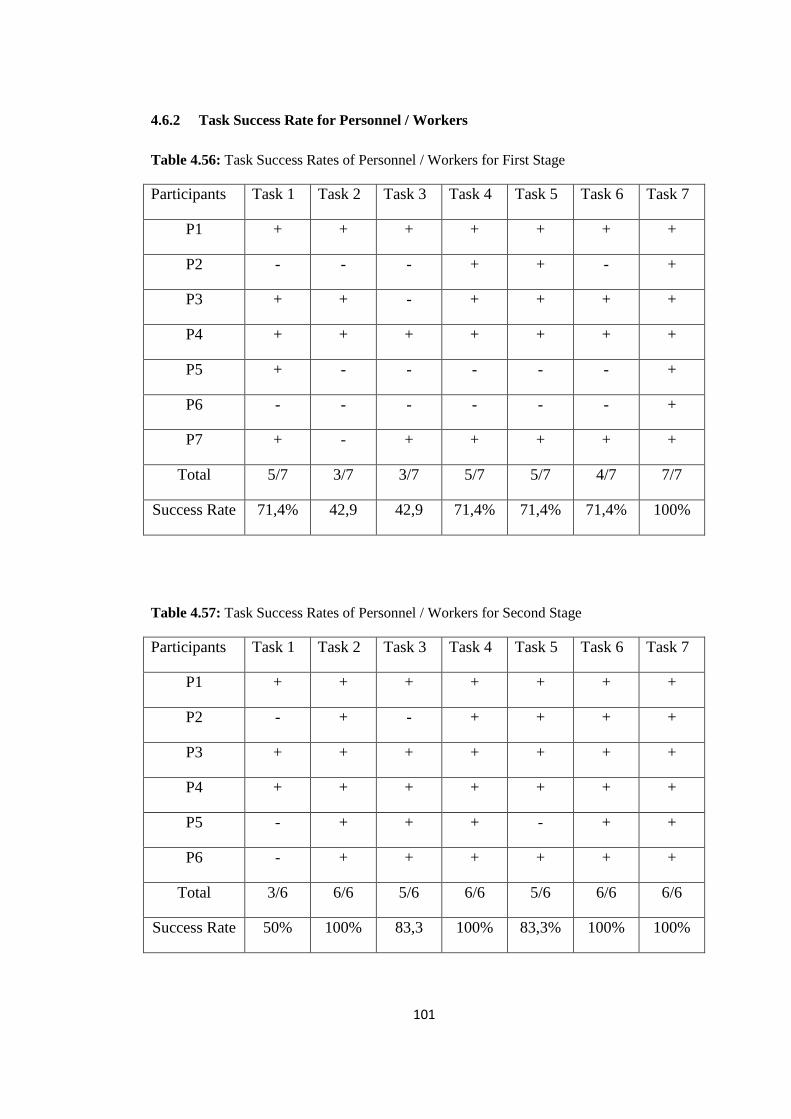
101
4.6.2 Task Success Rate for Personnel / Workers
Table 4.56: Task Success Rates of Personnel / Workers for First Stage
Participants Task 1 Task 2 Task 3 Task 4 Task 5 Task 6 Task 7
P1 + + + + + + +
P2 - - - + + - +
P3 + + - + + + +
P4 + + + + + + +
P5 + - - - - - +
P6 - - - - - - +
P7 + - + + + + +
Total 5/7 3/7 3/7 5/7 5/7 4/7 7/7
Success Rate 71,4% 42,9 42,9 71,4% 71,4% 71,4% 100%
Table 4.57: Task Success Rates of Personnel / Workers for Second Stage
Participants Task 1 Task 2 Task 3 Task 4 Task 5 Task 6 Task 7
P1 + + + + + + +
P2 - + - + + + +
P3 + + + + + + +
P4 + + + + + + +
P5 - + + + - + +
P6 - + + + + + +
Total 3/6 6/6 5/6 6/6 5/6 6/6 6/6
Success Rate 50% 100% 83,3 100% 83,3% 100% 100%
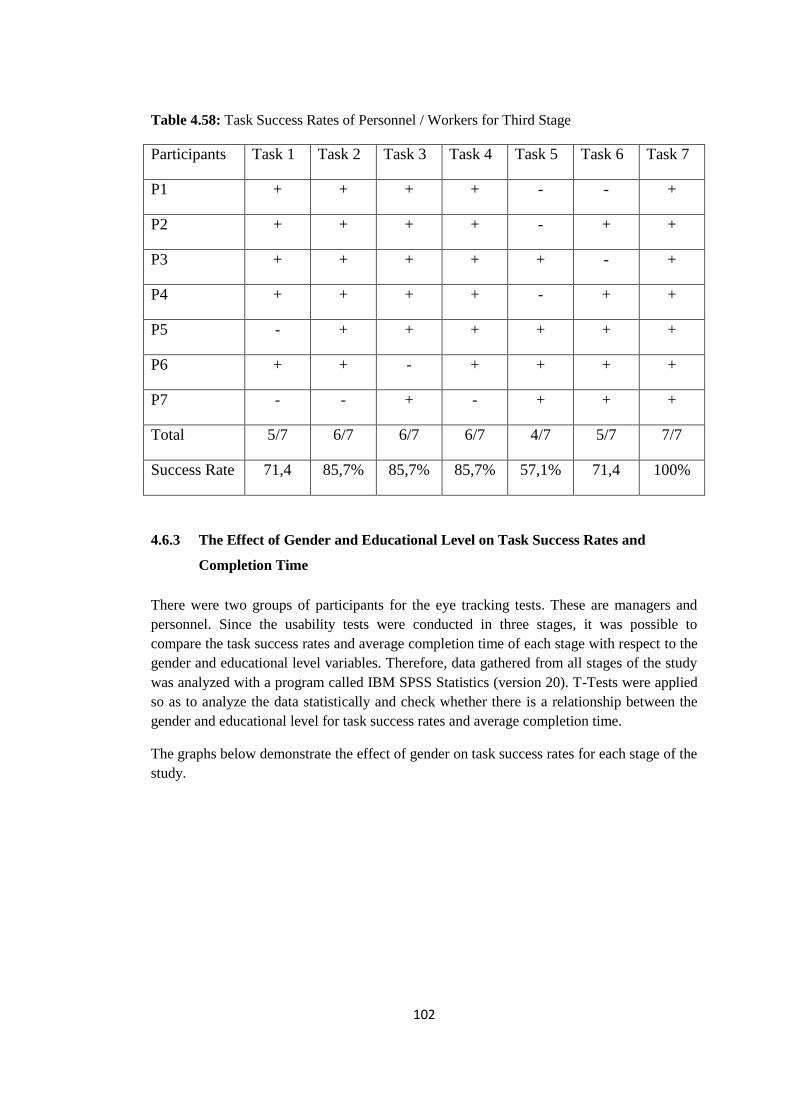
102
Table 4.58: Task Success Rates of Personnel / Workers for Third Stage
Participants Task 1 Task 2 Task 3 Task 4 Task 5 Task 6 Task 7
P1 + + + + - - +
P2 + + + + - + +
P3 + + + + + - +
P4 + + + + - + +
P5 - + + + + + +
P6 + + - + + + +
P7 - - + - + + +
Total 5/7 6/7 6/7 6/7 4/7 5/7 7/7
Success Rate 71,4 85,7% 85,7% 85,7% 57,1% 71,4 100%
4.6.3 The Effect of Gender and Educational Level on Task Success Rates and
Completion Time
There were two groups of participants for the eye tracking tests. These are managers and
personnel. Since the usability tests were conducted in three stages, it was possible to
compare the task success rates and average completion time of each stage with respect to the
gender and educational level variables. Therefore, data gathered from all stages of the study
was analyzed with a program called IBM SPSS Statistics (version 20). T-Tests were applied
so as to analyze the data statistically and check whether there is a relationship between the
gender and educational level for task success rates and average completion time.
The graphs below demonstrate the effect of gender on task success rates for each stage of the
study.
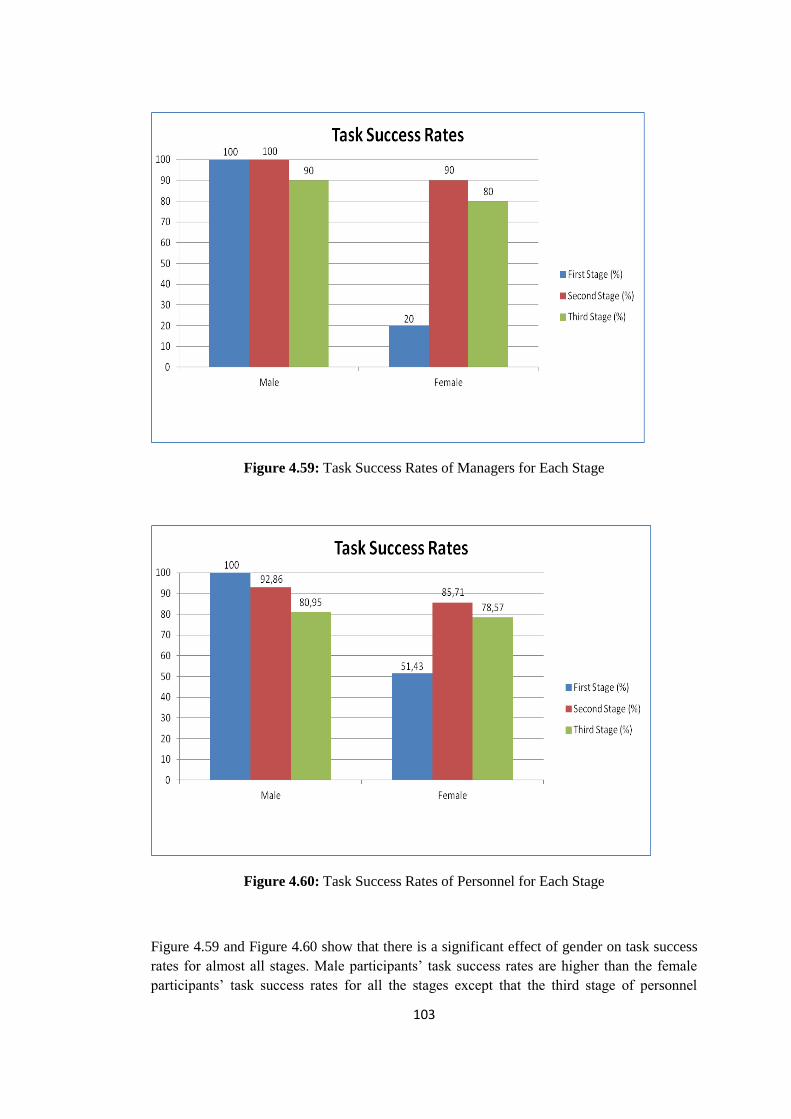
103
Figure 4.59: Task Success Rates of Managers for Each Stage
Figure 4.60: Task Success Rates of Personnel for Each Stage
Figure 4.59 and Figure 4.60 show that there is a significant effect of gender on task success
rates for almost all stages. Male participants’ task success rates are higher than the female
participants’ task success rates for all the stages except that the third stage of personnel
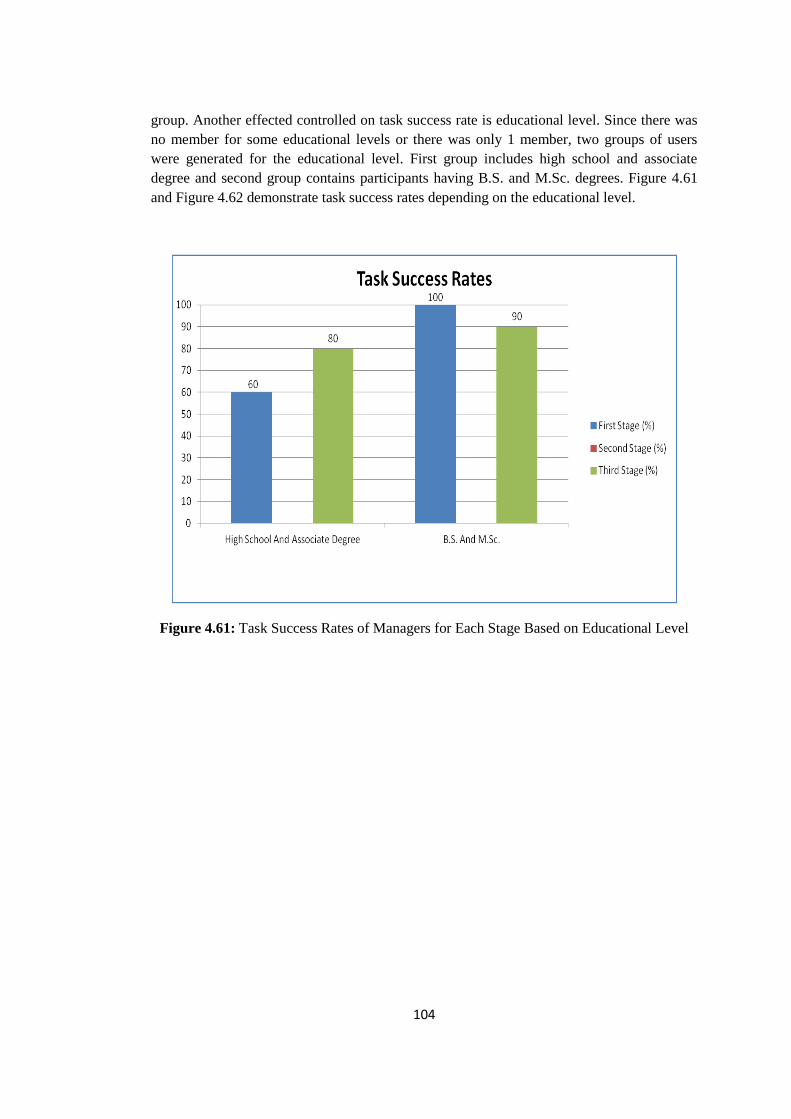
104
group. Another effected controlled on task success rate is educational level. Since there was
no member for some educational levels or there was only 1 member, two groups of users
were generated for the educational level. First group includes high school and associate
degree and second group contains participants having B.S. and M.Sc. degrees. Figure 4.61
and Figure 4.62 demonstrate task success rates depending on the educational level.
Figure 4.61: Task Success Rates of Managers for Each Stage Based on Educational Level
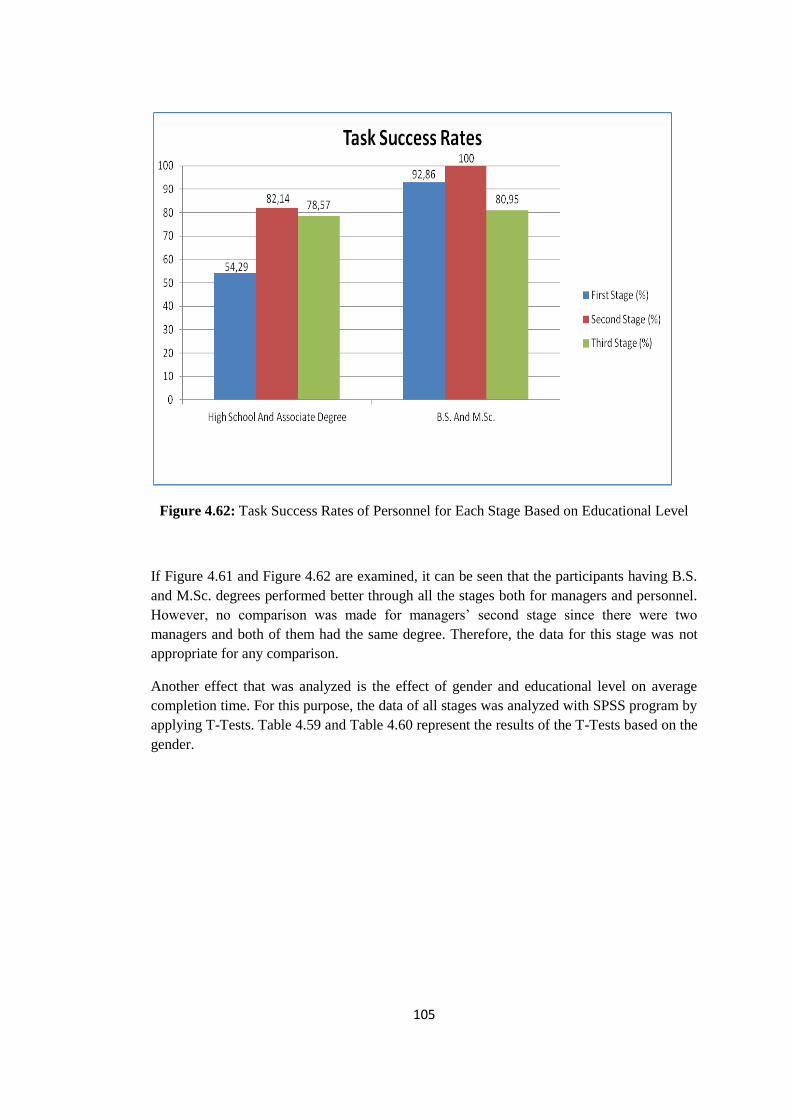
105
Figure 4.62: Task Success Rates of Personnel for Each Stage Based on Educational Level
If Figure 4.61 and Figure 4.62 are examined, it can be seen that the participants having B.S.
and M.Sc. degrees performed better through all the stages both for managers and personnel.
However, no comparison was made for managers’ second stage since there were two
managers and both of them had the same degree. Therefore, the data for this stage was not
appropriate for any comparison.
Another effect that was analyzed is the effect of gender and educational level on average
completion time. For this purpose, the data of all stages was analyzed with SPSS program by
applying T-Tests. Table 4.59 and Table 4.60 represent the results of the T-Tests based on the
gender.

106
Table 4.59: Average Completion Time Results of Managers for Each Stage Based on
Gender (Sec)
Task Gender Mean for First
Stage
Mean for Second
Stage
Mean for Third
Stage
Task 1 male 121,50 145 132
Task 1 female 147 124 153
Task 2 male 108 95 121,50
Task 2 female 180 138 160
Task 3 male 205,50 158 86,50
Task 3 female 180 164 137
Task 4 male 151,50 84 92,50
Task 4 female 240 134 114
Task 5 male 61 35 45
Task 5 female 111 64 34
When Table 4.59 is examined, it can be observed that there is a significant difference for
male and female managers. For the first stage, male participants performed better than
females since the means of male participants’ for task 1, 2, 4 and 5 are lower than female’s.
However, female participants performed better for task 3. For the second stage, male
participants performed better for task 2, 3, 4, and 5 and female participants performed better
for task 1. For the third stage, male participants performed better for task 1, 2, 3 and 4.
Female participants performed better for task 5.
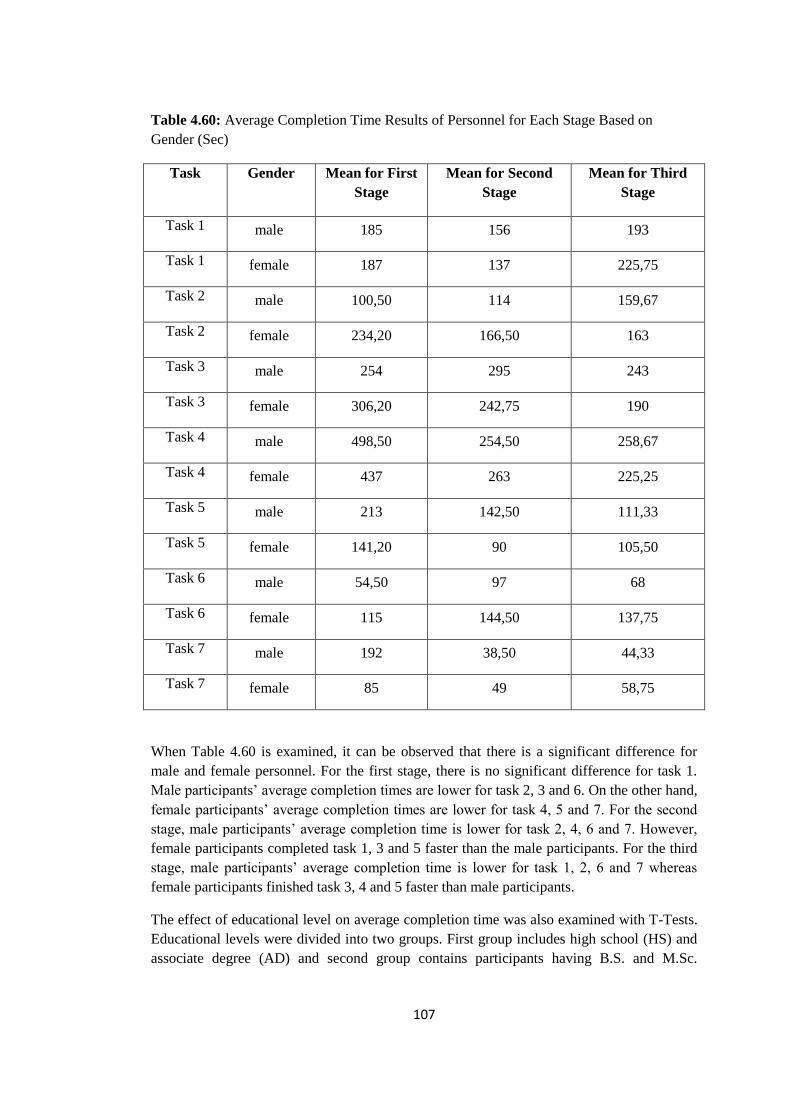
107
Table 4.60: Average Completion Time Results of Personnel for Each Stage Based on
Gender (Sec)
Task Gender Mean for First
Stage
Mean for Second
Stage
Mean for Third
Stage
Task 1 male 185 156 193
Task 1 female 187 137 225,75
Task 2 male 100,50 114 159,67
Task 2 female 234,20 166,50 163
Task 3 male 254 295 243
Task 3 female 306,20 242,75 190
Task 4 male 498,50 254,50 258,67
Task 4 female 437 263 225,25
Task 5 male 213 142,50 111,33
Task 5 female 141,20 90 105,50
Task 6 male 54,50 97 68
Task 6 female 115 144,50 137,75
Task 7 male 192 38,50 44,33
Task 7 female 85 49 58,75
When Table 4.60 is examined, it can be observed that there is a significant difference for
male and female personnel. For the first stage, there is no significant difference for task 1.
Male participants’ average completion times are lower for task 2, 3 and 6. On the other hand,
female participants’ average completion times are lower for task 4, 5 and 7. For the second
stage, male participants’ average completion time is lower for task 2, 4, 6 and 7. However,
female participants completed task 1, 3 and 5 faster than the male participants. For the third
stage, male participants’ average completion time is lower for task 1, 2, 6 and 7 whereas
female participants finished task 3, 4 and 5 faster than male participants.
The effect of educational level on average completion time was also examined with T-Tests.
Educational levels were divided into two groups. First group includes high school (HS) and
associate degree (AD) and second group contains participants having B.S. and M.Sc.

108
degrees. Table 4.61 and Table 4.62 demonstrate the results of the T-Tests based on the
educational level.
Table 4.61: Average Completion Time Results of Managers for Each Stage Based on
Educational Level
Task Educational
Level
Mean for First
Stage
Mean for Third
Stage
Task 1 HS and AD 137 150
Task 1 B.S. and M.Sc. 116 133,50
Task 2 HS and AD 152 130
Task 2 B.S. and M.Sc. 92 136,50
Task 3 HS and AD 236 83
Task 3 B.S. and M.Sc. 119 113,50
Task 4 HS and AD 226 80
Task 4 B.S. and M.Sc. 91 109,50
Task 5 HS and AD 94 40
Task 5 B.S. and M.Sc. 45 42
When Table 4.61 is examined, it can be said that there is a significant difference for all tasks
for the first stage. Participants B.S. and M.Sc. degrees completed all tasks faster than the
participants having high school and associate degrees. No comparison was made for the
second stage since one manager did not attend this stage and the other two managers had the
same degree. For the third stage, there is no significant difference for task 2 and 5.
Participants having high school and associate degree completed task 3 and 4 faster than the
other group whereas participants with B.S. and M.Sc. degrees finished task 1 faster.
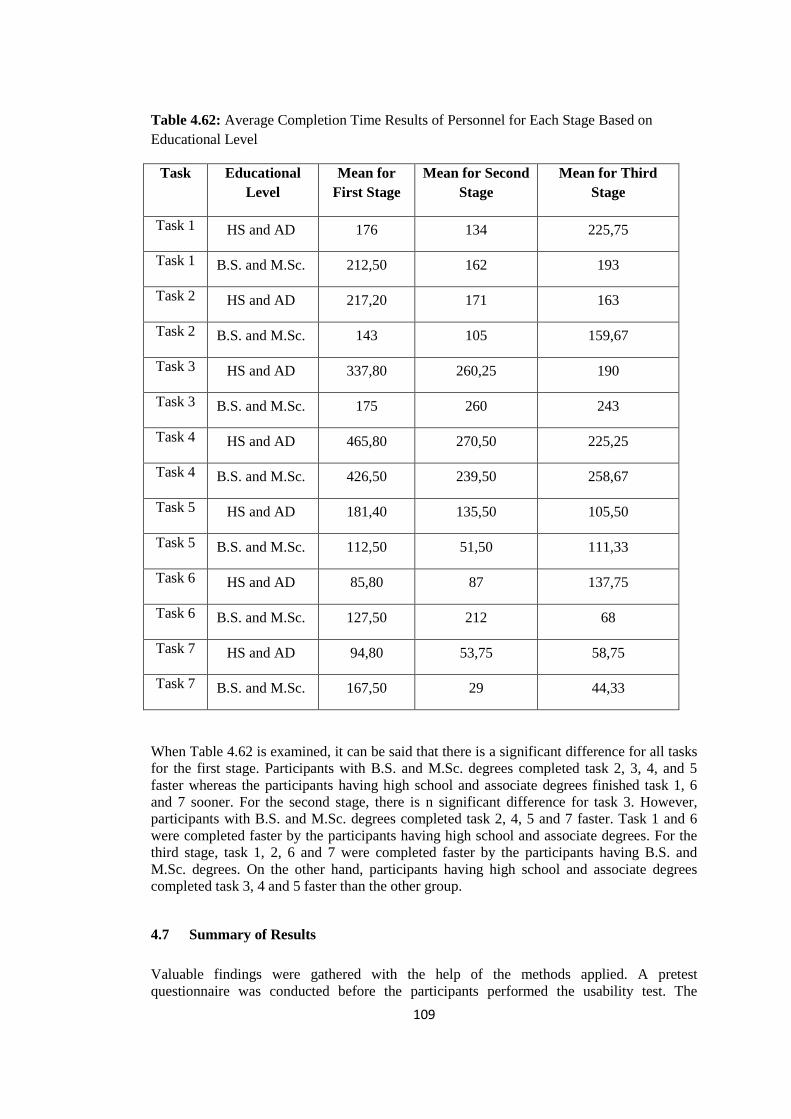
109
Table 4.62: Average Completion Time Results of Personnel for Each Stage Based on
Educational Level
Task Educational
Level
Mean for
First Stage
Mean for Second
Stage
Mean for Third
Stage
Task 1 HS and AD 176 134 225,75
Task 1 B.S. and M.Sc. 212,50 162 193
Task 2 HS and AD 217,20 171 163
Task 2 B.S. and M.Sc. 143 105 159,67
Task 3 HS and AD 337,80 260,25 190
Task 3 B.S. and M.Sc. 175 260 243
Task 4 HS and AD 465,80 270,50 225,25
Task 4 B.S. and M.Sc. 426,50 239,50 258,67
Task 5 HS and AD 181,40 135,50 105,50
Task 5 B.S. and M.Sc. 112,50 51,50 111,33
Task 6 HS and AD 85,80 87 137,75
Task 6 B.S. and M.Sc. 127,50 212 68
Task 7 HS and AD 94,80 53,75 58,75
Task 7 B.S. and M.Sc. 167,50 29 44,33
When Table 4.62 is examined, it can be said that there is a significant difference for all tasks
for the first stage. Participants with B.S. and M.Sc. degrees completed task 2, 3, 4, and 5
faster whereas the participants having high school and associate degrees finished task 1, 6
and 7 sooner. For the second stage, there is n significant difference for task 3. However,
participants with B.S. and M.Sc. degrees completed task 2, 4, 5 and 7 faster. Task 1 and 6
were completed faster by the participants having high school and associate degrees. For the
third stage, task 1, 2, 6 and 7 were completed faster by the participants having B.S. and
M.Sc. degrees. On the other hand, participants having high school and associate degrees
completed task 3, 4 and 5 faster than the other group.
4.7 Summary of Results
Valuable findings were gathered with the help of the methods applied. A pretest
questionnaire was conducted before the participants performed the usability test. The

110
demographic information of the participants was collected with the help of this
questionnaire. Moreover, data about participants’ computer usage and time spent while using
computer was collected. A task analysis about METU EDMS was performed in order to
identify the most frequently used tasks with the help of system administrators. The flow
charts for each task were generated as a result of the task analysis and these charts are
presented in Appendix C. After identifying the tasks, the ideal completion time and mouse
clicks count were calculated with the help of an expert user. The information about these
ideal case is provided at the tables in section 4.4. Moreover, the ideal case for each task was
demonstrated at the completion time and mouse clicks count graphs. After the tasks analysis,
eye tracking tests were conducted with the participants in three stages. Participants’ eye
movements and gaze plot data were recorded in METU HCI Lab so as to analyze this
information. The participants were chosen among METU administrative workers. The data
was recorded with the help of an eye tracker device. The recorded videos were analyzed for
each stage of the study and the results of these phases are presented in section 4.4. Eye
tracking tests revealed significant quantitative data for METU EDMS interface. These
quantitative data are presented under the subtopics of completion time, mouse clicks, areas
of interest, fixation duration and fixation count. Moreover, heat maps and gaze plots were
generated by the help of Tobii Studio software. Heat maps demonstrate the fixation areas of
the participants on the screen and gaze plots show the path of eye movements that the
participants followed during the task. One of the methods applied was think-aloud method.
This method was beneficial to interpret the ideas of the participants together with the eye
tracking tests’ results. The findings of think-aloud method were divided into categories based
on the statements of the participants. These statements were important to understand the
opinions of the end users and identify the problematic design issues based on their
perspective. Another indication of the results was task success rates. The data gathered from
the eye tracking tests was used to estimate the task success rates of the participants for each
stage and these rates are shown in section 4.6. Task success rates were helpful so as to
identify the tasks that the participants face with difficulties. Finally, the effect of gender and
education level on task success rates, completion time and mouse clicks showed that there is
significant difference for some tasks with respect to the total task completion time, average
task completion time and mouse clicks.
111
CHAPTER 5
5 DISCUSSION AND CONCLUSION
Four usability evaluation methods were used in this study. These methods are conducting
two different types of questionnaires (pretest and posttest questionnaires), eye tracking and
think aloud. Data collected with the help of these methods were analyzed and presented in
the previous chapter. The findings will be summarized and discussed in detail based on the
research questions of the study in this chapter.
There are mainly three research questions for this study. All of these questions include at
least two subtopics. The 3 main research questions are as follows:
(RQ1) What are the most significant tasks performed by managers and personnel on
METU EDMS?
(RQ2) Which usability issues are present on the current METU EDMS interface
with respect to the significant tasks?
(RQ3) How can METU EDMS interface be developed in the light of usability issues
determined?
Second research question was divided into 3 subtopics depending on the standardized
definition of usability. These subtopics are effectiveness, efficiency and satisfaction.
To evaluate the effectiveness of METU EDMS;
(RQ2.1) What are the task success rates of the users for each task?
(RQ2.2) Which tasks are the most difficult for the users to accomplish? What kinds
of errors/problems do they experience when they were not able to accomplish a task?
(RQ2.3) Is there a positive change in terms of using the system effectively for the
users of first and second stages who took the system test one year ago?
How many steps do the users take in order to complete the predefined tasks?
To evaluate the efficiency of METU EDMS;
(RQ2.4) How long does it take for the users to complete each task?
(RQ2.5) How many mouse clicks do the users execute to finalize each task?
(RQ2.6) How long do the users stare at the task-related and non-task-related areas?
To examine the user satisfaction aspect of the usability;
(RQ2.7) How do the users evaluate the perceived usefulness of METU EDMS?
(RQ2.8) What kind of interpretations do the users make about the interface of
METU EDMS?
112
5.1 RQ 1. What are the most significant tasks performed by managers and
personnel on METU EDMS?
Task analysis methodology was used so as to identify the most important tasks performed by
managers and personnel. Task analysis sessions were conducted with the administrators of
METU EDMS to benefit from their experience before identifying the tasks for managers and
personnel. Since one of the main purpose of this study is to show the usability issues of
METU EDMS, the most significant tasks were needed for proper evaluation of the system.
The chosen tasks for managers and personnel were explained in a detailed way in
methodology and result chapters. In addition to the task analysis, the opinions of the system
administrators were asked for the identification of the tasks. As a result of the task analysis
and informal interview with METU EDMS administrators, 5 tasks for managers and 7 tasks
for personnel were chosen for the usability study of METU EDMS. After chsing the related
tasks, the flow charts of these tasks were sketched by using the test environment of the
system. Then, the necessary paths for the completion of the tasks were clarified and these
paths are visualized in Appendix C. Finally, the ideal cases for the completion time and
mouse clicks of the identified tasks were calculated with METU EDMS administrators. In
other words, this estimation was calculated by the expert users.
5.2 RQ 2. Which usability issues are present on the current METU EDMS interface
with respect to the significant tasks?
The purpose of the second research question is to identify and show the usability issues of
METU EDMS interface with respect to the significant tasks determined by the result of RQ1.
This question was divided into sub questions depending on the elements of standardized
definition of usability. These elements are effectiveness, efficiency and satisfaction.
Therefore, the effectiveness and efficiency of METU EDMS are evaluated with the help of
the methods applied and eye tracking study results. The user satisfaction aspect of usability
was evaluated with the questionnaires conducted and think aloud method. The following sub
questions of RQ2 show the usability issues of METU EDMS for each stage of the study.
5.2.1 RQ 2.1. What are the task success rates of the users for each task?
The purpose of this question is to evaluate the effectiveness of METU EDMS. To evaluate
the effectiveness of METU EDMS, task success rates were revealed with the help of the eye
tracking tests. These tests were conducted by two groups of participants; namely managers
and personnel. After three stages of the usability tests, the data gathered with the eye-
tracking device were examined with the software called Tobii Studio that is explained in
Chapter 3. The results of the success rate show the achievement of the participant for the
related task. Task success rates are provided in Tables 4.53, 4.54, 4.55, 4.56, 4.57 and 4.58
for each stage and group of participants in Chapter 4. When these tables are examined, it can
be said that the success rate of the tasks for managers increased in the second and the third
stage compared to the first stage except task 1 and task 5 of workers. However, when these
tables are examined for personnel, the success rates of task 1 and task 5 fluctuate for the
second and third stages. This situation indicates that improvement is needed for these tasks.

113
5.2.2 RQ 2.2. Which tasks are the most difficult for the users to accomplish? What
kinds of errors/problems do they experience when they were not able to
accomplish a task?
The purpose of this question is to evaluate the effectiveness of METU EDMS, too. When the
results of the data gathered from the eye tracking tests were examined considering the
research question 2.1, it can be specified that Task 1 was one of the most difficult tasks both
for managers and personnel. The success rates of this task decreased to 50 % from 66.7% for
managers considering the first and the second stages. Moreover, task success rate decreased
further to 33.3 % for the third stage of managers. The task success rates of this task for
personnel fluctuate. The success rate for the first stage is 71.4%. This rate decreased to 50%
for the second stage and increased to 71.4% again for the third stage. This task is related with
assigning delegation. One of the main reasons for this problem is that the participants were
not able to find the assigning delegation function. They tried to find this function after they
entered into METU EDMS with their usernames and passwords. Firstly, they tried to find
this function at the home page of the system assuming that assigning delegation function was
located on that screen. Then, they started to navigate between the pages to find the related
function. There were two ways to achieve this task. One of them was using the system
settings menu and the other one was using mmy positions shortcut. However, some of the
participants did not recognize this function even if they found the related page.When the
overall fixation duration and fixation count percentages of Task 1 were examined for
managers and personnel in Figure 4.10 and Figure 4.30 with respectively, it can be seen that
the participants mostly focused on the irrelevant objects for this task. This situation is also an
indicator that the participants could not find the needed button or link.in addition to the task
success rates. Another difficult task for personnel is task 6. This task was related with taking
a document that had been sent by mistake back. The task success rates of this task seem to
increase and stay the same for the second and third stage respectively. However, total
fixation duration and fixation count percentages is an indicator for the difficulty of this task.
The percentage of fixation duration for the participants focusing on relevant areas is 12.95%
for the first stage. This ratio decreased to 10,96% and 11,35% for the second and third stages
with respectively. Moreover, the comments of the participants while trying to accomplish
this task showed that they face with difficulty.
5.2.3 RQ 2.3. Is there a positive change in terms of using the system effectively for
the users of first and second stages who took the system test one year ago?
Task success rates, obstacles and errors for the first and second stages are evaluated so as to
answer this question. The results of the first and second stages’ participants are appropriate
for this question since a comparison is needed for the same participants. When we evaluate
the results of the task success rates given in section 4.6, it could be seen that all the
participants performed better at the second stage excluding task 1. Only task 1’s success rate
is lower than the first stage. It means that the design and the usability of the system still
needs improvement for this task. However, even if the participants performed better at the
second stage, that does not mean there is no problem for the other tasks. When the
completion time of the tasks were evaluated, some tasks such as task 4 and task 6 take too
much time to complete. Therefore, it could not be said that the design and the usability of the
system are very good since the participants performed better at the second stage.
The participants’ eye movements and gaze plots were recorded during the task performance.
These records were analyzed in replay sessions with the help of Tobii Studio software. These
114
sessions are helpful to see the obstacles and the errors that the participants face with during
the first and second stage usability tests. It can be said that the participants face with less
obstacles and errors during the second stage. However, the participants are still not satisfied
with the performance of java technology while previewing the documents.
5.2.4 RQ 2.4. How long does it take for the users to complete each task?
The purpose of this question is to evaluate the efficiency of METU EDMS. Completion time
of each task was analyzed in order to answer this question. Completion time for each task of
managers and personnel were provided in Chapter 4. All the participants’ task completion
time values for each task were calculated and compared to the ideal case so as to see the
divergence from the expert users’ completion time. For instance, Figure 4.27 represents the
completion time of task 1 for personnel. When this figure is analyzed, it could be seen that
each participant’s completion time was provided for each stage of the study together with the
ideal case completion time. When all the figures of the completion time for each task are
interpreted, it can be observed that all the tasks were completed by spending more time
compared to the ideal cases. This situation demonstrates that the participants need to search
and find the relevant sections or the objects. Therefore, they lost too much time while trying
to accomplish the necessary tasks. When all the completion time graphs were analyzed, it
can be interpreted that task 3 for managers and task 4 for personnel are the most time
consuming tasks. Figure 5.1 and Figure 5.2 below represent the average completion time for
managers and personnel. During the calculation of average completion time, participants
who could not complete tasks were excluded. Especially task 4 for some personnel took too
much time to complete. 2 participants finished this task above 10 minutes. There was “+”
sign for task 4 that the participants need to click in order to add information to a field. Most
of the participants forgot to click on this sign because it was not visible. Then, when they
received the error message, they did not understand what the mistake was since the error
message was not explanatory. At that point, the system was not able to direct the user to the
point where the mistake had been made. Therefore, the participants lost time in order to
understand and solve this problem. Considering the completion time of all the tasks provided
in Chapter 4, it could be said that the navigation of the system across different pages is weak.
Therefore, overall complexity of the layout confuses the participants and they face with
difficulty while trying to find the necessary button or function.
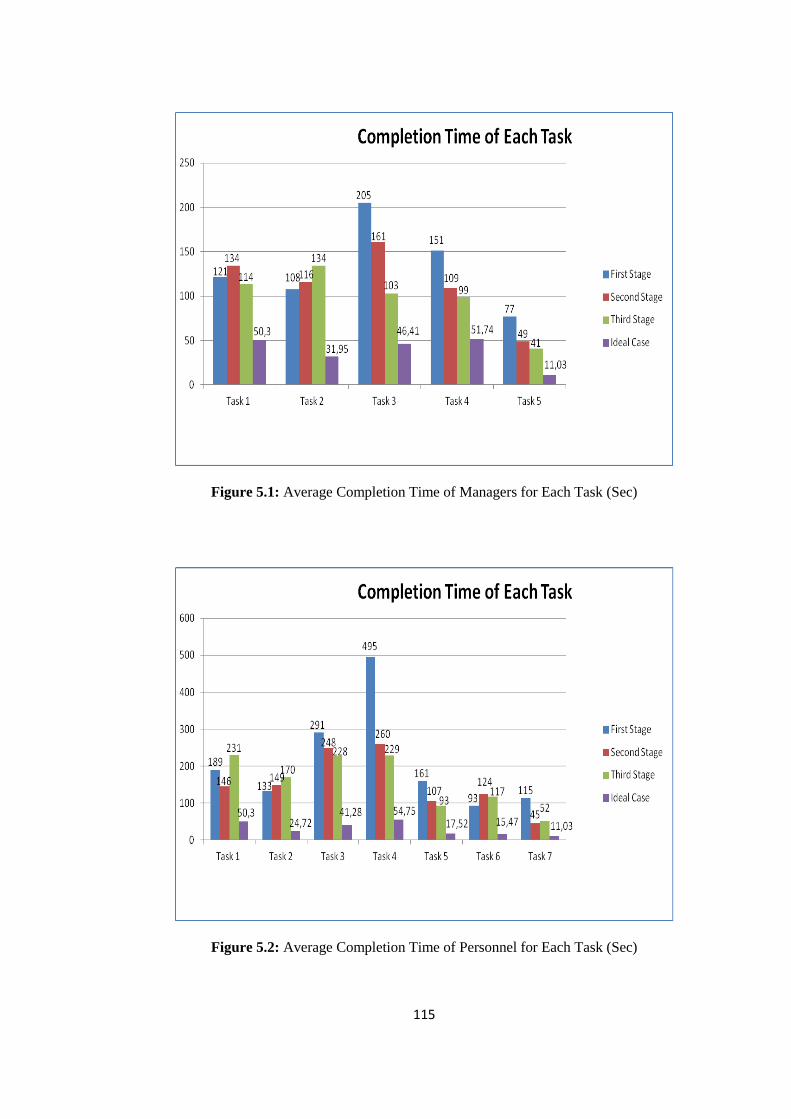
115
Figure 5.1: Average Completion Time of Managers for Each Task (Sec)
Figure 5.2: Average Completion Time of Personnel for Each Task (Sec)
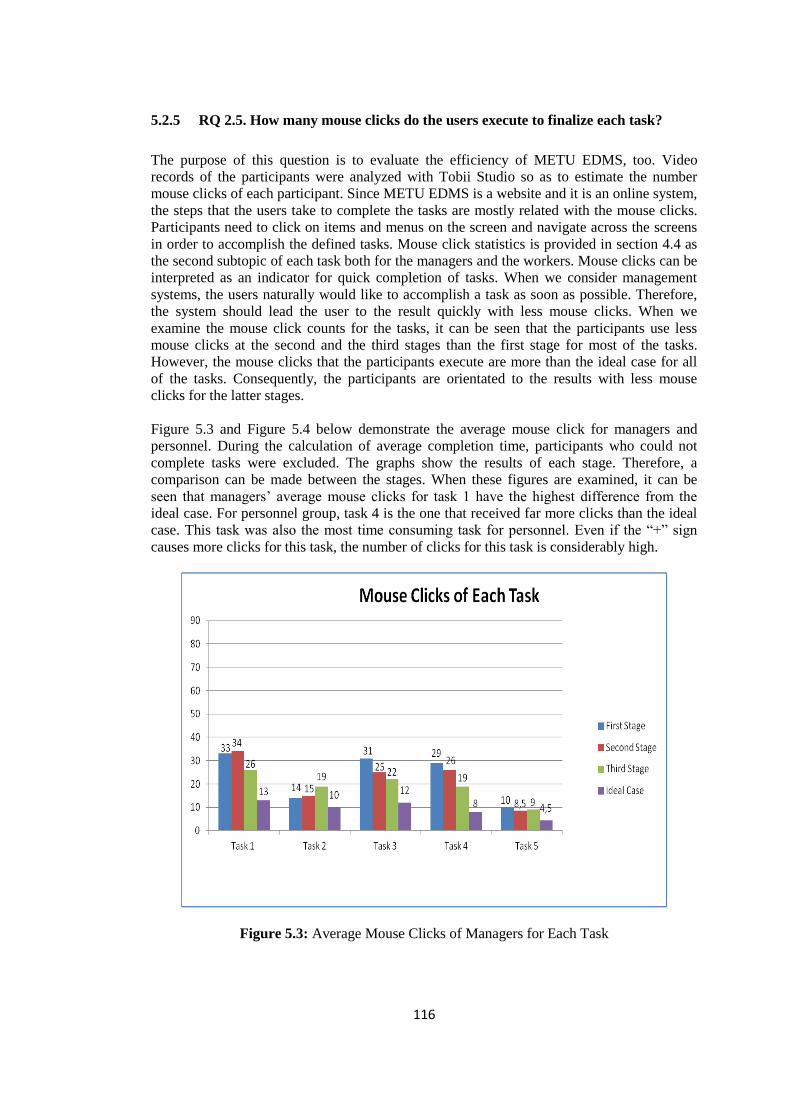
116
5.2.5 RQ 2.5. How many mouse clicks do the users execute to finalize each task?
The purpose of this question is to evaluate the efficiency of METU EDMS, too. Video
records of the participants were analyzed with Tobii Studio so as to estimate the number
mouse clicks of each participant. Since METU EDMS is a website and it is an online system,
the steps that the users take to complete the tasks are mostly related with the mouse clicks.
Participants need to click on items and menus on the screen and navigate across the screens
in order to accomplish the defined tasks. Mouse click statistics is provided in section 4.4 as
the second subtopic of each task both for the managers and the workers. Mouse clicks can be
interpreted as an indicator for quick completion of tasks. When we consider management
systems, the users naturally would like to accomplish a task as soon as possible. Therefore,
the system should lead the user to the result quickly with less mouse clicks. When we
examine the mouse click counts for the tasks, it can be seen that the participants use less
mouse clicks at the second and the third stages than the first stage for most of the tasks.
However, the mouse clicks that the participants execute are more than the ideal case for all
of the tasks. Consequently, the participants are orientated to the results with less mouse
clicks for the latter stages.
Figure 5.3 and Figure 5.4 below demonstrate the average mouse click for managers and
personnel. During the calculation of average completion time, participants who could not
complete tasks were excluded. The graphs show the results of each stage. Therefore, a
comparison can be made between the stages. When these figures are examined, it can be
seen that managers’ average mouse clicks for task 1 have the highest difference from the
ideal case. For personnel group, task 4 is the one that received far more clicks than the ideal
case. This task was also the most time consuming task for personnel. Even if the “+” sign
causes more clicks for this task, the number of clicks for this task is considerably high.
Figure 5.3: Average Mouse Clicks of Managers for Each Task
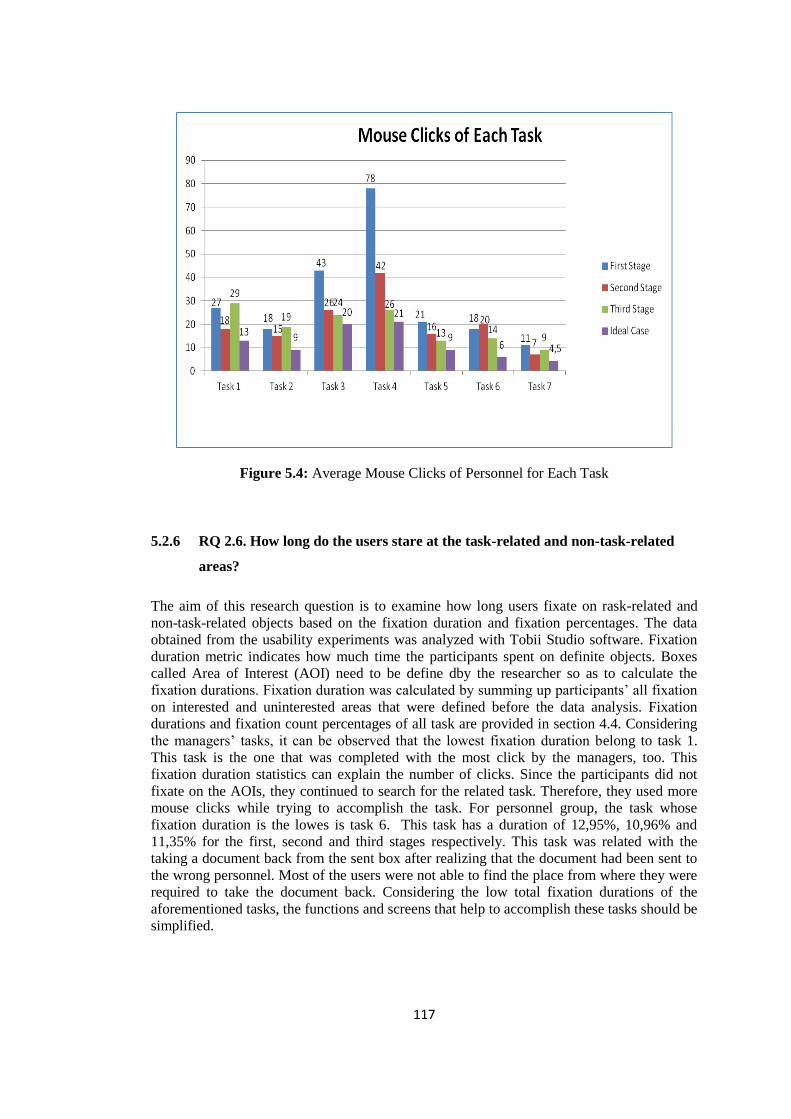
117
Figure 5.4: Average Mouse Clicks of Personnel for Each Task
5.2.6 RQ 2.6. How long do the users stare at the task-related and non-task-related
areas?
The aim of this research question is to examine how long users fixate on rask-related and
non-task-related objects based on the fixation duration and fixation percentages. The data
obtained from the usability experiments was analyzed with Tobii Studio software. Fixation
duration metric indicates how much time the participants spent on definite objects. Boxes
called Area of Interest (AOI) need to be define dby the researcher so as to calculate the
fixation durations. Fixation duration was calculated by summing up participants’ all fixation
on interested and uninterested areas that were defined before the data analysis. Fixation
durations and fixation count percentages of all task are provided in section 4.4. Considering
the managers’ tasks, it can be observed that the lowest fixation duration belong to task 1.
This task is the one that was completed with the most click by the managers, too. This
fixation duration statistics can explain the number of clicks. Since the participants did not
fixate on the AOIs, they continued to search for the related task. Therefore, they used more
mouse clicks while trying to accomplish the task. For personnel group, the task whose
fixation duration is the lowes is task 6. This task has a duration of 12,95%, 10,96% and
11,35% for the first, second and third stages respectively. This task was related with the
taking a document back from the sent box after realizing that the document had been sent to
the wrong personnel. Most of the users were not able to find the place from where they were
required to take the document back. Considering the low total fixation durations of the
aforementioned tasks, the functions and screens that help to accomplish these tasks should be
simplified.
118
5.2.7 RQ 2.7. How do the users evaluate the perceived usefulness of METU EDMS?
The purpose of this question is to search the user satisfaction dimension of usability. The
post-test questionnaire was conducted with the participants after the usability tests in order to
measure the participants’ satisfaction. This questionnaire can be seen in Appendix B. The
questionnaire have both open-ended questions and likert type questions. The results of this
questionnaire were presented in section 4.3 for each stage and group of participants. When
the results of this questionnaire were analyzed by considering the completion time, mouse
clicks and total fixation duration and fixation count percentages, it could be said that the
participants completed most of the tasks faster at the latter stages compared to the first stage.
However, when the results of the questionnaire were examined it can be said that most of the
participants have developed a negative attitude towards the system even if they completed
the tasks faster. The reason why they have developed such a negative attitude should be
studied in future studies.
The opinions of the participants are important for the satisfaction dimension. For instance,
one of the participants from the first stage stated an opinion about the appearance of the
system. This opinion is as follows:
“Ekranda çok fazla yazı ve menü bulunmakta. Bu da kafamı karıştırıp ürkütüyor.
Daha sade bir şekilde 3-4 başlık olsa kullanıcı alt kırılımlar yardımıyla istediği
evrak veya forma ulaşabilir. Yardım menüsü sayfanın en başında olmalı ve adı
yardım olarak görülmeli.”
“There is too many text and menu on the screen. That scares me and make me
confused. The user could reach the document or form that is desired simply if there
are 3 or 4 menus with the help of breakdowns. ”
When we consider the comments of the participants about the appearance and usability of
the system for the first and other two stages, it could be said that the participants’ attitude is
more positive after the second and third stages for this issue. However, one of the
participants’ from the third stage comment about the design of METU EDMS is as follows:
“Sistemin görünüşü diğer internet sitelerinde olan sadeliğe uymuyor. Bir bölüme
gitmek için izlenebilecek yollar çok sınırlı. Bu da ararken kaybolmaya sebebiyet
veriyor. Sistem e-posta sistemleri gibi olsa daha güzel olur.”
“The appearance of the system does not suit simplicity of the other websites. The
paths that need to be followed to a section are limited. This causes to get lost while
searching. It would be better if the system is similar to e-mail systems.”
Another participant from the first stage offered a suggestion about the search function and
the system was developed after the first stage as the participant suggested. This suggestion is
stated below:
“Evrak ararken çok ayrıntı var. Gelen ve giden evrakları neye göre ayıracağımı
bilemiyorum. Ayrıntılar ikinci seçenek olarak yapılabilir mi?”
“There are too many details while searching the document. I do not know relative to
what I will distinguish the inbound and outbound documents.”
Even if the participants’ attitude and suggestions above seem to be positive, most of the
ratings given for the second and the third stages fluctuate and the results for the second and
119
the third stages have a negative tendency compared to the first stage. The opinions of the
participants from all the stages were recorded. These records will be used to improve the
interface of METU EDMS in the near future.
5.2.8 RQ 2.8. What kind of interpretations do the users make about the interface of
METU EDMS?
This research question aims to investigate the user satisfaction aspect of usability. Think
aloud method was used to answer this research question. The participants were asked to
express their feelings and make comments during the eye tracking study. Participants’ voice,
comments and screen actions were recorded. The results of the think aloud data were
provided in Chapter 4 for each task of managers and personnel. The appropriate expressions
were grouped into categories mentioned in section 3.4.3.2. The expressions and comments of
the participants gave an idea about the possible usability problems with related the task.
Problems were identified for each category and these problems are stated below:
Navigation;
Forms have scrolling and having scrolling causes error messages at the top of the screen
to be missed
Unnecessary clicks across pages
Graphics;
Java preview
Layout / Screen Organization;
Error messages that are not understandable
Crowded text screen at the desktop menu
Too many criteria for search section
The place of assigning delegation function
Color;
Lack of different colored objects
Resolution;
Small font sizes that decrease readability
Meaning of Labels;
“+” sign located in Maintenance and Repair Form
Understanding of System Instructions / Error Messages;
Incomprehensible error messages
Consistency of Operations;
Not having the same options on the same document
Not being able to search for documents and forms at the same screen
Overall Ease of Use;
Complicated screens
Having archive option in the dispatch option
Finding the related form or document
120
Assigning delegation function
Response Time;
Previewing document take time
Visibility of System Status
Lack of visibility of system status across pages
Some error messages appear at the top of the page and the user cannot see it
No information is provided when a document is sent.
5.3 RQ 3. How can METU EDMS interface be developed in the light of usability
issues determined?
Several methods were applied for this study and usability problems of METU EDMS were
revealed. The identified problems of METU EDMS should be solved so as to improve the
interface of the system. The problems identified are categorized based on the severity level
and detailed recommendations are presented in 5.5 Recommendations to Improve Usability
of METU EDMS section. Some important problems that should receive high priority by the
administrators of METU EDMS are listed below;
Inconsistency of the actions taken on a document
Document search screen should be simplified and document and form search should not
be separated.
Scrolling should be avoided.
Assigning delegation function should be more visible.
Taking the document back from the sent box should be easier.
The error messages of the system should be more understandable and essential feedback
should be provided to the users.
Even if the participants’ performances were better at the second and the third stage with the
new design of METU EDMS, the system still needs improvements. These improvements
should be applied considering the results of the usability tests and the participants’ answers
to the questionnaires.
5.4 Conclusion
This study was conducted to evaluate the usability of METU EDMS and its components. The
users could reach this system online from the https://www.edys.metu.edu.tr address.
Usability tests were performed with real users in three stages. Firstly, the system was tested
with 10 participants. For the second stage, the same 10 participants were invited to repeat the
same test so as to evaluate the usability of the system again and see whether the
improvements made had an effect or not. Finally, another group of 10 participants were
invited to perform a third stage for the study. The aim of conducting the third stage was to
see whether there is a difference between the participants who attended the usability tests
before and the users who did not attend the usability test beforehand. However, the results
of the second and the third stage are similar to each other. There were two user groups for
the participants: Principals and Personnel / Workers. They had different tasks to accomplish
during the system test. System tests were conducted in METU Computer Center HCI Lab.
Two different user groups had some common tasks. All of the tasks were evaluated
121
separately for each group and their results are presented in Chapter 4. Participants filled a
pretest questionnaire before the usability test. This questionnaire had questions about the
demographics and computer usage of the participants. Then, the usability tests were
conducted with the participants. After the usability tests, participants filled a posttest
questionnaire. This questionnaire contains five main parts: system experience, general user
reaction, appearance of the METU EDMS pages, terms used in METU EDMS pages and
learning the system usage. The answers of these questionnaires were evaluated and the
results provided in Chapter 4. Moreover, the answers provided by the participants were used
to respond the research questions of the study and offer recommendations for improvement.
Users faced with errors and difficulties during the usability tests. These errors need to be
debugged for the later version of the system. Moreover, the difficulties that the participants
faced with should be evaluated and considered for the future studies.
5.5 Recommendations to Improve Usability of METU EDMS
Three stages of usability tests were performed with the real users of the system. Moreover,
two questionnaires were given to the users; one before the usability test and one after the
usability test. Based on the system tests and the questionnaires, some issues attracted special
attention. The recommendations were categorized based on their severity levels. There are 3
categories: Critical (C), Medium (M) and Low (L). Critical means the related issue or
recommendation inhibits the flow of the system. In this case, the user is not able to
accomplish the related task. Medium level indicates that the issue or recommendation affects
the user but does not stop the flow of the system. Finally, low level represents the issue or
recommendation that does not affect both the system and the user’s action. The severity level
of the issue or recommendation is indicated at the beginning of the sentences with C, M and
L letters each representing the first letter of the levels. The issues and recommendations are
provided below under the related topics.
5.5.1 Recommendations for the First Stage
(M) Icons at the home page should be more explicit. The name of the system setting
menu could be changed into “User Settings”. Thus, when the users want to change a
setting related with its account, they could achieve it via this menu.
(M) An important component of such a system is shortcuts. Therefore, some useful
shortcuts should be provided to the users on the home page.
(L) The order of the desktop menu is good. Since the users are familiar with the
desktop metaphor, they could guess what they would probably find under this menu.
(C) Document search task one of the most time consuming tasks for the users. There
are too many criteria on this page and all of them have the same priority. Therefore,
the users are confused when they open this page because they see tens of criteria.
(C) Another important observation is the inconsistency of the action button. When
the users reach the same document with different paths, they could not do the same
thing on the document. The icon of the action and the document are the same but the
contents are different.
(M) Message boxes should be used while warning the users for an error that they
had made. If the errors appear at the top of the page, the users do not have chance to
see that message. They need to see the error message directly on the screen.
(M) Feedbacks are important for the actions taken. Necessary feedback should be
provided to the users when they complete a task. For example, they should see a
122
warning message after dispatching a document. Otherwise, they could not know
whether their document was sent or not.
(C) Scrolling should be avoided especially for forms that need to be filled vertically.
For instance, they fill a vertical form for the maintenance and the repair form.
However, there is an obligatory “+” sign that they need to click on but they cannot
see it without scrolling the page horizontally.
5.5.2 Recommendations for the Second and Third Stages
(M) The search action should direct users to correctly and the users should be able to
search both documents and forms on that screen.
(M) The home page of METU EDMS should be simplified since the users get
confused according to the results of the usability studies and the questionnaires.
(C) When the users click on the pending tasks at the home page, the system should
lead the users to the pending tasks. The users are directed to a page that they need to
click pending tasks again. In this case, the home page does not function as a real
home page.
(L) Desktop menu includes too many menu and options according to the users. This
menu should be specialized based on the users’ choices.
(C) Assigning delegation function should be more visible in the system because the
users spent too much time to find this function.
(C) Taking the document back property should be more visible. Moreover, the users
should be able to see this option when they reach the related document.
(M) When the save button on the Maintenance and Repair Form is clicked, the
screen is directed to the top of the page. Then, the users are not able to see the
options button located at the bottom of the page and they do not understand whether
they saved the document or not.
(M) Necessary feedbacks should be provided to the users by the system. For
instance, when the users save the Maintenance and Repair Form, the system should
warn the users about the save action.
(L) When the users try to find a document, they use document search option.
However, this screen is still complicated and contains too many options even if it is
simplified after the first stage.
5.6 Limitations of the Study
One of the most significant limitations is that the usability tests applied do not include all
components of the system. Therefore, it is not possible to evaluate all parts of the system.
Another limitation is that test environment is not the users’ real environment. Since the eye
movements of the participants need to be recorded, usability tests were conducted in METU
HCI Lab. Another limitation could be related with the eye tracker device. Tobii T120 eye
tracker device is a sensitive machine and it may not perceive some eye movements of the
participants if the eye calibration is not adjusted properly at the beginning of the study. The
average age of the participants is around 40. The average is normal for the university
workers but there could be more participants who are under 30 or above 50.
123
5.7 Contributions of the Study
Electronic Document Management System (EDMS) is not an obligatory system in Turkey to
use in government agencies. However, the government is considering to make this system
obligatory in order to reduce the costs and accelerate document circulation to gain time. This
study is conducted about METU EDMS’s usability. Therefore, the findings and the results of
this study contributes to the research of EDMS’s usability. Moreover, other universities and
the institutions could use this study as a guide to apply usability studies for their systems.
Furthermore, the results of this study can be used as base for the design of the EDMSs before
these systems become obligatory. The recommendations to improve the usability of METU
EDMS can be used to enhance other EDMSs if similar conditions apply to these systems,
too.
5.8 Future Studies
Considering the discussion of the findings of the study, this study can be repeated in a more
detailed way. Following issues can be researched in future studies.
The data acquired from these tests would be used to make necessary changes
mentioned above in the recommendation sections. A new version of the system will
be installed soon with new properties. Therefore, these properties need to be tested
with the real users again.
Since the main component of the system was the maintenance and the repair form
with the current version of the system, the test was based on the tasks related with it.
Because of this, using my documents menu did not receive a special attention for
this test. However, when the new record properties become active for the system,
this menu needs to be tested, too.
Since the academic staff of the university has just started to use METU EDMS, the
system should be tested with the participants who use the system for academic
purposes.
Participants who attended the usability tests have developed positive and negative
attitudes towards the system based on their experience. Participants’ attitudes and
acceptance can be studied in the future.
124
REFERENCES
Abowd, G. D., Dey, A. K., Brown, P. J., Davies, N., Smith, M., & Steggles, P. (1999,
January). Towards a better understanding of context and context-awareness.
In Handheld and ubiquitous computing (pp. 304-307). Springer Berlin Heidelberg.
Baker, K., Greenberg, S., & Gutwin, C. (2002). Empirical development of a heuristic
evaluation methodology for shared workspace groupware. In Proceedings of the
2002 ACM conference on Computer supported cooperative work (pp. 96-105). ACM.
Barry, R. E. (1993). Managing organizations with electronic records. Information
Management and Technology. 26(3): 115-122.
Battleson, B., Booth, A., & Weintrop, J. (2001). Usability testing of an academic
library web site: a case study. The Journal of Academic Librarianship, 27(3), 188-
198.
Bearman, D. (1993). Archival data management to achieve organizational
accountability for electronic records. Archives and Manuscripts, 21(1), 14-28.
Bearman, D. (1993). Conferences: NAGARA. Archives and Museum Informatics, 7,
10-11.
Bearman, D. (1993). Functional requirements for record keeping systems.Archives
and Museum Informatics, 7(2), 3-5.
Bearman, D. (1993). Managing elelctronic records'. Archives and Museum
Informatics. 7(4): 13-16.
Bearman, D. (1993). Record-keeping systems. Archivaria, 1(36).
Bearman, D. (1994). Managing electronic mail. Archives and manuscripts,22(1), 28-
50.
Bellyuk, J. (1993). Ancient Science: Modern Machines'. Archives and Museum
Informatics; 7(4): 17-19.
Bikson, T. K., & Frinking, E. J. (1994). Preserving the present: toward viable
electronic records.
125
Bikson, T. K., & Law, S. A. (1993). Electronic information media and records
management methods: A survey of practices in UN organizations. The Information
Society, 9(2), 125-144.
Bikson, T. K. (1994). Organizational trends and electronic media: work in
progress. The American Archivist, 48-68.
Bratthall, L., & Jørgensen, M. (2002). Can you trust a single data source exploratory
software engineering case study?. Empirical Software Engineering,7(1), 9-26.
Brewster, S. (2002). Overcoming the lack of screen space on mobile
computers. Personal and Ubiquitous Computing, 6(3), 188-205.
Branger, P. J., & Duisterhout, J. S. (1991). Electronic Data Interchange in medical
care: an evaluation study. In Proceedings of the Annual Symposium on Computer
Application in Medical Care (p. 58). American Medical Informatics Association.
Brown, J. H. (1993). Electronic records management in the Humberside police' in:
Chaired by A. M. Hendley. OIS Document 93 Management. Proceedings of the
Tenth Annual Conference; 1993 Jun; London. London: Meckler: 437-440.
Brown, T.E. (1993). A decade of development: educational programs for automated
records and techniques within the Society of American Archivists'. American
Archivist; 56: 410-423.
Bruns, P. (1992). The USMARC community Information format: a history and brief
description'. Information Technology and Libraries; 11(4): 387-396.
Campbell, T. (1994). Possibilities for the international sharing of retroconverted map
files. INSPEL, 28, 182-182.
Card, S. K., Moran, T. P., & Newell, A. (Eds.). (1983). The psychology of human
computer interaction. Routledge.
Cory, K. A., & Hessler, D. W. (1994). Imaging the Archives: Now Is the Time.
Library & Archival Security, 12(1), 7-15.
Cox, R.J. (1992). The American archival profession and information technology
standards'. Journal of the American Society for Information Science. 43 (8), 571-575.
Cox, R.J. (1994). The first generation of electronic records archivists in the United
States: A study in professionalization. New York, Haworth Press.
Crockett, M. (1993). The theory of electronic records and archive management: a
preliminary outline'. Journal of the Society of Archivists. 1993; 14(2): 135-140.
Daniels, M. (1992). Computer-aided design and drafting systems and the records of
architecture' Janus; 1992(1): 31-33.

126
Davidson, J; Moscato, L. (1994). Towards an electronic records management
program: the University of Melbourne'. Archives and Manuscripts; 22(1): 124-135.
Dey, A. K. (2001). Understanding and using context. Personal and ubiquitous
computing, 5(1), 4-7.
Diaper, D., & Sanger, C. (2006). Tasks for and tasks in human–computer interaction.
Interacting with Computers, 18(1), 117-138.
Dix, A., Finlay, J. A., & Abow, D. G. and Beale, R.(1993). Human-Computer
Interaction.
Dix, A., Finlay, J., Abowd, G., & Beale, R. (2003). Human Computer, Interaction
(forth edition).
Du Rea, M. V., & Pemberton, J. M. (1992). Electronic mail and electronic data
interchange: Challenges to records. Information Science, 43(8), 556-558.
Dutta, R., Jarvenpaa, S., and Tomak, K. (2003) “Impact of Feedback and Usability of
Online Payment Processes on Consumer Decision Making,” In Proceedings of the
24th International Conference in Information Systems, S.T. March, A. Massey, and
J.I. DeGross (eds.), Seattle, WA, 15-24
Eastwood, T. (1993). Educating archivists about information technology.American
Archivist, 56(3), 458-466.
Emmerson, P. (1993). Developing a records management policy and programme in
an electronic environment' in: Proceedings of the 7th Annual Computers in Libraries
International Conference; 1993 Feb; London. London:Meckler: 22-26.
Faconti, G. P. (1996). Reasoning on gestural interfaces through syndetic
modelling. ACM SIGCHI Bulletin, 28(3), 71-76.
Gilani, S. M. M., Ahmed, J., & Abbas, M. A. (2009, August). Electronic document
management: a paperless university model. In Computer Science and Information
Technology, 2009. ICCSIT 2009. 2nd IEEE International Conference on (pp. 440-
444). IEEE.
Goodman, J., Brewster, S., & Gray, P. (2004, September). Using field experiments to
evaluate mobile guides. In Proceedings of HCI in Mobile Guides, workshop at
Mobile HCI (Vol. 2004).
Gould, J.D., Lewis, C. (1985). "Designing for Usability: Key Principles and What
Designers Think", Communications of the ACM, 28(3)
Groenewald, T. (2004). A phenomenological research design illustrated.
Gulliksen, J., Boivie, I., & Göransson, B. (2006). Usability professionals—current
practices and future development. Interacting with Computers, 18(4), 568-600.
127
Kim, H., Kim, J., Lee, Y., Chae, M., & Choi, Y. (2002, January). An empirical study
of the use contexts and usability problems in mobile Internet. In System Sciences,
2002. HICSS. Proceedings of the 35th Annual Hawaii International Conference
on (pp. 1767-1776). IEEE.
Hung, S. Y., Tang, K. Z., Chang, C. M., & Ke, C. D. (2009). User acceptance of
intergovernmental services: An example of electronic document management
system. Government Information Quarterly, 26(2), 387-397.
ISO 9241-11 Ergonomic requirements for office work with visual display terminals
(VDT)s - Part 11 Guidance on Usability, International Standard, 1998
Karam, M., Schraefel, M. C. (2005). A taxonomy of Gestures in Human Computer
Interaction. ACM Transactions on Computer-Human Interactions (submitted), 2005.
Kay, J. (2009). A test-first view of usability. Interacting with Computers, 21(5), 347-
349.
Kjeldskov, J., Graham, C., Pedell, S., Vetere, F., Howard, S., Balbo, S., & Davies, J.
(2005). Evaluating the usability of a mobile guide: the influence of location,
participants and resources. Behaviour & Information Technology,24(1), 51-65.
Kjeldskov, J., Skov, M. B., Als, B. S., & Høegh, R. T. (2004). Is it worth the hassle?
Exploring the added value of evaluating the usability of context-aware mobile
systems in the field. In Mobile Human-Computer Interaction-MobileHCI 2004 (pp.
61-73). Springer Berlin Heidelberg.
Kligyte, G. (2001). I Think I Know What Is Good For You?'. User Interface Design
for a CSCL system. Master's Degree Work: Master of Arts in New Media. Media
Lab, University of Art and Design Helsinki UIAH, Finland.
Kuniavsky, M. (2003). Observing the user experience: a practitioner's guide to user
research. Morgan Kaufmann.
Kushniruk, A. W., & Patel, V. L. (2004). Cognitive and usability engineering
methods for the evaluation of clinical information systems. Journal of biomedical
informatics, 37(1), 56-76.
Lee, S., & Koubek, R. J. (2010). Understanding user preferences based on usability
and aesthetics before and after actual use. Interacting with Computers,22(6), 530-
543.
Lindgaard, G., Dillon, R., Trbovich, P., White, R., Fernandes, G., Lundahl, S., &
Pinnamaneni, A. (2006). User Needs Analysis and requirements engineering: Theory
and practice. Interacting with computers, 18(1), 47-70.
Lipponen, L. (2002, January). Exploring foundations for computer-supported
collaborative learning. In Proceedings of the Conference on Computer Support for
Collaborative Learning: Foundations for a CSCL Community (pp. 72-81).
International Society of the Learning Sciences.
128
Lund, A. M. (1997). Expert ratings of usability maxims. Ergonomics in Design: The
Quarterly of Human Factors Applications, 5(3), 15-20.
Macleod, M. (1994, May). Usability in context: Improving quality of use. InHuman
Factors in Organizational Design and Management–IV (Proceedings of the
International Ergonomics Association 4th International Symposium on Human
Factors in Organizational Design and Management, Stockholm.
Maxwell, K. (2001). The maturation of HCI: moving beyond usability toward
holistic interaction. Human-Computer Interaction in the New Millennium, 191-209.
McKeown, C. (2007). Office ergonomics: practical applications. CRC Press.
Medlock, M. C., Wixon, D., Terrano, M., Romero, R., & Fulton, B. (2002). Using
the RITE method to improve products: A definition and a case study.Usability
Professionals Association.
Mentes, A. P. D. S. A., & Turan, A. H. (2012). Assessing the Usability of University
Websites: An Empirical Study on Namik Kemal University. TOJET,11(3).
Myers, B. A. (1998). A brief history of human-computer interaction technology.
interactions, 5(2), 44-54.
Nemirovsky, P. (2003). Redefining Digital Audience: Models and Actions. InHuman
Computer Interaction INTERACT (Vol. 3, pp. 391-398).
Nielsen, J. (1992). The usability engineering life cycle. Computer, 25(3), 12-22
Nielsen, J. (1994). Heuristic evaluation. Usability inspection methods, 17, 25-62.
Nielsen, J. (1994). Usability Engineering. Academic Press, San Diego, Calif.
Nielsen, J., (2000). Designing Web Usability: The Practice of Simplicity, New
Riders Publishing.
Oulasvirta, A., & Tamminen, S. (2004). Temporal tensions in human-computer
interaction. In CHI’04 Workshop on Temporal Aspects of Work.
Ozcelik, E., Karakus, T., Kursun, E., & Cagiltay, K. (2009). An eye-tracking study of
how color coding affects multimedia learning. Computers & Education,53(2), 445-
453.
Preece, J., & Rogers, Y. S. H, Benyon, D. Holland, S. & Carey, T.(1994).Human-
Computer Interaction.
Raskin, J. (2000). The humane interface: new directions for designing interactive
systems. Addison-Wesley Professional.
129
Savidis, A., & Stephanidis, C. (2006). Inclusive development: Software engineering
requirements for universally accessible interactions. Interacting with
Computers, 18(1), 71-116.
Shneiderman, B. (1998). Designing the user interface: Strategies for effective
human–computer interaction (3rd ed.). Reading, MA: Addison-Wesley.
Shneiderman, B., & Ben, S. (2003). Designing The User Interface: Strategies for
Effective Human-Computer Interaction, 4/e (New Edition). Pearson Education India.
Sprague Jr, R. H. (1995). Electronic document management: Challenges and
opportunities for information systems managers. MIS Quarterly, 29-49.
Strijbos, J. W., Martens, R. L., Prins, F. J., & Jochems, W. M. (2006). Content
analysis: What are they talking about?. Computers & Education, 46(1), 29-48.
Şengel, E., & Öncü, S. (2010). Conducting preliminary steps to usability testing:
investigating the website of Uludağ University. Procedia-Social and Behavioral
Sciences, 2(2), 890-894.
Tekin, F. B., & Tufekci, A. (2013). A Case Study for the Usability of Public
Institutions: Turkish State Meteorological Service Web Site. Procedia-Social and
Behavioral Sciences, 83, 1077-1084.
Tiitinen, P., Lyytikäinen, V., Päivärinta, T., & Salminen, A. (2000, January). User
Needs for Electronic Document Management in the Public Administration: A Study
of Two Cases. In ECIS (pp. 1144-1151).
Tognazzini, B. (1992). TOG on Interface. Reading, MA: Addison-Wesley.
Tüfekci, A. (2013). Evaluation of Turkish “E-Okul” System in Terms of
Usability.Journal of Universal Computer Science, 19(5), 639-657.
Volarevic, M., Strasberger, V., & Pacelat, E. (2000, June). A philosophy of the
electronic document management. In Information Technology Interfaces, 2000. ITI
2000. Proceedings of the 22nd International Conference on (pp. 141-146). IEEE.
Wald, M. (2005). Enhancing Accessibility through Automatic Speech Recognition.
Proceedings of Accessible Design in the Digital World.
Wild, P. J., & Johnson, P. (2004). Deepening Consideration OF Temporal Factors IN
Task Knowledge Structures.
Zhao, W., Durkalski, V., Pauls, K., Dillon, C., Kim, J., Kolk, D., ... & Palesch, Y.
(2010). An electronic regulatory document management system for a clinical trial
network. Contemporary clinical trials, 31(1), 27-33.

130
APPENDIX A: PRETEST QUESTIONNAIRE
ÇALIŞMA ÖNCESİ KATILIM ANKETİ
Bu çalışma Orta Doğu Teknik Üniversitesi (ODTÜ), Enformatik Enstitüsü, Bilişim
Sistemleri Bölümü yüksek lisans öğrencisi Alpay Karagöz tarafından yürütülmektedir. Bu
anket genel olarak; nüfus bilgileriniz ve bilgisayar kullanımınız ile ilgili sorulardan
oluşmaktadır. Cevaplarınız ve isim bilgileriniz kesinlikle gizli tutulacak ve sadece
araştırmacı tarafından ilgili araştırma için kullanılacaktır. Çalışma çerçevesinde topolanacak
veriler sadece bilimsel yayımlarda kullanılacaktır.
1. Cinsiyetiniz:
Bay _______ Bayan________
2. Yaşınız: ______
3. Eğitim durumunuz nedir?
İlkokul _____ Ortaokul _____ Lise _____
Üniversite – Lisans _____ Üniversite - Yüksek Lisans _____Üniversite - Doktora
4. Evinizde kendinize ait bilgisayarınız var mı?
Evet _____ Hayır _____
5. Ne kadar zamandır bilgisayar kullanıyorsunuz?
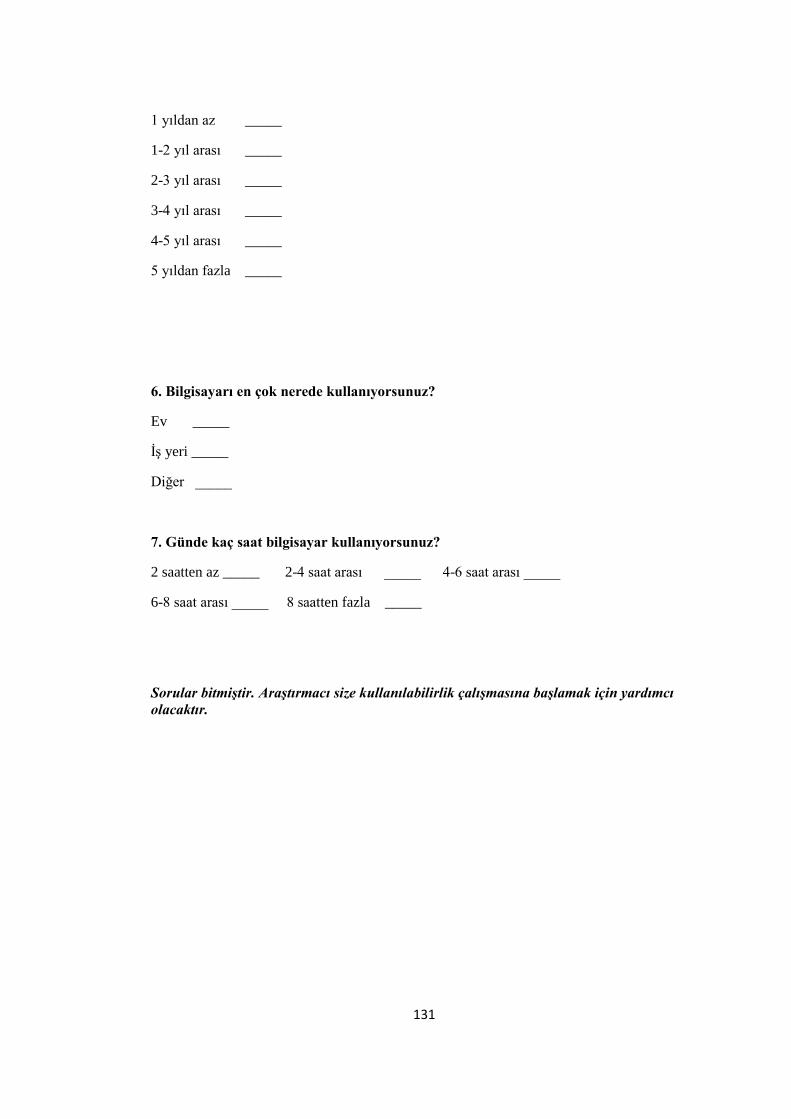
131
1 yıldan az _____
1-2 yıl arası _____
2-3 yıl arası _____
3-4 yıl arası _____
4-5 yıl arası _____
5 yıldan fazla _____
6. Bilgisayarı en çok nerede kullanıyorsunuz?
Ev _____
İş yeri _____
Diğer _____
7. Günde kaç saat bilgisayar kullanıyorsunuz?
2 saatten az _____ 2-4 saat arası _____ 4-6 saat arası _____
6-8 saat arası _____ 8 saatten fazla _____
Sorular bitmiştir. Araştırmacı size kullanılabilirlik çalışmasına başlamak için yardımcı
olacaktır.
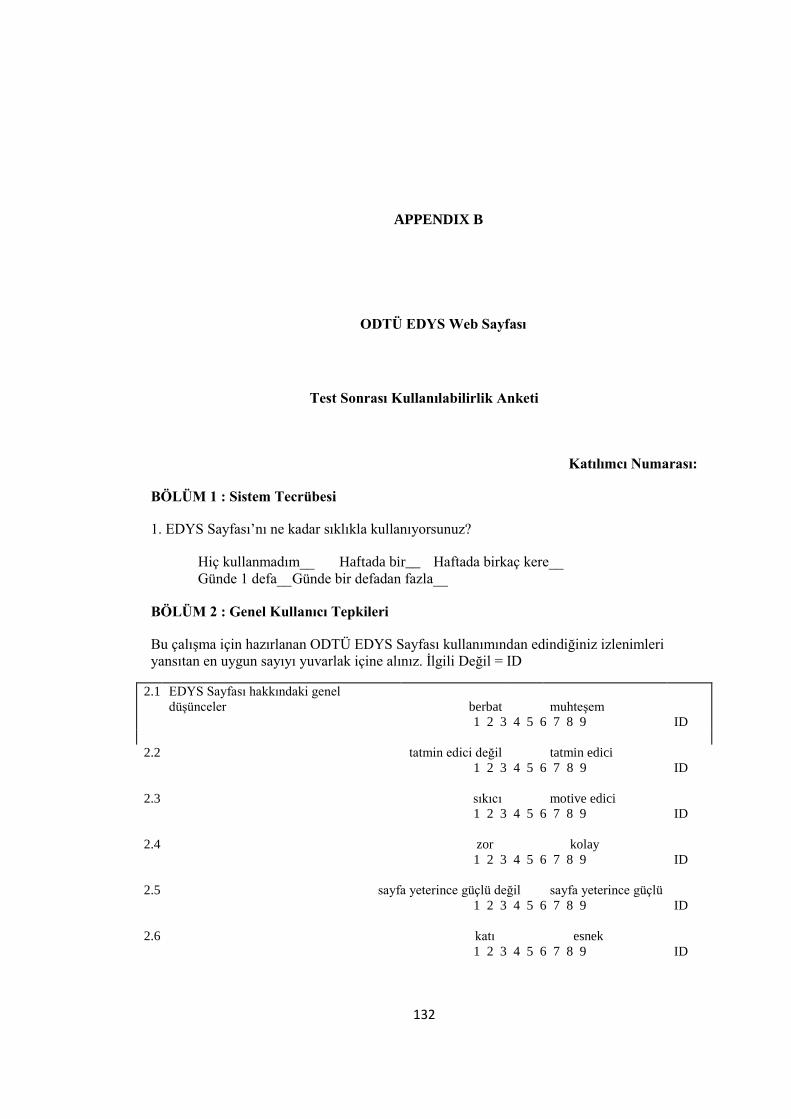
132
APPENDIX B
ODTÜ EDYS Web Sayfası
Test Sonrası Kullanılabilirlik Anketi
Katılımcı Numarası:
BÖLÜM 1 : Sistem Tecrübesi
1. EDYS Sayfası’nı ne kadar sıklıkla kullanıyorsunuz?
Hiç kullanmadım__ Haftada bir__ Haftada birkaç kere__
Günde 1 defa__ Günde bir defadan fazla__
BÖLÜM 2 : Genel Kullanıcı Tepkileri
Bu çalışma için hazırlanan ODTÜ EDYS Sayfası kullanımından edindiğiniz izlenimleri
yansıtan en uygun sayıyı yuvarlak içine alınız. İlgili Değil = ID
2.1 EDYS Sayfası hakkındaki genel
düşünceler
berbat
muhteşem
1 2 3 4 5 6 7 8 9 ID
2.2 tatmin edici değil tatmin edici
1 2 3 4 5 6 7 8 9 ID
2.3 sıkıcı motive edici
1 2 3 4 5 6 7 8 9 ID
2.4 zor kolay
1 2 3 4 5 6 7 8 9 ID
2.5 sayfa yeterince güçlü değil sayfa yeterince güçlü
1 2 3 4 5 6 7 8 9 ID
2.6 katı esnek
1 2 3 4 5 6 7 8 9 ID
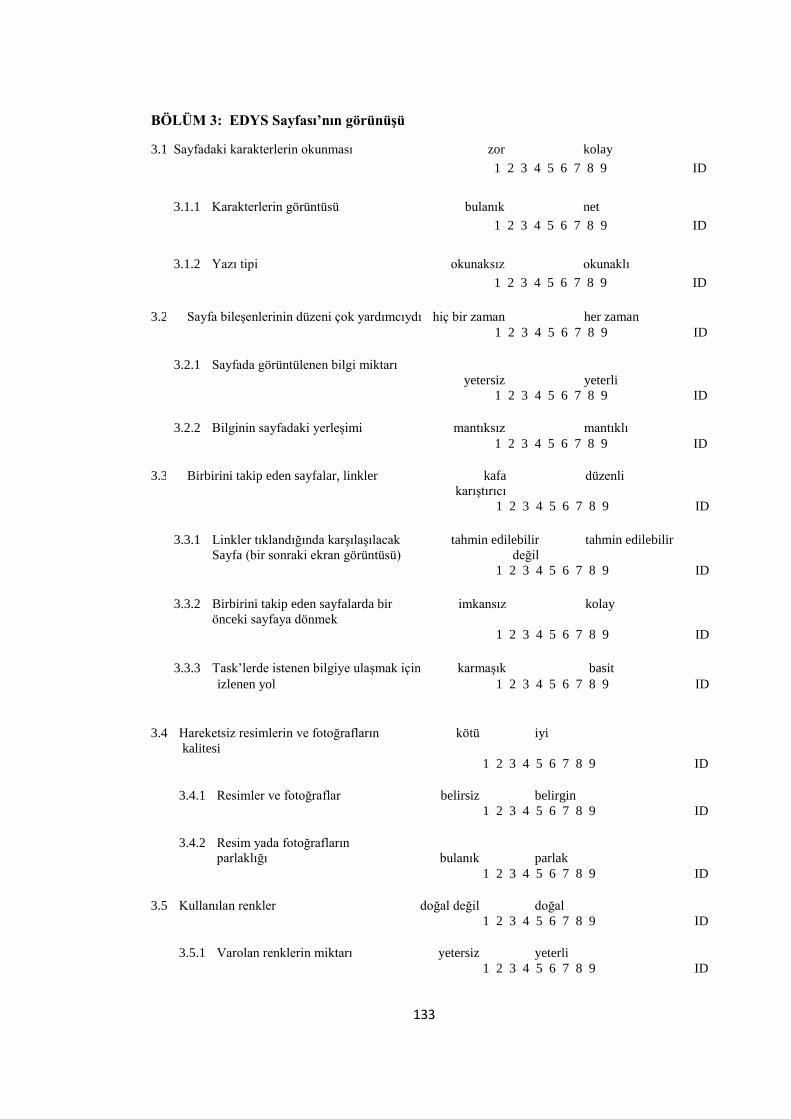
133
BÖLÜM 3: EDYS Sayfası’nın görünüşü
3.1 Sayfadaki karakterlerin okunması zor kolay
1 2 3 4 5 6 7 8 9 ID
3.1.1 Karakterlerin görüntüsü bulanık net
1 2 3 4 5 6 7 8 9 ID
3.1.2 Yazı tipi okunaksız okunaklı
1 2 3 4 5 6 7 8 9 ID
3.2 Sayfa bileşenlerinin düzeni çok yardımcıydı hiç bir zaman her zaman
1 2 3 4 5 6 7 8 9 ID
3.2.1 Sayfada görüntülenen bilgi miktarı
yetersiz
yeterli
1 2 3 4 5 6 7 8 9 ID
3.2.2 Bilginin sayfadaki yerleşimi mantıksız mantıklı
1 2 3 4 5 6 7 8 9 ID
3.3 Birbirini takip eden sayfalar, linkler kafa
karıştırıcı
düzenli
1 2 3 4 5 6 7 8 9 ID
3.3.1 Linkler tıklandığında karşılaşılacak
Sayfa (bir sonraki ekran görüntüsü)
tahmin edilebilir
değil
tahmin edilebilir
1 2 3 4 5 6 7 8 9 ID
3.3.2 Birbirini takip eden sayfalarda bir
önceki sayfaya dönmek
imkansız kolay
1 2 3 4 5 6 7 8 9 ID
3.3.3 Task’lerde istenen bilgiye ulaşmak için karmaşık basit
izlenen yol 1 2 3 4 5 6 7 8 9 ID
3.4 Hareketsiz resimlerin ve fotoğrafların
kalitesi
kötü iyi
1 2 3 4 5 6 7 8 9 ID
3.4.1 Resimler ve fotoğraflar belirsiz belirgin
1 2 3 4 5 6 7 8 9 ID
3.4.2 Resim yada fotoğrafların
parlaklığı
bulanık
parlak
1 2 3 4 5 6 7 8 9 ID
3.5 Kullanılan renkler doğal değil doğal
1 2 3 4 5 6 7 8 9 ID
3.5.1 Varolan renklerin miktarı yetersiz yeterli
1 2 3 4 5 6 7 8 9 ID
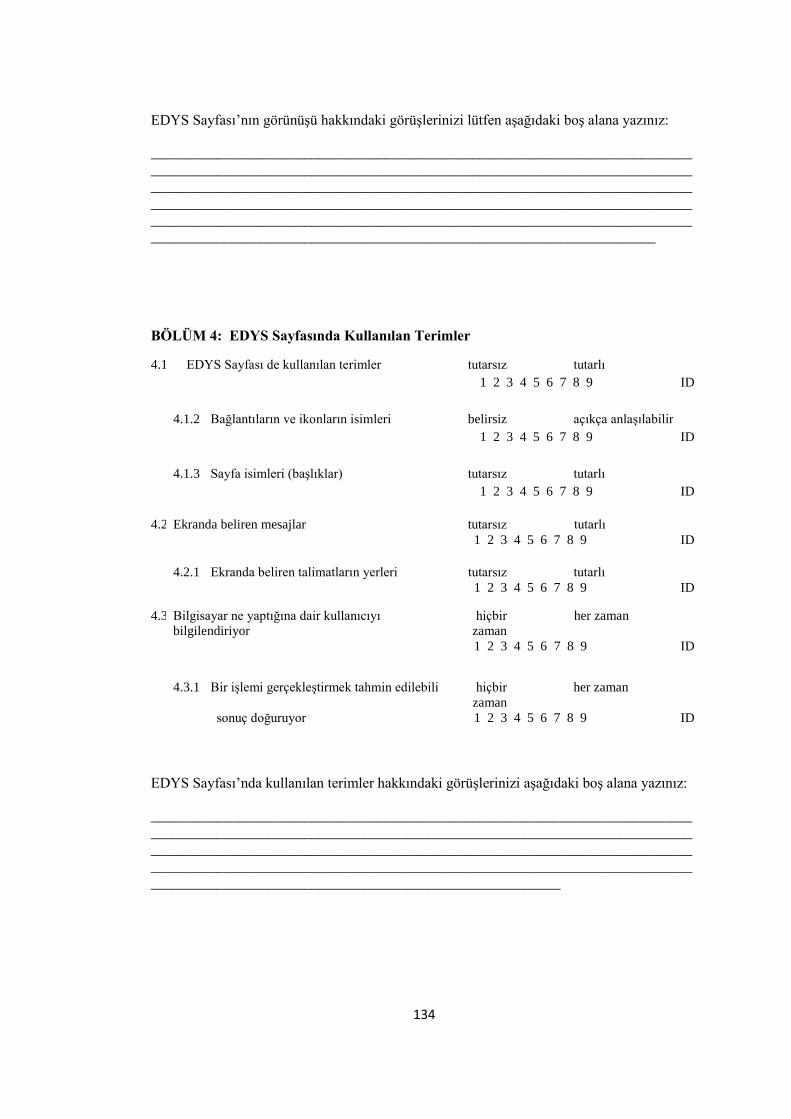
134
EDYS Sayfası’nın görünüşü hakkındaki görüşlerinizi lütfen aşağıdaki boş alana yazınız:
__________________________________________________________________________
__________________________________________________________________________
__________________________________________________________________________
__________________________________________________________________________
__________________________________________________________________________
_____________________________________________________________________
BÖLÜM 4: EDYS Sayfasında Kullanılan Terimler
4.1 EDYS Sayfası de kullanılan terimler tutarsız tutarlı
1 2 3 4 5 6 7 8 9 ID
4.1.2 Bağlantıların ve ikonların isimleri belirsiz açıkça anlaşılabilir
1 2 3 4 5 6 7 8 9 ID
4.1.3 Sayfa isimleri (başlıklar) tutarsız tutarlı
1 2 3 4 5 6 7 8 9 ID
4.2 Ekranda beliren mesajlar tutarsız tutarlı
1 2 3 4 5 6 7 8 9 ID
4.2.1 Ekranda beliren talimatların yerleri tutarsız tutarlı
1 2 3 4 5 6 7 8 9 ID
4.3 Bilgisayar ne yaptığına dair kullanıcıyı
bilgilendiriyor
hiçbir
zaman
her zaman
1 2 3 4 5 6 7 8 9 ID
4.3.1 Bir işlemi gerçekleştirmek tahmin edilebilir bir hiçbir
zaman
her zaman
sonuç doğuruyor 1 2 3 4 5 6 7 8 9 ID
EDYS Sayfası’nda kullanılan terimler hakkındaki görüşlerinizi aşağıdaki boş alana yazınız:
__________________________________________________________________________
__________________________________________________________________________
__________________________________________________________________________
__________________________________________________________________________
________________________________________________________
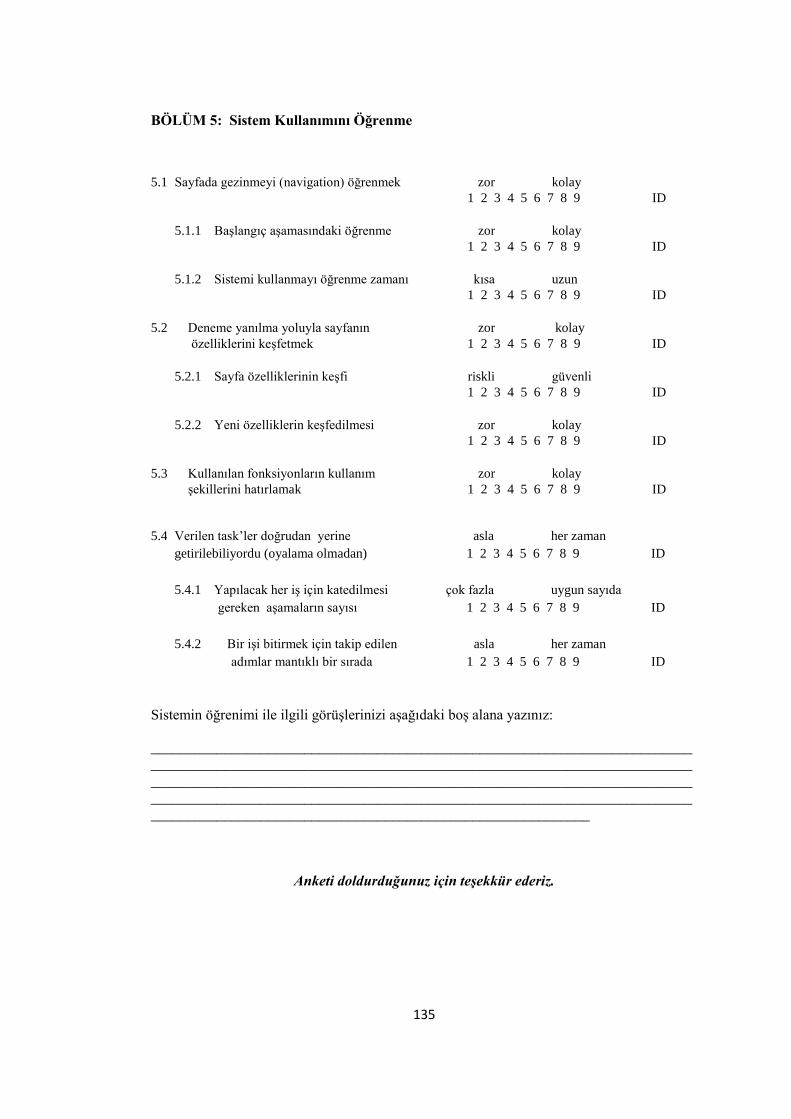
135
BÖLÜM 5: Sistem Kullanımını Öğrenme
5.1 Sayfada gezinmeyi (navigation) öğrenmek zor kolay
1 2 3 4 5 6 7 8 9 ID
5.1.1 Başlangıç aşamasındaki öğrenme zor kolay
1 2 3 4 5 6 7 8 9 ID
5.1.2 Sistemi kullanmayı öğrenme zamanı kısa uzun
1 2 3 4 5 6 7 8 9 ID
5.2 Deneme yanılma yoluyla sayfanın zor kolay
özelliklerini keşfetmek 1 2 3 4 5 6 7 8 9 ID
5.2.1 Sayfa özelliklerinin keşfi riskli güvenli
1 2 3 4 5 6 7 8 9 ID
5.2.2 Yeni özelliklerin keşfedilmesi zor kolay
1 2 3 4 5 6 7 8 9 ID
5.3 Kullanılan fonksiyonların kullanım zor kolay
şekillerini hatırlamak 1 2 3 4 5 6 7 8 9 ID
5.4 Verilen task’ler doğrudan yerine asla as asla her zaman
getirilebiliyordu (oyalama olmadan) 1 2 3 4 5 6 7 8 9 ID
5.4.1 Yapılacak her iş için katedilmesi çok fazla uygun sayıda
gereken aşamaların sayısı 1 2 3 4 5 6 7 8 9 ID
5.4.2 Bir işi bitirmek için takip edilen asla her zaman
adımlar mantıklı bir sırada 1 2 3 4 5 6 7 8 9 ID
Sistemin öğrenimi ile ilgili görüşlerinizi aşağıdaki boş alana yazınız:
__________________________________________________________________________
__________________________________________________________________________
__________________________________________________________________________
__________________________________________________________________________
____________________________________________________________
Anketi doldurduğunuz için teşekkür ederiz.
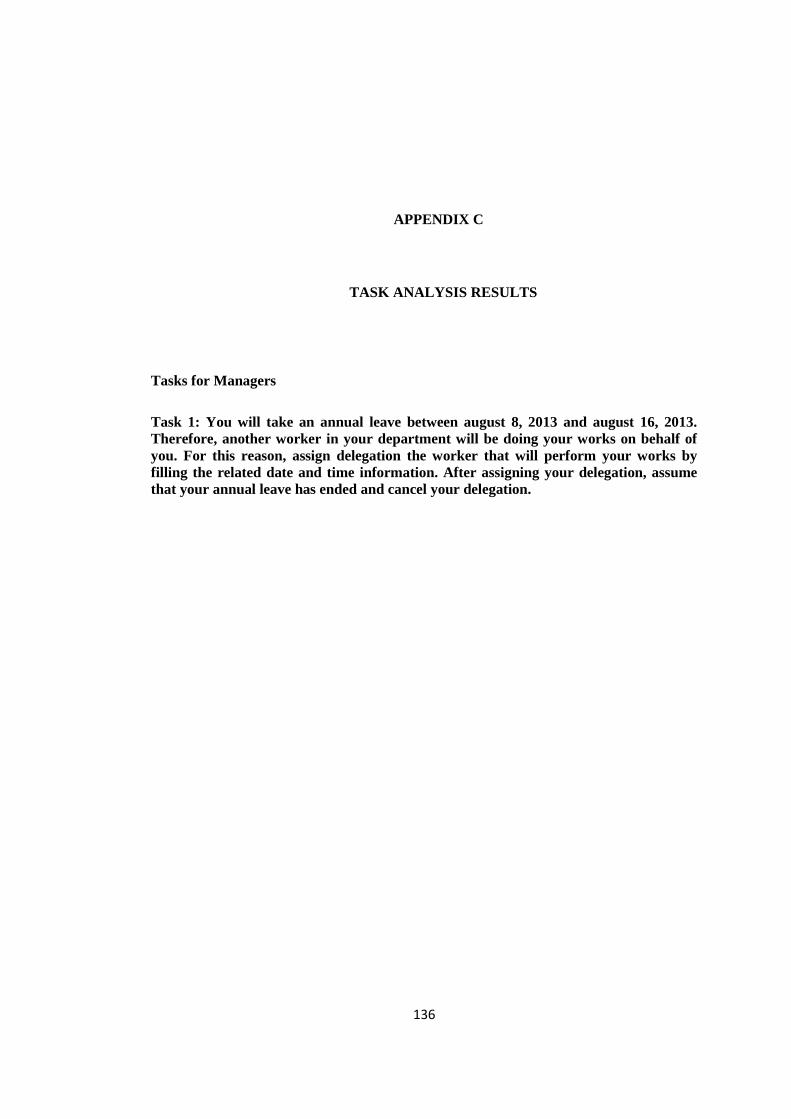
136
APPENDIX C
TASK ANALYSIS RESULTS
Tasks for Managers
Task 1: You will take an annual leave between august 8, 2013 and august 16, 2013.
Therefore, another worker in your department will be doing your works on behalf of
you. For this reason, assign delegation the worker that will perform your works by
filling the related date and time information. After assigning your delegation, assume
that your annual leave has ended and cancel your delegation.
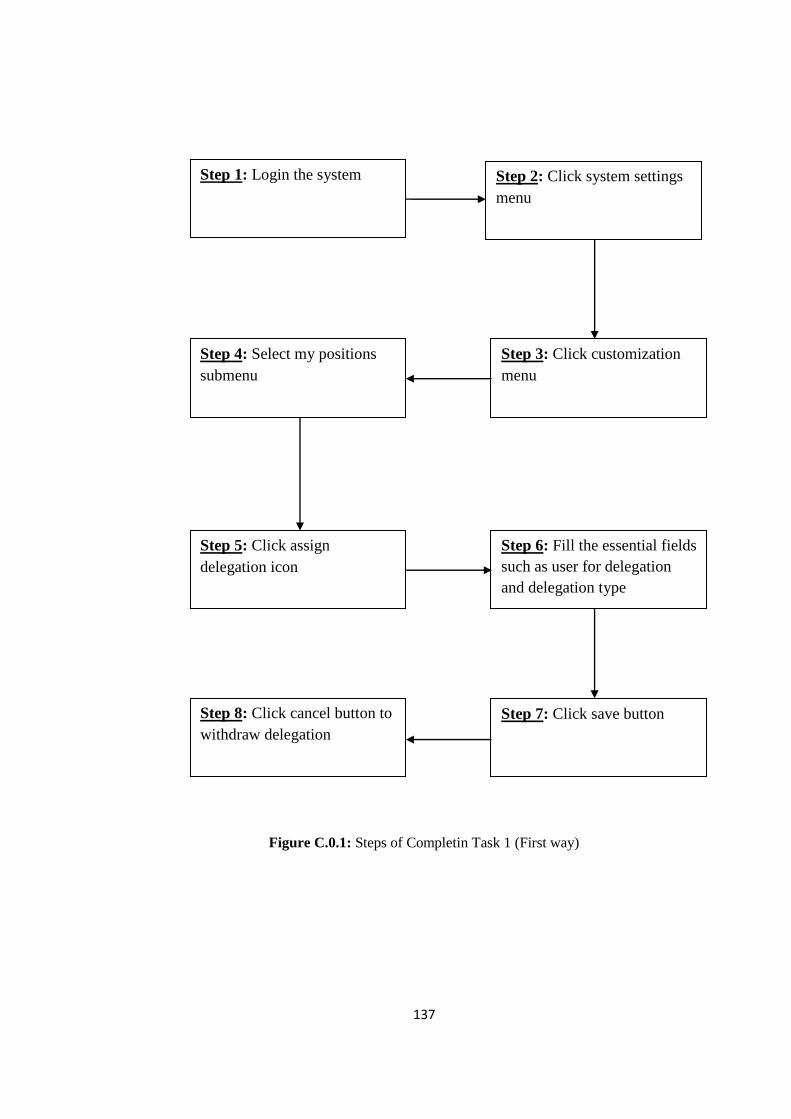
137
Figure C.0.1: Steps of Completin Task 1 (First way)
Step 1: Login the system Step 2: Click system settings
menu
Step 4: Select my positions
submenu
Step 3: Click customization
menu
Step 5: Click assign
delegation icon
Step 6: Fill the essential fields
such as user for delegation
and delegation type
Step 8: Click cancel button to
withdraw delegation
Step 7: Click save button

138
Figure C.0.2: Steps of Completing Task1 (Second way)
Task 2: You need some information related with a maintenance and repair form that
you had filled before. Find this form whose subject is “Eğitim Deneme Formu”
(Education Test Form) by using Electronic Form Search option and preview it in order
to get essential information. After previewing the document, learn where and on which
phase this document is.
Step 1: Login the system Step 2: Click on my positions
information
Step 4: Fill the essential fields
such as user for delegation
and delegation type
Step 3: Click assign
delegation icon
Step 5: Click cancel button to
withdraw delegation
Step 6: Click save button
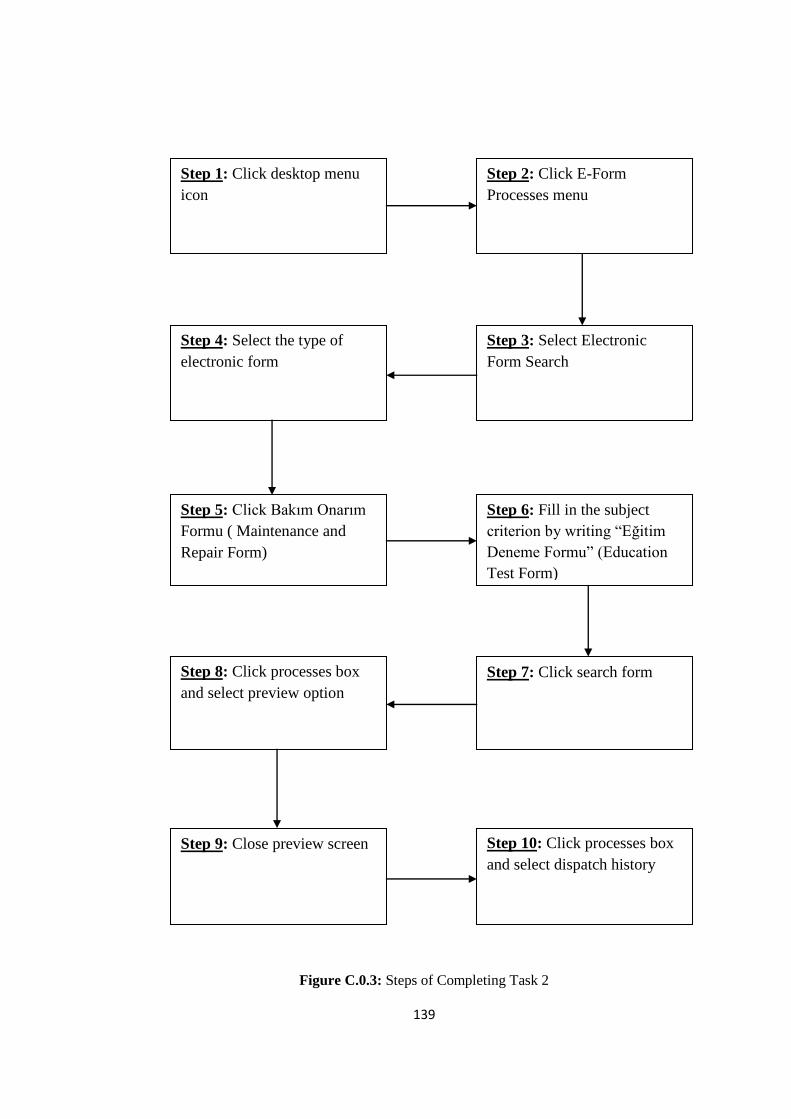
139
Figure C.0.3: Steps of Completing Task 2
Step 1: Click desktop menu
icon
Step 2: Click E-Form
Processes menu
Step 4: Select the type of
electronic form
Step 3: Select Electronic
Form Search
Step 5: Click Bakım Onarım
Formu ( Maintenance and
Repair Form)
Step 6: Fill in the subject
criterion by writing “Eğitim
Deneme Formu” (Education
Test Form)
Step 8: Click processes box
and select preview option
Step 10: Click processes box
and select dispatch history
Step 7: Click search form
Step 9: Close preview screen

140
Task 3: Preview the maintenance and repair form whose subject is “Eğitim Deneme”
(Education Test) sent by the related personnel and make the essential changes by using
Edit Text option. Send the document to the related personnel after you make the
desired changes.
Figure C.0.4: Steps of Completing Task 3
Step 1: Click on the pending
tasks at the home page
Step 2: Click the related tab
to find the document
Step 4: Click the processes
box and select preview option
Step 3: Find the form whose
subject is “Eğitim Deneme”
(Education Test)
Step 5: Click edit text button Step 6: Make the essential
changes
Step 8: Send the document
back to the related personnel
Step 7: Save the document
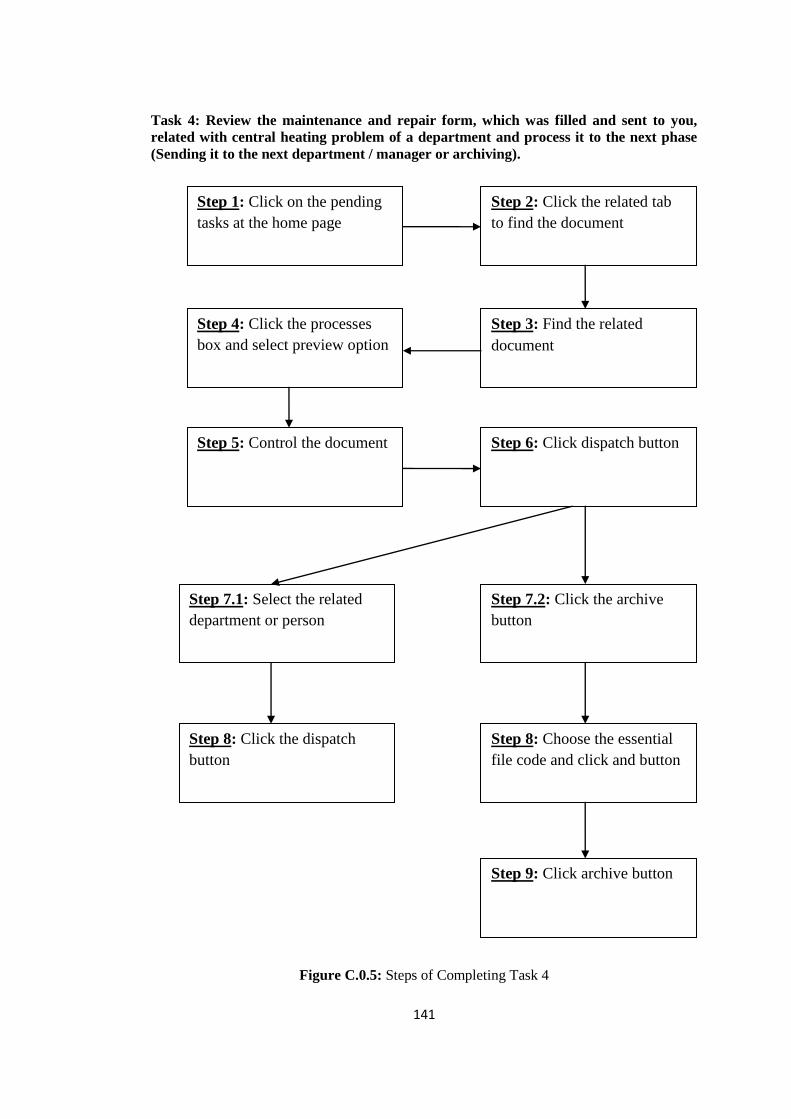
141
Task 4: Review the maintenance and repair form, which was filled and sent to you,
related with central heating problem of a department and process it to the next phase
(Sending it to the next department / manager or archiving).
Figure C.0.5: Steps of Completing Task 4
Step 1: Click on the pending
tasks at the home page
Step 2: Click the related tab
to find the document
Step 4: Click the processes
box and select preview option
Step 3: Find the related
document
Step 5: Control the document
Step 6: Click dispatch button
Step 7.1: Select the related
department or person
Step 8: Choose the essential
file code and click and button
Step 8: Click the dispatch
button
Step 7.2: Click the archive
button
Step 9: Click archive button
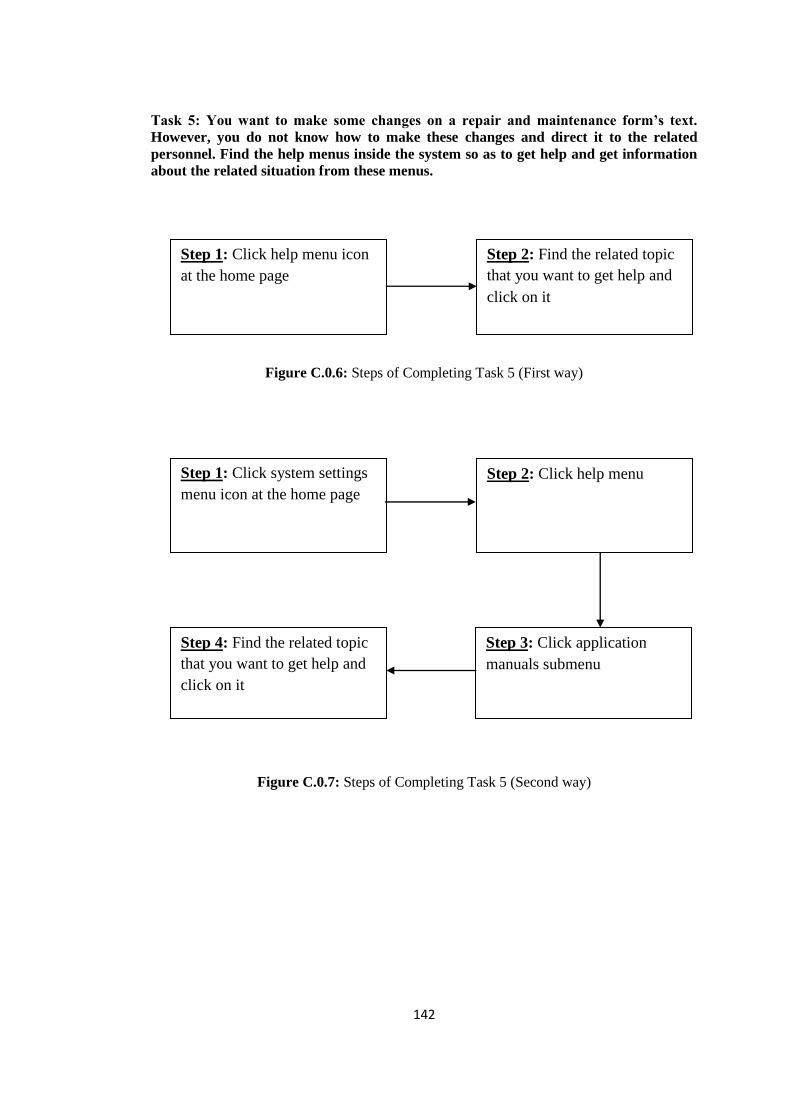
142
Task 5: You want to make some changes on a repair and maintenance form’s text.
However, you do not know how to make these changes and direct it to the related
personnel. Find the help menus inside the system so as to get help and get information
about the related situation from these menus.
Figure C.0.6: Steps of Completing Task 5 (First way)
Figure C.0.7: Steps of Completing Task 5 (Second way)
Step 1: Click help menu icon
at the home page
Step 2: Find the related topic
that you want to get help and
click on it
Step 1: Click system settings
menu icon at the home page
Step 2: Click help menu
Step 4: Find the related topic
that you want to get help and
click on it
Step 3: Click application
manuals submenu
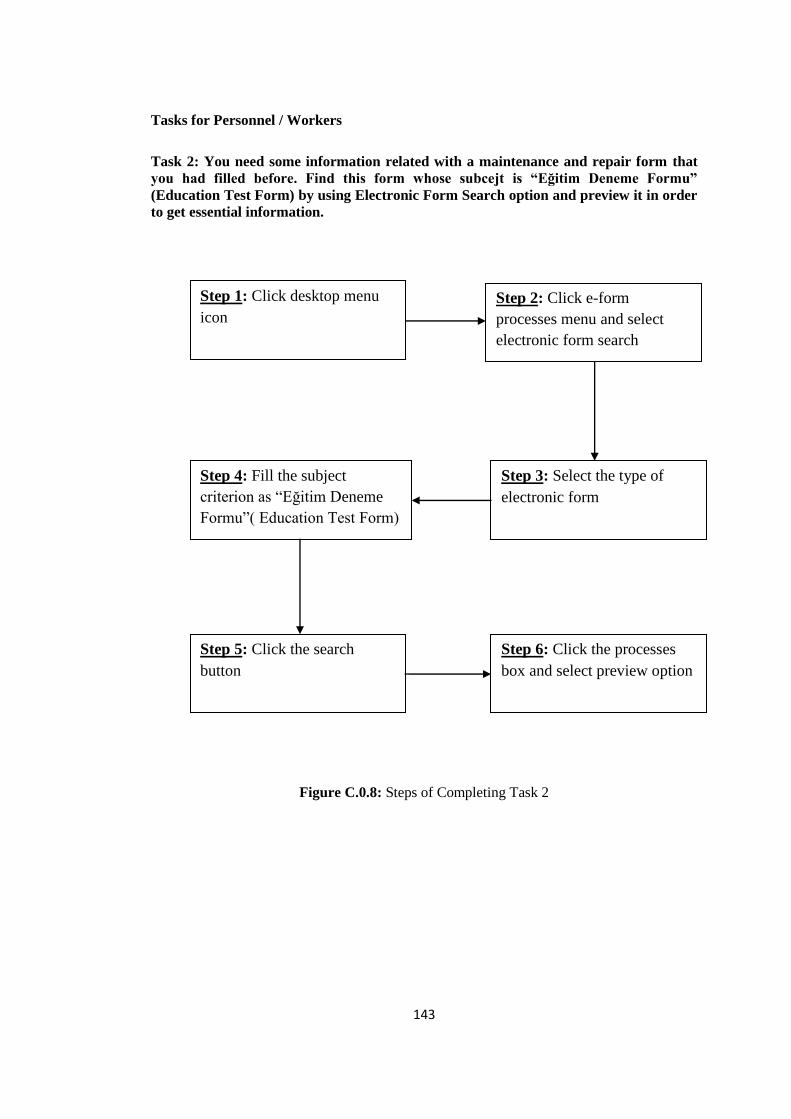
143
Tasks for Personnel / Workers
Task 2: You need some information related with a maintenance and repair form that
you had filled before. Find this form whose subcejt is “Eğitim Deneme Formu”
(Education Test Form) by using Electronic Form Search option and preview it in order
to get essential information.
Figure C.0.8: Steps of Completing Task 2
Step 1: Click desktop menu
icon
Step 2: Click e-form
processes menu and select
electronic form search
Step 4: Fill the subject
criterion as “Eğitim Deneme
Formu”( Education Test Form)
Step 3: Select the type of
electronic form
Step 5: Click the search
button
Step 6: Click the processes
box and select preview option

144
Task 3: Since you had another work to do, you left a repair and maintenance form that
you were filling incomplete. You want to continue filling your form after you completed
the other work. Hence, find the shortcomings of the document whose subject is “Eksik
Bilgileri Giriniz” (Enter Incomplete Information) in My New Records and send it to the
related personnel by completing it.
Figure C.0.9: Steps of Completing Task 3
Step 1: Click desktop menu
icon
Step 2: Click record
processes and select my new
records
Step 4: Click processes box
and select preview option
Step 3: Click electronic forms
check box
Step 5: Control the document
and click edit text button
Step 6: Make the necessary
changes and click save button
Step 8: Click dispatch button Step 7: Click dispatch button
and select the related
department or person
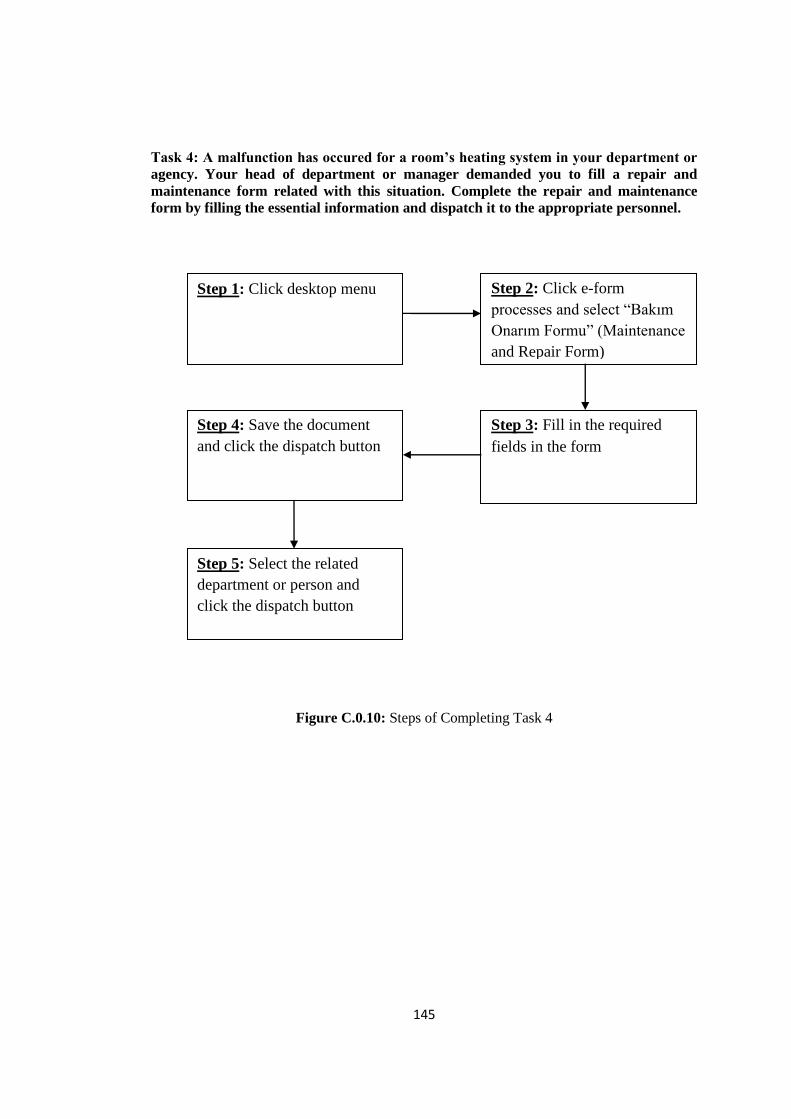
145
Task 4: A malfunction has occured for a room’s heating system in your department or
agency. Your head of department or manager demanded you to fill a repair and
maintenance form related with this situation. Complete the repair and maintenance
form by filling the essential information and dispatch it to the appropriate personnel.
Figure C.0.10: Steps of Completing Task 4
Step 1: Click desktop menu Step 2: Click e-form
processes and select “Bakım
Onarım Formu” (Maintenance
and Repair Form)
Step 4: Save the document
and click the dispatch button
Step 3: Fill in the required
fields in the form
Step 5: Select the related
department or person and
click the dispatch button
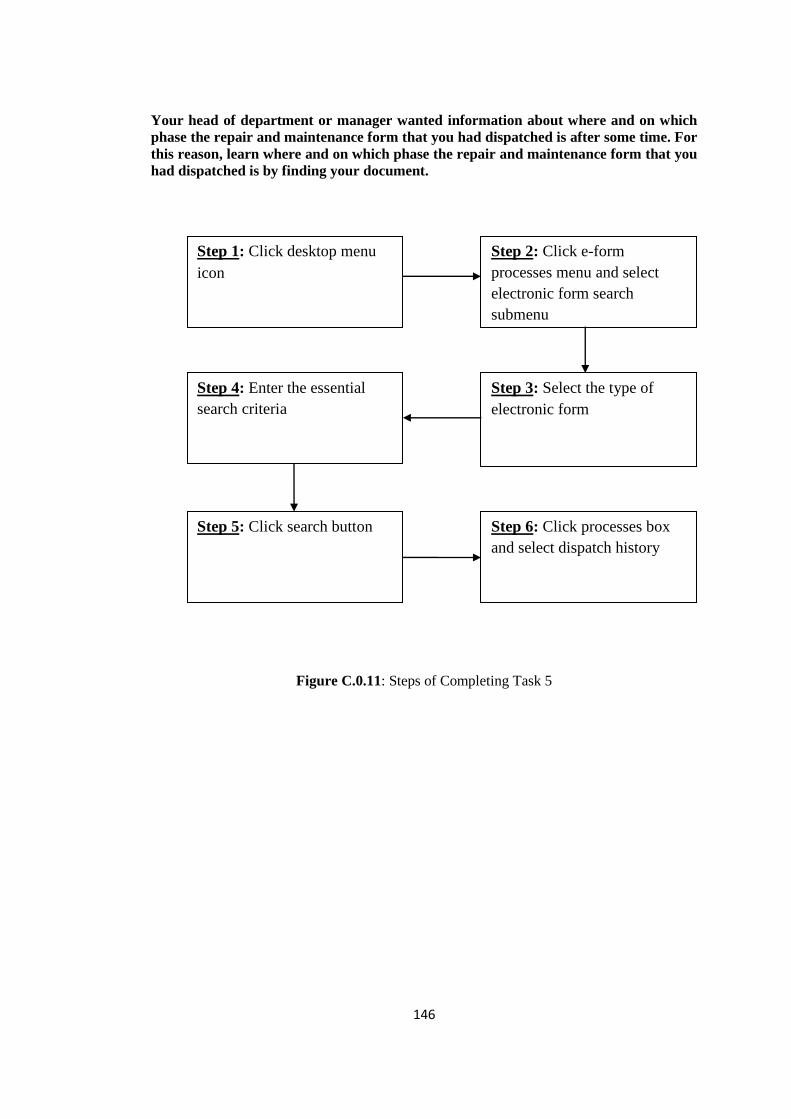
146
Your head of department or manager wanted information about where and on which
phase the repair and maintenance form that you had dispatched is after some time. For
this reason, learn where and on which phase the repair and maintenance form that you
had dispatched is by finding your document.
Figure C.0.11: Steps of Completing Task 5
Step 1: Click desktop menu
icon
Step 2: Click e-form
processes menu and select
electronic form search
submenu
Step 4: Enter the essential
search criteria
Step 3: Select the type of
electronic form
Step 5: Click search button
Step 6: Click processes box
and select dispatch history
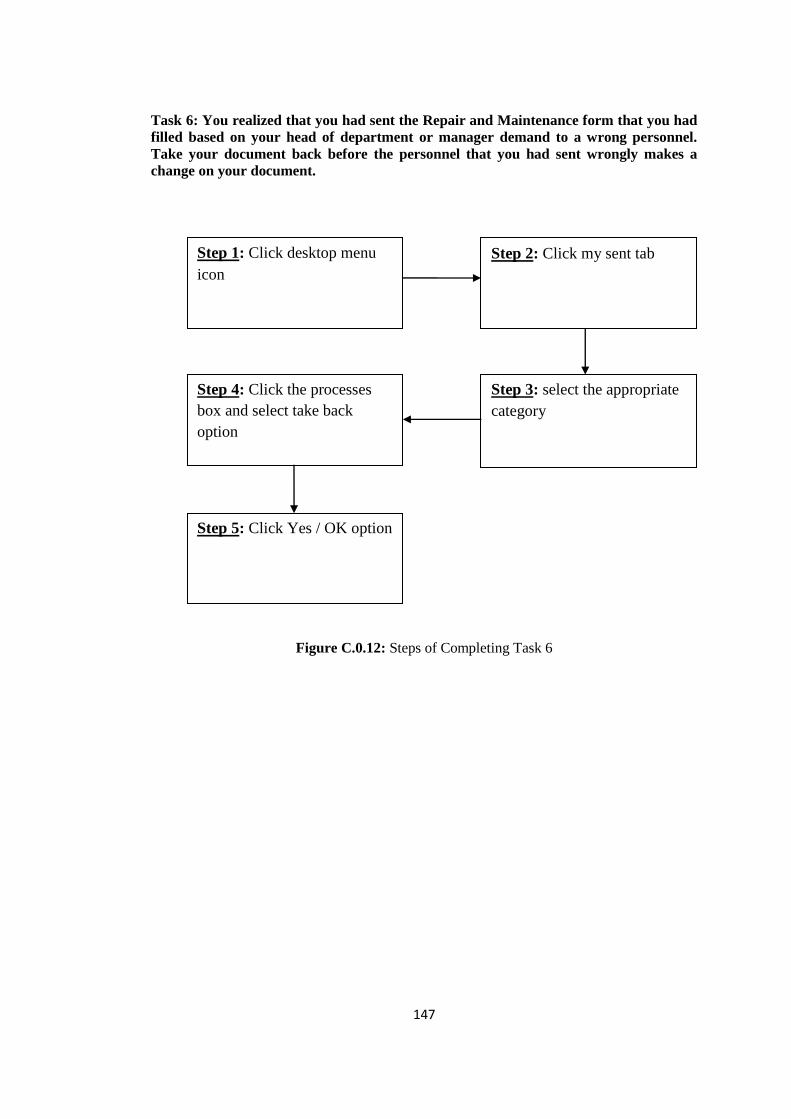
147
Task 6: You realized that you had sent the Repair and Maintenance form that you had
filled based on your head of department or manager demand to a wrong personnel.
Take your document back before the personnel that you had sent wrongly makes a
change on your document.
Figure C.0.12: Steps of Completing Task 6
Step 1: Click desktop menu
icon
Step 2: Click my sent tab
Step 4: Click the processes
box and select take back
option
Step 3: select the appropriate
category
Step 5: Click Yes / OK option
148
APPENDIX D
TASKS FOR MANAGERS
1. You will take an annual leave between august 8, 2013 and august 16, 2013.
Therefore, another worker in your department will be doing your works by
procuration on behalf of you. For this reason, give your procuration to the worker
that will perform your works by filling the related date and time information. After
giving procuration, assume that your annual leave has ended and cancel your
procuration.
2. You need some information related with a maintenance and repair form that you had
filled before. Find this form whose subject is “Eğitim Deneme Formu” (Education
Test Form) by using Electronic Form Search option and preview it in order to get
essential information. After previewing the document, learn where and on which
phase this document is.
3. Preview the maintenance and repair form whose subject is “Eğitim Deneme”
(Education Test) sent by the related personnel and make the essential changes by
using Edit Text option. Send the document to the related personnel after you make
the desired changes.
4. Review the maintenance and repair form, which was filled and sent to you, related
with central heating problem of a department and process it to the next phase (
Sending it to the next department / manager or archieve it).
5. You want to make some changes on a repair and maintenance form’s text. However,
you do not know how to make these changes and direct it to the related personnel.
Find the help menus inside the system so as to get help and get information about the
related situation from these menus.
149
APPENDIX E
TASKS FOR WORKERS / PERSONNEL
1. You will take an annual leave between august 8, 2013 and august 16, 2013.
Therefore, another worker in your department will be doing your works by
procuration on behalf of you. For this reason, give your procuration to the worker
that will perform your works by filling the related date and time information. After
giving procuration, assume that your annual leave has ended and cancel your
procuration.
2. You need some information related with a maintenance and repair form that you had
filled before. Find this form whose subject is “Eğitim Deneme Formu” (Education
Test Form) by using Electronic Form Search option and preview it in order to get
essential information.
3. Since you had another work to do, you left a repair and maintenance form that you
were filling incomplete. You want to continue filling your form after you completed
the other work. Hence, find the shortcomings of the document whose subject is
“Eksik Bilgileri Giriniz” (Enter Incomplete Information) in My New Records and
send it to the related personnel by completing it.
4. A malfunction has occurred for a room’s heating system in your department or
agency. Your head of department or manager demanded you to fill a repair and
maintenance form related with this situation. Complete the repair and maintenance
form by filling the essential information and dispatch it to the appropriate personnel
after you.
5. Your head of department or manager wanted information about where and on which
phase the repair and maintenance form that you had dispatched is after some time.
For this reason, learn where and on which phase the repair and maintenance form
that you had dispatched is by finding your document.
6. You realized that you had sent the Repair and Maintenance form that you had filled
based on your head of department or manager demand to a wrong personnel. Take
your document back before the personnel that you had sent wrongly makes a change
on your document.

150
7. You could not guess what to write to some text fields that exist in Maintenance and
Repair Form and you have difficulty in filling the form. Find the help menus inside
the system so as to get help and get information about the related situation from
these menus.