a unified theory for the atmospheres of …a unified theory for the atmospheres of the hot and very...
TRANSCRIPT
A UNIFIED THEORY FOR THE ATMOSPHERES OF THE HOT AND VERY HOT JUPITERS:TWO CLASSES OF IRRADIATED ATMOSPHERES
J. J. Fortney1,2,3
Space Science and Astrobiology Division, Mail Stop 245-3, NASA Ames Research Center, Moffett Field, CA 94035; [email protected]
K. Lodders
Planetary Chemistry Laboratory, Department of Earth and Planetary Sciences, Washington University, St. Louis, MO 63130
and
M. S. Marley and R. S. Freedman2
Space Science and Astrobiology Division, Mail Stop 245-3, NASA Ames Research Center, Moffett Field, CA 94035
Received 2007 September 4; accepted 2007 December 7
ABSTRACT
We highlight the importance of gaseous TiO and VO opacity on the highly irradiated close-in giant planets. The day-side atmospheres of these planets naturally fall into two classes that are somewhat analogous to the M- and L-typedwarfs. Those that arewarm enough to have appreciable opacity due to TiO andVOgaseswe term ‘‘pMclass’’ planets,and those that are cooler we term ‘‘pL class’’ planets. We calculate model atmospheres for these planets, includingpressure-temperature profiles, spectra, and characteristic radiative time constants. We show that pM class planets havetemperature inversions (hot stratospheres), appear ‘‘anomalously’’ bright in the mid-infrared secondary eclipse, andfeature molecular bands in emission rather than absorption. From simple physical arguments, we show that they willhave large day/night temperature contrasts and negligible phase shifts between orbital phase and thermal emissionlight curves, because radiative timescales are much shorter than possible dynamical timescales. The pL class planetsabsorb incident flux deeper in the atmosphere where atmospheric dynamics will more readily redistribute absorbedenergy. This will lead to cooler day sides, warmer night sides, and larger phase shifts in thermal emission light curves.The boundary between these classes (�0.04Y0.05 AU from a Sun-like primary for solar composition) is particularlydependent on the incident flux from the parent star, and less so on other factors. We apply these results to severalplanets and note that the eccentric transiting planets HD 147506b andHD 17156b alternate between the classes. Ther-mal emission in the optical from pM class planets is significant redward of 400 nm, making these planets attractivetargets for optical detection. The difference in the observed day/night contrast between � And b (pM class) andHD 189733b (pL class) is naturally explained in this scenario.
Subject headinggs: planetary systems — radiative transfer
1. INTRODUCTION
The blanket term ‘‘hot Jupiter’’ or even the additional term‘‘very hot Jupiter’’ belies the diversity of these highly irradiatedplanets. Each planet likely has its own unique atmosphere, in-terior structure, and accretion history. The relative amounts ofrefractory and volatile compounds in a planet will reflect theparent star abundances, nebula temperature, total disk mass, lo-cation of the planet’s formation within the disk, duration of itsformation, and its subsequent migration (if any). This accretionhistory will give rise to differences in core masses, total heavyelements abundances, and atmospheric abundance ratios. Giventhis incredible complexity, it is worthwhile to first look for phys-ical processes that may be common to groups of planets.
In addition to a mass and radius, one can further characterizea planet by studying its atmosphere. The visible atmosphere is awindow into the composition of a planet and contains clues toits formation history (e.g., Marley et al. 2007). Of premier im-portance in this class of highly irradiated planets is how stellarinsolation affects the atmosphere, as this irradiation directly af-
fects the atmospheric structure, temperatures, and chemistry, theplanet’s cooling and contraction history, and even its stabilityagainst evaporation.
Since irradiation is perhaps the most important factor in de-termining the atmospheric properties of these planets, we exam-ine the insolation levels of the 23 known transiting planets. Werestrict ourselves to those planets more massive than Saturn, andhence for now exclude treatment of the ‘‘hot Neptune’’ GJ 436b,which is by far the coolest known transiting planet. Figure 1 il-lustrates the stellar flux incident on the planets as a function ofboth planet mass (Fig. 1a) and planet surface gravity (Fig. 1b). Inthese plots diamonds indicate transiting planets and trianglesindicate other interesting hot Jupiters for which Spitzer SpaceTelescope data exist, but which do not transit.
The first known transiting planet, HD 209458b, is seen to befairly representative of these planets in terms of incident flux.Planets OGLE-TR-56b and OGLE-TR-132b are somewhat sep-arate from the rest of the group because they receive the higheststellar irradiation. Both orbit their parent stars in less than 2 daysand are prototypes of what has been called the class of ‘‘very hotJupiters’’ (Konacki et al. 2003; Bouchy et al. 2004) with orbitalperiods less than 3 days. However, orbital period is a poor discrim-inator between ‘‘very hot’’ and merely ‘‘hot,’’ as HD 189733bclearly shows. Labeled a very hot Jupiter on its discovery, dueto its short 2.2 day period (Bouchy et al. 2005), HD 189733b
1 Spitzer Fellow.2 Carl Sagan Center, SETI Institute, 515 North Whisman Road, Mountain
View, CA 94043.3 Department of Astronomy andAstrophysics, UCO/LickObservatory, Uni-
versity of California, Santa Cruz, CA 95064.
1419
The Astrophysical Journal, 678:1419Y1435, 2008 May 10
# 2008. The American Astronomical Society. All rights reserved. Printed in U.S.A.
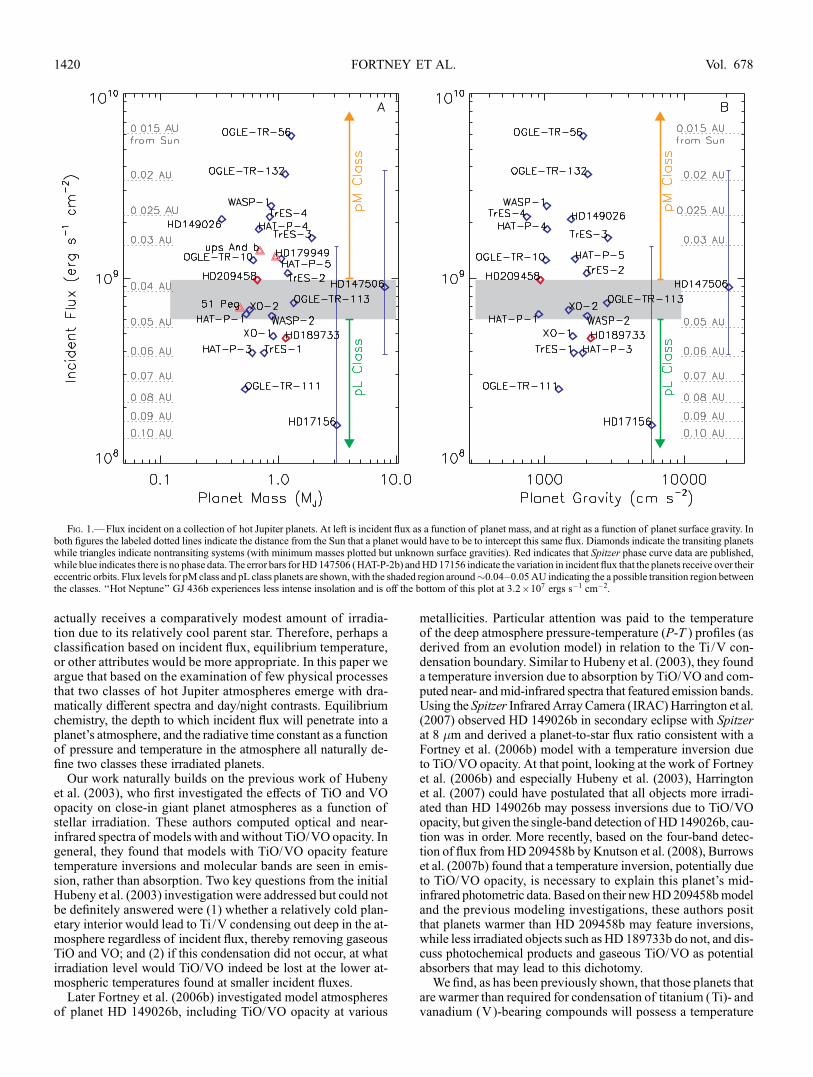
actually receives a comparatively modest amount of irradia-tion due to its relatively cool parent star. Therefore, perhaps aclassification based on incident flux, equilibrium temperature,or other attributes would be more appropriate. In this paper weargue that based on the examination of few physical processesthat two classes of hot Jupiter atmospheres emerge with dra-matically different spectra and day/night contrasts. Equilibriumchemistry, the depth to which incident flux will penetrate into aplanet’s atmosphere, and the radiative time constant as a functionof pressure and temperature in the atmosphere all naturally de-fine two classes these irradiated planets.
Our work naturally builds on the previous work of Hubenyet al. (2003), who first investigated the effects of TiO and VOopacity on close-in giant planet atmospheres as a function ofstellar irradiation. These authors computed optical and near-infrared spectra of models with and without TiO/VO opacity. Ingeneral, they found that models with TiO/VO opacity featuretemperature inversions and molecular bands are seen in emis-sion, rather than absorption. Two key questions from the initialHubeny et al. (2003) investigation were addressed but could notbe definitely answered were (1) whether a relatively cold plan-etary interior would lead to Ti /V condensing out deep in the at-mosphere regardless of incident flux, thereby removing gaseousTiO and VO; and (2) if this condensation did not occur, at whatirradiation level would TiO/VO indeed be lost at the lower at-mospheric temperatures found at smaller incident fluxes.
Later Fortney et al. (2006b) investigated model atmospheresof planet HD 149026b, including TiO/VO opacity at various
metallicities. Particular attention was paid to the temperatureof the deep atmosphere pressure-temperature (P-T ) profiles (asderived from an evolution model) in relation to the Ti /V con-densation boundary. Similar to Hubeny et al. (2003), they founda temperature inversion due to absorption by TiO/VO and com-puted near- andmid-infrared spectra that featured emission bands.Using the Spitzer InfraredArrayCamera (IRAC)Harrington et al.(2007) observed HD 149026b in secondary eclipse with Spitzerat 8 �m and derived a planet-to-star flux ratio consistent with aFortney et al. (2006b) model with a temperature inversion dueto TiO/VO opacity. At that point, looking at the work of Fortneyet al. (2006b) and especially Hubeny et al. (2003), Harringtonet al. (2007) could have postulated that all objects more irradi-ated than HD 149026b may possess inversions due to TiO/VOopacity, but given the single-band detection of HD149026b, cau-tion was in order. More recently, based on the four-band detec-tion of flux fromHD 209458b by Knutson et al. (2008), Burrowset al. (2007b) found that a temperature inversion, potentially dueto TiO/VO opacity, is necessary to explain this planet’s mid-infrared photometric data. Based on their newHD209458bmodeland the previous modeling investigations, these authors positthat planets warmer than HD 209458b may feature inversions,while less irradiated objects such as HD 189733b do not, and dis-cuss photochemical products and gaseous TiO/VO as potentialabsorbers that may lead to this dichotomy.We find, as has been previously shown, that those planets that
are warmer than required for condensation of titanium (Ti)- andvanadium (V)-bearing compounds will possess a temperature
Fig. 1.—Flux incident on a collection of hot Jupiter planets. At left is incident flux as a function of planet mass, and at right as a function of planet surface gravity. Inboth figures the labeled dotted lines indicate the distance from the Sun that a planet would have to be to intercept this same flux. Diamonds indicate the transiting planetswhile triangles indicate nontransiting systems (with minimum masses plotted but unknown surface gravities). Red indicates that Spitzer phase curve data are published,while blue indicates there is no phase data. The error bars for HD 147506 (HAT-P-2b) andHD17156 indicate the variation in incident flux that the planets receive over theireccentric orbits. Flux levels for pM class and pL class planets are shown,with the shaded region around�0.04Y0.05AU indicating the a possible transition region betweenthe classes. ‘‘Hot Neptune’’ GJ 436b experiences less intense insolation and is off the bottom of this plot at 3:2 ; 107 ergs s�1 cm�2.
FORTNEY ET AL.1420 Vol. 678
inversion at low pressure due to absorption of incident flux byTiO and VO, and will appear ‘‘anomalously’’ bright in second-ary eclipse at mid-infrared wavelengths. Thermal emission in theoptical will be significant (Hubeny et al. 2003; Lopez-Morales& Seager 2007). Furthermore, here we propose that these plan-ets will have large day/night effective temperature contrasts. Weterm these very hot Jupiters the pM class, meaning that gaseousTiO and VO are the prominent absorbers of optical flux. The pre-dictions of equilibrium chemistry for these atmospheres are sim-ilar to dM stars, where absorption by TiO, VO, H2O, and CO isprominent (Lodders 2002). Planets with temperatures below thecondensation curve of Ti and V bearing compounds will have agradually smaller mixing ratio of TiO and VO, leaving Na and Kas the major optical opacity sources (Burrows et al. 2000), alongwith H2O, and CO.We term these planets the pL class, similar tothe dL class of ultracool dwarfs. These planets will have rela-tively smaller secondary eclipse depths in the mid-infrared andsignificantly smaller day/night effective temperature contrasts.As discussed below, published Spitzer data are consistent withthis picture. The boundary between these classes, at irradiationlevels (and atmospheric temperatures) where Ti and V may bepartially condensed is not yet well defined.
In this paper we begin by discussing the observations to date.We then give an overview of our modeling methods and thepredicted chemistry of Ti and V. We calculate P-T profiles andspectra for models planets. For these model atmospheres we thenanalyze in detail the deposition of incident stellar flux and theemission of thermal flux, and go on to calculate characteristic ra-diative time constants for these atmospheres. We briefly exam-ine transmission spectra before we apply our models to knownhighly irradiated giant planets. Before our discussion and con-clusions we address issues of planetary classification.
2. REVIEW OF SPITZER OBSERVATIONS
2.1. Secondary Eclipses
The Spitzer Space Telescope allows astronomers to measurethe thermal emission from�3Y30 �m from the highly irradiatedatmospheres of these extra-solar giant planets (EGPs). This fieldhas progressed quickly from the first observations of second-ary eclipses (when the planet passes behind its parent star) byCharbonneau et al. (2005) for TrES-1 and by Deming et al.(2005) for HD 209458b. Once it was clear what Spitzer’s ca-pabilities were for these planets, additional observations camequickly. These included secondary eclipses for HD 189733b(Deming et al. 2006), HD 149026b (Harrington et al. 2007),GJ 436b (Deming et al. 2007; Demory et al. 2007), and a wealthof new (yet to be published) data for �10 other systems. In ad-dition, mid-infrared spectra were obtained for HD 209458b(Richardson et al. 2007; Swain et al. 2008) and HD 189733b(Grillmair et al. 2007). In particular, Richardson et al. (2007)claim evidence for emission features in the mid-infrared spec-trum. Very recently, Knutson et al. (2008) observed the sec-ondary eclipse of HD 209458b in all four IRAC bands.
One can now begin to examine the secondary eclipse data fortrends in planetary brightness temperatures. The brightness tem-perature, TB is defined as the temperature necessary for a black-body planet to emit the flux observed in the given observationalwavelength or band (Chamberlain & Hunten 1987). For the pub-lished secondary eclipse data as of 2007 June, Harrington et al.(2007) show that the observed dayside brightness temperaturesfor most transiting planets (TrES-1, HD 189733b, HD 209458b)vary by �20% from calculated planetary equilibrium temper-atures (when making a uniform assumption for all planets re-
garding albedo and flux redistribution). These differences arepresumably due to wavelength dependent opacity and vary-ing dynamical redistribution of the absorbed flux. However,HD 149026b has a�45% higher brightness temperature than pre-dicted from this relation, meaning that the temperature one mea-sures at 8 �m is significantly higher than the planet’s equilibriumtemperature. This level of infrared emission was predicted byFortney et al. (2006b) for models of HD 149026b that includeda hot stratosphere induced by absorption of stellar flux by TiOand VO. More recent Knutson et al. (2008) observations ofHD 209458b are broadly similar to the one-band detection forHD 149026b. Relatively high brightness temperatures of 1500Y1900 K were observed from 3.6 to 8 �m, compared to theHarrington et al. (2007) predicted equilibrium temperature of1330K. These observations have also been interpreted byBurrowset al. (2007b) as being caused by a temperature inversion (hotstratosphere). As we discuss in x 5.1, HD 209458b is in a temper-ature regime that is difficult to model, where Ti and V are ex-pected to be partially condensed.
2.2. Phase Curves
The observations that best allow us to understand the atmo-spheric dynamics of these presumably tidally locked planets arethose made as a function of orbital phase. Two approaches havebeen used to measure the thermal emission of these planets awayfrom secondary eclipse. The first is to periodically observe theinfrared flux from the combined planet+star system at severaltimes in the planet’s orbit. The advantage of periodic short ob-servations is that little telescope time is used. The disadvantage isthat since the system is not monitored continuously, systematicuncertainties could be important and may be hard to correct for.There are published data for four planets that have been observedin this way: detections of phase variation for �And b (Harringtonet al. 2006) and HD 179949b (Cowan et al. 2007), and upperlimits for HD 209458b, 51 Peg b (Cowan et al. 2007). Alterna-tively, one could monitor a system continuously over a significantfraction of a planet’s orbital period to eliminate any uncertaintiesinduced by having to revisit the target. Thismethodwas employedbyKnutson et al. (2007) to observe HD 189733b continuously for33 hr, including the transit and secondary eclipse. Large day/nightcontrasts were found for pM class planets � And b (which isconsistent with a dark night side) and HD 179949b, whereaspL class planet HD 189733b has a day/night 8 �m brightnesstemperature difference of only�240 K. We return to the Cowanet al. (2007) upper limit for HD 209458b in x 8.
Two additional factors that affect these observations are thebrightness of the parent star and the inclination of the planetaryorbit. While the brightest planet-hosting stars allow for the larg-est flux measurements (e.g., � And b), the brightest hot Jupitersystems do not transit. A measurement of the secondary eclipsedepth while obtaining a light curve is extremely valuable, be-cause the planet-to-star flux ratio at full planet illumination isthus known, as is the planet’s radius from transit observations.The interpretation is then much more straightforward for the tran-siting systems.
Among the current published data there appear to be twoplanets that are bright in secondary eclipse, HD 149026b andHD 209458b, compared to other transiting planets, and twoplanets that appear to have large day/night temperature differ-ences, � And b and HD 179949b. We show that these planets,HD 149026b, HD 209458b, � And b, and HD 179949b, arepM class planets, while the less irradiated hot Jupiters (such asHD 189733b and TrES-1) are pL class. We now turn to models
TWO CLASSES OF HOT JUPITER ATMOSPHERES 1421No. 2, 2008
of these classes of planets to examine how and why their atmo-spheres differ so strikingly.
3. MODEL ATMOSPHERES
3.1. Methods
We have computed atmospheric PYT profiles and spectra forseveral planets with a plane-parallel model atmosphere code thathas been used for a variety of planetary and substellar objects.The code was first used to generate profiles and spectra for Titan’satmosphere by McKay et al. (1989). It was significantly revisedto model the atmospheres of brown dwarfs (Marley et al. 1996,2002; Burrows et al. 1997) and irradiated giant planets (Marley& McKay 1999, for Uranus). Recently, it has been applied toL- and T-type brown dwarfs (Saumon et al. 2006, 2007; Cushinget al. 2008) and hot Jupiters (Fortney et al. 2005, 2006b, 2007). Itexplicitly accounts for both incident radiation from the parentstar and thermal radiation from the planet’s atmosphere and in-terior. The radiative transfer solution algorithm was developedby Toon et al. (1989). We model the impinging stellar flux from0.26 to 6.0 �mand the emitted thermal flux from 0.26 to 325 �m.
We use the elemental abundance data of Lodders (2003)and chemical equilibrium compositions are computed with theCONDOR code, following Lodders & Fegley (2002, 2006) andLodders (1999, 2002). We maintain a large and constantly up-dated opacity database, which is described in Freedman et al.(2008). When including the opacity of clouds, such as Fe-metalandMg-silicates, we use the cloud model of Ackerman&Marley(2001). However, in our past work we have found only weakeffects on P-T profiles and spectra due to cloud opacity (Fortneyet al. 2005), so we ignore cloud opacity here. However, the se-questering of elements into condensates, and their removal fromthe gas phase (‘‘rainout’’) is always accounted for in the chem-istry calculations. We note that day sides of the strongly irradi-ated pM class planets are toowarm for Fe-metal andMg-silicatescondensates to form.
3.2. Very Hot Jupiters and TiO/VO Chemistry
It is clear that the abundances to TiO and VO gases is impor-tant in these atmospheres. Hubeny et al. (2003) first discussedhow understanding the ‘‘cold trap’’ phenomenon may be signif-icant in understanding these abundances. If a given P-T profilecrosses a condensation curve in two corresponding altitude levels,the condensed species is expected to eventually mix down to thehighest pressure condensation point, where the cloud remainsconfined due to the planet’s gravitational field. This process isresponsible for the extremely lowwater abundance in the Earth’sstratosphere. It can also be seen in the atmospheres Jupiter andSaturn, where the ammonia ice clouds are confined to a pressureof several bars, although both these planets exhibit stratospheres,such that their warm upper atmospheres pass the ammonia con-densation curve again at millibar pressures. For the highly irra-diated planets, the relevant condensates are those that removegaseous TiO and VO, and sequester Ti and V into solid con-densates at pressures of tens to hundreds of bars, far below thevisible atmosphere.
The cold trap phenomenon constitutes a departure from chem-ical equilibrium that cannot be easily accounted for in the pre-tabulated chemical equilibrium abundances used by Hubenyet al. (2003), Fortney et al. (2006b), Burrows et al. (2007b), andhere as well. Our chemical abundances and opacities are pre-tabulated in P-T space and the atmosphere code interpolates inthese abundances as it converges to a solution. The abundancesdetermined for any one pressure level of the P-T profile are not
cognizant of abundances of other levels of the profile, al-though condensation and settling of species is always properlyaccounted for. In this case a tabulated TiO abundance at a givenP-T point at which, in equilibrium, TiO would be in the gas-eous state (warmer than required for Ti condensation), may notbe correct. If the atmospheric P-T profile intersects the conden-sation curve, the atmosphere becomes depleted in TiO abovethe cloud. We do not treat the cold trap here. In practice, we usetwo different opacity databases: one with TiO and VO removedat P < 10 bars, which simulates the removal of Ti and V intoclouds, and one in which gases TiO and VO remain as calculatedby equilibrium chemistry (which does not include depletion froma cold trap).A full discussion of titanium and vanadium chemistry in the
context of M- and L-dwarf atmospheres can be found in Lodders(2002). Much of that discussion pertains to the atmospheres ofhighly irradiated planets as well. The chemistry is complex. Forinstance Lodders & Fegley (2006) (using the updated Lodders2003 abundances) find that the first Ti condensate will not nec-essarily be CaTiO3. For solar metallicity, the first condensateis TiN if P barsk 30 bars, Ca3Ti2O7 if 5 barsPPP 30 bars,Ca4Ti3O10 if 0:03 barsPPP 5 bars, and CaTiO3 if PP 0:03bars. These four condensates are the initial condensates as afunction of total pressure and their condensation temperaturesdefine the Ti-condensation curve in Figure 2. Another importantpoint is that, following Lodders (2002), we assume that vana-dium condenses into solid solution with Ti-bearing condensates,as is found in meteorites (Kornacki & Fegley 1986). Lodders(2002) find this condensation sequence is also consistent withobserved spectra at the M- to L-dwarf transition (Kirkpatricket al. 1999). In the absence of this effect V would not condenseuntil�200 K cooler temperatures are reached and solid VO forms,as in the chemistry calculations of Burrows&Sharp (1999),Allard
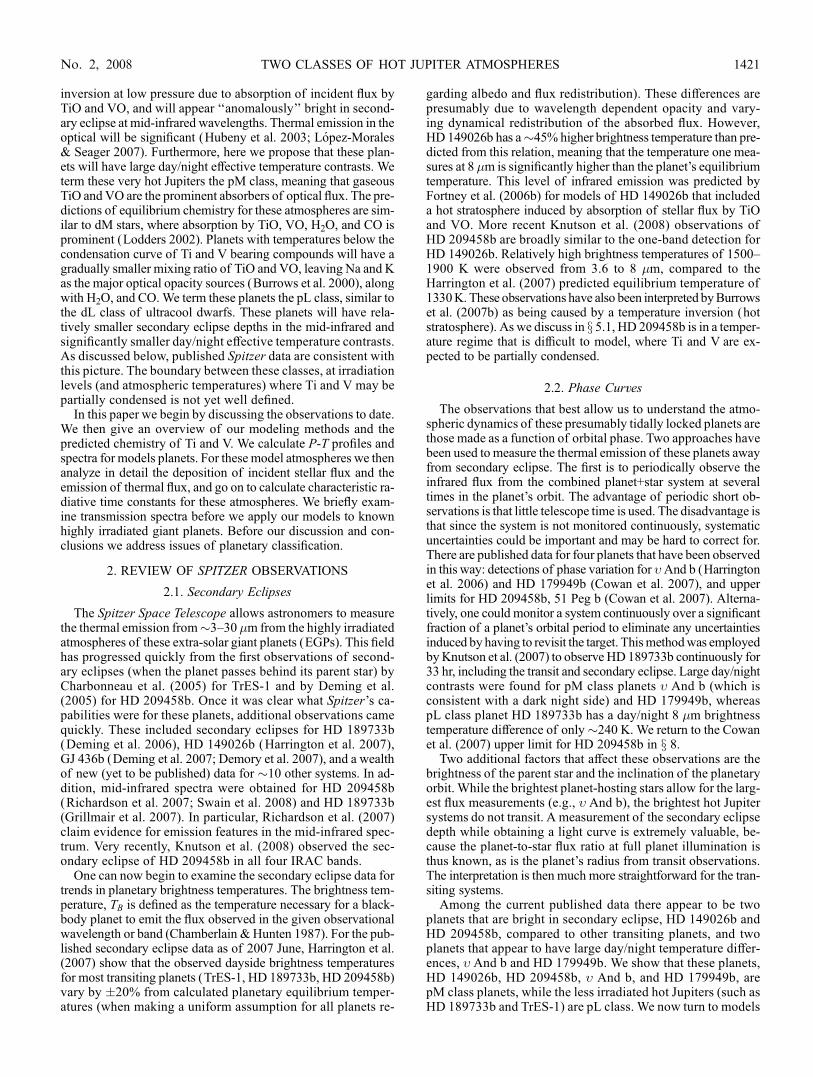
Fig. 2.—ModelP-T profiles for planets with g ¼ 15m s�2 andTint ¼ 200K atvarious distances (0.025Y0.055AU) from the Sun. ThisTint value is roughly con-sistent with that expected for a 1MJ planet with a radius of 1.2 RJ. Condensationcurves are dotted lines and the curvewhere COandCH4 have equal abundances isdashed. The 0.1X Ti-Cond curve shows where 90% of the Ti has condensed out.However, even then TiO is a major opacity source. For none of these profiles hasTiO/VO been artificially removed. The kinks in the 0.035 AU profile are due tointerpolation difficulties, as the opacity drops significantly over a small tempera-ture range.
FORTNEY ET AL.1422 Vol. 678
et al. (2001), and Sharp & Burrows (2007). Choices made in thecalculation of the Ti condensation curve (e.g., number of potentialTi-bearing compounds included in the calculations) and the V con-densation curve (e.g., whether V enters into Ti-bearing conden-sates or condenses as solid VO) will cause some shift in theposition of these condensation curves, important boundaries be-tween the pL and pM classes.
3.3. Calculating Pressure-Temperature Profiles
When modeling the atmospheres of irradiated objects with aone-dimensional, plane parallel atmosphere code it is necessaryto weigh the stellar flux by a geometric factor if one is comput-ing a profile for dayside average or planet-wide average con-ditions. Descriptions of this issue in solar system atmospheremodeling can be found in Appleby & Hogan (1984) and McKayet al. (1989). In the context of highly irradiated EGPs, Burrowset al. (2004, 2006, 2007a), Barman et al. (2005), Seager et al.(2005), and Fortney & Marley (2007) have all discussed thisissue in some detail. All are approximations for atmosphericstructures that are surely complex for these highly irradiatedatmospheres. In this paper we make a straightforward choice tomultiply the incident flux by a factor f ¼ 0:5 for a dayside av-erage (since the atmosphere radiates over 2� sr but interceptsflux over only � radians) and assume normal incidence of flux,� ¼ 1. This differs slightly from choices in our previous papers(see Fortney & Marley 2007). All profiles shown in this paperare relevant for the irradiated planetary day side.
In Figure 2 we show P-T profiles as a function of distancefrom the Sun. At 0.025 and 0.03 AU the profiles are everywherewarmer that the condensation curve for a solar abundance ofTi and V. Essentially all Ti and V is expected to be in TiO andVO. By 0.035 AU, where the incident flux is weaker, the profilecrosses this condensation curve, labeled ‘‘1X Ti /V-Cond.’’ To
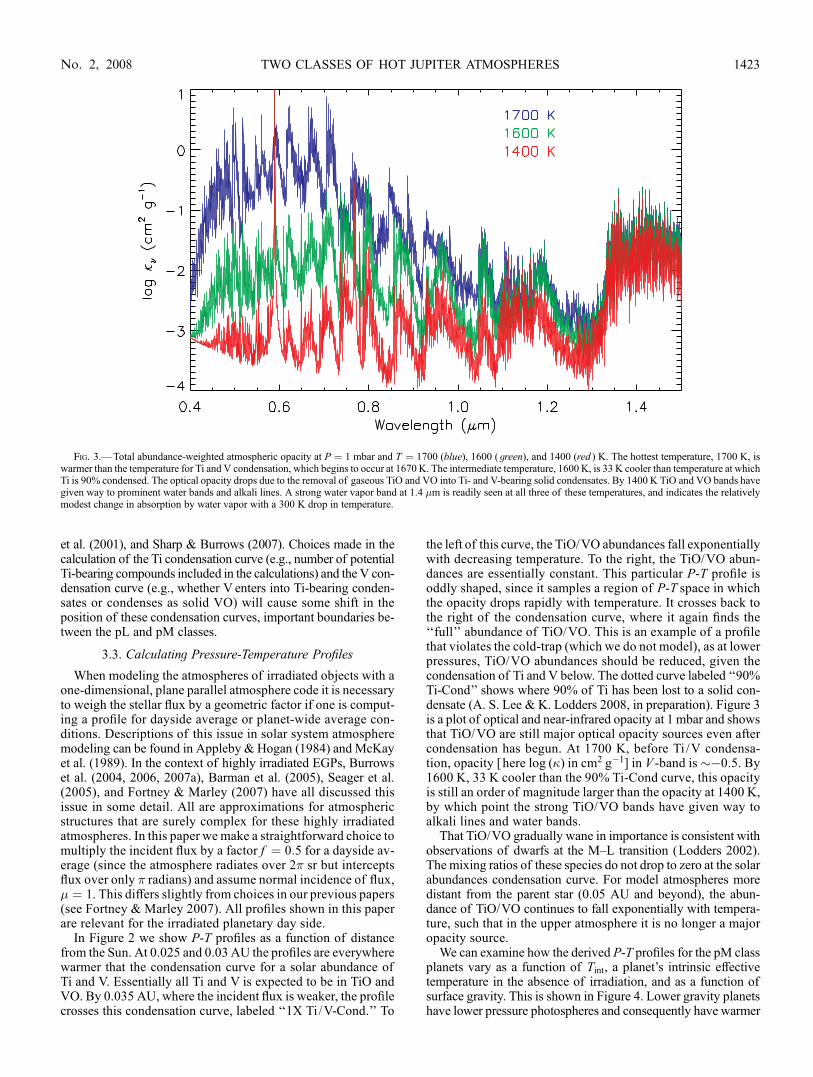
the left of this curve, the TiO/VO abundances fall exponentiallywith decreasing temperature. To the right, the TiO/VO abun-dances are essentially constant. This particular P-T profile isoddly shaped, since it samples a region of P-T space in whichthe opacity drops rapidly with temperature. It crosses back tothe right of the condensation curve, where it again finds the‘‘full’’ abundance of TiO/VO. This is an example of a profilethat violates the cold-trap (which we do not model), as at lowerpressures, TiO/VO abundances should be reduced, given thecondensation of Ti and V below. The dotted curve labeled ‘‘90%Ti-Cond’’ shows where 90% of Ti has been lost to a solid con-densate (A. S. Lee & K. Lodders 2008, in preparation). Figure 3is a plot of optical and near-infrared opacity at 1 mbar and showsthat TiO/VO are still major optical opacity sources even aftercondensation has begun. At 1700 K, before Ti /V condensa-tion, opacity [here log (�) in cm2 g�1] in V -band is ��0.5. By1600 K, 33 K cooler than the 90% Ti-Cond curve, this opacityis still an order of magnitude larger than the opacity at 1400 K,by which point the strong TiO/VO bands have given way toalkali lines and water bands.
That TiO/VO gradually wane in importance is consistent withobservations of dwarfs at the MYL transition (Lodders 2002).The mixing ratios of these species do not drop to zero at the solarabundances condensation curve. For model atmospheres moredistant from the parent star (0.05 AU and beyond), the abun-dance of TiO/VO continues to fall exponentially with tempera-ture, such that in the upper atmosphere it is no longer a majoropacity source.
We can examine how the derived P-T profiles for the pM classplanets vary as a function of Tint, a planet’s intrinsic effectivetemperature in the absence of irradiation, and as a function ofsurface gravity. This is shown in Figure 4. Lower gravity planetshave lower pressure photospheres and consequently have warmer
Fig. 3.—Total abundance-weighted atmospheric opacity at P ¼ 1 mbar and T ¼ 1700 (blue), 1600 (green), and 1400 (red ) K. The hottest temperature, 1700 K, iswarmer than the temperature for Ti and V condensation, which begins to occur at 1670 K. The intermediate temperature, 1600 K, is 33 K cooler than temperature at whichTi is 90% condensed. The optical opacity drops due to the removal of gaseous TiO and VO into Ti- and V-bearing solid condensates. By 1400 K TiO and VO bands havegiven way to prominent water bands and alkali lines. A strong water vapor band at 1.4 �m is readily seen at all three of these temperatures, and indicates the relativelymodest change in absorption by water vapor with a 300 K drop in temperature.
TWO CLASSES OF HOT JUPITER ATMOSPHERES 1423No. 2, 2008
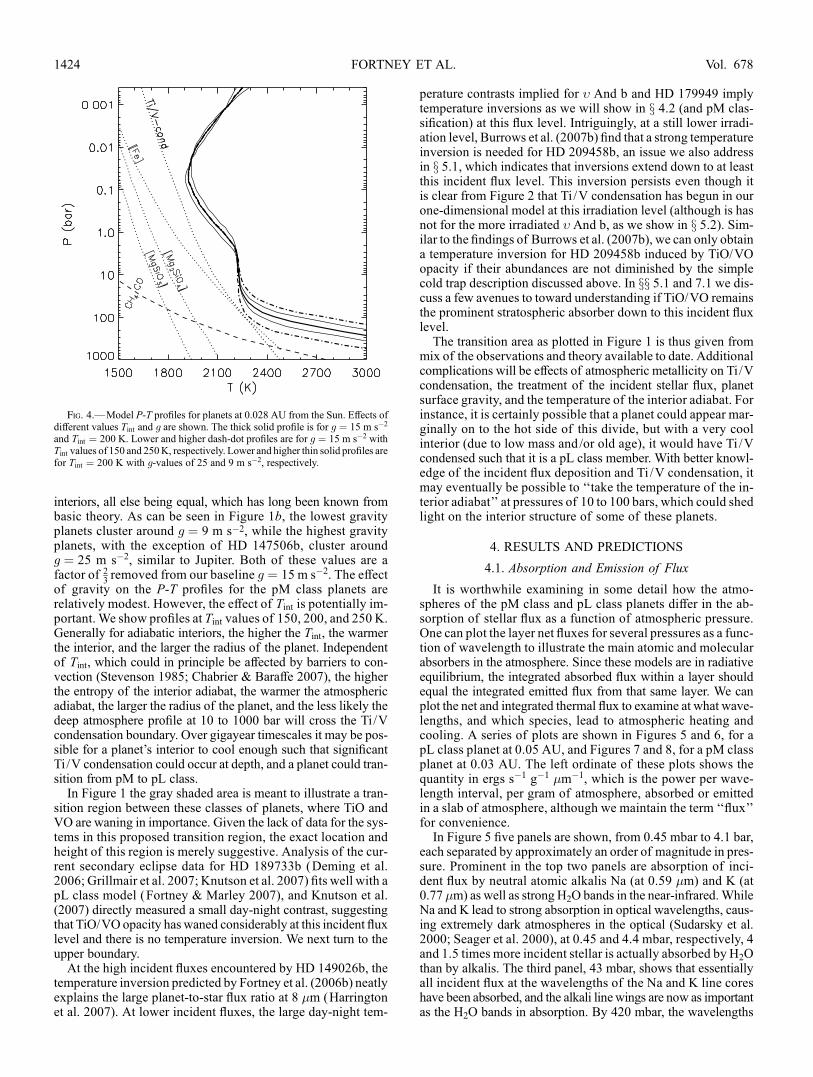
interiors, all else being equal, which has long been known frombasic theory. As can be seen in Figure 1b, the lowest gravityplanets cluster around g ¼ 9 m s�2, while the highest gravityplanets, with the exception of HD 147506b, cluster aroundg ¼ 25 m s�2, similar to Jupiter. Both of these values are afactor of 2
3removed from our baseline g ¼ 15 m s�2. The effect
of gravity on the P-T profiles for the pM class planets arerelatively modest. However, the effect of Tint is potentially im-portant. We show profiles at Tint values of 150, 200, and 250 K.Generally for adiabatic interiors, the higher the Tint, the warmerthe interior, and the larger the radius of the planet. Independentof Tint, which could in principle be affected by barriers to con-vection (Stevenson 1985; Chabrier & Baraffe 2007), the higherthe entropy of the interior adiabat, the warmer the atmosphericadiabat, the larger the radius of the planet, and the less likely thedeep atmosphere profile at 10 to 1000 bar will cross the Ti /Vcondensation boundary. Over gigayear timescales it may be pos-sible for a planet’s interior to cool enough such that significantTi /V condensation could occur at depth, and a planet could tran-sition from pM to pL class.
In Figure 1 the gray shaded area is meant to illustrate a tran-sition region between these classes of planets, where TiO andVO are waning in importance. Given the lack of data for the sys-tems in this proposed transition region, the exact location andheight of this region is merely suggestive. Analysis of the cur-rent secondary eclipse data for HD 189733b (Deming et al.2006; Grillmair et al. 2007; Knutson et al. 2007) fits well with apL class model (Fortney & Marley 2007), and Knutson et al.(2007) directly measured a small day-night contrast, suggestingthat TiO/VO opacity has waned considerably at this incident fluxlevel and there is no temperature inversion. We next turn to theupper boundary.
At the high incident fluxes encountered by HD 149026b, thetemperature inversion predicted by Fortney et al. (2006b) neatlyexplains the large planet-to-star flux ratio at 8 �m (Harringtonet al. 2007). At lower incident fluxes, the large day-night tem-
perature contrasts implied for � And b and HD 179949 implytemperature inversions as we will show in x 4.2 (and pM clas-sification) at this flux level. Intriguingly, at a still lower irradi-ation level, Burrows et al. (2007b) find that a strong temperatureinversion is needed for HD 209458b, an issue we also addressin x 5.1, which indicates that inversions extend down to at leastthis incident flux level. This inversion persists even though itis clear from Figure 2 that Ti /V condensation has begun in ourone-dimensional model at this irradiation level (although is hasnot for the more irradiated � And b, as we show in x 5.2). Sim-ilar to the findings of Burrows et al. (2007b), we can only obtaina temperature inversion for HD 209458b induced by TiO/VOopacity if their abundances are not diminished by the simplecold trap description discussed above. In xx 5.1 and 7.1 we dis-cuss a few avenues to toward understanding if TiO/VO remainsthe prominent stratospheric absorber down to this incident fluxlevel.The transition area as plotted in Figure 1 is thus given from
mix of the observations and theory available to date. Additionalcomplications will be effects of atmospheric metallicity on Ti/Vcondensation, the treatment of the incident stellar flux, planetsurface gravity, and the temperature of the interior adiabat. Forinstance, it is certainly possible that a planet could appear mar-ginally on to the hot side of this divide, but with a very coolinterior (due to low mass and /or old age), it would have Ti /Vcondensed such that it is a pL class member. With better knowl-edge of the incident flux deposition and Ti /V condensation, itmay eventually be possible to ‘‘take the temperature of the in-terior adiabat’’ at pressures of 10 to 100 bars, which could shedlight on the interior structure of some of these planets.
4. RESULTS AND PREDICTIONS
4.1. Absorption and Emission of Flux
It is worthwhile examining in some detail how the atmo-spheres of the pM class and pL class planets differ in the ab-sorption of stellar flux as a function of atmospheric pressure.One can plot the layer net fluxes for several pressures as a func-tion of wavelength to illustrate the main atomic and molecularabsorbers in the atmosphere. Since these models are in radiativeequilibrium, the integrated absorbed flux within a layer shouldequal the integrated emitted flux from that same layer. We canplot the net and integrated thermal flux to examine at what wave-lengths, and which species, lead to atmospheric heating andcooling. A series of plots are shown in Figures 5 and 6, for apL class planet at 0.05 AU, and Figures 7 and 8, for a pM classplanet at 0.03 AU. The left ordinate of these plots shows thequantity in ergs s�1 g�1 �m�1, which is the power per wave-length interval, per gram of atmosphere, absorbed or emittedin a slab of atmosphere, although we maintain the term ‘‘flux’’for convenience.In Figure 5 five panels are shown, from 0.45 mbar to 4.1 bar,
each separated by approximately an order of magnitude in pres-sure. Prominent in the top two panels are absorption of inci-dent flux by neutral atomic alkalis Na (at 0.59 �m) and K (at0.77 �m) as well as strong H2O bands in the near-infrared.WhileNa and K lead to strong absorption in optical wavelengths, caus-ing extremely dark atmospheres in the optical (Sudarsky et al.2000; Seager et al. 2000), at 0.45 and 4.4 mbar, respectively, 4and 1.5 times more incident stellar is actually absorbed by H2Othan by alkalis. The third panel, 43 mbar, shows that essentiallyall incident flux at the wavelengths of the Na and K line coreshave been absorbed, and the alkali linewings are now as importantas the H2O bands in absorption. By 420 mbar, the wavelengths
Fig. 4.—Model P-T profiles for planets at 0.028 AU from the Sun. Effects ofdifferent values Tint and g are shown. The thick solid profile is for g ¼ 15 m s�2
and Tint ¼ 200 K. Lower and higher dash-dot profiles are for g ¼ 15 m s�2 withTint values of 150 and 250K, respectively. Lower and higher thin solid profiles arefor Tint ¼ 200 K with g-values of 25 and 9 m s�2, respectively.
FORTNEY ET AL.1424 Vol. 678
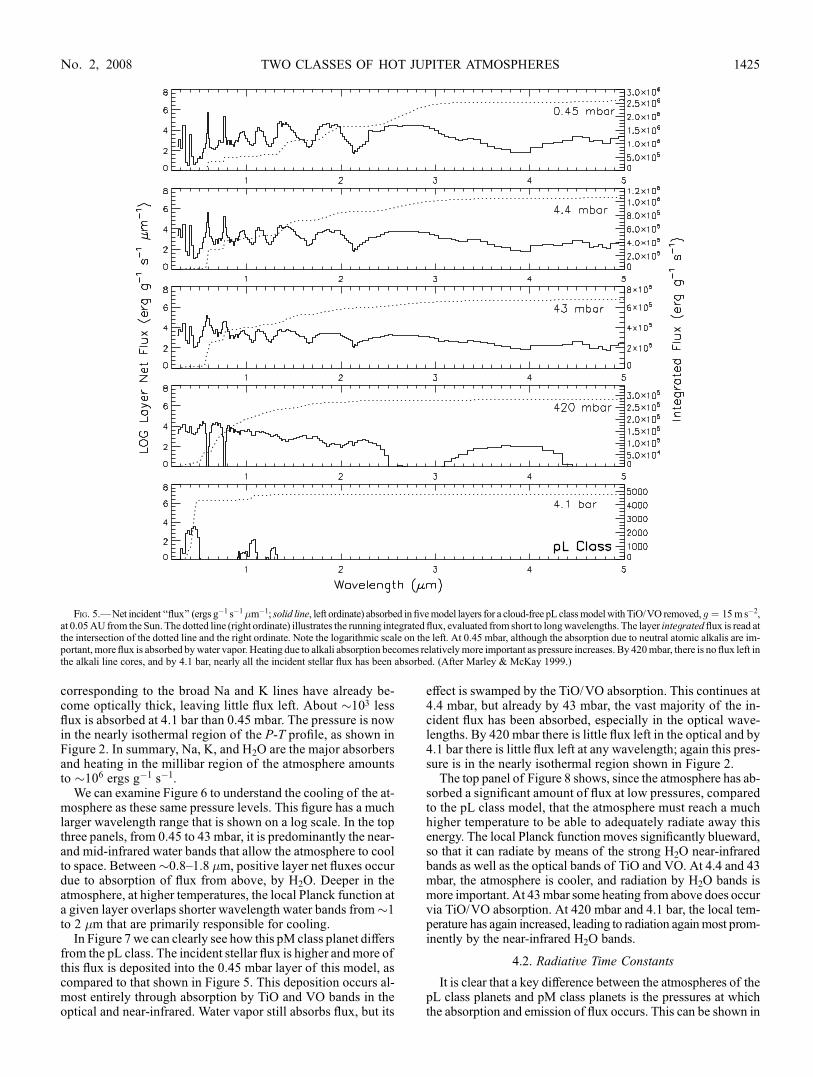
corresponding to the broad Na and K lines have already be-come optically thick, leaving little flux left. About �103 lessflux is absorbed at 4.1 bar than 0.45 mbar. The pressure is nowin the nearly isothermal region of the P-T profile, as shown inFigure 2. In summary, Na, K, and H2O are the major absorbersand heating in the millibar region of the atmosphere amountsto �106 ergs g�1 s�1.
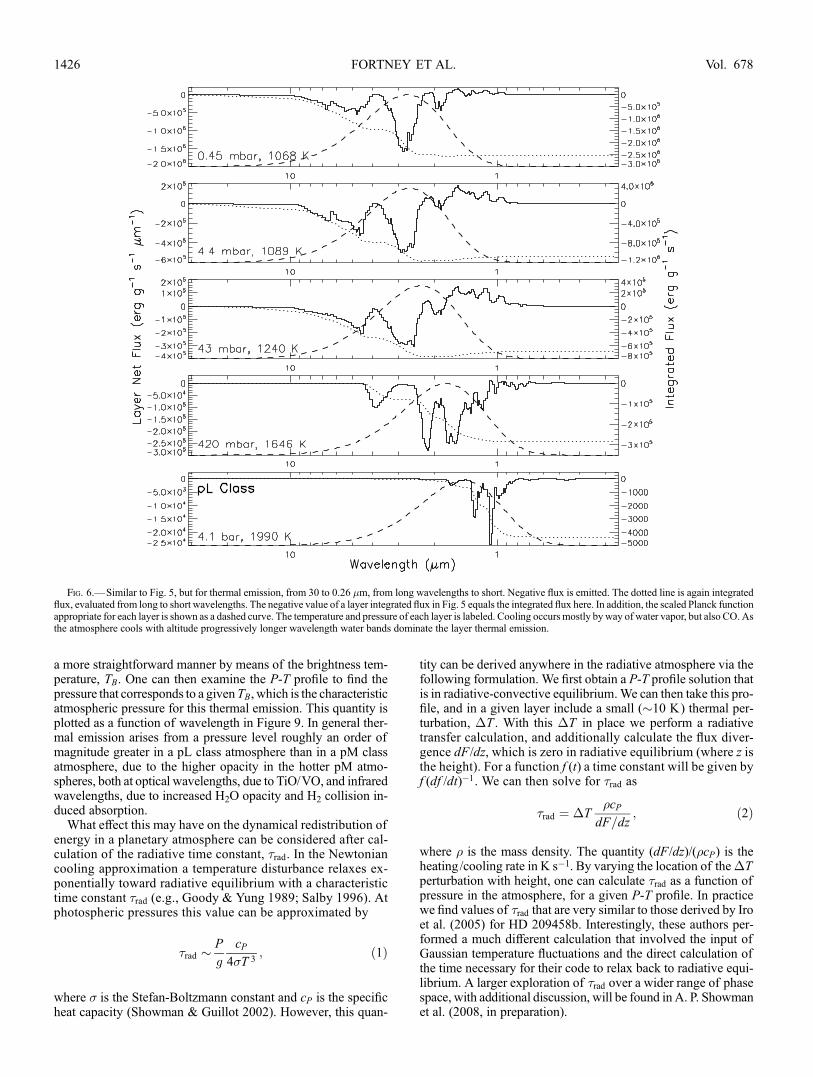
We can examine Figure 6 to understand the cooling of the at-mosphere as these same pressure levels. This figure has a muchlarger wavelength range that is shown on a log scale. In the topthree panels, from 0.45 to 43 mbar, it is predominantly the near-and mid-infrared water bands that allow the atmosphere to coolto space. Between�0.8Y1.8 �m, positive layer net fluxes occurdue to absorption of flux from above, by H2O. Deeper in theatmosphere, at higher temperatures, the local Planck function ata given layer overlaps shorter wavelength water bands from�1to 2 �m that are primarily responsible for cooling.
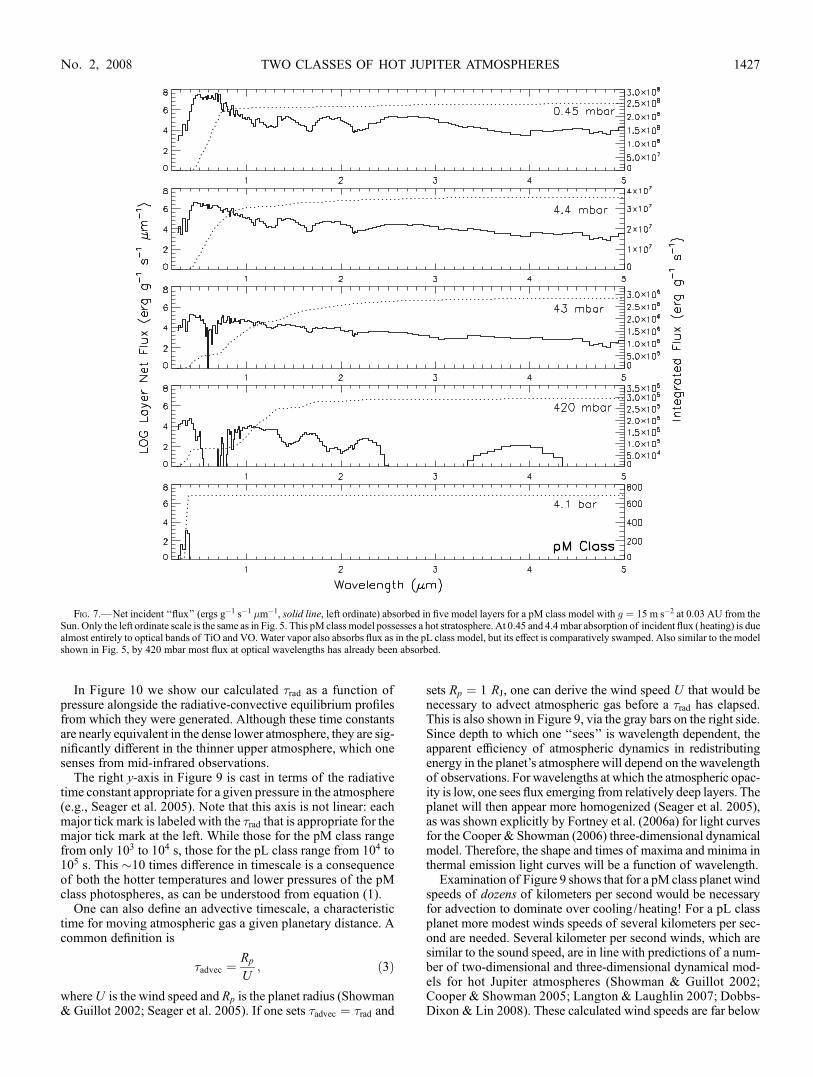
In Figure 7 we can clearly see how this pM class planet differsfrom the pL class. The incident stellar flux is higher and more ofthis flux is deposited into the 0.45 mbar layer of this model, ascompared to that shown in Figure 5. This deposition occurs al-most entirely through absorption by TiO and VO bands in theoptical and near-infrared. Water vapor still absorbs flux, but its
effect is swamped by the TiO/VO absorption. This continues at4.4 mbar, but already by 43 mbar, the vast majority of the in-cident flux has been absorbed, especially in the optical wave-lengths. By 420 mbar there is little flux left in the optical and by4.1 bar there is little flux left at any wavelength; again this pres-sure is in the nearly isothermal region shown in Figure 2.
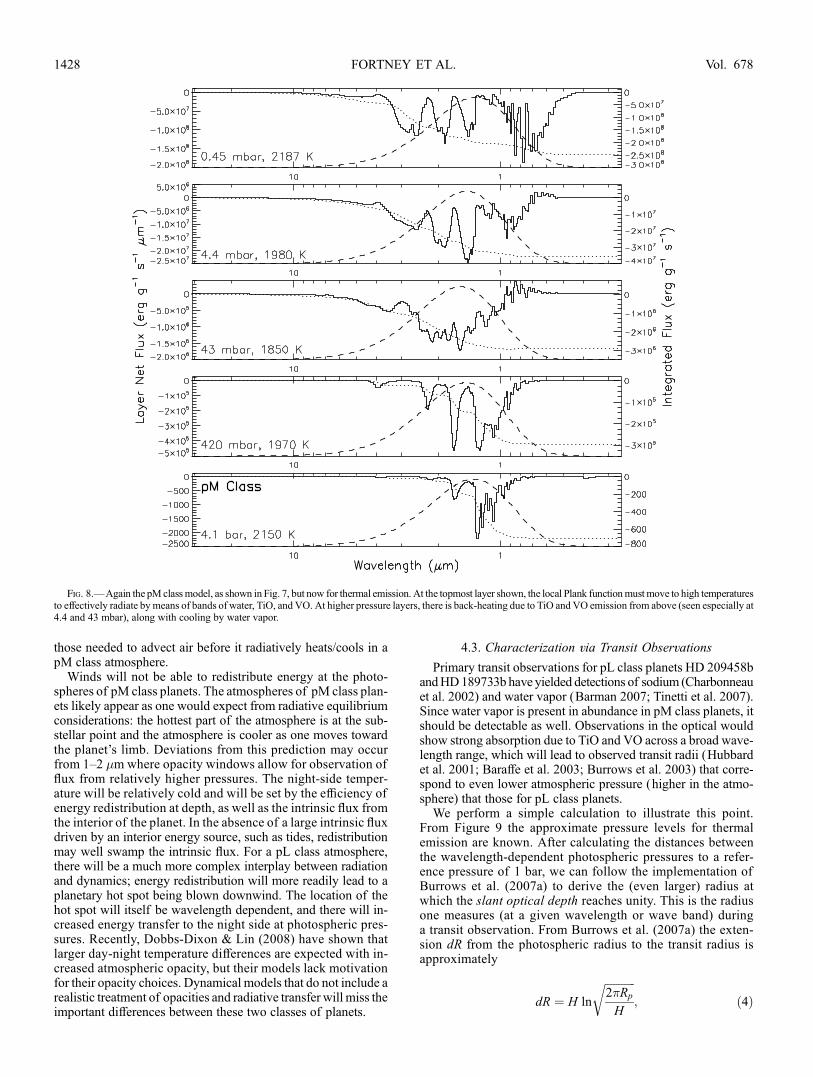
The top panel of Figure 8 shows, since the atmosphere has ab-sorbed a significant amount of flux at low pressures, comparedto the pL class model, that the atmosphere must reach a muchhigher temperature to be able to adequately radiate away thisenergy. The local Planck function moves significantly blueward,so that it can radiate by means of the strong H2O near-infraredbands as well as the optical bands of TiO and VO. At 4.4 and 43mbar, the atmosphere is cooler, and radiation by H2O bands ismore important. At 43mbar some heating from above does occurvia TiO/VO absorption. At 420 mbar and 4.1 bar, the local tem-perature has again increased, leading to radiation againmost prom-inently by the near-infrared H2O bands.
4.2. Radiative Time Constants
It is clear that a key difference between the atmospheres of thepL class planets and pM class planets is the pressures at whichthe absorption and emission of flux occurs. This can be shown in
Fig. 5.—Net incident ‘‘flux’’ (ergs g�1 s�1�m�1; solid line, left ordinate) absorbed in fivemodel layers for a cloud-free pL classmodelwith TiO/VO removed, g ¼ 15m s�2,at 0.05AU from the Sun. The dotted line (right ordinate) illustrates the running integrated flux, evaluated from short to longwavelengths. The layer integratedflux is read atthe intersection of the dotted line and the right ordinate. Note the logarithmic scale on the left. At 0.45 mbar, although the absorption due to neutral atomic alkalis are im-portant,more flux is absorbed bywater vapor. Heating due to alkali absorption becomes relativelymore important as pressure increases. By 420mbar, there is no flux left inthe alkali line cores, and by 4.1 bar, nearly all the incident stellar flux has been absorbed. (After Marley & McKay 1999.)
TWO CLASSES OF HOT JUPITER ATMOSPHERES 1425No. 2, 2008
a more straightforward manner by means of the brightness tem-perature, TB. One can then examine the P-T profile to find thepressure that corresponds to a givenTB, which is the characteristicatmospheric pressure for this thermal emission. This quantity isplotted as a function of wavelength in Figure 9. In general ther-mal emission arises from a pressure level roughly an order ofmagnitude greater in a pL class atmosphere than in a pM classatmosphere, due to the higher opacity in the hotter pM atmo-spheres, both at optical wavelengths, due to TiO/VO, and infraredwavelengths, due to increased H2O opacity and H2 collision in-duced absorption.
What effect this may have on the dynamical redistribution ofenergy in a planetary atmosphere can be considered after cal-culation of the radiative time constant, �rad. In the Newtoniancooling approximation a temperature disturbance relaxes ex-ponentially toward radiative equilibrium with a characteristictime constant �rad (e.g., Goody & Yung 1989; Salby 1996). Atphotospheric pressures this value can be approximated by
�rad �P
g
cP
4�T 3; ð1Þ
where � is the Stefan-Boltzmann constant and cP is the specificheat capacity (Showman & Guillot 2002). However, this quan-
tity can be derived anywhere in the radiative atmosphere via thefollowing formulation. We first obtain a P-T profile solution thatis in radiative-convective equilibrium.We can then take this pro-file, and in a given layer include a small (�10 K) thermal per-turbation, �T . With this �T in place we perform a radiativetransfer calculation, and additionally calculate the flux diver-gence dF/dz, which is zero in radiative equilibrium (where z isthe height). For a function f (t) a time constant will be given byf (df /dt)�1. We can then solve for �rad as
�rad ¼ �T�cP
dF=dz; ð2Þ
where � is the mass density. The quantity (dF/dz)/(�cP) is theheating/cooling rate in K s�1. By varying the location of the�Tperturbation with height, one can calculate �rad as a function ofpressure in the atmosphere, for a given P-T profile. In practicewe find values of �rad that are very similar to those derived by Iroet al. (2005) for HD 209458b. Interestingly, these authors per-formed a much different calculation that involved the input ofGaussian temperature fluctuations and the direct calculation ofthe time necessary for their code to relax back to radiative equi-librium. A larger exploration of �rad over a wider range of phasespace, with additional discussion, will be found in A. P. Showmanet al. (2008, in preparation).
Fig. 6.—Similar to Fig. 5, but for thermal emission, from 30 to 0.26 �m, from long wavelengths to short. Negative flux is emitted. The dotted line is again integratedflux, evaluated from long to short wavelengths. The negative value of a layer integrated flux in Fig. 5 equals the integrated flux here. In addition, the scaled Planck functionappropriate for each layer is shown as a dashed curve. The temperature and pressure of each layer is labeled. Cooling occursmostly by way of water vapor, but also CO. Asthe atmosphere cools with altitude progressively longer wavelength water bands dominate the layer thermal emission.
FORTNEY ET AL.1426 Vol. 678
In Figure 10 we show our calculated �rad as a function ofpressure alongside the radiative-convective equilibrium profilesfrom which they were generated. Although these time constantsare nearly equivalent in the dense lower atmosphere, they are sig-nificantly different in the thinner upper atmosphere, which onesenses from mid-infrared observations.
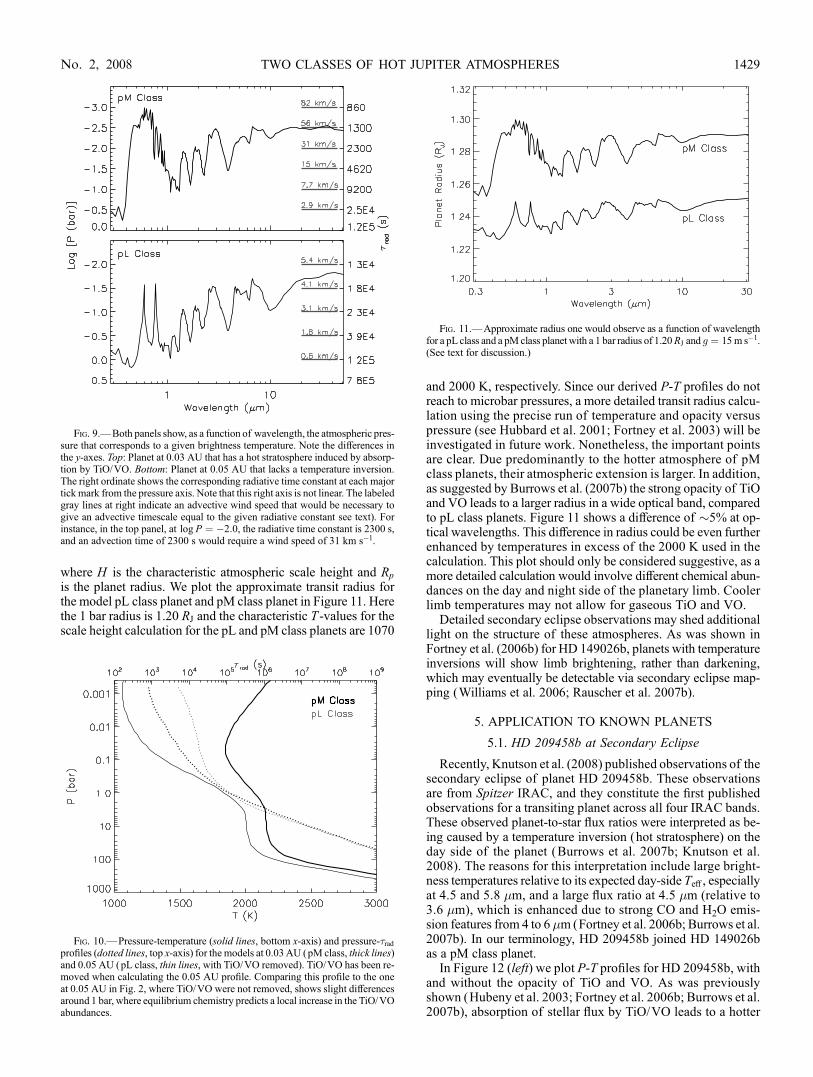
The right y-axis in Figure 9 is cast in terms of the radiativetime constant appropriate for a given pressure in the atmosphere(e.g., Seager et al. 2005). Note that this axis is not linear: eachmajor tick mark is labeled with the �rad that is appropriate for themajor tick mark at the left. While those for the pM class rangefrom only 103 to 104 s, those for the pL class range from 104 to105 s. This �10 times difference in timescale is a consequenceof both the hotter temperatures and lower pressures of the pMclass photospheres, as can be understood from equation (1).
One can also define an advective timescale, a characteristictime for moving atmospheric gas a given planetary distance. Acommon definition is
�advec ¼Rp
U; ð3Þ
whereU is the wind speed and Rp is the planet radius (Showman& Guillot 2002; Seager et al. 2005). If one sets �advec ¼ �rad and
sets Rp ¼ 1 RJ, one can derive the wind speed U that would benecessary to advect atmospheric gas before a �rad has elapsed.This is also shown in Figure 9, via the gray bars on the right side.Since depth to which one ‘‘sees’’ is wavelength dependent, theapparent efficiency of atmospheric dynamics in redistributingenergy in the planet’s atmosphere will depend on the wavelengthof observations. For wavelengths at which the atmospheric opac-ity is low, one sees flux emerging from relatively deep layers. Theplanet will then appear more homogenized (Seager et al. 2005),as was shown explicitly by Fortney et al. (2006a) for light curvesfor the Cooper & Showman (2006) three-dimensional dynamicalmodel. Therefore, the shape and times of maxima and minima inthermal emission light curves will be a function of wavelength.
Examination of Figure 9 shows that for a pM class planet windspeeds of dozens of kilometers per second would be necessaryfor advection to dominate over cooling/heating! For a pL classplanet more modest winds speeds of several kilometers per sec-ond are needed. Several kilometer per second winds, which aresimilar to the sound speed, are in line with predictions of a num-ber of two-dimensional and three-dimensional dynamical mod-els for hot Jupiter atmospheres (Showman & Guillot 2002;Cooper & Showman 2005; Langton & Laughlin 2007; Dobbs-Dixon & Lin 2008). These calculated wind speeds are far below
Fig. 7.—Net incident ‘‘flux’’ (ergs g�1 s�1 �m�1, solid line, left ordinate) absorbed in five model layers for a pM class model with g ¼ 15 m s�2 at 0.03 AU from theSun. Only the left ordinate scale is the same as in Fig. 5. This pM class model possesses a hot stratosphere. At 0.45 and 4.4mbar absorption of incident flux (heating) is duealmost entirely to optical bands of TiO and VO.Water vapor also absorbs flux as in the pL class model, but its effect is comparatively swamped. Also similar to the modelshown in Fig. 5, by 420 mbar most flux at optical wavelengths has already been absorbed.
TWO CLASSES OF HOT JUPITER ATMOSPHERES 1427No. 2, 2008
those needed to advect air before it radiatively heats/cools in apM class atmosphere.
Winds will not be able to redistribute energy at the photo-spheres of pM class planets. The atmospheres of pM class plan-ets likely appear as one would expect from radiative equilibriumconsiderations: the hottest part of the atmosphere is at the sub-stellar point and the atmosphere is cooler as one moves towardthe planet’s limb. Deviations from this prediction may occurfrom 1Y2 �m where opacity windows allow for observation offlux from relatively higher pressures. The night-side temper-ature will be relatively cold and will be set by the efficiency ofenergy redistribution at depth, as well as the intrinsic flux fromthe interior of the planet. In the absence of a large intrinsic fluxdriven by an interior energy source, such as tides, redistributionmay well swamp the intrinsic flux. For a pL class atmosphere,there will be a much more complex interplay between radiationand dynamics; energy redistribution will more readily lead to aplanetary hot spot being blown downwind. The location of thehot spot will itself be wavelength dependent, and there will in-creased energy transfer to the night side at photospheric pres-sures. Recently, Dobbs-Dixon & Lin (2008) have shown thatlarger day-night temperature differences are expected with in-creased atmospheric opacity, but their models lack motivationfor their opacity choices. Dynamical models that do not include arealistic treatment of opacities and radiative transfer will miss theimportant differences between these two classes of planets.
4.3. Characterization via Transit Observations
Primary transit observations for pL class planets HD 209458bandHD189733b have yielded detections of sodium (Charbonneauet al. 2002) and water vapor (Barman 2007; Tinetti et al. 2007).Since water vapor is present in abundance in pM class planets, itshould be detectable as well. Observations in the optical wouldshow strong absorption due to TiO and VO across a broad wave-length range, which will lead to observed transit radii (Hubbardet al. 2001; Baraffe et al. 2003; Burrows et al. 2003) that corre-spond to even lower atmospheric pressure (higher in the atmo-sphere) that those for pL class planets.We perform a simple calculation to illustrate this point.
From Figure 9 the approximate pressure levels for thermalemission are known. After calculating the distances betweenthe wavelength-dependent photospheric pressures to a refer-ence pressure of 1 bar, we can follow the implementation ofBurrows et al. (2007a) to derive the (even larger) radius atwhich the slant optical depth reaches unity. This is the radiusone measures (at a given wavelength or wave band) duringa transit observation. From Burrows et al. (2007a) the exten-sion dR from the photospheric radius to the transit radius isapproximately
dR ¼ H ln
ffiffiffiffiffiffiffiffiffiffiffi2�Rp
H
r; ð4Þ
Fig. 8.—Again the pM classmodel, as shown in Fig. 7, but now for thermal emission. At the topmost layer shown, the local Plank functionmustmove to high temperaturesto effectively radiate by means of bands of water, TiO, and VO. At higher pressure layers, there is back-heating due to TiO and VO emission from above (seen especially at4.4 and 43 mbar), along with cooling by water vapor.
FORTNEY ET AL.1428 Vol. 678
where H is the characteristic atmospheric scale height and Rp
is the planet radius. We plot the approximate transit radius forthe model pL class planet and pM class planet in Figure 11. Herethe 1 bar radius is 1.20 RJ and the characteristic T -values for thescale height calculation for the pL and pM class planets are 1070
and 2000 K, respectively. Since our derived P-T profiles do notreach to microbar pressures, a more detailed transit radius calcu-lation using the precise run of temperature and opacity versuspressure (see Hubbard et al. 2001; Fortney et al. 2003) will beinvestigated in future work. Nonetheless, the important pointsare clear. Due predominantly to the hotter atmosphere of pMclass planets, their atmospheric extension is larger. In addition,as suggested by Burrows et al. (2007b) the strong opacity of TiOand VO leads to a larger radius in a wide optical band, comparedto pL class planets. Figure 11 shows a difference of �5% at op-tical wavelengths. This difference in radius could be even furtherenhanced by temperatures in excess of the 2000 K used in thecalculation. This plot should only be considered suggestive, as amore detailed calculation would involve different chemical abun-dances on the day and night side of the planetary limb. Coolerlimb temperatures may not allow for gaseous TiO and VO.
Detailed secondary eclipse observations may shed additionallight on the structure of these atmospheres. As was shown inFortney et al. (2006b) for HD 149026b, planets with temperatureinversions will show limb brightening, rather than darkening,which may eventually be detectable via secondary eclipse map-ping (Williams et al. 2006; Rauscher et al. 2007b).
5. APPLICATION TO KNOWN PLANETS
5.1. HD 209458b at Secondary Eclipse
Recently, Knutson et al. (2008) published observations of thesecondary eclipse of planet HD 209458b. These observationsare from Spitzer IRAC, and they constitute the first publishedobservations for a transiting planet across all four IRAC bands.These observed planet-to-star flux ratios were interpreted as be-ing caused by a temperature inversion (hot stratosphere) on theday side of the planet (Burrows et al. 2007b; Knutson et al.2008). The reasons for this interpretation include large bright-ness temperatures relative to its expected day-side TeA, especiallyat 4.5 and 5.8 �m, and a large flux ratio at 4.5 �m (relative to3.6 �m), which is enhanced due to strong CO and H2O emis-sion features from 4 to 6�m (Fortney et al. 2006b; Burrows et al.2007b). In our terminology, HD 209458b joined HD 149026bas a pM class planet.
In Figure 12 (left) we plot P-T profiles for HD 209458b, withand without the opacity of TiO and VO. As was previouslyshown (Hubeny et al. 2003; Fortney et al. 2006b; Burrows et al.2007b), absorption of stellar flux by TiO/VO leads to a hotter
Fig. 9.—Both panels show, as a function of wavelength, the atmospheric pres-sure that corresponds to a given brightness temperature. Note the differences inthe y-axes. Top: Planet at 0.03 AU that has a hot stratosphere induced by absorp-tion by TiO/VO. Bottom: Planet at 0.05 AU that lacks a temperature inversion.The right ordinate shows the corresponding radiative time constant at each majortickmark from the pressure axis. Note that this right axis is not linear. The labeledgray lines at right indicate an advective wind speed that would be necessary togive an advective timescale equal to the given radiative constant see text). Forinstance, in the top panel, at log P ¼ �2:0, the radiative time constant is 2300 s,and an advection time of 2300 s would require a wind speed of 31 km s�1.
Fig. 10.—Pressure-temperature (solid lines, bottom x-axis) and pressure-�radprofiles (dotted lines, top x-axis) for the models at 0.03AU (pM class, thick lines)and 0.05 AU (pL class, thin lines, with TiO/VO removed). TiO/VO has been re-moved when calculating the 0.05 AU profile. Comparing this profile to the oneat 0.05 AU in Fig. 2, where TiO/VO were not removed, shows slight differencesaround 1 bar, where equilibrium chemistry predicts a local increase in the TiO/VOabundances.
Fig. 11.—Approximate radius one would observe as a function of wavelengthfor a pL class and a pMclass planetwith a 1 bar radius of 1.20RJ and g ¼ 15m s�1.(See text for discussion.)
TWO CLASSES OF HOT JUPITER ATMOSPHERES 1429No. 2, 2008
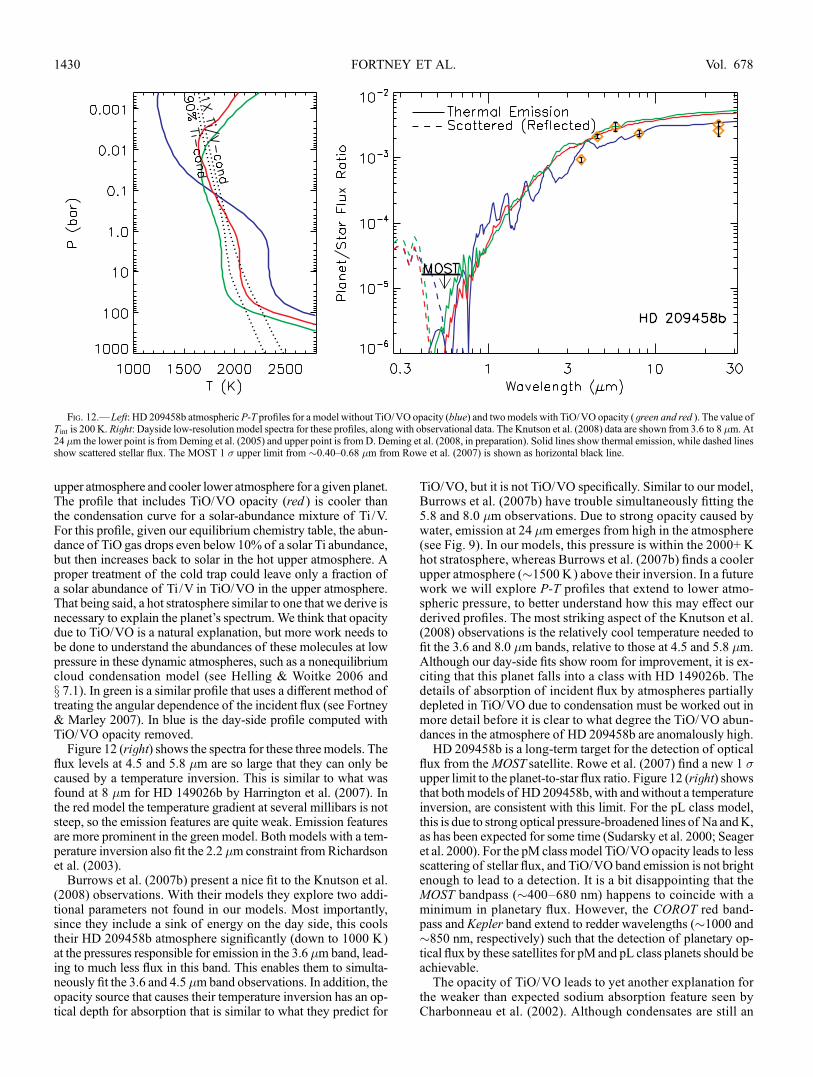
upper atmosphere and cooler lower atmosphere for a given planet.The profile that includes TiO/VO opacity (red ) is cooler thanthe condensation curve for a solar-abundance mixture of Ti /V.For this profile, given our equilibrium chemistry table, the abun-dance of TiO gas drops even below 10% of a solar Ti abundance,but then increases back to solar in the hot upper atmosphere. Aproper treatment of the cold trap could leave only a fraction ofa solar abundance of Ti /V in TiO/VO in the upper atmosphere.That being said, a hot stratosphere similar to one that we derive isnecessary to explain the planet’s spectrum. We think that opacitydue to TiO/VO is a natural explanation, but more work needs tobe done to understand the abundances of these molecules at lowpressure in these dynamic atmospheres, such as a nonequilibriumcloud condensation model (see Helling & Woitke 2006 andx 7.1). In green is a similar profile that uses a different method oftreating the angular dependence of the incident flux (see Fortney& Marley 2007). In blue is the day-side profile computed withTiO/VO opacity removed.
Figure 12 (right) shows the spectra for these three models. Theflux levels at 4.5 and 5.8 �m are so large that they can only becaused by a temperature inversion. This is similar to what wasfound at 8 �m for HD 149026b by Harrington et al. (2007). Inthe red model the temperature gradient at several millibars is notsteep, so the emission features are quite weak. Emission featuresare more prominent in the green model. Both models with a tem-perature inversion also fit the 2.2 �m constraint from Richardsonet al. (2003).
Burrows et al. (2007b) present a nice fit to the Knutson et al.(2008) observations. With their models they explore two addi-tional parameters not found in our models. Most importantly,since they include a sink of energy on the day side, this coolstheir HD 209458b atmosphere significantly (down to 1000 K)at the pressures responsible for emission in the 3.6 �m band, lead-ing to much less flux in this band. This enables them to simulta-neously fit the 3.6 and 4.5 �m band observations. In addition, theopacity source that causes their temperature inversion has an op-tical depth for absorption that is similar to what they predict for
TiO/VO, but it is not TiO/VO specifically. Similar to our model,Burrows et al. (2007b) have trouble simultaneously fitting the5.8 and 8.0 �m observations. Due to strong opacity caused bywater, emission at 24 �m emerges from high in the atmosphere(see Fig. 9). In our models, this pressure is within the 2000+ Khot stratosphere, whereas Burrows et al. (2007b) finds a coolerupper atmosphere (�1500 K) above their inversion. In a futurework we will explore P-T profiles that extend to lower atmo-spheric pressure, to better understand how this may effect ourderived profiles. The most striking aspect of the Knutson et al.(2008) observations is the relatively cool temperature needed tofit the 3.6 and 8.0 �m bands, relative to those at 4.5 and 5.8 �m.Although our day-side fits show room for improvement, it is ex-citing that this planet falls into a class with HD 149026b. Thedetails of absorption of incident flux by atmospheres partiallydepleted in TiO/VO due to condensation must be worked out inmore detail before it is clear to what degree the TiO/VO abun-dances in the atmosphere of HD 209458b are anomalously high.HD 209458b is a long-term target for the detection of optical
flux from theMOST satellite. Rowe et al. (2007) find a new 1 �upper limit to the planet-to-star flux ratio. Figure 12 (right) showsthat bothmodels of HD 209458b, with andwithout a temperatureinversion, are consistent with this limit. For the pL class model,this is due to strong optical pressure-broadened lines of Na andK,as has been expected for some time (Sudarsky et al. 2000; Seageret al. 2000). For the pM class model TiO/VO opacity leads to lessscattering of stellar flux, and TiO/VO band emission is not brightenough to lead to a detection. It is a bit disappointing that theMOST bandpass (�400Y680 nm) happens to coincide with aminimum in planetary flux. However, the COROT red band-pass and Kepler band extend to redder wavelengths (�1000 and�850 nm, respectively) such that the detection of planetary op-tical flux by these satellites for pM and pL class planets should beachievable.The opacity of TiO/VO leads to yet another explanation for
the weaker than expected sodium absorption feature seen byCharbonneau et al. (2002). Although condensates are still an
Fig. 12.—Left: HD 209458b atmospheric P-T profiles for a model without TiO/VO opacity (blue) and twomodels with TiO/VO opacity (green and red ). The value ofTint is 200 K. Right: Dayside low-resolution model spectra for these profiles, along with observational data. The Knutson et al. (2008) data are shown from 3.6 to 8 �m. At24 �m the lower point is from Deming et al. (2005) and upper point is from D. Deming et al. (2008, in preparation). Solid lines show thermal emission, while dashed linesshow scattered stellar flux. The MOST 1 � upper limit from �0.40Y0.68 �m from Rowe et al. (2007) is shown as horizontal black line.
FORTNEY ET AL.1430 Vol. 678
attractive option (Fortney et al. 2003; Fortney 2005), if TiO/VOare found on the day side of the planet’s limb, opacity due tothese molecules from �400 to 1000 nm could swamp the ex-pected Na absorption feature at 589 nm. If the opacity on the limbis everywhere larger in the optical this would lead to a weaker,narrowerNa absorption peak than expected by the first-generationmodels (Seager & Sasselov 2000; Brown 2001; Hubbard et al.2001). This effect can be seen in calculations of Barman et al.(2002), whose description of atmospheric chemistry at that timeleft addition absorbers of optical flux in the upper atmosphere. Itis not clear whether TiO/VOwould be found in abundance at theplanet’s limb, but this is an avenue worthy of further exploration.
5.2. Other Planets
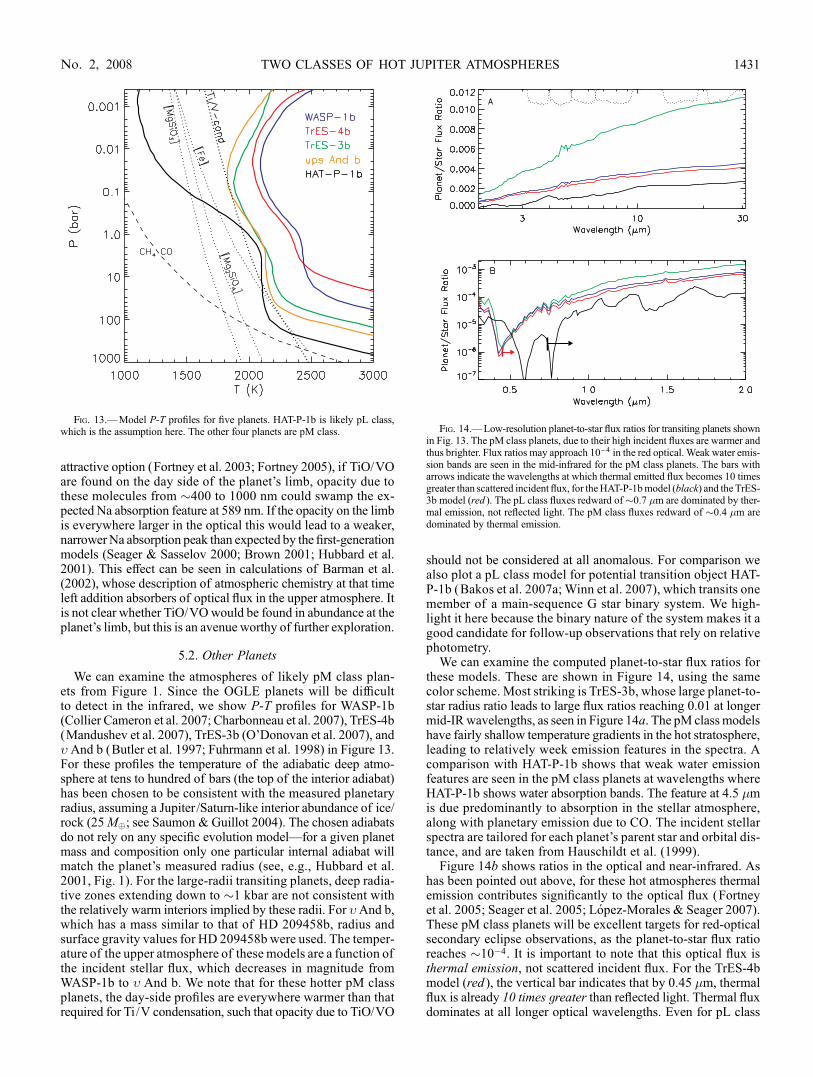
We can examine the atmospheres of likely pM class plan-ets from Figure 1. Since the OGLE planets will be difficultto detect in the infrared, we show P-T profiles for WASP-1b(Collier Cameron et al. 2007; Charbonneau et al. 2007), TrES-4b(Mandushev et al. 2007), TrES-3b (O’Donovan et al. 2007), and� And b (Butler et al. 1997; Fuhrmann et al. 1998) in Figure 13.For these profiles the temperature of the adiabatic deep atmo-sphere at tens to hundred of bars (the top of the interior adiabat)has been chosen to be consistent with the measured planetaryradius, assuming a Jupiter /Saturn-like interior abundance of ice/rock (25M�; see Saumon & Guillot 2004). The chosen adiabatsdo not rely on any specific evolution model—for a given planetmass and composition only one particular internal adiabat willmatch the planet’s measured radius (see, e.g., Hubbard et al.2001, Fig. 1). For the large-radii transiting planets, deep radia-tive zones extending down to �1 kbar are not consistent withthe relatively warm interiors implied by these radii. For �And b,which has a mass similar to that of HD 209458b, radius andsurface gravity values for HD 209458b were used. The temper-ature of the upper atmosphere of these models are a function ofthe incident stellar flux, which decreases in magnitude fromWASP-1b to � And b. We note that for these hotter pM classplanets, the day-side profiles are everywhere warmer than thatrequired for Ti/V condensation, such that opacity due to TiO/VO
should not be considered at all anomalous. For comparison wealso plot a pL class model for potential transition object HAT-P-1b (Bakos et al. 2007a; Winn et al. 2007), which transits onemember of a main-sequence G star binary system. We high-light it here because the binary nature of the system makes it agood candidate for follow-up observations that rely on relativephotometry.
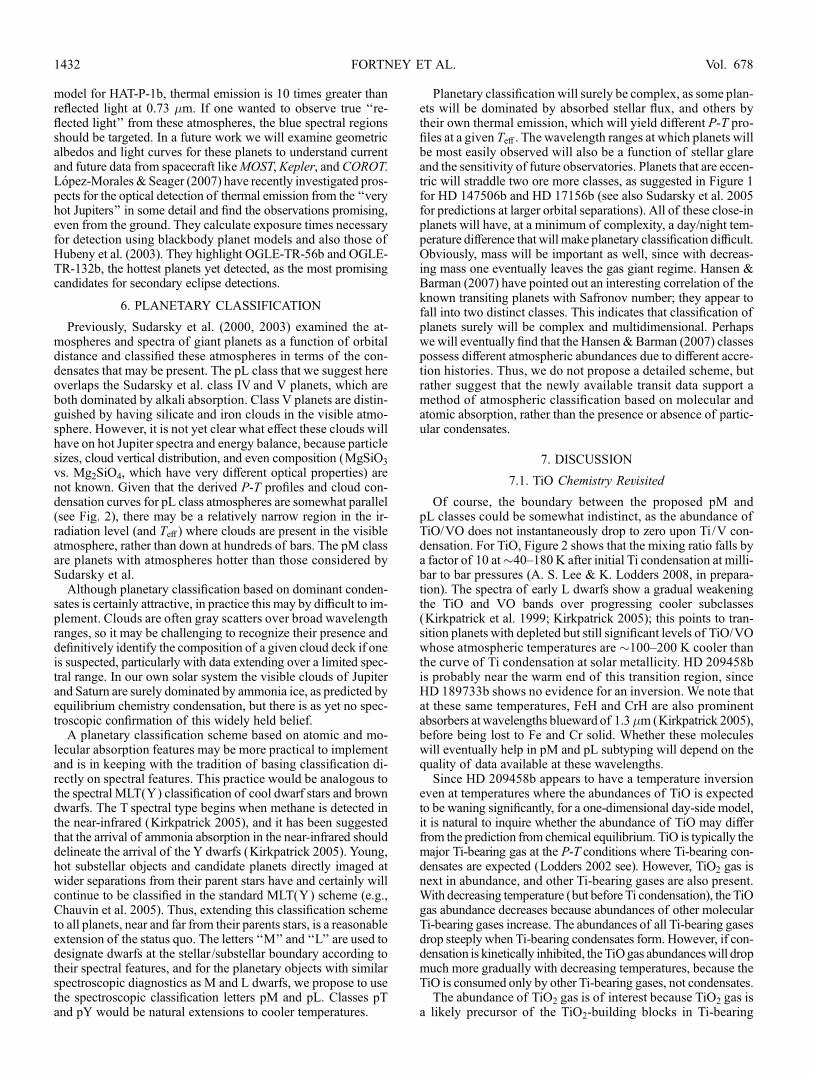
We can examine the computed planet-to-star flux ratios forthese models. These are shown in Figure 14, using the samecolor scheme. Most striking is TrES-3b, whose large planet-to-star radius ratio leads to large flux ratios reaching 0.01 at longermid-IRwavelengths, as seen in Figure 14a. The pM classmodelshave fairly shallow temperature gradients in the hot stratosphere,leading to relatively week emission features in the spectra. Acomparison with HAT-P-1b shows that weak water emissionfeatures are seen in the pM class planets at wavelengths whereHAT-P-1b shows water absorption bands. The feature at 4.5 �mis due predominantly to absorption in the stellar atmosphere,along with planetary emission due to CO. The incident stellarspectra are tailored for each planet’s parent star and orbital dis-tance, and are taken from Hauschildt et al. (1999).
Figure 14b shows ratios in the optical and near-infrared. Ashas been pointed out above, for these hot atmospheres thermalemission contributes significantly to the optical flux (Fortneyet al. 2005; Seager et al. 2005; Lopez-Morales & Seager 2007).These pM class planets will be excellent targets for red-opticalsecondary eclipse observations, as the planet-to-star flux ratioreaches �10�4. It is important to note that this optical flux isthermal emission, not scattered incident flux. For the TrES-4bmodel (red ), the vertical bar indicates that by 0.45 �m, thermalflux is already 10 times greater than reflected light. Thermal fluxdominates at all longer optical wavelengths. Even for pL class
Fig. 13.—Model P-T profiles for five planets. HAT-P-1b is likely pL class,which is the assumption here. The other four planets are pM class. Fig. 14.—Low-resolution planet-to-star flux ratios for transiting planets shown
in Fig. 13. The pM class planets, due to their high incident fluxes are warmer andthus brighter. Flux ratios may approach 10�4 in the red optical. Weak water emis-sion bands are seen in the mid-infrared for the pM class planets. The bars witharrows indicate the wavelengths at which thermal emitted flux becomes 10 timesgreater than scattered incident flux, for theHAT-P-1bmodel (black) and the TrES-3b model (red ). The pL class fluxes redward of�0.7 �m are dominated by ther-mal emission, not reflected light. The pM class fluxes redward of �0.4 �m aredominated by thermal emission.
TWO CLASSES OF HOT JUPITER ATMOSPHERES 1431No. 2, 2008
model for HAT-P-1b, thermal emission is 10 times greater thanreflected light at 0.73 �m. If one wanted to observe true ‘‘re-flected light’’ from these atmospheres, the blue spectral regionsshould be targeted. In a future work we will examine geometricalbedos and light curves for these planets to understand currentand future data from spacecraft likeMOST,Kepler, and COROT.Lopez-Morales &Seager (2007) have recently investigated pros-pects for the optical detection of thermal emission from the ‘‘veryhot Jupiters’’ in some detail and find the observations promising,even from the ground. They calculate exposure times necessaryfor detection using blackbody planet models and also those ofHubeny et al. (2003). They highlight OGLE-TR-56b and OGLE-TR-132b, the hottest planets yet detected, as the most promisingcandidates for secondary eclipse detections.
6. PLANETARY CLASSIFICATION
Previously, Sudarsky et al. (2000, 2003) examined the at-mospheres and spectra of giant planets as a function of orbitaldistance and classified these atmospheres in terms of the con-densates that may be present. The pL class that we suggest hereoverlaps the Sudarsky et al. class IV and V planets, which areboth dominated by alkali absorption. Class V planets are distin-guished by having silicate and iron clouds in the visible atmo-sphere. However, it is not yet clear what effect these clouds willhave on hot Jupiter spectra and energy balance, because particlesizes, cloud vertical distribution, and even composition (MgSiO3
vs. Mg2SiO4, which have very different optical properties) arenot known. Given that the derived P-T profiles and cloud con-densation curves for pL class atmospheres are somewhat parallel(see Fig. 2), there may be a relatively narrow region in the ir-radiation level (and TeA) where clouds are present in the visibleatmosphere, rather than down at hundreds of bars. The pM classare planets with atmospheres hotter than those considered bySudarsky et al.
Although planetary classification based on dominant conden-sates is certainly attractive, in practice this may by difficult to im-plement. Clouds are often gray scatters over broad wavelengthranges, so it may be challenging to recognize their presence anddefinitively identify the composition of a given cloud deck if oneis suspected, particularly with data extending over a limited spec-tral range. In our own solar system the visible clouds of Jupiterand Saturn are surely dominated by ammonia ice, as predicted byequilibrium chemistry condensation, but there is as yet no spec-troscopic confirmation of this widely held belief.
A planetary classification scheme based on atomic and mo-lecular absorption features may be more practical to implementand is in keeping with the tradition of basing classification di-rectly on spectral features. This practice would be analogous tothe spectral MLT(Y) classification of cool dwarf stars and browndwarfs. The T spectral type begins when methane is detected inthe near-infrared (Kirkpatrick 2005), and it has been suggestedthat the arrival of ammonia absorption in the near-infrared shoulddelineate the arrival of the Y dwarfs (Kirkpatrick 2005). Young,hot substellar objects and candidate planets directly imaged atwider separations from their parent stars have and certainly willcontinue to be classified in the standard MLT(Y) scheme (e.g.,Chauvin et al. 2005). Thus, extending this classification schemeto all planets, near and far from their parents stars, is a reasonableextension of the status quo. The letters ‘‘M’’ and ‘‘L’’ are used todesignate dwarfs at the stellar /substellar boundary according totheir spectral features, and for the planetary objects with similarspectroscopic diagnostics as M and L dwarfs, we propose to usethe spectroscopic classification letters pM and pL. Classes pTand pY would be natural extensions to cooler temperatures.
Planetary classification will surely be complex, as some plan-ets will be dominated by absorbed stellar flux, and others bytheir own thermal emission, which will yield different P-T pro-files at a given TeA. The wavelength ranges at which planets willbe most easily observed will also be a function of stellar glareand the sensitivity of future observatories. Planets that are eccen-tric will straddle two ore more classes, as suggested in Figure 1for HD 147506b and HD 17156b (see also Sudarsky et al. 2005for predictions at larger orbital separations). All of these close-inplanets will have, at a minimum of complexity, a day/night tem-perature difference that will make planetary classification difficult.Obviously, mass will be important as well, since with decreas-ing mass one eventually leaves the gas giant regime. Hansen &Barman (2007) have pointed out an interesting correlation of theknown transiting planets with Safronov number; they appear tofall into two distinct classes. This indicates that classification ofplanets surely will be complex and multidimensional. Perhapswe will eventually find that the Hansen &Barman (2007) classespossess different atmospheric abundances due to different accre-tion histories. Thus, we do not propose a detailed scheme, butrather suggest that the newly available transit data support amethod of atmospheric classification based on molecular andatomic absorption, rather than the presence or absence of partic-ular condensates.
7. DISCUSSION
7.1. TiO Chemistry Revisited
Of course, the boundary between the proposed pM andpL classes could be somewhat indistinct, as the abundance ofTiO/VO does not instantaneously drop to zero upon Ti/V con-densation. For TiO, Figure 2 shows that the mixing ratio falls bya factor of 10 at�40Y180 K after initial Ti condensation at milli-bar to bar pressures (A. S. Lee & K. Lodders 2008, in prepara-tion). The spectra of early L dwarfs show a gradual weakeningthe TiO and VO bands over progressing cooler subclasses(Kirkpatrick et al. 1999; Kirkpatrick 2005); this points to tran-sition planets with depleted but still significant levels of TiO/VOwhose atmospheric temperatures are �100Y200 K cooler thanthe curve of Ti condensation at solar metallicity. HD 209458bis probably near the warm end of this transition region, sinceHD 189733b shows no evidence for an inversion. We note thatat these same temperatures, FeH and CrH are also prominentabsorbers at wavelengths blueward of 1.3�m (Kirkpatrick 2005),before being lost to Fe and Cr solid. Whether these moleculeswill eventually help in pM and pL subtyping will depend on thequality of data available at these wavelengths.Since HD 209458b appears to have a temperature inversion
even at temperatures where the abundances of TiO is expectedto be waning significantly, for a one-dimensional day-side model,it is natural to inquire whether the abundance of TiO may differfrom the prediction from chemical equilibrium. TiO is typically themajor Ti-bearing gas at the P-T conditions where Ti-bearing con-densates are expected (Lodders 2002 see). However, TiO2 gas isnext in abundance, and other Ti-bearing gases are also present.With decreasing temperature (but before Ti condensation), the TiOgas abundance decreases because abundances of other molecularTi-bearing gases increase. The abundances of all Ti-bearing gasesdrop steeply when Ti-bearing condensates form. However, if con-densation is kinetically inhibited, theTiOgas abundanceswill dropmuch more gradually with decreasing temperatures, because theTiO is consumed only by other Ti-bearing gases, not condensates.The abundance of TiO2 gas is of interest because TiO2 gas is
a likely precursor of the TiO2-building blocks in Ti-bearing
FORTNEY ET AL.1432 Vol. 678
condensates. The net reaction TiOþ H2O ¼ TiO2 þ H2 is inde-pendent of total pressure (there are the same number of moleculeson both sides of the reaction). Under the relevant conditionshere, the oxidation of the TiO radical is fast. For example, at1750 K and 0.01 bar, oxidation of TiO to the equilibrium TiO2
gas abundance takes less than a minute. This means that TiOabundances are unlikely to be influenced by any vertical mixingprocesses in planetary or brown dwarf atmospheres, and equi-librium TiO and TiO2 abundances apply.
The formation of perovskite, CaTiO3, the expected conden-sate at total pressures <0.02 bar in a solar composition gas, re-quires reaction of TiO2 with CaO. Preliminary calculations showthat the oxidation of monatomic Ca to CaO gas proceeds on sim-ilar timescales as TiO to TiO2 oxidation. With respect to chemicalchanges by updraft mixing and quenching it must be emphasizedthat metal gas phase reactions are very fast, so that equilibriumabundances established at higher temperature regimes will quicklyreadjust to the appropriate low-temperature equilibria during up-welling. One possibility for HD 209458b, and planets at similarirradiation levels, is that TiO is only stable at the (hot) substellarpoint, but not on the rest of the day side. Another promising av-enue for further work may be additional investigation into V con-densation. As discussed in x 3.2, here we assume that VO isdepleted with TiO, although strict chemical equilibrium wouldallow abundant VO at temperatures 200 K cooler than neededfor initial Ti condensation (Lodders 2002).
At this time it would be unwise to rule out other absorbers,such as nonequilibrium gases or condensates driven by photo-chemistry, which we do not consider here. As Burrows et al.(2007b) correctly point out, it may be possible for the abundanceof a photochemically derived absorber to scale as a function ofirradiation level. Liang et al. (2004) have found that methane-derived hazes (which are present in the stratospheres of our solarsystem’s giants) would not be stable for a variety of reasons,mainly because methane is not abundant at these high temper-atures and low pressures, and haze particulate condensation isprevented. Visscher et al. (2006) also briefly investigated thephotochemistry of C- and O-dominated species in HD 209458b.Marley et al. (2007) suggest that photochemistry involving mul-tiple abundant elements, including sulfur, could be important forthese planets. Other authors (e.g., Yelle 2004) have investigatedthe photochemistry of the low-density upper atmosphere of theseplanets as well. Additional investigations in this area are surelyneeded.
7.2. Other Issues
Themodels presented here are for day-side average planetaryatmospheric structures and spectra. For pL class planets, redis-tribution of absorbed energy will likely lead to somewhat cooleratmospheres and lower fluxes than predicted here. The pM classplanetary atmospheres should be very close to a ‘‘no redistri-bution model’’ that is hottest at the substellar point and becomescooler toward the planetary limb. A no-redistribution day-side ismore luminous than a uniform dayside average (see Barman et al.2005, who computed planet-wide average, day-side average, andno-redistributionmodels of HD209458b and TrES-1). Therefore,our models are guides for understanding, and deviations from thepredictions for specific planets are expected. The pM class planetscould potentially be modestly brighter than we have shown.
To our knowledge, no models for the thermal evolution andcontraction of pM class planets have included TiO/VO opacityin their atmospheres. Instead, it has been assumed that Ti and Vhave condensed into clouds. If it is found thatWASP-1b, TrES-4b,and other pM class planets have the atmospheric properties that
we describe, this will mean that evolution models of these plan-ets will need to be recomputed with new model atmosphere grids.As shown in x 4.3, the atmospheric extension due to the hotstratospheric temperatures and strong TiO/VO opacity at opticalwavelengths could lead to larger measured radii (see also Burrowset al. 2007b).
8. CONCLUSIONS: TWO CLASSESOF HOT ATMOSPHERES
Using one-dimensional radiative-convective equilibriummodelatmospheres, we have addressed the class of atmospheres, thepM class, for which TiO and VO are extremely strong visible ab-sorbers (Hubeny et al. 2003). This absorbed incident flux drivesthese planets to have hot (�2000+ K) stratospheres. Therefore,these planets will appear very bright in the mid-infrared, withbrightness temperatures larger than their equilibrium tempera-tures. This is the case for HD 149026b (Harrington et al. 2007)andHD 209458bKnutson et al. (2008). In addition, these planetswill have large day/night temperature contrasts because radiativetime constants at photospheric pressures are much shorter thanreasonable advective timescales. The hottest point of the planetshould be the substellar point, which absorbs the most flux, lead-ing to perhaps negligible phase shift between the times of max-imum measured thermal emission and when the day side is fullyvisible. This appears to be the situation for planet � And b, ob-served by Harrington et al. (2006). Given that its irradiation levelis intermediate between HD 209458b and HD 149026b, we findthat this planet is pM class. Due to the fast radiative times, theday side of these planets may have P-T profiles that do not de-viate much from radiative equilibrium models. Although atmo-spheric dynamics will surely be vigorous, winds will be unableto advect gas before it cools to space. For these planets, high ir-radiation, the presence of gaseous TiO andVO, a hot stratosphere,the location of the hottest atmosphere at the substellar point, anda large day/night temperature contrast all go hand in hand.
On the other hand, we have shown that in the pL class, dom-inated by absorption by H2O, Na, and K, photospheric pres-sures and temperatures prevail such that advective timescalesand radiative timescales are similar (see also Seager et al. 2005).Since atmospheric dynamics will be important for the redistri-bution of energy, the consequences for the structure and thermalemission of these atmospheres will be quite complex. The ef-ficiency of energy redistribution will vary with planetary irra-diation level, surface gravity, and rotation rate. Planets of thepL class will have smaller day/night temperature contrasts andmeasurable phase shifts in thermal emission light curves thatwill be wavelength dependent. In addition, these planets mayshow variability in secondary eclipse depth (e.g., Rauscher et al.2007a). However, without a better understanding of the dynam-ics it is difficult to make detailed predictions at this time. Sec-ondary eclipse depths should range somewhere between valuesexpected for a ‘‘full redistribution’’ model and inefficient re-distribution. The published secondary eclipse data for pL classplanets TrES-1 and HD 189733b are all consistent with this pre-diction (Fortney et al. 2005; Fortney & Marley 2007). In addi-tion, the 8�m light curves for 51 Peg b andHD 209458b (Cowanet al. 2007) andHD 189733b (Knutson et al. 2007) are consistentwith this prediction as well. Examination of Figure 1 shows thatHD 179949b is a pM class planet, and indeed Cowan et al.(2007) found the largest phase variation it their small sample forthis planet, but the unknown orbital inclination makes definitiveconclusions difficult.
Additional observational results will soon help to test the mod-els presented here. We find that transiting planets WASP-1b,
TWO CLASSES OF HOT JUPITER ATMOSPHERES 1433No. 2, 2008
TrES-4b, TrES-3b, OGLE-Tr-10b, and TrES-2b will be in thepM class, along with nontransiters �And b and HD 179949. Thelow-irradiation boundary of this class is not yet clear, and planetHD 209458b shows that temperature inversions persist to irra-diation levels where TiO/VO are expected to begin being lost tocondensation (Burrows et al. 2007b). Perhaps Tio and VO arestable only at the substellar point. At still lower irradiation levels,the limited data for HD 189733b lead us to conclude it is pL class(Fortney & Marley 2007). Secondary eclipse data for XO-2b,HAT-P-1b, and WASP-2b will be important is determining howtemperature inversions (and the TiO/VO abundances) wane withirradiation level. Just as in dMand dL stars, the condensation of Tiand V is expected to be gradual process, so we fully expect tran-sition objects between the distinct pM and pL class members.
We will soon have additional information that will help shedlight on the atmosphere of HD 209458b.The 8 �m light curvefor HD 209458b obtained by Cowan et al. (2007) shows littlephase variation. However, if our theory connecting TiO/VOopac-ity and temperature inversions to large day/night contrasts is cor-rect, we expect to see a large variation. Soon H. Knutson andcollaborators will obtain half-orbit light curves for HD 209458bat 8 and 24 �m. The quality should be comparable to that ob-tained by Knutson et al. (2007) for HD 189733b and will put ourtheory to the test. HD 147506, with an eccentricity of 0.517(Bakos et al. 2007b), and HD 17156, with an eccentricity of0.67 (Fischer et al. 2007; Barbieri et al. 2007), will be extremelyinteresting cases as the flux they receive varies by factors of 9and 26, respectively, between periapse and apoapse. They shouldeach spend part of their orbits as pL class and part as pM class.This makes predictions difficult, but large day/night tempera-tures differences at apoapse are likely.
There has recently been considerable discussion on the rel-ative merits of multidimensional dynamical models and one-dimensional radiative-convective model atmospheres for these
highly irradiated planets. Both kinds of studies provide interest-ing predictions. While it could be claimed that one-dimensionalradiative-convective models are unrealistic because they ‘‘lackdynamics,’’ they do include very detailed chemistry, vast opacitydatabases, and advanced nongray radiative transfer, which alldynamics models for these planets lack. Given the large diversityin predictions among the various dynamical models, which use ahost of simplifications, the next stepwill be combining dynamicsand radiative transfer, an idea which has been mentioned or ad-vanced by a number of authors (Seager et al. 2005; Barman et al.2005; Fortney et al. 2006a; Burrows et al. 2006; Dobbs-Dixon &Lin 2008). Eventually we will be able to give up one-dimensionalf-type parameters to treat the incident flux in a more realisticfashion for these exotic atmospheres.We recently started workingtoward this goal in Fortney et al. (2006a; see also Dobbs-Dixon& Lin 2008); work continues, and we believe it has a promisingfuture. We think that the predictions we have made here with aone-dimensional model will provide a framework for under-standing the observations to come. Additional observations forboth pL and pM class planets, along with additional theoreticaland modeling efforts, should further clarify our understanding.
We thank Adam Showman for valuable discussions and forhelp with the calculation of radiative time constants. We thankDidier Saumon for providing the data files for Figure 3. JasonRowe kindly provided us with the MOST geometric albedoupper limit for HD 209458b in advance of publication. We alsothank the referee and Jason Barnes for comments that improvedthe draft. J. J. F. acknowledges the support of a Spitzer Fellowshipfrom NASA. Work by K. L. is supported by NSF grant AST 04-06963 and NASA grant NNG06GC26G. Work by M. S. M. issupported by the NASA Planetary Atmospheres Program.
REFERENCES
Ackerman, A. S., & Marley, M. S. 2001, ApJ, 556, 872Allard, F., Hauschildt, P. H., Alexander, D. R., Tamanai, A., & Schweitzer, A.2001, ApJ, 556, 357
Appleby, J. F., & Hogan, J. S. 1984, Icarus, 59, 336Bakos, G. A., et al. 2007a, ApJ, 656, 552———. 2007b, ApJ, 670, 826Baraffe, I., Chabrier, G., Barman, T. S., Allard, F., & Hauschildt, P. H. 2003,A&A, 402, 701
Barbieri, M., et al. 2007, A&A, 476, L13Barman, T. 2007, ApJ, 661, L191Barman, T. S., Hauschildt, P. H., & Allard, F. 2005, ApJ, 632, 1132Barman, T. S., Hauschildt, P. H., Schweitzer, A., Stancil, P. C., Baron, E., &Allard, F. 2002, ApJ, 569, L51
Bouchy, F., Pont, F., Santos, N. C., Melo, C., Mayor, M., Queloz, D., & Udry, S.2004, A&A, 421, L13
Bouchy, F., et al. 2005, A&A, 444, L15Brown, T. M. 2001, ApJ, 553, 1006Burrows, A., Hubeny, I., Budaj, J., & Hubbard, W. B. 2007a, ApJ, 661, 502Burrows, A., Hubeny, I., Budaj, J., Knutson, H. A., & Charbonneau, D. 2007b,ApJ, 668, L171
Burrows, A., Hubeny, I., Hubbard, W. B., Sudarsky, D., & Fortney, J. J. 2004,ApJ, 610, L53
Burrows, A., Marley, M. S., & Sharp, C. M. 2000, ApJ, 531, 438Burrows, A., & Sharp, C. M. 1999, ApJ, 512, 843Burrows, A., Sudarsky, D., & Hubbard, W. B. 2003, ApJ, 594, 545Burrows, A., Sudarsky, D., & Hubeny, I. 2006, ApJ, 650, 1140Burrows, A., et al. 1997, ApJ, 491, 856Butler, R. P., Marcy, G. W., Williams, E., Hauser, H., & Shirts, P. 1997, ApJ,474, L115
Chabrier, G., & Baraffe, I. 2007, ApJ, 661, L81Chamberlain, J. W., & Hunten, D. M. 1987, Theory of Planetary Atmospheres:An Introduction to Their Physics and Chemistry (2nd. ed.; Orlando: AcademicPress)
Charbonneau, D., Brown, T. M., Noyes, R. W., & Gilliland, R. L. 2002, ApJ,568, 377
Charbonneau, D., Winn, J. N., Everett, M. E., Latham, D. W., Holman, M. J.,Esquerdo, G. A., & O’Donovan, F. T. 2007, ApJ, 658, 1322
Charbonneau, D., et al. 2005, ApJ, 626, 523Chauvin, G., Lagrange, A.-M., Dumas, C., Zuckerman, B.,Mouillet, D., Song, I.,Beuzit, J.-L., & Lowrance, P. 2005, A&A, 438, L25
Collier Cameron, A., et al. 2007, MNRAS, 375, 951Cooper, C. S., & Showman, A. P. 2005, ApJ, 629, L45———. 2006, ApJ, 649, 1048Cowan, N. B., Agol, E., & Charbonneau, D. 2007, MNRAS, 379, 641Cushing, M. C., et al. 2008, ApJ, 678, 1372Deming, D., Harrington, J., Laughlin, G., Seager, S., Navarro, S. B., Bowman,W. C., & Horning, K. 2007, ApJ, 667, L199
Deming, D., Harrington, J., Seager, S., & Richardson, L. J. 2006, ApJ, 644, 560Deming, D., Seager, S., Richardson, L. J., & Harrington, J. 2005, Nature, 434, 740Demory, B.-O., et al. 2007, A&A, 475, 1125Dobbs-Dixon, I., & Lin, D. N. C. 2008, ApJ, 673, 513Fischer, D. A., et al. 2007, ApJ, 669, 1336Fortney, J. J. 2005, MNRAS, 364, 649Fortney, J. J., Cooper, C. S., Showman, A. P., Marley, M. S., & Freedman, R. S.2006a, ApJ, 652, 746
Fortney, J. J., & Marley, M. S. 2007, ApJ, 666, L45Fortney, J. J., Marley, M. S., Lodders, K., Saumon, D., & Freedman, R. 2005,ApJ, 627, L69
Fortney, J. J., Saumon, D., Marley, M. S., Lodders, K., & Freedman, R. S.2006b, ApJ, 642, 495
Fortney, J. J., Sudarsky, D.,Hubeny, I., Cooper, C. S.,Hubbard,W.B., Burrows, A.,& Lunine, J. I. 2003, ApJ, 589, 615
Freedman, R. S., Marley, M. S., & Lodders, K. 2008, ApJS, 174, 504Fuhrmann, K., Pfeiffer, M. J., & Bernkopf, J. 1998, A&A, 336, 942Goody, R. M., & Yung, Y. L. 1989, Atmospheric Radiation: Theoretical Basis(2nd ed.; New York: Oxford Univ. Press)
FORTNEY ET AL.1434 Vol. 678
Grillmair, C. J., Charbonneau, D., Burrows, A., Armus, L., Stauffer, J.,Meadows, V., Van Cleve, J., & Levine, D. 2007, ApJ, 658, L115
Hansen, B. M. S., & Barman, T. 2007, ApJ, 671, 861Harrington, J., Hansen, B. M., Luszcz, S. H., Seager, S., Deming, D., Menou, K.,Cho, J. Y.-K., & Richardson, L. J. 2006, Science, 314, 623
Harrington, J., Luszcz, S., Seager, S., Deming, D., & Richardson, L. J. 2007,Nature, 447, 691
Hauschildt, P. H., Allard, F., Ferguson, J., Baron, E., & Alexander, D. R. 1999,ApJ, 525, 871
Helling, C., & Woitke, P. 2006, A&A, 455, 325Hubbard, W. B., Fortney, J. J., Lunine, J. I., Burrows, A., Sudarsky, D., &Pinto, P. 2001, ApJ, 560, 413
Hubeny, I., Burrows, A., & Sudarsky, D. 2003, ApJ, 594, 1011Iro, N., Bezard, B., & Guillot, T. 2005, A&A, 436, 719Kirkpatrick, J. D. 2005, ARA&A, 43, 195Kirkpatrick, J. D., et al. 1999, ApJ, 519, 802Knutson, H. A., Charbonneau, D., Allen, L. E., Burrows, A., & Megeath, S. T.2008, ApJ, 673, 526
Knutson, H. A., et al. 2007, Nature, 447, 183Konacki, M., Torres, G., Jha, S., & Sasselov, D. D. 2003, Nature, 421, 507Kornacki, A. S., & Fegley, B. J. 1986, Earth Planet. Sci. Lett., 79, 217Langton, J., & Laughlin, G. 2007, ApJ, 657, L113Liang, M., Seager, S., Parkinson, C. D., Lee, A. Y.-T., & Yung, Y. L. 2004,ApJ, 605, L61
Lodders, K. 1999, ApJ, 519, 793———. 2002, ApJ, 577, 974———. 2003, ApJ, 591, 1220Lodders, K., & Fegley, B. 2002, Icarus, 155, 393———. 2006, Astrophysics Update 2 (Berlin: Springer, 2006)Lopez-Morales, M., & Seager, S. 2007, ApJ, 667, L191Mandushev, G., et al. 2007, ApJ, 667, L195Marley, M. S., Fortney, J., Seager, S., & Barman, T. 2007, in Protostars andPlanets V, ed. B. Reipurth, D. Jewitt, & K. Keil (Tucson: Univ. ArizonaPress), 733
Marley, M. S., & McKay, C. P. 1999, Icarus, 138, 268Marley, M. S., Saumon, D., Guillot, T., Freedman, R. S., Hubbard, W. B.,Burrows, A., & Lunine, J. I. 1996, Science, 272, 1919
Marley, M. S., Seager, S., Saumon, D., Lodders, K., Ackerman, A. S.,Freedman, R. S., & Fan, X. 2002, ApJ, 568, 335
McKay, C. P., Pollack, J. B., & Courtin, R. 1989, Icarus, 80, 23O’Donovan, F. T., et al. 2007, ApJ, 663, L37Rauscher, E., Menou, K., Cho, J. Y.-K., Seager, S., & Hansen, B. M. S. 2007a,ApJ, 662, L115
Rauscher, E.,Menou, K., Seager, S., Deming,D., Cho, J. Y.-K., &Hansen, B.M. S.2007b, ApJ, 664, 1199
Richardson, L. J., Deming, D., Horning, K., Seager, S., & Harrington, J. 2007,Nature, 445, 892
Richardson, L. J., Deming, D., & Seager, S. 2003, ApJ, 597, 581Rowe, J. F., et al. 2007, ApJ, submitted (arXiv:0711.4111)Salby,M. L. 1996, Fundamentals of Atmospheric Physics (SanDiego: AcademicPress)
Saumon, D., & Guillot, T. 2004, ApJ, 609, 1170Saumon, D., Marley, M. S., Cushing, M. C., Leggett, S. K., Roellig, T. L.,Lodders, K., & Freedman, R. S. 2006, ApJ, 647, 552
Saumon, D., et al. 2007, ApJ, 656, 1136Seager, S., Richardson, L. J., Hansen, B. M. S., Menou, K., Cho, J. Y.-K., &Deming, D. 2005, ApJ, 632, 1122
Seager, S., & Sasselov, D. D. 2000, ApJ, 537, 916Seager, S., Whitney, B. A., & Sasselov, D. D. 2000, ApJ, 540, 504Sharp, C. M., & Burrows, A. 2007, ApJS, 168, 140Showman, A. P., & Guillot, T. 2002, A&A, 385, 166Stevenson, D. J. 1985, Icarus, 62, 4Sudarsky, D., Burrows, A., & Hubeny, I. 2003, ApJ, 588, 1121Sudarsky, D., Burrows, A., Hubeny, I., & Li, A. 2005, ApJ, 627, 520Sudarsky, D., Burrows, A., & Pinto, P. 2000, ApJ, 538, 885Swain, M. R., Bouwman, J., Akeson, R., Lawler, S., & Beichman, C. 2008,ApJ, 674, 482
Tinetti, G., et al. 2007, Nature, 448, 169Toon, O. B., McKay, C. P., Ackerman, T. P., & Santhanam, K. 1989, J. Geophys.Res., 94, 16287
Visscher, C., Lodders, K., & Fegley, B. J. 2006, ApJ, 648, 1181Williams, P. K. G., Charbonneau, D., Cooper, C. S., Showman, A. P., &Fortney, J. J. 2006, ApJ, 649, 1020
Winn, J. N., et al. 2007, AJ, 134, 1707Yelle, R. V. 2004, Icarus, 170, 167
TWO CLASSES OF HOT JUPITER ATMOSPHERES 1435No. 2, 2008