a technique for frequency response identification from relay feedback
Post on 08-Dec-2016
214 views
TRANSCRIPT
122 IEEE TRANSACTIONS ON CONTROL SYSTEMS TECHNOLOGY, VOL. 7, NO. 1, JANUARY 1999
Brief Papers
A Technique for Frequency Response Identification from Relay FeedbackQing-Guo Wang, Chang-Chieh Hang, and Qiang Bi
Abstract—In this paper, a new method for process frequencyresponse identification is proposed, which can identify multiplepoints on a process frequency response from a single relayfeedback test. The process output and input responses to thetest are decomposed into the transient parts and the stationarycycle parts. These parts are then transformed to their frequencyresponses using the DFT and digital integration, respectively,to obtain the process frequency response. Real-time tests ofthe method on various processes give quite accurate processfrequency responses, especially in the important frequency rangefrom zero to the critical frequency. The testing conditions forour identification are the same as those for the step testing.The multiple points on process frequency response identified arevery useful for process modeling and controller tuning. A real-time PID controller auto-tuning experiment which employs theproposed identification method is presented to demonstrate theapplicability of our method.
Index Terms—Digital integration, FFT, frequency responses,identification, relay feedback.
I. INTRODUCTION
A STROM et al. have successfully applied the relay feed-back technique to the auto-tuning of proportional integral
derivative (PID) controllers [1]. This technique automaticallyextracts the process frequency response around an importantfrequency which is usually sufficient to tune a PID controllercrudely for a simple process. The technique is robust, time-saving, and easy to use [2]. More importantly, a relay feedbackis a closed-loop control which keeps the process close tothe set point so that the process operates in a linear regionwhere the frequency response is of interest [1]. While thestandard relay feedback method is successful in many processcontrol applications, it also faces two major problems. 1)Due to the adoption of describing function approximation,the estimation of the critical point is not accurate enoughfor some kinds processes, such as processes with large timedelays. 2) Only crude controller settings can be obtained,based on this single identified point. For better tuning of PIDcontrollers, knowledge ofmore and accurate points on theprocess frequency response curve is necessary [3]. Besides,advanced designs such as dominant pole assignment [1], gainand phase margin [4], Smith predictors [5], [6], and finitespectrum assignment [7] also make use of two or more pointson the process frequency response.
Manuscript received September 19, 1996; revised November 25, 1997.Recommended by Associate Editor, T. Ogunnaike.
The authors are with the Department of Electrical Engineering, NationalUniversity of Singapore, Singapore 119260.
Publisher Item Identifier S 1063-6536(99)00226-2.
Much research has been undertaken in identifying multiplepoints on the process frequency response. Historically, fre-quency response estimation began with the technique knownas sinusoidal transfer function analysis [8]. One major short-coming of this method is its long test time. Other identificationmethods have also reported, using step testing, pulse testing,and pseudo-random binary sequence testing. For instance, inthe previous work by Hanget al. [5], the process frequencyresponse is obtained by first removing the dc components fromthe input and output signals resulting from a step test and thenapplying the fast Fourier transform (FFT) to the remainingsignals. However, they are all open-loop methods. Within thecontext of relay testing, several modified methods have beenreported [6], [9], [10]. To identify two or more points onthe process frequency response, additional linear components(or varying hysteresis width) have to be connected into thesystem and additional relay tests have to be performed. Thesemethods are time consuming. The resulting estimations arestill approximate in nature, since they actually make repeateduse of Astrom’s method.
The process output and input logged from the relay feedbacktest cannot be directly transferred to frequency response mean-ingfully using the discrete Fourier transform (DFT). A newmultiple-point on process frequency response identificationmethod from a single relay feedback test is proposed inthis paper. The process output and input logged from therelay feedback test are decomposed into transient parts andstationary cycle parts. When permanent oscillation of thesystem is attained, the transient parts decay to zero. Thus, theircorresponding frequency response can be directly obtainedusing DFT. As for the stationary cycle parts, a digital inte-gration technique is used to obtain the frequency response ofthe stationary cycle parts. These two parts are then combinedto calculate the process frequency response.
This paper is organized as follows. In Section II, the pro-posed method is presented. Some real-time identification ex-amples are given in Section III to verify the method. Anapplication of the multiple-point identification method to aPID auto-tuner is presented in Section IV. Conclusions are inSection V.
II. THE METHOD
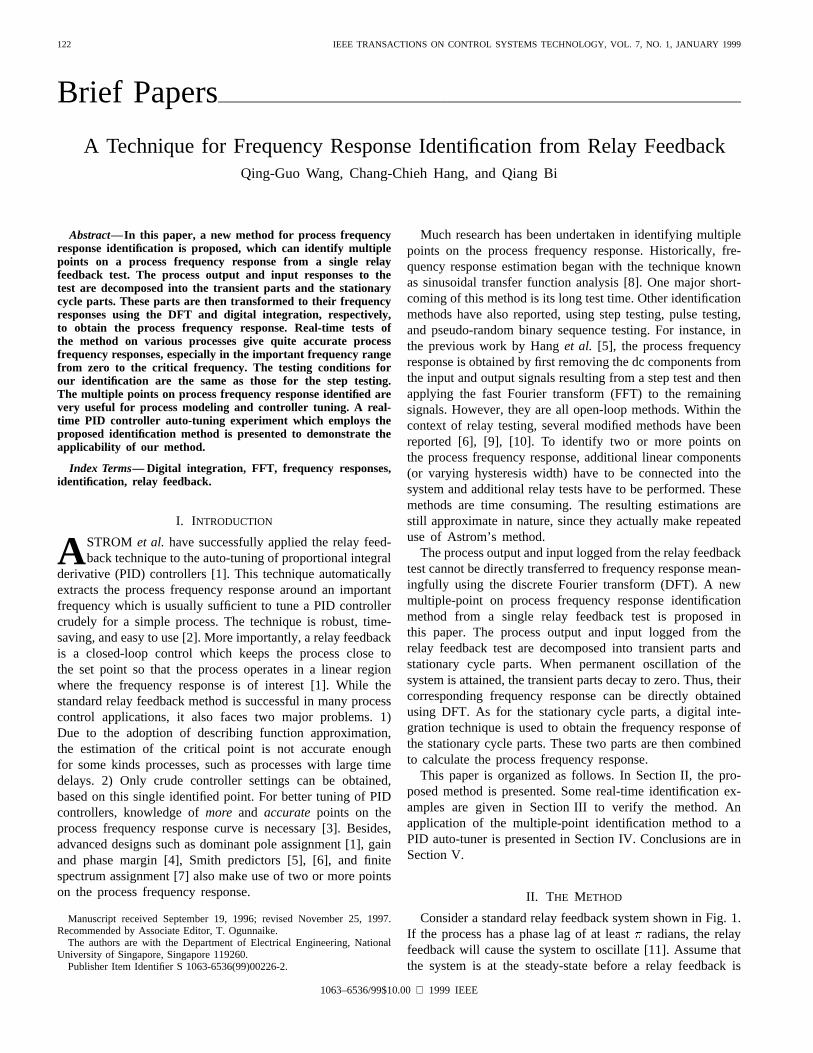
Consider a standard relay feedback system shown in Fig. 1.If the process has a phase lag of at leastradians, the relayfeedback will cause the system to oscillate [11]. Assume thatthe system is at the steady-state before a relay feedback is
1063–6536/99$10.00 1999 IEEE
IEEE TRANSACTIONS ON CONTROL SYSTEMS TECHNOLOGY, VOL. 7, NO. 1, JANUARY 1999 123
Fig. 1. Relay feedback system.
applied at . The steady-state condition is an ordinaryassumption which can also be found in other identificationschemes such as a step test. For example, the HoneywellTDC 3000 Robust PID Controller design requires a steadystate at the start of the step identification test [12]. In arelay test, the process output and input are loggeduntil the system reaches a stationary oscillation. It should benoted that and are neither periodic nor absolutelyintegrable. Hence, DFT cannot be directly applied to computethe discrete frequency response of the process correctly using
DFT DFT . To show why DFT cannot beapplied directly more clearly, or are decomposedas follows.
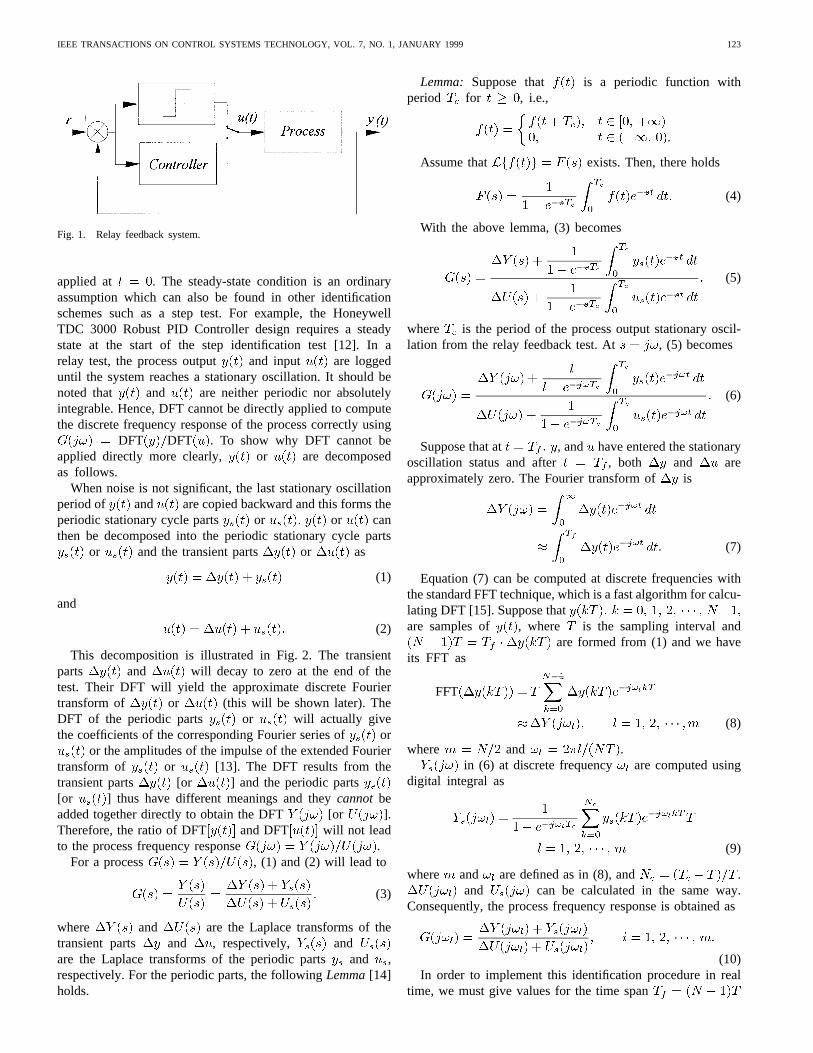
When noise is not significant, the last stationary oscillationperiod of and are copied backward and this forms theperiodic stationary cycle parts or or canthen be decomposed into the periodic stationary cycle parts
or and the transient parts or as
(1)
and
(2)
This decomposition is illustrated in Fig. 2. The transientparts and will decay to zero at the end of thetest. Their DFT will yield the approximate discrete Fouriertransform of or (this will be shown later). TheDFT of the periodic parts or will actually givethe coefficients of the corresponding Fourier series of or
or the amplitudes of the impulse of the extended Fouriertransform of or [13]. The DFT results from thetransient parts [or ] and the periodic parts[or ] thus have different meanings and theycannot beadded together directly to obtain the DFT [or ].Therefore, the ratio of DFT and DFT will not leadto the process frequency response .
For a process , (1) and (2) will lead to
(3)
where and are the Laplace transforms of thetransient parts and , respectively, andare the Laplace transforms of the periodic partsand ,respectively. For the periodic parts, the followingLemma[14]holds.
Lemma: Suppose that is a periodic function withperiod for , i.e.,
.
Assume that exists. Then, there holds
(4)
With the above lemma, (3) becomes
(5)
where is the period of the process output stationary oscil-lation from the relay feedback test. At , (5) becomes
(6)
Suppose that at , and have entered the stationaryoscillation status and after , both and areapproximately zero. The Fourier transform of is
(7)
Equation (7) can be computed at discrete frequencies withthe standard FFT technique, which is a fast algorithm for calcu-lating DFT [15]. Suppose thatare samples of , where is the sampling interval and
are formed from (1) and we haveits FFT as
FFT
(8)
where and .in (6) at discrete frequency are computed using
digital integral as
(9)
where and are defined as in (8), and .and can be calculated in the same way.
Consequently, the process frequency response is obtained as
(10)In order to implement this identification procedure in real
time, we must give values for the time span
124 IEEE TRANSACTIONS ON CONTROL SYSTEMS TECHNOLOGY, VOL. 7, NO. 1, JANUARY 1999
Fig. 2. Signals under relay feedback.
required in the FFT computations (8). It turns out thatoris related to the number of frequency response points to be
identified. Suppose that the number of the frequency responsepoints to be identified from zero frequency to phase-crossoverfrequency is , where should be specified by the user.It follows from (8) that the frequency response pointsrecovered by the FFT method are at the discrete frequencies
whereis the frequency increment. The definition of means
that , thus
(11)
On the other hand, one can measure the oscillation periodon line when a relay test is performed andcan be estimated[11] as
(12)
Equations (11) and (12) yield
(13)
where should be specifieda priori and should be largeenough to ensure that the stationary oscillation is reached. Thecorresponding time span is then
Different identification methods are more or less sensitive tonoise. It is apparent that in almost any identification methods,a large signal to noise ratio is desirable [16]. As to themeasurement noise in the relay test, Astrom and Hagglund[11] pointed out that a hysteresis in the relay is a simpleway to reduce the influence of the measurement noise. Thewidth of hysteresis should be bigger than the noise band [1]and is usually chosen as two times larger than the noise band[17]. Filtering is another possibility [11]. The measurementnoise is usually of high frequency while the process frequencyresponse of interest for control analysis and design is usually inthe low-frequency region. In particular, the process frequency
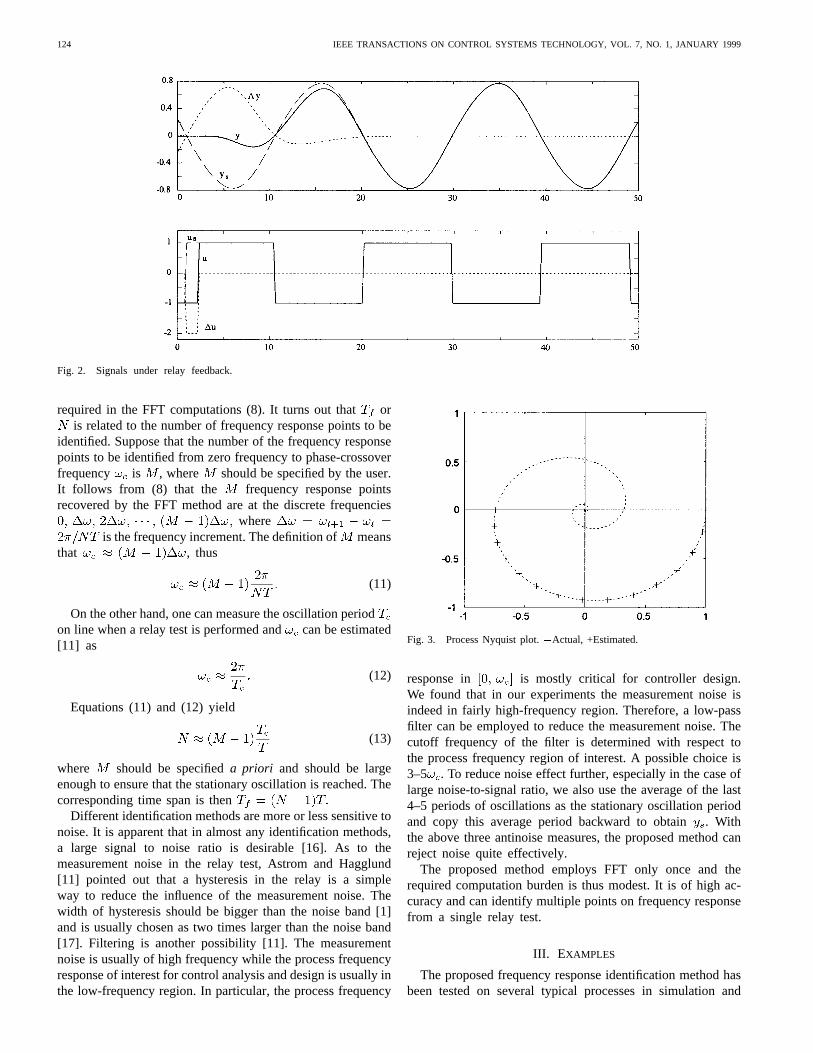
Fig. 3. Process Nyquist plot.�Actual, +Estimated.
response in is mostly critical for controller design.We found that in our experiments the measurement noise isindeed in fairly high-frequency region. Therefore, a low-passfilter can be employed to reduce the measurement noise. Thecutoff frequency of the filter is determined with respect tothe process frequency region of interest. A possible choice is3–5 . To reduce noise effect further, especially in the case oflarge noise-to-signal ratio, we also use the average of the last4–5 periods of oscillations as the stationary oscillation periodand copy this average period backward to obtain. Withthe above three antinoise measures, the proposed method canreject noise quite effectively.
The proposed method employs FFT only once and therequired computation burden is thus modest. It is of high ac-curacy and can identify multiple points on frequency responsefrom a single relay test.
III. EXAMPLES
The proposed frequency response identification method hasbeen tested on several typical processes in simulation and
IEEE TRANSACTIONS ON CONTROL SYSTEMS TECHNOLOGY, VOL. 7, NO. 1, JANUARY 1999 125
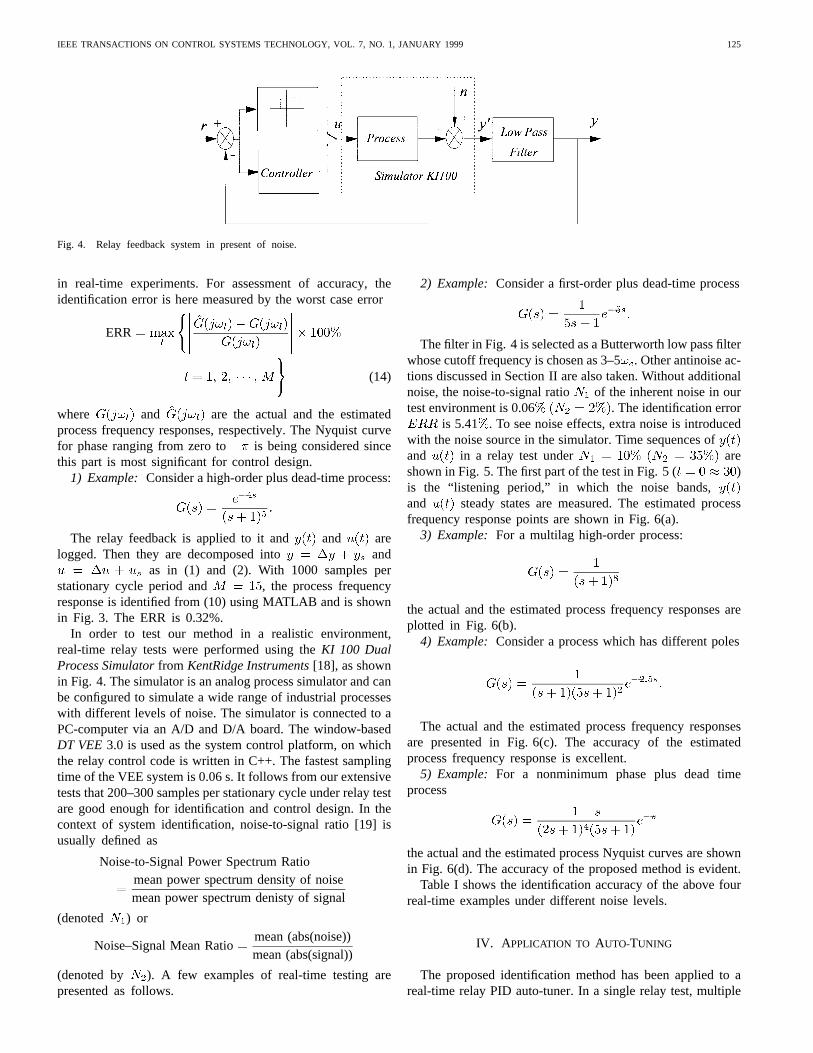
Fig. 4. Relay feedback system in present of noise.
in real-time experiments. For assessment of accuracy, theidentification error is here measured by the worst case error
ERR
(14)
where and are the actual and the estimatedprocess frequency responses, respectively. The Nyquist curvefor phase ranging from zero to is being considered sincethis part is most significant for control design.
1) Example: Consider a high-order plus dead-time process:
The relay feedback is applied to it and and arelogged. Then they are decomposed into and
as in (1) and (2). With 1000 samples perstationary cycle period and , the process frequencyresponse is identified from (10) using MATLAB and is shownin Fig. 3. The ERR is 0.32%.
In order to test our method in a realistic environment,real-time relay tests were performed using theKI 100 DualProcess Simulatorfrom KentRidge Instruments[18], as shownin Fig. 4. The simulator is an analog process simulator and canbe configured to simulate a wide range of industrial processeswith different levels of noise. The simulator is connected to aPC-computer via an A/D and D/A board. The window-basedDT VEE3.0 is used as the system control platform, on whichthe relay control code is written in C++. The fastest samplingtime of the VEE system is 0.06 s. It follows from our extensivetests that 200–300 samples per stationary cycle under relay testare good enough for identification and control design. In thecontext of system identification, noise-to-signal ratio [19] isusually defined as
Noise-to-Signal Power Spectrum Ratiomean power spectrum density of noisemean power spectrum denisty of signal
(denoted ) or
Noise–Signal Mean Ratiomean (abs(noise))mean (abs(signal))
(denoted by ). A few examples of real-time testing arepresented as follows.
2) Example: Consider a first-order plus dead-time process
The filter in Fig. 4 is selected as a Butterworth low pass filterwhose cutoff frequency is chosen as 3–5. Other antinoise ac-tions discussed in Section II are also taken. Without additionalnoise, the noise-to-signal ratio of the inherent noise in ourtest environment is 0.06 . The identification error
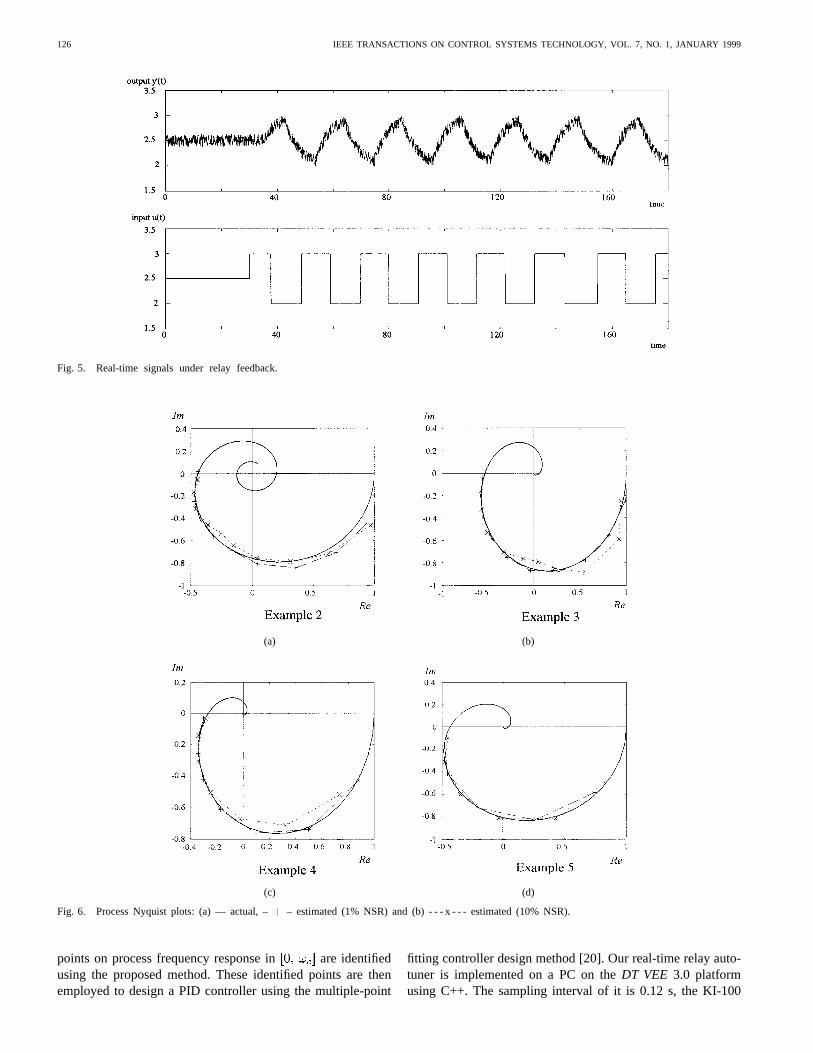
is 5.41 . To see noise effects, extra noise is introducedwith the noise source in the simulator. Time sequences ofand in a relay test under areshown in Fig. 5. The first part of the test in Fig. 5 ( )is the “listening period,” in which the noise bands,and steady states are measured. The estimated processfrequency response points are shown in Fig. 6(a).
3) Example: For a multilag high-order process:
the actual and the estimated process frequency responses areplotted in Fig. 6(b).
4) Example: Consider a process which has different poles
The actual and the estimated process frequency responsesare presented in Fig. 6(c). The accuracy of the estimatedprocess frequency response is excellent.
5) Example: For a nonminimum phase plus dead timeprocess
the actual and the estimated process Nyquist curves are shownin Fig. 6(d). The accuracy of the proposed method is evident.
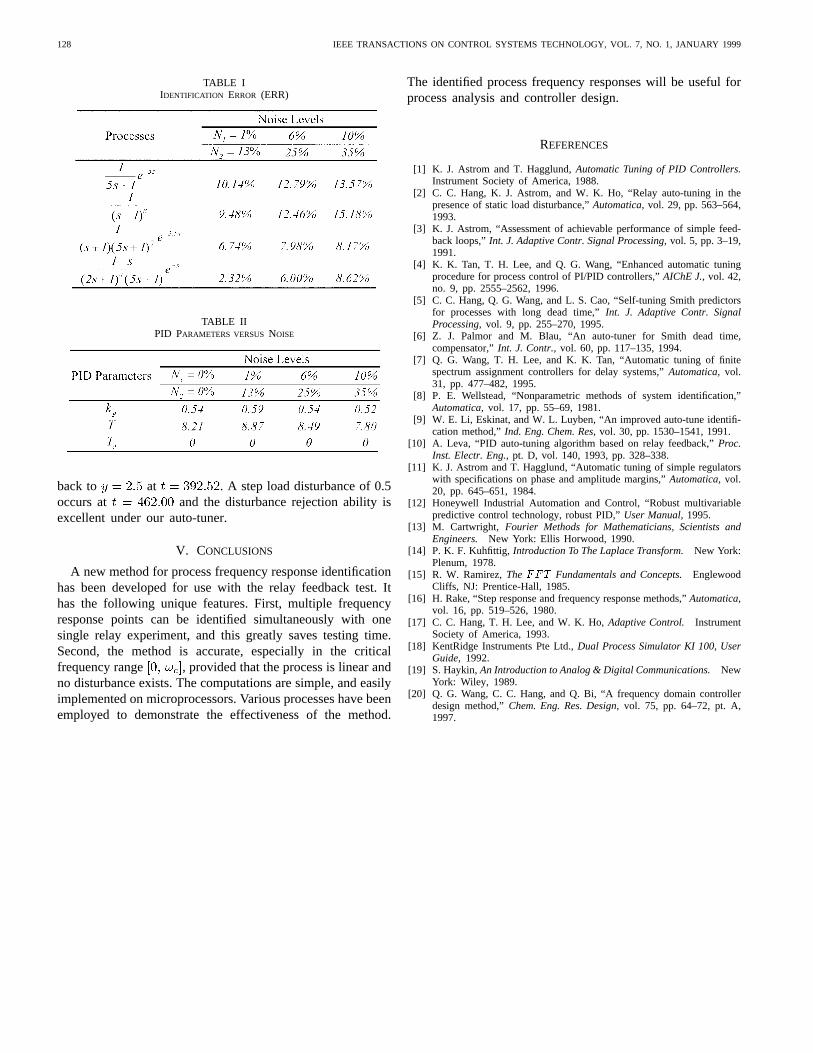
Table I shows the identification accuracy of the above fourreal-time examples under different noise levels.
IV. A PPLICATION TO AUTO-TUNING
The proposed identification method has been applied to areal-time relay PID auto-tuner. In a single relay test, multiple
126 IEEE TRANSACTIONS ON CONTROL SYSTEMS TECHNOLOGY, VOL. 7, NO. 1, JANUARY 1999
Fig. 5. Real-time signals under relay feedback.
(a) (b)
(c) (d)
Fig. 6. Process Nyquist plots: (a) — actual, –+ – estimated (1% NSR) and (b)- - - x - - - estimated (10% NSR).
points on process frequency response in are identifiedusing the proposed method. These identified points are thenemployed to design a PID controller using the multiple-point
fitting controller design method [20]. Our real-time relay auto-tuner is implemented on a PC on theDT VEE 3.0 platformusing C++. The sampling interval of it is 0.12 s, the KI-100
IEEE TRANSACTIONS ON CONTROL SYSTEMS TECHNOLOGY, VOL. 7, NO. 1, JANUARY 1999 127
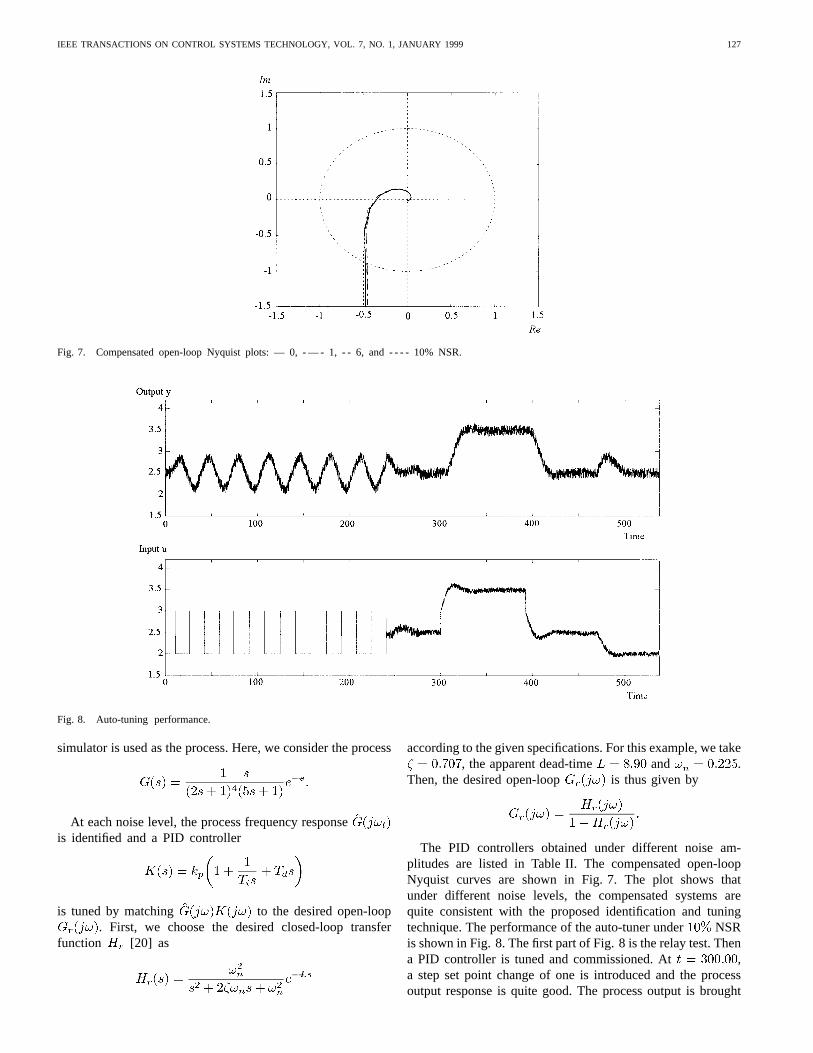
Fig. 7. Compensated open-loop Nyquist plots: — 0, - — - 1, - - 6, and - - - - 10% NSR.
Fig. 8. Auto-tuning performance.
simulator is used as the process. Here, we consider the process
At each noise level, the process frequency responseis identified and a PID controller
is tuned by matching to the desired open-loop. First, we choose the desired closed-loop transfer
function [20] as
according to the given specifications. For this example, we take, the apparent dead-time and .
Then, the desired open-loop is thus given by
The PID controllers obtained under different noise am-plitudes are listed in Table II. The compensated open-loopNyquist curves are shown in Fig. 7. The plot shows thatunder different noise levels, the compensated systems arequite consistent with the proposed identification and tuningtechnique. The performance of the auto-tuner under NSRis shown in Fig. 8. The first part of Fig. 8 is the relay test. Thena PID controller is tuned and commissioned. At ,a step set point change of one is introduced and the processoutput response is quite good. The process output is brought
128 IEEE TRANSACTIONS ON CONTROL SYSTEMS TECHNOLOGY, VOL. 7, NO. 1, JANUARY 1999
TABLE IIDENTIFICATION ERROR (ERR)
TABLE IIPID PARAMETERS VERSUSNOISE
back to at . A step load disturbance of 0.5occurs at and the disturbance rejection ability isexcellent under our auto-tuner.
V. CONCLUSIONS
A new method for process frequency response identificationhas been developed for use with the relay feedback test. Ithas the following unique features. First, multiple frequencyresponse points can be identified simultaneously with onesingle relay experiment, and this greatly saves testing time.Second, the method is accurate, especially in the criticalfrequency range , provided that the process is linear andno disturbance exists. The computations are simple, and easilyimplemented on microprocessors. Various processes have beenemployed to demonstrate the effectiveness of the method.
The identified process frequency responses will be useful forprocess analysis and controller design.
REFERENCES
[1] K. J. Astrom and T. Hagglund,Automatic Tuning of PID Controllers.Instrument Society of America, 1988.
[2] C. C. Hang, K. J. Astrom, and W. K. Ho, “Relay auto-tuning in thepresence of static load disturbance,”Automatica,vol. 29, pp. 563–564,1993.
[3] K. J. Astrom, “Assessment of achievable performance of simple feed-back loops,”Int. J. Adaptive Contr. Signal Processing,vol. 5, pp. 3–19,1991.
[4] K. K. Tan, T. H. Lee, and Q. G. Wang, “Enhanced automatic tuningprocedure for process control of PI/PID controllers,”AIChE J.,vol. 42,no. 9, pp. 2555–2562, 1996.
[5] C. C. Hang, Q. G. Wang, and L. S. Cao, “Self-tuning Smith predictorsfor processes with long dead time,”Int. J. Adaptive Contr. SignalProcessing,vol. 9, pp. 255–270, 1995.
[6] Z. J. Palmor and M. Blau, “An auto-tuner for Smith dead time,compensator,”Int. J. Contr.,vol. 60, pp. 117–135, 1994.
[7] Q. G. Wang, T. H. Lee, and K. K. Tan, “Automatic tuning of finitespectrum assignment controllers for delay systems,”Automatica,vol.31, pp. 477–482, 1995.
[8] P. E. Wellstead, “Nonparametric methods of system identification,”Automatica,vol. 17, pp. 55–69, 1981.
[9] W. E. Li, Eskinat, and W. L. Luyben, “An improved auto-tune identifi-cation method,”Ind. Eng. Chem. Res,vol. 30, pp. 1530–1541, 1991.
[10] A. Leva, “PID auto-tuning algorithm based on relay feedback,”Proc.Inst. Electr. Eng.,pt. D, vol. 140, 1993, pp. 328–338.
[11] K. J. Astrom and T. Hagglund, “Automatic tuning of simple regulatorswith specifications on phase and amplitude margins,”Automatica,vol.20, pp. 645–651, 1984.
[12] Honeywell Industrial Automation and Control, “Robust multivariablepredictive control technology, robust PID,”User Manual,1995.
[13] M. Cartwright, Fourier Methods for Mathematicians, Scientists andEngineers. New York: Ellis Horwood, 1990.
[14] P. K. F. Kuhfittig,Introduction To The Laplace Transform.New York:Plenum, 1978.
[15] R. W. Ramirez,TheFFT Fundamentals and Concepts.EnglewoodCliffs, NJ: Prentice-Hall, 1985.
[16] H. Rake, “Step response and frequency response methods,”Automatica,vol. 16, pp. 519–526, 1980.
[17] C. C. Hang, T. H. Lee, and W. K. Ho,Adaptive Control. InstrumentSociety of America, 1993.
[18] KentRidge Instruments Pte Ltd.,Dual Process Simulator KI 100, UserGuide, 1992.
[19] S. Haykin,An Introduction to Analog & Digital Communications.NewYork: Wiley, 1989.
[20] Q. G. Wang, C. C. Hang, and Q. Bi, “A frequency domain controllerdesign method,”Chem. Eng. Res. Design,vol. 75, pp. 64–72, pt. A,1997.