a t o graphy&s journal of chromatography of chromatography separation ... predisposition to...
TRANSCRIPT
Open Access
Ardente, et al., J Chromatogr Sep Tech 2016, 7:5DOI: 10.4172/2157-7064.1000334
Research Article Open Access
Journal of Chromatography Separation Techniques
Journal o
f Chr
omato
graphy & Separation Techniques
ISSN: 2157-7064
Volume 7 • Issue 5 • 1000334J Chromatogr Sep Tech, an open access journalISSN: 2157-7064
A Targeted Metabolomics Assay to Measure Eight Purines in the Diet of Common Bottlenose Dolphins, Tursiops truncatusArdente AJ1, Garrett TJ2, Wells RS1,3, Walsh M1, Smith CR4, Colee J5 and Hill RC*1College of Veterinary Medicine, University of Florida, Gainesville, FL, USA2Southeast Center for Integrated Metabolomics, Mass Spectrometry Core Laboratory, University of Florida, Gainesville, FL, USA3Chicago Zoological Society’s Sarasota Dolphin Research Program, C/O Mote Marine Laboratory, Sarasota, FL, USA4National Marine Mammal Foundation, San Diego, CA, USA5Department of Statistics, Institute of Food and Agricultural Sciences, University of Florida, Gainesville, FL, USA
*Corresponding author: Hill RC, Small Animal Clinical Sciences, College of Veterinary Medicine, University of Florida, 2015 SW 16th Ave., Gainesville, FL 32608, USA, Tel: +13523922235; E-mail: [email protected]
Received August 29, 2016; Accepted September 12, 2016; Published September 19, 2016
Citation: Ardente AJ, Garrett TJ, Wells RS, Walsh M, Smith CR, et al. (2016) A Targeted Metabolomics Assay to Measure Eight Purines in the Diet of Common Bottlenose Dolphins, Tursiops truncatus. J Chromatogr Sep Tech 7: 334. doi: 10.4172/2157-7064.1000334
Copyright: © 2016 Ardente AJ, et al. This is an open-access article distributed under the terms of the Creative Commons Attribution License, which permits unrestricted use, distribution, and reproduction in any medium, provided the original author and source are credited.
AbstractBottlenose dolphins managed under human care, human beings and Dalmatian dogs are prone to forming
urate uroliths. Limiting dietary purine intake limits urate urolith formation in people and dogs because purines are metabolized to uric acid, which is excreted in urine. Managed dolphins develop ammonium urate nephroliths, whereas free-ranging dolphins do not. Free-ranging dolphins consume live fish, whereas managed dolphins consume different species that have been stored frozen and thawed. Differences in the purine content of fish consumed by dolphins under human care versus in the wild may be responsible for the difference in urolith prevalence. Commercially available purine assays measure only four purines, but reported changes in purines during frozen storage suggest that a wider range of metabolites should be measured when comparing fresh and stored fish. A method using high performance liquid chromatography with tandem mass spectrometry was developed to quantify eight purine metabolites in whole fish and squid commonly consumed by dolphins. The coefficient of variation within and among days was sometimes high for purines present in small amounts but was acceptable (≤ 25%) for guanine, hypoxanthine, and inosine, which were present in high concentrations. This expanded assay identified a total purine content up to 2.5 times greater than the total that would be quantified if only four purines were measured. Assuming additional purines are absorbed, these results suggest that additional purine metabolites should be measured to better understand the associated risk when fish or other purine-rich foods are consumed by people or animals prone to developing uroliths.
Keywords: Kidney stones; LC-MS/MS; IMP; Inosine; Hypoxanthine; Urate; Uric acid; Fish; Purines
AbbreviationsDNA: Deoxyribonucleic acid; RNA: Ribonucleic acid; ATP:
Adenine triphosphate; GTP: Guanine triphosphate; AMP: Adenine 5’-monophosphate; IMP: Inosine 5’-monophosphate; LC: Liquid chromatography; HPLC: High performance liquid chromatography; MS/MS: Tandem mass spectrometry; HESI: Heated electrospray ionization; NH4: Ammonium; NH4OH: Ammonium hydroxide; MS 222: Tricaine methanesulfonate; TP4: Total purine four metabolite assay; TP8: Total purine eight metabolite assay.
IntroductionPurines contribute to the structure of deoxyribonucleic acid
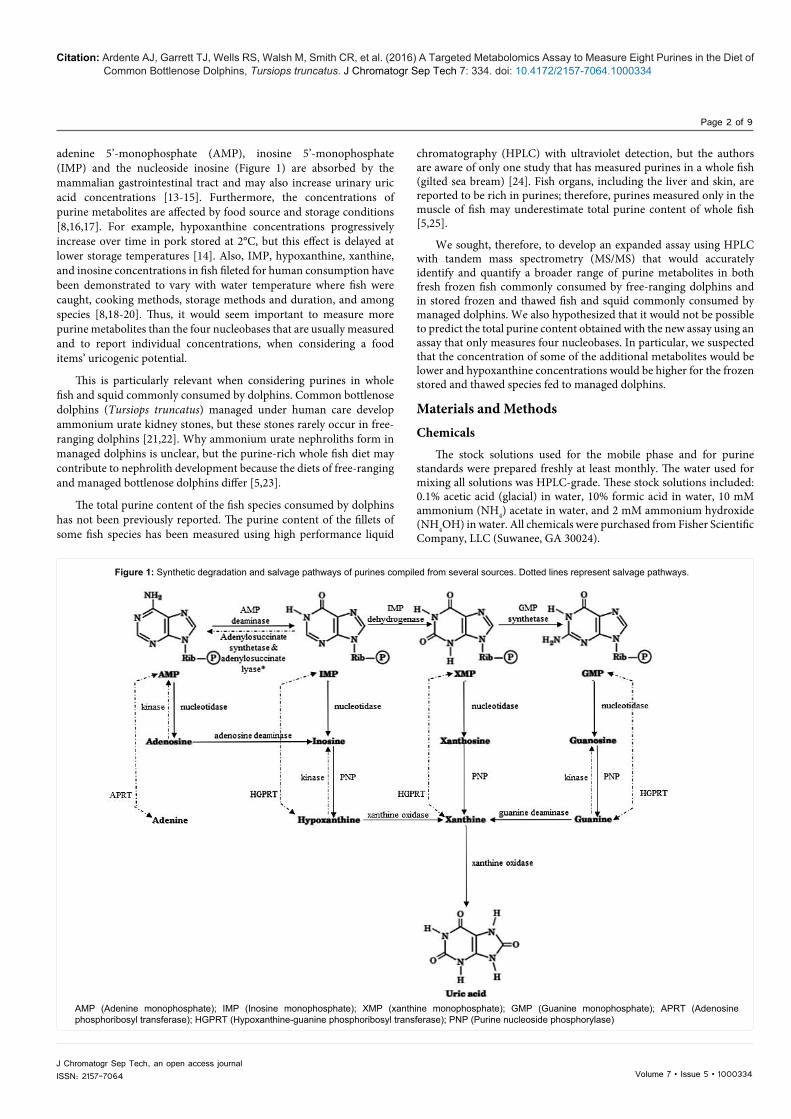
(DNA) and ribonucleic acid (RNA), adenine triphosphate (ATP) and guanine triphosphate (GTP). Purines are made by the body, salvaged and recycled, or absorbed from food. They are metabolized to uric acid, which is excreted in the urine (Figure 1) [1-4].
Dietary purines are found in high concentrations in organ meat and seafood [1,5]. Consumption of a purine-rich diet increases the production and excretion of uric acid. When the concentration of uric acid in the urine reaches a threshold, uric acid precipitates out of solution and can aggregate to form urate-based stones in the urinary tract. These urate uroliths can be composed of uric acid, ammonium urate, monosodium urate, sodium calcium urate, or potassium urate. Human beings primarily develop uric acid uroliths, and the prevalence of these uroliths has increased internationally as a consequence of increased consumption of meat [6,7]. Individuals living in Taiwan, for example, experience a high occurrence of uric acid stones as a consequence of consuming purine-rich diets that include seafood
and specifically grass shrimp [8]. Some Dalmatian dogs have a genetic predisposition to develop ammonium urate uroliths because of altered purine metabolism. For both species, consumption of a purine-restricted diet minimizes uric acid excretion and the risk of forming urate uroliths.
Foods are currently classified according to their total purine content, defined as the sum of the four nucleobases, adenine, guanine, hypoxanthine, and xanthine [1,8]. However, individual metabolites have different propensities for causing hyperuricosuria and individual metabolite concentrations may vary widely among purine-rich foods [9-12]. Human beings, for example, fed a diet supplemented with adenine and hypoxanthine excreted greater urinary uric acid concentrations than when fed a diet supplemented with guanine and xanthine [13]. Thus, it may be more important to describe the individual purine metabolite composition of food rather than total purine content, when determining a food’s uricogenic potential.
It also may not be sufficient to describe just the nucleobase content of foods. Additional metabolites, including nucleotides
Citation: Ardente AJ, Garrett TJ, Wells RS, Walsh M, Smith CR, et al. (2016) A Targeted Metabolomics Assay to Measure Eight Purines in the Diet of Common Bottlenose Dolphins, Tursiops truncatus. J Chromatogr Sep Tech 7: 334. doi: 10.4172/2157-7064.1000334
Page 2 of 9
Volume 7 • Issue 5 • 1000334J Chromatogr Sep Tech, an open access journalISSN: 2157-7064
adenine 5’-monophosphate (AMP), inosine 5’-monophosphate (IMP) and the nucleoside inosine (Figure 1) are absorbed by the mammalian gastrointestinal tract and may also increase urinary uric acid concentrations [13-15]. Furthermore, the concentrations of purine metabolites are affected by food source and storage conditions [8,16,17]. For example, hypoxanthine concentrations progressively increase over time in pork stored at 2°C, but this effect is delayed at lower storage temperatures [14]. Also, IMP, hypoxanthine, xanthine, and inosine concentrations in fish fileted for human consumption have been demonstrated to vary with water temperature where fish were caught, cooking methods, storage methods and duration, and among species [8,18-20]. Thus, it would seem important to measure more purine metabolites than the four nucleobases that are usually measured and to report individual concentrations, when considering a food items’ uricogenic potential.
This is particularly relevant when considering purines in whole fish and squid commonly consumed by dolphins. Common bottlenose dolphins (Tursiops truncatus) managed under human care develop ammonium urate kidney stones, but these stones rarely occur in free-ranging dolphins [21,22]. Why ammonium urate nephroliths form in managed dolphins is unclear, but the purine-rich whole fish diet may contribute to nephrolith development because the diets of free-ranging and managed bottlenose dolphins differ [5,23].
The total purine content of the fish species consumed by dolphins has not been previously reported. The purine content of the fillets of some fish species has been measured using high performance liquid
chromatography (HPLC) with ultraviolet detection, but the authors are aware of only one study that has measured purines in a whole fish (gilted sea bream) [24]. Fish organs, including the liver and skin, are reported to be rich in purines; therefore, purines measured only in the muscle of fish may underestimate total purine content of whole fish [5,25].
We sought, therefore, to develop an expanded assay using HPLC with tandem mass spectrometry (MS/MS) that would accurately identify and quantify a broader range of purine metabolites in both fresh frozen fish commonly consumed by free-ranging dolphins and in stored frozen and thawed fish and squid commonly consumed by managed dolphins. We also hypothesized that it would not be possible to predict the total purine content obtained with the new assay using an assay that only measures four nucleobases. In particular, we suspected that the concentration of some of the additional metabolites would be lower and hypoxanthine concentrations would be higher for the frozen stored and thawed species fed to managed dolphins.
Materials and MethodsChemicals
The stock solutions used for the mobile phase and for purine standards were prepared freshly at least monthly. The water used for mixing all solutions was HPLC-grade. These stock solutions included: 0.1% acetic acid (glacial) in water, 10% formic acid in water, 10 mM ammonium (NH4) acetate in water, and 2 mM ammonium hydroxide (NH4OH) in water. All chemicals were purchased from Fisher Scientific Company, LLC (Suwanee, GA 30024).
AMP (Adenine monophosphate); IMP (Inosine monophosphate); XMP (xanthine monophosphate); GMP (Guanine monophosphate); APRT (Adenosine phosphoribosyl transferase); HGPRT (Hypoxanthine-guanine phosphoribosyl transferase); PNP (Purine nucleoside phosphorylase)
Figure 1: Synthetic degradation and salvage pathways of purines compiled from several sources. Dotted lines represent salvage pathways.
Citation: Ardente AJ, Garrett TJ, Wells RS, Walsh M, Smith CR, et al. (2016) A Targeted Metabolomics Assay to Measure Eight Purines in the Diet of Common Bottlenose Dolphins, Tursiops truncatus. J Chromatogr Sep Tech 7: 334. doi: 10.4172/2157-7064.1000334
Page 3 of 9
Volume 7 • Issue 5 • 1000334J Chromatogr Sep Tech, an open access journalISSN: 2157-7064
222, Western Chemical, Ferndale, WA 98248) in sea water [29,30]. Death was confirmed by cessation of opercula movement for 10 minutes, and then fish were weighed, length was measured, and samples of fish were individually bagged, placed into a cooler of dry ice and transported to the UF nutrition laboratory where fish were stored at -80°C until further processing.
Boxes containing six fish species and one species of squid (‘managed species’) commonly fed to dolphins were supplied by two facilities where bottlenose dolphins are managed under human care (Table 2). Fish and squid were caught during one commercial fishing season, frozen stored at -18°C for 6 to 9 months, and then shipped overnight on dry ice from the dolphin management facilities to UF. Upon arrival, fish were stored at -20°C until further processing.
Five separate samples of each species were analyzed. To provide sufficient material to perform all the analyses on every sample, a minimum of 2 individual fish (or squid) were included in each sample; however, the number of individual fish (or squid) included in each sample varied depending on the size of the species so that each sample of smaller species contained more individuals than samples of large species. The five samples of each species were individually ground using commercial meat grinders with 4.5 and 10 mm plates (Biro 6642, Marblehead, OH 43440, and 1.5 HP, LEM Products, West Chester, OH 45011).
Free-ranging fish species were thawed the minimum amount needed to allow grinding, whereas managed diet fish species were thawed more completely using the standard operating procedure of one dolphin management facility. Free-ranging fish species were air thawed in a temperature controlled cold room (11-12°C) for approximately 1 hr., until fish thawed to a firm, slightly malleable texture. Managed diet fish were removed from the cardboard boxes, maintained wrapped in plastic, and air thawed in the cold room for approximately 20 hrs. Fish were then removed from the plastic and rinsed with cold water (approximately 16°C). Both minimally and well-thawed fish were then transported to the grinder in a cooler containing
Individual standard solutions were freshly prepared before each run. Purine metabolite solubility is highly pH dependent. Thus, AMP, IMP, adenine, and inosine were dissolved in 10 mM NH4CH3CO2 (pH 6.5), whereas uric acid and xanthine were dissolved individually and hypoxanthine and guanine were dissolved together in 2 mM NH4OH (pH 12, Sigma-Aldrich, St. Louis, MO). Each solution was then sonicated in a heated (35°C) water bath for 10-15 minutes to achieve complete dissolution. The individual standard purine solutions in NH4CH3CO2 were combined to generate one mixed standard solution with final concentrations of 0.01 mM for adenine, 0.02 mM for IMP, 0.05 mM for AMP, and 0.15 mM for inosine. Individual standard solutions dissolved in NH4OH were also combined to generate another mixed standard solution with final concentrations of hypoxanthine and guanine at 0.23 mM, xanthine at 0.22 mM, and uric acid at 0.01 mM. An internal standard, 15N2-xanthine (Cambridge Isotopes Laboratory, Inc., Tewksbury, MA 01876), was mixed with 2 mM NH4OH to achieve a concentration of 1.3 mM. The final concentrations of the individual metabolites in the combined solutions were half their original starting concentration.
Fish sampling and processing
Fish samples were collected by the Chicago Zoological Society’s Sarasota Dolphin Research Program under the Mote Marine Laboratory and University of Florida (UF) Institutional Animal Care and Use Committee approvals.
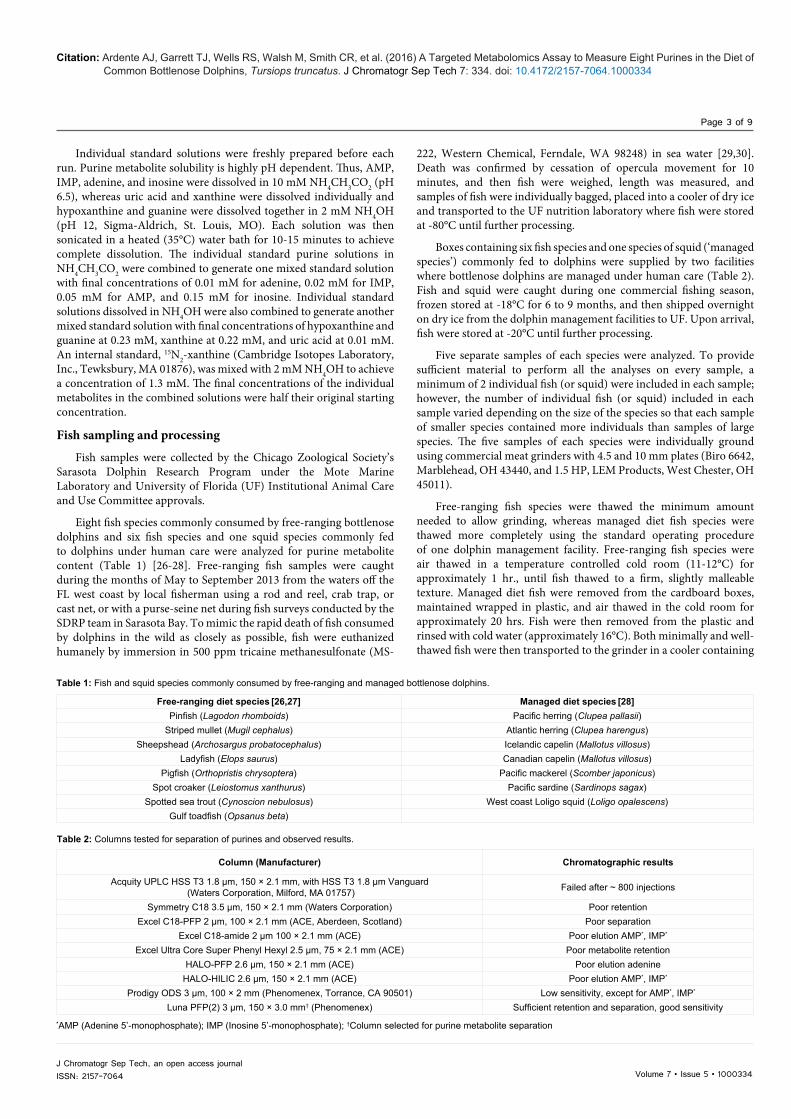
Eight fish species commonly consumed by free-ranging bottlenose dolphins and six fish species and one squid species commonly fed to dolphins under human care were analyzed for purine metabolite content (Table 1) [26-28]. Free-ranging fish samples were caught during the months of May to September 2013 from the waters off the FL west coast by local fisherman using a rod and reel, crab trap, or cast net, or with a purse-seine net during fish surveys conducted by the SDRP team in Sarasota Bay. To mimic the rapid death of fish consumed by dolphins in the wild as closely as possible, fish were euthanized humanely by immersion in 500 ppm tricaine methanesulfonate (MS-
Free-ranging diet species [26,27] Managed diet species [28]Pinfish (Lagodon rhomboids) Pacific herring (Clupea pallasii)
Striped mullet (Mugil cephalus) Atlantic herring (Clupea harengus)Sheepshead (Archosargus probatocephalus) Icelandic capelin (Mallotus villosus)
Ladyfish (Elops saurus) Canadian capelin (Mallotus villosus)Pigfish (Orthopristis chrysoptera) Pacific mackerel (Scomber japonicus)
Spot croaker (Leiostomus xanthurus) Pacific sardine (Sardinops sagax)Spotted sea trout (Cynoscion nebulosus) West coast Loligo squid (Loligo opalescens)
Gulf toadfish (Opsanus beta)
Table 1: Fish and squid species commonly consumed by free-ranging and managed bottlenose dolphins.
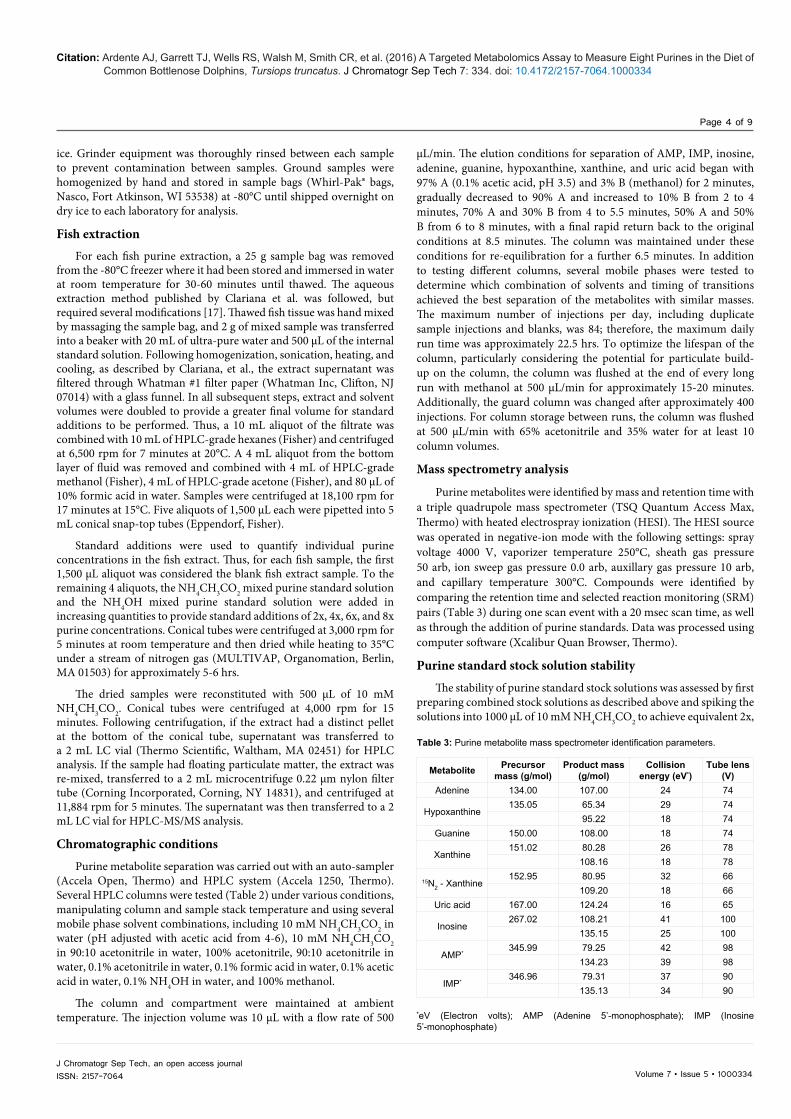
Column (Manufacturer) Chromatographic results
Acquity UPLC HSS T3 1.8 μm, 150 × 2.1 mm, with HSS T3 1.8 μm Vanguard (Waters Corporation, Milford, MA 01757) Failed after ~ 800 injections
Symmetry C18 3.5 μm, 150 × 2.1 mm (Waters Corporation) Poor retentionExcel C18-PFP 2 μm, 100 × 2.1 mm (ACE, Aberdeen, Scotland) Poor separation
Excel C18-amide 2 μm 100 × 2.1 mm (ACE) Poor elution AMP*, IMP*
Excel Ultra Core Super Phenyl Hexyl 2.5 μm, 75 × 2.1 mm (ACE) Poor metabolite retentionHALO-PFP 2.6 μm, 150 × 2.1 mm (ACE) Poor elution adenine
HALO-HILIC 2.6 μm, 150 × 2.1 mm (ACE) Poor elution AMP*, IMP*
Prodigy ODS 3 μm, 100 × 2 mm (Phenomenex, Torrance, CA 90501) Low sensitivity, except for AMP*, IMP*
Luna PFP(2) 3 μm, 150 × 3.0 mm† (Phenomenex) Sufficient retention and separation, good sensitivity*AMP (Adenine 5’-monophosphate); IMP (Inosine 5’-monophosphate); †Column selected for purine metabolite separation
Table 2: Columns tested for separation of purines and observed results.
Citation: Ardente AJ, Garrett TJ, Wells RS, Walsh M, Smith CR, et al. (2016) A Targeted Metabolomics Assay to Measure Eight Purines in the Diet of Common Bottlenose Dolphins, Tursiops truncatus. J Chromatogr Sep Tech 7: 334. doi: 10.4172/2157-7064.1000334
Page 4 of 9
Volume 7 • Issue 5 • 1000334J Chromatogr Sep Tech, an open access journalISSN: 2157-7064
µL/min. The elution conditions for separation of AMP, IMP, inosine, adenine, guanine, hypoxanthine, xanthine, and uric acid began with 97% A (0.1% acetic acid, pH 3.5) and 3% B (methanol) for 2 minutes, gradually decreased to 90% A and increased to 10% B from 2 to 4 minutes, 70% A and 30% B from 4 to 5.5 minutes, 50% A and 50% B from 6 to 8 minutes, with a final rapid return back to the original conditions at 8.5 minutes. The column was maintained under these conditions for re-equilibration for a further 6.5 minutes. In addition to testing different columns, several mobile phases were tested to determine which combination of solvents and timing of transitions achieved the best separation of the metabolites with similar masses. The maximum number of injections per day, including duplicate sample injections and blanks, was 84; therefore, the maximum daily run time was approximately 22.5 hrs. To optimize the lifespan of the column, particularly considering the potential for particulate build-up on the column, the column was flushed at the end of every long run with methanol at 500 µL/min for approximately 15-20 minutes. Additionally, the guard column was changed after approximately 400 injections. For column storage between runs, the column was flushed at 500 µL/min with 65% acetonitrile and 35% water for at least 10 column volumes.
Mass spectrometry analysis
Purine metabolites were identified by mass and retention time with a triple quadrupole mass spectrometer (TSQ Quantum Access Max, Thermo) with heated electrospray ionization (HESI). The HESI source was operated in negative-ion mode with the following settings: spray voltage 4000 V, vaporizer temperature 250°C, sheath gas pressure 50 arb, ion sweep gas pressure 0.0 arb, auxillary gas pressure 10 arb, and capillary temperature 300°C. Compounds were identified by comparing the retention time and selected reaction monitoring (SRM) pairs (Table 3) during one scan event with a 20 msec scan time, as well as through the addition of purine standards. Data was processed using computer software (Xcalibur Quan Browser, Thermo).
Purine standard stock solution stability
The stability of purine standard stock solutions was assessed by first preparing combined stock solutions as described above and spiking the solutions into 1000 μL of 10 mM NH4CH3CO2 to achieve equivalent 2x,
ice. Grinder equipment was thoroughly rinsed between each sample to prevent contamination between samples. Ground samples were homogenized by hand and stored in sample bags (Whirl-Pak® bags, Nasco, Fort Atkinson, WI 53538) at -80°C until shipped overnight on dry ice to each laboratory for analysis.
Fish extractionFor each fish purine extraction, a 25 g sample bag was removed
from the -80°C freezer where it had been stored and immersed in water at room temperature for 30-60 minutes until thawed. The aqueous extraction method published by Clariana et al. was followed, but required several modifications [17]. Thawed fish tissue was hand mixed by massaging the sample bag, and 2 g of mixed sample was transferred into a beaker with 20 mL of ultra-pure water and 500 µL of the internal standard solution. Following homogenization, sonication, heating, and cooling, as described by Clariana, et al., the extract supernatant was filtered through Whatman #1 filter paper (Whatman Inc, Clifton, NJ 07014) with a glass funnel. In all subsequent steps, extract and solvent volumes were doubled to provide a greater final volume for standard additions to be performed. Thus, a 10 mL aliquot of the filtrate was combined with 10 mL of HPLC-grade hexanes (Fisher) and centrifuged at 6,500 rpm for 7 minutes at 20°C. A 4 mL aliquot from the bottom layer of fluid was removed and combined with 4 mL of HPLC-grade methanol (Fisher), 4 mL of HPLC-grade acetone (Fisher), and 80 µL of 10% formic acid in water. Samples were centrifuged at 18,100 rpm for 17 minutes at 15°C. Five aliquots of 1,500 µL each were pipetted into 5 mL conical snap-top tubes (Eppendorf, Fisher).
Standard additions were used to quantify individual purine concentrations in the fish extract. Thus, for each fish sample, the first 1,500 µL aliquot was considered the blank fish extract sample. To the remaining 4 aliquots, the NH4CH3CO2 mixed purine standard solution and the NH4OH mixed purine standard solution were added in increasing quantities to provide standard additions of 2x, 4x, 6x, and 8x purine concentrations. Conical tubes were centrifuged at 3,000 rpm for 5 minutes at room temperature and then dried while heating to 35°C under a stream of nitrogen gas (MULTIVAP, Organomation, Berlin, MA 01503) for approximately 5-6 hrs.
The dried samples were reconstituted with 500 µL of 10 mM NH4CH3CO2. Conical tubes were centrifuged at 4,000 rpm for 15 minutes. Following centrifugation, if the extract had a distinct pellet at the bottom of the conical tube, supernatant was transferred to a 2 mL LC vial (Thermo Scientific, Waltham, MA 02451) for HPLC analysis. If the sample had floating particulate matter, the extract was re-mixed, transferred to a 2 mL microcentrifuge 0.22 µm nylon filter tube (Corning Incorporated, Corning, NY 14831), and centrifuged at 11,884 rpm for 5 minutes. The supernatant was then transferred to a 2 mL LC vial for HPLC-MS/MS analysis.
Chromatographic conditions
Purine metabolite separation was carried out with an auto-sampler (Accela Open, Thermo) and HPLC system (Accela 1250, Thermo). Several HPLC columns were tested (Table 2) under various conditions, manipulating column and sample stack temperature and using several mobile phase solvent combinations, including 10 mM NH4CH3CO2 in water (pH adjusted with acetic acid from 4-6), 10 mM NH4CH3CO2 in 90:10 acetonitrile in water, 100% acetonitrile, 90:10 acetonitrile in water, 0.1% acetonitrile in water, 0.1% formic acid in water, 0.1% acetic acid in water, 0.1% NH4OH in water, and 100% methanol.
The column and compartment were maintained at ambient temperature. The injection volume was 10 µL with a flow rate of 500 *eV (Electron volts); AMP (Adenine 5’-monophosphate); IMP (Inosine
5’-monophosphate)
Table 3: Purine metabolite mass spectrometer identification parameters.
Metabolite Precursor mass (g/mol)
Product mass(g/mol)
Collision energy (eV*)
Tube lens(V)
Adenine 134.00 107.00 24 74
Hypoxanthine135.05 65.34 29 74
95.22 18 74Guanine 150.00 108.00 18 74
Xanthine151.02 80.28 26 78
108.16 18 78
15N2 - Xanthine152.95 80.95 32 66
109.20 18 66Uric acid 167.00 124.24 16 65
Inosine267.02 108.21 41 100
135.15 25 100
AMP*345.99 79.25 42 98
134.23 39 98
IMP*346.96 79.31 37 90
135.13 34 90
Citation: Ardente AJ, Garrett TJ, Wells RS, Walsh M, Smith CR, et al. (2016) A Targeted Metabolomics Assay to Measure Eight Purines in the Diet of Common Bottlenose Dolphins, Tursiops truncatus. J Chromatogr Sep Tech 7: 334. doi: 10.4172/2157-7064.1000334
Page 5 of 9
Volume 7 • Issue 5 • 1000334J Chromatogr Sep Tech, an open access journalISSN: 2157-7064
6x, and 8x standard addition concentrations. Samples were analyzed in triplicate immediately then stored at -80°C for 24 hrs. Samples were then permitted to thaw for at least 1 hr. until approximately ambient temperature, vortexed, and re-analyzed in triplicate alongside freshly prepared standard solutions. This procedure was repeated once more for a total of 2 freeze/thaw cycles at 24 and 48 hrs. In addition, stability over 24 hr while at ambient temperature was assessed for standard stock solutions and fresh prepared Pacific herring and mullet samples, prepared using the method described above.
Method validation
Repeatability was assessed on pooled samples of Pacific herring and striped mullet that were divided into separate bags and frozen at -80°C. Purines were analyzed in these samples over 4 separate days to determine between-day variability. Additionally, 4 extracts were prepared from one sample bag for each fish species and analyzed on the same day to determine within-day variability.
Purine concentration quantification
For each sample, the ratio of peak area relative to internal standard was regressed against the concentration of purine metabolite after standard additions. The purine metabolite concentration (mmol/L) in the fish extract was obtained from the absolute value of the x-intercept of the regression line. Total purine content (mmol/L) was calculated either as the sum of adenine, guanine, hypoxanthine, and xanthine, representing the commercially available four-metabolite assay (TP4), or as the sum of those four metabolites plus uric acid, AMP, IMP, and inosine, representing the total obtained using this expanded eight-metabolite assay (TP8).
Statistical analysis
Statistical comparisons were performed using statistical software (SAS® for Windows, version 9.4, Cary, NC, 27513). The coefficient of variation for within and between days (n=4) was calculated for individual samples of Pacific herring and striped mullet. The ratios of TP4 to TP8 within species were assessed visually and were found to be normally distributed using the Shapiro-Wilk test. The correlations between TP4 and TP8, and between the logarithms of TP4 and TP8, were compared between groups of species using a general linear model procedure (SAS proc glm). The ratio of TP8:TP4 and the ratio of inosine to hypoxanthine were compared among fish species’ nested within species group using a general linear model (SAS glimmix) and post-hoc comparisons of least square means were performed with a Tukey-Kramer correction applied.
The primary endpoint was to determine whether there is a 50% increase in the concentration of hypoxanthine and other purines during frozen storage. Based on previous reports of the variability in concentrations of hypoxanthine and other purines in filleted fish during storage, comparing five samples of each species gave an 80% power to detect a 50% change in hypoxanthine concentration with a type I error of 0.05 [8,31,32].
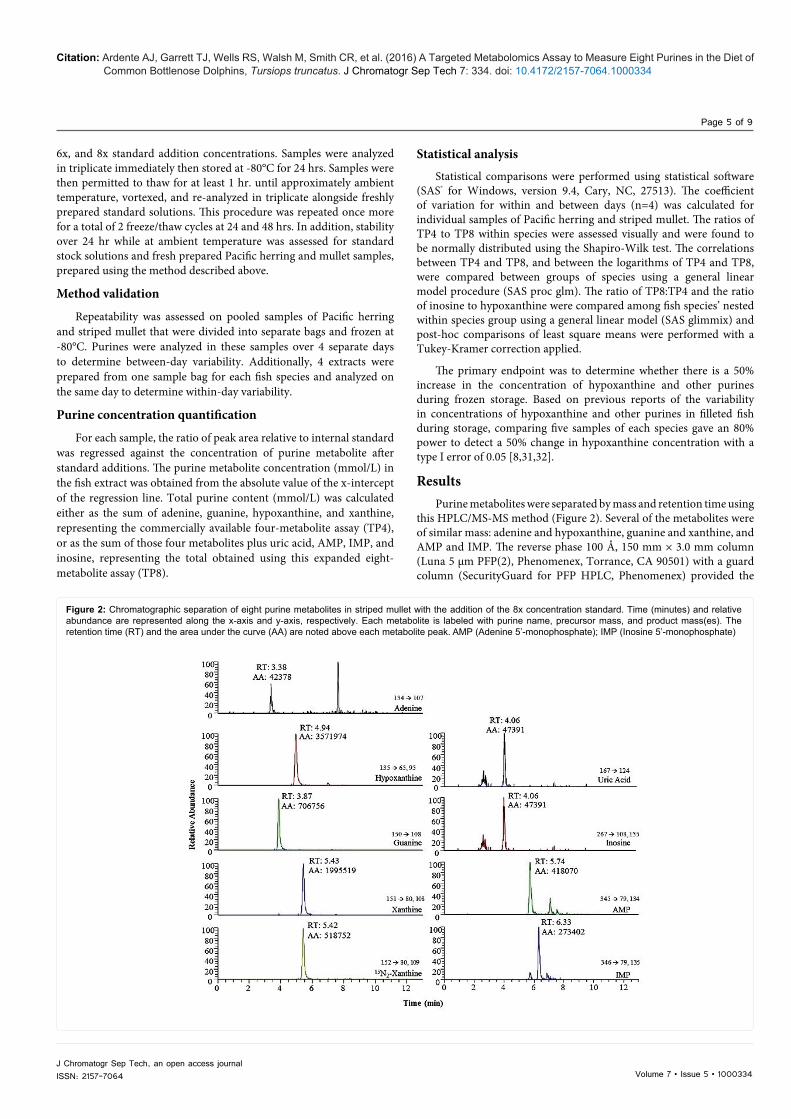
ResultsPurine metabolites were separated by mass and retention time using
this HPLC/MS-MS method (Figure 2). Several of the metabolites were of similar mass: adenine and hypoxanthine, guanine and xanthine, and AMP and IMP. The reverse phase 100 Å, 150 mm × 3.0 mm column (Luna 5 μm PFP(2), Phenomenex, Torrance, CA 90501) with a guard column (SecurityGuard for PFP HPLC, Phenomenex) provided the
Figure 2: Chromatographic separation of eight purine metabolites in striped mullet with the addition of the 8x concentration standard. Time (minutes) and relative abundance are represented along the x-axis and y-axis, respectively. Each metabolite is labeled with purine name, precursor mass, and product mass(es). The retention time (RT) and the area under the curve (AA) are noted above each metabolite peak. AMP (Adenine 5’-monophosphate); IMP (Inosine 5’-monophosphate)
Citation: Ardente AJ, Garrett TJ, Wells RS, Walsh M, Smith CR, et al. (2016) A Targeted Metabolomics Assay to Measure Eight Purines in the Diet of Common Bottlenose Dolphins, Tursiops truncatus. J Chromatogr Sep Tech 7: 334. doi: 10.4172/2157-7064.1000334
Page 6 of 9
Volume 7 • Issue 5 • 1000334J Chromatogr Sep Tech, an open access journalISSN: 2157-7064
best metabolite separation and most stable retention times when used with the method conditions described above. This column also had sufficient lifespan (~ 800 injections) for fish tissue purine identification. All other columns did not achieve desired results (Table 2). Standard additions verified the location of each metabolite, particularly when concentrations in the fish extract were low. Each metabolite concentration in the fish extract was quantified as the x-intercept of the regression of concentration after standard additions with area ratio relative to that of the internal standard (Figure 3).
There was a 15-30% decrease in signal for all metabolites after the first 24 hr. freeze and thaw cycle. There was no signal for adenine, AMP, and IMP following the second freeze/thaw cycle and the signal for the other metabolites decreased by an average of 25%. During a single 24 hr. run, the signal for neat standards decreased by up to 90% for adenine, between 20-40% for AMP, IMP, and uric acid, and between 5-15% for all other metabolites. The decrease in signal for metabolites in the fish extract was less than 20% over a 24 hr. run.
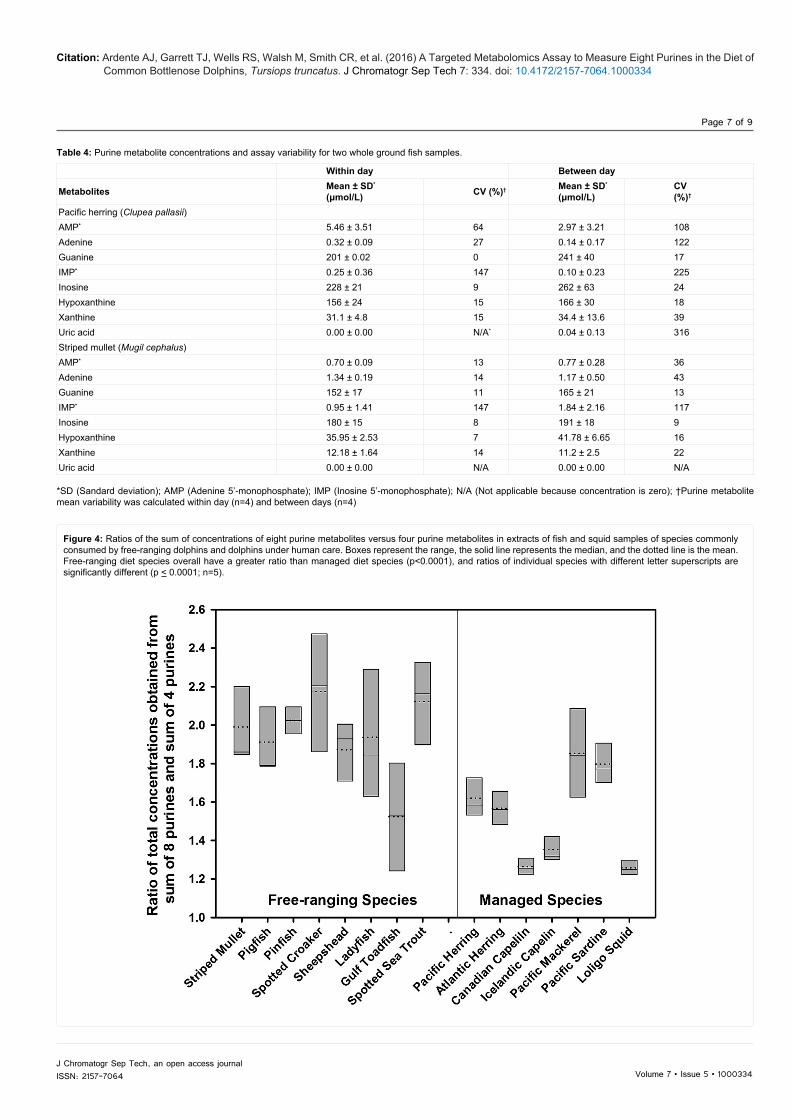
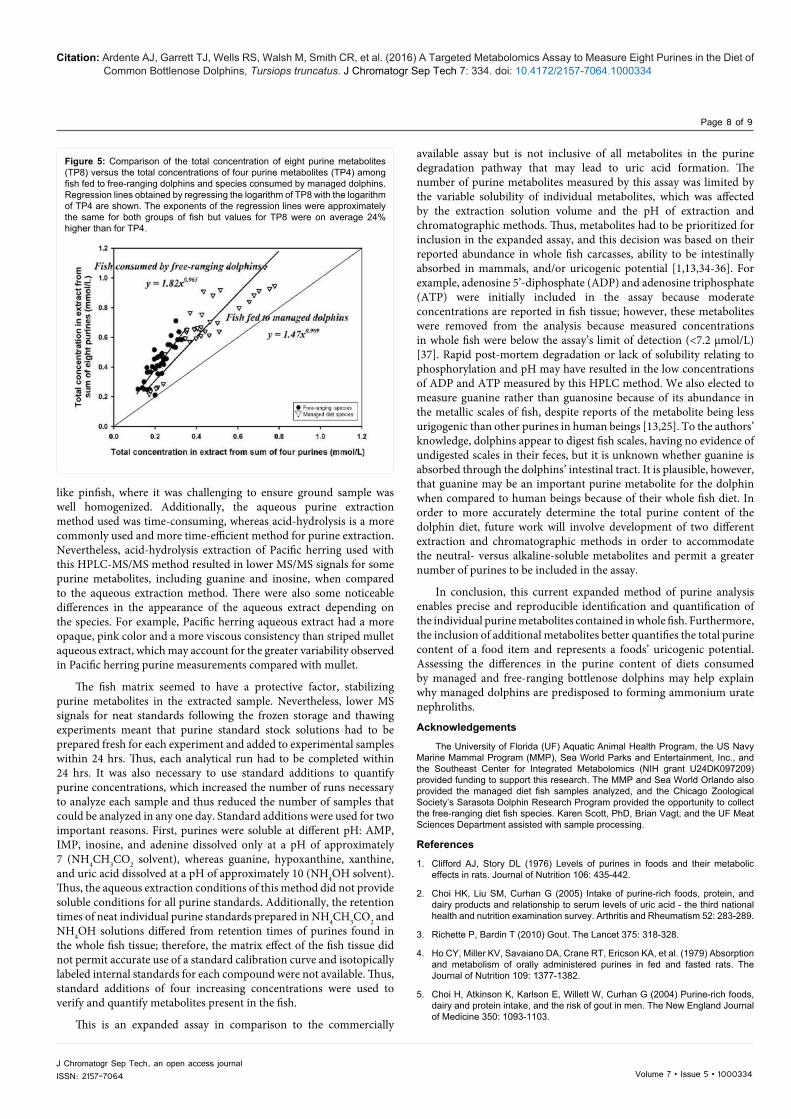
The coefficient of variation, measured both within and between days, for the Pacific herring and mullet samples were much greater for metabolites with minimal measured concentrations, like AMP, adenine, IMP, but was mostly below 20% for metabolites with greater measured concentrations, like guanine and hypoxanthine (Table 4). The ratio of TP8:TP4 differed among fish species and between fresh frozen free-ranging diet species and managed species which had been frozen stored for several months and then thawed (p < 0.0001; Figure 4). The slope of linear correlations of TP8 to TP4 was steeper for fresh frozen fish commonly fed to free-ranging dolphins than in stored and thawed species commonly fed to managed dolphins (p=0.01). Regression of the logarithm of TP8 with the logarithm of TP4 improved the fit, and the logTP8:logTP4 regression slopes were almost identical for both groups of fish (0.963 and 0.969, respectively, Figure 5). Values for TP8 were on average 24% higher relative to TP40.966 in free-ranging diet species than in managed diet species but variation was substantial. The difference between TP8 and TP4 was largely due to a change in the ratio of inosine to hypoxanthine, which was on average greater for the free-ranging species (3.70) than for managed species (1.67; p < 0.0001).
DiscussionThis study describes a new method that quantified eight purine
metabolites contained in whole fish and a squid commonly consumed by bottlenose dolphins. The four metabolites in greatest concentration were guanine, hypoxanthine, xanthine, and inosine, and the method provided satisfactory, repeatable results for measuring the concentrations of those purines. Inosine is not measured by the four-nucleobase commercial assay, so the whole fish total purine content would be underestimated if only the usual four nucleobases, adenine, guanine, hypoxanthine, and xanthine, were measured.
The total purine content from eight metabolites cannot be reliably predicted by measuring just four metabolites because the ratio of the total obtained from eight versus four metabolites varied widely among species. Furthermore, the ratio of the total purine content measured by eight versus four metabolites differed between free-ranging and managed diet species possibly because of inherent species and handling differences. For example, inosine and IMP degrade to hypoxanthine during frozen storage and storage conditions can markedly affect purine degradation rates [16,33]. In this study, fresh frozen fish had a greater inosine to hypoxanthine ratio than frozen, stored, and thawed fish. This likely represents the degradation of inosine to hypoxanthine during frozen storage for managed diet species, whereas degradation
was probably minimal for the free-ranging fish species that were quickly frozen at -80°C.
These findings confirm our initial hypothesis that it is important to measure more than just four purine metabolites when comparing the purine intake of managed and free-ranging bottlenose dolphins. All of the metabolites measured are absorbed through the mammalian intestinal tract; however, the uricogenic importance may not be similar for all metabolites. For example, the uricogenic potential of inosine is not well-described. In rats, it is suspected that intestinal absorption of inosine is saturable, but the threshold for saturation has not been established [34]. This may be important because even though fish concentrations of inosine are large when compared to other purine metabolites, limited absorption may diminish its impact on urine uric acid excretion. Nevertheless, very little is known about purine metabolism in dolphins. This is the first attempt to quantify the purine content of the diet of dolphins, and the relationship between diet and uric acid excretion has not been established [21,22]. At this time, therefore, all purine metabolites should be considered equally important in assessing the dolphin diet.
Measuring more purines with this assay may also be relevant for human medicine. Purine-rich foods are classified based on the total nucleobase content. Human beings susceptible to developing gout or uric acid stones are advised to avoid foods containing increased purines. This study shows that foods may be misclassified as to total purine content if the additional purines that are known to be absorbed by the mammalian intestinal tract are not measured. In particular, this study suggests that the total purine content may be underrepresented by the traditional assay especially in fresh foods that are not frozen and stored for long periods.
This method of sample preparation and analysis has some limitations. First, fish were pooled and ground for analysis, and there was inherent sample heterogeneity of some species because the diverse tissues of whole fish respond differently to grinding. This was particularly true for some of the smaller, more boney species
160
140
120
100
80
60
40
20
00.000 0.020 0.040 0.060 0.080 0.100 0.120 0.140
8x
6x
4x
2x
y=949.62x+32.18R2=1.00
Xanthine concentration (mmol/L)
Peak
are
a ra
tio
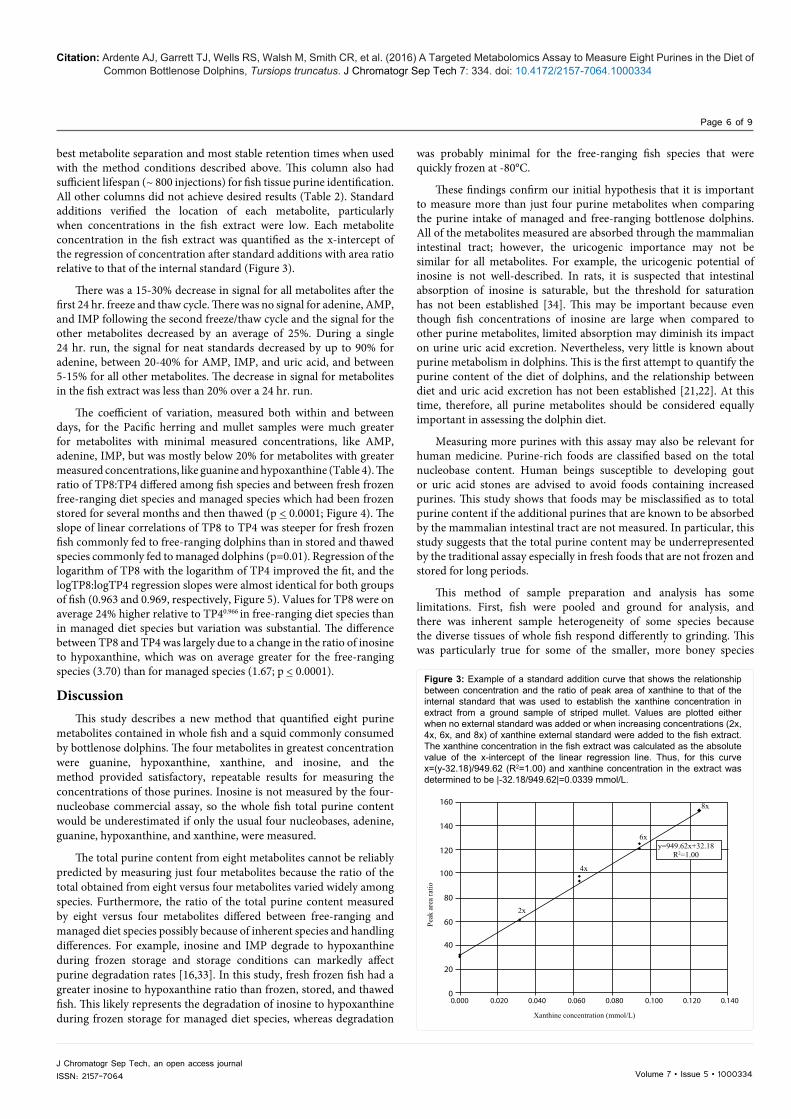
Figure 3: Example of a standard addition curve that shows the relationship between concentration and the ratio of peak area of xanthine to that of the internal standard that was used to establish the xanthine concentration in extract from a ground sample of striped mullet. Values are plotted either when no external standard was added or when increasing concentrations (2x, 4x, 6x, and 8x) of xanthine external standard were added to the fish extract. The xanthine concentration in the fish extract was calculated as the absolute value of the x-intercept of the linear regression line. Thus, for this curve x=(y-32.18)/949.62 (R2=1.00) and xanthine concentration in the extract was determined to be |-32.18/949.62|=0.0339 mmol/L.
Citation: Ardente AJ, Garrett TJ, Wells RS, Walsh M, Smith CR, et al. (2016) A Targeted Metabolomics Assay to Measure Eight Purines in the Diet of Common Bottlenose Dolphins, Tursiops truncatus. J Chromatogr Sep Tech 7: 334. doi: 10.4172/2157-7064.1000334
Page 7 of 9
Volume 7 • Issue 5 • 1000334J Chromatogr Sep Tech, an open access journalISSN: 2157-7064
Within day Between day
Metabolites Mean ± SD*
(μmol/L) CV (%)† Mean ± SD*
(μmol/L)CV (%)†
Pacific herring (Clupea pallasii)AMP* 5.46 ± 3.51 64 2.97 ± 3.21 108Adenine 0.32 ± 0.09 27 0.14 ± 0.17 122Guanine 201 ± 0.02 0 241 ± 40 17IMP* 0.25 ± 0.36 147 0.10 ± 0.23 225Inosine 228 ± 21 9 262 ± 63 24Hypoxanthine 156 ± 24 15 166 ± 30 18Xanthine 31.1 ± 4.8 15 34.4 ± 13.6 39Uric acid 0.00 ± 0.00 N/A* 0.04 ± 0.13 316Striped mullet (Mugil cephalus)AMP* 0.70 ± 0.09 13 0.77 ± 0.28 36Adenine 1.34 ± 0.19 14 1.17 ± 0.50 43Guanine 152 ± 17 11 165 ± 21 13IMP* 0.95 ± 1.41 147 1.84 ± 2.16 117Inosine 180 ± 15 8 191 ± 18 9Hypoxanthine 35.95 ± 2.53 7 41.78 ± 6.65 16Xanthine 12.18 ± 1.64 14 11.2 ± 2.5 22Uric acid 0.00 ± 0.00 N/A 0.00 ± 0.00 N/A
*SD (Sandard deviation); AMP (Adenine 5’-monophosphate); IMP (Inosine 5’-monophosphate); N/A (Not applicable because concentration is zero); †Purine metabolite mean variability was calculated within day (n=4) and between days (n=4)
Table 4: Purine metabolite concentrations and assay variability for two whole ground fish samples.
Figure 4: Ratios of the sum of concentrations of eight purine metabolites versus four purine metabolites in extracts of fish and squid samples of species commonly consumed by free-ranging dolphins and dolphins under human care. Boxes represent the range, the solid line represents the median, and the dotted line is the mean. Free-ranging diet species overall have a greater ratio than managed diet species (p<0.0001), and ratios of individual species with different letter superscripts are significantly different (p < 0.0001; n=5).
Citation: Ardente AJ, Garrett TJ, Wells RS, Walsh M, Smith CR, et al. (2016) A Targeted Metabolomics Assay to Measure Eight Purines in the Diet of Common Bottlenose Dolphins, Tursiops truncatus. J Chromatogr Sep Tech 7: 334. doi: 10.4172/2157-7064.1000334
Page 8 of 9
Volume 7 • Issue 5 • 1000334J Chromatogr Sep Tech, an open access journalISSN: 2157-7064
like pinfish, where it was challenging to ensure ground sample was well homogenized. Additionally, the aqueous purine extraction method used was time-consuming, whereas acid-hydrolysis is a more commonly used and more time-efficient method for purine extraction. Nevertheless, acid-hydrolysis extraction of Pacific herring used with this HPLC-MS/MS method resulted in lower MS/MS signals for some purine metabolites, including guanine and inosine, when compared to the aqueous extraction method. There were also some noticeable differences in the appearance of the aqueous extract depending on the species. For example, Pacific herring aqueous extract had a more opaque, pink color and a more viscous consistency than striped mullet aqueous extract, which may account for the greater variability observed in Pacific herring purine measurements compared with mullet.
The fish matrix seemed to have a protective factor, stabilizing purine metabolites in the extracted sample. Nevertheless, lower MS signals for neat standards following the frozen storage and thawing experiments meant that purine standard stock solutions had to be prepared fresh for each experiment and added to experimental samples within 24 hrs. Thus, each analytical run had to be completed within 24 hrs. It was also necessary to use standard additions to quantify purine concentrations, which increased the number of runs necessary to analyze each sample and thus reduced the number of samples that could be analyzed in any one day. Standard additions were used for two important reasons. First, purines were soluble at different pH: AMP, IMP, inosine, and adenine dissolved only at a pH of approximately 7 (NH4CH3CO2 solvent), whereas guanine, hypoxanthine, xanthine, and uric acid dissolved at a pH of approximately 10 (NH4OH solvent). Thus, the aqueous extraction conditions of this method did not provide soluble conditions for all purine standards. Additionally, the retention times of neat individual purine standards prepared in NH4CH3CO2 and NH4OH solutions differed from retention times of purines found in the whole fish tissue; therefore, the matrix effect of the fish tissue did not permit accurate use of a standard calibration curve and isotopically labeled internal standards for each compound were not available. Thus, standard additions of four increasing concentrations were used to verify and quantify metabolites present in the fish.
This is an expanded assay in comparison to the commercially
available assay but is not inclusive of all metabolites in the purine degradation pathway that may lead to uric acid formation. The number of purine metabolites measured by this assay was limited by the variable solubility of individual metabolites, which was affected by the extraction solution volume and the pH of extraction and chromatographic methods. Thus, metabolites had to be prioritized for inclusion in the expanded assay, and this decision was based on their reported abundance in whole fish carcasses, ability to be intestinally absorbed in mammals, and/or uricogenic potential [1,13,34-36]. For example, adenosine 5’-diphosphate (ADP) and adenosine triphosphate (ATP) were initially included in the assay because moderate concentrations are reported in fish tissue; however, these metabolites were removed from the analysis because measured concentrations in whole fish were below the assay’s limit of detection (<7.2 μmol/L) [37]. Rapid post-mortem degradation or lack of solubility relating to phosphorylation and pH may have resulted in the low concentrations of ADP and ATP measured by this HPLC method. We also elected to measure guanine rather than guanosine because of its abundance in the metallic scales of fish, despite reports of the metabolite being less urigogenic than other purines in human beings [13,25]. To the authors’ knowledge, dolphins appear to digest fish scales, having no evidence of undigested scales in their feces, but it is unknown whether guanine is absorbed through the dolphins’ intestinal tract. It is plausible, however, that guanine may be an important purine metabolite for the dolphin when compared to human beings because of their whole fish diet. In order to more accurately determine the total purine content of the dolphin diet, future work will involve development of two different extraction and chromatographic methods in order to accommodate the neutral- versus alkaline-soluble metabolites and permit a greater number of purines to be included in the assay.
In conclusion, this current expanded method of purine analysis enables precise and reproducible identification and quantification of the individual purine metabolites contained in whole fish. Furthermore, the inclusion of additional metabolites better quantifies the total purine content of a food item and represents a foods’ uricogenic potential. Assessing the differences in the purine content of diets consumed by managed and free-ranging bottlenose dolphins may help explain why managed dolphins are predisposed to forming ammonium urate nephroliths.
Acknowledgements
The University of Florida (UF) Aquatic Animal Health Program, the US Navy Marine Mammal Program (MMP), Sea World Parks and Entertainment, Inc., and the Southeast Center for Integrated Metabolomics (NIH grant U24DK097209) provided funding to support this research. The MMP and Sea World Orlando also provided the managed diet fish samples analyzed, and the Chicago Zoological Society’s Sarasota Dolphin Research Program provided the opportunity to collect the free-ranging diet fish species. Karen Scott, PhD, Brian Vagt, and the UF Meat Sciences Department assisted with sample processing.
References
1. Clifford AJ, Story DL (1976) Levels of purines in foods and their metabolic effects in rats. Journal of Nutrition 106: 435-442.
2. Choi HK, Liu SM, Curhan G (2005) Intake of purine-rich foods, protein, and dairy products and relationship to serum levels of uric acid - the third national health and nutrition examination survey. Arthritis and Rheumatism 52: 283-289.
3. Richette P, Bardin T (2010) Gout. The Lancet 375: 318-328.
4. Ho CY, Miller KV, Savaiano DA, Crane RT, Ericson KA, et al. (1979) Absorption and metabolism of orally administered purines in fed and fasted rats. The Journal of Nutrition 109: 1377-1382.
5. Choi H, Atkinson K, Karlson E, Willett W, Curhan G (2004) Purine-rich foods, dairy and protein intake, and the risk of gout in men. The New England Journal of Medicine 350: 1093-1103.
Figure 5: Comparison of the total concentration of eight purine metabolites (TP8) versus the total concentrations of four purine metabolites (TP4) among fish fed to free-ranging dolphins and species consumed by managed dolphins. Regression lines obtained by regressing the logarithm of TP8 with the logarithm of TP4 are shown. The exponents of the regression lines were approximately the same for both groups of fish but values for TP8 were on average 24% higher than for TP4.
Citation: Ardente AJ, Garrett TJ, Wells RS, Walsh M, Smith CR, et al. (2016) A Targeted Metabolomics Assay to Measure Eight Purines in the Diet of Common Bottlenose Dolphins, Tursiops truncatus. J Chromatogr Sep Tech 7: 334. doi: 10.4172/2157-7064.1000334
Page 9 of 9
Volume 7 • Issue 5 • 1000334J Chromatogr Sep Tech, an open access journalISSN: 2157-7064
6. Serio A, Fraioli A (1999) Epidemiology of nephrolithiasis. Nephron 81: 26-30.
7. Sakhaee K, Maalouf NM (2008) Metabolic syndrome and uric acid nephrolithiasis. Seminars in Nephrology 28: 174-180.
8. Lou SN (1998) Purine content in grass shrimp during storage as related to freshness. Journal of Food Science 63: 442-444.
9. Bartges JW, Osborne CA, Felice LJ, Allen TA, Brown C, et al. (1995) Diet effect on activity product ratios of uric-acid, sodium urate, and ammonium urate in urine formed by healthy beagles. American Journal of Veterinary Research 56: 329-333.
10. Hardy R, Klausner J (1983) Urate calculi associated with poral vascular anomalies, in Current veterinary therapy. In: Kirk R. WB Saunders: Philadelphia, pp: 1073-1076.
11. Brockis JG, Levitt AJ, Cruthers SM (1982) The effects of vegetable and animal protein diets on calcium, urate and oxalate excretion. British Journal of Urology 54: 590-593.
12. Sarwar G, Brule D (1991) Assessment of the uricogenic potential of processed foods based on the nature and quantity of dietary purines. Progress in Food and Nutrition Science 15: 159-181.
13. Clifford AJ, Riumallo JA, Young VR, Scrimshaw NS (1976) Effect of oral purines on serum and urinary uric acid of normal, hyperuricemic and gouty humans. The Journal of Nutrition 106: 428-450.
14. Spann WK, Grobner W, Zollner N (1980) Effect of hypoxanthine in meat on serum uric acid and urinary uric acid excretion. Purine metabolism in man-III 122A: 215-219.
15. Brule D, Sarwar G, Savoie L (1992) Changes in serum and urinary uric acid levels in normal human subjects fed purine-rich foods containing different amounts of adenine and hypoxanthine. Journal of the American College of Nutrition 11: 353-358.
16. Fraser D, Dingle J, Hines J, Nowlan S, Dyer W (1967) Nucleotide degredation, monitored by thin-layer chromatography, and associated postmortem changes in relaxed cod muscle. Journal of the Fisheries Research Board of Canada 24: 1837-1841.
17. Clariana M, Gratacos-Cubarsi M, Hortos M, Garcia-Regueiro JA, Castellari M (2010) Analysis of seven purines and pyrimidines in pork meat products by ultra high performance liquid chromatography–tandem mass spectrometry. Journal of Chromatography A 1217: 4294-4299.
18. Aubourg SP, Piñeiro C, Gallardo JM, Barros-Velazquez J (2005) Biochemical changes and quality loss during chilled storage of farmed turbot (psetta maxima). Food Chemistry 90: 445-452.
19. Lou SN, Lin CD, Benkmann R (2001) Changes in purine content of tilapia mossambica during storage, heating, and drying. Food Science and Agricultural Chemistry 3: 23-29.
20. Bennour M, El Marrakchi A, Bouchriti N, Hamama A, El Ouadaa M (1991) Chemical and microbiological assessments of mackerel (scomber scombrus) stored in ice. Journal of Food Protection 54: 789-792.
21. Venn-Watson S, Townsend F, Daniels R, Sweeney J, McBain J, et al. (2010) Hypocitraturia in common bottlenose dolphins (tursiops truncatus): Assessing a potential risk factor for urate nephrolithiasis. Comparative Medicine 60: 149-153.
22. Venn-Watson S, Smith C, Johnson S, Daniels R, Townsend F (2010) Clinical relevance of urate nephrolithiasis in bottlenose dolphins, tursiops truncatus. Diseases of Aquatic Organisms 89: 167-177.
23. Bernard J, Allen M (2002) Feeding captive piscivorous animals: Nutritional aspects of fish as food. Nutrition Advisory Group Handbook. In: Baer D, Crissey S, Ullrey D. Nutrition Advisory Group, p: 12.
24. Huidobro A, Pastor A, Tejada M (2001) Adenosine triphosphate and derivatives as freshness indicators of gilthead sea bream (sparus aurata). Food Science and Technology International 7: 23-30.
25. Levy-Lior A, Pokroy B, Levavi-Sivan B, Leiserowitz L, Weiner S, et al. (2008) Biogenic guanine crystals from the skin of fish may be designed to enhance light reflectance. Crystal growth and design 8: 507-511.
26. McCabe E, Gannon D, Barros N, Wells R (2010) Prey selection by resident common bottlenose dolphins (tursiops truncatus) in sarasota bay, florida. Marine Biology 157: 931-942.
27. Wells RS, Rhinehart HL, Hansen LJ, Sweeney JC, Townsend FI, et al. (2004) Bottlenose dolphins as marine ecosystem sentinels: Developing a health monitoring system. EcoHealth 1: 246-254.
28. Smith CR, Poindexter JR, Meegan JM, Bobulescu IA, Jensen ED, et al. (2014) Pathophysiological and physicochemical basis of ammonium urate stone formation in dolphins. The Journal of Urology 192: 260-266.
29. Jacobs J (2012) NOAA/NCCOS/Oxford lab - tricaine methanesulfonate (ms-222) effect on tissue mineral concentrations. A. Ardente Oxford.
30. Posner L (2012) North carolina state university college of veterinary medicine, anesthesiologist - tricaine methanesulfonate (ms-222) effect on tissue mineral concentrations.
31. Piñeiro-Sotelo M, Rodrıguez-Bernaldo de Quirós A, López-Hernández J, Simal-Lozano J (2002) Determination of purine bases in sea urchin (paracentortus lividus) gonads by high-performance liquid chromatography. Food Chemistry 79: 113-117.
32. Kabacoff R (2012) Power analysis. Quick R - Accessing the power of R.
33. Aubourg SP, Quitral V, Angélica Larraín M, Rodríguez A, Gómez J, et al. (2007) Autolytic degradation and microbiological activity in farmed coho salmon (oncorhynchus kisutch) during chilled storage. Food Chemistry 104: 369-375.
34. Salati LM, Gross CJ, Henderson LM, Savaiano DA (1984) Absorption and metabolism of adenine, adenosine-5'-monophosphate, adenosine, and hypoxanthine by the isolated vascularly perfused rat small intestine. The Journal of Nutrition 114: 753-760.
35. Yamamoto S, Inoue K, Murata T, Kamigaso S, Yasujima T, et al. (2010) Identification and functional characterization of the first nucleobase transporter in mammals: Implication in the species difference in the intestinal absorption mechanism of nucleobases and their analogs between higher primates and other mammals. The Journal of Biological Chemistry 285: 6522-6531.
36. Caulfield MJ, Munroe PB, O'Neill D, Witkowska K, Charchar FJ, et al. (2008) Slc2a9 is a high-capacity urate transporter in humans. Plos Medicine 5: 1509-1523.
37. Hattula T (1997) Adenosine triphosphate breakdown products as a freshness indicator of some fish species and fish products, in Biochemistry. University of Helsinki: VTT Publications, Technical Research Centre of Finland, p: 47.
Citation: Ardente AJ, Garrett TJ, Wells RS, Walsh M, Smith CR, et al. (2016) A Targeted Metabolomics Assay to Measure Eight Purines in the Diet of Common Bottlenose Dolphins, Tursiops truncatus. J Chromatogr Sep Tech 7: 334. doi: 10.4172/2157-7064.1000334
OMICS International: Publication Benefits & Features Unique features:
• Increased global visibility of articles through worldwide distribution and indexing• Showcasing recent research output in a timely and updated manner• Special issues on the current trends of scientific research
Special features:
• 700+ Open Access Journals• 50,000+ editorial team• Rapid review process• Quality and quick editorial, review and publication processing• Indexing at major indexing services• Sharing Option: Social Networking Enabled• Authors, Reviewers and Editors rewarded with online Scientific Credits• Better discount for your subsequent articles
Submit your manuscript at: http://www.omicsonline.org/submission