a successful intermodal rail corridor -...
TRANSCRIPT
Innovative Logistics Consultancy �
Solutions for Your Success
A successful Intermodal Rail CorridorHamburg � South East European Countries
Key Factors and Best Practices
Madrid, 12th November 2009
© TransCare AG 2
1. Key success Factors of Railway Supply Chains
2. Volumes and Volume Balance
3. Points of Consolidation
4. Integrated Rail-Roading
5. Impact of Liberalization
6. Summary
Content
3© TransCare AG
Introduction
� Railways grew traditionally in conventional business
� Intermodalism in Europe started not with the first Container arriving in Bremen in the late 50�s
� Only �Eckelmann�, the owner of a bulk port area in Hamburg (Eurokai), started investing in port facilities to handle containers in the early 60�s, while anybody around him was smiling: �What a crazy guy!�
� Eurokai, today Eurogate, became the largest container terminal operator in Europe
� Rail started 6 years later in 1967 to transport the first containers
� The rail share of containers compared to road was far less than 10% overall in Europe
� Only with the upcoming Liberalization in the central European States in the early 90�s, private activities and competition, the modal split grew in favor of rail
There are 4 key factors for success in rail transport: Volume �Consolidation � Supply chain orientation - Competition
1. Key success Factors of Railway Supply Chains
© TransCare AG 4
1. Key success Factors of Railway Supply Chains
2. Volumes and Volume Balance
3. Points of Consolidation
4. Integrated Rail-Roading
5. Impact of Liberalization
6. Summary
Content
5© TransCare AG
Rail�
� � is competitive transporting 1.000 tons or >70 TEUs
� � is competitive transporting with regular frequency (5 days a week)
� � needs constant high utilization because of the high share of fixed costs
� � needs outbalanced flows to cover costs and to keep frequency
� � needs more planning activities than road
� � creates higher supply chain complexity
� � needs smart order management � �JIT should not degenerate to the stupidity to order in time!�
� � needs consolidation of volumes to create the necessary mass of transport
� � has plenty of market opportunities (corridors) to gain business
Success to gain volumes is a question of consequent management
2. Volumes and Volume Balance
6© TransCare AG
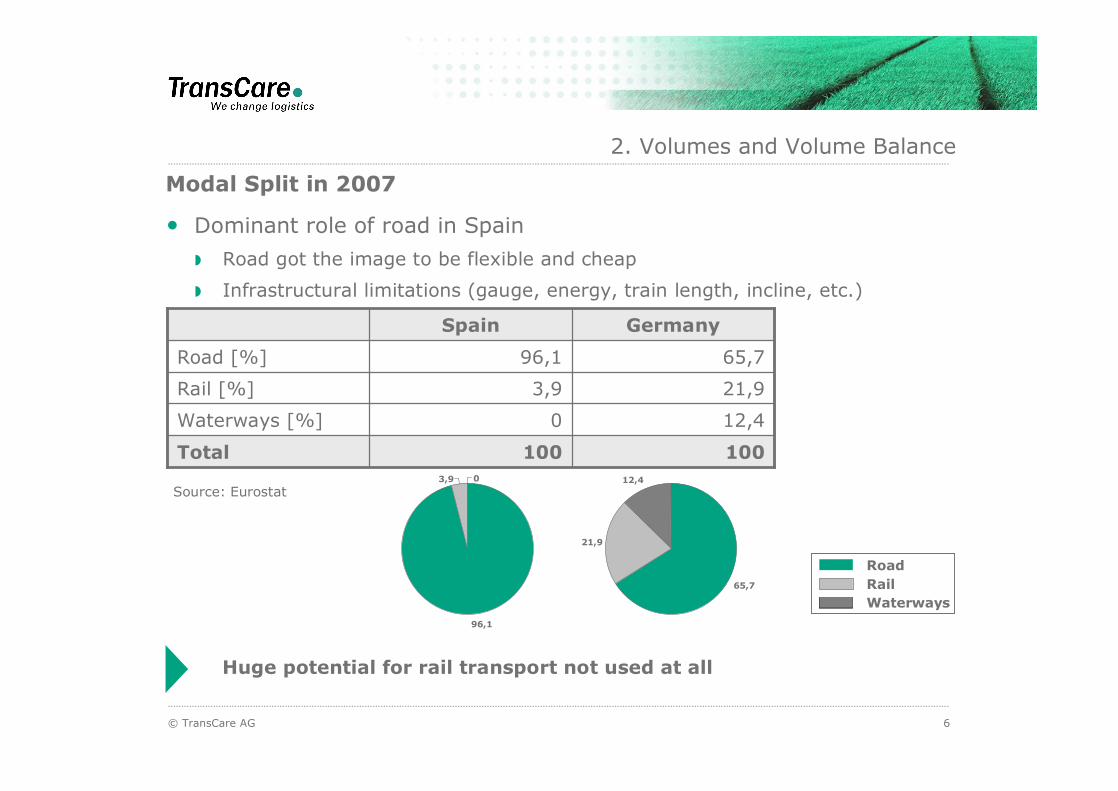
Modal Split in 2007
� Dominant role of road in Spain
Road got the image to be flexible and cheap
Infrastructural limitations (gauge, energy, train length, incline, etc.)
2. Volumes and Volume Balance
100100Total
12,40Waterways [%]
21,93,9Rail [%]
65,796,1Road [%]
GermanySpain
Huge potential for rail transport not used at all
65,7
21,9
12,4
96,1
3,9 0
Waterways
RoadRail
Source: Eurostat
7© TransCare AG
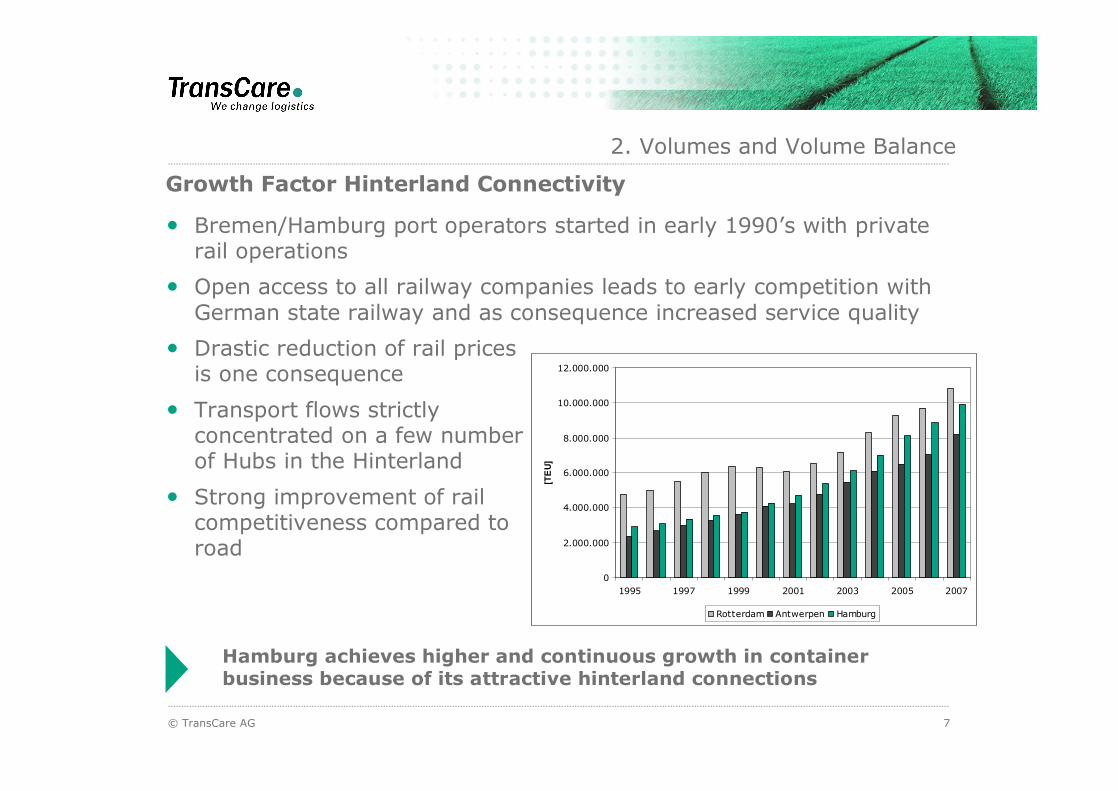
Growth Factor Hinterland Connectivity
� Bremen/Hamburg port operators started in early 1990�s with private rail operations
� Open access to all railway companies leads to early competition with German state railway and as consequence increased service quality
� Drastic reduction of rail prices is one consequence
� Transport flows strictly concentrated on a few numberof Hubs in the Hinterland
� Strong improvement of rail competitiveness compared to road
2. Volumes and Volume Balance
Hamburg achieves higher and continuous growth in container business because of its attractive hinterland connections
0
2.000.000
4.000.000
6.000.000
8.000.000
10.000.000
12.000.000
1995 1997 1999 2001 2003 2005 2007
[TE
U]
Rotterdam Antwerpen Hamburg
8© TransCare AG
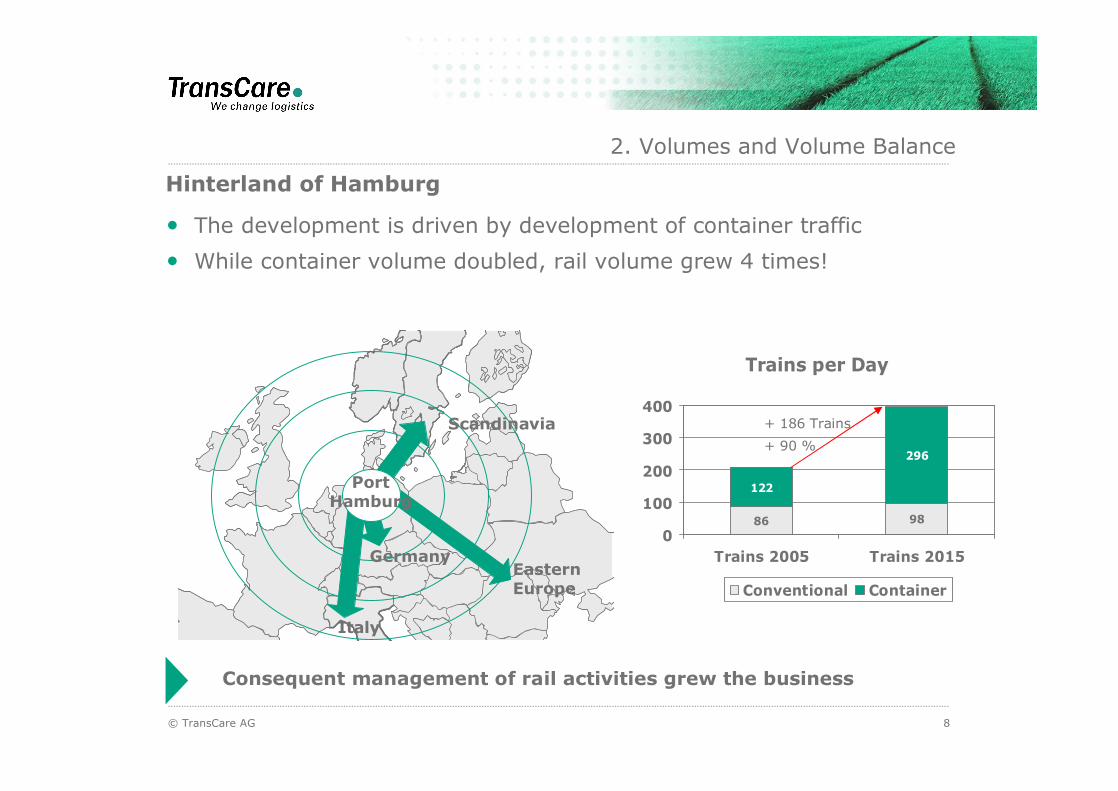
Hinterland of Hamburg
Consequent management of rail activities grew the business
Trains per Day
86 98
122
296
0
100
200
300
400
Trains 2005 Trains 2015
Conventional Container
+ 186 Trains
+ 90 %
� The development is driven by development of container traffic
� While container volume doubled, rail volume grew 4 times!
PortHamburg
Italy
Scandinavia
GermanyEastern Europe
2. Volumes and Volume Balance
9© TransCare AG
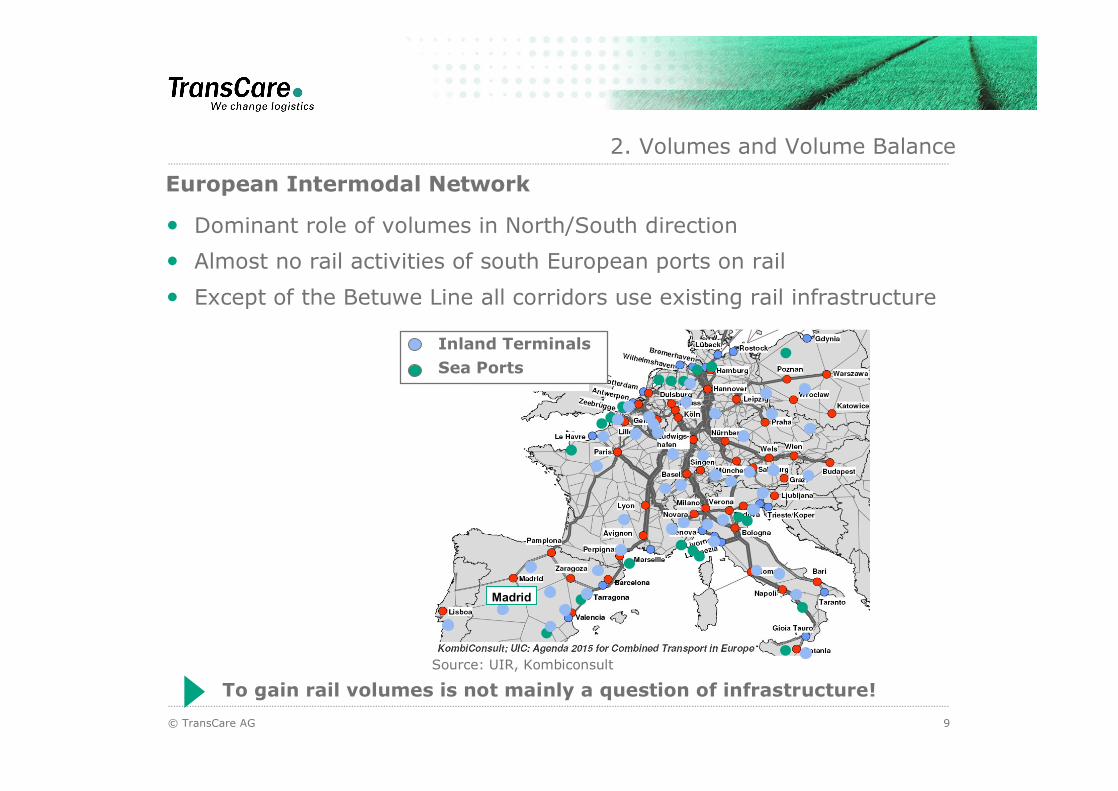
European Intermodal Network
� Dominant role of volumes in North/South direction
� Almost no rail activities of south European ports on rail
� Except of the Betuwe Line all corridors use existing rail infrastructure
2. Volumes and Volume Balance
Madrid
Source: UIR, Kombiconsult
Inland TerminalsSea Ports
To gain rail volumes is not mainly a question of infrastructure!
© TransCare AG 10
Optimal Connection between Port and Hinterland
1. Key success Factors of Railway Supply Chains
2. Volumes and Volume Balance
3. Points of Consolidation
4. Integrated Rail-Roading
5. Impact of Liberalization
6. Summary
Content
11© TransCare AG
Corridors need Consolidation Points
� Container hinterland transportation is the ideal example for rail corridors
� Corridors needs a high level �entrance� and �exit� - terminals
� Terminals and their surrounding markets are consolidation pointsalong the rail corridors
Sea ports with well integrated intermodal terminals
Transshipment terminals for rearranging of containers
Hinterland hubs and satellites for local supply
3. Points of Consolidation
Corridors are defined as the link between strong economic areas
12© TransCare AG
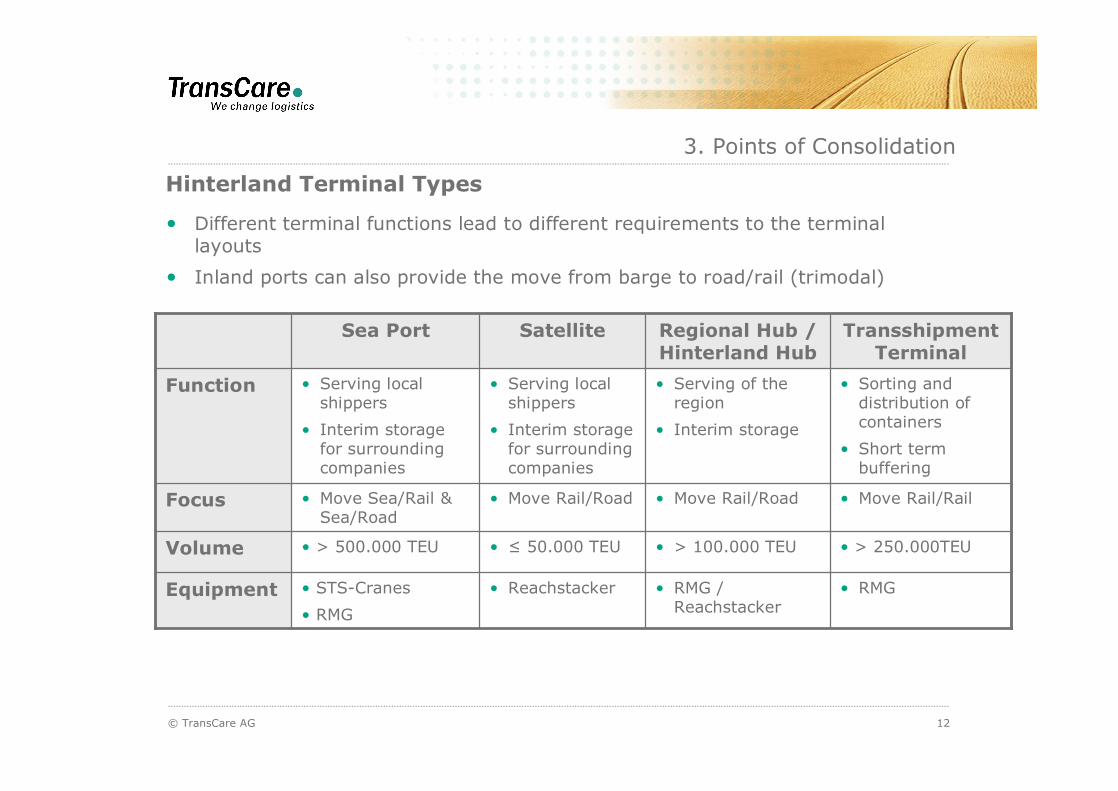
Hinterland Terminal Types
� Different terminal functions lead to different requirements to the terminal layouts
� Inland ports can also provide the move from barge to road/rail (trimodal)
� STS-Cranes
� RMG
� > 500.000 TEU
� Move Sea/Rail & Sea/Road
� Serving local shippers
� Interim storage for surrounding companies
Sea Port
� RMG� RMG / Reachstacker
� ReachstackerEquipment
� > 250.000TEU� > 100.000 TEU� ≤ 50.000 TEUVolume
� Move Rail/Rail� Move Rail/Road� Move Rail/RoadFocus
� Sorting and distribution of containers
� Short term buffering
� Serving of the region
� Interim storage
� Serving local shippers
� Interim storage for surrounding companies
Function
Transshipment Terminal
Regional Hub / Hinterland Hub
Satellite
3. Points of Consolidation
13© TransCare AG
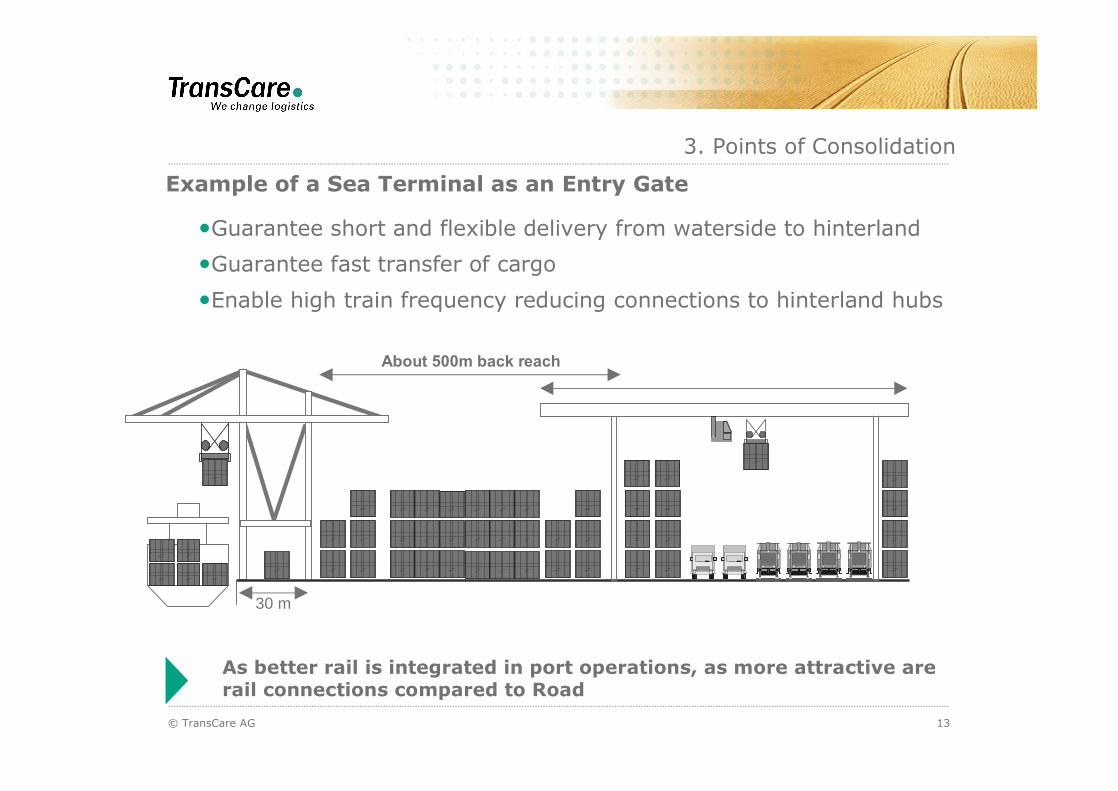
Example of a Sea Terminal as an Entry Gate
�Guarantee short and flexible delivery from waterside to hinterland
�Guarantee fast transfer of cargo
�Enable high train frequency reducing connections to hinterland hubs
3. Points of Consolidation
30 m
About 500m back reach
As better rail is integrated in port operations, as more attractive are rail connections compared to Road
14© TransCare AG
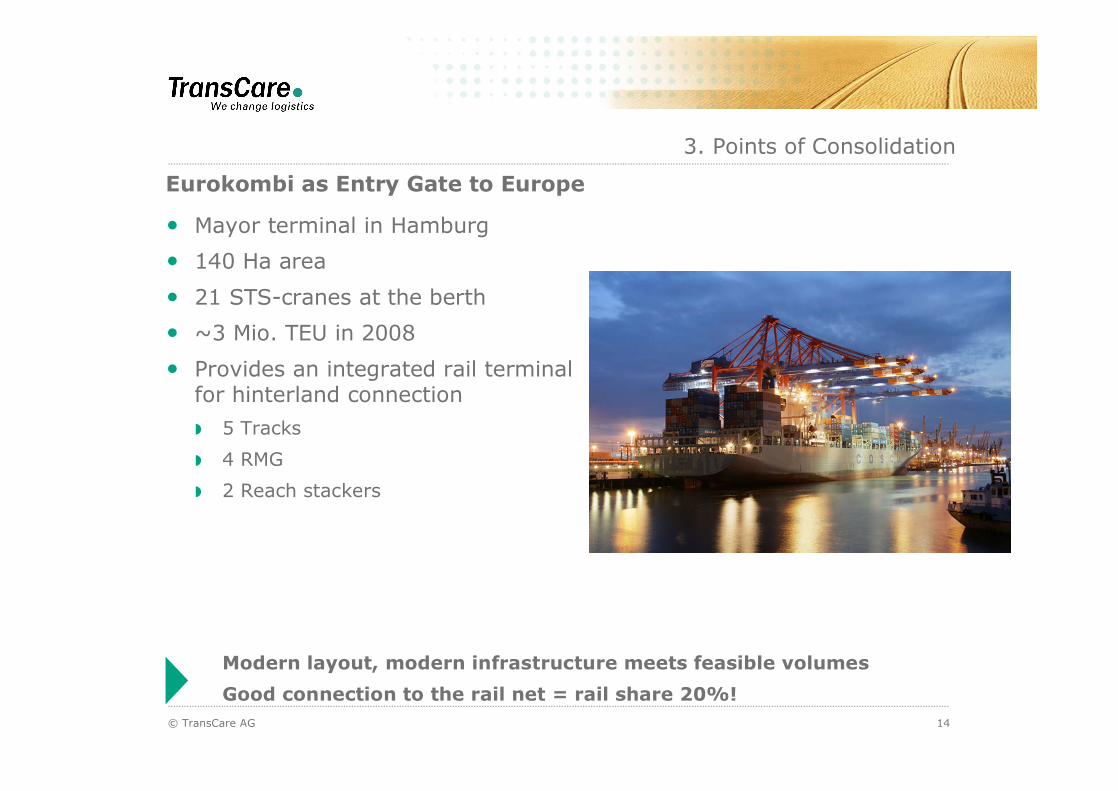
Eurokombi as Entry Gate to Europe
� Mayor terminal in Hamburg
� 140 Ha area
� 21 STS-cranes at the berth
� ~3 Mio. TEU in 2008
� Provides an integrated rail terminalfor hinterland connection
5 Tracks
4 RMG
2 Reach stackers
3. Points of Consolidation
Modern layout, modern infrastructure meets feasible volumes
Good connection to the rail net = rail share 20%!
15© TransCare AG
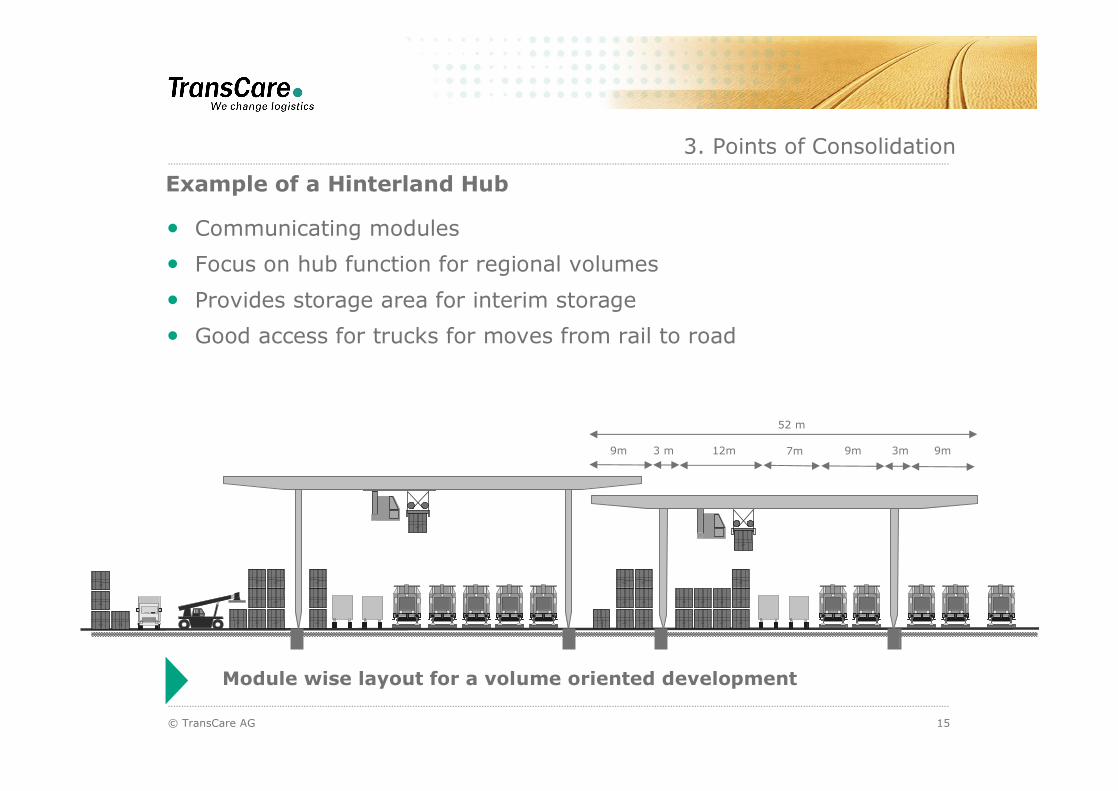
Example of a Hinterland Hub
� Communicating modules
� Focus on hub function for regional volumes
� Provides storage area for interim storage
� Good access for trucks for moves from rail to road
3. Points of Consolidation
52 m
3 m 12m 7m 9m 3m 9m9m
Module wise layout for a volume oriented development
16© TransCare AG
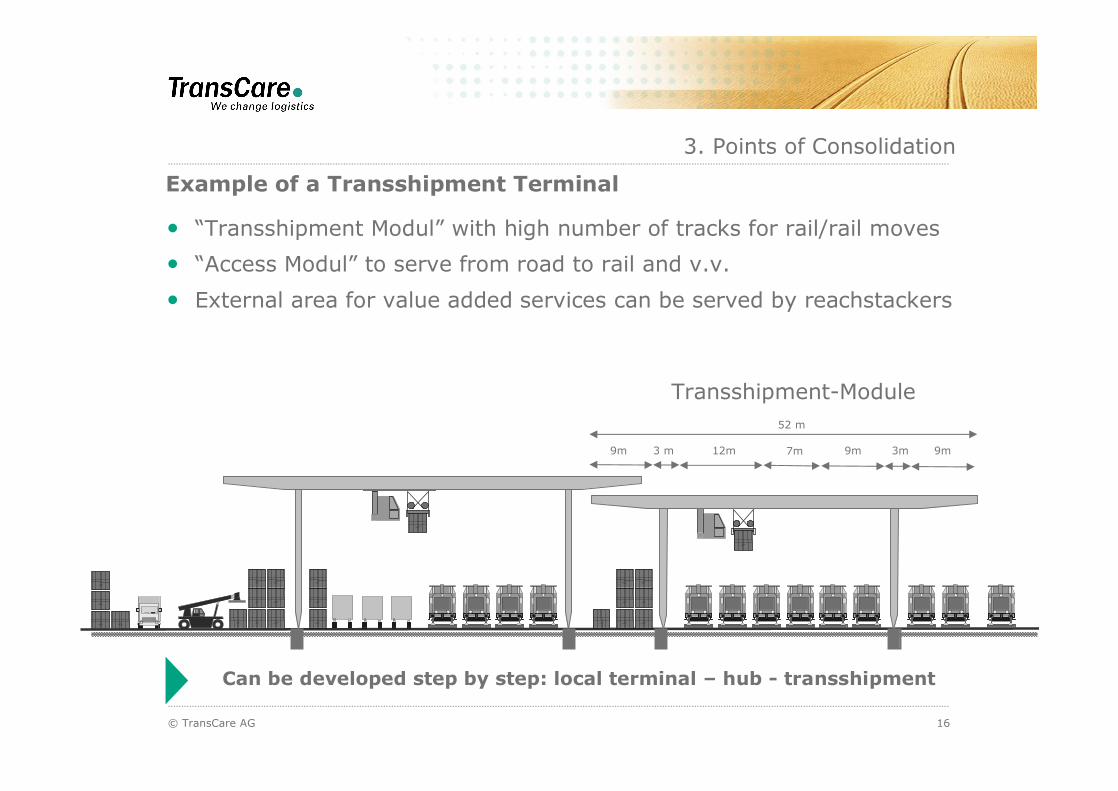
Example of a Transshipment Terminal
� �Transshipment Modul� with high number of tracks for rail/rail moves
� �Access Modul� to serve from road to rail and v.v.
� External area for value added services can be served by reachstackers
3. Points of Consolidation
9m
52 m
3 m 12m 7m 9m 3m 9m
Transshipment-Module
Can be developed step by step: local terminal � hub - transshipment
17© TransCare AG
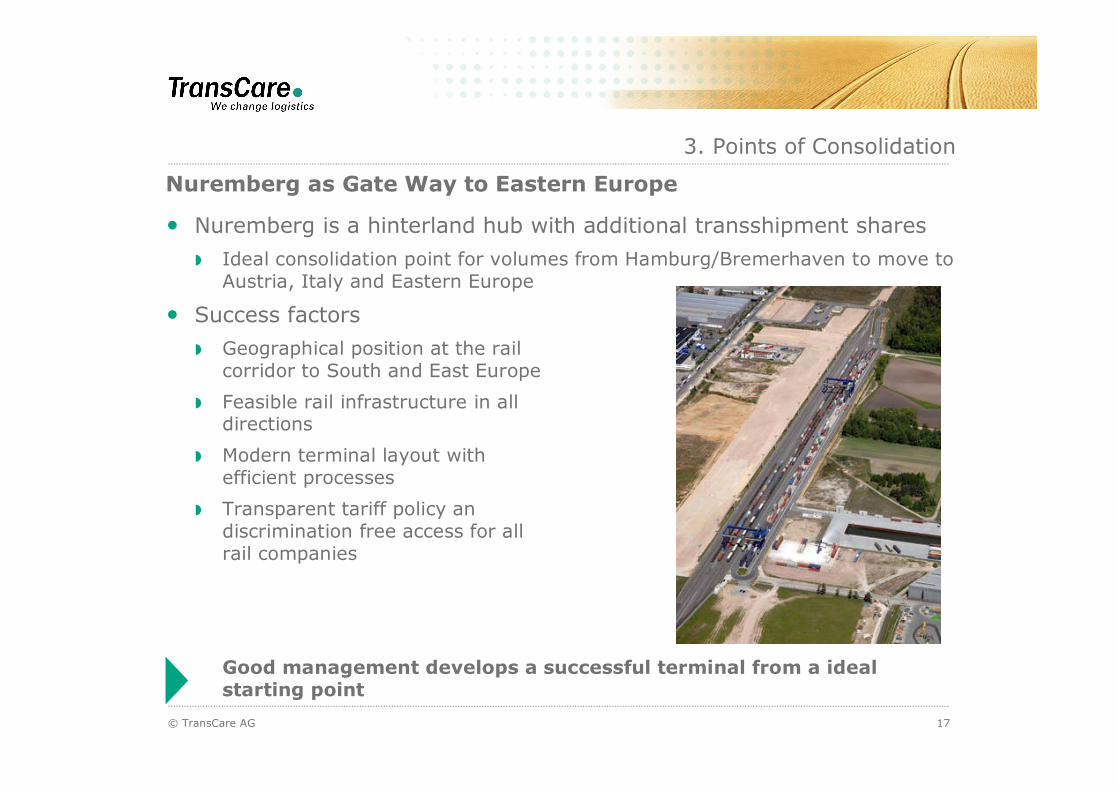
Nuremberg as Gate Way to Eastern Europe
� Nuremberg is a hinterland hub with additional transshipment shares
Ideal consolidation point for volumes from Hamburg/Bremerhaven to move to Austria, Italy and Eastern Europe
� Success factors
Geographical position at the rail corridor to South and East Europe
Feasible rail infrastructure in all directions
Modern terminal layout with efficient processes
Transparent tariff policy an discrimination free access for all rail companies
3. Points of Consolidation
Good management develops a successful terminal from a ideal starting point
18© TransCare AG
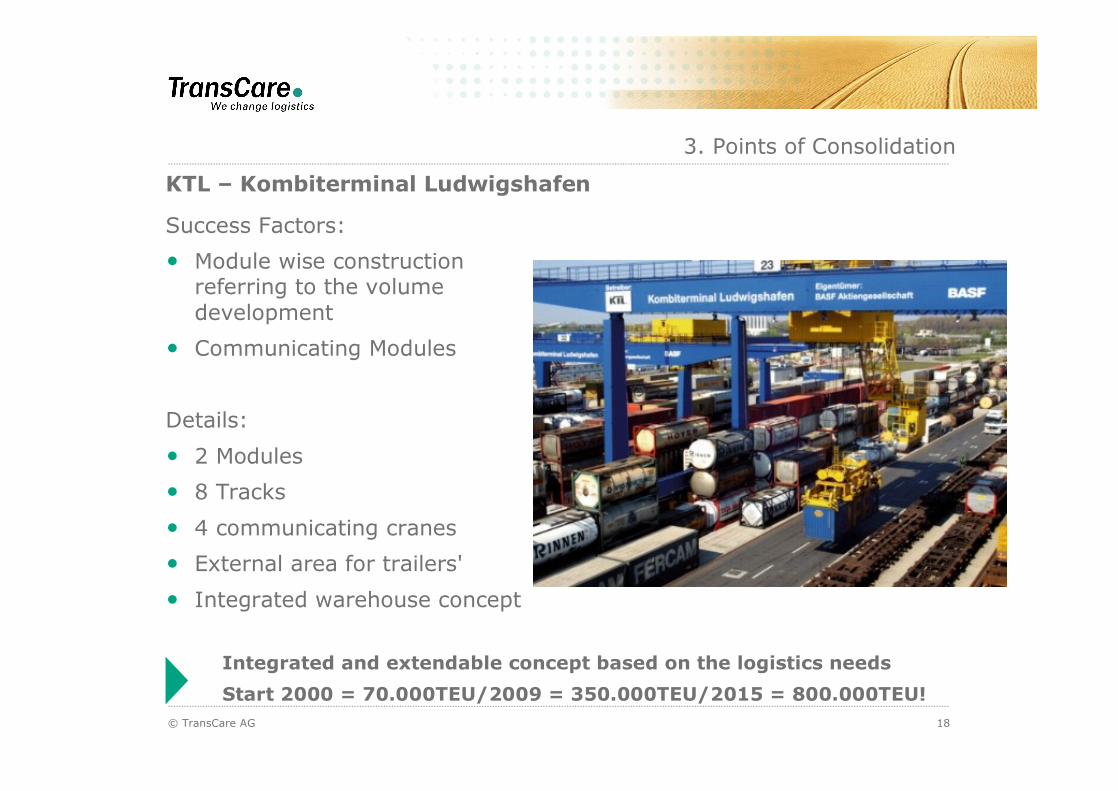
KTL � Kombiterminal Ludwigshafen
Success Factors:
� Module wise construction referring to the volume development
� Communicating Modules
Details:
� 2 Modules
� 8 Tracks
� 4 communicating cranes
� External area for trailers'
� Integrated warehouse concept
3. Points of Consolidation
Integrated and extendable concept based on the logistics needs
Start 2000 = 70.000TEU/2009 = 350.000TEU/2015 = 800.000TEU!
© TransCare AG 19
Optimal Connection between Port and Hinterland
1. Key success Factors of Railway Supply Chains
2. Volumes and Volume Balance
3. Points of Consolidation
4. Integrated Rail-Roading
5. Impact of Liberalization
6. Summary
Content
20© TransCare AG
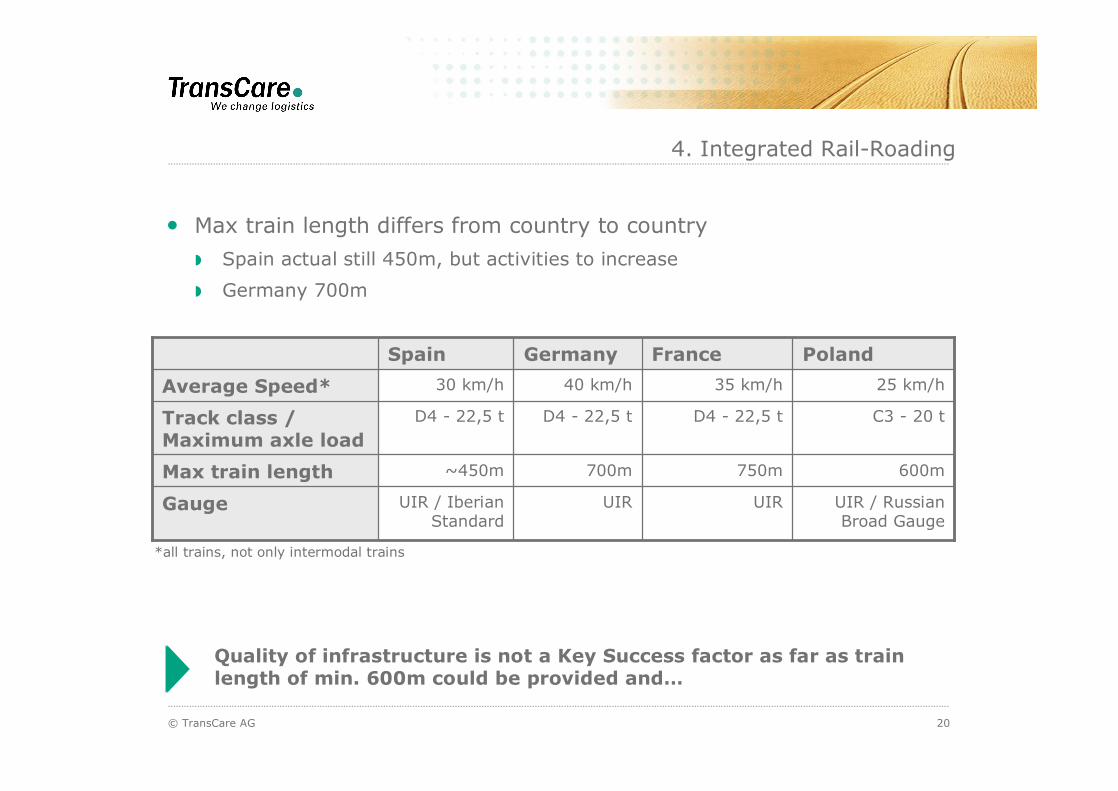
� Max train length differs from country to country
Spain actual still 450m, but activities to increase
Germany 700m
4. Integrated Rail-Roading
UIR / Russian Broad Gauge
UIRUIRUIR / Iberian Standard
Gauge
600m750m700m~450mMax train length
C3 - 20 tD4 - 22,5 tD4 - 22,5 tD4 - 22,5 tTrack class / Maximum axle load
25 km/h35 km/h 40 km/h 30 km/hAverage Speed*
PolandFranceGermanySpain
Quality of infrastructure is not a Key Success factor as far as train length of min. 600m could be provided and�
*all trains, not only intermodal trains
21© TransCare AG
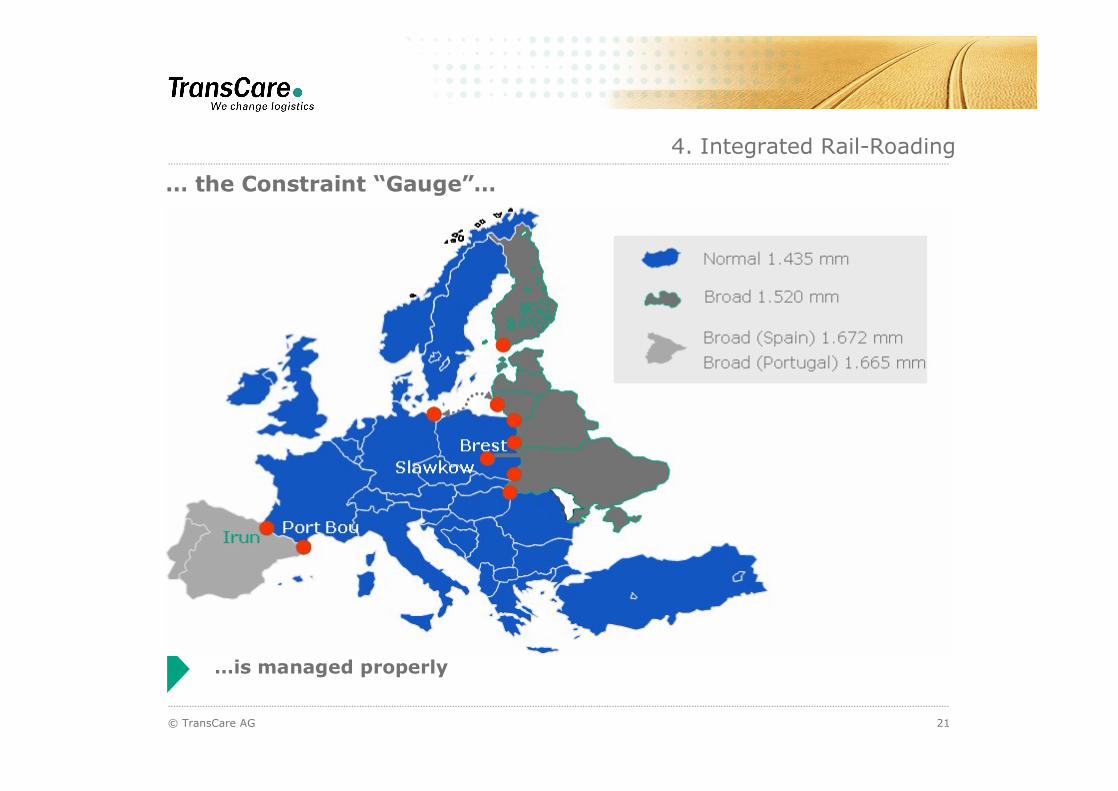
�is managed properly
� the Constraint �Gauge��
4. Integrated Rail-Roading
22© TransCare AG
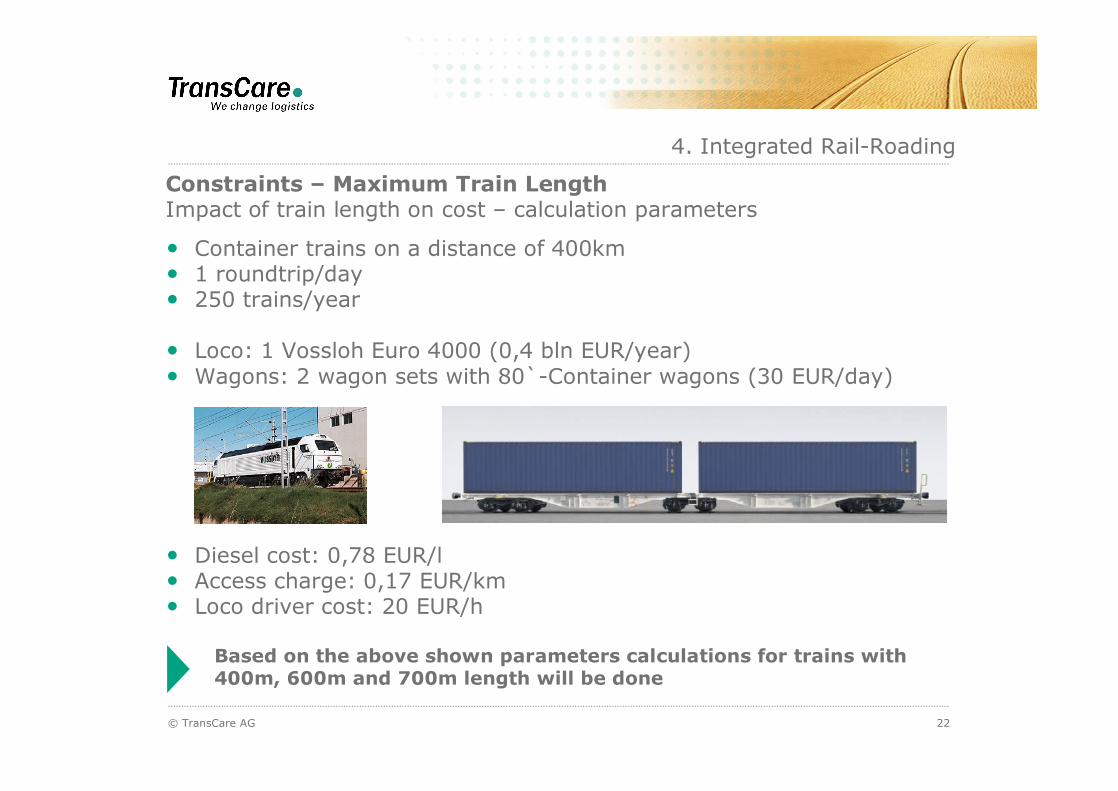
Based on the above shown parameters calculations for trains with400m, 600m and 700m length will be done
4. Integrated Rail-Roading
Constraints � Maximum Train LengthImpact of train length on cost � calculation parameters
� Container trains on a distance of 400km� 1 roundtrip/day� 250 trains/year
� Loco: 1 Vossloh Euro 4000 (0,4 bln EUR/year)� Wagons: 2 wagon sets with 80`-Container wagons (30 EUR/day)
� Diesel cost: 0,78 EUR/l� Access charge: 0,17 EUR/km� Loco driver cost: 20 EUR/h
23© TransCare AG
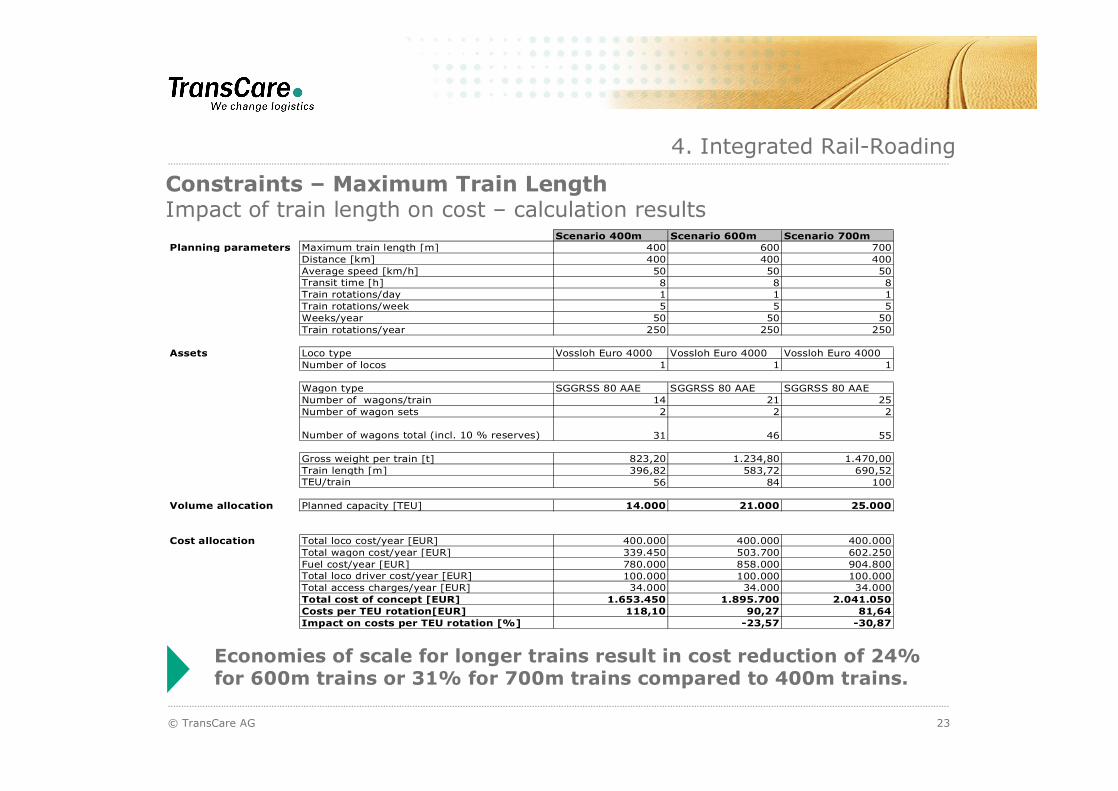
Economies of scale for longer trains result in cost reduction of 24% for 600m trains or 31% for 700m trains compared to 400m trains.
Scenario 400m Scenario 600m Scenario 700mPlanning parameters Maximum train length [m] 400 600 700
Distance [km] 400 400 400Average speed [km/h] 50 50 50Transit time [h] 8 8 8Train rotations/day 1 1 1Train rotations/week 5 5 5Weeks/year 50 50 50Train rotations/year 250 250 250
Assets Loco type Vossloh Euro 4000 Vossloh Euro 4000 Vossloh Euro 4000Number of locos 1 1 1
Wagon type SGGRSS 80 AAE SGGRSS 80 AAE SGGRSS 80 AAENumber of wagons/train 14 21 25Number of wagon sets 2 2 2
Number of wagons total (incl. 10 % reserves) 31 46 55
Gross weight per train [t] 823,20 1.234,80 1.470,00Train length [m] 396,82 583,72 690,52TEU/train 56 84 100
Volume allocation Planned capacity [TEU] 14.000 21.000 25.000
Cost allocation Total loco cost/year [EUR] 400.000 400.000 400.000Total wagon cost/year [EUR] 339.450 503.700 602.250Fuel cost/year [EUR] 780.000 858.000 904.800Total loco driver cost/year [EUR] 100.000 100.000 100.000Total access charges/year [EUR] 34.000 34.000 34.000Total cost of concept [EUR] 1.653.450 1.895.700 2.041.050Costs per TEU rotation[EUR] 118,10 90,27 81,64Impact on costs per TEU rotation [%] -23,57 -30,87
4. Integrated Rail-Roading
Constraints � Maximum Train LengthImpact of train length on cost � calculation results
24© TransCare AG
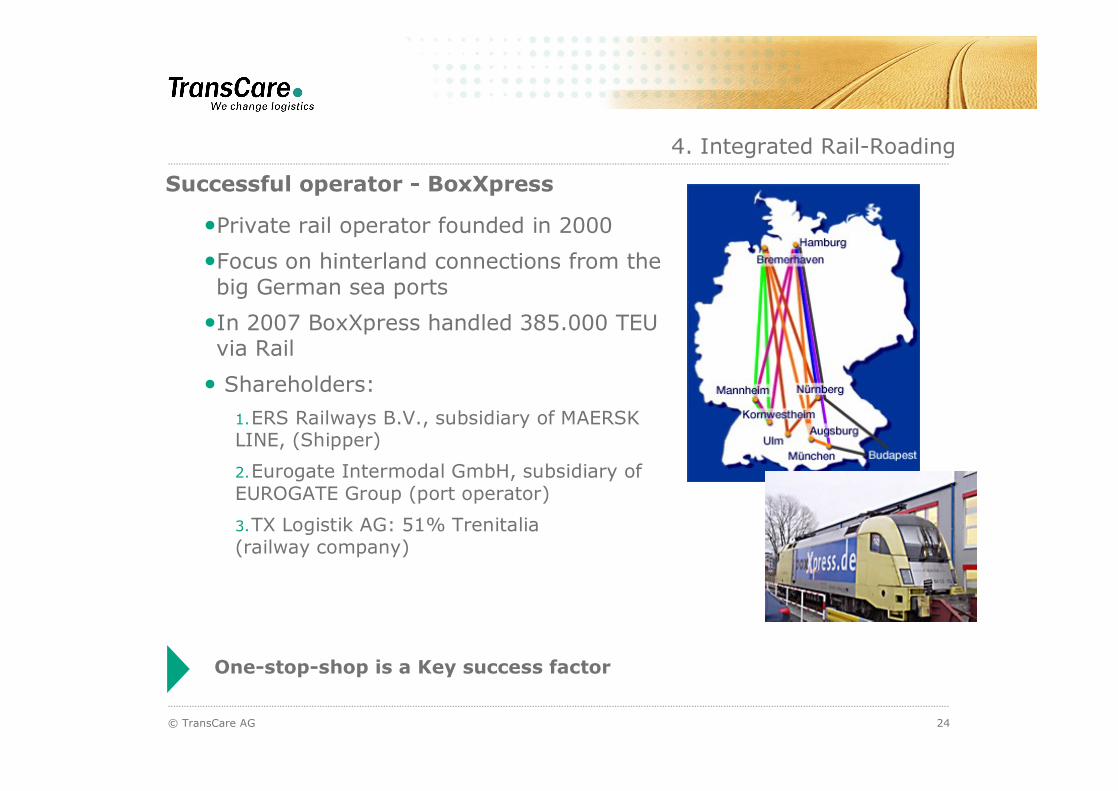
�Private rail operator founded in 2000
�Focus on hinterland connections from the big German sea ports
�In 2007 BoxXpress handled 385.000 TEU via Rail
� Shareholders:
1.ERS Railways B.V., subsidiary of MAERSK LINE, (Shipper)
2.Eurogate Intermodal GmbH, subsidiary of EUROGATE Group (port operator)
3.TX Logistik AG: 51% Trenitalia(railway company)
One-stop-shop is a Key success factor
4. Integrated Rail-Roading
Successful operator - BoxXpress
25© TransCare AG
Hinterland Hub
Main Line
Sea Port Terminal
4. Integrated Rail-Roading
Final Road Haulage
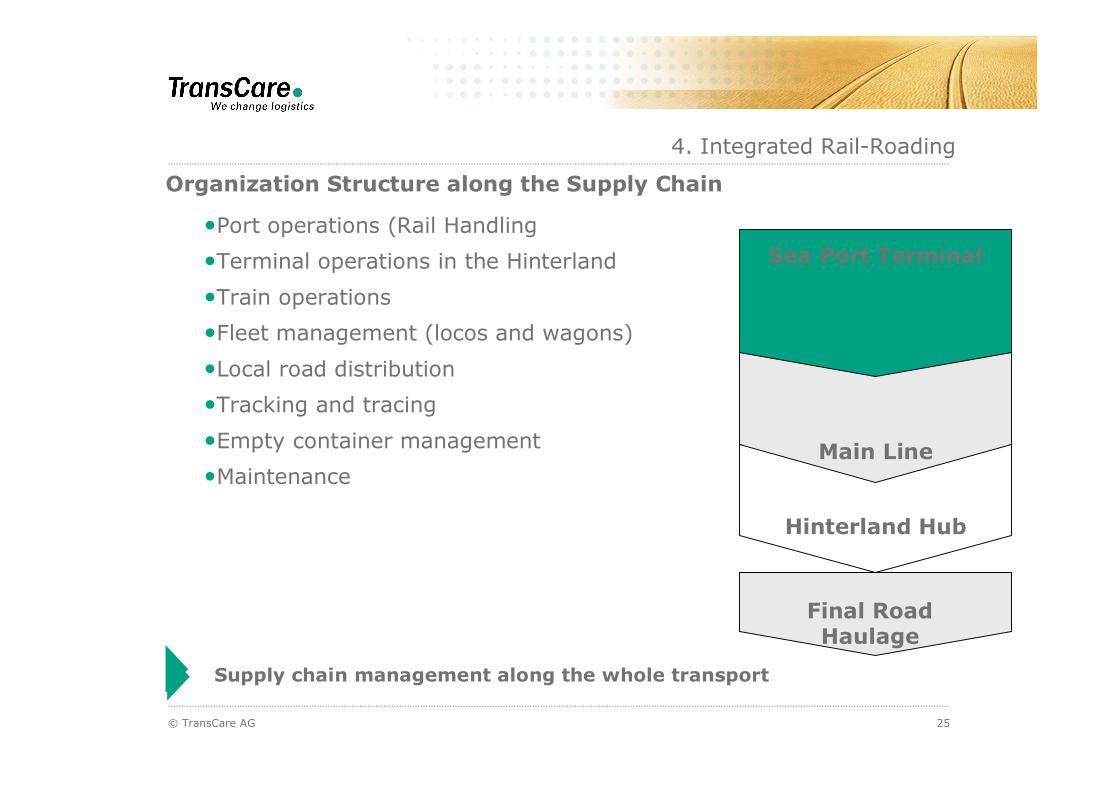
�Port operations (Rail Handling
�Terminal operations in the Hinterland
�Train operations
�Fleet management (locos and wagons)
�Local road distribution
�Tracking and tracing
�Empty container management
�Maintenance
Supply chain management along the whole transport
Organization Structure along the Supply Chain

© TransCare AG 26
Optimal Connection between Port and Hinterland
1. Key success Factors of Railway Supply Chains
2. Volumes and Volume Balance
3. Points of Consolidation
4. Integrated Rail-Roading
5. Impact of Liberalization
6. Summary
Content
27© TransCare AG
Impact of Liberalization on Rail Transport
� New players mean alternatives for the industries (for example in cases of strikes)
� New alliances and structures of cooperation
� Increased competition leads to increased quality and productivity
� Horizontal competition increased even vertical competitiveness
� Competition reduced the costs, pricing more competitive compared to Road
Establishing liberalization offers great chances for the Rail industry
5. Impact of Liberalization
28© TransCare AG 28
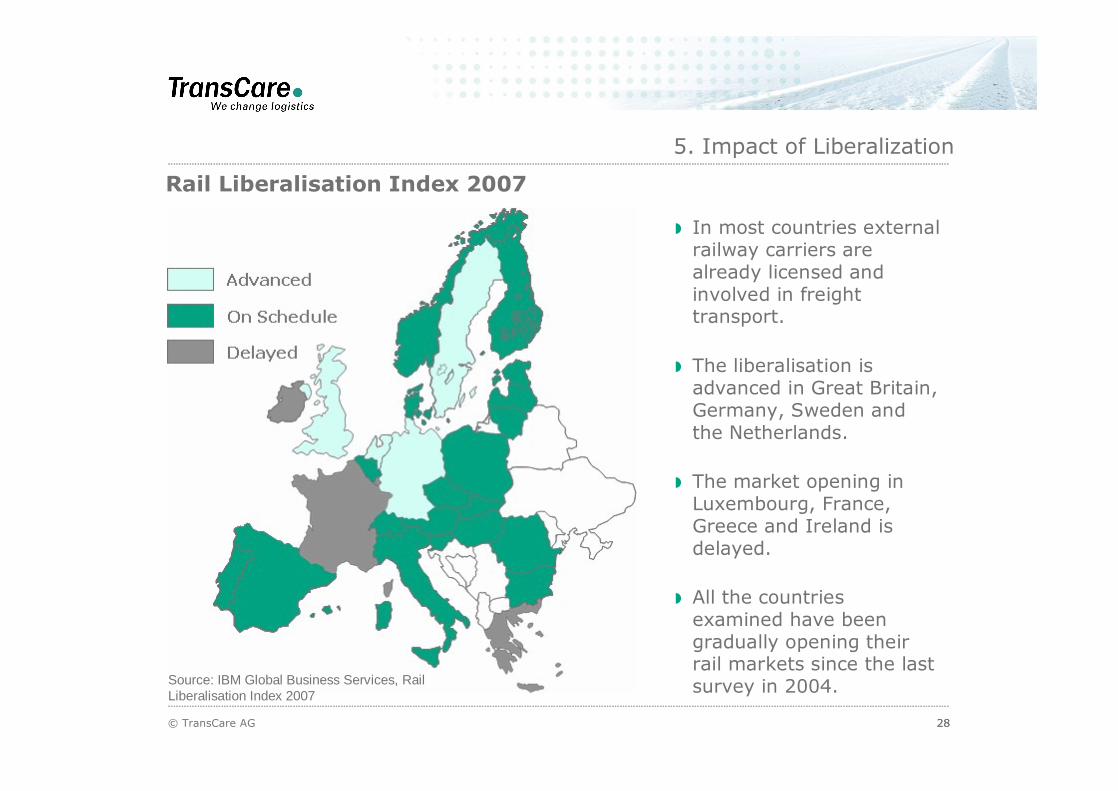
Source: IBM Global Business Services, Rail Liberalisation Index 2007
Rail Liberalisation Index 2007
In most countries external railway carriers are already licensed and involved in freight transport.
The liberalisation is advanced in Great Britain, Germany, Sweden and the Netherlands.
The market opening in Luxembourg, France, Greece and Ireland is delayed.
All the countries examined have been gradually opening their rail markets since the last survey in 2004.
5. Impact of Liberalization
29© TransCare AG
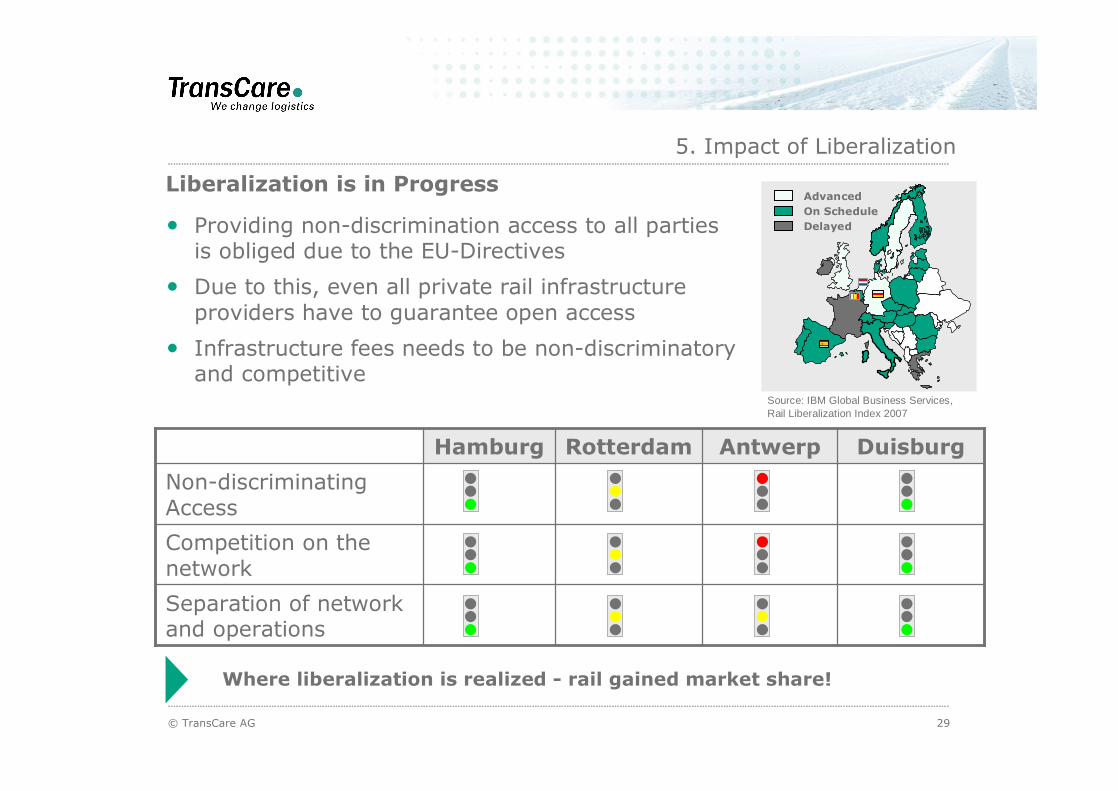
Liberalization is in Progress
Source: IBM Global Business Services, Rail Liberalization Index 2007
AdvancedOn ScheduleDelayed� Providing non-discrimination access to all parties
is obliged due to the EU-Directives
� Due to this, even all private rail infrastructureproviders have to guarantee open access
� Infrastructure fees needs to be non-discriminatoryand competitive
Where liberalization is realized - rail gained market share!
Separation of network and operations
Competition on the network
Non-discriminating Access
DuisburgAntwerpRotterdamHamburg
5. Impact of Liberalization
30© TransCare AG
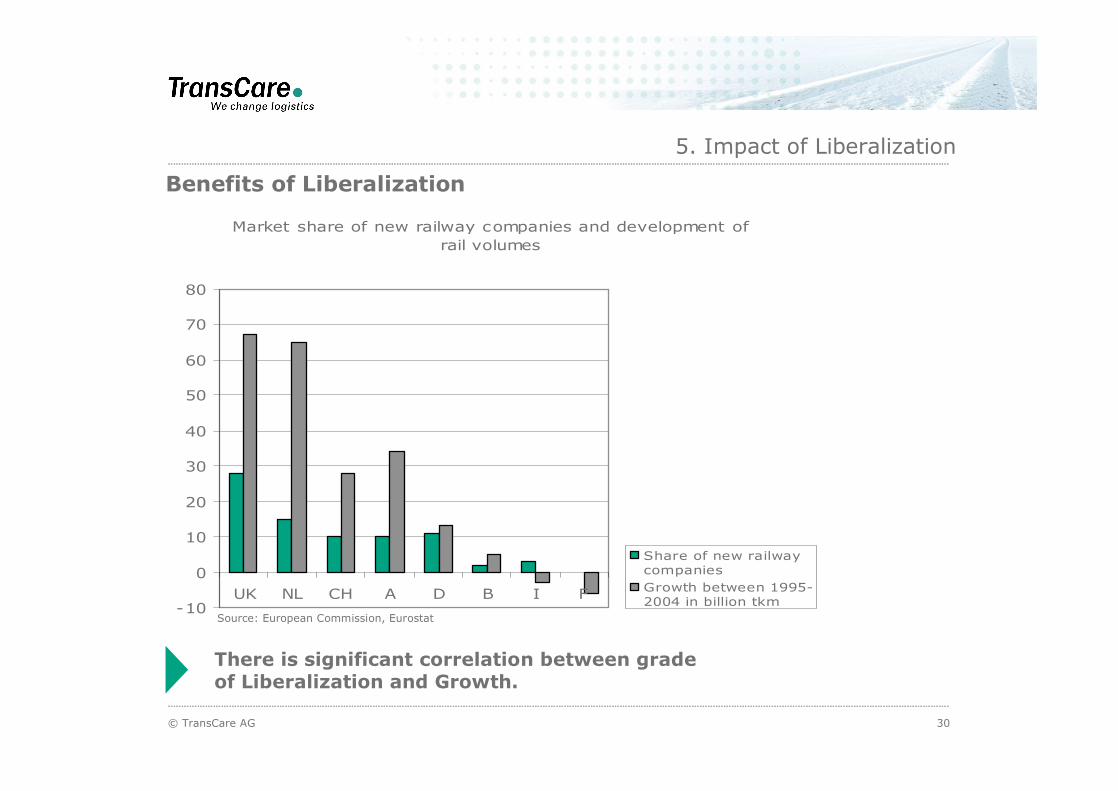
Benefits of Liberalization
There is significant correlation between grade of Liberalization and Growth.
Market share of new railway companies and development of rail volumes
-10
0
10
20
30
40
50
60
70
80
UK NL CH A D B I F
Share of new railwaycompaniesGrowth between 1995-2004 in billion tkm
Source: European Commission, Eurostat
5. Impact of Liberalization
31© TransCare AG
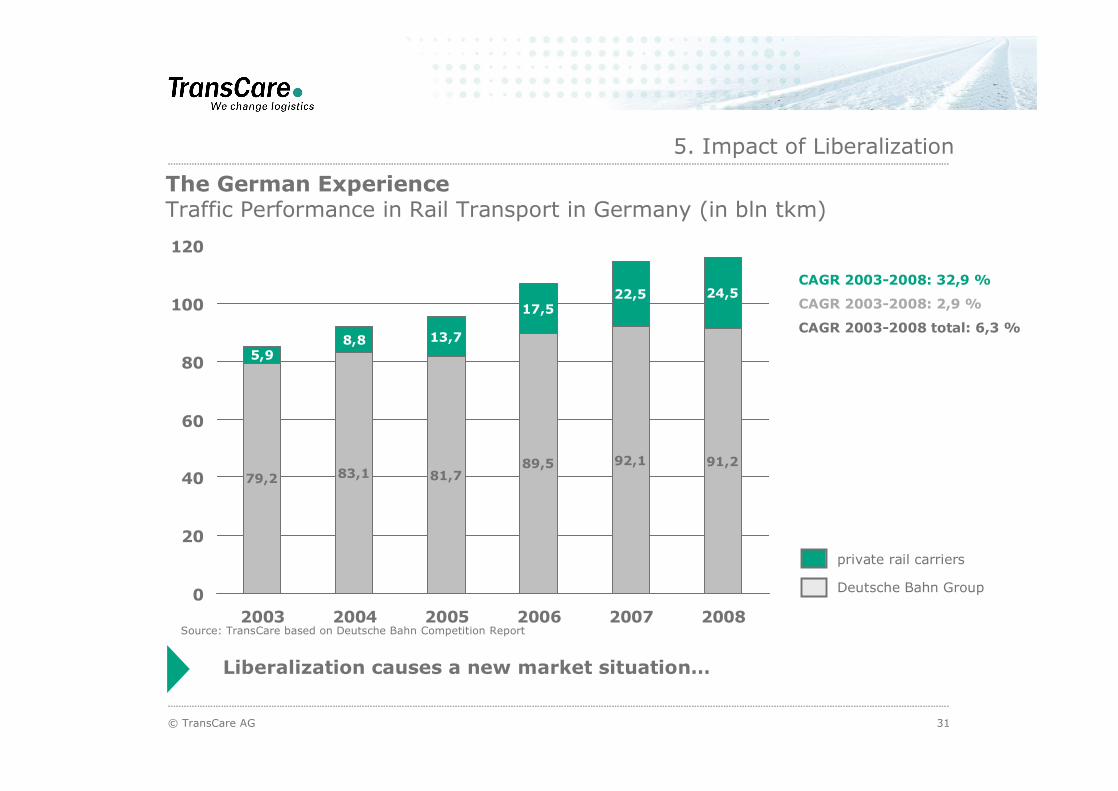
The German ExperienceTraffic Performance in Rail Transport in Germany (in bln tkm)
CAGR 2003-2008: 32,9 %
CAGR 2003-2008: 2,9 %
CAGR 2003-2008 total: 6,3 %
5. Impact of Liberalization
79,2 83,1 81,789,5 92,1 91,2
5,98,8 13,7
17,522,5 24,5
0
20
40
60
80
100
120
2003 2004 2005 2006 2007 2008
Liberalization causes a new market situation�
private rail carriers
Deutsche Bahn Group
Source: TransCare based on Deutsche Bahn Competition Report
32© TransCare AG
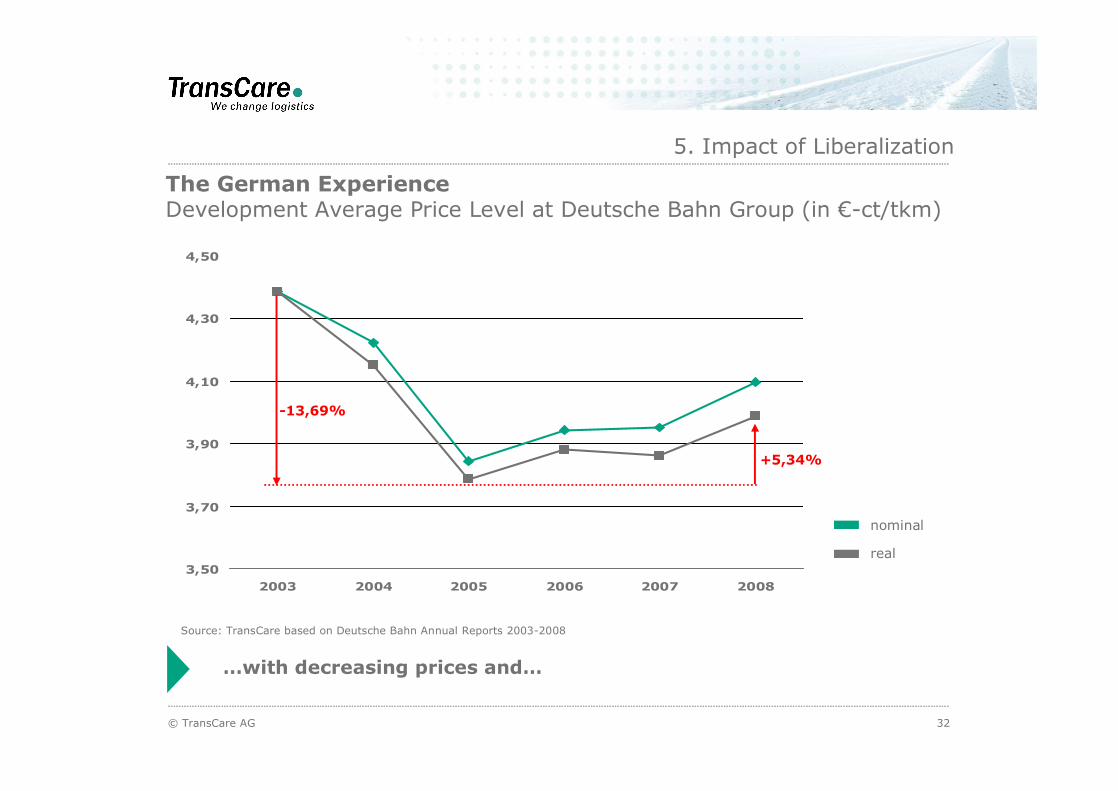
The German ExperienceDevelopment Average Price Level at Deutsche Bahn Group (in �-ct/tkm)
5. Impact of Liberalization
�with decreasing prices and�
3,50
3,70
3,90
4,10
4,30
4,50
2003 2004 2005 2006 2007 2008
nominal
real
-13,69%
+5,34%
Source: TransCare based on Deutsche Bahn Annual Reports 2003-2008
33© TransCare AG
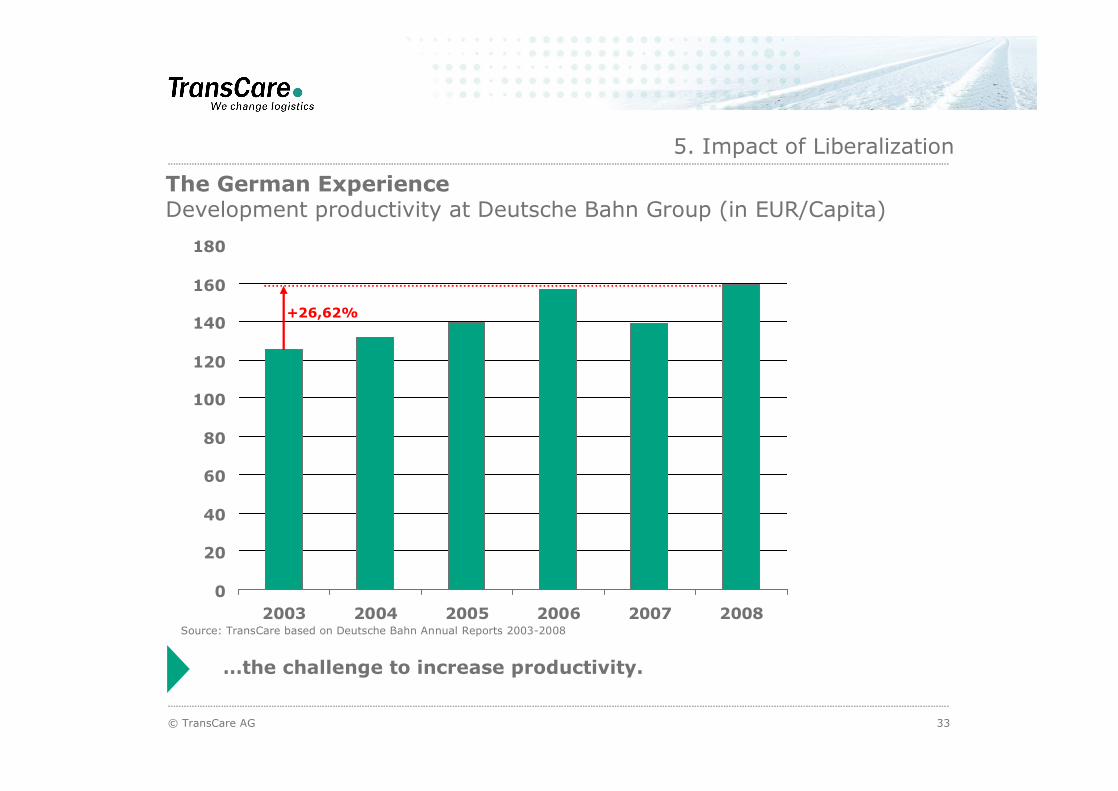
The German ExperienceDevelopment productivity at Deutsche Bahn Group (in EUR/Capita)
5. Impact of Liberalization
�the challenge to increase productivity.
0
20
40
60
80
100
120
140
160
180
2003 2004 2005 2006 2007 2008
+26,62%
Source: TransCare based on Deutsche Bahn Annual Reports 2003-2008
© TransCare AG 34
Optimal Connection between Port and Hinterland
1. Key success Factors of Railway Supply Chains
2. Volumes and Volume Balance
3. Points of Consolidation
4. Integrated Rail-Roading
5. Impact of Liberalization
6. Summary
Content
35© TransCare AG
Ports are not providing integrated rail terminals for intermodalhandling
Road market is not interested in rail
Railways are not really in competition � lack of private operators
Industry does not care � as far as road delivers
Nobody is taking consequently the initiative
There are great chances for rail transport in Spain! Small share of rail in transportation
Reasonable volumes
Long distances
Huge investments in infrastructure
Interest of big European players in Spanish market
Significant increase of intermodalism is possible
6. Summary
The lack of intermodal Transports in Spain is �House-made�
© TransCare AG 36
Thank you for your attention!