a study on tv consumption_final draft
TRANSCRIPT

Study of TV Program Consumption Among Youth in
Cochin City
Submitted by
Deeptwesh DM
Reg No: 85213186
In partial fulfilment of the requirements for the award of the degree of
MASTER OF BUSINESS ADMINISTRATION
Of
COCHIN UNIVERSITY OF SCIENCE AND TECHNOLOGY
MAY 2015
DEPARTMENT OF MANAGEMENT STUDIES
Toc H INSTITUTE OF SCIENCE & TECHNOLOGY
Arakkunnam P.O, Ernakulam District, KERALA –682 313

DECLARATION
I hereby declare that the Project Report titled ―Study of TV Program
Consumption Among Youths in Cochin City” is a record of bonafide
work done by me under the supervision of Dr. Suresh Manimala, Professor
and Dean, Dept of Management Studies, Toc H Institute of Science &
Technology and that no part of this report has formed the basis for award of
any degree, diploma, associate ship, fellowship or any other similar title or
recognition in any other institution.
Cochin
Date Deeptwesh DM

Toc H INSTITUTE OF SCIENCE & TECHNOLOGY
Arakkunnam P.O, Ernakulam District, KERALA – 682 313
DEPARTMENT OF MANAGEMENT STUDIES
Certificate
This is to certify that the project titled “Study of TV Program Consumption
Among Youths in Cochin City” submitted by Deeptwesh DM of MBA Semester
IV is a bonafide account of the work done by him / her under our supervision,
during the academic year 2014 - 2015 in partial fulfilment of the requirements
for the award of the degree of MASTER OF BUSINESS ADMINISTRATION
of COCHIN UNIVERSITY OF SCIENCE AND TECHNOLOGY
………………………… ..……………….........
Dr. Hareesh N Ramanathan Dr. Suresh Manimala
Project Guide and HOD Dean
…………………………………. Prof Dr V Vincent H Wilson
Principal

ACKNOWLEDGEMENT
First and foremost, I thank God for his Almighty support and mercy drop of
blessings upon me to complete my project within the stipulated time.
I owe my sincere thanks to Prof. Dr.Suresh Manimala (Professor and Dean, Dept of
Management Studies, Toc H Institute of Science & Technology and faculty
guide) who supported me throughout the work with excellent guidance. I take this
opportunity to thank all other faculties in college and staff members for their
valuable suggestions and sincere co-operation rendered to me during the academic
period.
I wish to pay my gratitude to my parents and family members for their constant
encouragement, motivation, help and moral support throughout my academic
pursuits.
Finally, I must extend thanks to all my friends and well-wishers for the
encouragement, sustained help and prayer which I got from them

TABLE OF CONTENTS
Content No. Page No.
1 Introduction
1.1 Introduction 2
1.2 Background of the study 4
1.3 Scope of the study 5
1.4 Statement of the Problem 5
1.5 Objectives 5
1.6 Limitations of study 5
2 Review of literature
2.1 Review of literature 7
3 Methodology
3.1 Introduction 11
3.2 Research design 11
3.3 Data Source 11
3.4 Instrument development 11
3.5 Tools for analysis 12
4 Data Analysis and Discussion
4.1 Introduction 15
4.2 Demographic profile 15
4.3 Ranks 31
4.4 Perception of Youth on TV Programs 41
4.5 Frequency Determination 43
5 Findings and Conclusion
5.1 Findings 46
5.2 Conclusion 48
Bibliography
Appendices

LIST OF TABLES
Table No. Title of the Table Page No.
4.2.1 Age 15
4.2.2 Sex 16
4.2.3 Income 17
4.2.4 Profession 17
4.2.5 Cross Tabs 18
4.2.6 Chi Square 19
4.2.7 Gender wise TV Viewing during weekdays 20
4.2.8 Chi Square 21
4.2.9 Gender wise TV Viewing during weekends 22
4.2.10 Chi Square 23
4.2.11 Preference to watch TV regularly 23
4.2.12 Chi Square 24
4.2.13 Normal Response During Commercials 25
4.2.14 Chi Square 26
4.2.15 Instances where channels are not Switched 27
4.2.16 Chi Square 28
4.2.17 Most preferred time for TV viewing during weekdays 29
4.2.18 Chi Square Test 30
4.3.1 Most Preferred Program Category 31
4.3.2 Hypothesis Test Summary 32
4.3.3 Pair wise Comparison 34
4.3.4 Most preferred time for TV viewing during weekends 35
4.3.5 Hypothesis Test Summary 36
4.3.6 Most preferred channel for movies 38
4.3.7 Most preferred channel for music 39
4.3.8 Most preferred channel for sports 40
4.3.9 Most preferred channel for reality shows 40
4.3.10 Most preferred channel for news 41
4.4.1 Televisions and Brand awareness 42

LIST OF FIGURES
Figure No. Title of the Figures Page No.
4.2.1 Age 16
4.3.1 Related Sample-Friedman Two Way Analysis of
Variance by Ranks 33
4.3.2 Pair wise Comparison 33
4.3.3 Related Sample-Friedman Two Way Analysis of
Variance by Ranks 36
4.3.4 Pair wise Comparison 37
4.4.1 TV and Brand Awareness 42
4.5.1 Frequency Distribution 43

1
Chapter 1
Introduction
\
2
1.1 Introduction
Television has become one of the most important mass media tools especially in
recent years. Dorr (1986) states that TV stands out from other media as it is generally
used more and can present more life like content than most of other media. Amount
of television watched and importance given to the DVDs/VCDs and channel
programs are the main determinants of TV consumption pattern. Ever since the 1ate
1940s when television first became available, social scientists have been interested in
its effect on behavior. Originally seen as entertainment for adults and older children,
television in the twenty-first century is watched by all age groups, including infants.
Television has capability to provide substantial benefits for youngsters when it is
used with awareness and for education purposes. However, generally speaking,
television programs that include violence events increase youngster‘s level of
aggression, and commercials shape consumption habits through youngsters.
Exposure to scenes of violence matters negative role models on TV may increase
direct, indirect, relational and social aggression in both girls and boys. Different
changes were seen on TV-viewing habits of youngsters in recent years. It is observed
that the duration of TV-viewing in general and the duration of watching TV alone
have increased.
India‘s entertainment economy is growing rapidly, and the world is taking
note. The country is among the world‘s youngest nations, with more than half a
billion people under the age of 25. With favourable demographics and a rise in
disposable incomes, the propensity to spend on leisure and entertainment is growing
faster than the economy itself. Enticed by economic liberalization and the huge
volume of demand for leisure and entertainment, many of the global media giants
have been present in the Indian market for more than two decades. However, in
recent years, with near double-digit annual growth and a fast-growing middle class,
there has been a renewed surge in investment in the country by global companies.
Companies in the US and Western Europe see their growth increasingly linked to
emerging giants like India, which is why they are now focused on the best way to
enter, grow and brand their business in this market.
3
With more than 600 television channels, 100 million pay-TV households,
70,000 newspapers and 1,000 films produced annually, India‘s vibrant media and
entertainment (M&E) industry provides attractive growth opportunities for global
corporations. Enticed by economic liberalization and high volumes of consumption,
many of the world‘s media giants have been present in the Indian market for more
than two decades. However, in recent years, with near double-digit annual growth
and a fast-growing middle class, there has been a renewed surge in investments into
the country by global companies.
Media sectors regarded as ―sunset‖ industries in mature markets are fl
ourishing in India, presenting global media companies with exciting opportunities to
counter declining revenues. For example, the newspaper industry, which is facing
declining readership in many international markets because of digital media,
continues to thrive in India, driven by increasing literacy rates, consumer spending
and the growth of regional markets and specialty newspapers. India is the second-
largest pay-TV market in the world, with 108 million subscribers and a reach of 48%
of Indian households.38 The TV distribution industry is dominated by analog cable,
which is highly fragmented and includes about 60,000 LCOs and 1,000 multi-system
operators (MSOs). However, fierce competition among DTH operators and a recent
Government policy mandating the digitization of cable TV is driving the growth of
digital TV.
1.1.1 Undefined Taste of Indian Youth
India is a very young country not because of its own age but because of its
young population, which accounts for nearly fifty percent of its total population. It is
very difficult for the marketers to catch their attention as the youth is surrounded
with many distractions, and to beat the competition, communication is a very good
strategy left with the marketers. The marketers are communicating with their target
audience 24×7 so that their brand can stay in the top of their customers minds. But
when the target is youth, the marketers get confused as the youth has an exposure to
a wide range of media. They have an exposure to at least two media at any point of
time.

4
This research paper is an attempt to study the media consumption pattern of
the youth so that a better media strategy can be developed.
1.2 Background of the study
India has been tagged as one of the most complex and hottest economies in the
world inhabited by a billion people, Roughly half of them is aged between the ages
15 – 29 years and their purchasing power is soaring an all time high. According to
MTV International well being study (2008), youth across India spend up to Rs. 9
billion in pocket money every day. It is made up of a generation that has grown up
with more choices, more access to information, more money to spend and
opportunities than any other generation of Indians before it. India's youth are already
having an enormous impact: on the economy, on companies hoping to sell them
products, on the media, and on the culture. Liberalization's children also differ from
their conservative parents in that they proudly mix Indian values with Western
packaging. This youth will demand a more cosmopolitan society that is a full-fledged
member of the global economy. They will start their own businesses and contribute
to a more vibrant economy. They also are likely to demand more accountability from
their politicians.
MTV in its latest youth study classifies youth as follows:
Homebodies who are traditional, collective and have low individuality
Two-faced - inwardly traditional, outwardly modern
Wannabes - those who show-off, are materialistic, desperate to be a part of
a crowd
Rebels who want to think and do differently but who won‘t rebel overtly
Cool guys, who work hard, play hard, are confident, have strong
individuality and are full of aspirations.
Youth is the most hard to please segment for the marketers, but then they cannot
afford to ignore them as a chunk of products are targeted at them and before starting
marketing to youth, the marketer needs to connect to them with different media. Thus
for a marketer it is important to understand what they watch, listen or read.
5
1.3 Scope of the study
Media Planning
Media Buying
Promotional strategy
Marketers have always been trying to decode the Indian youth‘s media
consumption pattern especially with respect to television as a major share of their
promotional strategies are planned in the form of television commercial. So it is
important to understand what they watch, which time they watch and through which
channel they watch.
This study emphasis on decoding the Television Program Consumption pattern of
youth with respect to their gender thereby reducing the confusion for marketers in
planning their advertising activities to youth through Television.
1.4 Statement of Problem
Youth‘s choices regarding television viewing is very specific to one another and
cannot be generalised. It is also dependent on one‘s taste, preferences, and
demographics. Hence it has become very difficult to analyse those similar patterns
among youth.
1.5 Objectives
To study the TV program consumption pattern of urban youth in
Cochin
To identify the most preferred TV channels, Program categories and
Programs among youth in Cochin
To identify opportunity zones to advertise for youth
1.6 Limitation of the study
The focus for this research will be onto Youth living in Cochin.
Television channels and programs have not been categorised on the
basis of language.

6
Chapter 2
Review of literature
7
2.1 Review of literature
(Valaskakis, 1983)in his study examined television viewing tastes and habits
among the Inuit Indians of the Eastern and Central Arctic. The findings revealed that
the amount of different types of programming was significantly different among the
Inuit Indians. Accordingly, the underlying assumption is that, the Inuit males who are
heavily engaged in television's sports fare, would underestimate the mean world of
television.
Television above all, accessible and understood by lay people, has become not
just the site where such reflexivity takes place, it actually pro-videos the specific
terms and forms of everyday talk and practice in the light of incoming knowledge.
Often, when local media productions largely fail to respond to the changing socio-
economic status and desire of women in a transitional society, it is global television
that is instead appropriated for making contact with the diverse formations of culture
and for talking about the everyday issues of gender and sexuality (Kim, 2009)
(Lowery, Shearon; DeFleur , Melvin L;, 1988) showed in their research that
children tend to watch more television than do adults, prefer to watch adult
programs, and usually watch as late into the night as do adults. Despite their
emergence from the more limited world of childhood and their increased reliance on
peers, adolescents continue to spend a great deal of their time watching television.
(S, 1993) in her study found that MTV programmes are changing the entire
music scene in Asia. Multinational rock music or world music is becoming the
mainstream popular music among the youth in Asia, while the traditional style is
becoming obscure and obsolete.
(N & Bajpai, 1996) found in their study that about 48% upper class and 62%
middle-class Indians watch Television for more than two hours per every day
(Nabiha, 2000) suggests through research that TV has a long-term effect on people‘s
thinking. Therefore, instead of glamorization, portrayal of crime and
commercialization, positive trends need to be introduced on the TV channels in order
to save our values. (Bukhari, 2002) concludes that the youth is getting liberated ideas
regarding the placement and position of women in the society.

8
(Corneo, 2002) found out in his research that in OECD countries watching
television is by far the most time-consuming form of leisure. Surprisingly, television
viewing is positively correlated with work hours across countries. Workers and
capitalists are shown to exhibit opposite preference orderings over equilibria. The
relative ability of those two groups in capturing a country's government may explain
which equilibrium is selected.
(S & W, 2002) in their study found that adolescents watch television for 12 hour
per week on an average. The study further indicates that Television viewing is seen
as a major source of stress relieving activity. It was concluded in the study that 29%
of viewers watch television for purpose of learning/education.
(Ahluwalia & R, 2011) found in their study that on an average, children watch
two hours or less of TV daily and most of them indulged in bedtime TV Viewing.
They watched TV primarily for entertainment and for learning. Children‘s most
preferred program was children shows/serials, followed by cartoon/animated
programs.
KPMG Industry Discussion (Jan 2014 ) Digitisation of cable saw the television
industry still on the path of progress, with the mandatory Digital Access System
(DAS) rollout almost complete in Phase II cities. The impact was felt to the extent
that carriage fees saw a reduction of 15-20 per cent overall.
The proliferation of satellite and cable television and online networks, enabled
by sophisticated digital technologies and the deregulation and liberalization of
broadcasting and telecommunications in the 1990s, has created a new global media
landscape, a complex terrain of multi-vocal, multimedia and multi-directional flows
offering enormous challenges and opportunities (Thussu, 2007)
The globalisation of the digital revolution has ensured that media content is
instantaneously delivered and widely accessible in a uniform format—in the form of
text, sound, still-and-moving pictures and databases. Corporations are already
speaking about a ‗pervasive media‘ environment. As an IBM report envisioned:
‗Between now and 2010, the increasing affordability, saturation, transmission speed
and massive data storage capacity of emerging digital technologies will enable new
formats and functionalities, multiplying and deepening the connectivity of users
around the globe‘ (IBM, 2004)

9
(TR, 2002) In a study conducted in Kerala in 2002, The preferences of the
younger generation with respect to TV programming was analysed. Music was
found to be the most preferred program component followed by movies.

10
Chapter 3
Methodology

11
3.1 Introduction
Youth‘s choices regarding television viewing is very specific to one another and
cannot be generalised. This study emphasis on decoding the Television Program
Consumption pattern of youth by analysing most watched Channels, Program
categories, Programs, and preferred timings.
3.2 Research design
The research design that used for the study is Descriptive in nature, it is
conducted to understand the TV consumption pattern and perceptions associated with
different programs. The most preferred timings for watching Television and amount
of time spend on TV during weekends and weekdays are also found out. Sampling
technique used is convenient sampling. While not representative of the population in
general, College students and freshly employed do constitute a major share of the
market for many products targeted at youth.
3.3 Data source
3.3.1 Primary data
Data‘s are being collected directly from the respondents with the help of
questionnaire. Convenient sampling method is being used for data collection using
questionnaires.
3.4 Instrument development
Questionnaire developed based on several studies and articles both international
and national. Out of those, Study on ―Television on Indian Adolescent Life‖
published in journal of youth and adolescence 2002 and ―Foreign Television and
Indian Youth: Changing Attitudes‖ by Peddiboyina Vijayalakshmi 2002 were taken
as the main reference.
12
3.5 Tools for analysis
3.5.1 Descriptive statistics
In the research mean is use to find the average of variables like age. Frequency
is used to find the number of occurrence of different perceptions and ranks given is
associated with most preferred channel category, channels and programs.
3.5.2 Henry Garrett weighted Ranking
Henry Garrett ranking is being used to rank the determine the favourite program
category, programs and associated channels.
Per cent position = 100(𝑅𝑖𝑗−0.05)
𝑁𝑗
Where, Rij = Total Score of Weighted Average
Nj = Total No of Respondents
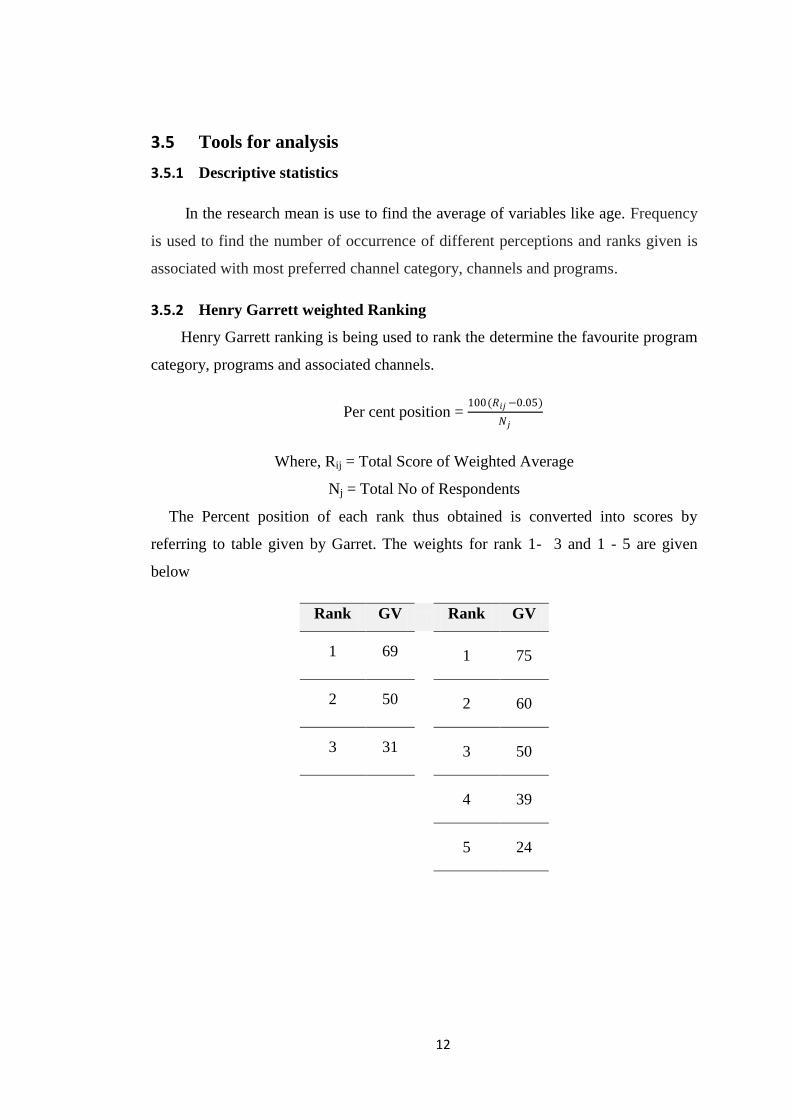
The Percent position of each rank thus obtained is converted into scores by
referring to table given by Garret. The weights for rank 1- 3 and 1 - 5 are given
below
Rank GV
Rank GV
1 69 1 75
2 50 2 60
3 31 3 50
4 39
5 24

13
3.5.3 Friedman test
The Friedman test is a non-parametric statistical test developed by
the U.S. economist Milton Friedman. Similar to the parametric repeated
measures ANOVA, It is used to test for differences between groups when the
dependent variable being measured is ordinal. The procedure
involves ranking each row (or block) together, then considering the values of
ranks by columns. Applicable to complete block designs, it is thus a special
case of the Durbin test. Friedman test is being done to compare the significance
between several ranks and perceptions associated with the colours.
3.5.4 Chi Square Test
Chi-square test is used in the study to test the probability of independence
of a distribution of data in the cross tabs showing television consumption of
youth with respect to gender.

14
Chapter 4
Data Analysis and Discussion

15
4.1 Introduction
Youth‘s choices regarding television viewing is very specific to one another and
cannot be generalised. It is also dependent on one‘s taste, preferences, and
demographics. Therefore, Rather than simple guessing it is important to analyse
those similar patterns of media consumption among youth. The main objective of this
study is the following:
To study the TV program consumption pattern of urban youth in
Cochin
To identify the most preferred TV channels, Program categories and
Programs among youth in Cochin
To identify opportunity zones to advertise for youth
4.2 Demographic profile
4.2.1 Age
Table 4.2.1(a)
Mean 22.3641
Std. Deviation 1.85123
Range 8.00
Minimum 18.00
Maximum 26.00
The Mean age of the respondents is 22.36 having a Standard Deviation of 1.85.
The youngest respondent is 18 years old and the eldest 26 years old. The range of the
respondent‘s age is 8.

16
Figure 4.2.1
4.2.2 Sex
Table 4.2.2
Sex
Frequency Percent Valid Percent Cumulative
Percent
Valid
Male 118 54.38 54.38 54.38
Female 99 45.62 45.62 45.62
Total 217 100 100.0
Missing Not Responded 0 0
Total 217 100.0
From the above table it can be said that 118 of the respondents were male and
contribute 54.38% of the total respondents. 99 of the respondents were female and
contribute 45.62% of the total respondents.
17
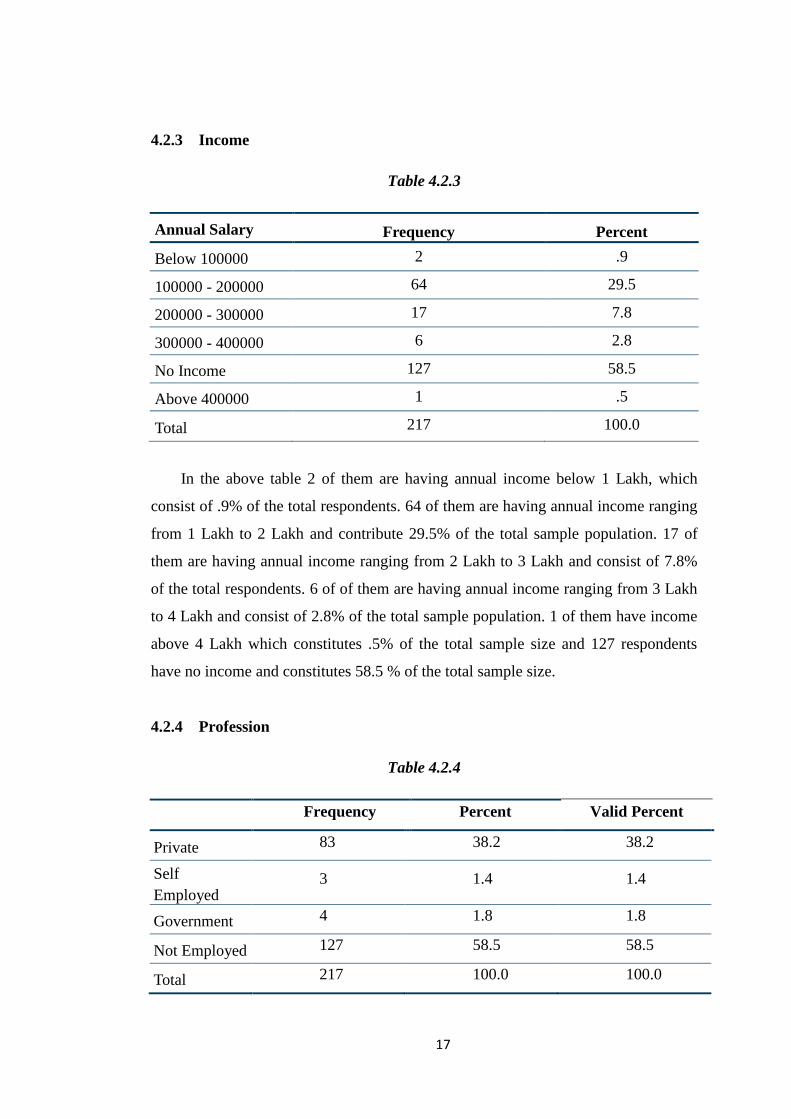
4.2.3 Income
Table 4.2.3
Annual Salary Frequency Percent Below 100000 2 .9
100000 - 200000 64 29.5
200000 - 300000 17 7.8
300000 - 400000 6 2.8
No Income 127 58.5
Above 400000 1 .5
Total 217 100.0
In the above table 2 of them are having annual income below 1 Lakh, which
consist of .9% of the total respondents. 64 of them are having annual income ranging
from 1 Lakh to 2 Lakh and contribute 29.5% of the total sample population. 17 of
them are having annual income ranging from 2 Lakh to 3 Lakh and consist of 7.8%
of the total respondents. 6 of of them are having annual income ranging from 3 Lakh
to 4 Lakh and consist of 2.8% of the total sample population. 1 of them have income
above 4 Lakh which constitutes .5% of the total sample size and 127 respondents
have no income and constitutes 58.5 % of the total sample size.
4.2.4 Profession
Table 4.2.4
Frequency Percent Valid Percent
Private 83 38.2 38.2
Self
Employed 3 1.4 1.4
Government 4 1.8 1.8
Not Employed 127 58.5 58.5
Total 217 100.0 100.0
18
From the above table, 127 of them are not employed which contributes 58.5% of
the total respondents. 3 of the total respondents are self employed which contributes
to 1.4%. 83 of the respondents are employed in private firms and contribute 38.2%. 4
of them are government employees and contributed 1.8% of the total population.
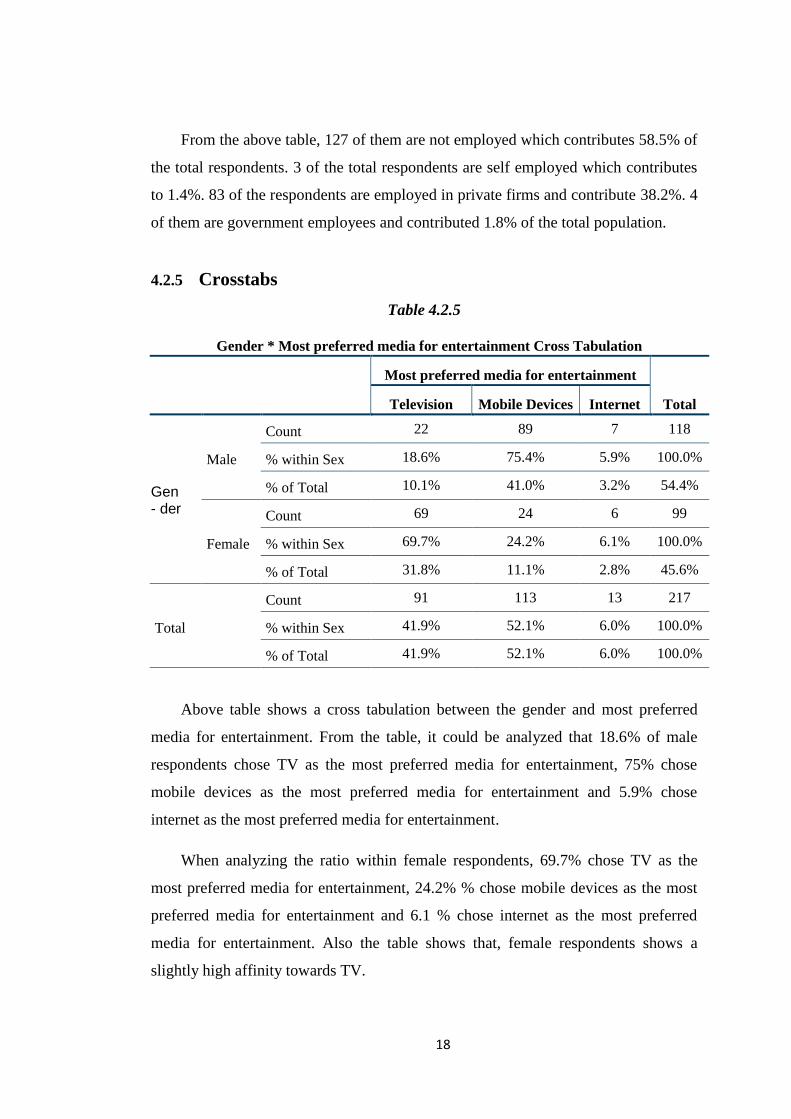
4.2.5 Crosstabs
Table 4.2.5
Gender * Most preferred media for entertainment Cross Tabulation
Most preferred media for entertainment
Total Television Mobile Devices Internet
Gen - der
Male
Count 22 89 7 118
% within Sex 18.6% 75.4% 5.9% 100.0%
% of Total 10.1% 41.0% 3.2% 54.4%
Female
Count 69 24 6 99
% within Sex 69.7% 24.2% 6.1% 100.0%
% of Total 31.8% 11.1% 2.8% 45.6%
Total
Count 91 113 13 217
% within Sex 41.9% 52.1% 6.0% 100.0%
% of Total 41.9% 52.1% 6.0% 100.0%
Above table shows a cross tabulation between the gender and most preferred
media for entertainment. From the table, it could be analyzed that 18.6% of male
respondents chose TV as the most preferred media for entertainment, 75% chose
mobile devices as the most preferred media for entertainment and 5.9% chose
internet as the most preferred media for entertainment.
When analyzing the ratio within female respondents, 69.7% chose TV as the
most preferred media for entertainment, 24.2% % chose mobile devices as the most
preferred media for entertainment and 6.1 % chose internet as the most preferred
media for entertainment. Also the table shows that, female respondents shows a
slightly high affinity towards TV.

19
H0: there is no relation between gender and most preferred media for entertainment
H1: there is relation between gender and most preferred media for entertainment
4.2.6 Chi Square Test
Table 4.2.6
Value df
Asymp. Sig.
(2-sided) Pearson Chi-Square 60.542
a 2 .000
Likelihood Ratio 63.686 2 .000 Linear-by-Linear Association 39.697 1 .000 N of Valid Cases 217
a. 0 cells (.0%) have expected count less than 5. The minimum expected count is 5.93.
Here the data is found to be significant. So we accept the hypothesis that there is
relation between gender and most preferred media for entertainment

20
4.2.7 Gender * Hours you spend watching Television during weekdays
Table 4.2.7
Hours spend watching Television during
weekdays Total 0 – 1 1 - 2 2 - 3 3 - 4
Sex
Male
Count 16 65 28 9 118
% within
Sex
13.6% 55.1% 23.7% 7.6% 100.0%
% of Total 7.4% 30.0% 12.9% 4.1% 54.4%
Female
Count 1 6 19 73 99
% within
Sex
1.0% 6.1% 19.2% 73.7% 100.0%
% of Total 0.5% 2.8% 8.8% 33.6% 45.6%
Total
Count 17 71 47 82 217
% within
Sex
7.8% 32.7% 21.7% 37.8% 100.0%
% of Total 7.8% 32.7% 21.7% 37.8% 100.0%
Above table shows a cross tabulation between the gender and hours spend
watching Television during weekdays.
When analyzing the ratio within male respondents, it could be inferred that
13.6% of male respondents spend 0-1 hour watching Television during weekdays.
55.1% spend 1-2 hour watching Television during weekdays, 23.7% spend 2-3 hour
watching Television during weekdays and 7.6% spend 3-4 hour watching Television
during weekdays
When analyzing the ratio within female respondents, it could be inferred that
1.0% of female respondents spend 0-1 hour watching Television during weekdays.
6.1% spend 1-2 hour watching Television during weekdays, 19.2% spend 2-3 hour
watching Television during weekdays and 73.7% spend 3-4 hour watching

21
Television during weekdays. Also it is found that females spend more time watching
television during weekdays.
H0: there is no relation between gender and hours spend watching Television during
weekdays
H1: there is relation between gender and hours spend watching Television during
weekdays
4.2.8 Chi Square Test
Table 4.2.8
Value df
Asymp. Sig.
(2-sided) Pearson Chi-Square 113.142
a 3 .000
Likelihood Ratio 130.258 3 .000
Linear-by-Linear Association 104.625 1 .000
N of Valid Cases 217 a. 0 cells (.0%) have expected count less than 5. The minimum expected count is 7.76.
Here the data is found to be significant. So we accept the hypothesis that there is
relation between gender and hours spend watching Television during weekdays

22
4.2.9 Gender * Hours spend watching Television during weekends
Table 4.2.9
Hours spend watching Television during
weekends Total
0 - 3 3 - 5 5 - 7 Above 7
Male
Count 17 77 15 9 118
% within
Sex 14.4% 65.3% 12.7% 7.6% 100%
% of Total 7.8% 35.5% 6.9% 4.1% 54.4%
Female
Count 3 8 62 26 99
% within
Sex 3.0% 8.1% 62.6% 26.3% 100%
% of Total 1.4% 3.7% 28.6% 12.0% 45.6%
Total
Count 20 85 77 35 217 % within
Sex
9.2% 39.2% 35.5% 16.1% 100.0
% % of Total 9.2% 39.2% 35.5% 16.1% 100.0
%
Above table shows a cross tabulation between the gender and hours spend
watching Television during weekends.
When analyzing the ratio within male respondents, it could be inferred that
14.4% of male respondents spend 0-3 hour watching Television during weekends,
65.3% spend 3-5 hour watching Television during weekends, 12.7% spend 5-7 hour
watching Television during weekends and 7.6% spend above 7 hour watching
Television during weekends.
When analyzing the ratio within female respondents, it could be inferred that
3.0% of female respondents spend 0-3 hour watching Television during weekends.
8.1% spend 3-5 hour watching Television during weekends, 62.6% spend 5-7 hour
watching Television during weekends and 26.3% spend above 7 hour watching
Television during weekends. Also it is found that females spend more time watching
TV during weekends compared to males.

23
H0: there is no relation between gender and hours spend watching Television during
weekends.
H1: there is relation between gender and hours spend watching Television during
weekends.
4.2.10 Chi Square Test
Table 4.2.10
Value df
Asymp. Sig.
(2-sided) Pearson Chi-Square 101.875
a 3 .000
Likelihood Ratio 113.375 3 .000
Linear-by-Linear Association 69.441 1 .000
N of Valid Cases 217 a. 0 cells (.0%) have expected count less than 5. The minimum expected count is 9.12.
Here the data is found to be significant. So we accept the hypothesis that there is
relation between gender and hours spend watching Television during weekends.
4.2.11 Gender* Preference for watching programs regularly
Prefer to watch any pogram
regularly
Total Yes No
Sex
Male
Count 40 78 118
% within Sex 33.9% 66.1% 100.0%
% of Total 18.4% 35.9% 54.4%
Female
Count 83 16 99
% within Sex 83.8% 16.2% 100.0%
% of Total 38.2% 7.4% 45.6%
Total
Count 123 94 217
% within Sex 56.7% 43.3% 100.0%
% of Total 56.7% 43.3% 100.0%
Above table shows a cross tabulation between the gender and preference for
watching programs regularly.

24
When analyzing the ratio within male respondents, it could be inferred that
33.9% of male respondents use to watch programs regularly while 66.1% responded
they do not prefer to watch any programs regularly.
When analyzing the ratio within female respondents, it could be inferred that
83.8% of female respondents use to watch programs regularly while 16.2%
responded they do not prefer to watch any programs regularly. Also it could be
inferred that females shows a high tendency to watch programs regularly compared
to males.
H0: there is no relation between gender and preference for watching programs
regularly
H1: there is relation between gender and preference for watching programs regularly
4.2.12 Chi Square Test
Table 4.2.12
Value df
Asymp.
Sig.
(2-sided) Exact Sig.
(2-sided) Exact Sig.
(1-sided) Pearson Chi-Square 54.682
a 1 .000
Continuity Correctionb 52.667 1 .000
Likelihood Ratio 58.231 1 .000
Fisher's Exact Test
.000 .000
Linear-by-Linear
Association 54.430 1 .000
N of Valid Cases 217
a. 0 cells (.0%) have expected count less than 5. The minimum expected count is
42.88.
b. Computed only for a 2x2 table
Here the data is found to be significant. So we accept the hypothesis that there is
relation between gender and preference for watching programs regularly.

25
4.2.13 Gender* Normal response during commercials on TV
Table 4.2.13
Normal response during commercials
on TV
Switch to
another
channel
Switch
attention
to mobile
chats,
browse etc.
Watch it if
interesting
Reading
News
paper /
Magazi
-nes
Total
Male
Count 49 19 38 12 118
% within
Sex 41.5% 16.1% 32.2% 10.2% 100%
% of Total 22.6% 8.8% 17.5% 5.5% 54.4%
Fema
- le
Count 72 16 5 6 99
% within
Sex 72.7% 16.2% 5.1% 6.1% 100%
% of Total 33.2% 7.4% 2.3% 2.8% 45.6%
Total
Count 20 121 35 43 18
% within
Sex 9.2% 55.8% 16.1% 19.8% 8.3%
% of Total 9.2% 55.8% 16.1% 19.8% 8.3%
Above table shows a cross tabulation between the gender and normal response
during commercials on TV.
When analyzing the ratio within male respondents, it could be inferred that
41.5% of male respondents switch to another channel during commercials, 16.1%
switch attention to mobile chats, browse etc, 32.2% watch it if interesting, 10.2%
prefer to read news paper / magazines.
When analyzing the ratio within female respondents, it could be inferred that
72.7% of female respondents switch to another channel during commercials, 16.2%
switch attention to mobile chats, browse etc, 5.1% watch it if interesting, 6.2% prefer

26
to read news paper / magazines. Also it can be inferred that males have higher
affinity towards interesting commercials compared to males.
H0: there is no relation between gender and Normal response during commercials on
TV
H1: there is relation between gender and Normal response during commercials on
TV
4.2.14 Chi Square Test
Value df
Asymp. Sig.
(2-sided) Pearson Chi-Square 30.525
a 3 .000
Likelihood Ratio 33.728 3 .000
Linear-by-Linear Association 22.616 1 .000
N of Valid Cases 217 a. 0 cells (.0%) have expected count less than 5. The minimum expected count is 8.21. .
Here the data is found to be significant. So we accept the hypothesis that there is
relation between gender and Normal response during commercials on TV.

27
4.2.15 Gender* Instances where channels are not switched during commercials
Table 4.2.15
Instances when channels are not switched
during commercials
If
commercial
is too short
If i dont
want to be
deviated
from
program
if a
cricket
match is
on
if the
commercial
is new
Total
Male
Count 55 16 43 4 118
% within
Sex
46.6% 13.6% 36.4% 3.4% 100.0%
% of Total 25.3% 7.4% 19.8% 1.8% 54.4%
Fem
- a le
Count 55 24 8 12 99
% within
Sex
55.6% 24.2% 8.1% 12.1% 100.0%
% of Total 25.3% 11.1% 3.7% 5.5% 45.6%
Total
Count 20 110 40 51 16
% within
Sex 9.2%
50.7% 18.4% 23.5% 7.4%
% of Total 9.2% 50.7% 18.4% 23.5% 7.4%
Above table shows a cross tabulation between the gender and Instances when
channels are not switched during commercials
When analyzing the ratio within male respondents, it could be inferred that
46.6% of male respondents do not switch to another channel if the commercial is
short, 13.6% of male respondents do not switch to another channel if they do not
want to be deviated from programs, 36.4% of male respondents do not switch to
another channel if the cricket match is on, 3.4% of male respondents do not switch to
another channel if the commercial is new.
28
When analyzing the ratio within female respondents, it could be inferred that
55.6% of female respondents do not switch to another channel if the commercial is
short, 24.2% of female respondents do not switch to another channel if they do not
want to be deviated from programs, 8.1% of female respondents do not switch to
another channel if the cricket match is on, 12.1% of female respondents do not
switch to another channel if the commercial is new.
From the above data it can be concluded that both male and female prefer not to
switch channel if the commercial is too short. Also in the case of males there is high
probability of not switching channel during commercials if a cricket match is on.
Whereas in the case of females, There is a high probability of channel not being
switched if they do not want to deviate from the program.
H0: there is no relation between gender and Instances when channels are not
switched during commercials
H1: there is relation between gender and Instances when channels are not switched
during commercials.
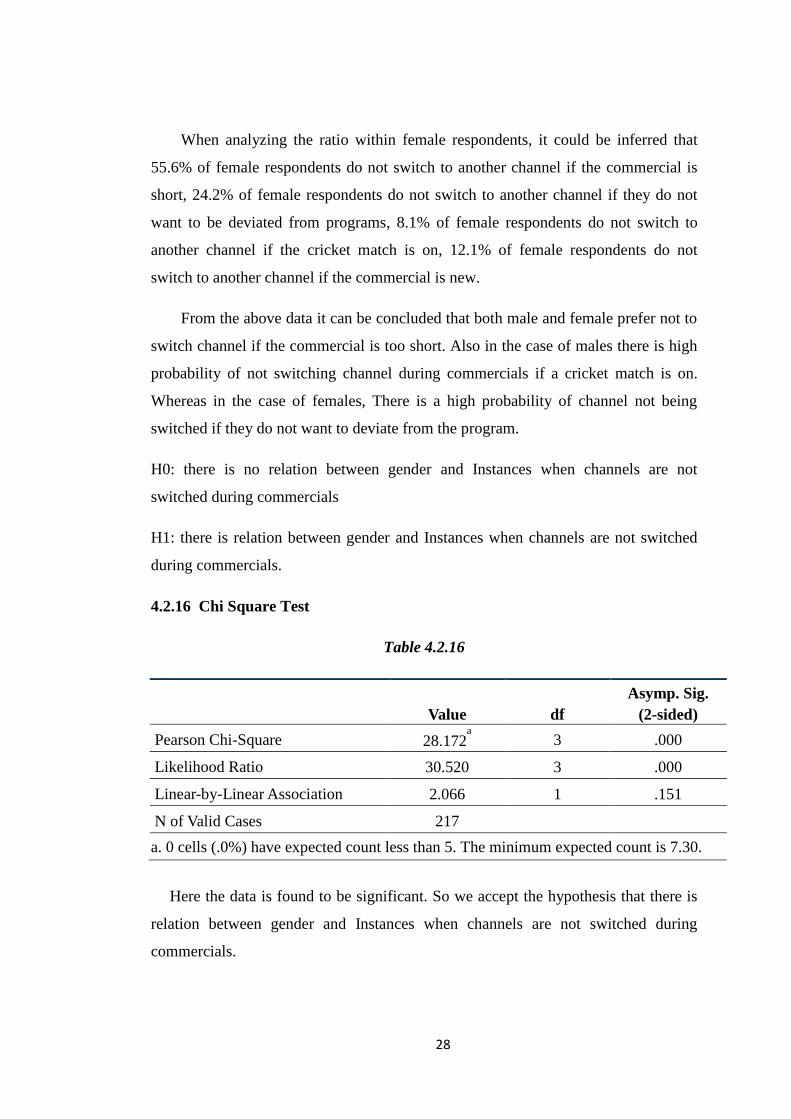
4.2.16 Chi Square Test
Table 4.2.16
Value df
Asymp. Sig.
(2-sided) Pearson Chi-Square 28.172
a 3 .000
Likelihood Ratio 30.520 3 .000 Linear-by-Linear Association 2.066 1 .151 N of Valid Cases 217
a. 0 cells (.0%) have expected count less than 5. The minimum expected count is 7.30.
Here the data is found to be significant. So we accept the hypothesis that there is
relation between gender and Instances when channels are not switched during
commercials.

29
4.2.17 Gender * Most preferred time for watching televisions during weekdays
Table 4.2.17
Above table shows a cross tabulation between the gender and most preferred time
for watching televisions during weekdays.
When analyzing the ratio within male respondents, it could be inferred that 11.%
of male respondents answered Evening (4 pm - 7 pm) as the most preferred time for
watching televisions during weekdays, 25.4% preferred night (7 pm - 11 pm) as the
most ideal time and 63.6% preferred late night (11 pm onwards) as the most ideal
time to watch TV during weekdays.
When analyzing the ratio within female respondents, it could be inferred that 6.1%
of female respondents answered Evening (4 pm - 7 pm) as the most preferred time
for watching televisions during weekdays, 88.9% preferred night (7pm - 11 pm) as
Most preferred time for watching
televisions during weekdays
Evening (4
pm - 7 pm)
Night (7 pm
- 11 pm)
Late Night
(11 pm
onwards)
Male
Count 13 30 75 118
% within
Sex 11.0% 25.4% 63.6% 100.0%
% of Total 6.0% 13.8% 34.6% 54.4%
Fema
- le
Count 6 88 5 99
% within
Sex 6.1% 88.9% 5.1% 100.0%
% of Total 2.8% 40.6% 2.3% 45.6%
Total Count 20 19 118 80
% within
Sex
8.8% 54.4% 36.9% 100.0%
% of Total 8.8% 54.4% 36.9% 100.0%
Total
30
the most ideal time and 5.1% preferred late night (11 pm onwards) as the most ideal
time to watch TV during weekdays.
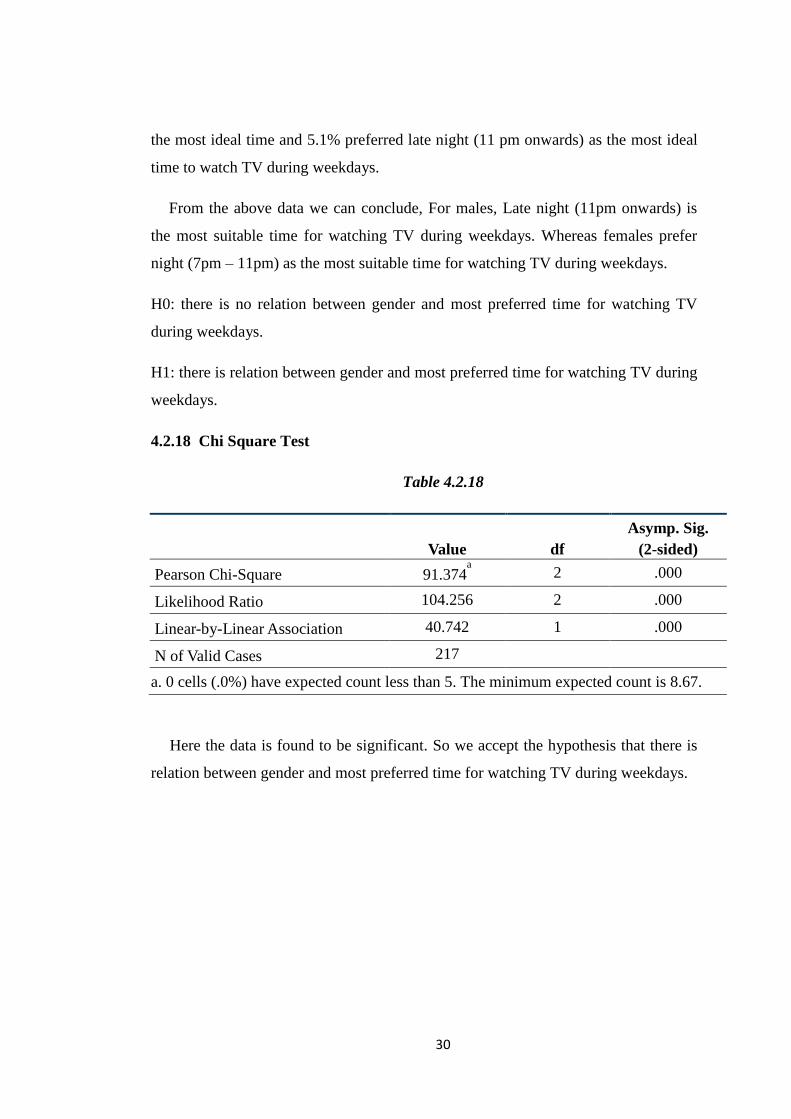
From the above data we can conclude, For males, Late night (11pm onwards) is
the most suitable time for watching TV during weekdays. Whereas females prefer
night (7pm – 11pm) as the most suitable time for watching TV during weekdays.
H0: there is no relation between gender and most preferred time for watching TV
during weekdays.
H1: there is relation between gender and most preferred time for watching TV during
weekdays.
4.2.18 Chi Square Test
Table 4.2.18
Value df
Asymp. Sig.
(2-sided) Pearson Chi-Square 91.374
a 2 .000
Likelihood Ratio 104.256 2 .000
Linear-by-Linear Association 40.742 1 .000
N of Valid Cases 217
a. 0 cells (.0%) have expected count less than 5. The minimum expected count is 8.67.
Here the data is found to be significant. So we accept the hypothesis that there is
relation between gender and most preferred time for watching TV during weekdays.

31
4.3 Henry Garret Ranking
Henry Garret ranking is used to identify the ranks of most watched TV
Program category, TV channels and TV programs there by analysing the patterns
of television consumption among youth. Henry Garret method is followed by
Friedman Test to test hypothesis.
Table 4.3.1
Most preferred Program Category
Items Frequencies Weighted Frequencies Total Rank
1 2 3 4 5 1 2 3 4 5 Movies 81 91 32 12 1 6075 5460 1600 468 24 8167 3
Sports 48 50 12 16 33 3600 3000 600 624 792 8616 2
News 8 13 69 70 21 600 780 3450 2730 504 8064 4
Music 70 60 41 44 2 5250 3600 2050 1716 48 12664 1
Travel 1 1 3 9 93 75 60 150 351 2232 2868 6
Documentaries /
Informative
Program
0 0 1 49 35 0 0 50 1911 840 2801 7
Events 0 0 0 0 6 0 0 0 0 144 144 8
Serials 0 0 0 0 0 0 0 0 0 0 0 9
Comedy 0 0 0 0 0 0 0 0 0 0 0 9
Current Affairs 0 0 0 0 0 0 0 0 0 0 0 9
Health
Care Programs
0 0 0 0 0 0 0 0 0 0 0 9
Reality Show 10 1 59 17 16 750 60 2950 663 384 4807 5
Education 0 0 0 0 0 0 0 0 0 0 0 9
Music is the most watched channel category followed by Sports. Movies is the
third most preferred category followed by News and Reality shows is at the fifth
place.
32
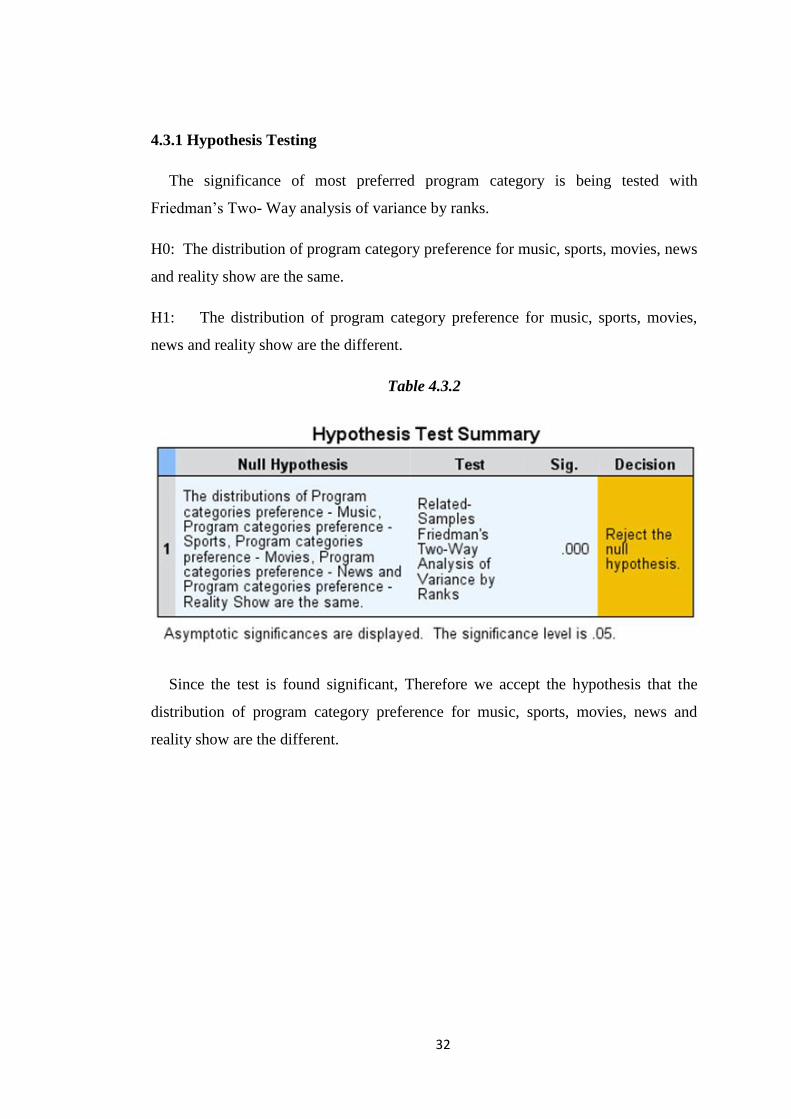
4.3.1 Hypothesis Testing
The significance of most preferred program category is being tested with
Friedman‘s Two- Way analysis of variance by ranks.
H0: The distribution of program category preference for music, sports, movies, news
and reality show are the same.
H1: The distribution of program category preference for music, sports, movies,
news and reality show are the different.
Table 4.3.2
Since the test is found significant, Therefore we accept the hypothesis that the
distribution of program category preference for music, sports, movies, news and
reality show are the different.

33
Figure 4.3.1
From the above table, It can be inferred that program category movies has the
highest mean rank followed by music. Sports is at the the third position and news at
the fourth followed by reality show.
Figure 4.3.2

34
Table 4.3.3
Pair wise comparison indicates that there is significant difference between every
program category and none of the ranks have occurred by chance.

35
4.3.5 Preferred Timings for Watching Television during Weekends
Since people have multiple timings for watching television during weekends,
Option to rank different timings of a day were given and Henry Garret ranking
method is used for analysis of ranks given to each timing by the respondents.
Table 4.3.4
Considering the data from above table it can be inferred that forenoon (9 am - 12 pm)
has been ranked first followed by night (7 pm - 11 pm). Late night (11 pm onwards)
time is at the third position followed by evening (4pm – 7 pm). The most least
preferred time for watching TV during weekend is morning (6am – 9am).
4.3.6 Hypothesis Testing
The significance of timings for watching television during weekends is being
tested with Friedman‘s Two- Way analysis of variance by ranks.
H0: The distribution of most preferred timing for watching TV during weekends are
same
Preferred Timings for Watching Television during Weekends
Items Frequencies Weighted Frequencies Total Rank
1 2 3 4 5 1 2 3 4 5
Morning (6 am - 9 am) 1 0 0 0 3 75 0 0 0 72 147 6
Forenoon (9 am - 12 pm) 146 29 23 19 0 10950 1740 1150 741 0 14581 1
Noon (12 pm - 4 pm) 0 68 51 52 46 0 4080 2550 2028 1104 9762 4
Evening (4 pm - 7 pm) 0 11 11 52 142 0 660 550 2028 3408 6646 5
Night (7 pm - 11 pm) 45 33 103 36 0 3375 1980 5150 1404 0 11909 2
Late Night (11 pm onwards) 23 79 29 58 23 1725 4740 1450 2262 552 10729 3
36
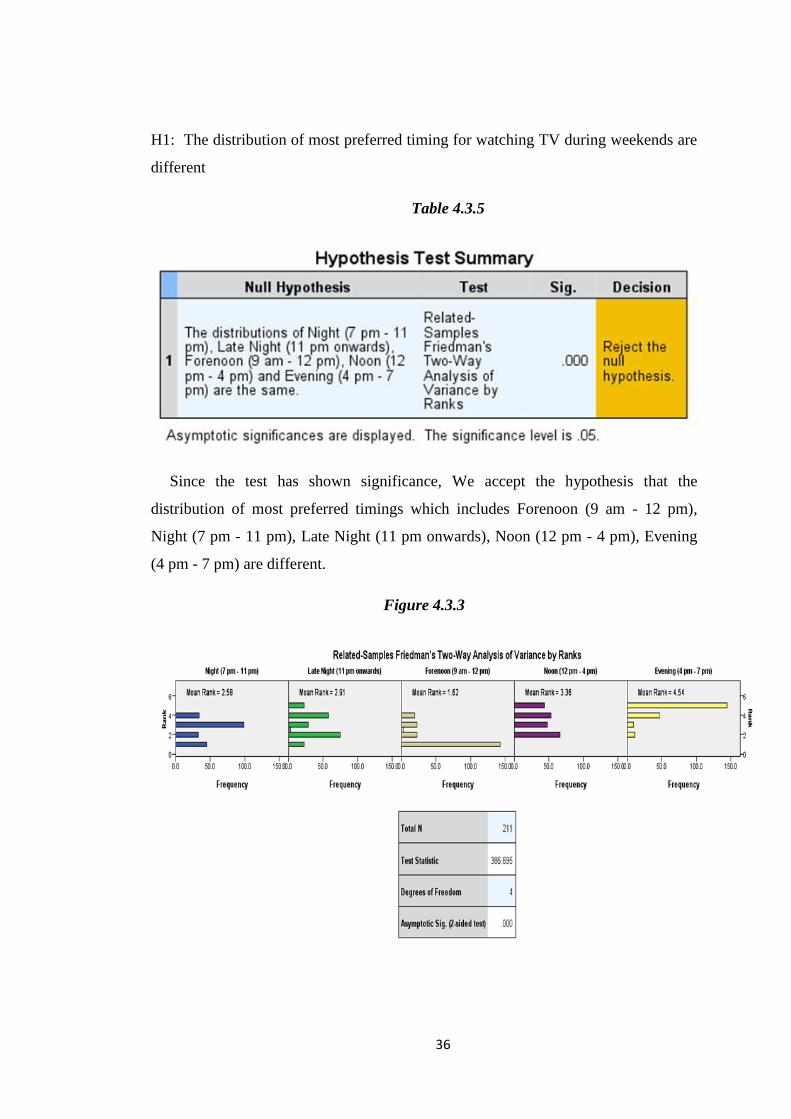
H1: The distribution of most preferred timing for watching TV during weekends are
different
Table 4.3.5
Since the test has shown significance, We accept the hypothesis that the
distribution of most preferred timings which includes Forenoon (9 am - 12 pm),
Night (7 pm - 11 pm), Late Night (11 pm onwards), Noon (12 pm - 4 pm), Evening
(4 pm - 7 pm) are different.
Figure 4.3.3
37
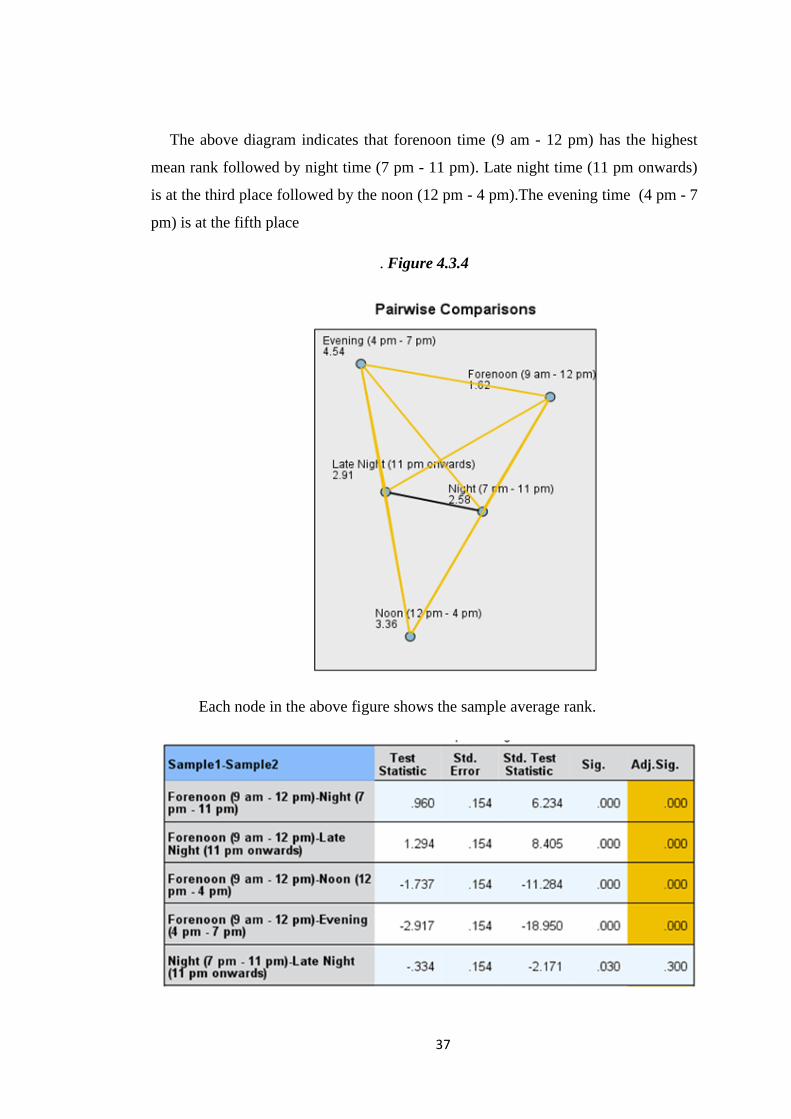
The above diagram indicates that forenoon time (9 am - 12 pm) has the highest
mean rank followed by night time (7 pm - 11 pm). Late night time (11 pm onwards)
is at the third place followed by the noon (12 pm - 4 pm).The evening time (4 pm - 7
pm) is at the fifth place
. Figure 4.3.4
Each node in the above figure shows the sample average rank.

38
Pair wise comparison indicates that there is significant difference between every
timings except between late night and night time.
4.3.7 Most Preferred Channels for Watching Movies
Respondents were asked to rank the channels for watching movies in the order
of their usage. The frequencies were tabulated and Henry Garret method was used to
analyse the given ranks.
Items Frequencies Weighted Frequencies Total Rank
1 2 3 1 2 3
Asianet 23 12 16 1587 600 480 2667 6
Surya 36 25 31 2484 1250 930 4664 2
Asianet Movies 42 23 24 2898 1150 720 4768 1
Star Movies 33 28 18 2277 1400 540 4217 4
HBO 23 20 28 1587 1000 840 3427 5
Movies Now 36 30 20 2484 1500 600 4584 3
Sony Max 6 5 9 414 250 270 934 10
Star Gold 6 11 10 414 550 300 1264 8
Kiran 8 15 24 552 750 720 2022 7
Mazhavil
Manorama
1 11 5 69 550 150 769 11
Sony pix 1 1 0 69 50 0 119 16
Romedy Now 0 6 4 0 300 120 420 14
Sun TV 0 3 4 0 150 120 270 15
UTV Movies 2 4 6 138 200 180 518 13
Star Plus 0 7 9 0 350 270 620 12
Colors 0 16 9 0 800 270 1070 9
Table 4.3.6

39
Above table indicates that Asianet Movies is the most preferred channel for
watching movies followed by Surya. Movies Now is at the third place.
4.3.8 Most Preferred Channels for Watching Music
Respondents were asked to rank the channels for watching music in the order of
their usage. The frequencies were tabulated and Henry Garret method was used to
analyse the given ranks.
Above table indicates that MTV is the most preferred channel for watching
music followed by 9XM. Channel V is at the third place.
4.3.9 Most Preferred Channel for Watching Sports
Respondents were asked to rank the channels for watching sports in the order of
their usage. The frequencies were tabulated and Henry Garret method was used to
analyse the given ranks.
Most Preferred Channels for Watching Music
Items Frequencies Weighted Frequencies Total Rank
1 2 3 1 2 3
MTV 90 12 12 6210 600 360 7170 1
Zoom 27 31 7 1863 1550 210 3623 4
9XM 40 60 21 2760 3000 630 6390 2
VH1 5 19 17 345 950 510 1805 8
Channel V 2 40 64 138 2000 1920 4058 3
B4U Music 8 19 24 552 950 720 2222 6
Kappa 8 16 37 552 800 1110 2462 5
Kiran 6 6 18 414 300 540 1254 9
Sun Music 12 4 7 828 200 210 1238 10
Others 19 10 10 1311 500 300 2111 7
Table 4.3.7
40
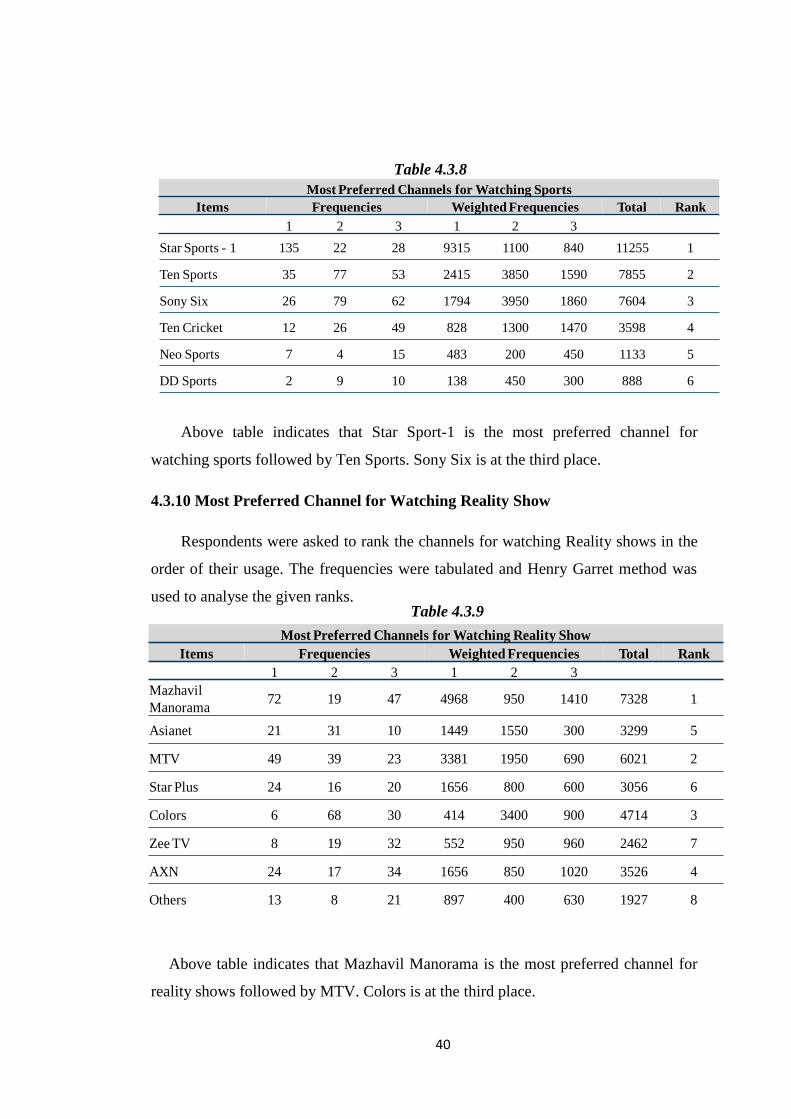
Above table indicates that Star Sport-1 is the most preferred channel for
watching sports followed by Ten Sports. Sony Six is at the third place.
4.3.10 Most Preferred Channel for Watching Reality Show
Respondents were asked to rank the channels for watching Reality shows in the
order of their usage. The frequencies were tabulated and Henry Garret method was
used to analyse the given ranks.
Above table indicates that Mazhavil Manorama is the most preferred channel for
reality shows followed by MTV. Colors is at the third place.
Most Preferred Channels for Watching Sports
Items Frequencies Weighted Frequencies Total Rank
1 2 3 1 2 3
Star Sports - 1 135 22 28 9315 1100 840 11255 1
Ten Sports 35 77 53 2415 3850 1590 7855 2
Sony Six 26 79 62 1794 3950 1860 7604 3
Ten Cricket 12 26 49 828 1300 1470 3598 4
Neo Sports 7 4 15 483 200 450 1133 5
DD Sports 2 9 10 138 450 300 888 6
Most Preferred Channels for Watching Reality Show
Items Frequencies Weighted Frequencies Total Rank
1 2 3 1 2 3
Mazhavil
Manorama72 19 47 4968 950 1410 7328 1
Asianet 21 31 10 1449 1550 300 3299 5
MTV 49 39 23 3381 1950 690 6021 2
Star Plus 24 16 20 1656 800 600 3056 6
Colors 6 68 30 414 3400 900 4714 3
Zee TV 8 19 32 552 950 960 2462 7
AXN 24 17 34 1656 850 1020 3526 4
Others 13 8 21 897 400 630 1927 8
Table 4.3.8
Table 4.3.9
41
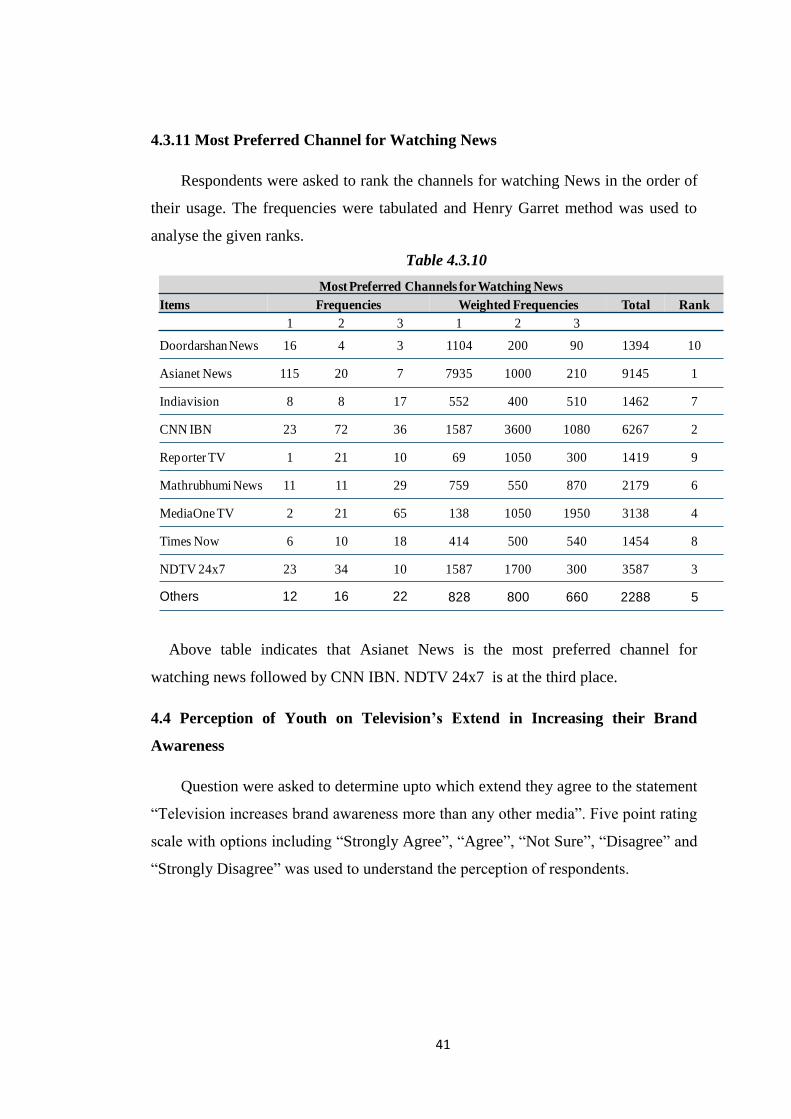
4.3.11 Most Preferred Channel for Watching News
Respondents were asked to rank the channels for watching News in the order of
their usage. The frequencies were tabulated and Henry Garret method was used to
analyse the given ranks.
Above table indicates that Asianet News is the most preferred channel for
watching news followed by CNN IBN. NDTV 24x7 is at the third place.
4.4 Perception of Youth on Television’s Extend in Increasing their Brand
Awareness
Question were asked to determine upto which extend they agree to the statement
―Television increases brand awareness more than any other media‖. Five point rating
scale with options including ―Strongly Agree‖, ―Agree‖, ―Not Sure‖, ―Disagree‖ and
―Strongly Disagree‖ was used to understand the perception of respondents.
Most Preferred Channels for Watching News
Items Frequencies Weighted Frequencies Total Rank
1 2 3 1 2 3
Doordarshan News 16 4 3 1104 200 90 1394 10
Asianet News 115 20 7 7935 1000 210 9145 1
Indiavision 8 8 17 552 400 510 1462 7
CNN IBN 23 72 36 1587 3600 1080 6267 2
Reporter TV 1 21 10 69 1050 300 1419 9
Mathrubhumi News 11 11 29 759 550 870 2179 6
MediaOne TV 2 21 65 138 1050 1950 3138 4
Times Now 6 10 18 414 500 540 1454 8
NDTV 24x7 23 34 10 1587 1700 300 3587 3
Others 12 16 22 828 800 660 2288 5
Table 4.3.10
42
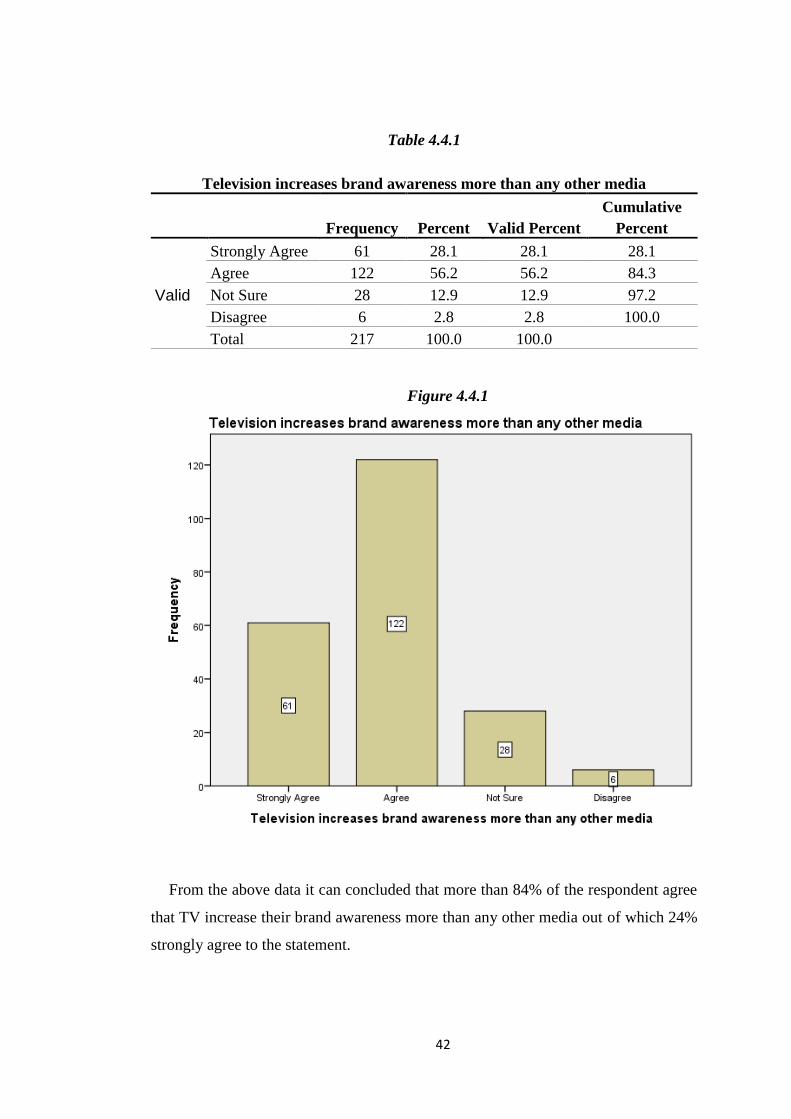
Table 4.4.1
Television increases brand awareness more than any other media
Frequency Percent Valid Percent
Cumulative
Percent
Valid
Strongly Agree 61 28.1 28.1 28.1
Agree 122 56.2 56.2 84.3
Not Sure 28 12.9 12.9 97.2
Disagree 6 2.8 2.8 100.0
Total 217 100.0 100.0
From the above data it can concluded that more than 84% of the respondent agree
that TV increase their brand awareness more than any other media out of which 24%
strongly agree to the statement.
Figure 4.4.1

43
4.5 Frequency Determination
4.5.1 Most Preferred Programs for Regular Watching (Daily basis)
Respondents were asked to list the name of programs they prefer to watch on a
daily basis. Responses were tabulated and frequency for each program were
determined.
Out of 217 respondents, 123 use to watch programs on television regularly / on a
daily basis.
Figure 4.5.1
As shown in the above Figure 4.5.1, 17 programs were listed from the responses
of respondents. D4 Dance tops the list with a frequency of 97 followed by MTV
97
61
48
33 32 3124
8 7 6 5 4 4 3 2 2 10
20
40
60
80
100
120
D4 D
ance
MT
V R
oad
ies
Kodee
shw
aran
Onnum
Onnum
Moonu
MT
V S
pli
tsvil
la
Diy
a au
r B
hat
i H
um
Tak
e it
Eas
y
WW
E
So Y
ou T
hin
k y
ou c
an d
ance
Musi
c M
ojo
Jhal
ak D
hik
laja
Chri
s A
ngel
Min
d F
reak
Com
edy N
ights
wit
h K
apil
Fla
vo
urs
of
India
Com
edy S
tars
Par
aspar
am
Dan
ce I
ndia
Dan
ce
Fre
qu
ency
Preferred Program

44
Roadies which is having a frequency of 61. Ningalkum Aakam Kodeeshwaran
comes at third place followed by Onnum Onnum Moonu, MTV Splitsvilla and Diya
aur Bhatia with a frequency of 33, 32, and 31 respectively.

45
Chapter 5
Findings and Conclusion

46
5.1 Findings
The major findings of study are listed below:
Women shows more affinity towards television compared with men in terms of
TV program consumption.
Compared to with men, Women prefer to use more Television for entertainment
purposes. Within female respondent 69.7% choose TV as the most preferred media
for entertainment while just 18.6% of male respondents choose TV this purpose.
Considering hours spend watching Television during weekdays, Most of the
women spend 3 – 4 hours on TV while most of the males spend just 1 – 2 hours.
During weekends, 62.6% of female respondents spend 5 - 7 hours on watching
TV while 65.3% spend 3 – 5 hours.
Considering the habit of watching programs regularly, ie, on an episode by
episode basis, Females stand far ahead of males with 83.8% saying they use to watch
some kind of program / programs on a daily basis while just 33.9% responded of
watching programs regularly.
Out of 217 respondents, 123 use to watch programs on television regularly / on a
daily basis and 17 programs were listed from the responses altogether. D4 Dance
tops the list with a frequency of 97 followed by MTV Roadies which is having a
frequency of 61. Ningalkum Aakam Kodeeshwaran comes at third place followed by
Onnum Onnum Moonu, MTV Splitsvilla and Diya aur Bhatia with a frequency of 33,
32, and 31 respectively.
Considering the response during an advertisement on TV, Majority of females,
ie 72.7% responded of switching channels. Within males 41.5% responded of
possessing the same habit but 32.2% responded, They would watch the ad if it is
interesting while just 5.1% of female responded that way. It shows male shows more
affinity towards interesting ads than females.
47
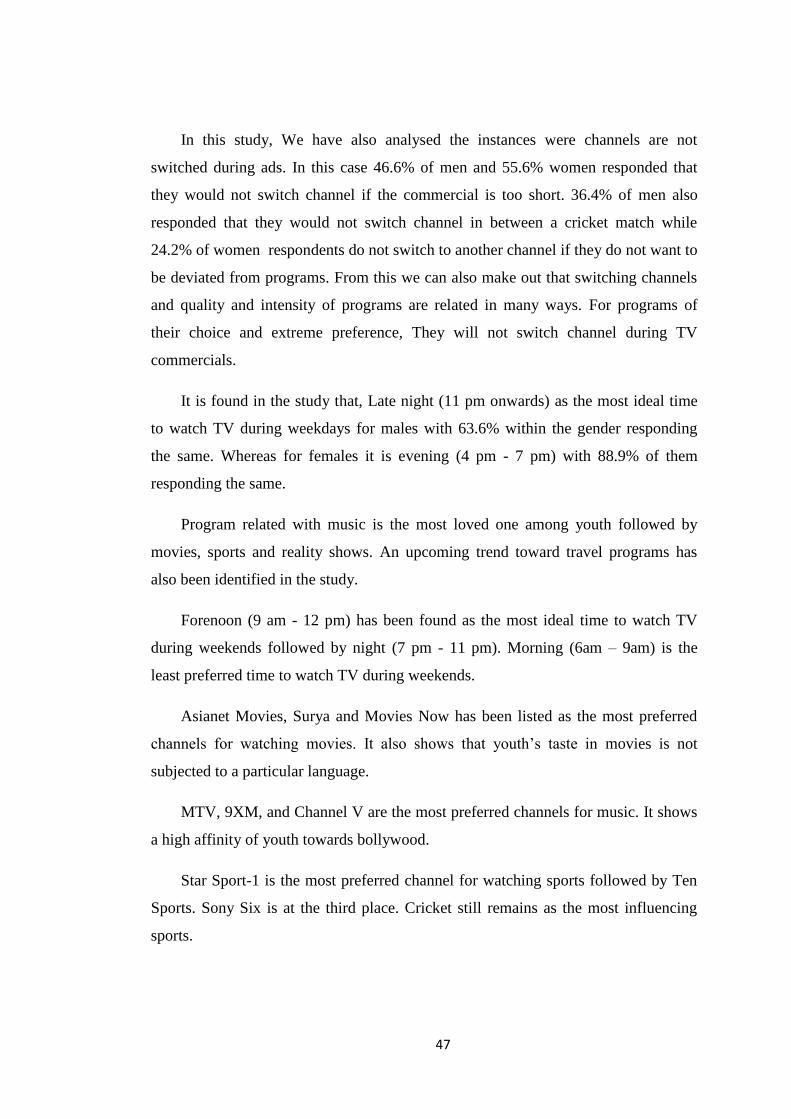
In this study, We have also analysed the instances were channels are not
switched during ads. In this case 46.6% of men and 55.6% women responded that
they would not switch channel if the commercial is too short. 36.4% of men also
responded that they would not switch channel in between a cricket match while
24.2% of women respondents do not switch to another channel if they do not want to
be deviated from programs. From this we can also make out that switching channels
and quality and intensity of programs are related in many ways. For programs of
their choice and extreme preference, They will not switch channel during TV
commercials.
It is found in the study that, Late night (11 pm onwards) as the most ideal time
to watch TV during weekdays for males with 63.6% within the gender responding
the same. Whereas for females it is evening (4 pm - 7 pm) with 88.9% of them
responding the same.
Program related with music is the most loved one among youth followed by
movies, sports and reality shows. An upcoming trend toward travel programs has
also been identified in the study.
Forenoon (9 am - 12 pm) has been found as the most ideal time to watch TV
during weekends followed by night (7 pm - 11 pm). Morning (6am – 9am) is the
least preferred time to watch TV during weekends.
Asianet Movies, Surya and Movies Now has been listed as the most preferred
channels for watching movies. It also shows that youth‘s taste in movies is not
subjected to a particular language.
MTV, 9XM, and Channel V are the most preferred channels for music. It shows
a high affinity of youth towards bollywood.
Star Sport-1 is the most preferred channel for watching sports followed by Ten
Sports. Sony Six is at the third place. Cricket still remains as the most influencing
sports.

48
Mazhavil Manorama is the most preferred channel for reality shows followed by
MTV. Colors is at the third place. Here also, there shows a high affinity of youth
towards Hindi programs.
Asianet News is the most preferred channel for watching news followed by
CNN IBN. NDTV 24x7 is at the third place. It also suggest youth‘s interest in
listening to English news channels unlike the previous days.
84% of the respondent agree that TV increase their brand awareness more than
any other media out of which 24% strongly agree to the statement. It shows that even
in midst of internet invasion, People are reminded and familiarised about brand
through TV ads.
5.2 Conclusion
This study has provided much relevant insights into the television habits of the
youth in Kerala.
TV program consumption pattern and gender are closely related and young
generation‘s taste in TV programs have become very specific and cannot be easily
generalised on the basis of a language or a specific program category.
Youth‘s preference is also dynamic and cannot be predicted for a longer period.
It changes fast according to the socio cultural environment and the trends in the
society.

49
Bibliography

50
Bibliography
Ahluwalia, A. K., & R, S. (2011). TV Viewing Habits Amongst Urban Children.
IUP Journal Of Marketing Management , 10, 45-62.
Bukhari, B. (2002). The Effect of Television Programmes on Youth. M.A. Thesis,
University of the Punjab, Lahore , 67-70.
Corneo, G. (2002). Work and Television. CESifo Working Paper Series No. 829;
IZA Discussion , 376.
IBM. (2004). Media and Entertainment 2010: Open on the Inside, Open on the
Outside: The Open Media Company of the Future. IBM Institute for Business
Value Future Series report .
Kim, Y. (2009). Media Consumption and Everyday Life in Asia. In S. To OH.
NY: Routledge.
Lowery, Shearon; DeFleur , Melvin L;. (1988). Longman Inc, New York .
N, U., & Bajpai. (1996). Impact Of Television Advertising On Children. 4th
Edition, Sage, New Delhi .
Nabiha, F. (2000). Effects of Satellite Channels (ZEE TV) on Middle Class of
Lahore. M.A. Thesis, University of the Punjab, Lahore , 60.
S, S. (1993). The Implication Of Trans-Border Television For Natural Cultures
And National Broadcasting: A Japanese Perspective. Singapore: An Asian Mass
Communication Quarterly , 183 - 197.
S, V., & W, L. R. (2002). TV in Indian adolescent's lives: A member of the
family. Journal of youth and Adolescene , Vol 31, 177-183.
Thussu, D. K. (2007). Media on the move. NY: Routledge.
Valaskakis, G. (1983). Media and Acculturation Patterns.

51
Appendices

52
Appendix
QUESTIONNAIRE
Age: Income:
Sex: Male Female Location:
Profession: Education:
1. Which is your most preferred media for entertainment and news?
Television Mobile Devices
Internet Newspaper / Magazines
2. How much hours you spend watching Television during week days?
0 - 1 1 - 2
2 - 3 3 - 4
3. How much hours you spend watching Television during weekends?
1 - 3 3 - 5
5 - 7 7 - 9
4. Rank the following Television program categories according to your viewing
preference?
Program Category Rank
Movies
Sports
News
Music

53
Travel
Serials
Comedy
Current Affairs
Healthcare programs
Reality shows
Education
Documentaries/Informative Programs
Events
Any other (specify):
5. Which is your favorite channel for the following program categories as per your
viewing?
Rank
1 2 3 4
Movies
Sports
News
Music
Travel
Serials
Comedy
Current Affairs
Healthcare programs
Reality shows
Education
Documentaries/
Informative Programs
Events
Any other (specify):
6. Is there any TV program / programs you prefer to watch regularly?
Yes NO
Usage

54
7. If yes, Name them in the order of your preference:
Name the program Channel
8. What is your normal response during commercials on TV?
Switch to another channel
Switch attention to other activities like mobile chat, browse etc
Watch it if interesting
Reading Newspaper / Magazines
Any other (Specify):
9. Are there any instances where you choose not to switch channel during
commercials?
If commercial break is too short
If I don‘t want to be deviated from the program
If a cricket match is on
If the commercial is new
Any other (Specify)
10. Do you agree Television viewing increases your brand awareness more than any
other media?
Strongly
Agree Agree
Not
Sure Disagree
Strongly
Disagree

55
11. Which is your most preferred time for watching televisions during weekdays?
Morning ( 6 am – 9 am)
Fore Noon ( 9am – 12 pm)
Noon (12 pm – 4 pm)
Evening (4 pm – 7 pm)
Night (7 pm – 11 pm)
Late Night (11 pm onwards)
12. Rank (1-5) your most preferred time for watching televisions during weekends?
Time Rank
Morning ( 6 am – 9 am)
Fore Noon ( 9am – 12 pm)
Noon (12 pm – 4 pm)
Evening (4 pm – 7 pm)
Night (7 pm – 11 pm)
Late Night (11 pm
onwards)