a study of proof conceptions in algebra - mr. schultzmrschultz.yolasite.com/resources/a study of...
TRANSCRIPT

A Study of Proof Conceptions in AlgebraAuthor(s): Lulu Healy and Celia HoylesReviewed work(s):Source: Journal for Research in Mathematics Education, Vol. 31, No. 4 (Jul., 2000), pp. 396-428Published by: National Council of Teachers of MathematicsStable URL: http://www.jstor.org/stable/749651 .Accessed: 03/11/2011 01:13
Your use of the JSTOR archive indicates your acceptance of the Terms & Conditions of Use, available at .http://www.jstor.org/page/info/about/policies/terms.jsp
JSTOR is a not-for-profit service that helps scholars, researchers, and students discover, use, and build upon a wide range ofcontent in a trusted digital archive. We use information technology and tools to increase productivity and facilitate new formsof scholarship. For more information about JSTOR, please contact [email protected].
National Council of Teachers of Mathematics is collaborating with JSTOR to digitize, preserve and extendaccess to Journal for Research in Mathematics Education.
http://www.jstor.org

Journal for Research in Mathematics Education
2000, Vol. 31, No. 4, 396-428
A Study of Proof Conceptions in Algebra
Lulu Healy and Celia Hoyles, University of London, UK
After surveying high-attaining 14- and 15-year-old students about proof in algebra, we found that students simultaneously held 2 different conceptions of proof: those about arguments they consid- ered would receive the best mark and those about arguments they would adopt for themselves. In the former category, algebraic arguments were popular. In the latter, students preferred arguments that they could evaluate and that they found convincing and explanatory, preferences that excluded
algebra. Empirical argument predominated in students' own proof constructions, although most students were aware of its limitations. The most successful students presented proofs in everyday language, not using algebra. Students' responses were influenced mainly by their mathematical
competence but also by curricular factors, their views of proof, and their genders.
Key Words: Algebra; Large-scale studies; Proof; Reasoning; Secondary mathematics; Survey study
Within the mathematics community, the topic of proof is frequently the subject of debate; deductive reasoning is contrasted with natural induction from empirical pursuits and with informal argumentation. Yet research suggests that students of mathematics do not find these distinctions easy (see, e.g., Martin & Harel, 1989). The process of proving is undeniably complex, involving a range of student compe- tencies-identifying assumptions, isolating given properties and structures, and
organizing logical arguments-each of which is by no means trivial. These
complexities may be further compounded by the ambiguous nature of the term proof itself and by the fact that outside of mathematics, proof can be indistinguishable from evidence. As Tall (1989) observed, "beyond reasonable doubt" constitutes
proof to a jury; "occurring with a certain probability" may imply proof to a statis- tician; and for a scientist, proof may reside in the result of empirical investigation. Even among mathematicians, there is diversity of opinion regarding the role and functions of proof and to what extent proofs should or should not provide insight into the underlying mathematics (for reference to discussion of these issues, see Thurston, 1995).
Turning more to mathematics education, we note that Hanna and Jahnke (1993) suggested that understanding is primary to the acceptance by a learner that a new theorem has been proved, with rigor playing only a secondary role. They went on to argue that students are likely to gain a greater understanding of proof when
emphasis is placed on communication of meaning rather than on formal deriva-
We gratefully acknowledge the support of the Economics and Social Research Council (ESRC), Project R000236178. We would also like to thank the anonymous reviewers for their helpful comments and suggestions.
Lulu Healy and Celia Hoyles 397
tion: "A mathematics curriculum which aims to reflect the real role of rigorous proof in mathematics must present it as an indispensable tool in mathematics rather than as the very core of that science" (p. 879).
In mathematics education, empirical research on this topic has tended to focus on describing and analyzing students' responses to questions requiring proof. A large body of evidence indicates that most students have difficulties in following or constructing formally presented deductive arguments, in understanding how they differ from empirical evidence, and in using them to derive further results (Balacheff, 1988; Chazan, 1993; Fischbein, 1982; Harel & Sowder, 1998; Porteous, 1994; Schoenfeld, 1989). Students' approaches to proving have been classified along various dimensions: from pragmatic, involving recourse to actions, to conceptual, arguing from properties and relationships (Balacheff, 1988; van Dormolen, 1977); from weak to strong deduction (Bell, 1976; Coe & Ruthven, 1994); according to different representations-enactive, visual, numeric, formal (Tall, 1998)-and different proof schemes-transformational (Simon, 1996), analytical, empirical, and external (Harel & Sowder, 1998). What is a matter of dispute is how far there is continuity or discontinuity among the different approaches; for example, Duval (1991) pointed to the dramatic gap between the two poles of argumentation and deduction, whereas mathematics educators (including ourselves, Hoyles & Healy, 1999; see also Douek, 1998) have sought to forge connections between them.
In this corpus of research, little attention has been paid to documenting students' views of the meaning of proof in mathematics, and the relationship between views and approaches to proof have been discussed largely on the basis of theory rather than empirical evidence (e.g., Simon, 1996). Additionally, researchers have tended to limit their attention to individual conceptions or to classroom studies, with surprisingly little systematic investigation of school and curriculum factors and the role they might play in shaping students' views of and competencies in mathe- matical proof. (This is a general comment about mathematics education research; see Hoyles, 1997.)
We do not claim that the positioning of proof within the curriculum has remained unchanged over the last quarter century. In the United Kingdom, following Polya (1962), many (e.g., Bell, 1976; Mason, 1982) have argued that students should have opportunities to test and refine their own conjectures and to gain personal convic- tion of their truth alongside the experience of presenting generalizations and evidence of their validity. This approach is now prescribed in the current National Curriculum for mathematics in England and Wales (Department for Education, 1995). This curriculum is statutory and followed closely by all state schools.
The purpose of this article is not to critique this development but rather to analyze its outcomes in terms of student conceptions of proving and proof. The move to specify problem solving and proving processes in a curriculum inevitably imposed on students a structural organization and sequence in their mathematics instruction. In the case of the National Curriculum for England and Wales, the curriculum was organized into five attainment targets (ATs), which included Number (AT2) and

398 Proof Conceptions in Algebra
Algebra (AT3) (the mathematical foci of this article); mathematical reasoning was specified separately in a target termed Using and Applying Mathematics (AT1). It was in ATi that students were expected to engage in problem solving, formulate and test conjectures, and explain and justify conclusions. Because of the separation of problem solving and proving from mathematical content, particularly from geometry, as well as their explicit specification, the curriculum stood in marked contrast to that of many other countries where proof is still taught in the context of traditional Euclidean geometry (see Hanna, 1995). In terms of sequencing in the curriculum, each attainment target was divided into eight levels of ascending diffi-
culty against which students would be tested. This division into eight levels was not based on any theoretical or empirical analysis of progression but rather was imposed across the curriculum as a mechanism to compare achievement across participants. Nonetheless the requirement to specify levels in proving would clearly be expected to have implications for student learning.
Although this emphasis on processes in the new curriculum resonated with some of the messages from mathematics education and indeed from mathemati- cians, initial reactions to the curriculum changes were less than positive. The debate culminated in 1995 in a publication spearheaded by the London Mathematical Society, a powerful group of mathematicians, who complained about the lack of emphasis on precision and proof in the curriculum, despite the latter' s separate specification in the curriculum. One interesting aspect of this debate was that it was conducted largely in the absence of evidence, because the effect of the separate specification of processes in the curriculum had yet to be systemati- cally investigated. Were students who had followed the new curriculum able to
apply their reasoning skills to content in other attainment targets? Were students
competent at constructing or evaluating a mathematical proof? What did students
judge to be the nature of mathematical proof? What did they see as its purposes? Did they see proving as verifying cases or as convincing and explaining? What were the views of mathematics teachers about teaching proof, and how were students influenced by their views? Although the National Curriculum was statutory and thus universally delivered, were there variations in how it was implemented and
experienced, and if so, what were these variations in the area of proof, why had
they taken place, and what were the implications for student learning?
THE STUDY
In the research project Justifying and Proving in School Mathematics, we tried to answer some of these questions by studying, through an analysis of the concep- tions of proof held by students who had followed this curriculum, how the National Curriculum was delivered and experienced with regard to proof. We also sought to interpret and explain these conceptions by reference to a landscape of student, school, and teacher factors and, by such means, to address some "hot problems" (Bauersfeld, 1997, p. 621) posed for the mathematics education community. Specifically, our aims were to investigate the characteristics of arguments recog-

Lulu Healy and Celia Hoyles 399
nized as proofs by high-attaining students (aged 14-15 years), the reasons behind their judgments, and the ways they constructed proofs for themselves. We focused on high-attainers (the top 20-25% of the student population), because it was this group of students who would have been introduced to most of the content speci- fied in the eight levels of reasoning in the National Curriculum.
To relate student responses to school factors, we used multilevel modeling of the data set (see Goldstein, 1995), a method of statistical analysis used rarely in math- ematics education but commonly in school-effectiveness research. However, unlike the use in school-effectiveness studies, our use of this methodology was not to assess and compare performance across schools but to open a window onto student conceptions. After completing the quantitative analysis, we undertook interviews of a sample of teachers and their students to seek further illumination of the trends identified.
We investigated proof in two domains: arithmetic/algebra and geometry. In this article we report the findings from the former study only (for a complete descrip- tion of the survey analysis, see Healy & Hoyles, 1998; for a discussion of the find- ings of the geometry study, see Hoyles & Healy, 2000). We will outline the char- acteristics of a proof recognized by students, the ways in which they constructed
proofs, and the extent to which these productions fulfilled their own criteria. We will describe the role played by algebra, not only as a way of communicating a proof of a number-theoretic conjecture but also as an indication of students' ideas about the
purpose of proof. Finally, we discuss any factors, arising from school and curriculum organization, that appeared to influence students' conceptions and performance.
The Research Instruments
To collect the quantitative data, we designed two survey instruments-a student proof-questionnaire and a school questionnaire-and schedules for teacher and student follow-up interviews. The proof questionnaire was designed to provide, first, an overview of students' views of what comprised a proof, its role, and its gener- ality and, second, an indication of students' competence in constructing proofs.
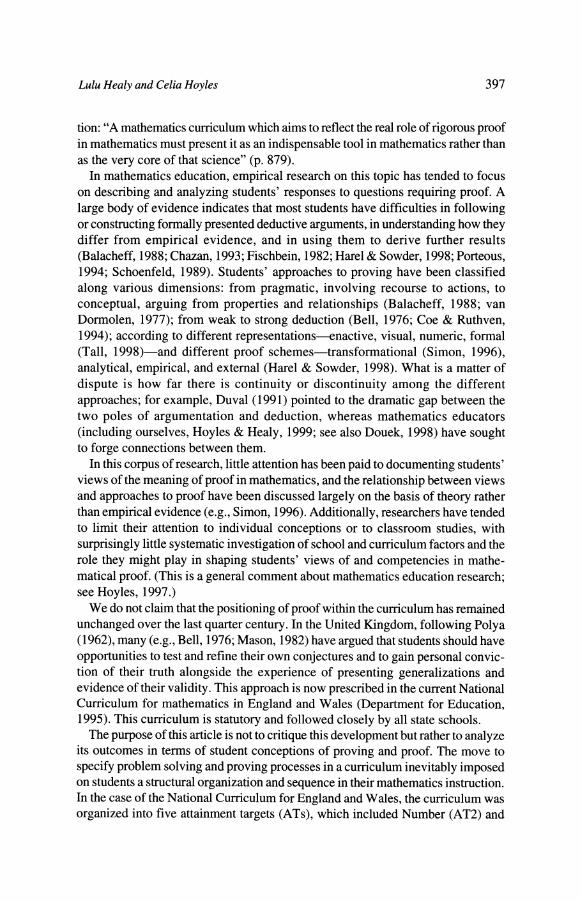
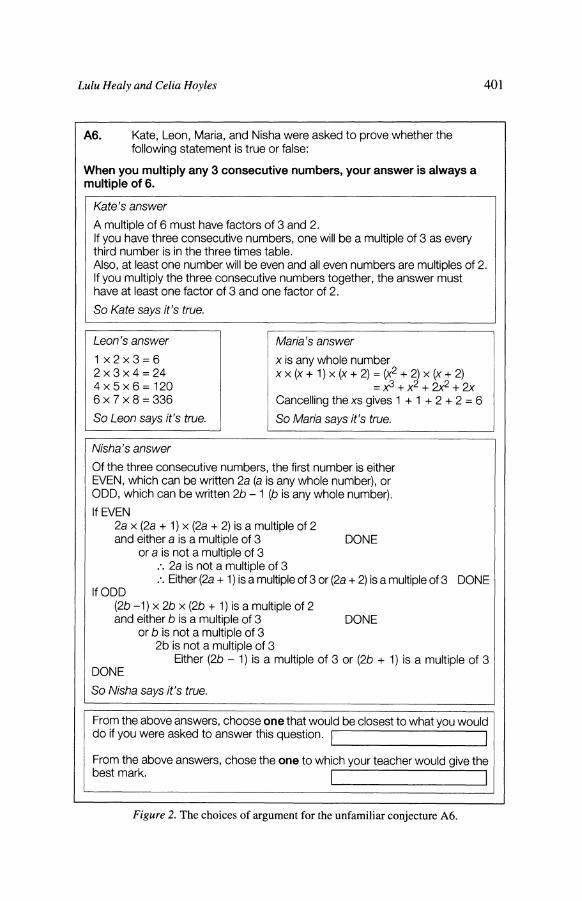
The survey included three types of items to probe student views of proof from a variety of standpoints. First, students were asked to provide written descriptions about proof and what they thought was its purpose. Second, students were presented with mathematical conjectures and a range of arguments in support of them; they were asked to make two selections from these arguments-the argument that would be nearest to their own approaches and the argument they believed would receive the best mark from their teachers. Third, students' assessments of these argu- ments in terms of their validity or explanatory power were elicited. Two conjec- tures were included, one familiar (Question Al) and the other unfamiliar (Question A6), and these, together with the arguments presented in the multiple-choice format, are shown in Figures 1 and 2.
For the theoretical framework that governed the choice of arguments included in each of these questions, we drew on the analyses of van Dormolen (1977) and

400 Proof Conceptions in Algebra
Al. Arthur, Bonnie, Ceri, Duncan, Eric, and Yvonne were trying to prove whether the following statement is true or false:
When you add any 2 even numbers, your answer is always even.
Arthur's answer a is any whole number b is any whole number 2a and 2b are any two even numbers 2a + 2b = 2(a + b) So Arthur says it's true.
Ceri's answer Even numbers are numbers that can be divided by 2. When you add numbers with a common factor, 2 in this case, the answer will have the same common factor. So Ceri says it's true.
Eric's answer Let x = any whole number,
y = any whole number x+y=z z-x=y z-y=x z + z - (x + y) = x + y = 2z
So Eric says it's true.
Bonnie's answer 2+2=4 4+2=6 2+4=6 4+4=8 2+6=8 4+6=10 So Bonnie says it's true.
Duncan's answer Even numbers end in 0, 2, 4, 6, or 8. When you add any two of these, the answer will still end in 0, 2, 4, 6, or 8. So Duncan says it's true.
Yvonne's answer
::::: : ::e
000000000 000000000
So Yvonne says it's true.
From the above answers, choose one that would be closest to what you would do if you were asked to answer this question. I
From the above answers, chose the one to which your teacher would give the best mark.
Figure 1. The choices of argument for the familiar conjecture Al.
Balacheff (1988) and the operationalization of Balacheff's framework by Coe and Ruthven (1994). Each question included (if possible) (a) an argument or arguments characterized as specific, empirical, or requiring an action or concrete demonstra- tion with little or no explanation (e.g., Bonnie's in Al); (b) an argument that relied on common properties or a generic case (e.g., Yvonne's in Al); (c) an argument that suggested underlying reasons and explanations written in a narrative everyday
Lulu Healy and Celia Hoyles 401
A6. Kate, Leon, Maria, and Nisha were asked to prove whether the following statement is true or false:
When you multiply any 3 consecutive numbers, your answer is always a multiple of 6.
Kate's answer A multiple of 6 must have factors of 3 and 2. If you have three consecutive numbers, one will be a multiple of 3 as every third number is in the three times table. Also, at least one number will be even and all even numbers are multiples of 2. If you multiply the three consecutive numbers together, the answer must have at least one factor of 3 and one factor of 2. So Kate says it's true.
Leon's answer 1 x2x3=6 2x3x4=24 4 x5x6= 120 6 x 7 x 8 = 336
So Leon says it's true.
Maria's answer
"x is any whole number "xx (x + 1) x (x + 2) = (X2 + 2) x (x + 2)
= x3 + X2 + 2X2 + 2X Cancelling the xs gives 1 + 1 + 2 + 2 = 6
So Maria says it's true.
Nisha's answer Of the three consecutive numbers, the first number is either EVEN, which can be written 2a (a is any whole number), or ODD, which can be written 2b - 1 (b is any whole number). If EVEN
2a x (2a + 1) x (2a + 2) is a multiple of 2 and either a is a multiple of 3 DONE
or a is not a multiple of 3 .. 2a is not a multiple of 3 .'. Either (2a + 1) is a multiple of 3 or (2a + 2) is a multiple of 3 DONE
If ODD (2b -1) x 2b x (2b + 1) is a multiple of 2 and either b is a multiple of 3 DONE
or b is not a multiple of 3 2b is not a multiple of 3
Either (2b - 1) is a multiple of 3 or (2b + 1) is a multiple of 3 DONE So Nisha says it's true.
From the above answers, choose one that would be closest to what you would do if you were asked to answer this question. I I
From the above answers, chose the one to which your teacher would give the best mark. I I
Figure 2. The choices of argument for the unfamiliar conjecture A6.

402 Proof Conceptions in Algebra
style (e.g., Ceri's in Al); and (d) a deductive proof, written in a formal style, presenting a logical argument with explicit links made between premises and conclusions. Because we were interested in to what extent students would distin- guish form and content, we included two arguments in this final category, one valid (e.g., Arthur's in Al) and one not (e.g., Eric's in Al).
Having agreed on the framework for the arguments to be presented in each multiple-choice question, we developed the items over five phases. First, we studied the National Curriculum specifications and found that students of this age and attainment were likely to have explored a variety of situations that led to the expression of relationships algebraically and would have had some experience of using letters to represent unknowns and of manipulating algebraic expressions. Second, we scoured textbooks for conjectures, in the arithmetic/algebra domain, appropriate for use with high-attaining 14- and 15-year-old students and discussed possibilities with a group of six teachers. Third, we gave a sample of these conjec- tures to a prepilot group of 68 high-attaining students, aged 14-15 years, who were asked to construct proofs of each conjecture. These responses provided us with a bank of appropriate proofs from which to choose arguments for our multiple-choice questions. Fourth, if there were any gaps in the framework, we filled them by writing with the teachers some arguments that fit the criteria. Finally, all the arguments were
subject to some modification after the proof questionnaire was piloted. To obtain more evidence of students' views of the functions of proof, we asked
the students, after they had answered each multiple-choice question, to evaluate each argument presented. They were asked to assess the correctness ("Do you think the argument contains a mistake?") and generality ("Do you believe that the argu- ment holds for all cases or simply for a specific case or cases?"). An example of the format used, as it applied to Bonnie's argument in Question Al, is shown in
Figure 3, Statements 1, 2, and 3. The correctness of students' evaluations of gener- ality was scored by what was called a student's validity rating (VR): An entirely correct profile of responses to 1, 2, and 3 for any given argument scored 2; a profile in which the student correctly noted whether the argument was general, specific, or wrong but was unsure of other factors obtained a rating of 1; all other profiles scored 0.1
Students were also asked to assess to what degree each argument explained the proof and convinced them of its truth. An example, again relating to the assess- ment of Bonnie's answer, is also given in Figure 3, Statements 4 and 5. If students
agreed with both statements, their explanatory power rating (EP) for that argument was 2; if they agreed with one or the other of the statements, the EP was 1; other- wise the EP was 0.
We sought further to assess students' views of the generality of a proved state- ment by asking them whether or not it automatically held for a given subset of cases.
1 Because the validity of Yvonne's visual argument is particularly ambiguous, students who assessed it as either specific or general were considered to be correct.

Lulu Healy and Celia Hoyles 403
agree don't know disagree Bonnie's answer 1. Has a mistake in it 1 2 3 2. Shows that the statement is always true 1 2 3 3. Only shows that the statement is true for
some even numbers 1 2 3 4. Shows you why the statement is true 1 2 3 5. Is an easy way to explain to someone in
your class who is unsure 1 2 3
Figure 3. Assessing the validity and explanatory power of Bonnie's answer.
The statement that was assumed to have been proved was the familiar conjecture presented in Question Al, about the sum of two even numbers. The question posed (A2) is given in Figure 4.
A2: Suppose it has been proved that when you add any 2 even numbers, your answer is always even.
Zach asks what needs to be done to prove whether when you add 2 even numbers that are square, your answer is always even.
Tick either A or B. (A) Zach doesn't need to do anything; the first statement has already I proved this. (B) Zach needs to construct a new proof. O
Figure 4. Assessing the generality of a proved statement.
The proof questionnaire also included questions with an open format: Students were asked to construct their own proofs, again for one familiar and one less familiar conjecture, and to present their arguments so as to obtain the best possible mark (Questions A4 and A7, respectively; see Figure 5). The order of questions was such that students could adapt arguments presented in earlier multiple-choice questions for use in their own proof constructions (for example, by adapting a proof about the sum of two even numbers to prove a conjecture about the sum of two odd numbers). All students' constructed proofs were scored for correctness (0 for no basis for proof, 1 for relevant information but no deductions, 2 for partial proof, and 3 for a complete proof). The main form of argument was also noted: empir- ical, formal (algebraic), or narrative. We noted if responses were irrelevant or absent; all the remaining proof types were classified as other.

404 Proof Conceptions in Algebra
The familiar conjecture to be proved was
A4: Prove that when you add any 2 odd numbers, your answer is always even. (Write down your answer in the way that would get you the best mark you can.)
The unfamiliar conjecture to be proved was
A7: Prove that if p and q are any two odd numbers, (p + q) x (p - q) is always a multiple of 4. (Write your answer in the way that would get you the best mark you can.)
Figure 5. The familiar and unfamiliar statements to be proved.
Finally, we coded students' written descriptions of the purposes of proof into three categories: truth (verification), explanation (illumination and communi- cation), and discovery (discovery and systemization), following and simplifying deVilliers's (1990) categories, shown in parentheses. If students wrote nothing or if their contributions were irrelevant, we coded the response in a category none/other.
While we were developing the student proof-questionnaire, we designed a school questionnaire to obtain information about a school-the type of school, its selection and setting (tracking) procedures, the hours spent in mathematics classes per week, the textbooks adopted, and the examinations entered. The proof questionnaire was to be given to whole classes of students, so the school ques- tionnaire was completed by the students' mathematics teachers, who were also asked to provide information on their backgrounds, qualifications, reactions to the place of proof in the National Curriculum, and the approaches they adopted to proof and the proving process in the classroom. They were also asked to esti- mate the percentage of their class that would be entered for the GCSE higher tier2 and to provide the Key Stage 3 (KS3) test scores3 of all the students who had completed the proof questionnaire. These teachers were also asked to complete all the multiple-choice questions in the proof questionnaire, but with a small change in the best-mark criterion. They (like the students) were asked to give their own choices of proof but also the proofs that they thought their students would believe would receive the best mark.
2 The General Certificate of Education (GCSE) is the public examination taken by students in England and Wales at the end of their compulsory schooling (age 16 years). Students are entered for one of three levels in the examination-foundation, middle, or higher. Although there is overlap in the grades obtainable from taking the examinations in the different tiers, there are ceiling grades for the lower tier examinations.
3 Key Stage 3 tests are national tests administered in the summer term to all Year 9 students (age 13-14 years). The scores are organized into Levels 1 to 8. At Key Stage 3, about 20% of students achieve each of Levels 5 and 6, 10% Level 7, and 2% Level 8.

Lulu Healy and Celia Hoyles 405
We returned to a sample of schools to interview these teachers as well as a subset of their students (the details of how the samples were chosen are given in the next section). Our aim in the teacher interviews was to build a picture of the teachers' views of proof and the ways they assessed their students. We devised a semi- structured interview schedule comprising some general questions on selection and procedures for tracking in mathematics followed by questions specifically about
proof: on what they thought should be the focus of the teaching of proofs and how
they went about teaching proof. In each interview, we also asked the teachers about
responses of interest from their proof and school questionnaires, and, in particular, we discussed differences between their predictions of arguments students believed would receive the best mark and the actual response patterns of their students on the best-mark question.
For the students, we designed a semistructured interview to probe the reasons for their responses to the proof questionnaire. We started with general questions about their attitudes toward mathematics and their plans for future study in math- ematics. We then asked if they had encountered proof in their mathematics lessons and, if so, where and how. Before the interviews, we had selected some of the students' interesting responses to the proof questionnaire, which we probed further
by asking the students why they had chosen a particular argument, why they had made their assessment of the argument (as, for example, true for all cases), or why they had gone about a proof in a particular way.
Methods
The two questionnaires were piloted with 182 high-attaining 14- and 15-year- old students in 8 schools, and modifications were made on the basis of the responses. These modifications included some small changes to the wording of a few of the
conjectures and arguments and a tighter specification of administration procedures of the proof survey. The survey, which was to be completed in 70 minutes, was administered to 2,459 students from 94 classes in 90 schools; the mathematics teachers of the 94 classes completed the proof questionnaire and school question- naire. A person employed by the research team for this task oversaw the adminis- tration of the survey. The schools were spread across England and Wales, 29 in urban, 25 in rural, and 36 in suburban settings. The sample of 2,459 students was made up of 1,305 girls and 1,154 boys, 14-15 years of age (Year 10 or U.S. Grade 9), with a mean Key Stage 3 score of 6.56.4 Thus these students were of higher than average ability, and because the survey was administered toward the end of the school year, they would all have been exposed to the algebra curriculum described earlier.
The arguments chosen, the written descriptions given in the proof questionnaire, and the information provided in the school questionnaire were coded and the proof
4 The distribution of scores according to National Curriculum Levels was 1 Level 4, 133 Level 5, 920 Level 6, 1109 Level 7, 162 Level 8, and 133 unknown.

406 Proof Conceptions in Algebra
constructions scored. Descriptive statistics based on frequency tables, simple correlations, and tests of significance were produced, and we built multilevel models of the factors associated with student responses (see Goldstein, 1995). This multilevel analysis had a two-level structure with student variables at Level 1 and class, teacher, school, and curriculum variables at Level 2. Following this analysis, we attempted to contextualize the statistical correlates identified in the quantita- tive analyses through data from the teacher and student interviews. To obtain the sample for interviews, we first chose some interesting schools, that is, schools with unusual characteristics, and then, within those schools, some students who either had responded following the general response pattern for that school or had given some intriguing answers. To find the interesting schools, we used our multilevel analysis to identify schools that performed particularly well. In these outlier schools, the students' scores were better than the scores predicted statistically after all the variables found to affect performance had been taken into account. Schools were also interesting in other ways; some had students who were good at formal proof or particularly expert at algebra. By looking at the multilevel data school by school and by carefully going through all the survey responses for those schools that looked interesting, we selected an initial sample of 22 schools. For practical reasons, this sample was honed to 10 schools that we revisited to conduct the teacher and student interviews.
RESULTS WITH DISCUSSION
Choices in the Multiple-Choice Questions
First, we present in Table 1 the distributions of students' and teachers' choices in the multiple-choice questions Al and A6 (see Figures 1 and 2).
Table 1 Distribution of Students' and Teachers' Choices of Proofs for Al, Familiar Conjecture, and for A6, Unfamiliar Conjecture
Percentages of students Percentages of teachers Argument Own approach Best mark Own approach Best mark
Argument chosen for Al N = 2450 N = 2423 N= 94 N= 94 Duncan (narrative) 29 7 6 12 Bonnie (empirical) 24 3 3 7 Ceri (narrative) 17 18 10 11 Yvonne (visual) 16 9 - -
Arthur (algebraic) 12 22 81 62 Eric (algebraic) 2 42 0 9
Argument chosen for A6 N = 2381 N = 2348 N= 94 N = 94 Kate (narrative) 41 19 70 48 Leon (empirical) 39 2 4 7 Nisha (algebraic) 7 55 22 38 Maria (algebraic) 13 24 3 6
Note. Yvonne's response was not given to the teachers.

Lulu Healy and Celia Hoyles 407
Clearly there was marked variation between the choices students made for their own approaches and for best mark. The differences between these distributions were highly significant for both questions (Al: X2 = 1741.5, df= 5, p < .0001; A6: X2 =
1891.2, df = 3, p < .0001). In fact, the arguments that were the most popular for the students' own approaches turned out to be the least popular when it came to choosing for best mark, and vice versa: In answer to Al, Duncan's and Bonnie's arguments were popular for one's own approach but not for best mark, whereas the reverse was true for Eric's algebraic (but incorrect) attempt and, to a lesser extent, for Arthur' s proof.
The differences between the teachers' own choices and those the teachers predicted the students would select for best mark were also significant (Al: :2 = 12.3, df= 4, p < .05; A6: X2 = 16.3, df= 3, p < .01), although in both questions, the most popular among the teachers' choices for their own approaches (Arthur's correct algebraic approach for Al and Kate's more narrative presentation for A6) were also the most frequently selected by the teachers as the argument that they believed their students would choose for best mark. Both sets of data indicate that students judged that their teachers would reward any argument provided it contained some "algebra" whereas teachers presumed that the logic of the argument would also be important. Teachers thus appeared to overestimate the extent to which their students would make judgments that were based on mathematical content rather than simply on form.
Students' Constructed Proof Scores
After scoring all the students' proofs (see Figure 5), we compared the distribu- tion of the scores with the distribution of choices of correct proofs in the multiple- choice questions. Comparison of the total number of students who selected an argu- ment representing what we deemed to be a correct proof with the total number of students who constructed either a partial or complete proof showed that students were significantly better at choosing correct mathematical proofs than at constructing them (X2 = 1088.77, df= 1, p < .0001). In fact, students were rather poor at constructing proofs, as shown in Table 2, which presents the distributions and means of students' scores for the proofs to the familiar and unfamiliar conjec- tures A4 and A7.
Not surprisingly, students constructed better arguments for the familiar conjec- ture than for the unfamiliar one, with 40% using some deductive reasoning in the former case (22% completely correct together with 18% partial proofs). For the less familiar and more complex statement, more than a third of the student sample could not give any basis for a proof, and only 3% managed to produce a complete proof.
Clearly, constructing a proof was difficult for the students. To obtain more insight into what students believed a proof should look like, we analyzed the major forms in which their arguments were presented. Our analysis of student choices of argument had pointed to their preferences for empirical, narrative, and formal (algebraic) proofs, the first two for a student's own approach and the last

408 Proof Conceptions in Algebra
Table 2 Distribution and Mean of Students' Scores for Each Constructed Proof
Familiar Unfamiliar conjecture (A4)a conjecture (A7)b
Constructed proof score No. % No. % 0 No basis for the construction of a correct
proof 354 14 866 35 1 No deductions but relevant information
presented 1130 46 1356 55 2 Partial proof, including all information
needed but some reasoning omitted 438 18 154 6 3 Complete proof 537 22 83 3 aM = 1.47; SD = 0.988. bM = 0.778; SD = 0.708.
for best mark. We therefore focused on the distribution of these major forms of argu- ment among the students' own productions, as shown in Table 3. (Other interesting types of informal argumentation that students used in response to the familiar A4 but not to the unfamiliar A7 do not appear in this classification. We have briefly noted them under Table 3.)
Table 3 Distribution of Forms of Presentation for Constructed Proofs
Familiar Unfamiliar conjecture (A4) conjecture (A7)
Form of proof No. % No. %
Empirical 845 34 1062 43 Narrative 692 28 792 32 Formal (algebraic) 281 11 82 3 None 74 3 443 18 Other 567 24a 80 4
a8% of the responses for A4 were attempts at visual proofs, and 15% were attempts to produce an exhaus- tive proof by examples referring to the units digit. These types of proof did not appear in responses to A7.
Table 3 shows that although producing empirical examples was the most popular form of argument used by the students, if they did try to go beyond this pragmatic approach, students were more likely to give arguments expressed informally in a narrative style than to use algebra formally. As shown in Table 4, these narrative proofs clearly were more likely than the algebraic attempts to be correct.
In the following three sections we discuss in more detail the three dominant forms of argument used by the students-empirical, algebraic, and narrative. We will

Lulu Healy and Celia Hoyles 409
Table 4 Distribution of Scores for Proofs in Narrative and Formal Modes
Narrative Formal Scores No. % No. %
Familiar conjecture, A4 0 176 25 84 30 1 67 10 98 35 2 160 23 52 18 3 289 42 47 17 Total 692 100 281 100
Unfamiliar conjecture, A7 0 350 44 33 40 1 221 28 37 45 2 141 18 8 10 3 80 10 4 5 Total 792 100 82 100
consider students' reactions to and use of these different types of argument and contex- tualize the quantitative data with extracts from the interviews when appropriate.
Empirical Arguments
Empirical arguments dominated responses in this study-a finding not surprising in light of previous research (most recently in the United Kingdom by Coe & Ruthven, 1994) although disappointing given the age and attainment level of the students in the sample. However, the students' use of examples in their constructed proofs was interesting, because this presentation was clearly influenced by the activ- ities specified in the Using and Applying attainment target (AT1) of the National Curriculum. As mentioned earlier, it is in this attainment target in activities known as investigations that students are most likely to encounter reasoning and proof-sepa- rated from the content of algebra or geometry. In investigations, real data must be collected and tabulated; then a pattern is to be spotted and, if possible, explained and proved. In students' proofs of the conjectures presented in A4 and A7, we frequently found evidence of the transposition of this investigations approach (of producing evidence, finding patterns, and making checks) from the applied problem-solving context in which it had been learned to the production of empirical proofs in the number-theoretic context.5 Typical examples are shown in Figures 6 and 7.
Responses to other questions in the proof questionnaire provided some insight into how the students assessed their empirical arguments. First, empirical evidence was not judged in the same way as the other arguments presented in the multiple- choice questions. Only a tiny minority of students chose an argument consisting
5 This phenomenon was also evident in the student responses to the geometry questions (see Hoyles & Healy, 1999).

410 Proof Conceptions in Algebra
My answer
add 1 (a) add 2 (b) a + b (c) 1 3 4 7 9 16
11 13 24 21 23 44
113 97 210 1111 1111 2222 1003 10003 11006
I noticed all the sums will be an even number a +b=c
Test: a = 35, b = 73
35 + 73 = 108 108 is also even so it is true.
Figure 6. An empirical argument for the proof of the familiar conjecture A4 (typed from original student work).
(p + q)x(p-q) = multiple of 4 4
I would substitute a range of numbers into p and q and divide by 4 and see if it is a multiple of 4.
p q p+q p-q (p+q)x +4 is it a (p - q) multiple
of 4? 7 5 12 2 24 6 / 9 7 16 2 32 8 /
11 9 20 2 40 10 / 13 11 24 2 48 12 / 11 5 16 6 96 24 /
Figure 7. An empirical argument for the proof of the unfamiliar conjecture A7 (typed from original student work).
entirely of examples as one that would receive the best mark (3% in Al, 2% in A6; see Tables 1 and 2), although many chose such an argument as being nearest their own approach (24% in Al and 39% in A6; see Tables 1 and 2). This result suggests that most students were aware that empirical arguments had limitations; they knew more was expected of them.

Lulu Healy and Celia Hoyles 411
This interpretation is given some support by our analysis of the validity ratings of the empirical arguments presented in the multiple-choice questions, that is, whether or not students thought arguments had mistakes and whether students believed argu- ments held for all or only some cases. The first part of Table 5 shows the validity ratings of the empirical arguments, Bonnie's in A I and Leon's in A6. These data indi- cate that although around one third of students (37% and 28% for Bonnie's and Leon's arguments, respectively) had no idea of the validity of these empirical arguments, more than half gave completely correct evaluations (54% and 60%); that is, they knew that these arguments had been proved to be true only in a subset of cases.
Table 5 Validity Ratings and Explanatory Power of Empirical, Algebraic, and Narrative Arguments, in Percentages
Validity ratings Explanatory power Argument type 0 1 2 0 1 2
Empirical arguments Bonnie's (Al) 37 9 54 24 51 25 Leon's (A6) 28 12 60 33 48 19
Algebraic arguments Arthur's (Al, correct) 44 15 40 56 33 11 Eric's (Al, incorrect) 69 19 12 64 33 3
Narrative argument Duncan's (Al) (most popular choice of Al) 24 8 68 18 40 42
Note. N = 2459 for each argument. There are three evaluations of the validity of each argument (mistake, always true, sometimes true): 2 = correct evaluation, 1 = partially correct evaluation, 0 = incorrect. There are two evaluations of explanatory power (shows you why, explains to someone in your class): 2 = explains private and public, 1 = explains private or public, 0 = does not explain.
Even among those students who had made incorrect evaluations of the empir- ical argument in Al, many suggested in their interviews that they had made this response as a result of having "looked through" the particular cases to the gener- ality because the truth of the conjecture was so obvious. This finding is illustrated in the following interview extract in which a student justified her choice of Bonnie's argument essentially by saying, "I know it is true."
I: If you look at Bonnie's [argument],... you said it doesn't have a mistake in it, but you said it does show it's always true, and it's not just for some even numbers; you said, "It's always true and not just for some." Could you justify why you said that and show it's always true?
T: Why does it show it's always true? Because when you're adding two even numbers, it [pointing to the units] will always give that number, so even if you had say 10 added to it, it would still give that [pointing to the units]; you'd still be adding these as well, so you'd still end up with that on the end [pointing to the units].
I: Oh, you're looking at just the units column, so if you start adding all the others, other digits on the end, it wouldn't make any difference?
T: No, before them [to the left of the units place], it wouldn't make any difference.

412 Proof Conceptions in Algebra
In A6, although the majority of students (rather more than was the case for Bonnie's argument) realized that Leon's empirical argument held only for specific cases, it was also the case that more students chose Leon's than Bonnie's for their own approach. Some students clarified in their interviews that they had selected Leon's argument not because it was a "good proof' but because they were aware that they were unable to construct anything better. We in fact tested to see if the distri- bution of empirical choices was the same as the distribution of empirical construc- tions and found significant differences ( X2 = 246.73, df= 1, p < .0001). These differ- ences not only showed that students were more likely to construct empirical arguments than to choose them but also supported the suggestion that they were the best arguments available to the students, and not necessarily that they were satis- fied with them as proofs. A student who would have preferred an argument with more reasoning and more explanation than Leon's made this point in an interview:
I: Now here you say that Leon's only shows the statement is true for some numbers, but you say that's closest to what you would do.
S: What did I ...? Of course I was being honest.... I mean I would like to find reasoning, but the answer I would give instinctively would be well ... examples. But I think reasoning you get more marks for.
I: And do you think that that [Leon's argument] is a proof? S: No,... well,... it looks as if it is right, but it is not finished because it doesn't tell you
why. Taken together, the data indicate that students were more likely to assess empir-
ical arguments as general-to believe them to be proofs-if they were already convinced of the truth of the statement and so intuitively could extend the argu- ment for themselves. When using this strategy was not possible, as in response to
Question A6, they assessed the limitations of the empirical argument correctly but were honest enough to realize that they would produce something similar.
Turning to other ways students assessed empirical arguments, we analyzed the
explanatory powers they had awarded these arguments, also shown in Table 5. These data indicate that fewer than one third of the students (24% for Bonnie's argu- ment, 28% for Leon's) felt that empirical argument had no explanatory value at all. This result again indicates sensitivity to the role of examples in proofs: Examples provide an immediate entry into what the conjecture is about and help to convince oneself or another of its truth.
Formal, Algebraic Arguments
Table 1 showed that arguments that included algebra were clear favorites among the students (Arthur's and Eric's for Al, Nisha's and Maria's for A6) when they made a choice for best mark; algebraic arguments were chosen by 63% of students for Al and 79% for A6. Clearly many students had not checked the logic of the
arguments they had chosen for best mark but instead were swayed by the presence of the algebraic form. Our interviews indicate that students may have chosen Eric's argument simply because it was "hard" to follow.

Lulu Healy and Celia Hoyles 413
I: So you chose Duncan's for you but Eric's for what you thought would get the best answer. Why did you think Eric would get the best answer?
E: Because I didn't completely understand what he was going on about, lots of xs and ys. I: Eric? E: Yes. And it's what Miss G likes because she likes complicated things and would prob-
ably give it the best mark.
I: Right. But this one you chose for yourself because you did understand that one? E: Yes, because I understood it. I: That's interesting. In fact, you thought that Eric's was wrong; you said you didn't know
if it's got a mistake in it and you thought Arthur's one is right,... but this [Eric's] would get the best mark because it's kind of got x and y in?
E: Yes. I understood Arthur's one, but Eric's was more, looked more mathematical; it's got more to it.
Recall that teachers tended to choose Arthur's argument for their own approach and for the choice of their students for best mark (see Table 1). In the interviews, many teachers explained this latter choice by saying that it was more important that the argument was clear and uncomplicated than that it included any algebra. For
example, in the interview extract below a teacher describes this type of motivation as underlying her choices:
I: You said Arthur's here would be your choice for this one [A l], the best mark, and for this one [A6], Kate's.
A: Well I would say that, I would say that [Arthur's argument] because to me that proves it unequivocally that that's the answer. I think it's because that's straightaway more obvious.... But I think you don't always have to go for formal; I think you go for the one that's most obvious ... when you're trying to explain something. When it comes to this one [A6], to start with I would explain it like that [Kate's argument]. I think I perhaps thought, "Well, you're going to get confused really quickly," and certainly the students might not be happy with this one [Nisha's]. So I think I may have discounted from that point of view, and I also felt that you'd get bogged down in that [Nisha's argument]. It's very complicated, isn't it? Well it isn't when you read through it, but it looks like it's going to be awful.
Although arguments that included algebra were the most popular among students for best mark, our results show that students knew that they would be highly unlikely to base their own arguments on similar algebraic constructions. In both
multiple-choice questions (Al and A6), the algebraic arguments were the least
frequently selected as the closest to the approach students would use, and algebra was used rarely as the language through which students attempted to write their own proofs (11% for A4, 3% in A7; see Table 3). When students did give alge- braic arguments, frequently the arguments scored 0 (30% in A4, 40% in A7; see Table 4) because, for example, the student simply seemed to sprinkle letters about in a nonsensical way, as illustrated in Figure 8.
As Table 4 also shows, of those students who did use a formal approach for A4, 65% included no deductions or reasoning (30% scored 0, 35% scored 1). Only 52 students (or 2% of the whole sample) who scored 2 in proving A4 used algebra to capture the structure of odd numbers with letters, and even fewer (47 students) went beyond this stage to manipulate the algebra and prove the statement (scoring 3).

414 Proof Conceptions in Algebra
3a + 3b = 6(a + b) a=3 b=9
(3 x 3) + (3 x 9) = 36
5a + 5b = 10(a + b) 93a + 57b = 140(a + b) An even number of odd numbers make an even answer but an odd number of odd numbers makes an odd answer: Odd Even 7a + 9b = 16(a+b) Odd Even Odd 7a + 9b + llc = 27(a+b+c) Odd Even Odd Even 7a + 9b + llc + 13d = 40(a+b+c+d) Odd Even Odd Even Odd 93a + 7b + 13c + 101d + 39e = 153(a+b+c+d+e)
Figure 8. A "nonsense" argument, with letters masquerading as algebra, to prove familiar conjecture A4 (typed from original student work).
In the unfamiliar question, these percentages dropped even further. Only 3% of students (82) chose to use algebra at all, and of these, only 5% (4 students) gave what we assessed as a complete proof (see Table 4). Again, the majority (85%) of those attempting a formal argument engaged in no reasoning or deduction. Clearly our students have difficulty presenting arguments algebraically.
To find out if reasons other than fluency explained students' reluctance to incor- porate algebra into their constructions, even for a familiar conjecture (Al), we turned to their evaluations of the validity and explanatory power of the two alge- braic arguments in Al, shown in Table 5. First, the VR rating for the arguments were on average lower than for any other argument, suggesting that students had
difficulty deciding whether the arguments were correct and if the letters meant the argument was always true or only sometimes true. Students' difficulty in identi- fying errors was noticeable: For Eric's answer, 69% failed to identify any mistake, and only 40% of students could correctly evaluate Arthur's argument.
Regarding explanatory power, arguments that incorporated algebra were most
likely to be viewed neither as showing why the given statement was true nor as representing an easy way to explain to someone who was unsure. This result is illus- trated in the VR and EP scores for Arthur's and Eric's answers (see Table 5); 56% of students found nothing convincing in Arthur' s argument, and (not surprisingly) 64% were unconvinced by Eric's. Similarly few students felt that these arguments both communicated and illuminated the mathematics involved (EP of 2 was awarded by only 11% of students to Arthur's answer and by 3% to Eric's).

Lulu Healy and Celia Hoyles 415
These evaluations suggest that students were put off from using algebra because it offered them little in the way of explanation; they were uncomfortable with alge- braic arguments and found them hard to follow. These factors did not however seem to deter them from thinking that their teachers would give these arguments the best mark-an interesting insight into how the teacher' s preferences as shown in their choices are transferred to students despite the limited emphasis on algebra in the curriculum. These interpretations are given support in the student interviews, as illustrated below:
I: Could you elaborate on your evaluation of Eric's argument? A: I think if someone was unsure of why it worked in the first place, then going into algebra
about it just wouldn't help them; it would just confuse them ... whereas this [refer- ring to numbers], you can say ... this is what happened, and you are using numbers, which are easier to deal with, whereas lots of people find algebra confusing.... If they didn't understand it anyway, then they might have a problem as well with the algebra; they might not understand that. I'd start with the simplest way of looking at it. I mean, it depends; sometimes algebra might be an easier way to explain, because the numbers just bog you down; there's too many of them,... but in this case algebra would just be complicating it.
Narrative Arguments
Arguments in which mathematical relationships and reasoning were described in everyday narrative or in pictures were chosen by large numbers of students as closest to their own approach: For Al, Duncan' s, Ceri' s, and Yvonne' s answers collectively accounted for 62% of the responses, and for A6, 41% selected Kate's narrative expo- sition. Such arguments were also more popular than formal ones when it came to students' attempts to write proofs of their own (see Table 3). Narrative arguments accounted for 28% of students' proof constructions in A4 and 32% in A7, and for both questions these presentations were in general associated with a higher incidence of deductive reasoning than any other mode of presentation (see Table 5). For example, for Question A4, 42% of the narrative arguments were complete proofs (see, e.g., Figure 9), and nearly two thirds of students who adopted this mode of argu- mentation used some deductive reasoning (scored 2 or 3).
Even for the unfamiliar A7, 28% of the arguments presented in words contained some deductive reasoning. A rather typical example is given in Figure 10, which illustrates a variety of representations "glued together" in an explanatory narrative.
Note that in the arguments presented in Figures 9 and 10, students also included empirical examples alongside their narrative explanations. These student proofs seemed to follow a pattern: Examples are presented as evidence to convince and are followed by a discussion, in words perhaps illustrated by pictures, of why the statement is true. This type of argument appeared to be firmly connected to the mathematical structure of odd and even numbers and was clearly not the result of students' simply following a routine given by the teacher. For these students we argue that empirical data convince whereas words and pictures, but not algebra, explain.

416 Proof Conceptions in Algebra
an odd number = [an] even number + 1. e.g. 9 = 8 + 1 so when you add two odd numbers you are adding an even no. + an even no. + 1 + 1, so you get an even number. This is because it has already been proved that an even number + an even number = an even number. Therefore as an odd number = an even no. + 1, if you add two of them together, you get an even number + 2, which is still an even number.
Figure 9. A complete narrative proof of the familiar conjecture A4 (typed from original student work).
(1 + 3) = 4 (1 - 3) = [-]2 2 x 4 = 8 If p is odd and q is odd: (p + q) = even p - q = even @000 0 0
00 0 -
An odd subtracted from another odd no. leaves an even no.
even x even = multiple of 4. Because each even no. is a multiple of 2 when multiplied together they must make a multiple of 4. z> (p + q) x (p - q) = multiple of 4
Figure 10. A narrative proof of the unfamiliar conjecture A7 (typed from original student work).
We find evidence to support this claim in student evaluations of the generality and explanatory power of arguments presented in words. The most popular choice for the student's own approach in Al (Duncan's argument) was given an explana- tory power of 2 by 42% of students overall (see Table 5), and only 18% felt that it neither explained why the conjecture is true nor served as a good means to communicate to someone who was unsure. Students also found evaluating these arguments easier than evaluating those that included algebra. Duncan's answer received the best validity rating, with 68% of students achieving a maximum score.
Students' Views of the Role and Generality of Proof
The students' views of proof were evident in their choices of proofs, their eval- uations of these choices, and in their own proofs-although students' constructions were also influenced by their understanding of the mathematics involved. We had further evidence about their views of the generality of a proof though their responses to Question A2. Among our student sample, the majority of students (62%) were

Lulu Healy and Celia Hoyles 417
aware that no further work was necessary to check whether a proof held for a subset of cases if its generality had already been proved.
In fact, this proportion might be even higher, inasmuch as our interview data show that some of the students' reasons for saying that a new proof was necessary were unre- lated to any lack of appreciation of the generality of a proof. For example, one student misunderstood the language of the question; another assumed that a student must
always do something in school. The former case is illustrated in the following extract:
I: Let me just look at this next question, which is A2. Remember that we've shown that when you add two even numbers, the number [sum] is always even.... And you said the following [Zach needs to construct a new proof]: Do you think you could tell me why you chose (B) (reference to Figure 4) and why you think you need to construct a new proof and what you would do?
A: I think you have to construct a new proof because in the former question you proved that when you add two even numbers the answer is even, but if you're squaring them, then you're multiplying them together, yeah, multiplying them by themselves, and you haven't shown that if you multiply two even numbers the answer is even.
In contrast, Susie's response revealed a conviction that proof is not general. In her view of proof, the conjecture has to be tested with the particular examples suggested, that is with even numbers that are square: I: Could you [say] ... why you need a new proof? Why does Zach need a new proof? S: Yes, I think you need to use some examples because you just write out a statement....
He needs to write out some examples and then to make it more clear. I: Right, so what sort of examples would you have to do? S: Like 2 times 2 and the whole squared. It is 4 squared equals 16, so this [4 plus 16] is
even, but it's not enough. You need to prove at least more than three times and then do more again. If you think it is even, then you can use x and y to prove it again; x and y can be the even number.
Susie's response raises the central issue of students' views of the purpose of proof in school mathematics-verification, explanation, examples, or ritual. We have further evidence concerning students' views of proof from their answers to the open- ended survey question asking them to describe proof and its purposes. Responses were coded into four categories; the distribution of the categories used is shown in Table 6.
Table 6 Students' Descriptions of Proof and Its Purposes Categories View of proof and its purposes Number %
Truth References to verification, validity, and providing evidence 1234 50
Explanation References to explanations, reasons, communicating to others 895 35
Discovery References to discovering (or systemizing) new theories or ideas 26 1
None/other No response or one that indicated no understanding 700 28 Note. Any student description that mentioned several roles for proof received multiple codes, so total
percentage is greater than 100.

418 Proof Conceptions in Algebra
Half the students said that proof is used to establish the truth of a mathematical statement, although a substantial number (more than one third) ascribed to it an explanatory function. Only 26 students (1%) made reference to proofs' use in discovering or systemizing new ideas or theories. More than a quarter of students had little or no idea of the meaning of proof and what it was for. We attribute the propensity for students to describe proving in terms of explaining to the transfer to this content area of the emphasis on explanation in the investigations that form part of Attainment Target 1 of the National Curriculum. An example of how a student describes proof in terms of investigations is given in Figure 11.
You are going to complete a survey that is all about proof.
Before you start, write below everything you know about proof in mathematics and what it is for.
All that I know about proof is that when you get an answer in an investigation you may need some evidence to back it up to (PROVE) that it is right or to prove that a rule or equation works. Proof is to show that you understand what you have done and may have to show how you worked it out, and to show that you'll be able to answer the question showing all your working outs.
Figure 11. A student's description of proof as part of an investigation (typed from orig- inal student work).
Our follow-up interviews indicated that this view of proof as explanation might have been even more widespread than our coding had shown. Among students whose written descriptions of proof mentioned only verification, many, on further probing, mentioned that they also felt that proofs were important to illuminate and communicate mathematical ideas. To illustrate this point, we use Sarah's interview. First, Sarah simply mentioned "a truth role": I: What's it for? What's the point of proving? S: To prove that you were right or wrong.
However after examining the interview as a whole, we saw that she held a more multifaceted perspective of proof. When she discussed Leon's empirical argument, we discovered that she thought that examples could be a "proof," although not an "explanation." S. It is enough for a proof, but it is not a conclusion to me because it is not why.... A
proof that it is, not a proof plus conclusion, really-which is always what I prefer, because I like to find reasons rather than just examples.
I: So a proof can be on the basis of just examples? S: Yes, you proved that the statement is wrong or right.

Lulu Healy and Celia Hoyles 419
I: So you have proved it's right? S: Yes, but it hasn't given the reason that I would find interesting; ... that's what I try
and do because it has more reasoning than just an example. The question we posed for ourselves was whether these different views of proof
mattered-whether a partial view of proof or even an absence of any explicit idea of proof influenced a student's ability to identify or construct a proof. In the next section we report the explanatory factors that we identified through statistical analysis as underlying students' responses.
Factors Influencing Students' Conceptions
In the previous sections, we described some overall patterns in student responses to the proof questionnaire. In this section, using data from the school question- naire, we consider the factors associated with these different student outputs and the extent to which they varied from school to school. To carry out this analysis, we constructed a series of two-level statistical models with school variables (including school, curriculum, and teacher factors) at Level 26 and student vari- ables at Level 1. We present the models of the following student responses: students' choices for their own approaches on the multiple-choice questions and their scores for constructed proofs. A total of 34 input variables were tested for asso- ciation with each output measure; for 13 (9 Level 1 and 4 Level 2), either we found that the variable was significant across several outputs or we found a substantive interpretation for their effects.7 These variables are shown in Table 7.
We discuss first the findings from modeling the scores for constructed proofs. As Table 7 shows, only two variables were significantly associated with both these scores-the gender of the student and his or her KS3 test score. Exploring further the influence of a student's gender, we found that when we accounted for KS3 test scores, girls obtained higher scores than boys in their constructed proofs.
The models indicated that students with high KS3 test scores constructed better proofs than those with low KS3 scores and were less likely to rely only upon empir- ical evidence in their constructions and selections. This result in itself is not altogether surprising, although it should be noted that Key Stage 3 tests include no items on proof. Perhaps more interesting is that KS3 test score was never the only factor associated with student performance, and other factors exerted a significant influence.
The other student-level variables associated with performance on constructing proofs involved responses to proof-questionnaire items rather than individual- student data and related to student views of the role and generality of proof. The only Level 2 (school) variable that we found to be a significant influence on proof scores and that we can explain is the curriculum factor "percentage GCSE higher tier." Because these factors have some theoretical interpretation, we looked
6 Because we obtained responses from 2 classes in only 4 schools, we are unable to distinguish between school and class effects.
7 For more detail on the statistical models, see Healy and Hoyles (1998).

420 Proof Conceptions in Algebra
Table 7 Variables Significantly Associated With Performance on the Six Output Measures
Output measures Choices for Scores for
own approach constructed proofs Variable Al A6 A4 A7
Level 1 Views of role of proof
Truth * *
Discovery * Explanation *
Student characteristics Gender * * * * Key Stage 3 test score * * * *
Response to questionnaire Best mark * * Proof as general *
Validity ratings * * Explanatory power * *
Level 2 Curriculum factors
% GCSE higher tier *
Examination syllabus * Main textbook/scheme * * *
Hours/wk in mathematics class * *
more closely at their precise influence; in Table 8 we present the estimated effects of these five significant variables on the scores for the two constructed
proofs.
Table 8 Estimated Effects of the Significant Variables on the Scores for the Proofs to Familiar and Unfamiliar Conjectures
Proof of familiar Proof of unfamiliar conjecture (A4)a conjecture (A7)b
Estimated Std Estimated Std Variables effect SE effect effect SE effect
Level 1 Views of role of proof
Truth 0.075 .029 0.052 Student characteristics
Gender 0.13 .053 0.067 0.07 .028 0.049 KS3 test score 0.29 .034 0.207 0.15 .023 0.150
Responses to questionnaire Proof as general 0.20 .040 0.098
Level 2 Curriculum factors
% GCSE higher tier 0.003 .001 0.089
aBase group mean for scores on A4 = 1.28; SE = 0.053. bBase group mean for scores on A7 = 1.62; SE = 0.041.

Lulu Healy and Celia Hoyles 421
To explain how these estimates can be interpreted, we consider the model for the scores for proofs of the familiar conjecture A4. The model showed that three Level 1 variables and one Level 2 variable were associated with students' scores: student gender, Key Stage 3 test score, view of algebra proofs as general or not, and the percentage of the class expected to be entered in the higher tier GCSE paper. To undertake the analysis, one must select a base group for this model according to particular values for these significant variables; we chose male students who had a KS3 score of 6, were from a class in which 80% of students were expected to be entered for the GCSE higher tier paper, and believed a valid algebra proof not to be general. The estimate for this base-group mean score was 1.28. The estimates for the explanatory variables indicate the expected increase (or decrease) in this mean score. For example, to calculate the estimated score for a female student who had a KS3 score of 8, was aware of the generality of a valid algebra proof, and came from a class in which all students were expected to be entered for the higher paper, we would add to the base-group mean of 1.28 an additional 0.13 for the effect of being female, 2 x 0.29 for the Key Stage 3 effect, 0.20 as the estimate associated with the proof-as-general variable, and 20 x 0.003 to take into account that 100% of the class entered the GCSE higher tier. The estimated score for this group would therefore be 2.25.
Also in Table 8 are the standardized effects associated with each explanatory vari- able so that their relative effects within a model can be compared. On Question A4, for instance, the standardized estimates indicate that the variable with the largest effect was Key Stage 3 test score (0.207), the smallest was a student's gender (0.067), and the other two significant variables had similar effect sizes: 0.098 for recognition of proof as general and 0.089 for percentage GCSE higher tier.
Overall Tables 7 and 8 indicate that higher general mathematics competence is associated with better constructed proofs, with girls performing better than boys. Other factors such as having some idea of the nature of proof or being in a class that will sit the most challenging examination could also be of influence.
We now turn to the multinomial models of student choices in Questions Al and A6 and the factors shown to be significant as already noted in Table 7. Evidence from these models supports the findings of the descriptive statistics. They indi- cate that students were attracted in their choices for their own approaches by argu- ments that they could evaluate correctly (measured by their validity ratings, i.e., finding mistakes or correctly assessing their generality) and those that they felt were explanatory (the variable explanatory power was significant). Their choices were also influenced by the views students held of proof and its role and by what they believed the teacher would reward with the best mark. Other factors that had not been noted in the descriptive statistics did emerge in the models, for example, the influence on choices of KS3 test score and the gender of the student as well as a range of Level 2 factors, such as hours of mathematics class per week, the textbook used, or the examination syllabus followed. To indicate the relative influences of these factors, we show in Table 9 the chi-square values of all the variables for which we could make some theoretical interpretation and for which

422 Proof Conceptions in Algebra
the association with choices in Al and A6 were significant (with probability of association < .01).
Table 9 shows the strong influence of student factors, particularly KS3 score and the students' assessment of the explanatory power of an argument. Then, using multinomial modeling, we examined whether these influences varied according to the choices made. For a multinomial model, one category must be selected as a fixed locus or comparison category. In the case of Al for example, Bonnie's argument was chosen for this fixed category, so all data represent comparisons with the number of choices of Bonnie's argument. Table 10 presents the significant vari- ables related to student choices in Al. Particular values of these significant vari- ables were chosen to define a base group, in this case male students with an average Key Stage 3 score of 6, receiving the average hours of mathematics class (3 hours) per week. Students in this group were further defined by responses to other questionnaire items: They offered no view of the role of proof; chose different options for own approaches and best-mark approaches; and, on evaluations of their choices of argument, received scores of 0 for VR and for EP.
Table 9 Extent ofAssociation Between Student Choices for Own Approach and Other Variables
Familiar Unfamiliar conjecture (Al) conjecture (A6)
Variable x2 df x2 df Level 1
Views of role of proof Truth 69.9** 5
Student characteristics Gender 31.0** 5 KS3 score 313.5*** 5 119.4*** 3
Responses to questionnaire Best mark 294.6*** 5 37.3** 3 Validity rating 189.8*** 5 126.0*** 3 Explanatory power 823.2*** 5 379.6*** 3
Level 2 Curriculum factors
Examination syllabus 53.0** 15 Main textbook 45.6** 12 24.1** 12 Hours/wk in mathematics class 27.1"* 5 27.2** 3
*p < .01; **p < .001; ***p < .0001.
Table 10 also presents the estimates of the significant variables: A positive esti- mate indicates an increase in the likelihood of choosing a particular category in pref- erence to the comparison category, whereas a negative estimate indicates a decrease. So by considering the estimates associated with Arthur's argument in Al, one finds the model shows that the students most likely to choose his argument were males (being female decreases the base-group ratio by 0.36) who had a Key Stage 3 test

Lulu Healy and Celia Hoyles 423
score of 8 (increases the base-group ratio by 2 x 0.57), had a VR and EP score of 2 for this proof (increases the base-group ratio by 2 x 0.59 and 2 x 1.03, respec- tively), and so on. The higher estimate for the scores of students defined in these
ways indicates that such students were more likely to choose the valid algebraic argument than the empirical option in Al.
Table 10 Estimated Effects of the Significant Variables on Student Choices of Proofs for Familiar Conjecture A]
Argument chosen Variable Duncan's Ceri's Yvonne's Arthur's Eric's
Level 1 Views of role of proof
Truth 0.27 0.29 0.27 0.70 (0.10) (0.12) (0.13) (0.30)
Discovery 0.82 (0.41)
Student characteristics Gender -0.36
(0.12) KS3 score 0.39 0.53 0.30 0.57
(0.07) (0.08) (0.09) (0.09) Responses to questionnaire
Best mark 0.37 1.94 1.41 (0.10) (0.17) (0.36)
Validity rating 0.21 0.79 0.59 0.58 (0.06) (0.08) (0.08) (0.23)
Explanatory power 0.62 1.25 0.93 1.03 1.52 (0.13) (0.08) (0.09) (0.08) (0.21)
Level 2 Curriculum factors
Hours/wk in mathematics class 0.39 0.41 0.32 0.89 (0.12) (0.19) (0.16) (0.19)
Note. The comparison category was the empirical form, Bonnie's argument. Standard errors are in paren- theses. Some variables may improve the model overall, but significant estimates for particular cate- gories were not obtained. These variables are not shown here.
Overall the most interesting trends seen from Table 10 are that increases in Key Stage 3 test score and hours per week of mathematics class consistently raise the likelihood of choosing arguments that are not empirical, except in the case of Eric's algebraic but incorrect argument. A situation in which students have high mathe- matics attainment and considerable exposure to mathematics might be associated with student choices of proofs that are more mathematical but does not guard against their attraction to xs and ys. The finding that if all other factors are taken into account, girls are less likely than boys to choose Arthur's argument may also be worthy of further investigation.
The model once again confirms the tendencies indicated earlier that students' ratings of validity and explanatory power were significantly associated with their

424 Proof Conceptions in Algebra
choices for their own approaches for almost all the arguments presented. There was a consistent and positive effect showing that the higher these scores for any argu- ment, the greater the chance the argument would be selected. The model also indi- cates that despite differences between choices for best-mark and own approaches, there was a statistically significant association between the two.
The model of the significant variables in choices in A6 and their estimated effects is shown in Table 11. This table shows associations very similar to those shown for responses to Al in terms of the influence of Key Stage 3 test score, hours per week of mathematics class, ratings of validity and explanatory power, and best mark.
Table 11 Estimated Effects of the Significant Variables on Student Choices of Proofs for Unfamiliar Conjecture A6
Argument chosen Variable Kate's Nisha's Maria's
Level 1 Student characteristics
KS3 score 0.46 (0.08) 0.29 (0.12) 0.58 (0.11) Responses to questionnaire
Best mark 0.39 (0.16) 1.69 (0.26) 0.36 (0.17) Validity rating 0.61 (0.06) 0.43 (0.11) Explanatory power 0.92 (0.07) 1.07 (0.16) 1.01 (0.10)
Level 2 Curriculum factors
Hours/wk in mathematics class 0.35 (0.12) 0.39 (0.17) 0.60 (0.15) Note. The comparison category was the empirical form, Leon's argument. Standard errors are in
parentheses. Some variables may improve the model overall, but significant estimates for particular categories were not obtained. These variables are not shown here.
In examining all the models, we found that the influence of Level 2 factors was more limited than we had anticipated. Perhaps the most surprising finding was that there was no variation in students' scores according to the teacher variables, qual- ifications, gender, and teaching experience, although almost all the teachers in the sample were well qualified mathematically. Additionally, the fact that no signifi- cant associations were found when teachers' choices were added to the multino- mial models of student choices indicates that teachers' own choices of approach or predictions of their students' choices for best mark had little influence on students' responses. Teachers' choice scores were also not significantly associated with any other Level 2 variables relating to school and curriculum.
We had set out to investigate school variation, but after adjusting for all the signif- icant factors, we found considerable overlap in constructed-proof scores between schools and, in particular, more unexplained variation within than between schools. Additionally, from the multinomial models used to analyze choices, we found that little variation remained at the school level after adjustment had been made for all

Lulu Healy and Celia Hoyles 425
the significant variables. Only one finding of interest may be worthy of further
investigation: Girls' performances and choices were similar across all schools, whereas boys' performances varied widely according to the school attended.
SUMMARY AND IMPLICATIONS
In this article we have presented results from a nationwide survey of the concep- tions of proof of high-attaining 14- and 15-year-old students who had followed a new approach to proof, specified in a national curriculum. This curriculum is
statutory, so teachers are obliged to "cover" the content specified in the attainment targets, and this coverage is closely monitored by inspection and through Key Stage testing. We can separate the findings into those specific to the domain of algebra and those of more general interest. First we summarize the major findings as they illuminate student conceptions of proof in the domain of number and algebra.
Although our study showed that the majority of the students were unable to construct valid proofs in this domain, it also indicated that they valued general and
explanatory arguments. Additionally, although students predominantly used empir- ical arguments for their own proofs, they also recognized that these had low status and would not receive the highest marks from their teachers. The majority were also aware that empirical arguments were not general-particularly if the statement to be proved was not familiar-but they recognized that examples offered a
powerful means of gaining conviction about a statement's truth. Most students were also aware that a valid proof must be general and that once a proof has been given, no further work is necessary to ascertain the truth of specific cases within its domain of validity.
We also found that arguments presented in words were popular as students' choices of their own approaches to a proof; students were reasonably successful at evaluating these types of arguments and were likely to see them as explanatory. Students had most success in constructing proofs of their own when they used this narrative form, possiply including examples and diagrams. In contrast, students found that arguments containing algebra were hard to follow and that they offered little in terms of communicating and explaining the mathematics involved. Students still believed that the use of complicated algebraic expressions would get the best marks from their teachers-a belief about which many teachers seemed unaware. Yet few students chose such arguments for their own approaches, and fewer still constructed them with any success.
The findings related to student evaluations of the algebra proofs in the multiple- choice questions and the fact that students rarely used algebra in their own proofs raise an important question. If students do not see algebra as a language with which they can explain phenomena in mathematics classrooms in which explanations are highly valued, what motivation can there be for those who can successfully construct informal arguments to learn how to reexpress them algebraically? Clearly such a question extends beyond notions of proof to encompass students' views of algebra. To what extent do students recognize symbols as something they can

426 Proof Conceptions in Algebra
construct and use to give meaning to their work or as something they simply appro- priate from "outside" (for further discussion, see Bednarz, Dufour-Janvier, Poirier, & Bacon, 1993). Our students had yet to see algebraic transformations as poten- tial sources for conjectures, as building blocks for new proofs, or as a means to explain and communicate their mathematical ideas.
In addition to our findings related to algebraic understandings, we can point to more general results. As is clear from the survey, the ability to recognize or construct a proof is influenced by factors in addition to the individual students' conceptions mentioned above. Following our analysis, we suggest that the students simultaneously held two different conceptions of proof: those about arguments they considered would receive the best mark and those about arguments they would adopt for themselves. In the former category, algebraic arguments were popular. In the latter, students preferred arguments that they could evaluate and that they found convincing and explanatory, preferences that excluded algebra.
Our study also indicated that in England and Wales student responses to ques- tions about proof were shaped by the National Curriculum through which students learned about proving (separate from any content) as part of investigations in which they collected data and informally tested and checked empirical examples. Although many students seemed to appreciate that for a valid proof they need more than evidence, the majority had yet to adopt a theoretical approach or to produce proofs that included any logical reasoning. Using school-questionnaire data on the teaching contexts in which students experienced ideas relating to proof and justification, we found that in 77% of schools, proof was met only in investigations, and we note that students' views of its function did not extend to systemization and discovery.
The multilevel modeling analysis in this study showed that students' success in constructing proofs and their choices of arguments were strongly influenced by indi- vidual competence but were never determined by these factors alone. Students' views and evaluations of proof, the genders of the students, and their experiences in the curriculum all exerted significant influences on responses. There were differences in responses between boys and girls, with girls performing better than boys (if account is taken of mathematics attainment) and exhibiting different patterns of choices that appeared to be school-related, inasmuch as girls' perfor- mances were similar across schools whereas boys' performances varied more widely according to school attended. In relation to curricular influence, students in mathematics classes for more than the average number of hours per week or in a class of highly motivated students who would be entered for the most challenging assessment at age 16 years had better responses than other students.
Longitudinal studies are needed to draw out any causal links between the factors identified and the outputs measured.8 Additionally we do not know whether we found no teacher influence on student responses because our teacher-survey data, based only on teacher self-reports, failed to capture the subtlety of teacher influ-
8 A longitudinal study to follow students from age 12 to 15 years was started October 1999.

Lulu Healy and Celia Hoyles 427
ence or because the statutory curriculum is tightly specified in number, algebra, and proof. The lack of school variation that was evident in our models suggests that
practices in teaching proof in this domain do not fluctuate widely from school to school. In fact, there was much greater variation in the survey responses in geom- etry, maybe because geometry is less elaborated in the curriculum, thus leaving more space for teacher and school influence.
In conclusion, in conducting this research we considered a range of factors that are not generally taken into account in mathematics education research yet are regu- larly measured in other paradigms. We have suggested that explanations and argu- mentation may not be so neatly separated from formal proof along the dimensions
presented in the literature and that attention might usefully be paid to factors such as gender, general mathematics attainment, expectations, views of the mathe- matics involved, and mathematics contact-time in school. However, we do not know to what extent the conceptions of students who have followed a curriculum in which
processes of problem solving and proving are specified explicitly and sequenced match the conceptions developed in the students of other countries, where less
emphasis is placed on explanation, investigation, and argumentation and where
proof is more tightly linked to a content area (usually geometry). Additionally, in a situation in which the curriculum is not statutory, one might expect to find the school variation anticipated but not found to the extent envisaged in this study.
We as teachers need to find ways to build on the conceptions of students. In
England and Wales, we need to exploit students' strengths in informal and narra- tive argumentation to develop more multifaceted competence in proving that includes some deductive reasoning. Elsewhere (Hoyles & Healy, 1999), we have described and evaluated a teaching intervention designed to achieve these goals.
REFERENCES
Balacheff, N. (1988). Aspects of proof in pupils' practice of school mathematics. In D. Pimm (Ed.), Mathematics, teachers and children (pp. 216-235). London: Hodder & Stoughton.
Bauersfeld, H. (1997). Research in mathematics education: A well-documented field? [Review of the book International handbook of mathematics education]. Journal for Research in Mathematics Education, 28, 612-625.
Bednarz, N., Dufour-Janvier, B., Poirier, L., & Bacon, L. (1993). Socioconstructivist viewpoint on the use of symbolism in mathematics education. Alberta Journal of Educational Research, 39, 41-58.
Bell, A. W. (1976). A study of pupils' proof-explanations in mathematical situations. Educational Studies in Mathematics, 7, 23-40.
Chazan, D. (1993). High school geometry students' justification for their views of empirical evidence and mathematical proof. Educational Studies in Mathematics, 24, 359-387.
Coe, R., & Ruthven, K. (1994). Proof practices and constructs of advanced mathematics students. British Educational Research Journal, 20, 41-53.
Department for Education. (1995). Mathematics in the national curriculum. London: Her Majesty's Stationery Office.
deVilliers, M. D. (1990). The role and function of proof in mathematics. Pythagoras, 24, 7-24.
Douek, N. (1998, August). Some remarks about argumentation and mathematical proof and their educa- tion implications. Paper presented at the First European Conference of Research in Mathematics Education, Osnabrtick, Germany.

428 Proof Conceptions in Algebra
Duval, R. (1991). Structure du raisonnement deductif et apprentissage de la demonstration. Educational Studies in Mathematics, 22, 233-261.
Fischbein, E. (1982). Intuition and proof. For the Learning of Mathematics, 3(2), 9-18, 24. Goldstein, H. (1995). Multilevel statistical models (2nd ed.). London: Edward Arnold. Hanna, G. (1995). Challenges to the importance of proof. For the Learning ofMathematics, 15(3), 42-49. Hanna, G., & Jahnke, H. N. (Eds.). (1993). Aspects of proof [Special issue]. Educational Studies in
Mathematics, 24(4). Harel, G., & Sowder, L. (1998). Students' proof schemes: Results from exploratory studies. In A. H.
Schoenfeld, J. Kaput, & E. Dubinsky (Eds.), Research in collegiate mathematics education. III (pp. 234-283). Providence, RI: American Mathematical Society and Washington, DC: Mathematical Association of America..
Healy, L., & Hoyles, C. (1998). Justifying and proving in school mathematics (Technical Report). London: Institute of Education, University of London.
Hoyles, C. (1997). The curricular shaping of students' approaches to proof. For the Learning of Mathematics, 17(1), 7-16.
Hoyles, C., & Healy, L. (1999). Linking informal argumentation with formal proof through computer- integrated teaching experiments. In O. Zaslavsky (Ed.), Proceedings of the 23rd conference of the International Group for the Psychology of Mathematics Education (Vol. 3, pp. 105-112). Haifa: Technion-Israel Institute of Technology.
Hoyles, C., & Healy, L. (2000). Curriculum change and geometrical reasoning. In P. Boero (Ed.), Theorems in school. Dordrecht, The Netherlands: Kluwer. Manuscript in preparation.
London Mathematical Society, Institute of Mathematics and Its Applications, & The Royal Society. (1995). Tackling the mathematics problem. London: London Mathematical Society.
Martin, W. G., & Harel, G. (1989). Proof frames of preservice elementary teachers. Journal for Research in Mathematics Education, 20, 41-51.
Mason, J. (with Burton, L., & Stacey, K.). (1982). Thinking mathematically. London: Addison-Wesley. Polya, G. (1962). Mathematical discovery. Princeton, NJ: Princeton University Press.
Porteous, K. (1994). When a truth is seen to be necessary. Mathematics in School, 23(5), 2-5.
Schoenfeld, A. H. (1989). Explorations of students' mathematical beliefs and behavior. Journal for Research in Mathematics Education, 20, 338-355.
Simon, M. A. (1996). Beyond inductive and deductive reasoning: The search for a sense of knowing. Educational Studies in Mathematics, 30, 197-210.
Tall, D. (1989). The nature of mathematical proof. Mathematics Teaching, 127, 28-31.
Tall, D. (1998, August). The cognitive development of proof. Is mathematical prooffor all orfor some? Presentation at the conference of the University of Chicago School Mathematics Project, Chicago.
Thurston, W. P. (1995). On proof and progress in mathematics. For the Learning ofMathematics, 15(1), 29-37.
van Dormolen, J. (1977). Learning to understand what giving a proof really means. Educational Studies in Mathematics, 8, 27-34.
Authors
Lulu Healy, Research Officer, Mathematical Sciences Group, Institute of Education, 20 Bedford Way, London WC1H OAL; [email protected]
Celia Hoyles, Professor, Mathematical Sciences Group, Institute of Education, 20 Bedford Way, London WC I H OAL; [email protected]