a study of driving range estimation for city electric ... papers_v2.pdf · a study of driving range...
TRANSCRIPT
EVS28 International Electric Vehicle Symposium and Exhibition 1
EVS28 KINTEX, Korea, May 3-6, 2015
A Study of driving range estimation for city electric buses based on Taiwan EV Pilot Run Project
Yi-Ching Lee1, Bo-Han Hwang1, Wen-Hsien Hsu1
Automotive Research & Testing Center, No.6, Lugong S. 7th Rd., Lukang, Changhua County Taiwan, [email protected],[email protected],[email protected]
Abstract The driving range is an important issue of electric car manufacturers and electric vehicle fleet operators,
and it directly influences the cost, operation and customer satisfaction. The estimation of Battery
performance which has a significant impact on the driving range is an immature technique, however ARTC
(Automotive Research & Testing Center) proposed to estimate parameters including energy consumption
and battery aging. ARTC estimates the driving range by referring the following parameters like the speed,
the times of start and stop, and the temperature. Battery capacity is another impact factor, and it will
diminish when battery aging and degradation. However, the decreasing capacity has the enormous
implications of the range. ARTC presents the down trend of the battery capacity by the EV’s driving data
statistics, and then the capacity will be predicted from the trend. The bus is characterized by specific time,
position, path and driver, and it’s suitable to electrification of bus systems. This paper is focused on
estimating the energy consumption of electric bus. The driving range can be estimated by the speed, the
times of start and stop, the temperature, and battery capacity, and it will be more accurate. Furthermore,
this paper will present the trend of the battery aging by the charging capacity of battery. The research will
help to improve the vehicle’s design, and then support the expansion of electric vehicles.
Keywords: electric vehicle, driving range, OBU (On-Board Unit)
1 Introduction It’s been over hundred years since the first electric vehicle was built. However, the development of electric vehicle has no breakthrough until recently. According to the environment pollution, the electric vehicles are gradually taken seriously. Although the performance of electric vehicles today is better than hundred years ago, the EVs still can’t meet customer satisfaction in the driving range, the price, and charging infrastructure. Hence, vehicle manufacturers make efforts in developing EV to improve the car’s performance in reducing the
price and increasing the driving range. In the meantime, governments and institutions worldwide are implementing the EV pilot run to make masses experience and understand the EVs.
1.1 Taiwan EV Pilot Run Project According to “Intelligent Electric Vehicle Development Strategies and Action Plans”, Taiwan government starts to perform Pilot Run Project. In the first stage, 5 pilot projects are launched and over 250 electric passenger vehicles are driven around Taiwan including Taipei metropolitan area, Taichung metropolitan area, Tainan metropolitan area, and Sun Moon Lake National Scenic Area.
EVS28 International Electric Vehicle Symposium and Exhibition 2
The EVs are used as the government cars and rental cars. The main purpose of government cars is to show EVs to the Public. They are used as shuttle bus between the government buildings or squad cars. The rental car can be rented by the Public. It helps the Public to approach and understand EVs. In the second stage, the electric buses (eBus) are introduced to the project. So far, there are 3 projects are ongoing, and introduce over 30 electric buses which are made by Taiwan manufacturers. Nowadays, the eBuses run in many areas in Taiwan such as Kaohsiung metropolitan area, Dapeng Bay National Scenic Area, and Hsinchu Science Park and the operation modes of eBus in Taiwan EV Pilot Run Project are including city bus, intercity coach service, and shuttle bus. Next, the eBuses will be the shuttle bus running on campus and national park. Because the buses are characterized by specific time, position, path and driver, and they are suitable for electrification of bus systems. The paper focuses on the city eBus because of the operational mode’s features. This research expects to simplify the environment and summarize the relation between parameters and energy consumption by analysing the data from city eBus.
1.2 The driving and charging data evaluation in Taiwan EV Pilot Run Project
In order to evaluate the project’s performance, the first step is to make the operational plan. Next step is to establish the model that is what and how to evaluate. The third and fourth steps are data capturing and processing are. Then verify the outcome and produce the report. The flows are shown on Figure 1.
Figure 1 flow of data evaluation
Taiwan i-EV Pilot Project collects and analyses the EV data to evaluate the user’s driving and charging habits, and infrastructure appropriateness of EVs. The goal of this project is to gain the constructive suggestions to make
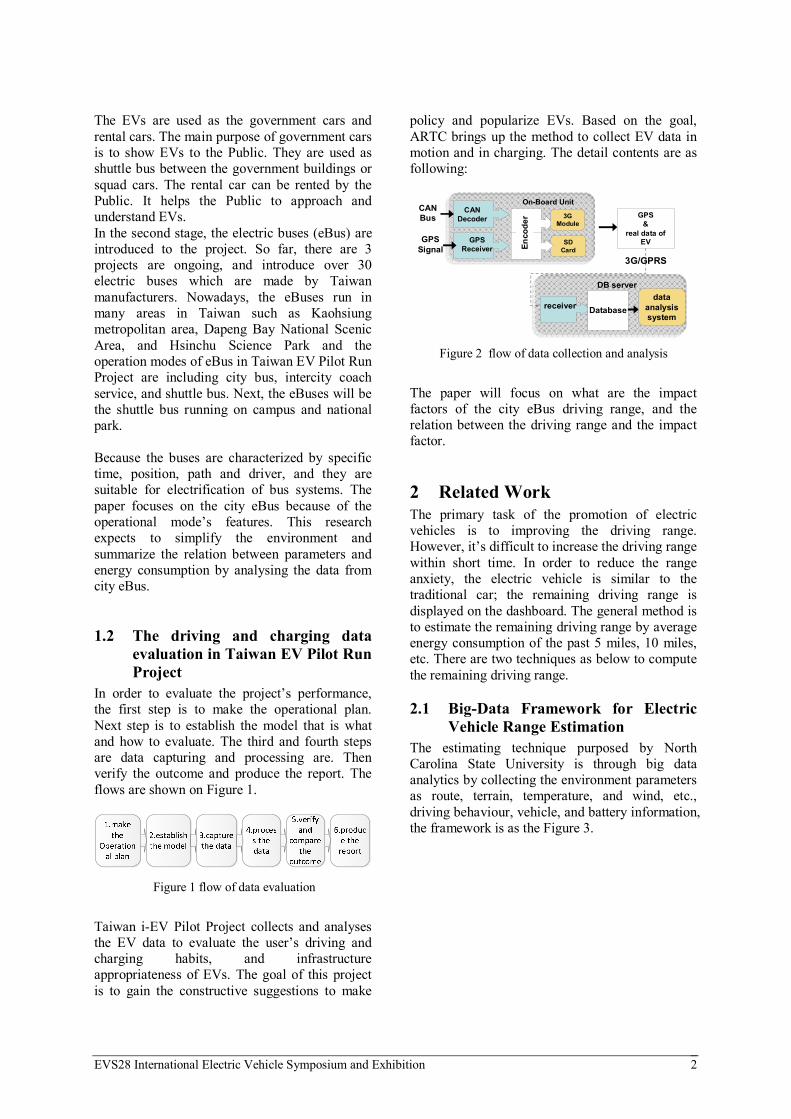
policy and popularize EVs. Based on the goal, ARTC brings up the method to collect EV data in motion and in charging. The detail contents are as following:
receiver
DB server
Databasedata
analysis system
GPS&
real data of EV
3G/GPRS
CAN Decoder
GPS Receiver
On-Board Unit
3G Module
CAN Bus
GPS Signal
SD CardEn
code
r
Figure 2 flow of data collection and analysis
The paper will focus on what are the impact factors of the city eBus driving range, and the relation between the driving range and the impact factor.
2 Related Work The primary task of the promotion of electric vehicles is to improving the driving range. However, it’s difficult to increase the driving range within short time. In order to reduce the range anxiety, the electric vehicle is similar to the traditional car; the remaining driving range is displayed on the dashboard. The general method is to estimate the remaining driving range by average energy consumption of the past 5 miles, 10 miles, etc. There are two techniques as below to compute the remaining driving range.
2.1 Big-Data Framework for Electric Vehicle Range Estimation
The estimating technique purposed by North Carolina State University is through big data analytics by collecting the environment parameters as route, terrain, temperature, and wind, etc., driving behaviour, vehicle, and battery information, the framework is as the Figure 3.
EVS28 International Electric Vehicle Symposium and Exhibition 3
Google map
Wunderground.com
Battery manufacturer
Vehicle manufacturer
Driving history
Route &Terrain
Wether
Driving Behavior
Vehicle Modeling
Battery Modeling
Electric Vehicle Model
Battery Simulator(SimBattery)
Distamce, Terrain, Location
Temperature, wind
Vehicleparameters
Battery Model parameters
Power consumption
Driving Range
Speed
Figure 3: Range estimation framework block diagram
2.2 Data mining approach for Range Prediction of electric vehicle
The method is based on the past driving data, and using real time information about the Electric Vehicle parameters as speed and energy, combined with external parameters like conditions of roads, traffic, and weather. The driver profile is based on the stored data, which acts as training set for a Data Mining approach, in order to estimate the Electric Vehicle range. The parameters of this model are as Figure 4.
Figure 4 main parameters for range prediction
2.3 The influence factor analysis of energy consumption on all electric range of electric city bus in China
There are serval impact factors of the driving range of electric city bus. The paper takes the Hefei city bus as an example, and focuses on the
driving cycles of constant speed, and analyses the influence of the vehicle mass, battery capacity, and the electric auxiliary on the energy consumption and endurance mileage.
3 The driving range estimation It’s important for driver to get the remaining driving range when using the electric vehicle. The driving range is affected by the vehicle model, driver’s behaviour, and environment’s status. The paper takes the city bus as an example, and focuses on the speed, temperature, and the times of start and stop. In order to study the electric bus, the conditions need to be simple. Because the city buses are used by the same driver, and the same route, the city bus are chosen to be an example. The city bus offers 26 seats; the vehicle weight is 13,000kg; the battery capacity is 250kWh. The city electric buses which are taken as an example run in one of the metropolitan areas in Taiwan, and the route is busy while the commuting time.
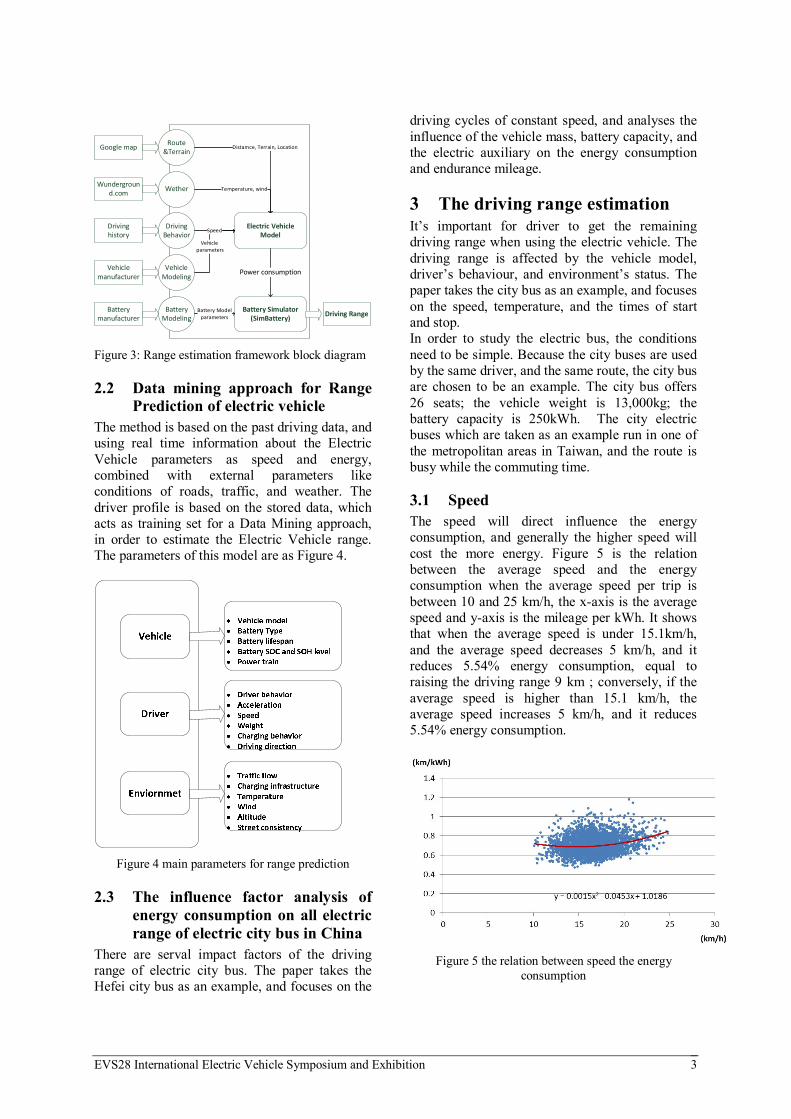
3.1 Speed The speed will direct influence the energy consumption, and generally the higher speed will cost the more energy. Figure 5 is the relation between the average speed and the energy consumption when the average speed per trip is between 10 and 25 km/h, the x-axis is the average speed and y-axis is the mileage per kWh. It shows that when the average speed is under 15.1km/h, and the average speed decreases 5 km/h, and it reduces 5.54% energy consumption, equal to raising the driving range 9 km ; conversely, if the average speed is higher than 15.1 km/h, the average speed increases 5 km/h, and it reduces 5.54% energy consumption.
Figure 5 the relation between speed the energy
consumption
EVS28 International Electric Vehicle Symposium and Exhibition 4
3.2 Times of start and stop
Figure 6 the relation between energy consumption and
the times of start and stop
Start and stop will influence the energy consumption. In Figure 6, the times of start and stop is through the distance and times of start and stop per day; and the energy consumption is the energy consumption per day. In Figure 6, the energy cost lower when the times of start and stop is lower. If the times of start and stop is 2, the energy consumption is 0.72 km/kWh; and the times is 2.5, the energy consumption is 0.69 km/kWh, the rate of decreasing is about 4%, and the driving range reduces 7.5 km..
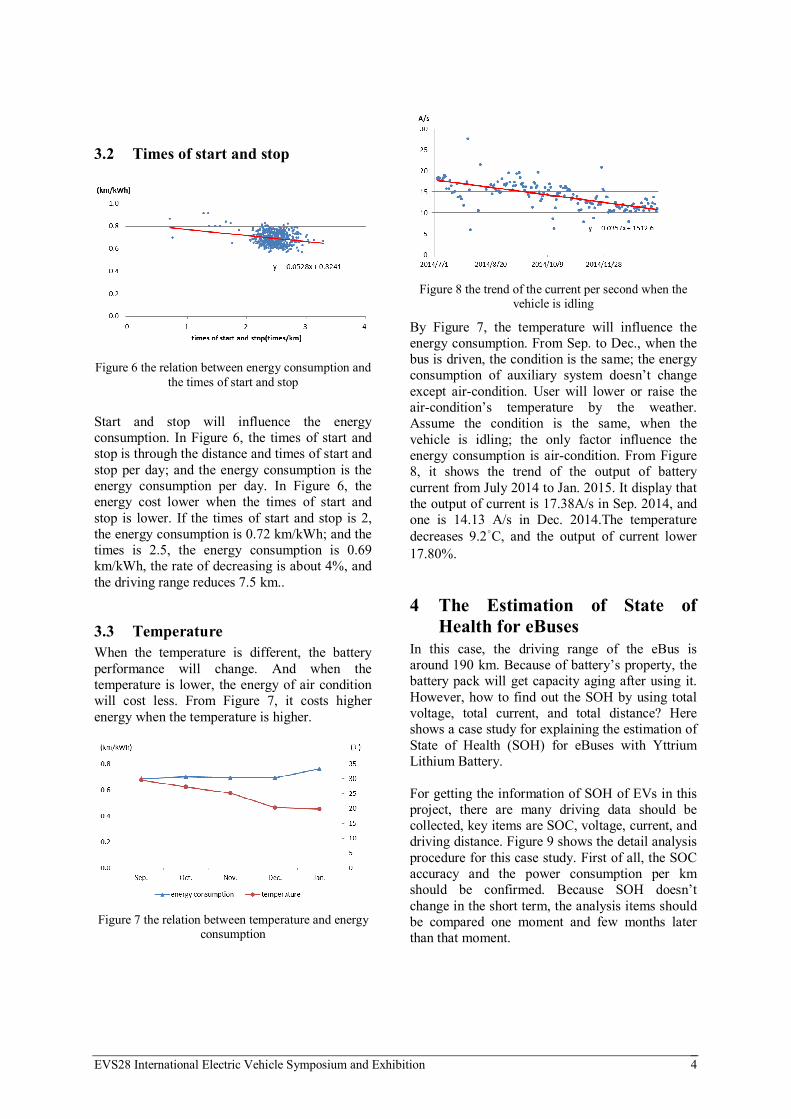
3.3 Temperature When the temperature is different, the battery performance will change. And when the temperature is lower, the energy of air condition will cost less. From Figure 7, it costs higher energy when the temperature is higher.
Figure 7 the relation between temperature and energy
consumption
Figure 8 the trend of the current per second when the
vehicle is idling
By Figure 7, the temperature will influence the energy consumption. From Sep. to Dec., when the bus is driven, the condition is the same; the energy consumption of auxiliary system doesn’t change except air-condition. User will lower or raise the air-condition’s temperature by the weather. Assume the condition is the same, when the vehicle is idling; the only factor influence the energy consumption is air-condition. From Figure 8, it shows the trend of the output of battery current from July 2014 to Jan. 2015. It display that the output of current is 17.38A/s in Sep. 2014, and one is 14.13 A/s in Dec. 2014.The temperature decreases 9.2°C, and the output of current lower 17.80%.
4 The Estimation of State of Health for eBuses
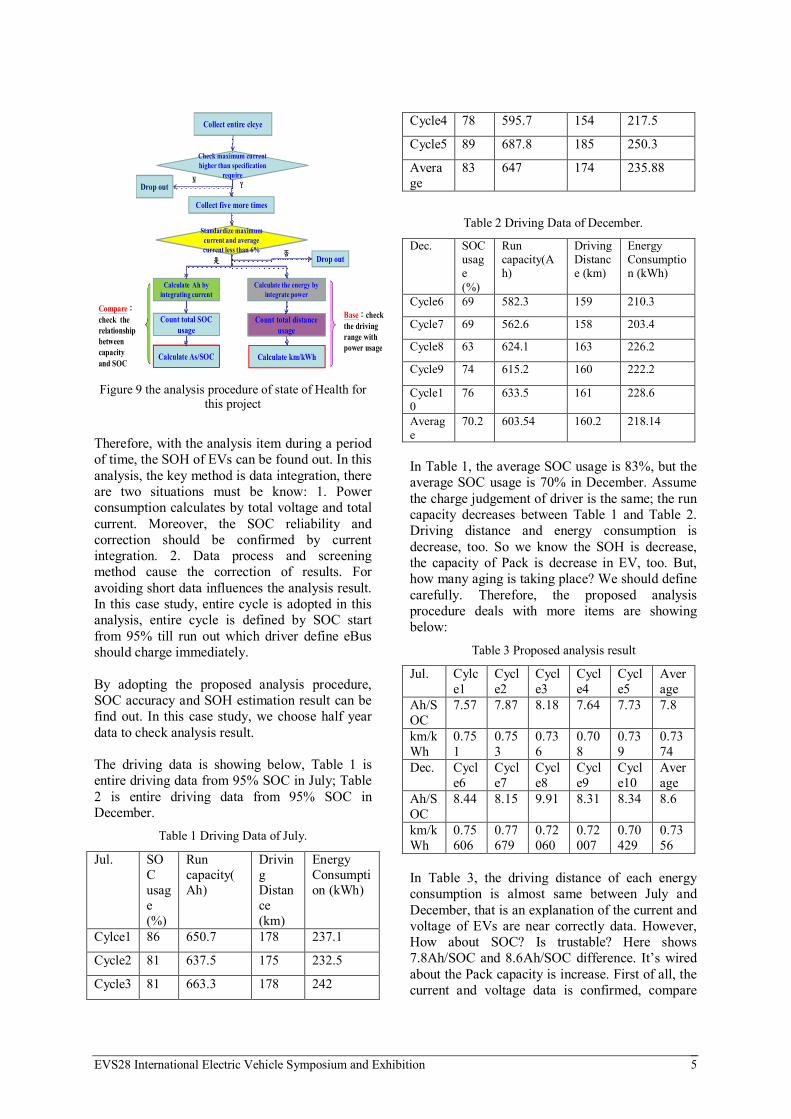
In this case, the driving range of the eBus is around 190 km. Because of battery’s property, the battery pack will get capacity aging after using it. However, how to find out the SOH by using total voltage, total current, and total distance? Here shows a case study for explaining the estimation of State of Health (SOH) for eBuses with Yttrium Lithium Battery. For getting the information of SOH of EVs in this project, there are many driving data should be collected, key items are SOC, voltage, current, and driving distance. Figure 9 shows the detail analysis procedure for this case study. First of all, the SOC accuracy and the power consumption per km should be confirmed. Because SOH doesn’t change in the short term, the analysis items should be compared one moment and few months later than that moment.
EVS28 International Electric Vehicle Symposium and Exhibition 5
Collect entire clcye
Collect five more times
Check maximum current higher than specification
requireDrop out
Standardize maximum current and average current less than 6%
Drop out
Calculate Ah by integrating current
Count total SOC usage
Calculate As/SOC
Calculate the energy by integrate power
Count total distance usage
Calculate km/kWh
Y
是
N
否
Base:check the driving range with power usage
Compare:check the relationship between capacity and SOC Figure 9 the analysis procedure of state of Health for
this project
Therefore, with the analysis item during a period of time, the SOH of EVs can be found out. In this analysis, the key method is data integration, there are two situations must be know: 1. Power consumption calculates by total voltage and total current. Moreover, the SOC reliability and correction should be confirmed by current integration. 2. Data process and screening method cause the correction of results. For avoiding short data influences the analysis result. In this case study, entire cycle is adopted in this analysis, entire cycle is defined by SOC start from 95% till run out which driver define eBus should charge immediately. By adopting the proposed analysis procedure, SOC accuracy and SOH estimation result can be find out. In this case study, we choose half year data to check analysis result. The driving data is showing below, Table 1 is entire driving data from 95% SOC in July; Table 2 is entire driving data from 95% SOC in December.
Table 1 Driving Data of July.
Jul. SOC usage (%)
Run capacity(Ah)
Driving Distance (km)
Energy Consumption (kWh)
Cylce1 86 650.7 178 237.1
Cycle2 81 637.5 175 232.5
Cycle3 81 663.3 178 242
Cycle4 78 595.7 154 217.5
Cycle5 89 687.8 185 250.3
Average
83 647 174 235.88
Table 2 Driving Data of December.
Dec. SOC usage (%)
Run capacity(Ah)
Driving Distance (km)
Energy Consumption (kWh)
Cycle6 69 582.3 159 210.3
Cycle7 69 562.6 158 203.4
Cycle8 63 624.1 163 226.2
Cycle9 74 615.2 160 222.2
Cycle10
76 633.5 161 228.6
Average
70.2 603.54 160.2 218.14
In Table 1, the average SOC usage is 83%, but the average SOC usage is 70% in December. Assume the charge judgement of driver is the same; the run capacity decreases between Table 1 and Table 2. Driving distance and energy consumption is decrease, too. So we know the SOH is decrease, the capacity of Pack is decrease in EV, too. But, how many aging is taking place? We should define carefully. Therefore, the proposed analysis procedure deals with more items are showing below:
Table 3 Proposed analysis result
Jul. Cylce1
Cycle2
Cycle3
Cycle4
Cycle5
Average
Ah/SOC
7.57 7.87 8.18 7.64 7.73 7.8
km/kWh
0.751
0.753
0.736
0.708
0.739
0.7374
Dec. Cycle6
Cycle7
Cycle8
Cycle9
Cycle10
Average
Ah/SOC
8.44 8.15 9.91 8.31 8.34 8.6
km/kWh
0.75606
0.77679
0.72060
0.72007
0.70429
0.7356
In Table 3, the driving distance of each energy consumption is almost same between July and December, that is an explanation of the current and voltage of EVs are near correctly data. However, How about SOC? Is trustable? Here shows 7.8Ah/SOC and 8.6Ah/SOC difference. It’s wired about the Pack capacity is increase. First of all, the current and voltage data is confirmed, compare
EVS28 International Electric Vehicle Symposium and Exhibition 6
with the information of Ah/SOC in July, the 7.8Ah/SOC can be as a reference to add in Table 2. The run capacity divide with 7.8Ah/SOC is almost 77% SOC, comparing with SOC usage in December, near 7% SOC difference is SOC error rate, and then SOH is difference between 83% and 77%. If driving data is a reference in December, the SOH is 94%.
5 Conclusion Taiwan EV Pilot Run Project provide the platform to let the public understand the electric vehicle. Especially, when traditional buses turn to electric buses, the public can take the electric bus go to work or school, and experience the electric bus’s advantage such as low pollution and low noise. However, the driving range estimation will confuse the driver, this paper summarize the impact factors like speed, temperature, the times of start and stop, and battery aging. Through this study, the result is as following: 1. When the speed is under 25 km/h, the energy
consumption is a quadratic curve, there is an inflection point, the value is bigger than the point, and the trend is that the high speed cost low energy; On the other hand, the value is lower than the point, the high speed cost more energy, In this case, when the average speed is higher than the value of inflection point, for every 1 km/h increase in average speed, the driving range increases by 1.8 km.
2. The energy and the times of start and stop are in direct proportion. The more times cost more energy. In this case. When the times increase 1, the energy cost increases 8%, equal to the driving range decrease 13.2 km.
3. The energy and the temperature are in direct proportion. The higher temperature costs more energy. In this case, When the temperature increases 1 ° C, the energy consumption increases 1.93%.
4. The battery SOH, in the case, through the battery capacity, the capacity decreases 6% in 6 months.
This paper provide the research of the impact factor of the energy consumption, and take city eBuses as an example to figure out the relation between the energy consumption and impact factors. Through the energy consumption, the driving range will be estimated. It’s expected the research will provide information to the vehicle
manufacturer and help bus operator to manage the driver.
References [1] Habiballah Rahimi-Eichi, Mo-Yuen Chow, Big-
Data Framework for Electric Vehicle Range Estimation, IECON'2014.
[2] João Ferreira, Vítor Monteiro, João L. Afonso, Data mining approach for Range Prediction of electric vehicle, Conference on Future AuTOMOTIVE Technology- Focus Electromobility, 26-27 March 2012 Munich Germany, pp. 1-15.
[3] Xiaogang Wu, Jiuyu Du, Chen Hu, Tingting Jiang, The influence factor analysis of energy consumption on all electric range of electric city bus in China, EVS 27
Authors
Miss Yi-Ching Lee The researcher studies the data analysis of EV in Taiwan EV Pilot Run Project. Her experiences are data collection, statistical data analysis and reporting. Dr. Bo-Han Hwang He received the B.S.E.E. degree from the Institute of Electronic Engineering, National Taipei University of Technology, Taipei, Taiwan, ROC, in 2007. He is currently working toward the Ph.D. degree in the Department of Electronic Engineering, National Taipei University of Technology. He is the leader of the battery energy management team in ARTC now. The major researches are evaluating the battery SOC, SOH, and cell screening. Mr. Wen-Hsien Hsu Wen-Hsin Hsu has over 15 years’ experience in the automotive industry specializing in service model research and systems engineering. He is also the leader of group does the evaluation data of EV research in Taiwan EV Pilot Run Project.