a study of coir vyvasaya co-operative societies in kerala...
TRANSCRIPT

CHAPTER VI
PROBLEMS AND PROSPECTS
6.1 Problems Facing by the Coir Vyavasaya Co-operative Societies
Ihe soda-economic status of the coir workers, the performance and the
operational efficiency of the coir vyavasaya co-operatives were analysed in
the previous chapter. In the following paragraphs the problems faced by the
eves are discussed.
The eves have certain favourable factors for successful working. They
are own infrastructure facilities, carrying out of manufacturing activities at the
convenience of members, assistance from governments in the form of grants and
subsidies. But these societies are faced with number of constraints. They are
discussed under three major heads Viz; i] Under-utilisation of production
capacity. ii] Marketing problems and Hi] problems connected with
machanisation.
6.1.1 Under-utilisation of production capacity
In the earlier discussion it was noted that the eves. were not utilising their
entire production capacity. The range of capacity utilisation and the reasons
thereof are given in Tables 6.1 and 6.2.

258
Table 6.1. Production Capacity Utilisation of A. Band Cclass of CVCS in the Study area
Range of Capacity Number of Societies in each CategoryTotalUtilisation [%] A B C
<-20 2[12] 7[44] 4[34] 13[29]
2140 7[40] 8[50] 6[50] 21[47]
41-60 4[24] 1[6] 1[8] 6[13]
61-80 2[12] -- 1[8] 3[7]
81-100 2[12] -- -- 2[4]
Total 17[100 16[100] 12[100] 45[100]
Source: Primary data
Note:- Figures in brackets indicate percentage to column total
Table 6.2. Reasons of Under-utilisation of Capacity
No of Societies and their responses for under-utilisation
Reasons [Code] ACategory BCategory CCategory Total
[Nos.17] [Nos..16] [Nos..12]
A 10[59] 8[50] 7[58] 22[56]
B 10[59] 15[94] 11[92] 36[80]
C 11[65] 6[38] 6[50] 23[51]
D 1[6] 1[6] 2[7] 4[9]
E 3[18] 0 0 3[7]
F 0 1[6] 1[8] 2[4]
G 8[47] 7[44] 5[42] 2044]
H 2[12] 1[6] 0 3[7]Source: Pnmary DataNote:- 1) A= Shortage of rawmaterials. B= Shortage of Working Capital
C= Non- availability of workers at the right time D= Lack of retting facilityE= Policy of the Director Board F= Environmental objectionsG= Labour problems H= Any other
2) Figures in parentheses indicate percentage to total number of cves in each class.3) Since the respondents [A,B and C classes of cves.] highlighted more than one
reason for under-utilisation of capacity, the sum total of percentages will never equalto 100.

259
Table 6.1 shows that out of the 45 societies belonging to all the categories
only 2(4%) have utilised their full production capacity and 34(76%) utilised only
upto 40 per cent of their producton capacity. This clearly indicates that there is
considerable under utilisation of production capacity in the case of most of the
eves.
In order to have some deeper insight to the reasons for such under
utilization, six major constraints were identified and the responses from the eves
on each item were solicited and recorded.
Table 6.2 presents the rankings of the four major reasons identified viz;
shortage of working capitaI[80 %], shortage of raw material[56%], non
availability of workers at the peak production period[51 %] and labour
problems[44%].
6.1.2 Working capital shortage [8- 80%]
In spite of all governmental support in such as Revival Assistance, Working
Capital loan, l.C.D.P. loan and other subsidies, the eves are facing the problems
of working capital shortage. On a much closer examination it was understood
that the lengthy production process and blocking up of working capital are the
reasons for this state of affairs. Once working capital is invested, it has to be rolled
on. But in eves, the problem is that after procurement of green husks, it takes 7
to 9 months to get them retted. As running concerns, they carry out yarn
manufacturing activity using old stock. But they have to pay wages and meet all
other establishment and contingency expenses. These constitute a major share
of their cost of production. To meet such expenses they send their products to
COIRFED for selling. But the eOIRFED takes its own time to pay the sale

260
proceeds to eves. Sometimes it may take months. This results in working
capital shortage and that forces some eves to shut down their production.
Table 6.2 shows that working capital problem is not that severe in A
category societies. This is because they get working capital loan and other
assistance from government. But around 90 per cent of Band e category
societies are experiencing working capital shortage.
6.1.3 Shortage of raw material[A- 56%]
Another major reason for the under-utilisation of production capacity of
eves was shortage of raw material. Raw husk is the raw material for eves. It is
aparadox to see that eves in Kerala are facing raw material shortage even when
Kerala is the major producer of coconut in India. It is already pointed out that
on~ a minorshare of the raw material potential of the state is utilised by the coir
industry as well as the coir co-operatives operating in Kerala. This points to the
~ct that raw material shortage is not due to lack of material availability, but due
:0 some other reasons:- They are discussed below.
i· Lack of collection machinary
The eves are depend on the traditional trade route for purchasing raw husk.
11~ route comprises of brokers, copra producers and capitalist husk dealers.
l1ere is no effective machinery to collect husk from small-scale coconut producer
~ouseholds. Therefore, husk from households are either discarded or used as
'Jet. This happens mostly in high range areas because of transporting problem,
261
11· Higher price
As Levy system is lifted by the Government, the eves have to purchase
husk from the open market. Naturally they have to compete with other private
lam manufacturing firms for purchase of husks. Moreover husks passes through
::1ultiples of intermediaries and that which adds the price of husk. Purchase of
Jfown fibre from Tamil Nadu is also affected with because of the same problem.
iii· Incapability of the mangement of societies to purchase husk at
the right time
Husks riped between January and March are of high quality and that yield
maximum fibre. Similarly, fibre content vary in relation to geographical area.
Husks collected from Perumbavoor and Mala are considered as top quality. The
CJCs have to purchase raw husk in the right season from the right place and in
required quality. But they fail to do so because of working capital problem. This
results in high raw material cost and interruptions in production
c· Non- availability of workers at the right time [C-51%]
Though Kerala is endowed with abundance of man power, coir societies
are facing labour shortage. Field survey revealed that lack of certainty of regular
oQrk in coir societies labourers go in search of work in low paid private coir sector
~here they get continuos work. So even at the time of need in coir societies
.lQrkers will not be available even though they are sure to get higher wages. It
:nay be recalled that the survey among coir households also revealed this
:i!uation. It is learnt during the survey that the secretaries of eves have to go to
!le eoir worker households in search of workers during busy periods of

262
production. But they fail to get them as they are in a binding contract with private
entrepreneurs.
Labour problems also disrupt the working of evCs. Labour is unionised
and the left parties have a stronghold in the coir sector. A number of strikes take
place inthis sector on various issues.
In certain areas like Thanneermukkom [Alappuzha] environmentalists
started raising voice against pollution of lakes and backwaters caused by retting of
husk. This is going to be a major problem in this sector in the comming years
and thatwill affect the production capacity of the societies. Eco-friendly methods
of retting are to be experimented to overcome this problem.
Category-wise analysis shows that shortages in the areas of working
capital, raw-material and labour are the major causes for the existance of
unutilised capacity in Band C categories of societies. But for 'A' category,
shortage of workers at right time is their major problem.
6.2 Marketing problem
Marketing problems are broadly categorised into two:- a] Marketing
problems directly linked with coir vyavasaya co-operative societies in kerala and
b] Marketing problems linked with coir industry in generaL
Marketing problems directly linked with coir vyavasaya societies are
analysed on the basis of the survey results and general marketing problems on
the basis of relevant literature.
263
6.2.1 Marketing problems directly linked with Coir VyavasayaCo-operatives in Kerala
As per rule, every coir society except that makes only fibre is required to
sell their products (yarn) to the apex marketing agency,Viz; the-COIRFED. They
are not allowed to market through private parties. But it was observed during the
survey that some of the societies are violating this rule. They market yam to Mats
and Mattings units owned by private parties or co-operative societies. They also
sell their products to local people for agricultural purposes. Some cvesmanufacture thick yam, known as 'vadom' to meet local demands.
The details of societies selling their products through private channels and
dlereasons thereof are depicted in Tables 6.3 and 6.4 respectively.
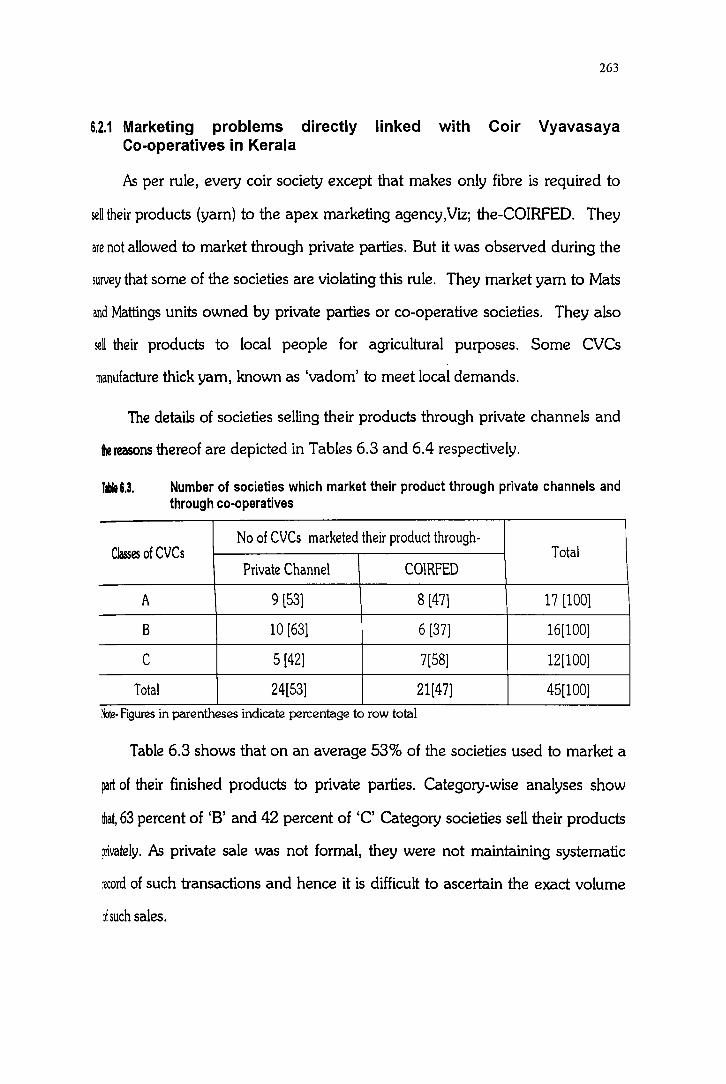
llble6.3. Number of societies which market their product through private channels andthrough co-operatives
No of CVCs marketed their product through-Classes of CVCs Total
Private Channel COIRFED
A 9(531 8(471 17 (1001
B 10 [63] 6 [37] 16[100]
C 5 [42] 7[58] 12[100]
Total 24[53] 21[47] 45[100]
~te· Figures in parentheses indicate percentage to row total
Table 6.3 shows that on an average 53% of the societies used to market a
part of their finished products to private parties. Category-wise analyses show
mat,63 percent of 'B' and 42 percent of 'C' Category societies sell their products
Jrivately. As private sale was not formal, they were not maintaining systematic
:ecord of such transactions and hence it is difficult to ascertain the exact volume
l! such sales.
264
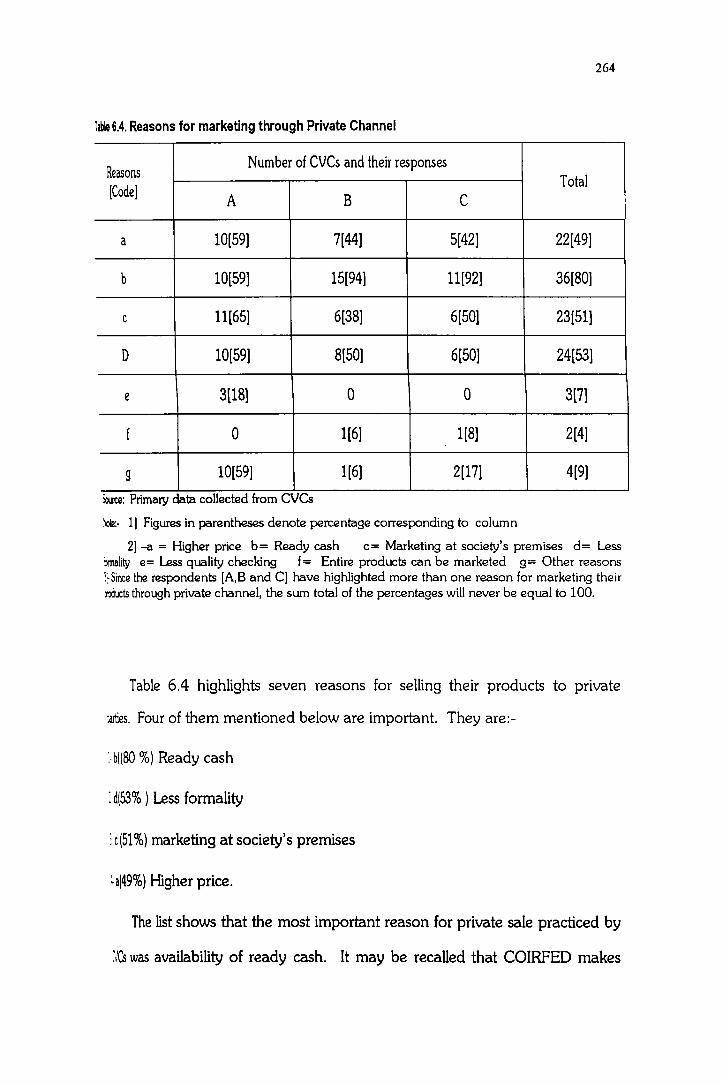
lable 6.4. Reasons for marketing through Private Channel
ReasonsNumber of CVCs and their responses
[Code]Total
A B C
a 10[59] 7[44] 5[42] 22[49]
b 10[59] 15[94] 11[92] 36[80]
c 11[65] 6[38] 6[50] 23[51]
D 10[59] 8[50] 6[50] 24[53]
e 3[181 0 0 3[71
f 0 1[6] 1[8] 2[4]
9 10[59] 1[6] 2[17] 4[9]
».ate: Primary data collected from eves~:. 11 Figures in parentheses denote percentage corresponding to column
2]-a = Higher price b= Ready cash c= Marketing at society's premises d= Less~lity e= Less quality checking f= Entire products can be marketed g= Other reasons]!·Since the respondents [A,S and Cl have highlighted more than one reason for marketing theirmucts through private channel, the sum total of the percentages will never be equal to 100.
Table 6.4 highlights seven reasons for selling their products to private
:arties. Four of them mentioned below are important. Theyare:-
:'b((80 %) Ready cash
:d(53% ) Less formality
:c(51%) marketing at society's premises
~aI49%) Higher price.
The list shows that the most important reason for private sale practiced by
:JCs was availability of ready cash. It may be recalled that COIRFED makes

265
available the sale price to societies after considerable delay and sometimes
repeated visits of secretaries becomes necessary to realise the sales price. Next
important reason for private sale was less formality. Dealings with eOIRFED
involve more formality including quality checking. The third important reason for
private sale is that such sales take place at the society's premises. There is no
transportation cost and strain involved in such sales. This is an advantage to the
society in the sense that a vehicle is to be hired for transporting the yarn to the
COIRFED in case of sale for eOIRFED and if no adjustment of space is available
in the godown, unloading take place only after one or two days which invites
more cost and displeasure of vehicle owners. The fourth important reason for sale
to private parties is the price differential. The price given by private parties will be
abit higher. There were some other reasons also for private sale as is given in
Table 6.4. But it is to be noted that, the societies will be eligible for husk subsidy
or fibre subsidy only if they sell their products to, eOIRFED. But some eves
.ere ready even to sacrifice this attractive subsidy for avoiding delay in cash
:eceipts and formalities while selling to the eOIRFED.
6.2.1.1 Problems confronted in selling through COIRFED
Field survey revealed the fact that majority of the societies are having
:omplaints about the approach of the eOIRFED. According to the situation the
:OlRFED is not only not extending any helpful attitude towards coir primaries
:ut eso acting as a 'big brother' .

266
Table 6.5. Problems confronted by A I Band Cclasses ofCVCs with COIRFED
i No. Of CVCs and their responses TotalI ProblemsII Aclass Bclass CclassI [Code] No. %I
[Total 17] [Total 16] [Total 12],
,
a 6[35] 5[31] 3[25] 14 31
b 11[65] 13[81] 11[92] 35 78
c 10[59] 10[63] 11[91] 31 69
d 12[71] 12[75] 9[75] 33 73
e 2[12] 5[31] 4[33] 11 24
f 9[53] 7[44] 4[33] 20 44
9 5[29] 6[38] 6[50] 17 38
h 1[6] 6[38] 2[17] 9 20Source: Primary data collected from A, Band e classes of evCs.Note:- 1. A] Fixed Selling b] Unscientific measurement of quality
Cl Non-acceptance of the produce due to lack of storing facilities ineOIRFED.D]lmportance of delay in releasing of selling priceE] DistanceF] Favouritism towards some societyG] Unfriendly attitude fo employees of eOIRFED.H] Non- acceptance of Fibre.
2. Figures in brackets indicate percentage to the total number of evCs in each class3. Since the respondents [A, Band e class eVCs] expressed more than one reasons for
selling their produces through eOIRFED, the sum total of the percentages will neverequal to 100.
Table 6.5 depicts the list of problems connected with dealings with the
COIRFED. On the basis of the importance of the problems expressed by coir
zdefies in each category, the problems are ranked. Out of eight reasons given
~ythe societies five were found to be significant. b- (78% of societies) d- (73%
JIsocieties) c- (69% of societies) f -(44% of societies) g- (38%of societies)
Thirty five societies (78%) complained about the unscientific way of
:r£asuring quality of yam by the COIRFED. For quality check the COIRFED take
lTandom sample of one bundle of 15 kg from a load of 50 Quintals of yam, they

267
and measures its runnage (Meter per kg.). If the COIRFED finds it is less than
standard the entire load of 5000 kg. will be under-priced. The moisture
measuring equipment is not used in checking quality. The employees of
COIRFED randomly assess the quality with a preconceived notion without any
scientific basis. In order to avoid further confrontation and delay most of the
secretaries are forced to accept the measurement.
Thirty three societies (73%) complained about the delay in releasing
selling price by COIRFED. This delay, according to them lead delayed payment
of wages to workers and causes working capital problem. Another important
complaint aqainst the COIRFED was non-acceptance of produce by COIRFED.
Consequently godowns of majority of societies, and offices of the secretaries were
flooded with yam. COIRFED has intimated the societies that they need to bring
the coir yarn only after getting positive signal from the COIRFED. Due to lack of
storage facilities at their disposal the societies were forced to stop production and
consequently workers were forced to go to private manufactures in search of work
at lower wages. Another problem pointed out is by the societies is that if too
much delay happens in sale, the yam will get dried further and the resultant
weight loss will add to its cost as the workers were already paid on the basis of
weight also when the societies took possession of the yam. Again yarn from
brown fibre gets broken when they are excessively dried. So when secretaries
rush their yarn to COIRFED have to run from one godown to another in the
I suburb area to keep their stock in tact and sometimes they are forced to keep the
, yam in the transport vehicle itself for days. In such a situation increasing
production becomes an added liability.
Another important problem (44%) pointed out by the societies against the
COIRFED authorities is favouritism. They allege that COIRFED authorities are
268
showing favoritism towards some societies in matters relating to measurement of
quality and release of sales price. It was pointed out that the politically influential
Board Members of societies are able to manipulate quality measurement and get
their products, graded as superior. They also succeed in getting the sales price
released without any delay.
The unfriendly attitude of the COIRFED officials towards the secretaries of
me societies were pointed out by 17 societies (38%). The COIRFED officials
consider the secretaries (majority of them are women) as second grade citizens.
Distance from eOIRFED is also a problem raised by some societies. In
.~ppuzha project, there are a number of Mats and Matings societies working
:lear the eves and their raw material is yam. But they were not permitted to sell
Jirectly to such Mats and Mattings societies. These eves have to transport their
\arTl to the COIRFED first which is 40 k.m. away from their place and then the
:0IRFED supply the same yam to Mats and Mattings societies located near the
JJCs. This shows that the COIRFED has no practical approach. Non
neptance of fibre is also a problem raised by some of the societies. For ego in
~ Thrissur project area some societies are manufacturing only fibre due to lack
j workers for manufacturing yam. But this yarn is not accepted by the
:OlRFED and so they are not eligible for any subsidy from Governments.
il2 Marketing problems linked with Coir Industry in General
Marketing problems of coir industry in general are assessed under two
:::egories as:- I] Problems in the domestic Market and 11] Problems in the Export
M.et.

269
6.2.2.1 Problems in the domestic Market of coir
In the recent past several substitutes have been introduced in the. market
lor coir mats and mattings. The samples of 'wondermat', 'ultimate' and 'pp
:urled Mats' are much in demand in the market in spite of their high prices.
~urther the introduction of Rubber Stud and Hollow Mats have reduced the sales
:JI Coir Mats to a large extent. With the effect of WTO agreement, cheaper
'iarieties of Polyster floor coverings are being imported from Belguim and other
:ountries and are being sold in India at a price much cheaper than coir floor
:overings. The properties of coir say eco-friendliness, is lost. The non- woven
erpets are bright, colourful, can be laid wall to wall, can easily be brushed and
:leaned but are not environmental friendly. Indian Railways and other ministries
were used to buy coir mattings every year, but now they have totally stopped
Juying eoir mattings and have switched over to non- woven carpets. Even the
~ays are now using PVC floor coverings for their coaches, toilets and
Jathroorns. The corridors in ministries at Udyog Bhavan, Krishi Bhawan, etc. are
~m~hed with PVC floorings while coir mattings were used as corridor matting in
~e past. It is rather a pity to see that the Ministry dealing with promotion of coir
Il the country is not using coir for its own offices and gangways.!
Coir is an item of consumption of mediocre families, institutions and
:epartments. The State Governments of Rajastan and U.P. have exempted coir
;oods from sales tax while in states of Delhi and Maharashtra the tax is as high as
l%, This makes coir goods uneconomical and unaffordable.
The marketing effortsin the domestic market is not very effective. The
j:Jvemment owned marketing undertakings wear a shabby look and fail to
::rract consumers. They fail to keep their showrooms attractive. So also the most
:emanded eoir products are not available in sufficient quantities in such show
:oms. The mode and style of packing are crude and conventional, and does not
270
nt in the present marketing scenario. Publicity, which is the need of the hour is
not carried out in a way to hammer the minds of consumers. The services of
media consultants are to be availed for this purpose. Again, movement of coir
~s from Alappuzha is greatly hampered due to non-availability of railway
.vagons. Similarly there is no pacca shed at the goods yard, and that forces the
maded goods to be kept in the open exposed to sun and rain. So the goods
~badly damaged and also subjected to theft.
6.2.2.2 Problems in the Export Market
Even though wide prospects for coir and coir products are existing, several
ifOblems are impeding its growth in the export market. Lack of market
monnation is a major problem. The exporters of coir products are generally of
~Uand medium size. Their knowledge about the target market is rather scanty.
Ally a few exporters undertake travel to have a first hand information about the
7dlket, identifying competing products and their prices, monitor the trends in the
~dlket place and watch out for emerging opportunities. Lack of market
r.teillgence is a principal problem being faced by the export sector." There is no
j.Jba1 forum to effectively represent the cause of the coir industry. The
~mmittee on Hard Fibres set up by FAO has several other hard fibres like Jute,
~af, Sisal, Abaca etc, on it, which are competitors of coir in the market place.
1Je high tariff rates for coir existing in various importing countries other than
~S.A is oneof the main hurdles for promoting exports of coir and coir products.
.~ international market for coir and coir products to a large extent depends
.:on the flexibility of the tariff imposed by the importing countries. Apart from
:< tariff, there are several non-tariff barriers that are impeding the growth of
'9Ort market for coir products. They include, allegations of child labour,
D?~cation of hazardous chemicals, environmental pollution while processing,
271
restrictive banking facilities, import quota restrictions antidumping measures,
undue insistence on the labour welfare measures etc.
6.3 Problems related to Mechanisation
Mechanisation is a controversial as well as a 'sensitive subject in the coir
industry as it is having some strong social and political linkage. Earlier any type
01 mechanisation was objected by labourers with their political backing due to
tear of loss of employment. But now situation has changed. For certain process,
abourers are not willing to work and hence shortage is felt. In this context, issues
re~ted to mechanisation of various processes of coir work is analysed in two
Qimensions, Viz; i] From the point view of coir societies and ii] From the point of
:oir workers.
~.3.1 The views of coir societies regarding mechanisation of variousstages of coir work
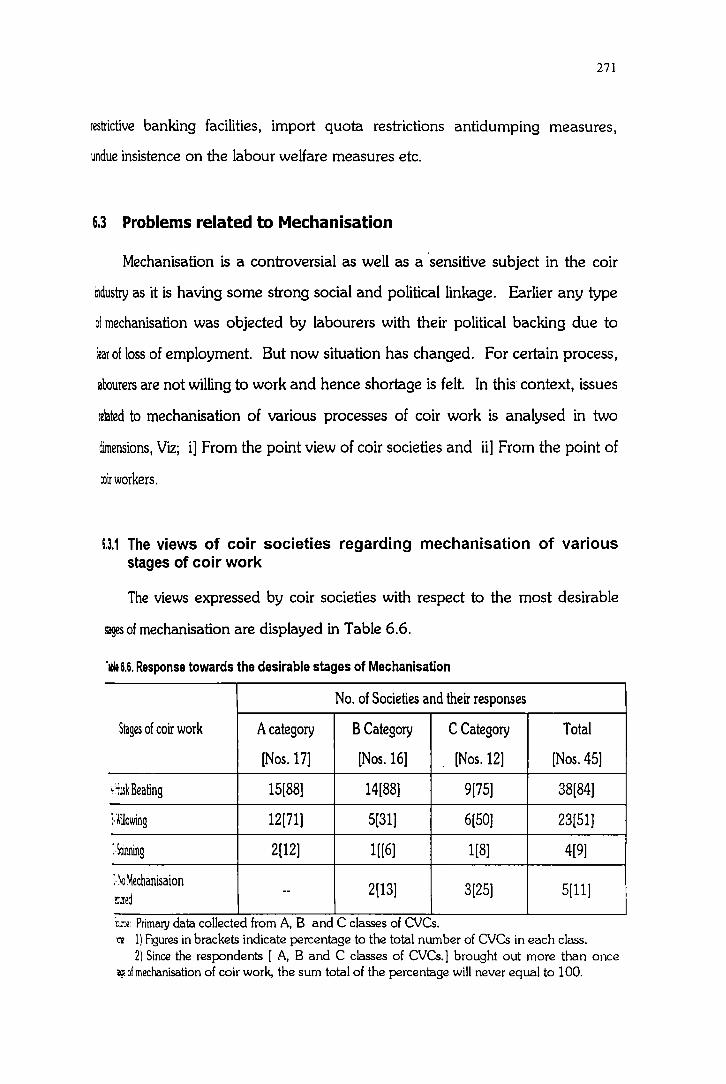
The views expressed by coir societies with respect to the most desirable
&ageS of mechanisation are displayed in Table 6.6.
'1bIe 6.6. Response towards thedesirable stages of Mechanisation
No. of Societies and their responses
Stages of coir work Acategory BCategory CCategory Total
[Nos. 17) [Nos. 16) [Nos. 12) [Nos. 45)
'~usk Beating 15[88) 14[88) 9[75) 38[84)
;.'liillowing 12[71) 5[31) 6[50) 23[51J
:\~inning 2[12) 1[[6) 1[8) 4[9)
:'So Mechanisaion 2[13) 3[25) 5[IIJ!:Jed
--
1)..'Ce: Primary data collected from A, Band e classes of OJCs.to' 1) Figures in brackets indicate percentage to the total number of evCs in each class.
2) Since the respondents [ A, Band e classes of evCs.] brought out more than once~ of mechanisation of coir work, the sum total of the percentage will never equal to 100.

272
Table 6.6 indicates that coir societies are not prefer mechanisation in the
spinning process and and the reasons there of are depicted in table 6.7.
Table 6.7. Reasons for poor response towards Non- Mechanisation of Spinning Process
Reasons [Code]Categories ofSocieties
TotalA[Nos] B[Nos.] ClNos.]
a 15[88] 12[75] 10[82] 37[82]
b 2[12] 3[19] 2[17] 7[16]
c 16[94] 14[88] 11[92] 41[91]
cl 1[6] 3[19] 3[25] 7[16]
e 16[94] 15[94] 8[67] 39[87]Source: Primary Data collected from A, Band C Classes of cvesNote 1) A = Labourers are available for traditional spinning
B = Financial scarcity. c = Low quality yarn from mechanased spinningD = Board of Directors are not interested e = Low price and increased cost ofproduction of Yarn
2) Firgures in brackets indicate percentage to the total number of cves in each class.3) Since the respondents [A,B and C classes of eves] expressed more than one reason
for the poor response to mechanisation of spinning sector, the sum total of thepercentage will never be equal to 100.
Table 6.6 highlights the views of the three categories of societies Viz; A,S
lbd Ctowards mechanisation. On the basis of the necessity of mechanisation of
~ stages of yarn production, the sample societies expressed their own opinion
!om their working experience. Their views towards stages of mechanisation are
~ked onthe basis of number of societies preferring the stages of mechanisation.
isdear from the table that most important stage to be mechanised in their order
:: importance are husk beating [84%], willowing [51%] and spinning process
1%]. Thus it can be inferred that a large majority of the societies are favouring
~achanisation of the beating process. This is because of the simple reason, that
',:lSk beating process is hard and unhygenic and labourers are not available for
~:lS work. Only old generation workers are prepared to do this work. The
~inion from coir household survey also support the same picture.

273
Even societies, having mechanised spinning facilities, were against
mechanisation in spinning. The major reasons cited against mechanisation of
spinning are ranked in the order of preference and are presented in Table 6.7.
The major factors that go against mechanisation in spinning are:-
1-C Low quality of yam from mechanised spinning [91% of societies]
2-E Low price and increased cost of production[87%]
3-A Labour available for traditional spinning[82%].
The other minor reasons relate financial problems in installing motorised
ratt and indifference of Board of Directors. It was understood that motorised
spinning leads to high cost of production due to increased wastage, high repair
and electricity charges. In addition it results in low sale price to quality difference.
There is no shortage of labourers for traditional spinning.
6.3.2 Approach of coir workers towards mechanisaton of various coirprocess
The effect of mechanisation whether favorable or not affects the coir
workers directly. Therefore, their opinion about mechanisation is more relevant
Ihan anybody else. Table 6.8 portrays the opinion of worker households about
Ih~ issue.
Table 6.8. Response towards mechanisation of thedifferent stages of coirwork
Favour for Stages of partial mechanisationNumber of Favour to Partial demands
Jtegory of Respondents mechanise all mechanisation HusklOCieties [Nos.] process [Nos.] [Nos.] Beating Willowin Spinning
[Nos.]g [Nos.] [Nos.J
A 100 33 62[100J 60[98J 40[65J 1O[16J
B 100 45 53[100] 53[100] 30[57] 5[8]
C 75 20 49[100] 48[98] 26[54] 3[6]
Total 275 98 164[100] 161[98] 105[59] 19[11]Iource: Survey Data
~te: Figures in brackets indicate percentage to column No.4

274
Table 6-8 depicts opinions of the coir worker respondents about
mechanization of coir process. As a whole 98[36%] of the respondents were for
lull mechanization and 164[60 %], for partial mechanization and 13 persons
[4%], against any kind of mechanization.
Among those who favoured partial mechanization 161[98%] respondents
were for mechanization of Husk Beating process and 96[59%] respondents for
mechanization of willowing process. Only 18[11%] persons advocated for
mechanizing spinning process. The general conclusion is that, most of the
respondents were against full mechanization but were favouring mechanization of
nusk beating process. Thus, majority people feel husk beating and willowing
requires mechanization and not the spinning process.
Now it is vital to examine the views of coir workers towards the existing
rode ofwork, their approach towards future of coir work etc.
The approach of coir households towards the various processes of work
and the reasons thereoff are depicted in tables 6.9 and 6.10.
llble 6.9. Response towards favouring to work in all stages of Yarn Manufacture
:ategory of No. ofRespondents Who Reasons for favour [Nos.]favoured to work
Xcieties Respondentsall Stages [Nos.] 1 2 3 4
(ll (2) (3) (4) (5) (6) (7)
A 100 50[100] 45[90] 48[96] 20[40] 2[4]
B 100 35[100] 28[80] 33[94] 20[57] 3[9]
C 75 26[100] 18[71] 25[96] 15[57] 2[8]
Total 275 111[100] 91[82] 106[95] 55[50] 7[6]Me: Survey Data~:. 1. Figures in brackets indicate percentage to column No.3
2. Reasons: 1 denotes Nearness to dwelling place2 denotes Non-availability of alternative employment3 denotes Beating is mechanized4 denotes Getting of reasonable wages
3. Out of the total four options, the respondents marked more one option and hencethesum total of percentages will not be equal to 100
275
Table 6.10 shows that 111 [40 %] favoured to work in all stages of coir
work except husk beating. Among them 106[96 %] preferred coir work due to
non-availability of alternative work and 91[82 %] preferred due to nearness. The
other reasons were not given due response by the majority members. From this it
s inferred that lack of alternative work and proximity to dwelling place are the
most important reasons for opting coir work by the members.
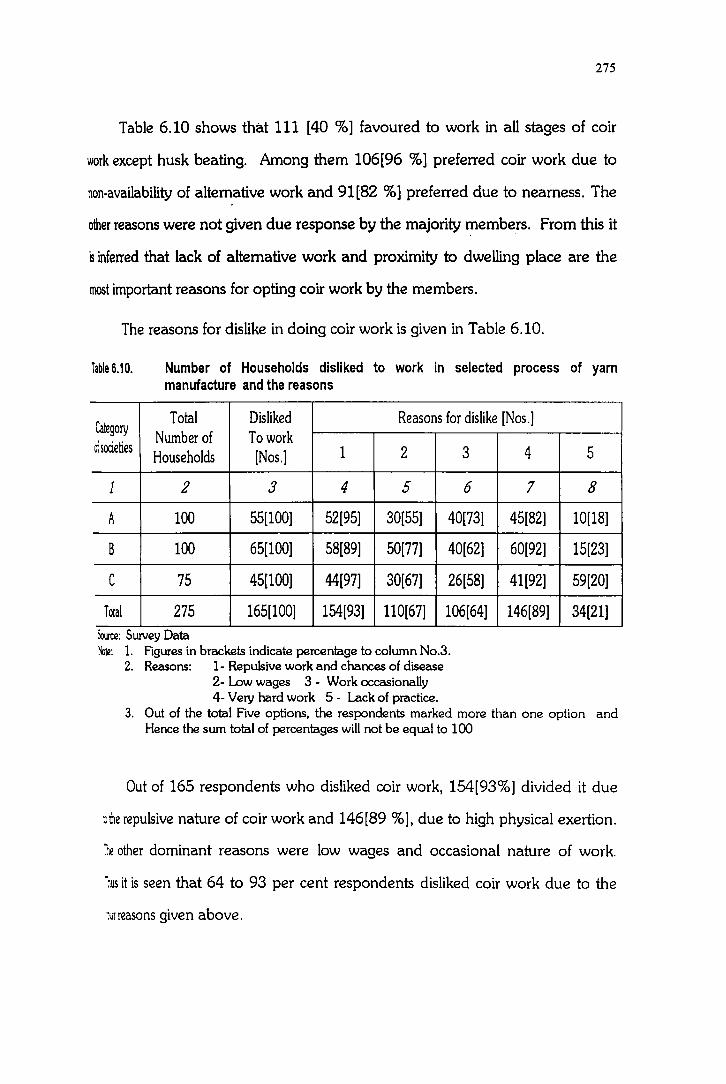
The reasons for dislike in doing coir work is given in Table 6.10.
Table 6.10. Number of Households disliked to work in selected process of yarnmanufacture and the reasons
CategoryTotal Disliked Reasons for dislike [Nos.]
Number of To work01 societies
Households [Nos.J 1 2 3 4 5
1 2 3 4 5 6 7 8
A 100 55[100J 52[95J 30[55J 40[73] 45[82] 10[18]
B 100 65[100] 58[89] 50[77] 40[62] 60[92] 15[23]
C 75 45[100] 44[97] 30[67] 26[58] 41[92] 59[20]
Total 275 165[100] 154[93] 110[67] 106[64] 146[89] 34[21]»Jrce: Survey Data~te: 1. Figures in brackets indicate percentage to column No.3.
2. Reasons: 1- Repulsive work and chances of disease2- Low wages 3 - Work occasionally4- Very hard work 5 - Lack of practice.
3. Out of the total Five options, the respondents marked more than one option andHence the sum total of percentages will not be equal to 100
Out of 165 respondents who disliked coir work, 154[93%] divided it due
'Jme repulsive nature of coir work and 146[89 %], due to high physical exertion.
je other dominant reasons were low wages and occasional nature of work.
"jUS it is seen that 64 to 93 per cent respondents disliked coir work due to the
:ljrreasons given above.

276
From 6.9 and 6.10 tables, it can be understood that, the only attraction
towards work relating to coir is its nearness to dwelling place.
While analysing the of societies and labour towards mechanization it was
seen that both object mechanization in spinning process. However, all are in
lavour of mechanization of husk beating process.
In this context the opinion of coir workers in sending their children to coir
',\Iork is worth noting.
6,4 Opinion of workers in sending their children to coir work
The views of workers in sending their children to coir work under the
existing processof yarn production, is depicted in Tables 6.11 and 6.12
fable 6.11. Response towards sending children for Coir workand reasons
[a~gory Total Not Reasons[Nos.]of Number of Favoured
lOCieties Respondents [Nos.] 1 2 3 4 5
A 100 57[100] 54[95] 53[93] 50[88] 25[44] 20[35]
B 100 70[100] 66[94] 68[97] 60[86] 42[60] 25[36]
C 75 55[100] 44[80] 54[98] 52[95] 39[71] 15[27]
iotal 275 182[100] 164[90] 175[96] 162[89] 106[58] 60[33]Me: Survey Data'lJle: 1. Figures in parentheses indicates percentage to row total
2. Out of the total Five options, the respondents marked more than one option andhence the sum total of percentages will not be equal to 100
3. Reasons-- 1- Low wages 2- Ugly nature and sick 3- Beating is tedious4 - No continues work 5- Low social status

277
Table 6.11, exhibits that, out of the 275 worker respondents 182[66 %]do
not prefer to send their children to coir work. This shows the aversion of new
generation of people to coir work.
6.4.1 The reasons for favoring to send children to coir work
Even though 66 per cent of the workers do not like to send their children
to work the rest has no objection with respect to this. The reasons cited by the rest
in their in sending their children to coir work is depicted in Table 6.12.
Table 6.12. Reasons for favoring to send children to Coir Work
Category ofFavoring children Reasons[Nos.]
for Coir workSocieties
[Nos.] 1 2 3 4
A 25[100] 20[80] 24[96] -- 15[60]
B 26[100] 25[96] 25[96] 1[4] 18[69]
C 18[100] 14[78] 16[91] 13[4] 13[70]
Total 69[100] 59[85] 65[94] 2[3] 46[66]:xJUlCe: Survey Data~te: 1) Figuresin parentheses denote percentage to row total
2) Reasons-l- denotes Nearness to Dwelling place2- .. No other alternative work3 .. Reasonable wages4 .. To support family
3) Out of the total four reasons, the respondents marked more than one reason andhence the sum total of percentages will not be equal to 100.
Table 6.12 shows that 'lack of alternative work' and 'nearness to dwelling
Jiace' are the compelling reasons stated by coir workers in sending their children
Dcoirwork
The reasons for low preference to coir work were the same as given in
ab~ 6.10. Apart from that coir work has only low social status. There is no

278
significant variation among the responses of the three categories of societies.
Hence it can be safely inferred that the new generation is not interested in coir
work and unless mechanisation is resorted to, the societies cannot survive in the
years to come.
6.5 Member Participation Level in Coir Vyavasaya Co-operatives
In the hierarchy of planned economic development, people's participation
in the growth process is an essential condition. No doubt, co-operatives are no
exception to this rule. There also member's participation in the various affairs of
the coir societies is very crucial for their success. This particularly true where Sl7th
01 Board members are ordinary coir workers. So it is desirable to examine the
/xtent of participation of worker members in the important areas of the working
)1 the evCs.
~,5,1 Reasons for taking membership in Coir Societies
Table 6.13 presents information regarding how coir workers took
~£mbership in the coir societies.
'lble6.13. Mode of Taking membership in CoirSocieties
Calegory of Total Mode oftaking membership [Nos.]
~ieties Households A B e 0
A 100[100] 83[83] 6[6] 2[2] 9[9]
B 100[100] 88[88] 4[4] 3[3] 5[5]
C 75[100] 60[80] 4[5] 4[5] 7[10]
Total 275[100] 231[84] 14[5] 9[3] 21[8]
ime: 5wvey Data'tIR: 1] Figures in Parentheses denote percentage to row total
2] Adenotes Voluntary, B denotes Persuasion of friendsC denotes Persuasion of union leaders, D denotes Persuasion by Board Members
279
Table 6.13 shows that 84 per cent of the respondents took membership
voluntarily and eight per cent because of persuasion from Board of Directors.
There was no significant variation noticed in this aspect in the three categories of
societies.
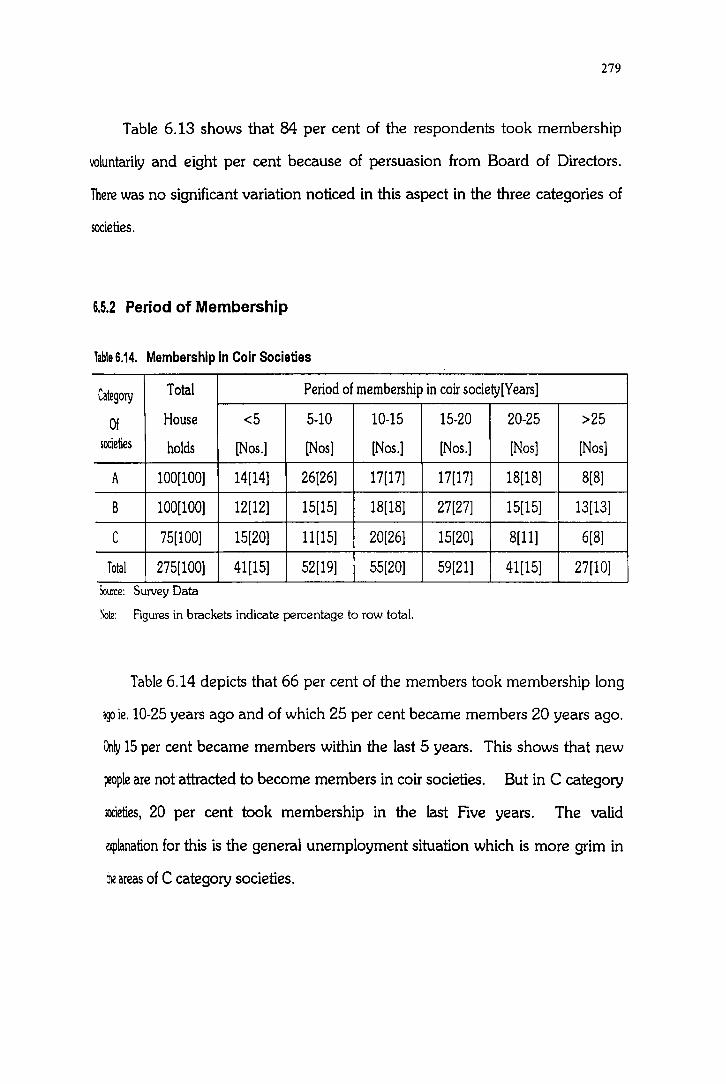
6.5.2 Period of Membership
Table 6.14. Membership inCoirSocieties
Category Total Period of membership in coir society[Years]
Of House <5 5-10 10-15 15-20 20-25 >25
societies holds [Nos.] [Nos] [Nos.] [Nos.] [Nos] [Nos]
A 100[100] 14[14] 26[26] 17[17] 17[17] 18[18] 8[8]
B 100[100] 12[12] 15[15] 18[18] 27[27] 15[15] 13[13]
C 75[100] 15[20] 11[15] 20[26] 15[20] 8[11] 6[8]
Total 275[100] 41[15] 52[19] 55[20] 59[21] 41[15] 27[10]Source: Survey Data
~te: Figures in brackets indicate percentage to row total.
Table 6.14 depicts that 66 per cent of the members took membership long
~ ie. 10-25 years ago and of which 25 per cent became members 20 years ago.
On~ 15 per cent became members within the last 5 years. This shows that new
~ople are not attracted to become members in coir societies. But in C category
iOCieties, 20 per cent took membership in the last Five years. The valid
IXplanation for this is the general unemployment situation which is more grim in
:ne areas ofC category societies.

280
6.5.3 Participation in Democratic Process
Participation of members in the democratic process of the society is a vital
requirement. General body is the supreme authority and an important forum in
which members can express their views freely and frankly with respect to
improving the society's business. While electing the managing committee/Board
of Directors, they should be cautious to elect persons who are honest and capable
of managing the business of the society in an efficient manner. Are they really
doing this? To know this one must have some idea regarding the extent of the
participation of worker members in the democratic process of evCs.
Participation in elected body
Table 6.15. Official position held bycoir workers in coirsocieties
Official Positions
Number ofNumber of
Category of Persons are Member ofRespondents Board
Societies Held official President other[Nos.] [Nos.] Members
Committeespositions [Nos.][Nos.]
A 100 16[100] 2[13] 12[75] 2[13]
B 100 16[100] 2[13] 12[75] 2[12]
C 75 16[100] 2[14] 12[72] 2[14]
Total 275 48[100] 6[13] 36[74] 6[13]»JlCe: SUIVey Data
~te: Figures in brackets denotes percentage to row total.
It is seen from the Table 6.15 shows that only 18 per cent of the
~cspondents took active interest and became office bearers of societies. Of this,
:Jper cent became presidents and 74 per cent, members of Board of Directors.
norder toensure representation to coir workers in the Board, the Govt. made it
281
compulsory that five out of the seven Board Members should be coir workers.
The study reveals that those who become members of the Board continues to be
the Directors as new persons are reluctant to get elected to the Board or they are
side tracked by the existing directors.
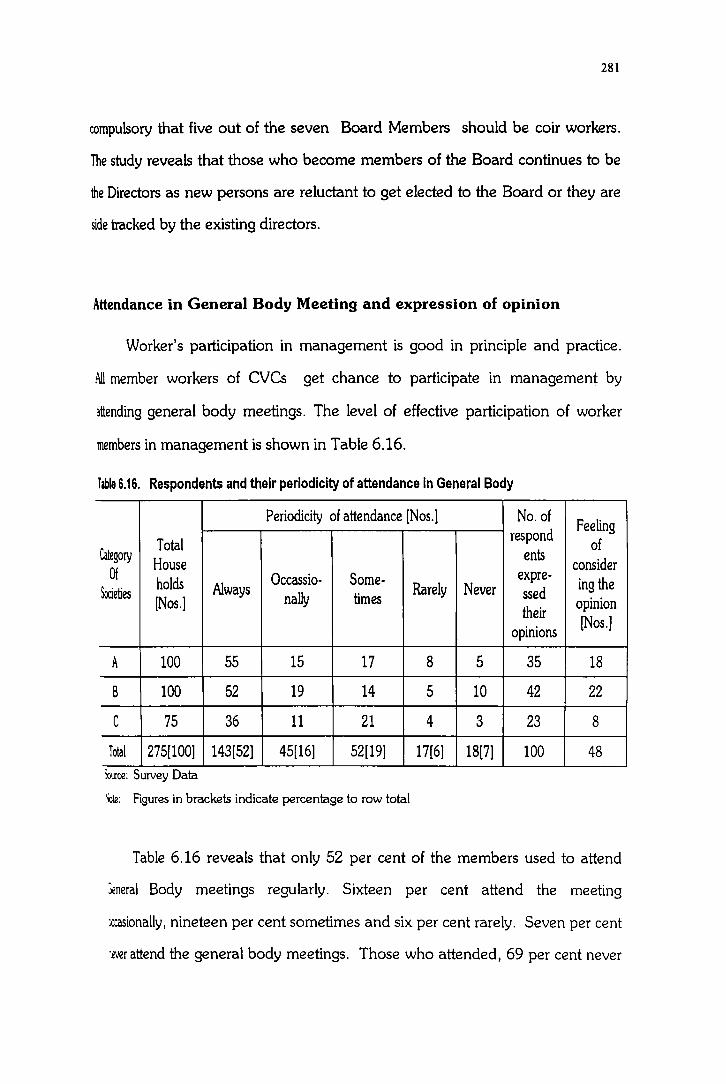
Attendance in General Body Meeting and expression of opinion
Worker's participation in management is good in principle and practice.
All member workers of eves get chance to participate in management by
attending general body meetings. The level of effective participation of worker
members in management is shown in Table 6.16.
Table 6.16. Respondents and their periodicity ofattendance in General Body
Periodicity of attendance [Nos.) No. ofFeeling
Totalrespond
ofCategory
Houseents
considerOf
holds Occassio- Some- expre-ing the
~eties Always Rarely Never ssed[Nos.) nally times opiniontheir
opinions[Nos.)
A 100 55 15 17 8 5 35 18
B 100 52 19 14 5 10 42 22
C 75 36 11 21 4 3 23 8
Total 275[100) 143[52) 45[16) 52[19) 17[6] 18[7) 100 48:.Jurce: Survey Data
~te: Figures in brackets indicate percentage to row total
Table 6.16 reveals that only 52 per cent of the members used to attend
Jeneral Body meetings regularly. Sixteen per cent attend the meeting
:crasionally, nineteen per cent sometimes and six per cent rarely. Seven per cent
".ever attend the general body meetings. Those who attended, 69 per cent never

282
expressed any opinion. Forty-eight per cent of those who expressed opinions feel
that their opinions were not at all considered in the meeting. This shows that
only 17 per cent of the members opinion were considered. This reflects the
pathetic situation with respect of participation of coir workers in the policy making
body of coir co-operatives.
6.5.4 Participation level of worker members in the societies' affairs
Consultation during the pre-planning period
Participation of member workers is of considerable imporlance during the
pre-planning period, as the future working of the society is based upon the
decisions taken during this period. The extent of member workers participation is
depicted in Table 6.31.a.
Table 6.17.a. Consultation during thepre-planning period
Category ofSocieties Total respondents[No.] Respondents participation[No]
A 100 17[17]
B 100 12[12]
C 75 11[14]
TOTAL 275[100] 40[14]Source: Survey Data
~ote: Figures in brackets indicate percentage to row total
Table 6.17.a highlights the fact that only 14 per cent of the member
~orkers participated during the pre-planning discussions. Among the three
:ategory societies, the participation rate was a bit higher in A category.

283
Supervision during implementation
To ensure implementation of programmes as planned, participation of
members are highly essential, particularly in societies where supervision of
experienced worker members is essential. The level of participation in this aspect
sshown in Table 6.17-b.
Table 6.17-b. Supervision during implementation
Category of Societies Total Respondents Respondents participated
A 100 28[28]
B 100 25[25]
C 75 19[26]
TOTAL 275 72[26]Source: Survey Data
Note: Figures in Brackets indicate percentage to row total
Table 6.17.b shows that the level of supervision very low, viz; around 25
per cent. Not much difference in the level of supervision is noted among the three
categories of societies.
Receipts of benefits
The level of participation of members in receiving benefits from eves is
liven in Table 6.17.c
llble6.17.c. Receipts of benefits
Category of societies Total respondents[No] Respondents participated[No]
A 100 80[80]
B 100 84[84]
C 75 70[93]
TOTAL 275 229[84]i:Jte: Survey data
0.1: Figures in brackets indicate percentage to row total

284
Table 6.17.c reveals that members are eager to exploit the benefits from
the societies rather than contributing their might for the benefit of the societies.
This is evident from the higher participation of members [80 to 93%] in receiving
benefits from societies.
Sharing of cost
Sharing of cost by worker members is good for the long run working of
eVC5. Table 6.17.d depicts the extent to which members are ready to share the
cost.
Table 6.17.d. Sharing ofcost
Category of societies Total respondents [No] Respondents participated[No]
A 100 2[2]
B 100 8[8]
C 75 3[4]
TOTAL 275[100] 13[5]Source: Survey data
Note: Figures in brackets indicate percentage to row total
Table 6.17- d. shows that the members are not prepared to share the cost.
. h~ natural as the workers are getting only very low wages.
Involvement in evaluation
Involvement of workers in the evaluation process of the working of eves5important for ensuring efficiency in operation. Table 6.31.e indicates how far
th~ purpose is served by the worker members.
285
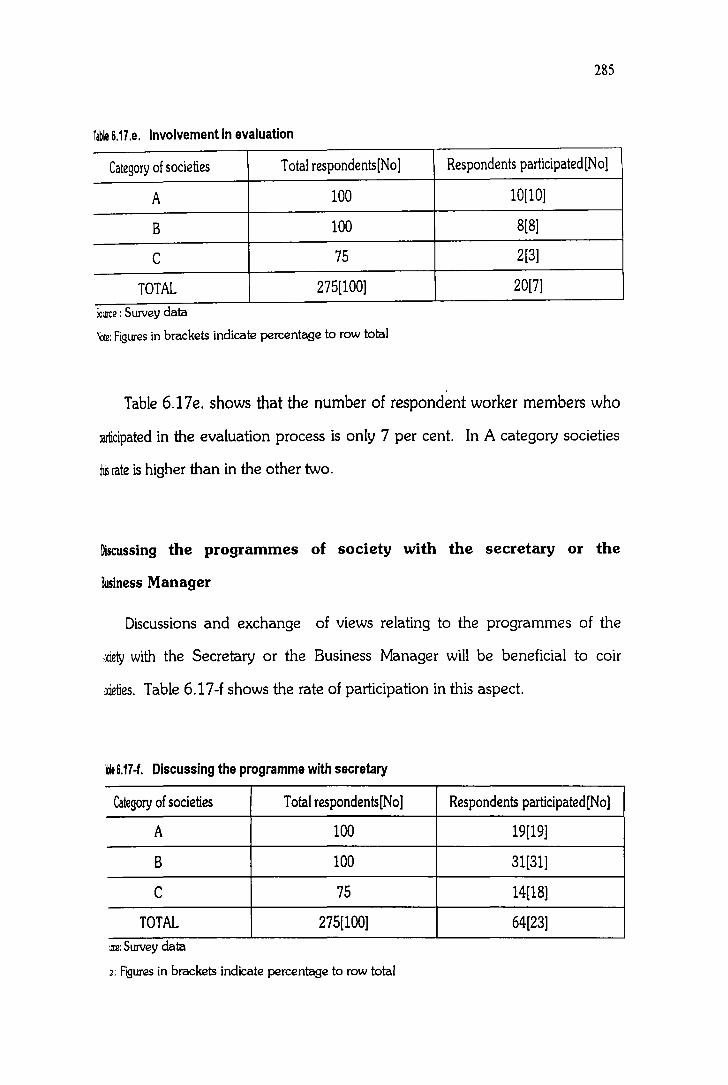
lable 6.17.e. Involvement in evaluation
Category of societies Total respondents[No) Respondents participated [N 0)
A 100 10[10)
B 100 8[8)
C 75 2[3)
TOTAL 275[100) 20[7)
):JUICe: Surveydata
~te: Figures in brackets indicate percentage to row total
Table 6.17e. shows that the number of respondent worker members who
:articipated in the evaluation process is only 7 per cent. In A category societies
JUs rate is higher than in the other two.
Discussing the programmes of society with the secretary or the
Business Manager
Discussions and exchange of views relating to the programmes of the
,:ciety with the Secretary or the Business Manager will be beneficial to coir
~ieties. Table 6.17-f shows the rate of participation in this aspect.
'&6.17·1. Discussing theprogramme withsecretary
Category of societies Total respondents[No] Respondents participated[No]
A 100 19(19)
B 100 31(31)
C 75 14(18)
TOTAL 275[100) 64(23)
:Jte: Survey data
2; Figures in brackets indicate percentage to row total

286
Table 6.17.f, shows that only a quarter of the members discussed the
programmes with the secretary or the Business Manager. Among the three
categories, of societies members of B category participated more in such
discussions.
Visiting the office of the organisation
Visiting the office of the society by its members is desirable for healthy
relationship and involvement. Table 6.17-g. depicts the rate of visits of worker
members in the offices of the societies.
lable 6.17. g. Visiting the office ofthe organisation
Categories ofsocieties Total respondents[No] Respondents participated[No]
A 100 88[88]
B 100 90[90]
C 75 68[90]
TOTAL 275[100] 246[89]Iource: 5U1Vey data
Note: Figures in brackets indicate percentage to row total
It is interesting to note [Table 6.17- g] that, the members visit the offices of
~e societies quite frequently. Eighty-nine per cent of the members visit the office
lequently. There is no significant difference in this in the case of the three
:ategories of societies. It is learnt that members frequently visit to the office for
:raking enquiries regarding release of their wages and prospects of work .in the
~iety in the ensuing days.
~aking suggestions with respect to programmes
The rate of participation of members with respect making suggestions
19arding the programmes is depicted in Table 6.17-h.
287
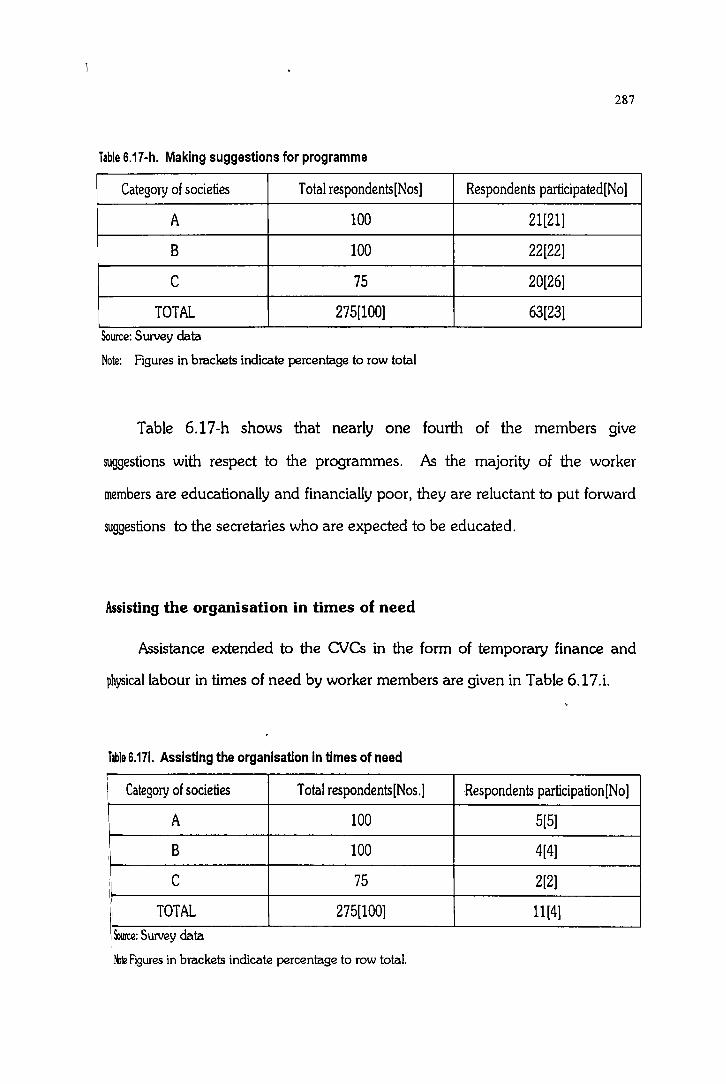
Table 6.17-h. Making suggestions for programme
Category of societies Total respondents[Nos) Respondents participated[No)
A 100 21[21)
B 100 22[22)
C 75 20[26)
TOTAL 275[100) 63[23)Source: Survey clata
Note: Figures in brackets indicate percentage to row total
Table 6.17-h shows that nearly one fourth of the members give
suggestions with respect to the programmes. As the majority of the worker
members are educationally and financially poor, they are reluctant to put forward
suggestions to the secretaries who are expected to be educated.
Assisting the organisation in times of need
Assistance extended to the cves in the form of temporary finance and
physical labour in times of need by worker members are given in Table 6.17.i.
Table 6.17i. Assisting theorganisation in timesof need
1\ Category of societies Total respondents[Nos.) Respondents participation[No)
A 100 5[5)
IB 100 4[4)
i C 75 2[2)
TOTAL 275[100) 11[4)
fxlurce: Survey data
t1lte Figures in brackets indicate percentage to row total.

288
Table 6.17.i shows that only a very small percentage of the member
workers[4] is ready to extend their financial or manual help in case the societies
need such help.
Briefing and propagating programmes to others
For getting popularity about the working of eves and their products
among the public briefing and propagating programmes are desirable.
Participation of worker members in such activities is depicted in Table 6.17-j.
lable 6.17-j. Briefing- propagating - programmes to others
Category of societies Total respondents[Nos.]Respondents
participation[Nos.]
A 100 2[2]
B 100 4[4]
C 75 2[2]
TOTAL 275[100] 6[2]Iource: Survey data
~te: Figures in Brackets indicate percentage to row total.
Table 6.17-j clearly shows that of worker members are least interested in
~opagating the eve's programmes. From e category societies no worker
Q'£mber is involved in such activity. This reveals that the members are either
::maware of their own society's programmes or have a passive attitude towards
li'im.
Il5.5 Awareness about Training Programmes offered by Coir Societies
and worker member's participation
Coir Board offered training programmes to coir workers to impart
mwledge about technological improvement. Table 6.18 gives information
289
regarding awareness about training programme and participation of coir workers
III such programmes.
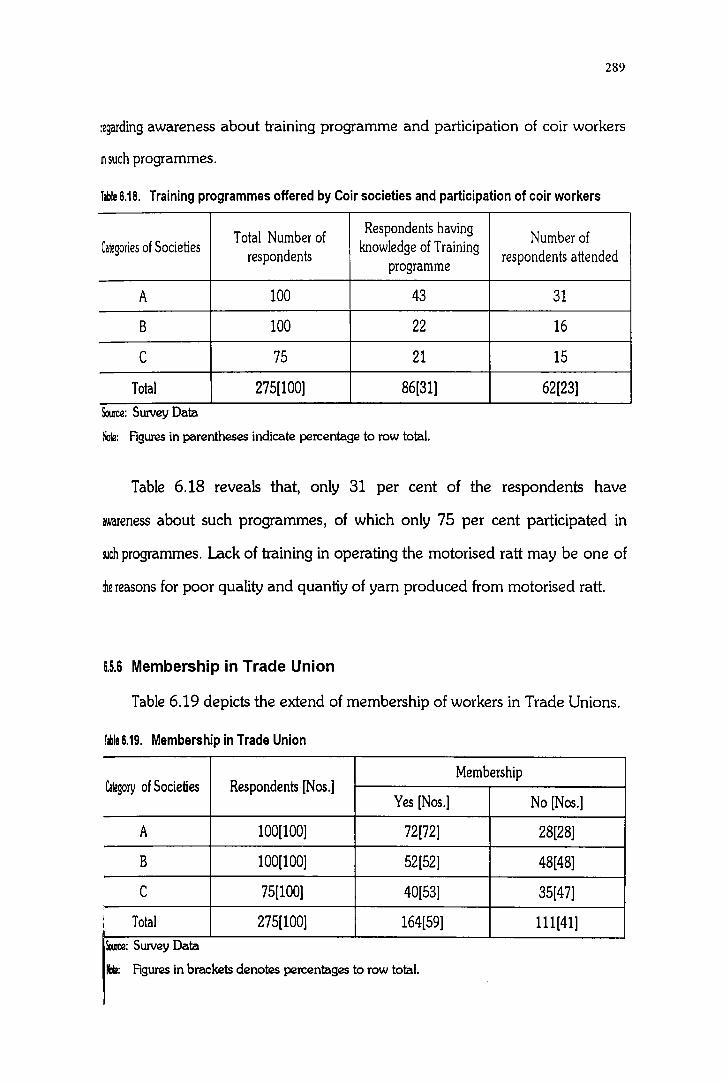
Table 6.18. Training programmes offered by Coir societies and participation of coir workers
Total Number ofRespondents having
Number ofCategories of Societies respondents
knowledge of Trainingrespondents attendedprogramme
A 100 43 31
B 100 22 16
C 75 21 15
Total 275[100] 86[31] 62[23]Source: Survey Data
Note: Rgures in parentheses indicate percentage to row total.
Table 6.18 reveals that, only 31 per cent of the respondents have
awareness about such programmes, of which only 75 per cent participated in
lUch programmes. Lack of training in operating the motorised ratt may be one of
the reasons for poor quality and quantiy of yam produced from motorised ratio
6.5.6 Membership in Trade Union
Table 6.19 depicts the extend of membership of workers in Trade Unions.
lable 6.19. Membership in Trade Union
ta~gory of Societies Respondents [Nos.]Membership
Yes [Nos.] No [Nos.]
A 100[100] 72[72] 28[28]
B 100[100] 52[52] 48[48]
C 75[100] 40[53] 35[47],I Total 275[100] 164[59] 111[41]I
Me: Survey Data
It&: Rgures in brackets denotes percentages to row total.

290
Table 6.19 reveals that on an average 59 per cent of the respondents are
members of any trade unions. Even then any change in this sector regarding
wage rate, mechanization etc. are affected only with the approval of Trade
Unions. In A category societies Trade Union membership is as high as 72 per
cent.
6.5.7 Membership in other Coir Societies
Certain members used to take membership in more than one coir
societies. The dual membership is not a healthy practice. It may vitiate the
interest of existing members.
lable 6.20. Respondent's membership in other Coir Co-operatives -Reasons
Category of ReasonsRespondents
societies 1[Nos] 2[Nos] 3[Nos.]J
A 5 3 2 -
B 4 2 1 1
C 14 5 3 6iI Total 23[100] 10[43] 6[26] 7[31]
louIce: Survey Data
tbte: - Reasons-I. Denotes, To avail raw husk 2 denotes To sell produce, 3 denotes, ToIVote in election
Table 6.20 depicts that out of the 275 respondents 23[8%] have dual
IOOmbership in coir societies. Of the 23 dual membership holders, 43 per cent
ook membership for availing raw husk and 26 per cent, for selling their produce
lid 31 per cent for getting voting right in elections~ The. first two reasons cited by

291
members show that they take dual memberhsips for ensuring continuity of
employment. The third reason was rather political and not in the best interest of
societies.
6.5.8 Opinion of worker members regarding Managerial efficiency ofCoir Societies
Managerial efficiency of societies are analysed under seven heads. They
are:-
Purchase of raw materials
fable 6.21-a. Opinion of members regarding the efficiency of societies in purchasing rawhusk [ Raw material]
Total Efficiency regarding purchase of Raw materials(ategory of
Respondents Very Good Good Satisfactory Very BadSocieties Bad [Nos.][Nos.] [Nos.] [Nos.] [Nos.] [Nos.]
A 100[100] -- 43[43] 50[50] 6[6] 1[1]
B 100[100] 1[1] 52[52] 40[40] 6[6] 1[1]
C 75[100],
32[43] 38[50] 5[7]-- --
127[46] 128[47] 17[6]2[1]
Total 275[100] 1[--]
Me: SurveyData
~te· Figures in brackets denote percentage to row total
Table 6.21-a shows the opinion of member workers regarding the
Ifficiency of management in processing raw husk. Only one member in 'B'
:alegory societies had 'very good' opinion in this regard. Forty-six per cent are
-ave 'good' and 47 per cent have 'satisfactory' opinion regarding purchase of
'.USk. Purchasing at the appropriate time and retling are important aspects in
:rofitable or efficient working of coir societies. But apathy of management

292
towards this regard is one of the reasons for the weak performance of majority of
the societies. Scarcity of working capital, lack of professional skill in decision
making etc. are also factors affecting the ability of management in purchasing.
Marketing efficiency of Coir Societies
Table 6.21-b. Opinion about Marketing efficiency of Coir Societies
Opinion aboutMarketing efficiencyCategory of
Respondents Very Good Good Bad Very BadSocieties
[Nos.] [Nos.] [Nos.] [Nos.]
I 1[1]I A 100[100] 2[2] 78[78] 19[19]II,
B 100[100] 2[2] 87[87] 10[10] 1[1]I C 75[100] 58[77] 14[19] 3[4]--
Total 275[100] 4[1] 223[81] 43[16] 5[2]
Source: Survey Data
Note: Figures in brackets indicate percentages to corresponding row total.
Table 6.21-b depicts that only one per cent of the respondents had 'very
good' opinion while 16 per cent had negative opinion with respect to about the
marketing efficiency of the coir societies. It is mandatory that for every society to
sell their output to COIRFED. But some societies as already been noted sell their
output in the open market for the sake of liquidity. This may be one of the
reasons why a substantial number of respondents expressed 'Bad' opinion about
management with respect to marketing efficiency. Moreover, the accumulated
stock in the societies itself gives an impression of poor marketing efficiency.
293
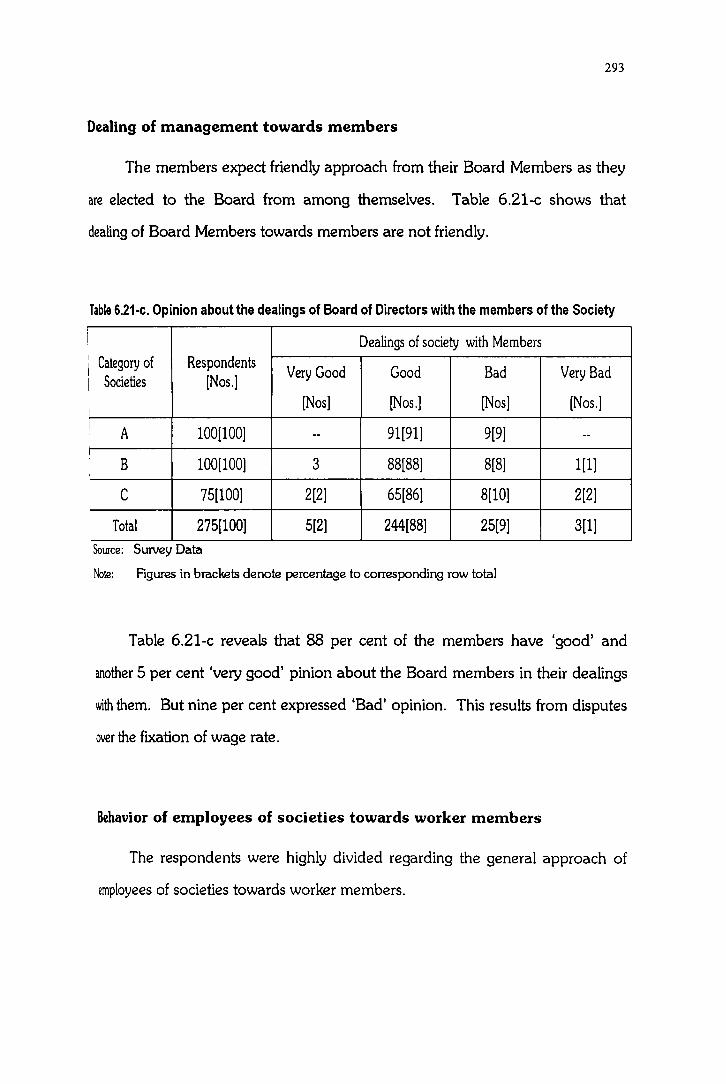
Dealing of management towards members
The members expect friendly approach from their Board Members as they
are elected to the Board from among themselves. Table 6.21-c shows that
dealing of Board Members towards members are not friendly.
Table 6.21-c. Opinion about thedealings of Board of Directors withthe members of theSociety
i Dealings of society with MembersI Category of RespondentsI Very Good Good Bad Very BadI Societies [Nos.]I [Nos] [Nos.] [Nos] [Nos.]iI A 100[100] 91[91] 9[9]-- --I
B 100[100] 3 88[88] 8[8] 1[1],
C 75[100] 2[2] 65[86] 8[10] 2[2]
Total 275[100] 5[2] 244[88] 25[9] 3[1]
Source: Survey Data
Note: Figures in brackets denote percentage to corresponding row total
Table 6.21-c reveals that 88 per cent of the members have 'good' and
another 5 per cent 'very good' pinion about the Board members in their dealings
with them. But nine per cent expressed 'Bad' opinion. This results from disputes
over the fixation of wage rate.
Behavior of employees of societies towards worker members
The respondents were highly divided regarding the general approach of
employees of societies towards worker members.

294
Table 6.21-d. Behavior of employees of CoirSocieties towardsmembers
BehaviorCategory of Respondents
Very Good Good Satisfactory Bad Very BadSocieties [Nos.][Nos.] [Nos.] [Nos.] [Nos.] [Nos.]
A 100[100] 1[1] 36[36] 62[62] 1[1] --
B 100[100] 7[7] 43[43] 42[42] 8[8] --
C 75[100] 3[4] 26[34] 44[59] -- 2[3]
Total 275[100] 11[4] 105[38] 148[54] 9[3] 2[1]
Source: Survey Data
Note: Figures in brackets indicate percentage to corresponding row total.
Table 6.21-d depicts that only 4 per cent of the members have 'very good'
impression regarding the behaviour of employees towards them. Thirty-eight per
cent expressed 'good' opinion and 54 per cent 'satisfactory' opinion. Only one
per cent were having 'very bad' opinion in this regard.
It was observed during the survey that coir workers are a highly dis
satisfied lot. There are many reasons for this. Unhygienic environment, low wage
rate, uncertainly regarding payment of wages and stability of work are major
among them. The employees are also under severe stress due to low salary and
the uncertainty about future. In most of the societies, the secretaries are ladies
and they have to answer all unpleasant questions raised by workers. All these
make smooth relationship among employees and worker members difficult.
295
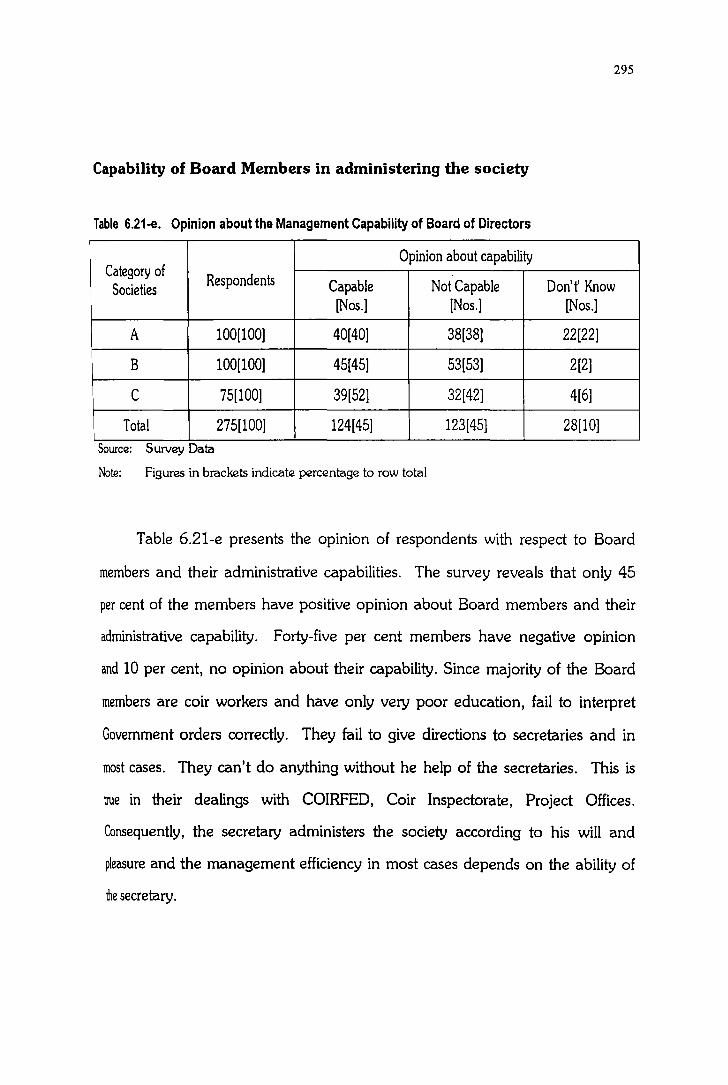
Capability of Board Members in administering the society
Table 6.21-e. Opinion about theManagement Capability of Board of Directors
Opinion about capabilityCategory of
Respondents Capable Not Capable Don't' KnowSocieties[Nos.] [Nos.] [Nos.]
A 100[100] 40[40] 38[38] 22[22]
B 100[100] 45[45] 53[53] 2[2]
C 75[100] 39[52] 32[42] 4[6]
Total 275[100] 124[45] 123[45] 28[10]Source: Survey Data
Note: Figures in brackets indicate percentage to row total
Table 6.21-e presents the opinion of respondents with respect to Board
members and their administrative capabilities. The survey reveals that only 45
per cent of the members have positive opinion about Board members and their
administrative capability. Forty-five per cent members have negative opinion
and 10 per cent, no opinion about their capability. Since majority of the Board
members are coir workers and have only very poor education, fail to interpret
Government orders correctly. They fail to give directions to secretaries and in
most cases. They can't do anything without he help of the secretaries. This is
true in their dealings with COIRFED, Coir Inspectorate, Project Offices.
Consequently, the secretary administers the society according to his will and
pleasure and the management efficiency in most cases depends on the ability of
the secretary.

296
Incorporation of Co-operative principles in Coir Societies
Table 6.21-f. Observance of co-operative principles in CoirSocieties
Observance ofCo-operative principlesCategory of
Total [Nos.]Societies Don't' Know
Yes [Nos.] No [No.][Nos.]
A 100 67 11 22I
B 100 60 20 20,
I
14C 75 50 11
Total 275[100] 177[65] 42[15] 56[20]Source: Survey Data
Note- Figures in brackets shows the percentage to row total
Table 6.21-f displays that 65 per cent of the respondents opined that, coir
societies are running in accordance with co-operative principles. But 15 per cent
of the respondents are not agree with this claim. Twenty per cent of the members
did not express any opinion on this aspect. This shows that they are not aware of
co-operative principles. Lack of awareness about co-operative principles is more
in the case of A category societies. Membership in coir societies without the
knowledge of co-operative principles is against the spirit of co-operation.
Comparative advantage of Co-operatives over private Sector
The respondents gave more weightage to coir co-operatives in comparison
with the operation of private units. The factors responsible for this are displayed
in Table 6.21-g.

297
Table 6.21-g. Factors patronizing the co-operative sector by the respondents
Category ofTotal Factors patronizing co-operatives and number ofrespondents
Respondentssocieties
[Nos.] a b c d e
A 100 74 76 34 80 65
B 100 89 84 29 97 67
C 75 55 70 17 72 60
Total 275[100] 218[79] 230[84] 80[29] 249[91] 192[70]
Source: Survey Data
Note: 1] Figures in brackets denotes percentage to corresponding row total
2] Factors of Patronage- a = Conditions of work b = Income c = Continuity ofemployment d = Welfare measures e = Approach of Management
Table 6.21 g reveals that, 91 per cent of the respondents favoured eo-
operatives welfare measures, 84per cent on high income due to higher rate of
wages, and 79 per cent on working conditions. Seventy-one per cent[100-29]
have favoured the private coir sector on continuity of employment offered by
them.
Survey responses indicate that continuity of employment is a major factor
not only to hold existing members in the coir co-operative sector but also to
attract more coir workers into the co-operative fold.
6.6 Prospectsof Coir Industry
The analysis of the diverse problems faced by the coir industry and the
coir co-operatives shows that some of the problems that cause crisis in the evesare self -created ones. Wrong policies of Government also adds to their miseries.

298
These problems can be solved out through concerted and sincere attempts on the
part of authorities. But, even in the midst of a cloudy atmosphere, there still exist
asilver line that gives hope to the industry.
The factors that give hopes to the coir industry are assessed in two heads,
AI Prospects in the overseas market and
Bl Prospects in the domestic market.
The prospects of coir in both the markets depend upon popularising the
inherent properties of coir products.
Properties of coir products
Coir falls under the category of industrial hard fibre. other hard fibres
competing with coir in its various end-use outlets are Sisal, Abaca, Henequen and
Hemp. The unique characteristics of coir hold a position of its own among the
industrial hard fibres. It has qualities which few other hard fibres possess which
gave it international acceptance as an excellent raw material for manufacture of
roor furnishing articles. Coir is rot proof and water resistant. It is resistant to
dampness and deadens sound. It can impart coolness in torrid heat and retains
warmth in severe winter. Its durability under moisture and humid conditions is
proverbial. Coir products are also resistant to microbiological attack. Properties
01 coir products, in relation to synthetics are hundred per cent natural, bio-
degradable, non-allergic, flame retardant and environment friendly. Publicity for
coir projecting these unique features would arouse the interest of overseas
consumers in using it as floor furnishing materials. Other products such as geo-
textiles, rubberised coir, coir ply, coir pith etc. will also be in immense demand.
Specific advantages of various new coir products mentioned are given below.
Coir Geo-Textiles
Water run off creates soil erosion and that is a major problem in plantation
areas, mountain slopes and river embankments. Nets made of coir can not only
stop soil erosion but can also add organic matter to the soil which increase the
growth ofvegetables by retaining soil moisture. The properties of coir geo-textiles
are the following:-
1. High tensil strength of coir fibre protects steep surfaces from heavy flows
and debris movement.
~, Five to 10 years of longevity that it provides allows for full plant and soil
establishment, and land stabilisation.
J. Totally biodegradable, coir fibre functions as a soil amendment.
4, A.s water absorbent fibre it acts as a mulch on the surface and as a wick in
the soil mantle.
5, Coir re-vegetation measures encourage the restoration of terrestrial and
aquatic riparian habitat. 3 Coir geo-textiles are cheaper than other geo
textiles available and presently used in india viz. nylone, jute etc.
Room surface cooling
Homes, offices and factories can be effectively cooled by using coir
mattings. It can bring down indoor air surface temperature up to 10 degrees pari
passu with non-air-conditioned buildings. It can also help to reduce the power

300
consumption of air-conditioners/desert coolers substantially and it is economical
to install and easy to operate with the help of one pump set and a timer.
Coir Pith
Coir pith is a waste material accumulated during the course of extraction
of fibre. It can be converted into manure in 30 days by the applying of 'pith
plus', a Fungal Spawn. Development of coir pith into a horticulture growing
medium extraction of organic matter like lignosulphonacts, resorcinol, catechol,
and tannin from coir pith also applied for industrial use. It is further used as
building material, low cost packing material and to maintain the optimum and
electrical conductivity are also from part of the research efforts.4
Coirply [Poly Coir]
Development of coir composites based on rubber/plastic for finding new
use areas for coir and coir products are continueing. Research undertaken on
product development has revealed that coir needled felt impregnated with
phenolformaldehyde resin yielded in production of 'Poly Coir'. The fibre content
in poly coir is in the range of 70-85%. Poly coir can be moulded into various
shapes, sizes to suit a variety of applications in building construction, paneling
and partition, fabrication of office/house furniture,and boats. There are a few
lroperties of polycoir which make it superior to wood/plywood products. The
ow water absorption and swelling also make polycoir superior to standard ply
lood/fibre board products. This is a potential substitute for wood based Ught
.eight Bricks. Ught-weight bricks are low density building bricks generally used
Jf multi-storeyed buildings with structural frame work for reducing the load-

301
bearing members and also for thermal and acoustic applications. The technology
is developed at Regional Research Laboratory, Thiruvananthapuram, utilising
, coir and coconut pith. The manufacture of light-weight bricks closely follows the
process of wire cut bricks with a slight change in the schedule of drying and
I firing. 5
i 6.6.1 Prospects in Overseas marketI
I Coir fibre, yarn and other coir products are used in various products in
several countries. Coir fibre and yarn are used to manufacture filters for olive oil
presses in countries like Italy, Greece etc. Coir fibre also finds use for a variety of
air filtering applications especially in evaporative coolers and air breathers for
,small engines. In selected markets of Europe like West Germany, coir fibre is
used as an insulation medium in buildings. In view of the high moisture retention
icapacity coir netting filled with coir fibre is imported by countries in West Asiani
\region for use in gardens and nurseries. Coir yarn spun from coir fibre is used for, ,
:1avariety of agricultural purposes apart from its main end-use in the manufactureI
:of doormats, mattings etc. In the recent past there has been large scale import of
coiryarn into the U.K and the U.S.A for Hop cultivation. Coir yarn is used here
asupport string to the Hop plant to grow. Special variety of yarn exported for
!his end use application is known as Hop Yam. Creepers finds it easy to climb on
itheir growth is supported by a coir pole.
Since coir products have certain inherent properties, the export market for
mir and coir products is bright. Only thing is that there must be a sincere attempt
blap it. Table 6.22 - shows over the last five years there has been a substantial
wth in export of coir and coir products from India.

302
Table 6.22. Exportof coir and coir products from India in Quantity and Value
Year Quantity[Tonnes] Value[Rs. Crores] Growth rate [%]
1995-96 48276 206.84 20
1996-97 46368 212.58 3
1997-98 49850 238.93 12
1998-99 55490 292.19 22I 1999-00 61030 303.05 4Source: Coir Board
Recently, in the Indian export arena, a major change has taken place with
respect to the Minimum Export Price [MEP] policy. Under the new policy,
embellishment has been taken out of the purview of MEP. The growing
awareness in favour of environment friendly, bio-degradable and non-polluting
products provides a reasonable opportunity and potential for eoir products with
export market. Out of the total imported quantity of geo-textiles in the world
market 90 per cent consists of synthetic products. The use of coir mesh is still not
known to many end users. Therefore, if proper awareness is created about the
properties of coir geo-textiles, sufficient potential can be created. It is also
~eported that, there is abundant market opportunities for coir and coir products in
te Latin American countries and CIS countries. U.S.A is one of the major
narkets for coir and coir products. The zero duty policy for of natural products in
JSA is a major advantage for coir and coir products. The European Union
:Ountries also have given preferential treatment in the case of import tariff of
Dir and eoir products and this has paved the way for development of market for,Dir and eoir products in the European Union countries." The consulting and
':search for Environment Management [CREM] in Amsterdam has assigned a
::oject to the Government of Netherlands for investigating the desirability and
:asibility of introducing coir fibre geo-textiles and thermal insulation materials in
"1 building sectors in the Netherlands. The report concluded that coir fibre
':ducts offer the Dutch building sector a unique chance to bring about a
303
synergic effect. Introduction of coir fibre geo-textile and thermal insulation
materials in building sector in the Netherlands will open up new opportunities to
the coir industry of India not only in Netherlands but also in other parts of
Europe. There exists vast potential for using coir as a geo-textiles in U.S.A.,
Sweden and Korea in areas such as erosion control, application in river
embankments, highway construction, lakes, canals, roadside slopes, plant tree
protection, re-vegetation of batters, weed control etc. In Australia and Switzerland
coir has been used with positive results on Ski slopes for high altitude erosion
control.
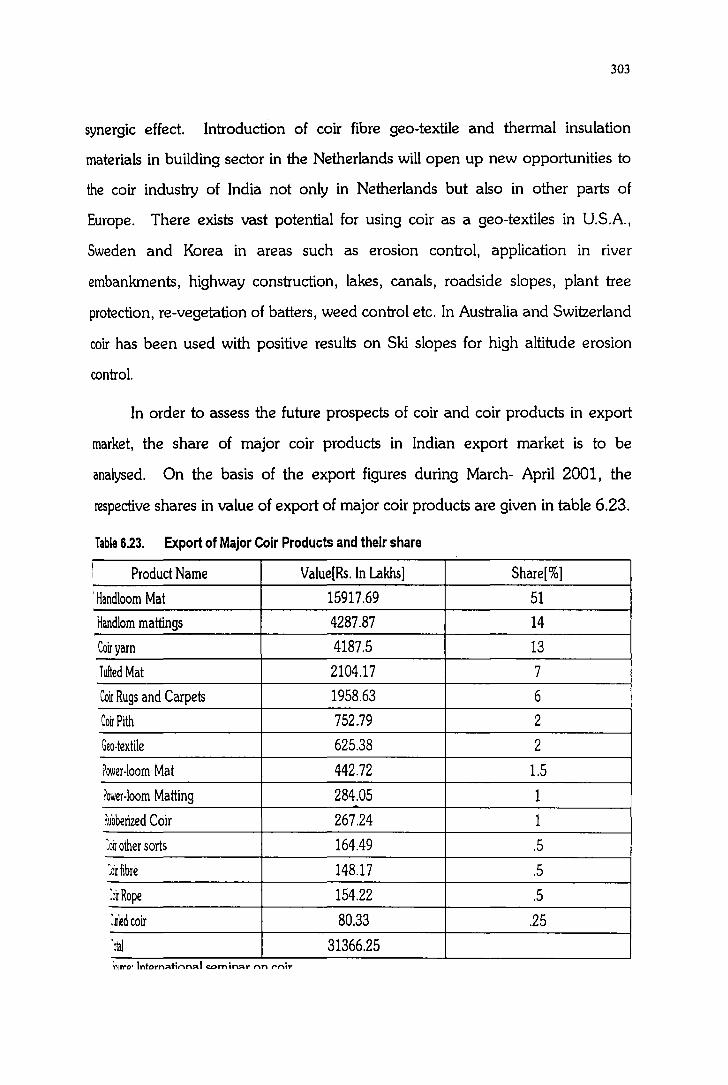
In order to assess the future prospects of coir and coir products in export
market, the share of major coir products in Indian export market is to be
analysed. On the basis of the export figures during March- April 2001, the
respective shares in value of export of major coir products are given in table 6.23.
Table 6.23. Export of Major Coir Products and theirshare
I Product Name Value[Rs. In Lakhs] Share[%]I
'Handloom Mat 15917.69 51
Handlom mattings 4287.87 14
Coir yarn 4187.5 13
Tufted Mat 2104.17 7
Coir Rugs and Carpets 1958.63 6
CoirPith 752.79 2
Geo-textile 625.38 2
rower-loom Mat 442.72 1.5
rower·loom Matting 284.05 1
~ubberized Coir 267.24 1
~oir other sorts 164.49 .5
~irfibre 148.17 .5
~irRope 154.22 .5
:lIlled coir 80.33 .25')laJ 31366.25~Ift"O' Intorn;\t1nn;\l t::D",i~rnn t"'nir

304
Handloom Mats
They are the most demanded item in export and account for nearly half of
the total export earnings. Handloom mats are exported to 68 countries, five
among them viz;- USA, UK, Germany, Belgium and the Netherlands put together
account for 90 per cent of total exports. It is obvious that, lot of scope exists not
only in these 5 countries in the existing range but also of the new range in the
remaining 63 countries also. With improvements in production, marketing and
with appropriate planning, exports can be increased by 3 times in the next six
years to reach the level of around Rs. 450 crores from the current exports of
about Rs. 160 crores.?
Handloom Matting
This has been the second largest export earning product. Though
exported to 38 countries, five of them -USA, the Netherlands, U.K, Belgium and
Germany together account for 71 per cent of the exports. USA has the highest
share[33 %]. Considering the Eco- friendly nature of the product, it is possible to
target an export value of say Rs. 120 crores in the next six years. For this
innovations in product designs and exploration of new markets are required....
Coir Yarn
It has been the third highest export earner. Even though yam is exported
to 28 countries, - Italy, the Netherlands, U.S.A., France and Germany together
account for 71 per cent of total exports. With modernization of production and
upgradation of technology it should not be difficult to increase exports by three
limes both in the existing as well as new markets.
305
Tufted Mats
The export earnings from tufted mats has increased from Rs. 65 lakhs in
1995 to over Rs.21 crores in 2000-2001. Even though tufted mats are exported
to 37 countries 96 per cent of them are exported to 5 countries. Considering its
scope for export a target of Rs. 300 crores can be achievable in the next 6 years.
Coir Rugs and Carpets
These items are in direct competition with synthetics. The Eco friendly
customers can be persuaded to prefer the use of coir rugs and carpets.
Coir Pith
Coir Pith is a new non-traditional item exported to 32 countries. However
five countries viz; the Netherlands, France, Australia, Ecuador and USA together
account for 82 per cent of the total exports. It is expected that the versatility of
the product and its wider usage will help to attain an annual growth of 100 per
cent in exports.
Geo-textiles[Coir Bhoovastra]
It is another new non traditional eco-friendly item highly demanded in
~leign countries. It is to exported to 21 countries. Considering its characteristics
md demand potential, 100 per cent annual export growth can be targeted [Rs.
;oocrores] in the next 6 years. Appropriate planning and marketing strategy are
'tquired in this respect. 8
Similar marketing prospects exists in the case of other coir products like
:ower-Ioom mats, power-loom mattings, rubberized coir and coir fibre. The
~.portant use of rubberised coir is in the automobile industry. The leading users
:1Mercedes and BMW in Germany, Volvo in Sweden, Volks Wagen and Datsun

306
in Japan. The prospects of coir in the automobile industry appears to be very
promising.
Bright propects for hand-made coir products
The hand-made coir products continue to be marketed at a premium price
in spite of the fact that a few fully mechanised units have come up in the export
sector. Therefore, this niche requires to be developed by offering better initiative
lor encouraging hand-made coir products.
It is seen from the study that almost 70 to 80 per cent of exports of various
items are confined to 5 countries. But there are around 20 countries which
import large quantities of such products. Marketing effort need to be
strengthened to exploit the opportunities existing in other countries."
6.6.2 Prospects in the domestic market
Coir industry is essentially an Export Oriented Industry. This does not
1\ean that the domestic sector is to be ignored. Both these markets should be
ieveloped strengthened by removing obstacles faced by the market. Coir being
meeo-friendly products, its use is to be popularised through evoking public
:.vareness. The general public are not fully aware of the various uses of coir and
::oducts made of coir and their eco-friendly nature.
Coir has an expanding domestic market. The growing affinity towards~
":vironment friendly natural products all over the world presents new market
:rx>rtunities to coir and coir products. There is a vast unexploited market
:tential in India. The unique properties of coir like high resistance to rotting,
j~ to act as an insulating material and ability to withstand high velocity water
:.' etc. are not known even within India.
307
Traditionally coir and coir products were marketed with in the country
largely through private traders. The expanding role of co-operative sector in
developing a stable internal market for coir yam, since co-operative movement
took birth in coir sector is commendable. Out of the total production of coir yarn
in India, 85 per cent is consumed domestically. This is only 40 per cent in the
case of products like coir door mats, mattings etc. Coir rope, has a number of
commercial uses and is a highly demanded item. In the case of rubbersied coir
products, almost the entire production is consumed in the home market. West
Bengal, UP., M.P., Maharahtra and Punjab are the leading markets of coiryarn
in India. They account for about 70 per cent of the coir yarn despatched from
the producing region. UP., M.P., Maharashtra and Delhi are the major
consumers of coir rope. The end use pattern of coir yarn consists of four major
segments:-
Construction activities, Agricultural operation, Charpoy making
[demanded in UP., M.P., Punjab, Haryana, Rajastan and Delhi] and General
packing and bundling. 10
Coir rope finds major use in tethering cattles, lifting of water, felling of
trees, drawing temple chariots and in trucks and bullock carts. It is facing
increasing competition from rope made of synthetic material.
The internal market for coir products [coir mats and mattings] has two,
segments- household and institutional. The organised selling channels of coir
products referred to above cater mainly to the institutional channels and not
sufficient to tap the unexploited household sector in India.
Coir matting has been recommended for schools by the Government of
J&K for snow-clad regions of Leh, Ladakh and Kargil. In Kashmir also, coir is
being used as a floor covering in Government undertakings, factories and offices.
308
There is a lot of potential for coir mattings in this region and the same can be
explored with the help of Coir Board. Other potential areas can be hilly areas of
U.P., Himachal Pradesh, Rajastan and Madhya Pradesh. Coir is recommended
in these areas because of damp floors due to seasonal effects.'! Jute patties in
large quantities are in demand in Schools in Northern India. In Uttar Pradesh
alone, there are about 60,000 primary schools, where jute patties of 60 ems. X 4
Mts. Size are used for primary school students to sit. The wooden desks are too
costly for village schools and they cannot afford them. The Jute Patties are not
durable. The use of coir has been rejected because of its rough surface and
pinching problem. If these problems are solved the industry will have a vast
market.
The market potential of eco-friendly coir products in North eastern States
is accelerating because of the undulating terrain and incessant rains and the
consequent flood conditions prevalent in the region. The use of coir as a means
to prevent soil erosion and land slide by protecting embankments and hill slopes
s the reason for this added market potential. The Coir Bhoovastra[Coir geo
textiles] is a blessing to people in these areas. Thus, it is expected that, north
eastern region comprising of eight States, Mizoram, Tripura, Meghalaya, Assam,
Manipur, Nagaland, Arunachal pradesh and Sikkim would constitute a region of
adequate growth potential for marketing coir and coir products. The unique
characteristic of coir being warm in winter would be an added attraction to the
people of north-eastern states.
Various studies undertaken with respect to domestic market revealed that
there exists considerable scope for substantially increasing the sale of coir and coir
products with-in the country. The household sector in India, as has already been
309
pointed out, still remains an unexploited market segment as far as coir products
are concerned.
Regarding problems facing by Coir Vyavasaya Co-operatives in Kerala it is
assessed that, problems have linkages with the socio-economic status of coir
workers and with the working inefficiency of COIRFED. Problems ultimately
point towards the inefficient marketing strategy of COIRFED and this leads to
chain reactions.
It is observed that the primary societies are in a vicious circle. Because of
shortage working capital they could't purchase raw husk and put for retting at the
appropriate time. If the workers feel that sufficient raw husk for the normal
working season has not been stored in the society, they will not wait for work in
such societies and go to private sector seeking work and finally enter into binding
contract with them by accepting advance wages. When society starts production
after heavy struggle they experience shortage of labour. Even with all these
difficulties if they organise production, the COIRFED will not give sale price in
time, Societies will have to wait at least 2-3 months to realise the sales price and
that put them in difficulties to pay wages to workers for the work done. If stock is
flooded in COIRFED due to inefficient marketing it reacts adversely on societies.
COIRFED will not accept yarn from primary societies. This will put result in
fooding the society's godown and they will be forced to stop production. This
will put workers in an uncertain situation about future work and wages for the
'IJOrk already done. The survey revealed that even though lA' category societies
are having adequate working capital, they were also forced to stop production
:ecause of this situation.
The great objectives of governments regarding the Coir Co-operativisation
xheme are nullified because of the inefficient working of the apex body.

310
Launching of various schemes with the intention of nurturing coir co-operatives
are not a solution to the real disease. The sincere attempt for studying the
problems has not done by the apex body. Introduction of mechanisation in the
spinning sector is the best example. This mechanisation has neither benefited the
societies nor the workers.
The participation rate of worker members in the various activities of the
coir co-operatives is extremely low. This itself cuts the root of co-operative
principles.
However, coir and coir products have good prospects in the internal as
well as the external markets because of these unique qualities of durability, bio
degradability and eco-friendleness. But India could tap only 4 per cent of the
~Drld market potential for coir and coir products. Coir co-operative sector in
Kerala could't tap even one per cent of the export market. It can be tapped only
mough concerted efforts on the part of all concerned in the coir industry.
311
References
1. Goel, Rameshwar [2001]"Development of coir in domestic market",
Paper presented in the International Seminar on Coir at Kochi, October
11-13.
2. Fernandez,Christy [2000], "Coir Industry in India", Coir News, August 20,
Vol. XXIX No.8, PP. 23-25.
3. Sivaramakrishnan .R[1999], "New Generation Organic Fibre Coir
Geomaterials for Environmental Solutions in the new Millennium", Coir
News, Vol. XXVIII, No. 12. Dec. 20, p. 31-36.
4. Kutty, V.K.[1999], "Marketing strategy for promoting sales of coir
products" ,Coir News, Vol.XXVIII, No.I. Jan. pp. 21-23.
5. Damodaran, AD., Pavithran C and Warrier. KG.K.[1995], "Polycoir and
Ught-Weight Bricks" , Souvenire- Seminar and Exhibition on
Modernisation of Coir Industry, P.159
6. Fernandez, Christy[2000], "Coir Industry in India", Coir News, August 20,
Vol. XXIX No.S, PP. 23-25.
1. Gandhi,G.N[2001], "Export of coir products in the emerging international
business scenario", Paper presented in the International Seminar on Coir
at Kochi, Oct. 11-13, p.7
l. Ibid p. 8.
l. Ibid p.10
~~. Ajith Kumar, P.[1995], "Marketing coir and coir products", Souvenire
Seminar and Exhibition on Modernisation of Coir Industry, p.123
.• Gael, Rameshwar [2001]"Development of coir in domestic market",
Paper presented in the International Seminar on Coir at Kochi, October
11-13.