a spatial decision support system for retail plan generation and impact assessment
TRANSCRIPT

A spatial decision support system for retail plan generation andimpact assessment
T.A. Arentze, H.J.P. Timmermans *
Urban Planning Group, Eindhoven University of Technology, P.O. Box 513, Mail Station 20, 5600 MB Eindhoven,
Netherlands
Abstract
Current geographic information systems typically o�er limited analytical capabilities and lack the ¯ex-ibility to support spatial decision making e�ectively. Spatial decision support systems aim to ®ll this gap.Following this approach, this paper describes an operational system for integrated land-use and trans-portation planning called Location Planner. The system integrates a wide variety of spatial models in a¯exible and easy-to-use problem solving environment. Users are able to construct a model out of availablecomponents and use the model for impact analysis and optimization. Thus, in contrast to existing spatialdecision support systems, the proposed system allows users to address a wide range of problems. The paperdescribes the architecture of the system and an illustrative application. Furthermore, the potentials of thesystem for land-use and transportation planning are discussed. Ó 2000 Elsevier Science Ltd. All rightsreserved.
Keywords: Integrated land-use and transportation planning; Spatial decision support systems; Spatial models; Multi-
purpose trips models
1. Introduction
The interest in geographical information systems in transportation research has recentlyincreased considerably, as evidenced by the number of papers at transportation conferences.Especially in the area of integrated land-use and transportation planning, geographical infor-mation systems allow users to manage their geo-coded data, perform particular analyses, and mapthe results of these analyses. While the mapping and database aspects of geographical informationsystems are generally well developed, this cannot be said about the opportunities for analyses that
Transportation Research Part C 8 (2000) 361±380www.elsevier.com/locate/trc
* Corresponding author. Tel.: +31-40-247-3315; fax: +31-40-247-5882.
E-mail addresses: [email protected] (T.A. Arentze), [email protected] (H.J.P. Timmermans).
0968-090X/00/$ - see front matter Ó 2000 Elsevier Science Ltd. All rights reserved.
PII: S0968-090X(00)00010-3

geographical information systems o�er. In most commercially available systems, such opportu-nities are rather limited. Moreover, to the extent that systems o�er modeling opportunities, theytend to be quite dated and often restricted to the simplest versions of that model.
Under such circumstances, the user is left with the option to either apply more or less outdatedtechnology, or develop and apply dedicated software. Several geographical information systemsnow also provide some script language that may be used, but in general, this is not particularlye�cient. In many cases, we have therefore chosen to build dedicated software that has beenoptimized with a particular class of problems in mind, and that incorporates the latest models thathave been developed for that problem. Communication with widely used geographical informa-tion systems is guaranteed through the use of particular data ®le formats.
The present article focuses on an example of such a spatial decision support system that wasmade operational over the last couple of years: Location Planner. It has been developed withretail planning problems in mind, and allows the user to address issues of transportation and land-use planning. A major problem is how the supply of retail facilities, given the properties of thetransportation system, a�ects spatial shopping behavior and related trip patterns, and vice versa.
The article is organized as follows. First, we will describe the objectives of the system against abrief overview of spatial decision support systems. This is followed by a more detailed discussionof the architecture and various components of the decision support system. Next, we will illustratethe use of part of the system in a case study of Veldhoven, Netherlands. The article is concludedwith a summary and evaluation of the proposed system.
2. Review of spatial DSS approaches
Decision support systems (DSS) were ®rst introduced in business management. The aim was toimprove the decision support capabilities of the management information systems that were usedat the time. The ®rst DSS applications began to appear in the early 1970s. Since the early 1980s,DSS e�orts gained in strength under in¯uence of the PC revolution, the increasing performance±price ratio of hardware and software, and the increasing availability of public databases and othersources of external data (Sprague, 1989). Although there is not a generally agreed upon de®nition,the term DSS commonly refers to ``computer-based systems which help decision makers utilizedata and models to solve unstructured problems'' (Sprague, 1989). Spatial DSS is generally de-®ned as a DSS which combines geographic information with appropriate algorithms to supportlocational decision making (Crossland et al., 1995; Keenan, 1998; Maniezzo et al., 1998). Thissection ®rst reviews approaches in spatial DSS for transportation and location planning and thenpositions our approach in this context.
Spatial DSS approaches reported in the literature are typically centered on a single modelingtechnique. According to the technique used, we can distinguish spatial interaction/choice modeling,mathematical programming, or multi-criteria decision modeling approaches. Examples of systemsbased on the ®rst approach are Roy and Anderson (1988), Borgers and Timmermans (1991),Grothe and Scholten (1992), Kohsaka (1993), Birkin (1994), Birkin et al. (1996) and Clarke andClarke (1995). The core of these systems is a spatial interaction/choice model for predicting des-tination choice or interactions between zones dependent on travel distance, size and attributes ofretail or service facilities. Typically, predictions are represented in an origin±destination matrix
362 T.A. Arentze, H.J.P. Timmermans / Transportation Research Part C 8 (2000) 361±380

from which market shares of stores and travel demands of consumers are derived. Thus, the sys-tems allow users to predict and analyze impacts of possible location or transportation plans. Fewsystems also actively support location selection. The system proposed by Kohsaka (1993) incor-porates a steepest descend algorithm to search for locations on a continuous potential surface(predicted by the shopping model). Clarke and Clarke (1995) and Birkin et al. (1996) describededicated GIS applications that incorporate a location±allocation model for optimizing the spatialcon®guration of a network of facilities.
In contrast, location±allocation models make up the core of systems based on the second ap-proach. Location±allocation models simultaneously optimize the choice of locations for facilitiesand the allocation of consumers to those facilities. The mathematical programming approachimplies that an optimization problem can be de®ned by users in terms of a (single) objectivefunction and one or more constraints on solutions. For given candidate locations, the systemgenerates optimal con®gurations of the retail/service network and, in some cases, optional outletformats. Densham (1994) reviews applications for location selection. Armstrong et al. (1990) andDensham and Rushton (1996) describe spatial DSS applications for reorganizing service deliverysystems. As Densham (1991) argues, the objective of spatial DSS (in this approach) is to provide aÔ¯exible problem-solving environment in which decision makers can explore a given problem,evaluate the possible trade-o� between con¯icting objectives, and identify unanticipated, possiblyundesirable characteristics of the problemÕ.
Multi-criteria or multi-objective DSS represents a third approach aimed at providing tools foranalyzing the complex trade-o� between candidate locations in choosing a suitable location for anew facility (e.g., highway, waste dumps, power plant, hospital, etc.). Multi-criteria evaluation(MCE) refers to a set of techniques for ranking a given set of choice alternatives on a given set ofmultiple, possibly, con¯icting criteria. Multi-criteria or multi-objective spatial DSS is typicallyapplied in a group setting. It assists the group in identifying location candidates, developing listsof criteria for evaluation, determining weights of criteria, performing sensitivity analysis andalternative ranking (Janssen, 1991). The systems typically integrate MCE or multi-objectiveprogramming (e.g., goal programming) with analytical and mapping tools of GIS. There aremany examples of such systems reported in the GIS literature (Fedra and Reitsma, 1990; Carver,1991; Pereira and Duckstein, 1993; Jankowski, 1995; Lin et al., 1997; Malczewski, 1996; Jan-kowski and Ewart, 1996; Crossland et al., 1995). Thill (1999) gives a review of the ®eld. Thespatial DSS for solid waste planning described in MacDonald (1997) combines various techniquesincluding mathematical programming, impact analysis, and the Analytical Hierarchical Process.Carver (1991) describes a method for integrating GIS and MCE techniques.
The spatial DSS that we propose intends to improve the ¯exibility and interactive properties ofcurrent spatial DSS. Sprague and Carlson (1982) distinguish two aspects of ¯exibility. First-level¯exibility is the ability of the system to adapt to a solution path preferred by the decision maker.This is important because location problems are often ill-structured implying that no standardsolution procedure exists. Second-level ¯exibility is the ability to modify the con®guration of theDSS so that it can handle a di�erent set of problems. This is an essential feature of a generic DSS.Existing systems perform poorly on both ®rst and second-level ¯exibility. With respect to the ®rstlevel, spatial interaction/choice model (SIM) systems focus on what Densham and Armstrong(1993) call the intuitive mode. In this mode, users can specify scenarios in terms of planned oranticipated developments (e.g., opening a new facility, population forecasts) and the system gives
T.A. Arentze, H.J.P. Timmermans / Transportation Research Part C 8 (2000) 361±380 363

feedback in terms of impacts on criterion variables (e.g., travel demands). On the other hand, DSSbased on mathematical programming (MP) or multi-criteria evaluation (MCE) methods are de-signed to support the goal-seeking mode. That is, users can specify the location problem in termsof criterion variables (e.g., criteria weights) and the system generates optimal solutions in terms ofdecision variables (i.e., optimal con®gurations or rankings). Where SIM-systems lack the ana-lytical capabilities or an appropriate user-interface for the goal-seeking mode, the MP/MCEsystems are weak in supporting the intuitive mode. The goal of our approach is to design a systemthat supports both interaction modes in terms of modeling capabilities, as well as user interfaces.
With respect to second-level ¯exibility, SIM-systems also tend to be highly restrictive. Theyo�er users limited possibilities to change the speci®cation of a shopping model (selection of at-tributes), the utility function form (e.g., nested logit or MNL), and sometimes even the values ofmodel parameters (weights of attributes). The reason for this is that most systems are designed fora speci®c application. For each new application, systems must be re-designed to suit the speci®cinformation needs. A generic DSS requires a more fundamental solution. To be able to supportproblems in both public-sector and private-sector planning, the system must cover a wide range ofplanning objectives. Moreover, users should be able to choose attributes, attribute parameters,and even the form of the spatial shopping model.
Interactive properties relate to two dimensions of the user-interface: the extent to which userscan view and manipulate relevant conditions of a problem (openness of the system) and com-municative properties. To identify potentially relevant information categories, we use a model ofthe planning cycle. The model is schematically shown in Fig. 1. The boxes in this scheme cor-respond to di�erent information categories or sections of the problem domain and the arrowsrepresent the dependency relationships between them. The user-interface of the proposed system
Fig. 1. Scheme of the planning cycle.
364 T.A. Arentze, H.J.P. Timmermans / Transportation Research Part C 8 (2000) 361±380

allows users to interact with each of the sections to view or change conditions of the system beingplanned. In particular, users should not only be able to evaluate alternative plans, but also de-mographic and economic scenarios of change in a study area.
To enhance the communicative properties, the second dimension of user-interfaces, we usedynamic-graphics techniques much in the same way as proposed by Densham and Armstrong(1993) and Densham (1994). That is, the proposed system supports multiple representation for-mats (views) of domain sections. These include map, graph and table format. The views aredynamically linked with each other so that changes in one view lead to automatically updatingrelated views. For example, if the user selects a record in the table view, the system highlights thecorresponding object in the map and graph views at the same time.
3. Architecture of the system
This section discusses the architecture of the system designed to achieve these objectives.The architecture is schematically shown in Fig. 2. The inference model supports the intuitive
Fig. 2. Architecture of Location Planner.
T.A. Arentze, H.J.P. Timmermans / Transportation Research Part C 8 (2000) 361±380 365

interaction mode. Users can de®ne scenarios, for example related to population or plans, and runmodels to predict and analyze impacts on planning objectives. To provide second-level ¯exibility,the inference model is not a ®xed component of the system. Rather users are able to construct themodel out of more elementary components that are available in the model base of the system.Thus, users can construct a model that suits information needs, available data and preference formodel types. To provide ®rst-level ¯exibility, the second major component called Problem Solversupports the goal-seeking interaction mode. Users can de®ne a problem in terms of objectives andconstraints and the system generates the optimum and near-optimum solutions. The system isimplemented as a stand-alone Windows-95 application using the object-oriented programmingtool C++-builder. The remainder of this section discusses each component in turn.
3.1. Constructing an inference model structure
Location Planner allows users to construct a model of the retail/service system out of ele-mentary models available in the model base of the system. The internal database consists ofseveral interconnected sections that correspond to the planning scheme mentioned before (Fig. 1).The present state and goal state represents the current and desired states of the system beingplanned respectively. The desired state refers to planning objectives to be attained at some futuremoment in time. The future state of the system is the result of anticipated or planned changes ofthe present state. The future-C state represents the future state in terms of the system performancecharacteristics that are used to describe the goal state. The discrepancy state is the result ofcomparing the future-C state and the goal state. Dependent on the speci®cation of the goal state,discrepancies involve either an imbalance between demand and supply, or opportunities for ex-panding or otherwise improving a facility network.
Within each of these states of the system, the database stores information about di�erent typesof spatial objects. The following object types are distinguished: (i) demand objects (residentialzones); (ii) supply objects (retail or service facilities); and (iii) interactions between demand andsupply (trips or expenditure ¯ows). Distances between locations are considered externally giventhrough data ®les. Each combination of object type and state of the system constitutes a section ofthe internal database. For example, the combination demand±present state stores informationabout the present state of residential zones in the study area. For planning, not all possiblecombinations are relevant. For example, goals are usually not formulated at the level of inter-actions between demand and supply. Therefore, the goal-state-interaction section is not sup-ported. Fig. 2 shows the sections that are available in Location Planner.
Internally, a section is an object holding a two- or three-way table. A demand section stores ademand� attribute table, a supply section a supply� attribute table, and an interaction section ademand� supply� attribute matrix. For example, the attribute dimension of interactions mayconcern trip type or consumer segment. Irrespective of the table type, attributes are dynamicallyde®ned.
Initially, a section is empty. Users construct the inference model by adding attributes to sectionsand de®ning for each attribute a model for evaluating that attribute. In Location Planner (and inobject-oriented systems in general), a model related to an attribute is called a ÔmethodÕ. Users cande®ne a method by selecting a model from the model base. The following categories of models areavailable:
366 T.A. Arentze, H.J.P. Timmermans / Transportation Research Part C 8 (2000) 361±380

1. procedures for retrieving data from the external database (present-state, goal-state and changesattributes);
2. procedures for arithmetic summation �compute : future � present� changes�;3. spatial shopping models (future-state-interactions attributes);4. demand-related performance analysis models (future-C-demand attributes);5. supply-related performance analysis models (future-C-supply attributes); and6. performance evaluation models (discrepancy attributes).
Having selected a model, users next specify model parameters, if any, and indicate which at-tributes in related sections (methods 2±6) or external databases (method 1) provide input data.Thus, methods establish connections between mutual attributes (2±6) or between attributes andthe external database (1).
3.2. Inference model base
This part of the system contains the models that can be used as methods for evaluating at-tributes, as explained above. The data-retrieval and arithmetic models compute elementaryfunctions and need no further explanation. Available performance-evaluation models simplycalculate a ratio or di�erence between corresponding goal-state and future-state attributes. Thissection focuses on the available spatial shopping models and performance analysis models. Ofeach model type, di�erent variants are available to allow users to choose the model variantconsidered appropriate for the application.
3.2.1. Shopping modelsThese models predict interaction probabilities between demand and supply locations (objects).
The production-constrained spatial interaction model is available, as well as the MNL modeland a nested-logit model. All models, including the spatial interaction model, assume multi-di-mensional location-attractiveness terms, inelastic demand, rule-based de®nitions of choice sets,and an out¯ow measure per demand location (proportion of expenditure that leaves the studyarea). In the nested-logit model, location choice is embedded within the choice of trip type. Theutility of each trip-type is calculated as the sum of a user-de®ned alternative-speci®c constant andthe logsum of the lower nest. The logsum quanti®es the expected maximum utility across thelocation alternatives within the nest. Thus, it represents the utility of the nest under optimallocation choice. For each nest, users can specify a rule de®ning the choice set, utility function,and out¯ow attribute, just as in the case of a conventional MNL model. The nested-logit modelcan be speci®ed as the multi-purpose-shopping model that we have developed and tested inearlier work (Arentze et al., 1997). When speci®ed as a multi-purpose model, the trip-types referto alternative trip purposes including possible combinations of purchases of di�erent goods(multi-purpose).
As stated before, interaction sections support a demand� supply � attribute matrix. The at-tribute dimension can be speci®ed in di�erent ways. First, if the nested-logit model is used, Lo-cation Planner automatically generates a three-dimensional matrix of which the third dimensionrepresents trip type. In a three-dimensional matrix, cell probabilities sum up to 1 for each demandlocation across the supply and attribute dimension. Second, users can use the same structure tode®ne one or more two-dimensional matrices, i.e., matrices in which cell probabilities sum up to 1
T.A. Arentze, H.J.P. Timmermans / Transportation Research Part C 8 (2000) 361±380 367

across the supply dimension. A set of two-dimensional interaction matrices is relevant, for ex-ample, in cases where one wishes to use di�erent speci®cations of an MNL model for predictingchoice behavior of di�erent consumer segments (e.g., socio-economic groups).
3.2.2. Supply related performance modelsThese models compute attributes in the future-C-supply section. Two model types are avail-
able. First, interaction-based models use the demand� supply� attribute matrix to calculate foreach supply location a measure of allocated demand. Besides the interaction matrix, this methodassumes input as a measure of demand per demand location and a measure of in¯ow of demandfrom outside the study area per supply location. Two variants are available. The ®rst variantassumes a three-dimensional interaction matrix. Users can set the relative weight of each triptype (the third dimension). The weights should re¯ect di�erences between trip types in theamount of money spent per trip on the good or service of interest. The second variant assumesone or more two-dimensional interaction matrices. Users can set the origin demand for eachmatrix separately.
The second model type uses a deterministic rule, instead of an interaction matrix, for allocatingdemand to supply. The rule implemented assumes that consumers choose the nearest location thatmatches the trip purpose. Irrespective of the particular model used, interaction-based or rule-based, users have the option to choose between alternative ways of expressing allocated demandas turn over, ¯oor productivity, or market share.
3.2.3. Demand-related performance modelsThese models compute performance measures related to demand locations. The following
models are available:1. distance to N nearest facilities or the number of facilities available within cost-band K (Brehe-
ney, 1978);2. travel distance required to purchase a set of n goods while accounting for multi-purpose trips
(Arentze et al., 1994a);3. expected travel distance required for purchasing a good while accounting for multi-stop trips
(Arentze et al., 1994b); and4. the amount of allocated supply capacity for each demand location (Clarke and Wilson, 1994);5. total distance traveled, average trip length and trip frequency while accounting for multi-pur-
pose trips.These models relate to di�erent criteria for judging plans including accessibility/spatial choicerange (models 1±3), service-provision e�ciency (model 4), and travel demands (model 5). Models2±3 can be viewed as more sophisticated alternatives for model 1 in that they account for multi-purpose, multi-stop trips. Models 4±5 assume a demand� supply� attribute matrix.
Deriving total travel distance from an interaction matrix is not straightforward if multi-purposeshopping is involved. The question is whether consumers keep the total purchase frequencies orthe total trip frequency constant when they choose to make a multi-purpose trip (i.e., combiningseveral purchases on the same trip). Model 5 allows users to specify, dependent on the assumptionmade, either a total trip frequency or purchase frequency and calculates the travel distance im-plied by the matrix accordingly.
368 T.A. Arentze, H.J.P. Timmermans / Transportation Research Part C 8 (2000) 361±380

3.3. External database
The external database consists of a collection of ®les speci®ed by the user. The data ®les shouldcontain attribute information of demand locations and supply locations, and distances betweenlocations in table form. Geographic and image data about the study area are optional and allowthe system to display a map of the area and an image background for the map.
Location Planner does not provide an editor for editing these ®les. Instead, the system supportsthe use of existing ®les, for example, generated by a GIS or other general-purpose software.Supported formats include DBase, TransCad-table and text ®les for attribute and distance data,BNA for geographical data, and bitmap for image data.
3.4. Inference engine
The inference engine controls the execution of methods for evaluating attributes and guards theinternal consistency of the inference model. In this context, it is important to note that de®ningdependency relationships between attributes and methods constitutes a coherent model structure.Generally, the methods that need to be executed for evaluating an attribute at any position in themodel constitute a tree structure of which the endpoints (leafs) consist of methods for readingexternal data. If the engine receives a command to evaluate an attribute, it identi®es and executesthe nodes (methods) of the tree starting from leaf nodes. On the other hand, if the de®nition of anattribute changes, the data of dependent attributes are a�ected as well. The attributes that area�ected constitute a tree structure in the opposite direction, whereby leafs represent the endpointsof reasoning chains. If an action of the user leads to a change of the de®nition of an attribute, theengine identi®es and resets the tree of a�ected attributes. Various user actions can lead to a changeof variable de®nitions. These include re-specifying or deleting a method, changing the selectionstatus of supply or demand objects, changing data ®les, editing attributes in present state, changeor goal sections and adding or deleting attributes. In sum, the inference model works much like aspreadsheet where formulas need to be de®ned only once and are automatically executed ifneeded. Besides speeding up the process of evaluation, the advantage is that users are insulatedfrom the technical details of the models.
3.5. Problem solver
This module incorporates models for solving well-de®ned location problems. There are twobasic models available: the competitive location model and the central location model.
3.5.1. The competitive location modelThis model allows users to optimize the con®guration of a retail or service chain in terms of the
number, attribute pro®le and location of outlets. Users can de®ne the problem in terms of anobjective function and a constraint function. For example, a typical problem is to maximize themarket share for a chain as a whole under the constraint that every outlet of the chain meets aminimum ¯oor productivity level. If users have speci®ed di�erent attribute pro®les (maximallythree) for new outlets, the model optimizes the format of each new outlet simultaneously. Fur-thermore, users can choose between two search algorithms for solving the problem: an exhaustive
T.A. Arentze, H.J.P. Timmermans / Transportation Research Part C 8 (2000) 361±380 369

search algorithm and an interchange algorithm. The exhaustive search algorithm is suitable forproblems of small size. Irrespective of the algorithm chosen, the form of the output depends onthe chosen output option. Users can choose between displaying the N best solutions or the bestsolution per possible macro-strategy. A macro-strategy is a speci®c combination of the numberand formats of outlets, which normally can be implemented in di�erent ways in terms of locations(Ghosh and McLa�erty, 1987).
3.5.2. The central location modelThis model allows users to ®nd the locations of p outlets that minimize the aggregated weighted
travel distance from demand locations to nearest supply location. Users can specify the problemin terms of the size p of the network, the relevant existing supply locations (all or selected only),the attribute containing demand weights, and the yes/no possibility to relocate existing facilities(®xed or replaceable). Again, the exhaustive search and interchange algorithms are available forgenerating solutions.
3.5.3. Implementation of the modelsThe exhaustive, as well as interchange search algorithms, are not implemented as independent
models. Instead, they use the inference model (de®ned by the user) to evaluate solutions in termsof both the objective function and constraint conditions. Since users can specify the inferencemodel independent of the location model, a wide variety of model speci®cations are possible. Forexample, a complex multi-purpose shopping model can be used in combination with sophisticatedperformance models to evaluate solutions.
3.6. User interfaces
All settings de®ned by users, as well as the internal database, are stored in a single project ®le.When users open a new project ®le, every section of the database is empty and holds only oneattribute. Sections can be viewed through a table, map and graph representation format. In thetable view, users can add attributes (columns or sheets) and de®ne methods for attributes.
The table and map views are bi-directionally linked. When activated, the map window displaysdemand objects as zones with centroids and supply objects as point locations. By clicking on amap object, the record in the table window is simultaneously highlighted. Conversely, by clickingon a table record, the corresponding map object receives focus. This functionality of the system isconsidered important, as it allows users to link attribute and geographical data of objects. Fur-thermore, the system automatically displays thematic information contained in the table view onthe map. When users select a column of a table, the map is refreshed by the system and the at-tribute is displayed in the form of a circle diagram on the map. Thus, the spatial distribution of aquantity, such as population or ¯oor space, can be easily assessed. Interaction data, on the otherhand, are displayed in the form of lines connecting demand and supply locations. The width of aline represents the relative size of the ¯ow. Finally, when activated, the graph view displays theselected attribute in the form of a bar diagram. This format gives a visual impression of thedistribution of objects on an attribute (e.g., population). Table-graph links are uni-directionalfrom table to graph. Speci®cally, the graph is refreshed each time the selection of a columnchanges.
370 T.A. Arentze, H.J.P. Timmermans / Transportation Research Part C 8 (2000) 361±380

Editing data is possible in the table view of change, future and goal sections. In LocationPlanner, the content of a demand-change or supply-change section is called a ÔscenarioÕ. Ascenario can be implemented by editing in the table view or by retrieving data from the externaldatabase. By clicking on the update button, users give a command to the inference engine toupdate attributes. The discrepancy state shows consequences in terms of performance scoresrelative to the goal state (if any). The Scenario Manager module allows one to store andmanage scenarios. Using the scenario manager, users can easily return to an old scenario orevaluate new combinations of demand and supply scenarios. Problem Solver supports, in asimilar way, the management of generated solutions. Generated solutions are automaticallystored. Users can display, remove, or re-generate solutions. A solution itself is a list generallyconsisting of N best solutions. The same linked table, graph and map views are available toview solutions.
Typically, the ®nal result of this user-system interaction is a set of alternative scenarios andcorresponding outcomes. Each scenario is based on speci®c assumptions about demographic andeconomic developments (demand scenarios), consumer choice behavior (shopping model) andobjectives (optimization model or goal state). To facilitate political decision making, the resultstogether with scenario assumptions should be compiled into a comprehensive report. LocationPlanner does not o�er a facility for generating such a report. However, the views provide therequired material in the form of tables, graphs and maps. Moreover, each attribute is explicitlyde®ned in terms of the linked method speci®cation.
4. Illustration
The case study conducted to illustrate the system considers a large-scale expansion of the majorshopping center in Veldhoven, Netherlands. The multi-purpose trip model and complementaryperformance models are applied to predict the impacts of the expansion on travel demands ofconsumers and market shares of shopping centers. Thus, the case study focuses on the inferencemodel component of Location Planner. This section discusses the de®nition of the study area, theestimation of a multi-purpose trip model, and the information that can be derived from the model.
4.1. The study area
Veldhoven is a city in the Southeast of Netherlands with 41,000 inhabitants in 1996. It is lo-cated nearby Eindhoven. The map in Fig. 3 shows the major neighborhoods of Veldhoven and thespatial distribution of the shopping centers in the area. As is typical for Dutch retail systems, themajority of retail facilities are concentrated in planned neighborhood centers. The major shoppingcenter, called the City Center, is located in the central district (nr 1). The second center with anabove local function is Kromstraat (nr 3). The only centers outside of Veldhoven that attractconsumers from Veldhoven are the major shopping center of Eindhoven and some shoppingcenters in the eastern and central part of Eindhoven. These centers were identi®ed based on aconsumer survey and were also included in the analysis.
In 1997, a large-scale expansion of the City Center in Veldhoven was undertaken. Expansioninvolved an increase in ¯oor space with approximately one half of the existing ¯oor space in
T.A. Arentze, H.J.P. Timmermans / Transportation Research Part C 8 (2000) 361±380 371

both the daily and the non-daily sector. To analyze the impacts of this development on theshopping and travel behavior of the Veldhoven population, a consumer survey was held beforeand after the expansion of the center. The after-survey provided suitable data for estimating amulti-purpose trip model. 498 households ®lled out a paper-and-pencil questionnaire. Thestops, as well as purposes, were known for shopping trips made by the respondent in the lastweek.
4.2. Model estimation
Considering the general information needs of local government in retail impact studies, thepurchased items reported by the respondents were exhaustively classi®ed into daily goods (foodand personal care) and non-daily goods (all other goods). Given this two-good system, three triptypes based on trip purpose could be distinguished, namely (i) single purpose daily good trips, (ii)single purpose non-daily good trips, and (iii) multi-purpose trips where items of both categoriesare bought during the same visit to the center. Although data were available about multiple tripstops as well, the single stop variant of the multi-purpose model was estimated. Fig. 4 shows thestructure of the model used in this case.
The reported shopping trips involved 1369 visits to identi®able shopping centers. These visitswere used as observations for estimating the model. In this sample, 53% involved daily trips only,27% non-daily only, and 20% were multi-purpose. Hence, a considerable portion of reported trips
Fig. 3. The neighborhoods and shopping centers in Veldhoven.
372 T.A. Arentze, H.J.P. Timmermans / Transportation Research Part C 8 (2000) 361±380
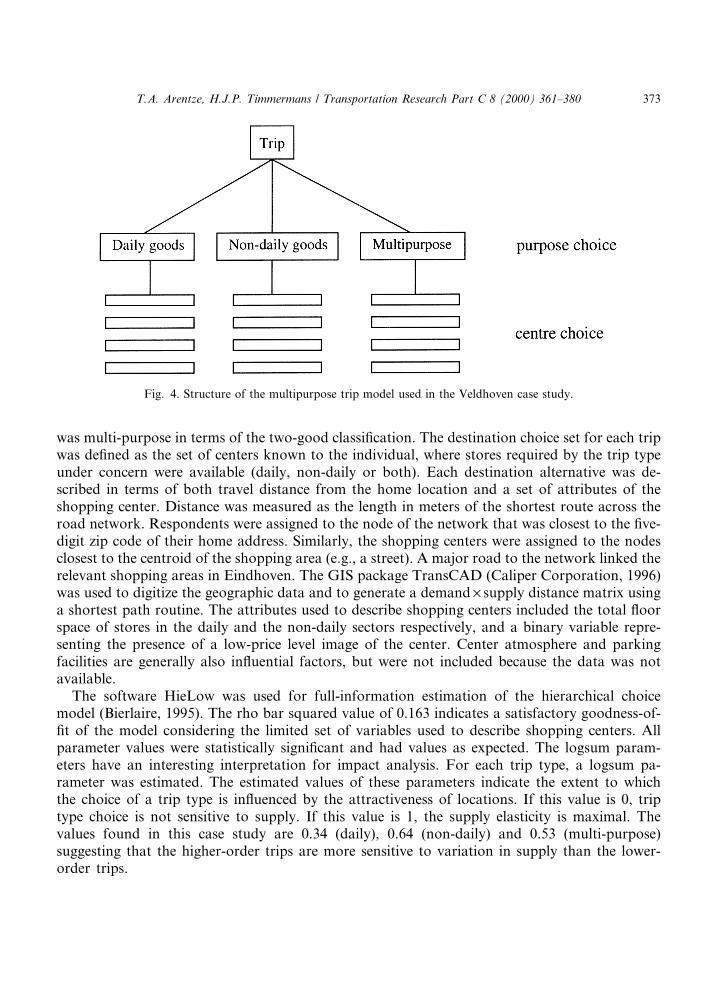
was multi-purpose in terms of the two-good classi®cation. The destination choice set for each tripwas de®ned as the set of centers known to the individual, where stores required by the trip typeunder concern were available (daily, non-daily or both). Each destination alternative was de-scribed in terms of both travel distance from the home location and a set of attributes of theshopping center. Distance was measured as the length in meters of the shortest route across theroad network. Respondents were assigned to the node of the network that was closest to the ®ve-digit zip code of their home address. Similarly, the shopping centers were assigned to the nodesclosest to the centroid of the shopping area (e.g., a street). A major road to the network linked therelevant shopping areas in Eindhoven. The GIS package TransCAD (Caliper Corporation, 1996)was used to digitize the geographic data and to generate a demand ´ supply distance matrix usinga shortest path routine. The attributes used to describe shopping centers included the total ¯oorspace of stores in the daily and the non-daily sectors respectively, and a binary variable repre-senting the presence of a low-price level image of the center. Center atmosphere and parkingfacilities are generally also in¯uential factors, but were not included because the data was notavailable.
The software HieLow was used for full-information estimation of the hierarchical choicemodel (Bierlaire, 1995). The rho bar squared value of 0.163 indicates a satisfactory goodness-of-®t of the model considering the limited set of variables used to describe shopping centers. Allparameter values were statistically signi®cant and had values as expected. The logsum param-eters have an interesting interpretation for impact analysis. For each trip type, a logsum pa-rameter was estimated. The estimated values of these parameters indicate the extent to whichthe choice of a trip type is in¯uenced by the attractiveness of locations. If this value is 0, triptype choice is not sensitive to supply. If this value is 1, the supply elasticity is maximal. Thevalues found in this case study are 0.34 (daily), 0.64 (non-daily) and 0.53 (multi-purpose)suggesting that the higher-order trips are more sensitive to variation in supply than the lower-order trips.
Fig. 4. Structure of the multipurpose trip model used in the Veldhoven case study.
T.A. Arentze, H.J.P. Timmermans / Transportation Research Part C 8 (2000) 361±380 373

4.3. Impact analysis
The model was implemented in Location Planner using the system facilities for model con-struction. For predicting shopping trips, the same travel distance matrix as in the estimation stagerepresented the transportation system. The travel distance matrix was based on a subdivision ofthe area into 89 zip code areas. However, demographic data was available only at a more ag-gregated level of 14 districts. The demographic data were disaggregated to the zip code level byassuming that populations within districts are evenly distributed across the zip code areas. Des-tination choice-sets per trip type and per zone were de®ned using deterministic rules available forthat purpose in Location Planner. Speci®cally, for each trip type the choice-set was de®ned as thecenters o�ering the required store types (daily or non-daily or both). Furthermore, an additionalrule was used for single-purpose daily good trips to further reduce choice-sets to centers lyingwithin a distance of 5000 meter from origin locations.
The multi-purpose trip model was used to predict trips in both the before and after situation.Since the expansion of the City Center was the only development that had taken place, di�erencesfound could be interpreted as impacts of the expansion. Impacts on the choice of multi-purposetrips, travel demands of consumers, and market shares of centers were considered using the de-mand and supply related performance models available in Location Planner.
4.3.1. Choice of multi-purpose tripsFor each trip type, the average choice probability across residential zones weighted by the
zoneÕs population were determined. In the before situation, the probabilities are 51.8% (dailyonly), 30.4% (non-daily only) and 17.8% (multi-purpose trips) and in the after situation, 51.5%,30.2% and 18.3%. This indicates a small increase of the probability of multi-purpose trips causedby the City CenterÕs expansion.
Predicted trip type choice varies not only across time, but also across space. As an indication ofthis, predicted minimum and maximum probabilities across zones in the after situation are 45.9±53.0% (daily only), 28.3±33.6% (non-daily only), and 17.9±20.5% (multi-purpose trips). Thespread in trip frequency is caused by the spatial di�erentiation of utilities of available destinations.Generally, zones near relatively large shopping centers are characterized by higher shares ofsingle-purpose, non-daily, as well as, multi-purpose trips. This re¯ects the relatively big supplyelasticity of higher-order trips compared to daily good trips. For example, relatively high shares ofmulti-purpose trips are predicted for zones nearby the City Center or the major shopping center ofEindhoven.
4.3.2. Travel demandThe expansion may lead to a change in destination choices as well as a change in the share of
multi-purpose trips. The latter may have consequences for trip generation. As discussed in theprevious section, the travel demand model allows a choice between two assumptions about howindividuals adjust their travel behavior in response to changes in multi-purpose trips. Dependenton the assumption made, either the total number of trips across purposes or the total purchasefrequency across goods is kept constant. If the ®rst assumption is chosen, users need to specifythe number of trips. If the second assumption is chosen, the total purchase frequency needs tobe speci®ed. In the present case, the latter option was chosen re¯ecting the assumption that
374 T.A. Arentze, H.J.P. Timmermans / Transportation Research Part C 8 (2000) 361±380

individuals keep purchase frequencies constant and make multi-purpose trips in order to reducethe required number of trips.
The model was run for both the before and after situation. The output generated by LocationPlanner describes for each zone (i) the predicted trip frequency per capita, (ii) the average triplength, and (iii) the total distance traveled. Table 1 shows the after situation when the beforepredictions are set to 100. Average trip length is calculated as a weighted sum of trip lengths usingprobabilities of trip types as weights. Then, total distance traveled is simply calculated as theproduct of trip frequency, trip length and population weights. As the ®gures indicate, the multi-purpose model predicts a decrease in total travel across residential zones of 2.9%. The modelpredicts for each zone a small decrease in total trip frequency (on an average 0.5%). Assumingthat the sum of purchases of daily and non-daily goods remains constant, the decrease is at-tributable to the predicted increase in the share of multi-purpose trips (on an average 3.6%). Also,the predicted average trip length has decreased for each zone (on an average 2.5%). A closer lookat the destination choice probabilities reveals that this decrease is the result of two counter-actinge�ects. First, the City Center tends to attract trips which in the before situation went to localdistrict centers inducing more travel inside Veldhoven. At the same time, the increased compet-itive strength of the center is responsible for a decrease of relatively long trips to the larger centersin Eindhoven. The net result of these two opposite e�ects is a decrease of average trip length.
4.3.3. Market sharesLocation Planner further allows users to predict the market share for each shopping center and
good. The market share of a center is de®ned as the share of the total amount of expenditureavailable in the study area attracted by that center. In this case, market shares were calculated fordaily and non-daily stores in each shopping center. Recall that in the used market share model, theamount of expenditure per capita and per good is a given constant independent of available supply.However, the model takes into account that the amount of expenditure may di�er between trip
Table 1
Travel demand after expansion of the City Center expressed as a percentage of travel demand before expansion
District Population Total frequency Average trip length Total travel
1 1560 99.6 99.0 98.5
2 210 99.5 98.7 98.3
3 3225 99.5 97.9 97.6
4 160 99.6 99.6 99.1
5 3900 99.5 98.5 98.0
6 4690 99.6 99.7 99.3
7 3920 99.5 96.4 95.9
8 2430 99.5 96.4 95.9
9 5060 99.6 96.3 95.9
10 560 99.6 96.3 95.9
11 1500 99.5 98.1 97.6
12 4800 99.6 98.6 98.1
13 2975 99.6 98.1 97.6
14 5985 99.5 94.8 94.3
Average 99.5 97.5 97.1
T.A. Arentze, H.J.P. Timmermans / Transportation Research Part C 8 (2000) 361±380 375

types and users can specify the relative weights of trip type. In the present case, the relative weightof multi-purpose trips was set to 0.5 for both daily and non-daily goods assuming that the amountof expenditure for each good is twice as much on single purpose trips than on multi-purpose trips.Furthermore, users can specify for each shopping center the amount of expenditure attracted fromoutside the study area. Because these data were not available in this case, in¯ows were assumed tobe zero. Hence, the calculated market shares cannot be readily interpreted in terms of turnover, butthey do give an indication of the competitive strength of centers in attracting consumers fromwithin the study area, which was the primary concern in the present study.
Predicted market shares for the after situation when the before situation is set to 100 are shownin Table 2. As expected, the market share of the City Center has increased considerably in boththe daily (38%) and non-daily sector (32%). The decrease in market share of competing centers isdistributed almost evenly across the centers. Impacts range between 6.9% and 7.5% in the dailysector and between 4.9% and 6.0% in the non-daily sector. The competition with the major centerof Eindhoven is also of interest. The loss of Veldhoven market share in Eindhoven inner city is7.4% (daily sector) and 5.4% (non-daily sector).
4.4. Discussion
As the results indicate, the expansion of the center has reduced the total distance traveled by thepopulation for shopping purposes (by approximately 3%). Multi-purpose trips have increasedsomewhat, but the e�ect is largely due to a substitution of long trips to the Eindhoven center byshorter trips to the Veldhoven center. The market share of the City Center has increased con-siderably (32±38%), but to a lesser extent than the increase in ¯oor space (approximately 50%).The model did not take into account possible impacts on transport mode choice for the shoppingtrips. However, the same model structure could be used to de®ne a nested model of transport-mode and location choice. In a mode-location-nested model, alternative destinations of trips are
Table 2
Attributes and market shares after expansion of the City Centera
Center Size daily
(m2)
Size non-daily
(m2)
Low price
image
Market share
daily (%)
Market share
non-daily (%)
1 City Center 8000 10,800 0 137.9 131.6
2 Burg van Hoof 1198 1745 0 93.4 94.9
3 Kromstraat 1534 4148 0 94.1 95.1
4 Heikant 775 30 0 93.8 95.0
5 t Look 610 0 0 93.8
6 Zonderwijk 1340 230 0 93.7 94.9
7 Mariaplein 115 745 0 93.3 95.0
8 Zeelst 657 1146 0 93.2 94.9
9 Oerle 100 0 0 93.3
10 EH inner city 4273 88,273 0 92.6 94.6
11 EH Wonsoel 7780 12139 0 92.5 94.0
12 De Hurk 1225 3163 1 92.8 95.0
13 Kast. Plein 1653 2318 0 93.2 94.9
14 Trudoplein 207 2189 0 93.0 95.0a Market shares are expressed as a percentage of the market share before expansion.
376 T.A. Arentze, H.J.P. Timmermans / Transportation Research Part C 8 (2000) 361±380

nested under mode choices (for example, car versus other modes), so that the impact of changes atdestinations on mode choice can be predicted.
In this case study, the model was estimated on consumer data after the change had taken place.However, in most studies one would estimate the model on the before situation and use it topredict possible impacts in a planning stage. Several scenarios might be considered related toanticipated population developments or compensatory actions to reduce negative impacts, if any.For example, if parking facilities were included as additional attributes in the location utilityfunction, the e�ects of simultaneous parking policies could be evaluated. The facilities o�ered byLocation Planner may reduce the threshold for formulating scenarios. The inference engine au-tomatically runs the entire inference model for evaluating impacts of each scenario and ScenarioManager can be used for generating and managing a scenario base.
The present case study focused on how a multi-purpose trip model can be speci®ed, estimatedand applied for impact analysis using Location Planner. The two-good system assumed in thiscase suits the data-availability and information needs of local governments. At least in Dutchretail planning, it is usual to analyze and collect ¯oor space data at the level of daily and non-dailygoods. Retail plans are also normally formulated at this level. The case study highlighted the extrainformation that can be derived from the multi-purpose model. Besides an origin±destinationmatrix, the model predicts trip-type probabilities and trip frequencies dependent on the choice ofmulti-purpose trips. Moreover, the model is sensitive to (i) settings of the relative weight of triptypes in predicting market shares, (ii) assumptions about the trip-generation e�ects of multi-purpose trips, (iii) purpose-speci®c attractiveness of centers, and (iv) supply elasticity of tripchoice.
5. Conclusions and discussion
This article described and illustrated with a case study the spatial decision support system,Location Planner, which we have developed. The primary objective of Location Planner is toprovide a system that is easy to use and able to support a large variety of problems in retail/serviceplanning. The system is relevant in addressing both issues of transportation planning and locationdecisions. It incorporates a wide range of spatial models, including spatial interaction/choicemodels, system performance models and location±allocation models (Fig. 5).
The system can be evaluated against general objectives of a decision support system. First,adaptability of the system to a wide range of problems is a strong point of the system. Thestructure of the inference model is not ®xed but can be de®ned by users. Because the model baseincludes a wide range of model variants within each category a wide range of problems can beaccommodated. Once the model structure is de®ned, the system has the ¯exibility to allow thechoice between di�erent modes of user±system interaction. The intuitive mode supports impactanalysis of plans or market developments. The goal-seeking mode supports model-based opti-mization of the spatial con®guration of retail or service networks.
Second, the system is strong on visual and interactive properties. The use of dynamic variablede®nitions strongly reduces the length of feedback loops. Users can manipulate a wide range ofconditions and need only to click on an update button to see the implications. Using multipleactive and linked views on data sections enhances the interactive properties. Users can view the
T.A. Arentze, H.J.P. Timmermans / Transportation Research Part C 8 (2000) 361±380 377

same data set in table, map and graph views. The views are linked so that the selection of objectsor attributes in one view is simultaneously implemented in linked views as well.
Third, it should be noted that the system has a limited focus. Not all stages of plan decisionmaking are supported. The system emphasizes the stages of impact analysis and plan generating.To also support the preceding stage of monitoring developments and identifying problems, thesystem must be extended with a time dimension that make the representation and analysis of timeseries data possible. The identi®cation of candidate locations and evaluation of plan alternativesalso receive limited attention.
Given the emphasis on impact analysis and plan-generation, general-purpose GIS and MCE-software are considered complementary. Standard GIS tools support the elementary forms ofspatial analysis required for identifying candidate locations. Commercially available MCE-soft-ware, such as Expert Choice (1995), can be used in addition for identifying criteria, derivingcriterion weights, and ranking alternatives on the criteria. Hence, Location Planner is explicitlymeant to be complementary to existing GIS and MCE (group) software. Communication isrealized through data ®les.
Acknowledgements
This research is supported by the Technology Foundation (STW), Netherlands.
References
Arentze, T.A., Borgers, A.W.J., Timmermans, H.J.P., 1994a. Geographical information systems and the measurement
of accessibility in the context of multipurpose travel: a new approach. Geographical Systems 1, 87±102.
Fig. 5. Organization of data, models and knowledge in Location Planner.
378 T.A. Arentze, H.J.P. Timmermans / Transportation Research Part C 8 (2000) 361±380

Arentze, T.A., Borgers, A.W.J., Timmermans, H.J.P., 1994b. Multistop-based measurements of accessibility in a GIS
environment. The International Journal of Geographical Information Systems 8, 343±356.
Arentze, T., Oppewal, H., Timmermans, H.J.P., 1997. A multipurpose destination choice model for shopping trips:
some empirical results. In: Proceedings of the Paper presented at the Fourth Recent Advances in Retailing and
Services Science Conference, 30 June±3 July, Scotsdale, Arizona.
Armstrong, M.P., De, S., Densham, P.J., Lolonis, P., Rushton, G., Tewari, V.K., 1990. A knowledge-based approach
for supporting locational decisionmaking. Environment and Planning B: Planning and Design 17, 341±364.
Bierlaire, M., 1995. A robust algorithm for the simultaneous estimation of hierarchical logit models. GRT Report 95/3,
Department of Mathematics, FUNDP, Namur, Belgium.
Birkin, M., 1994. Understanding retail interaction patterns: the case of the missing performance indicators. In:
Bertuglia, C.S., Clarke, G.P., Wilson, A.G. (Eds.), Modelling the City: Performance, Policy and Planning.
Routledge, London, UK, pp. 121±150.
Birkin, M., Clarke, G., Clarke, M., Wilson, A., 1996. Intelligent GIS: Location Decisions and Strategic Planning.
Geoinformation International, Cambridge, UK.
Borgers, A.W.J., Timmermans, H.J.P., 1991. A decision support and expert system for retail planning. Computers
Environment and Urban Systems 15, 179±188.
Breheney, M.J., 1978. The measurement of spatial opportunity in strategic planning. Regional Studies 12, 463±479.
Caliper Corporation, 1996. TransCAD: Transportation GIS software: UserÕs Guide Version 3.0, Caliper Corporation,
Newton, MA.
Carver, S.J., 1991. Integrating multicriteria evaluation with geographical information systems. International Journal of
Geographical Information Systems 5, 321±339.
Clarke, C., Clarke, M., 1995. The development and bene®ts of customized spatial decision support systems. In:
Longley, P., Clarke, G. (Eds.), GIS for Business and Service Planning. Geoinformation International, Cambridge,
UK, pp. 227±254.
Clarke, G.P., Wilson, A.G., 1994. A new geography of performance indicators for urban planning. In: Bertuglia, C.S.,
Clarke, G.P., Wilson, A.G. (Eds.), Modelling the City: Performance Policy and Planning. Routledge, London, UK,
pp. 55±81.
Crossland, M.D., Wynne, B.E., Perkins, W.C., 1995. Spatial decision support systems: an overview of technology and a
test of e�cacy. Decision Support Systems 14, 219±235.
Densham, P.J., 1991. Spatial decision support systems. In: Maguire, D.J., Goodchild, M.F., Rhind, D.W. (Eds.),
Geographical Information Systems: Principles. Wiley, New York, pp. 403±412.
Densham, P.J., 1994. Integrating GIS and spatial modelling: visual interactive modelling and location selection.
Geographical Systems 1, 203±221.
Densham, P.J., Armstrong, M.P., 1993. Supporting visual interactive locational analysis using multiple abstracted
topological structures. In: Proceedings of AutoCarto 11, American Congress on Surveying and Mapping, Bethesda,
MD, pp. 2±22.
Densham, P.J., Rushton, G., 1996. Providing spatial decision support for rural public service facilities that require a
minimum work load. Environment and Planning B: Planning and Design 23, 553±574.
Expert Choice, 1995. Decision Support Software: User Manual. Expert Choice, Pittsburgh, Pennsylvania, US.
Fedra, K., Reitsma, R.F., 1990. Decision support and geographic information systems. In: Scholten, J.J., Stillwell,
J.C.H. (Eds.), Geographic Information Systems for Urban and Regional Planning. Kluwer, Dordrecht,
Netherlands, pp. 177±188.
Ghosh, A., McLa�erty, S.L., 1987. Location Strategies for Retail and Service Firms. Lexington Books, Massachusetts.
Grothe, M., Scholten, H.J., 1992. Modelling catchment areas: towards the development of spatial decision support
systems for facility location problems. In: Harts, J.J., Ottens, H.F.L., Scholten, H.J. (Eds.), Proceedings of the
Second European Conference on Geographical Information Systems 2. EGIS Foundation, Faculty of Geographical
Sciences, Utrecht, Netherlands, pp. 978±987.
Jankowski, P., 1995. Integrating geographical information systems and multiple critera decision-making methods.
International Journal of Geographical Information Systems 9, 251±273.
Jankowski, P., Ewart, G., 1996. Spatial decision support system for health practitioners: selecting a location for rural
health. Geographical Systems 3, 279±299.
T.A. Arentze, H.J.P. Timmermans / Transportation Research Part C 8 (2000) 361±380 379

Janssen, R., 1991. Multiobjective decision support for environmental problems. Dissertation, Free University,
Amsterdam, Netherlands.
Keenan, B., 1998. Spatial decision support systems for vehicle routing. Decision Support Systems 22, 65±71.
Kohsaka, H., 1993. A monitoring and locational decision support system for retail activity. Environment and planning
A 25, 197±211.
Lin, H., Wan, Q., Li, X., Chan, J., Kong, Y., 1997. GIS-based multicriteria evaluation for investment environments.
Environment and Planning B: Planning and Design 24, 403±414.
Macdonald, M., 1997. A spatial decision support system for collaborative solid waste planning. In: Craglia, M.,
Couclelis, H. (Eds.), Geographic Information Research: Bridging the Atlantic. Taylor & Francis, London, UK, pp.
510±522.
Malczewski, J., 1996. A GIS-based approach to multiple criteria group decision-making. International Journal of
Geographical Information Systems 10, 955±997.
Maniezzo, I., Mendes, I., Paruccini, M., 1998. Decision support for siting problems. Decision Support Systems 23, 273±
284.
Pereira, J.M.C., Duckstein, L., 1993. A multiple criteria decision-making approach to GIS-based land suitability
evaluation. International Journal of Geographical Information Systems 7, 407±424.
Roy, J.R., Anderson, M., 1988. Assessing impacts of retail development and redevelopment. In: Taylor, M.A.P.,
Sharpe, R. (Eds.), Desktop Planning: Microcomputer Applications for Infrastructure & Services Planning &
Management. Newton Hargreen Publishing Company, Melbourne, Australia, pp. 172±179.
Sprague, R.H., 1989. A framework for the development of decision support systems. In: Sprague, R.H., Watson, H.J.
(Eds.), Decision Support Systems: Putting Theory Into Practice. Prentice-Hall, London, pp. 9±35.
Sprague Jr., R.H., Carlson, J.E.D., 1982. Building E�ective Decision Support Systems. Prentice-Hall, New Jersey, US.
Thill, J.C., 1999. Spatial Multicriteria Decision-Making and Analysis: A Geographic Information Sciences Approach.
Ashgate, Aldershot, UK.
380 T.A. Arentze, H.J.P. Timmermans / Transportation Research Part C 8 (2000) 361±380