a soil mechanics approach to study soil compaction …pub_off/lectures/lns018/12dias.pdfa soil...
TRANSCRIPT
A Soil Mechanics Approach to Study Soil Compaction and Traffic Effect on the Preconsolidation Pressure of
Tropical Soils
Moacir de Souza Dias Junior∗
Soil Science Department, Federal University of Lavras, Brazil
Lectures given at the College on Soil Physics
Trieste, 3 – 21 March 2003
LNS0418012
A Soil Mechanics Approach to Study Soil Compaction 113
A SOIL MECHANICS APPROACH TO STUDY SOIL COMPACTION Introduction The intensive use of the soil without moisture control has been causing dissemination of the soil compaction (Pedrotti and Dias Junior, 1996), due to the increase of the traffic of agricultural machines through the year (Hill and Meza-Montalvo, 1990; Muller et al., 1990), causing in consequence, a reduction of the productivity in the areas of intense traffic (Stone, 1987). Soil compaction has been identified as one of the leading problem causing soil degradation (Canillas and Salokhe, 2002). Different soil uses has been altering the physical and mechanical soil properties (Barnes et al., 1971; Gupta et al., 1985; Larson et al., 1989; Soane and van Ouwerkerk, 1994; Dias Junior and Pierce, 1996ab, Dias Junior and Miranda, 2000, Horn et al., 2000; Dias Junior, 2000), causing soil compaction and restricting root penetration due to the insufficient root turgor pressure to overcome the mechanical resistance of the soil (Gysi, 2001). Soil compaction increase bulk density and soil strength (Taylor, 1971; Lebert et al., 1989; Hill and Meza-Montalvo, 1990; Lebert and Horn, 1991; Dias Junior et al., 1999, Arvidsson, 2001; Ishaq et al., 2001); decrease total porosity, size and continuity of the pores (Hillel, 1982; Smucker and Erickson, 1989; Servadio et al., 2001) and limit nutrient uptake, water infiltration and redistribution, gas exchange, seedling emergency and root development (Tardieu, 1988; Smucker and Erickson, 1989; Bicki and Siemens, 1991; Dürr and Aubertot, 2000, Arvidsson, 2001; Ishaq et al., 2001) resulting in decreased yields (Arvidsson, 2001; Radford et al., 2001; Dauda and Samari, 2002), increased erosion and increased power requirement for tillage (Stone, 1987, Canillas and Salokhe, 2002). In tropical conditions, the soil compaction process has been occurring in annual crops due to tillage and harvest operation is carried out when the soil surface is wetter than optimal for wheel traffic (Silva et al., 1986, Dias Junior, 1997); in pasture, due to the excessive trampling of the cattle (Kondo and Dias Junior, 1999) and in forest areas due to the traffic of the harvest operations and wood transport under inadequate soil water conditions (Dias Junior et al., 1999; Dias Junior, 2000).
On the other hand, with the standardization of specific legislation regarding the use of natural resources, the companies involved in this activity type, should adapt their activities in a way to match sustainable development, avoiding therefore, the degradation of their areas. Thus, a consensus of which soil physics or mechanics property should be used as a universal indicator of soil structure sustainability is needed. Gupta and Raper (1994), suggested that there is a scarcity of reliable information concerning soil compaction that can be widely used to develop guidelines to determine: a) the maximum pressure a specific soil can withstand over a range of water content and b) the range of applied stresses and moisture contents that are conducive to excessive soil compaction.
M. de Souza Dias Junior 114
In spite of this, there are evidences in literature indicating that preconsolidation pressure or precompression stress (σp) is an indication of soil strength (Arvidsson, 2001) and of the maximum previously applied stress sustained by a soil and defines the limit of elastic deformation in the soil compression curves (Holtz and Kovacs, 1981, Dias Junior and Pierce, 1995; Defossez and Richard, 2002), and may be used as a quantitative indicator of soil structure sustainability (Dias Junior et al., 1999) and to estimate, root growth (Römkens and Miller, 1971). Thus, in agriculture, application of stress greater than the precompression stress should be avoid (Gupta et al., 1989; Lebert and Horn, 1991; Defossez and Richard, 2002). Therefore, changes in σp as a function of moisture content is important for root growth and also to assess the load support capacity of the soil. Although, several researchers (Barnes et al., 1971; Gupta et al., 1985; Larson et al., 1989; Soane and van Ouwerkerk, 1994; Dias Junior and Pierce, 1996ab, Dias Junior and Miranda, 2000; Horn et al., 2000) had already quantified the soil management effect in the soil physics properties, there is a need for a methodology that predicts the maximum stress that a soil can withstand over a range of water contents without causing soil structure degradation.
Inside of this context, Dias Junior (1994) seeking for a property that might be used as an indicator of soil management sustainability, developed a methodology that may be used to predict: a) the maximum pressure that a specific soil can withstand over a range of water content without additional soil compaction occurs and b) the range of applied stresses and water content that are conducive to additional soil compaction. Therefore, in this notes it will be present the development of this methodology and its application in studies of structure sustainability of some tropical soils. Methodology Development
The soil compression curves obtained from laboratory compressibility test
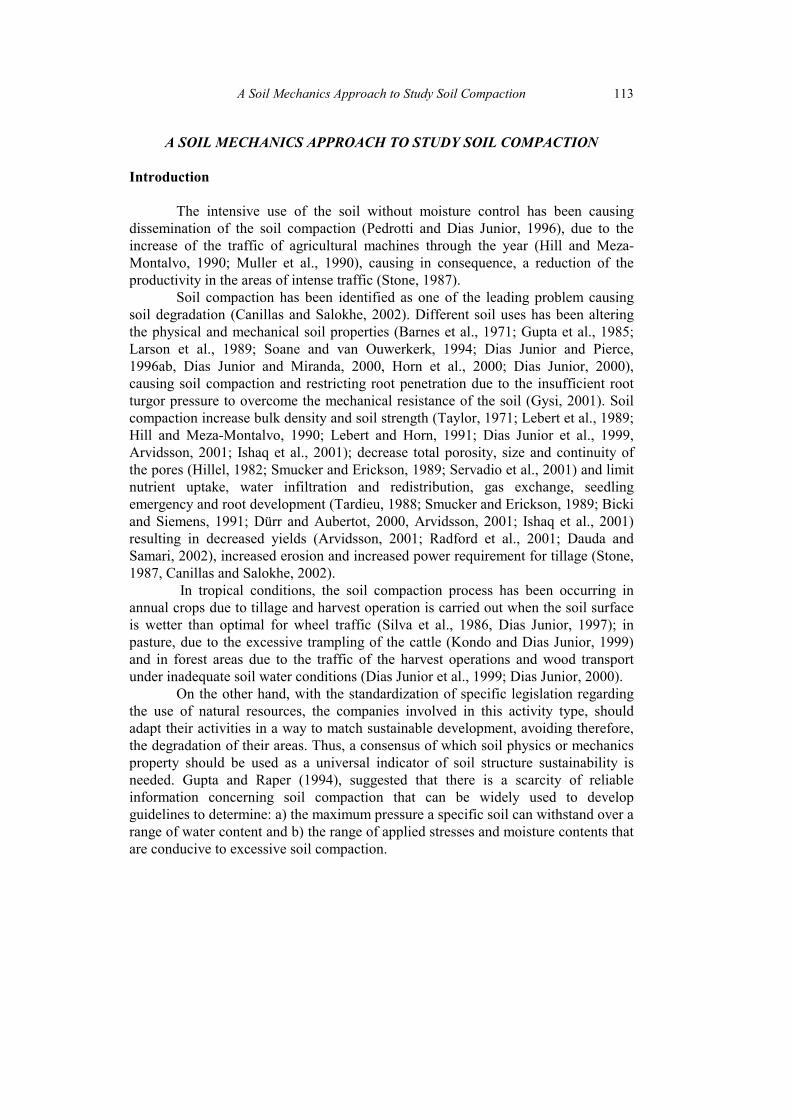
are frequently used in compaction studies (Larson et al., 1980; Larson and Gupta, 1980; Bingner and Wells, 1992; O'Sullivan, 1992; MacNabb and Boersma, 1993; Dias Junior, 1994; Dias Junior and Pierce, 1996ab; Canarache et al., 2000). These curves describe the relationship between the logarithm of the applied pressure and bulk density or void ratio (Casagrande, 1936; Leonards, 1962; Holtz and Kovacs, 1981). The precompression stress divides the soil compression curves into a region of small, elastic and recoverable deformation (secondary compression curve) that defines soil management history and a region of plastic and unrecoverable deformation (virgin compression curve) (Holtz and Kovacs, 1981; Jamiolkowski et al., 1985; Gupta et al, 1989; Lebert and Horn, 1991; Dias Junior and Pierce, 1995; Canarache et al., 2000) (Figure 1). Thus the development of this methodology was based on the soil compression curve.
A Soil Mechanics Approach to Study Soil Compaction 115
Log Applied Pressure
PrecompressionStress
Secondary Compressioncurve
(Elastic Deformation)
Virgin CompressionCurve
(Plastic Deformation)
Figure 1. Soil compression curve. Source: Dias Junior (1994).
σ (kPa)10 100 1000 10000
1,4
1,6
1,8
σp
U (kg kg-1)
0.19
0.24
0.12
0.05
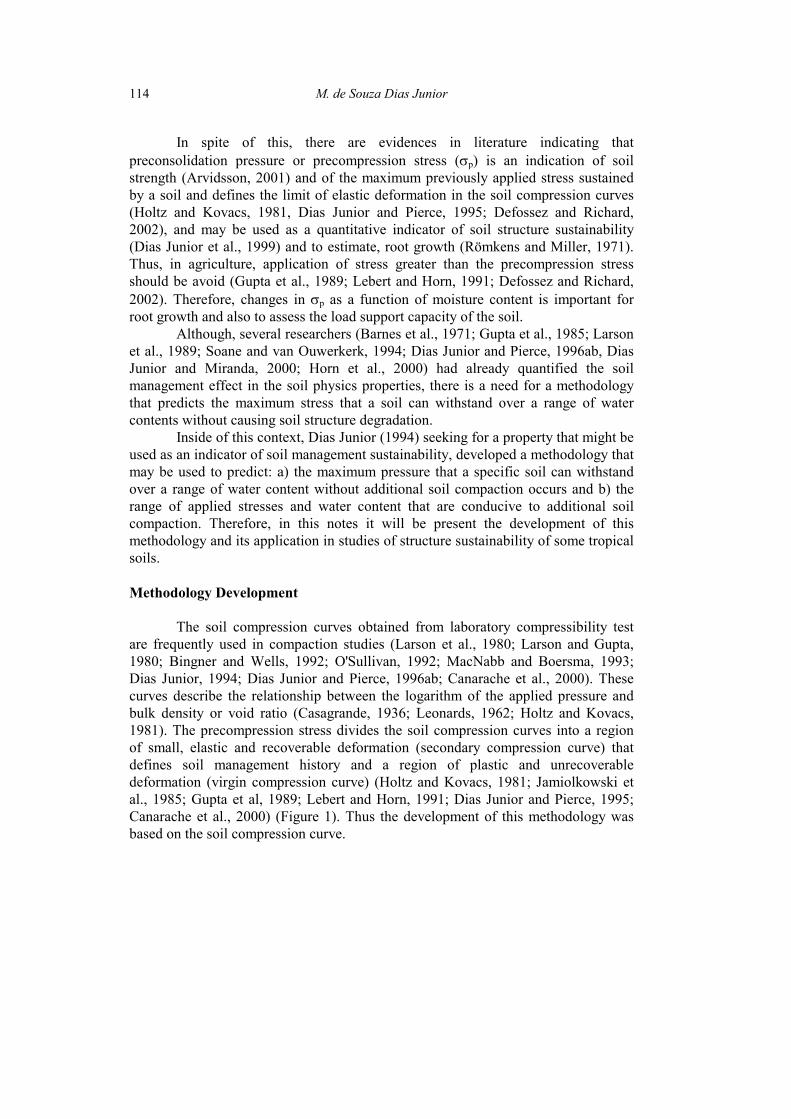
Figure 2. Soil compression curves at different moisture content (U). The dotted line indicates
the precompression stress. Source: Dias Junior (1994).
M. de Souza Dias Junior 116
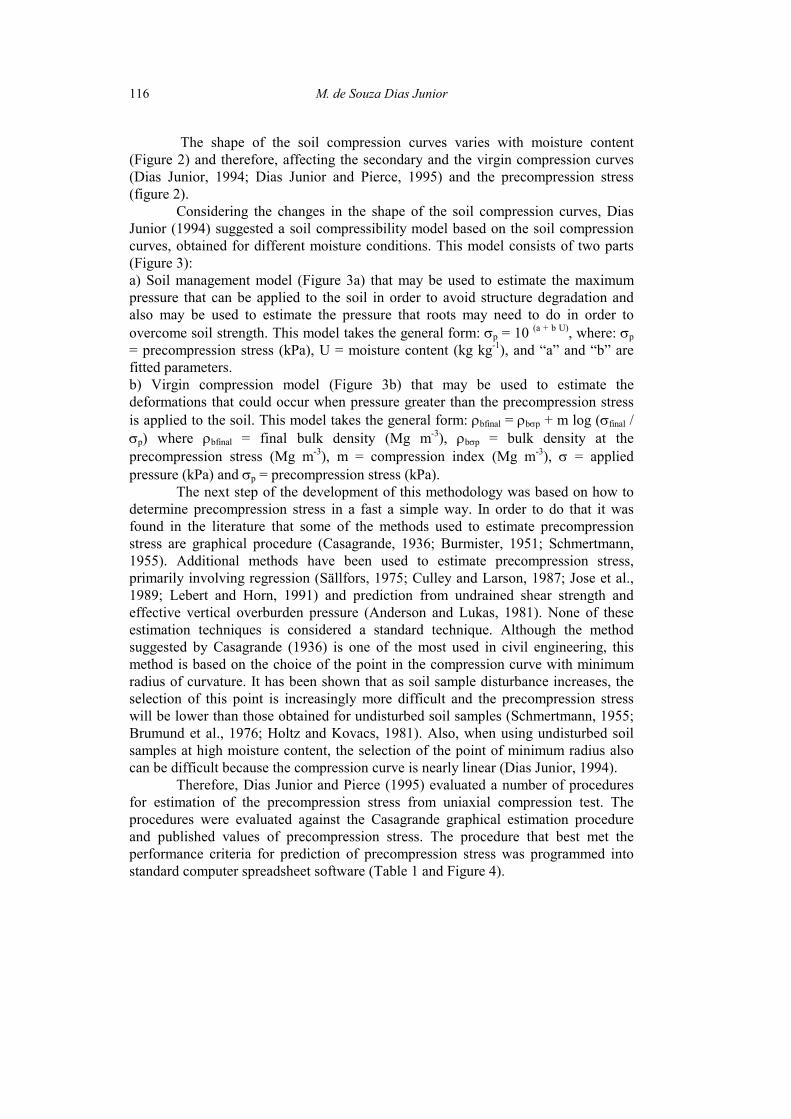
The shape of the soil compression curves varies with moisture content (Figure 2) and therefore, affecting the secondary and the virgin compression curves (Dias Junior, 1994; Dias Junior and Pierce, 1995) and the precompression stress (figure 2).
Considering the changes in the shape of the soil compression curves, Dias Junior (1994) suggested a soil compressibility model based on the soil compression curves, obtained for different moisture conditions. This model consists of two parts (Figure 3): a) Soil management model (Figure 3a) that may be used to estimate the maximum pressure that can be applied to the soil in order to avoid structure degradation and also may be used to estimate the pressure that roots may need to do in order to overcome soil strength. This model takes the general form: σp = 10 (a + b U), where: σp = precompression stress (kPa), U = moisture content (kg kg-1), and “a” and “b” are fitted parameters. b) Virgin compression model (Figure 3b) that may be used to estimate the deformations that could occur when pressure greater than the precompression stress is applied to the soil. This model takes the general form: ρbfinal = ρbσp + m log (σfinal / σp) where ρbfinal = final bulk density (Mg m-3), ρbσp = bulk density at the precompression stress (Mg m-3), m = compression index (Mg m-3), σ = applied pressure (kPa) and σp = precompression stress (kPa).
The next step of the development of this methodology was based on how to determine precompression stress in a fast a simple way. In order to do that it was found in the literature that some of the methods used to estimate precompression stress are graphical procedure (Casagrande, 1936; Burmister, 1951; Schmertmann, 1955). Additional methods have been used to estimate precompression stress, primarily involving regression (Sällfors, 1975; Culley and Larson, 1987; Jose et al., 1989; Lebert and Horn, 1991) and prediction from undrained shear strength and effective vertical overburden pressure (Anderson and Lukas, 1981). None of these estimation techniques is considered a standard technique. Although the method suggested by Casagrande (1936) is one of the most used in civil engineering, this method is based on the choice of the point in the compression curve with minimum radius of curvature. It has been shown that as soil sample disturbance increases, the selection of this point is increasingly more difficult and the precompression stress will be lower than those obtained for undisturbed soil samples (Schmertmann, 1955; Brumund et al., 1976; Holtz and Kovacs, 1981). Also, when using undisturbed soil samples at high moisture content, the selection of the point of minimum radius also can be difficult because the compression curve is nearly linear (Dias Junior, 1994).
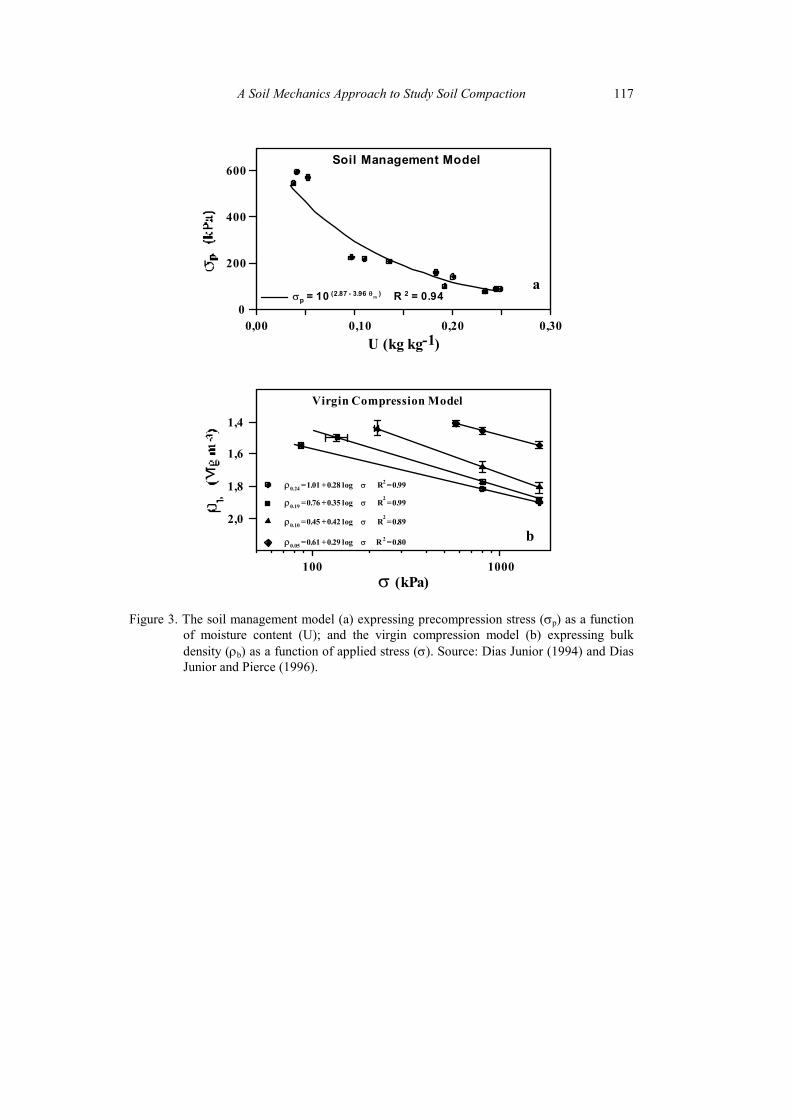
Therefore, Dias Junior and Pierce (1995) evaluated a number of procedures for estimation of the precompression stress from uniaxial compression test. The procedures were evaluated against the Casagrande graphical estimation procedure and published values of precompression stress. The procedure that best met the performance criteria for prediction of precompression stress was programmed into standard computer spreadsheet software (Table 1 and Figure 4).
A Soil Mechanics Approach to Study Soil Compaction 117
U (kg kg-1)0,00 0,10 0,20 0,30
0
200
400
600
σ (kPa)100 1000
1,4
1,6
1,8
2,0
Soil Management Model
σp = 10 (2.87 - 3.96 θm ) R 2 = 0.94
ρ0.24 = 1.01 + 0.28 log σ R2 = 0.99
ρ0.19 = 0.76 + 0.35 log σ R2 = 0.99
ρ0.10 = 0.45 + 0.42 log σ R2 = 0.89
ρ0.05 = 0.61 + 0.29 log σ R 2 = 0.80
Virgin Compression Model
a
b
Figure 3. The soil management model (a) expressing precompression stress (σp) as a function
of moisture content (U); and the virgin compression model (b) expressing bulk density (ρb) as a function of applied stress (σ). Source: Dias Junior (1994) and Dias Junior and Pierce (1996).
M. de Souza Dias Junior 118
Table 1. Spreadsheet for determination of the precompression stress (σp) from soil compression curves. Source: Dias Junior and Pierce (1995).
Stress Log Stress ρb ρb vcc ρb reg
25 1.3979 1.3905 1.2897 1.3845 50 1.6960 1.4444 1.3825 1.4502
100 2.0000 1.5097 1.5160 1.5160 200 2.3010 1.5878 1.5681 1.5847 400 2.6021 1.6712 1.6609 1.6474 800 2.9031 1.7537 1.7537 1.7131
1600 3.2041 1.8465 1.8465 Method 1 (Suction < 100 kPa) Method 3 (Suction > 100 kPa)
σp = 151 kPa σp = 238 kPa ρb = 1,53 Mg m-3 ρb = 1,61 Mg m-3
Applied Pressure (kPa)10 100 1000 10000
Bul
k D
ensi
ty (M
g m
-3)
0,8
1,0
1,2
1,4
1,6
1,8
2,0
Soil compression curve
Virgin compression lineLine that passes through the first two points- Regression line fitted to the first four points
σp - 1
σp - 3
Figure 4. Computer screen of the soil compression curve showing the precompression
stress(σp) obtained using method 1 and method 3. Source: Dias Junior (1994).
A Soil Mechanics Approach to Study Soil Compaction 119
TRAFFIC EFFECT ON THE PRECONSOLIDATION PRESSURE OF TROPICAL SOILS Evaluation of the susceptibility of soil management systems to compaction
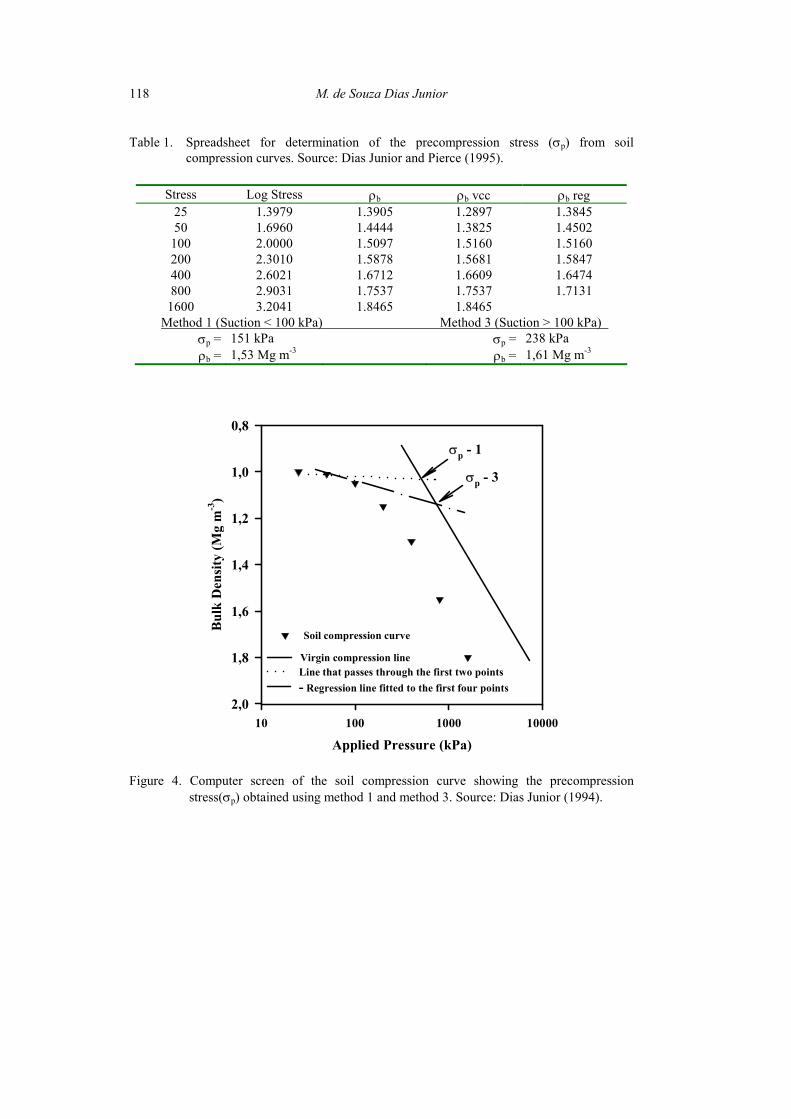
Kondo and Dias Junior (1997 and 1999) evaluated the changes in the precompression stress as a function of the moisture content of a Red-Yellow Latosol (Oxisol) under annual crop, cultivated pasture and native forest. The undisturbed soil samples were taken randomly at 0-3 cm depth. According to figure 5, it was observed a shifting for the region of lower pressure of the curve of precompression stress as a function of moisture content for the annual crop in relation of the curve of native forest, which is due to the destruction of soil structure by the tillage tools, suggesting therefore, greater soil susceptibility to compaction of the soil under annual crop. For the cultivated pasture, the precompression stress was greater than for the annual crop and the native forest, evidencing the influence of the trampling of the cattle on the compaction of the soil surface.
U (kg kg-1)
0,00 0,10 0,20 0,30 0,40
σ p (k
Pa)
200
400
600
Annual crop σp=10 (2,69-1,63U) R2=0,69
Native Forest σp = 10 (2,87-2,25U) R2=0,85
Pasture σp = 10 (2,91-2,21U) R2=0,82
Red-Yellow Latosol0 - 3 cm
PLSL
Figure 5. Relationship between precompression stress (σp) and moisture content (U) for a
Red-Yellow Latosol at 0-3 cm depth, for annual crop, native forest and cultivated pasture. SL = Shrinkage limit, PL = Plastic limit. Source: Kondo and Dias Junior (1997 and 1999).
M. de Souza Dias Junior 120
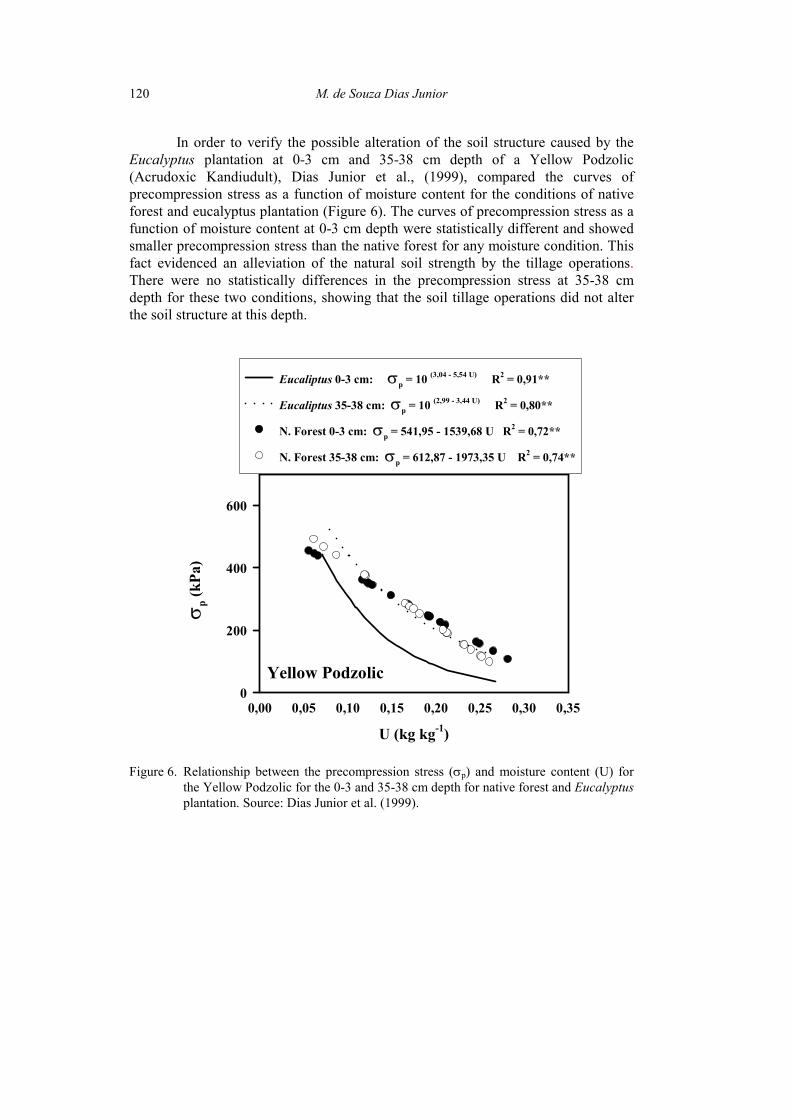
In order to verify the possible alteration of the soil structure caused by the Eucalyptus plantation at 0-3 cm and 35-38 cm depth of a Yellow Podzolic (Acrudoxic Kandiudult), Dias Junior et al., (1999), compared the curves of precompression stress as a function of moisture content for the conditions of native forest and eucalyptus plantation (Figure 6). The curves of precompression stress as a function of moisture content at 0-3 cm depth were statistically different and showed smaller precompression stress than the native forest for any moisture condition. This fact evidenced an alleviation of the natural soil strength by the tillage operations. There were no statistically differences in the precompression stress at 35-38 cm depth for these two conditions, showing that the soil tillage operations did not alter the soil structure at this depth.
U (kg kg-1)
0,00 0,05 0,10 0,15 0,20 0,25 0,30 0,35
σp (
kPa)
0
200
400
600
Eucaliptus 0-3 cm: σp = 10 (3,04 - 5,54 U) R2 = 0,91**
Eucaliptus 35-38 cm: σp = 10 (2,99 - 3,44 U) R2 = 0,80**
N. Forest 0-3 cm: σp = 541,95 - 1539,68 U R2 = 0,72**
N. Forest 35-38 cm: σp = 612,87 - 1973,35 U R2 = 0,74**
Yellow Podzolic
Figure 6. Relationship between the precompression stress (σp) and moisture content (U) for
the Yellow Podzolic for the 0-3 and 35-38 cm depth for native forest and Eucalyptus plantation. Source: Dias Junior et al. (1999).
A Soil Mechanics Approach to Study Soil Compaction 121
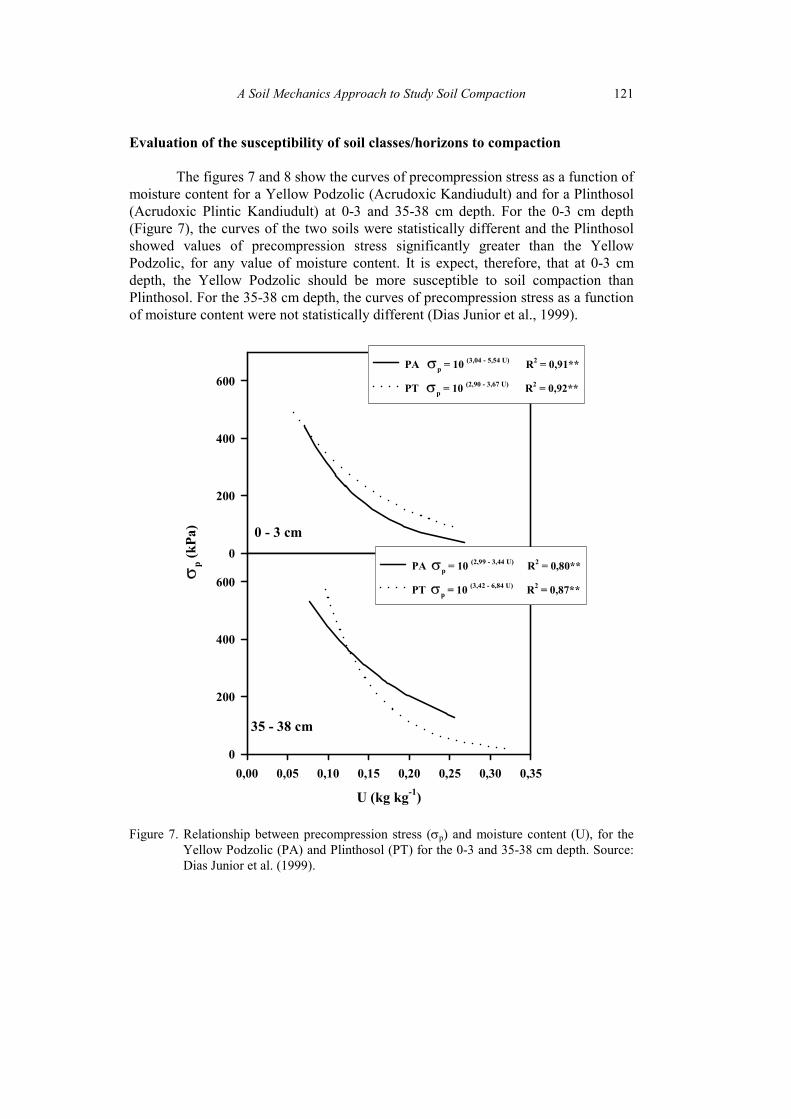
Evaluation of the susceptibility of soil classes/horizons to compaction The figures 7 and 8 show the curves of precompression stress as a function of moisture content for a Yellow Podzolic (Acrudoxic Kandiudult) and for a Plinthosol (Acrudoxic Plintic Kandiudult) at 0-3 and 35-38 cm depth. For the 0-3 cm depth (Figure 7), the curves of the two soils were statistically different and the Plinthosol showed values of precompression stress significantly greater than the Yellow Podzolic, for any value of moisture content. It is expect, therefore, that at 0-3 cm depth, the Yellow Podzolic should be more susceptible to soil compaction than Plinthosol. For the 35-38 cm depth, the curves of precompression stress as a function of moisture content were not statistically different (Dias Junior et al., 1999).
σp (
kPa)
0
200
400
600PA σp = 10 (3,04 - 5,54 U) R2 = 0,91**
PT σp = 10 (2,90 - 3,67 U) R2 = 0,92**
0 - 3 cm
U (kg kg-1)
0,00 0,05 0,10 0,15 0,20 0,25 0,30 0,350
200
400
600PA σp = 10 (2,99 - 3,44 U) R2 = 0,80**
PT σp = 10 (3,42 - 6,84 U) R2 = 0,87**
35 - 38 cm
Figure 7. Relationship between precompression stress (σp) and moisture content (U), for the
Yellow Podzolic (PA) and Plinthosol (PT) for the 0-3 and 35-38 cm depth. Source: Dias Junior et al. (1999).
M. de Souza Dias Junior 122
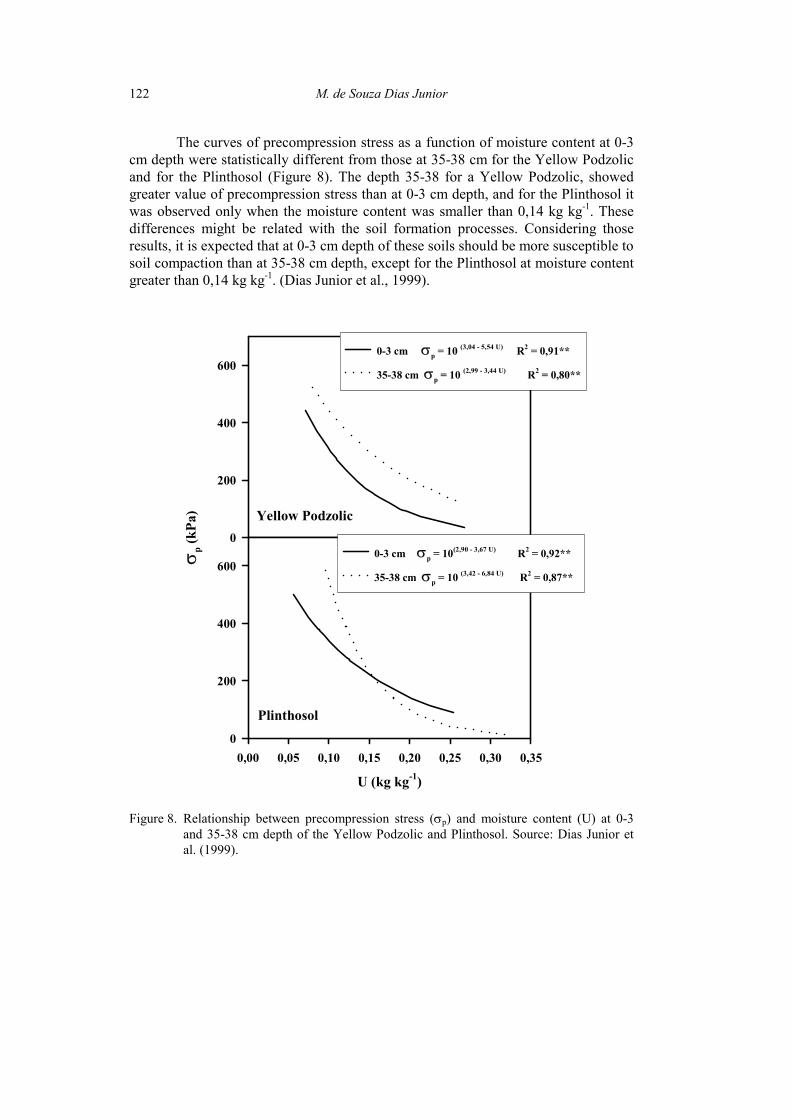
The curves of precompression stress as a function of moisture content at 0-3 cm depth were statistically different from those at 35-38 cm for the Yellow Podzolic and for the Plinthosol (Figure 8). The depth 35-38 for a Yellow Podzolic, showed greater value of precompression stress than at 0-3 cm depth, and for the Plinthosol it was observed only when the moisture content was smaller than 0,14 kg kg-1. These differences might be related with the soil formation processes. Considering those results, it is expected that at 0-3 cm depth of these soils should be more susceptible to soil compaction than at 35-38 cm depth, except for the Plinthosol at moisture content greater than 0,14 kg kg-1. (Dias Junior et al., 1999).
σp (
kPa)
0
200
400
6000-3 cm σp = 10 (3,04 - 5,54 U) R2 = 0,91**
35-38 cm σp = 10 (2,99 - 3,44 U) R2 = 0,80**
Yellow Podzolic
U (kg kg-1)
0,00 0,05 0,10 0,15 0,20 0,25 0,30 0,350
200
400
6000-3 cm σp = 10(2,90 - 3,67 U) R2 = 0,92**
35-38 cm σp = 10 (3,42 - 6,84 U) R2 = 0,87**
Plinthosol
Figure 8. Relationship between precompression stress (σp) and moisture content (U) at 0-3
and 35-38 cm depth of the Yellow Podzolic and Plinthosol. Source: Dias Junior et al. (1999).
A Soil Mechanics Approach to Study Soil Compaction 123
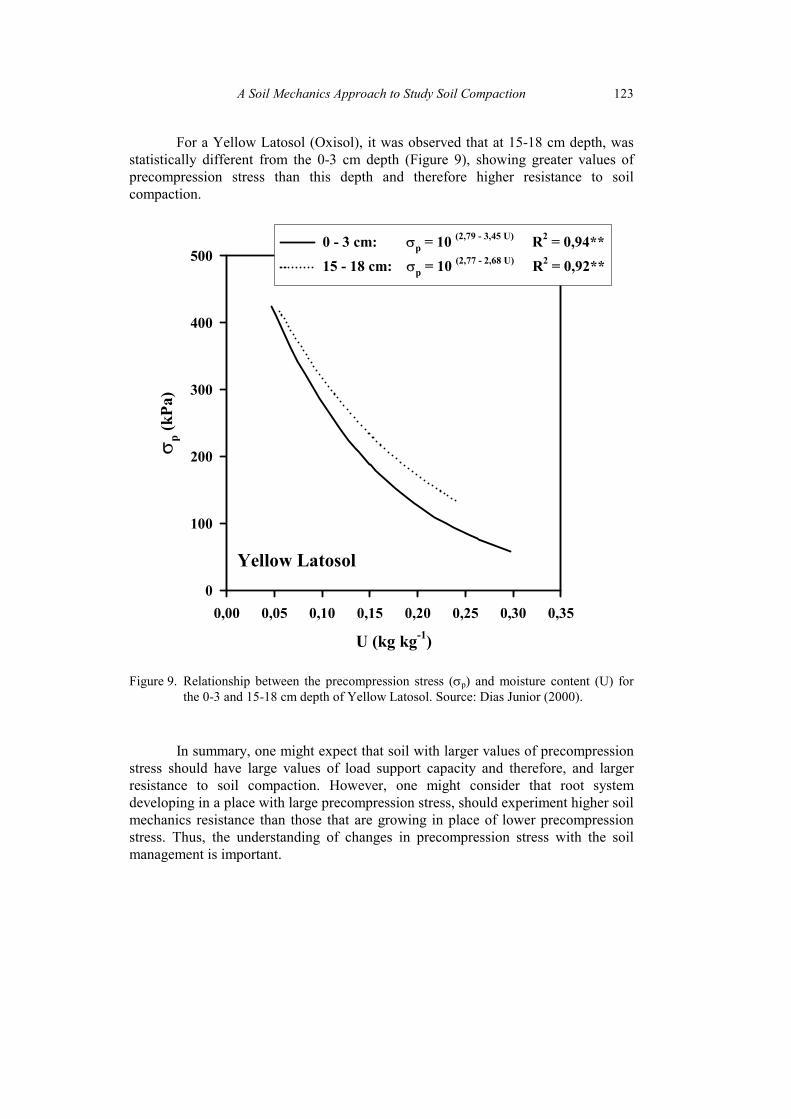
For a Yellow Latosol (Oxisol), it was observed that at 15-18 cm depth, was statistically different from the 0-3 cm depth (Figure 9), showing greater values of precompression stress than this depth and therefore higher resistance to soil compaction.
U (kg kg-1)
0,00 0,05 0,10 0,15 0,20 0,25 0,30 0,35
σ p (kP
a)
0
100
200
300
400
5000 - 3 cm: σp = 10 (2,79 - 3,45 U) R2 = 0,94**15 - 18 cm: σp = 10 (2,77 - 2,68 U) R2 = 0,92**
Yellow Latosol
Figure 9. Relationship between the precompression stress (σp) and moisture content (U) for
the 0-3 and 15-18 cm depth of Yellow Latosol. Source: Dias Junior (2000). In summary, one might expect that soil with larger values of precompression stress should have large values of load support capacity and therefore, and larger resistance to soil compaction. However, one might consider that root system developing in a place with large precompression stress, should experiment higher soil mechanics resistance than those that are growing in place of lower precompression stress. Thus, the understanding of changes in precompression stress with the soil management is important.
M. de Souza Dias Junior 124
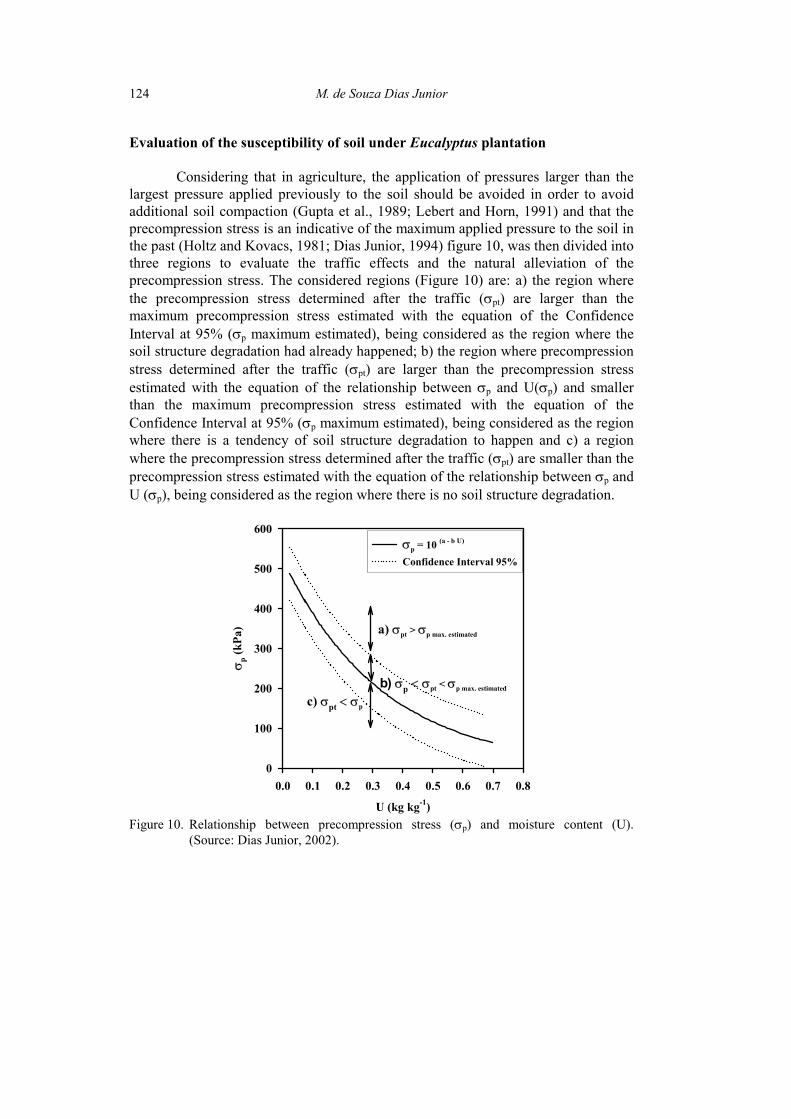
Evaluation of the susceptibility of soil under Eucalyptus plantation
Considering that in agriculture, the application of pressures larger than the largest pressure applied previously to the soil should be avoided in order to avoid additional soil compaction (Gupta et al., 1989; Lebert and Horn, 1991) and that the precompression stress is an indicative of the maximum applied pressure to the soil in the past (Holtz and Kovacs, 1981; Dias Junior, 1994) figure 10, was then divided into three regions to evaluate the traffic effects and the natural alleviation of the precompression stress. The considered regions (Figure 10) are: a) the region where the precompression stress determined after the traffic (σpt) are larger than the maximum precompression stress estimated with the equation of the Confidence Interval at 95% (σp maximum estimated), being considered as the region where the soil structure degradation had already happened; b) the region where precompression stress determined after the traffic (σpt) are larger than the precompression stress estimated with the equation of the relationship between σp and U(σp) and smaller than the maximum precompression stress estimated with the equation of the Confidence Interval at 95% (σp maximum estimated), being considered as the region where there is a tendency of soil structure degradation to happen and c) a region where the precompression stress determined after the traffic (σpt) are smaller than the precompression stress estimated with the equation of the relationship between σp and U (σp), being considered as the region where there is no soil structure degradation.
U (kg kg-1)
0.0 0.1 0.2 0.3 0.4 0.5 0.6 0.7 0.8
σ p (kP
a)
0
100
200
300
400
500
600σp = 10 (a - b U) Confidence Interval 95%
a) σpt > σp max. estimated
b) σp < σpt < σp max. estimated
c) σpt < σp
Figure 10. Relationship between precompression stress (σp) and moisture content (U).
(Source: Dias Junior, 2002).
A Soil Mechanics Approach to Study Soil Compaction 125
With the standardization of specific legislation regarding the exploration of natural resources, the companies involved in this type of activity are alert about the problems that their mechanical activities can cause to the soil structure. Therefore, they are interested in obtain answer to questions such as: a) Any increase in soil bulk density values means additional soil compaction? b) Which soil class is more susceptible to soil compaction? c) Which harvest machinery can cause more soil compaction? d) What is the influence of harvest operations in A and B-horizons? Thus, the studies conducted in this area should consider as an attempt to find some answer for those question, in a way to contribute with the sustainability of the areas of Eucalyptus exploration.
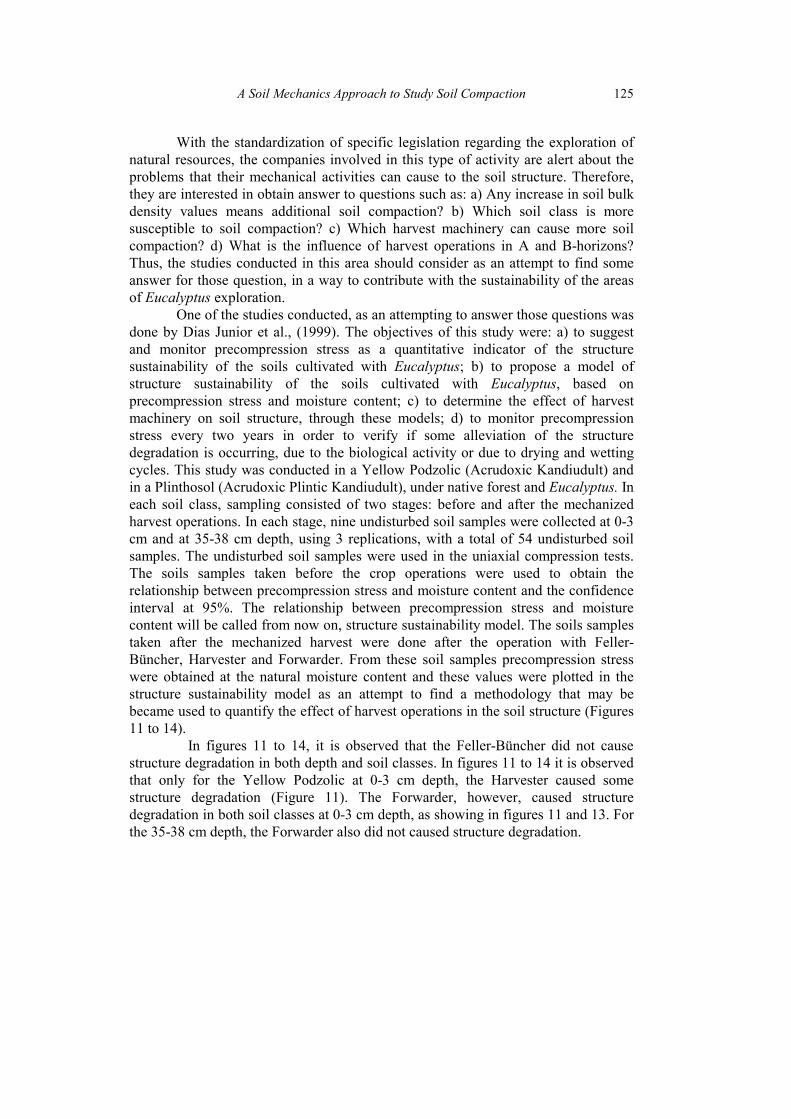
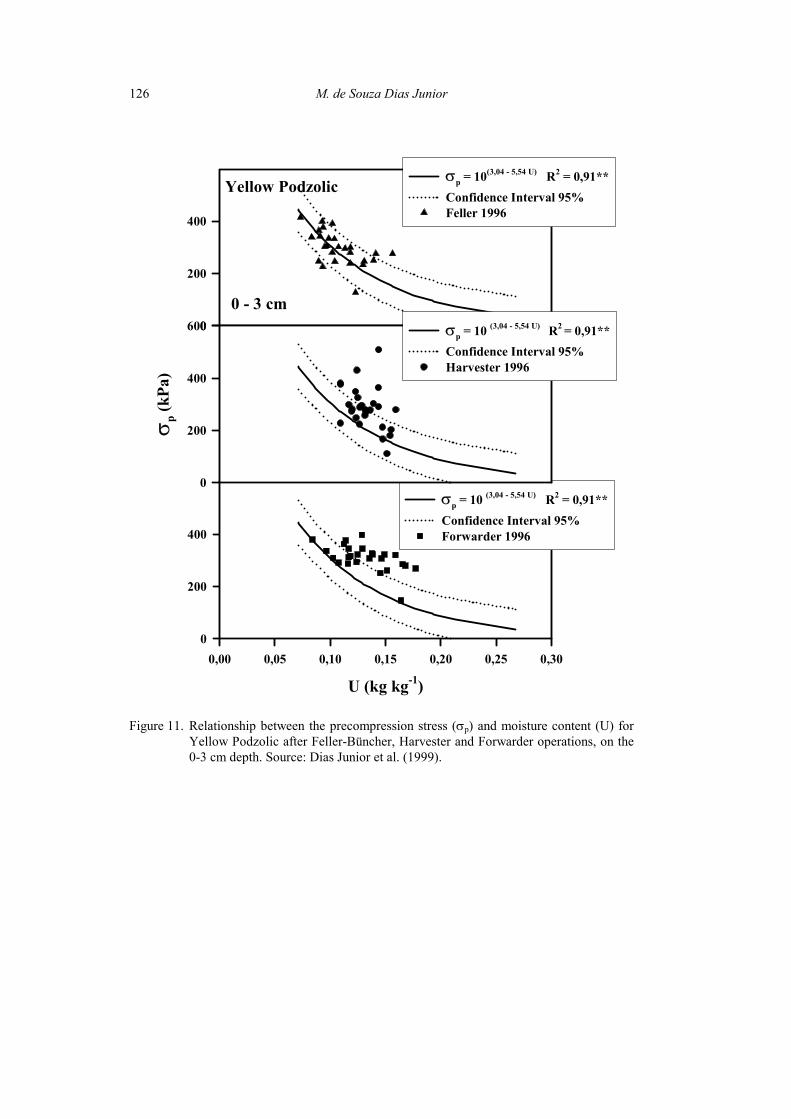
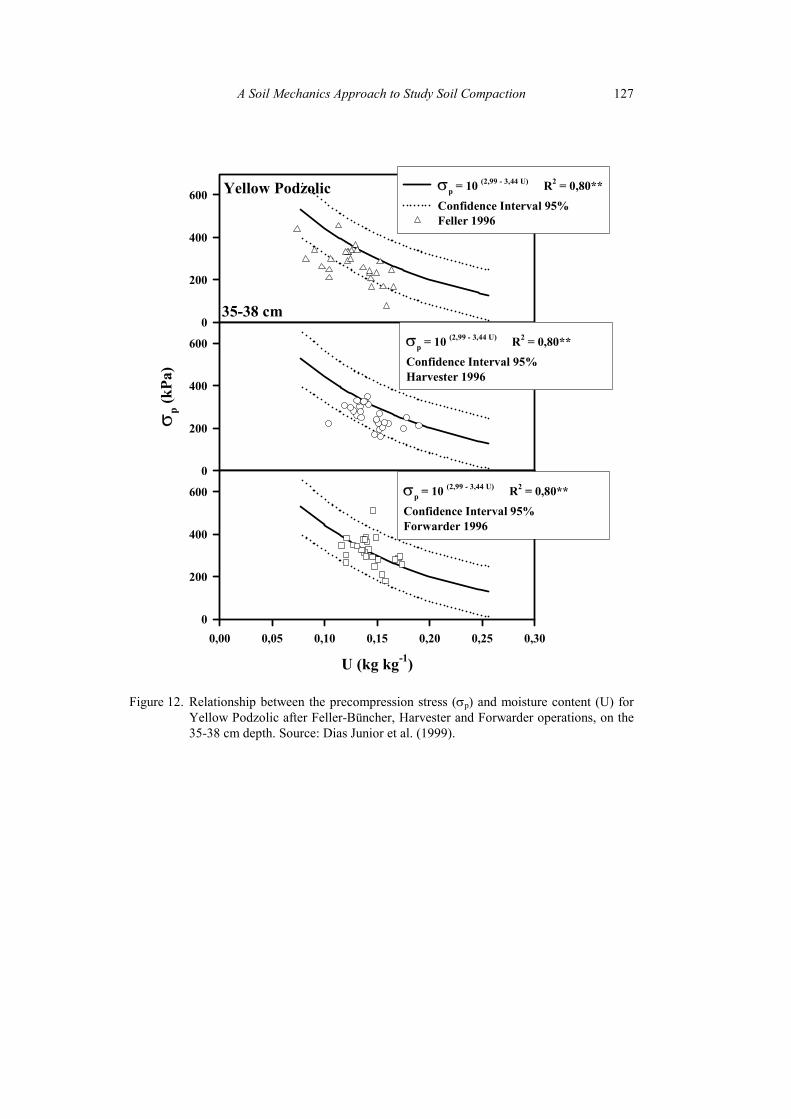
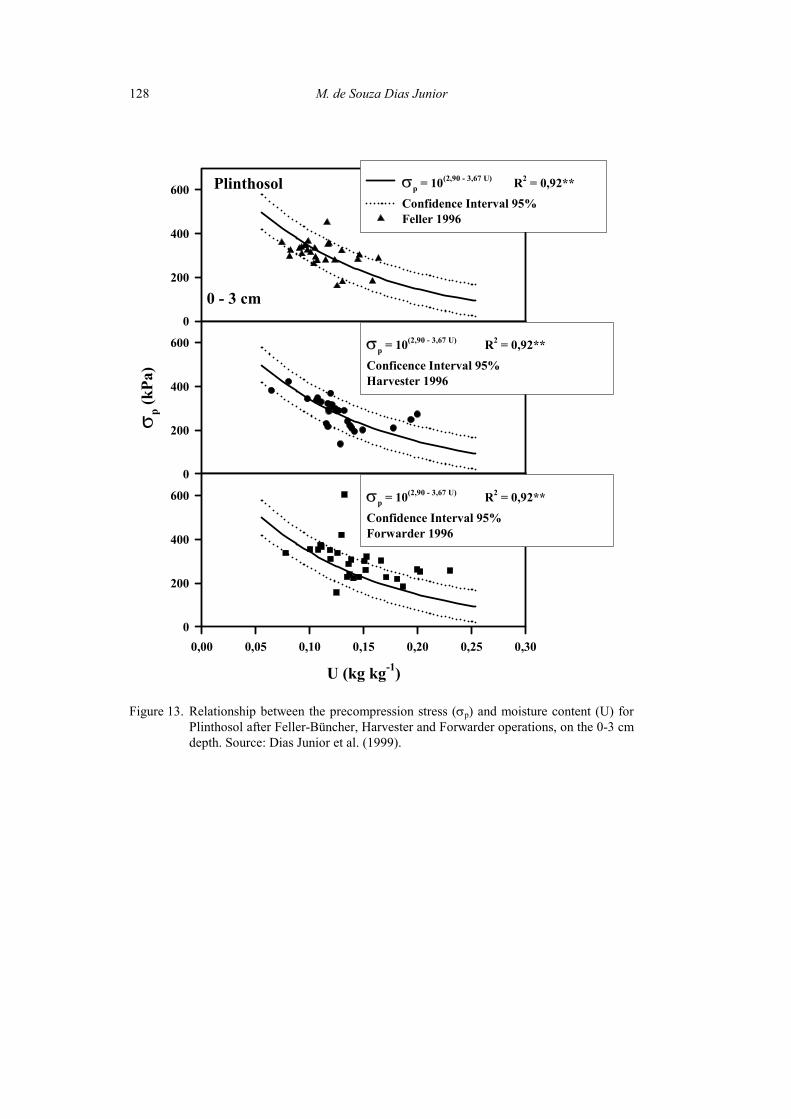
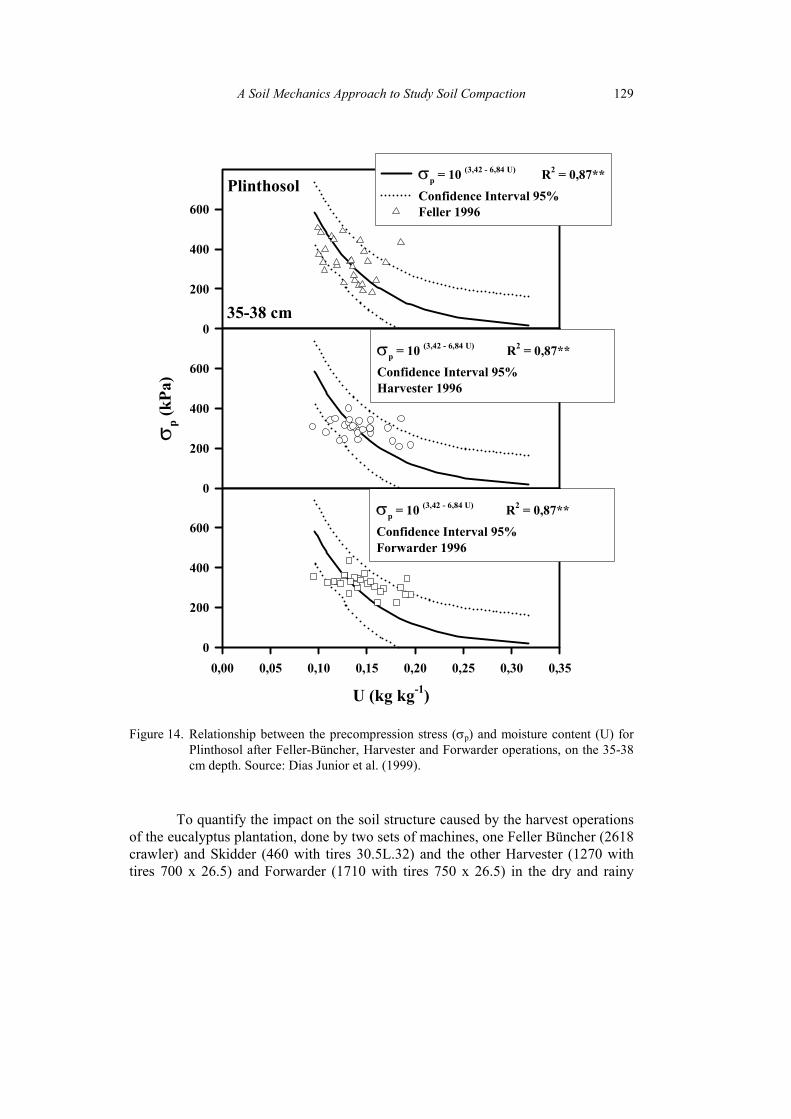
One of the studies conducted, as an attempting to answer those questions was done by Dias Junior et al., (1999). The objectives of this study were: a) to suggest and monitor precompression stress as a quantitative indicator of the structure sustainability of the soils cultivated with Eucalyptus; b) to propose a model of structure sustainability of the soils cultivated with Eucalyptus, based on precompression stress and moisture content; c) to determine the effect of harvest machinery on soil structure, through these models; d) to monitor precompression stress every two years in order to verify if some alleviation of the structure degradation is occurring, due to the biological activity or due to drying and wetting cycles. This study was conducted in a Yellow Podzolic (Acrudoxic Kandiudult) and in a Plinthosol (Acrudoxic Plintic Kandiudult), under native forest and Eucalyptus. In each soil class, sampling consisted of two stages: before and after the mechanized harvest operations. In each stage, nine undisturbed soil samples were collected at 0-3 cm and at 35-38 cm depth, using 3 replications, with a total of 54 undisturbed soil samples. The undisturbed soil samples were used in the uniaxial compression tests. The soils samples taken before the crop operations were used to obtain the relationship between precompression stress and moisture content and the confidence interval at 95%. The relationship between precompression stress and moisture content will be called from now on, structure sustainability model. The soils samples taken after the mechanized harvest were done after the operation with Feller-Büncher, Harvester and Forwarder. From these soil samples precompression stress were obtained at the natural moisture content and these values were plotted in the structure sustainability model as an attempt to find a methodology that may be became used to quantify the effect of harvest operations in the soil structure (Figures 11 to 14). In figures 11 to 14, it is observed that the Feller-Büncher did not cause structure degradation in both depth and soil classes. In figures 11 to 14 it is observed that only for the Yellow Podzolic at 0-3 cm depth, the Harvester caused some structure degradation (Figure 11). The Forwarder, however, caused structure degradation in both soil classes at 0-3 cm depth, as showing in figures 11 and 13. For the 35-38 cm depth, the Forwarder also did not caused structure degradation.
M. de Souza Dias Junior 126
0
200
400
σp = 10(3,04 - 5,54 U) R2 = 0,91**Confidence Interval 95%Feller 1996
Yellow Podzolic
0 - 3 cm
U (kg kg-1)
0,00 0,05 0,10 0,15 0,20 0,25 0,300
200
400
σp = 10 (3,04 - 5,54 U) R2 = 0,91**Confidence Interval 95%Forwarder 1996
σ p (k
Pa)
0
200
400
600 σp = 10 (3,04 - 5,54 U) R2 = 0,91**Confidence Interval 95%Harvester 1996
Figure 11. Relationship between the precompression stress (σp) and moisture content (U) for
Yellow Podzolic after Feller-Büncher, Harvester and Forwarder operations, on the 0-3 cm depth. Source: Dias Junior et al. (1999).
A Soil Mechanics Approach to Study Soil Compaction 127
0
200
400
600σp = 10 (2,99 - 3,44 U) R2 = 0,80**Confidence Interval 95%Feller 1996
Yellow Podzolicσ p (
kPa)
0
200
400
600
U (kg kg-1)
0,00 0,05 0,10 0,15 0,20 0,25 0,300
200
400
600
35-38 cm
σp = 10 (2,99 - 3,44 U) R2 = 0,80**Confidence Interval 95%Forwarder 1996
σp = 10 (2,99 - 3,44 U) R2 = 0,80**Confidence Interval 95%Harvester 1996
Figure 12. Relationship between the precompression stress (σp) and moisture content (U) for
Yellow Podzolic after Feller-Büncher, Harvester and Forwarder operations, on the 35-38 cm depth. Source: Dias Junior et al. (1999).
M. de Souza Dias Junior 128
0
200
400
600 σp = 10(2,90 - 3,67 U) R2 = 0,92**
Confidence Interval 95%Feller 1996
Plinthosol
σ p (kP
a)
0
200
400
600
0 - 3 cm
U (kg kg-1)
0,00 0,05 0,10 0,15 0,20 0,25 0,300
200
400
600
σp = 10(2,90 - 3,67 U) R2 = 0,92**
Conficence Interval 95%Harvester 1996
σp = 10(2,90 - 3,67 U) R2 = 0,92**
Confidence Interval 95%Forwarder 1996
Figure 13. Relationship between the precompression stress (σp) and moisture content (U) for
Plinthosol after Feller-Büncher, Harvester and Forwarder operations, on the 0-3 cm depth. Source: Dias Junior et al. (1999).
A Soil Mechanics Approach to Study Soil Compaction 129
0
200
400
600
σp = 10 (3,42 - 6,84 U) R2 = 0,87**Confidence Interval 95%Feller 1996
Plinthosolσ p (
kPa)
0
200
400
600
35-38 cm
U (kg kg-1)
0,00 0,05 0,10 0,15 0,20 0,25 0,30 0,350
200
400
600σp = 10 (3,42 - 6,84 U) R2 = 0,87**Confidence Interval 95%Forwarder 1996
σp = 10 (3,42 - 6,84 U) R2 = 0,87**Confidence Interval 95%Harvester 1996
Figure 14. Relationship between the precompression stress (σp) and moisture content (U) for
Plinthosol after Feller-Büncher, Harvester and Forwarder operations, on the 35-38 cm depth. Source: Dias Junior et al. (1999).
To quantify the impact on the soil structure caused by the harvest operations of the eucalyptus plantation, done by two sets of machines, one Feller Büncher (2618 crawler) and Skidder (460 with tires 30.5L.32) and the other Harvester (1270 with tires 700 x 26.5) and Forwarder (1710 with tires 750 x 26.5) in the dry and rainy
M. de Souza Dias Junior 130
seasons, a experiment was conducted in a Red Yellow Latosol (Oxisol) at 0.10-0.125 m depth. The results of this experiment are showed in table 2.
Table 2. Precompression stress induced by Feller Büncher (2618 de crawler) and Skidder (460
with tires 30.5L.32), and Harvester (1270 tires 700x26.5) and Forwarder (1710 with tires 750x26.5) in a Red Yellow Latosol, at 0.10-0.125 m depth. (Source: Dias Junior, 2002b)
Harvest machines σpt
1> σp max est2
Dry season Rainy season ∆ (%)
Feller Büncher and Skidder 5 15 200 Harvester and Forwarder 8 31 287
∆ (%) 60 106 1 – Pressure applied by the harvest machines, 2 – Precompression stress estimated with the equation of the confidence interval at 95%. Table 2, shows that the harvest operations performed with Harvester and Forwarder in the dry season, increased the precompression stress values in 60% in relation to the precompression stress induced by Feller Büncher and Skidder and in the rainy season this increase was 106%. In addition, the precompression stress induced by Feller Büncher and Skidder, and Harvester and Forwarder increased in 200% and 287%, respectively, when the harvest operations were performed in the rainy season. Although, the operations performed with Harvester and Forwarder caused more soil structure degradation, one might consider that the traffic done with Harvester and Forwarder is located, while the traffic done with Feller Büncher and Skidder is random and could consequently, disseminate the compaction in the whole area. Assessment of the natural alleviation of the precompression stress
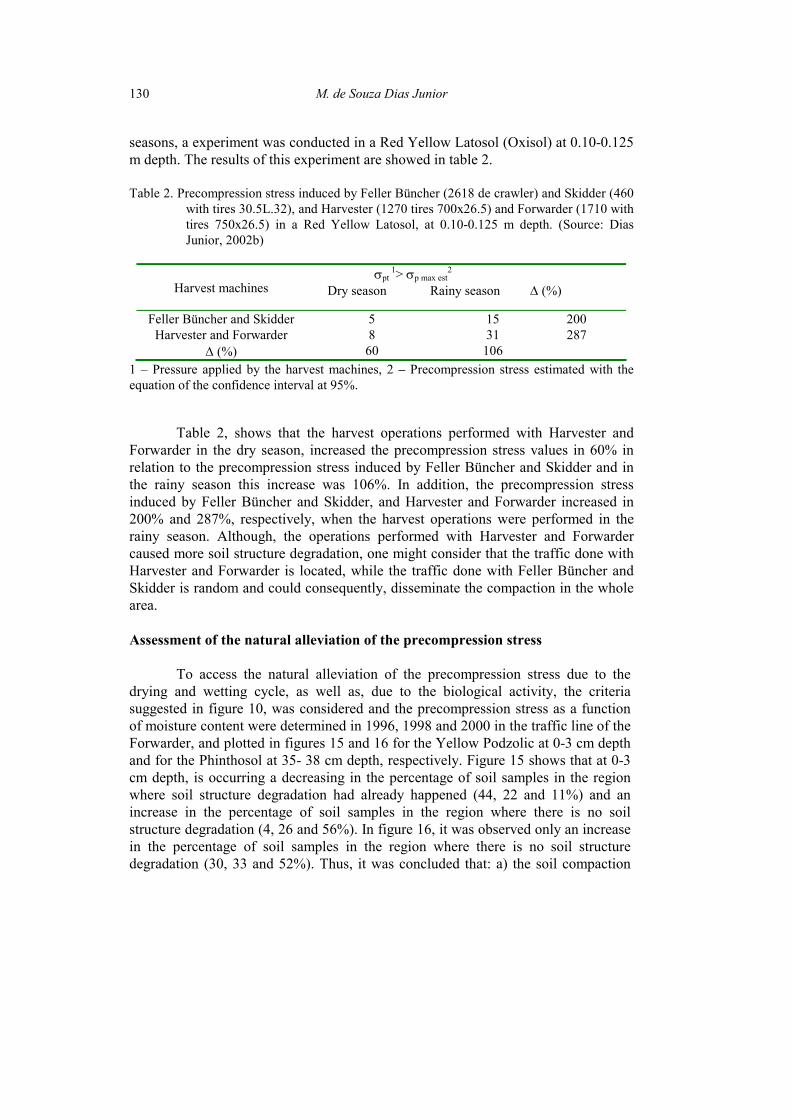
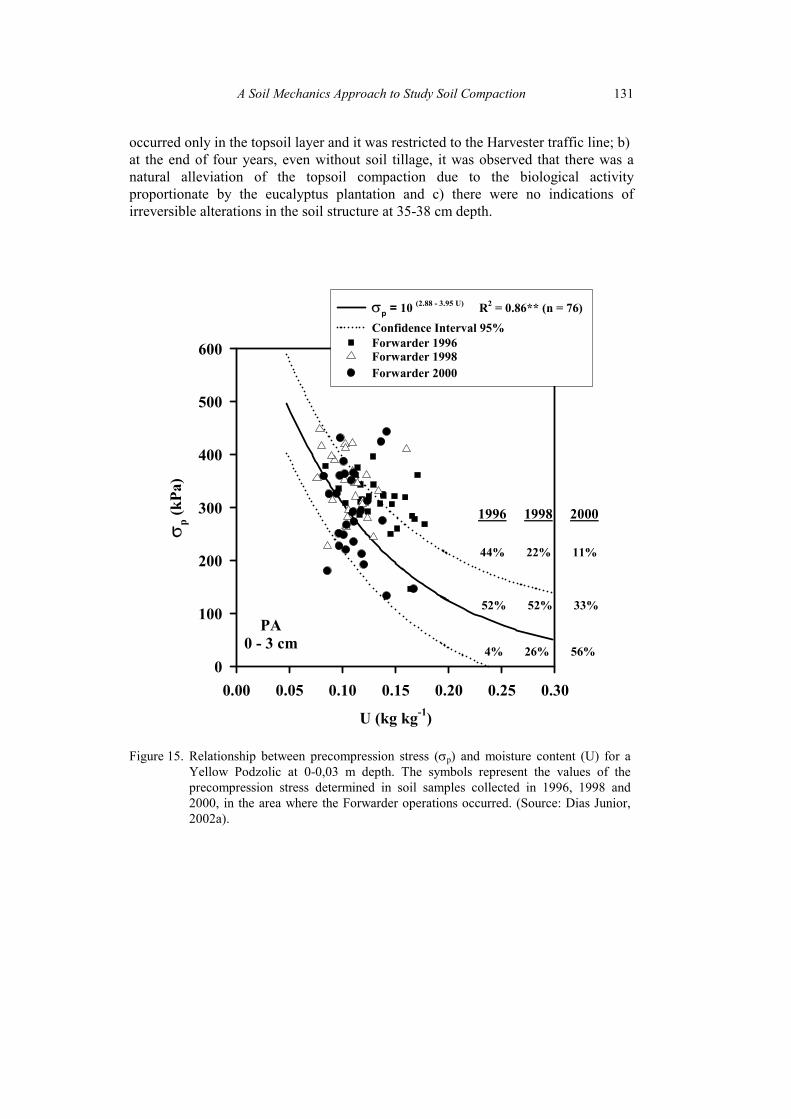
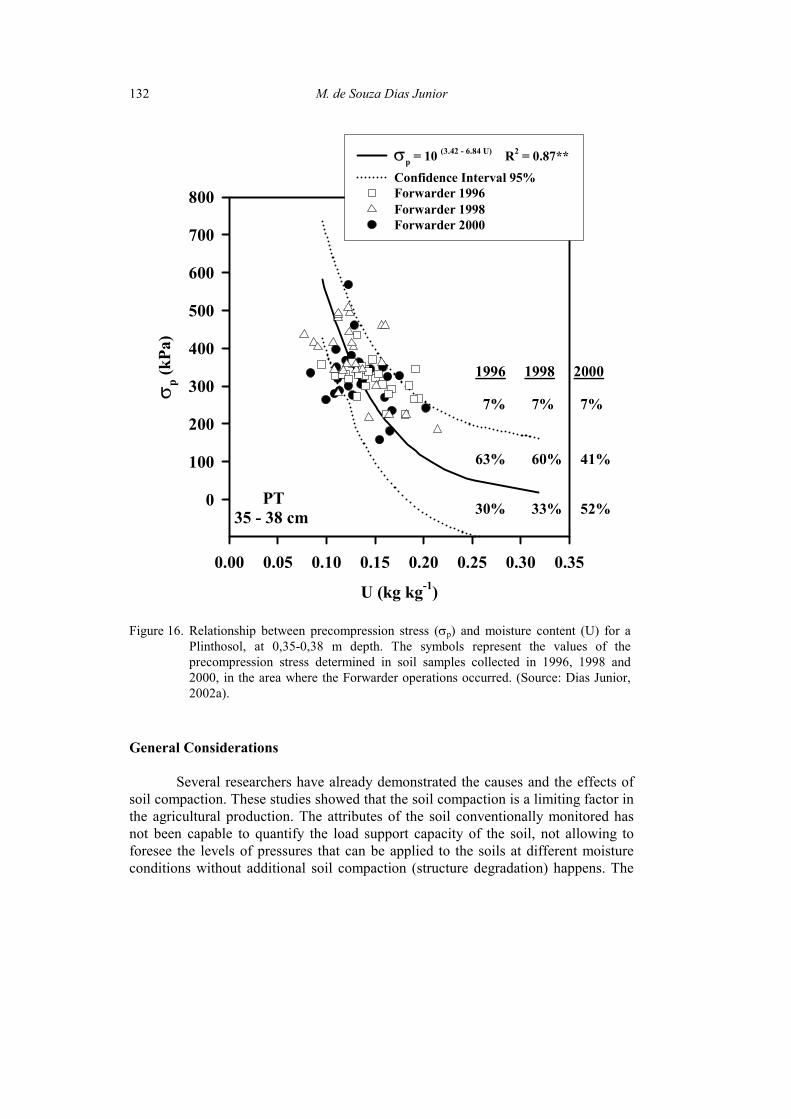
To access the natural alleviation of the precompression stress due to the drying and wetting cycle, as well as, due to the biological activity, the criteria suggested in figure 10, was considered and the precompression stress as a function of moisture content were determined in 1996, 1998 and 2000 in the traffic line of the Forwarder, and plotted in figures 15 and 16 for the Yellow Podzolic at 0-3 cm depth and for the Phinthosol at 35- 38 cm depth, respectively. Figure 15 shows that at 0-3 cm depth, is occurring a decreasing in the percentage of soil samples in the region where soil structure degradation had already happened (44, 22 and 11%) and an increase in the percentage of soil samples in the region where there is no soil structure degradation (4, 26 and 56%). In figure 16, it was observed only an increase in the percentage of soil samples in the region where there is no soil structure degradation (30, 33 and 52%). Thus, it was concluded that: a) the soil compaction
A Soil Mechanics Approach to Study Soil Compaction 131
occurred only in the topsoil layer and it was restricted to the Harvester traffic line; b) at the end of four years, even without soil tillage, it was observed that there was a natural alleviation of the topsoil compaction due to the biological activity proportionate by the eucalyptus plantation and c) there were no indications of irreversible alterations in the soil structure at 35-38 cm depth.
U (kg kg-1)
0.00 0.05 0.10 0.15 0.20 0.25 0.30
σ p (kP
a)
0
100
200
300
400
500
600
PA 0 - 3 cm
1996 1998 2000
44% 22% 11%
52% 52% 33%
4% 26% 56%
σp = 10 (2.88 - 3.95 U) R2 = 0.86** (n = 76) Confidence Interval 95%Forwarder 1996Forwarder 1998Forwarder 2000
Figure 15. Relationship between precompression stress (σp) and moisture content (U) for a Yellow Podzolic at 0-0,03 m depth. The symbols represent the values of the precompression stress determined in soil samples collected in 1996, 1998 and 2000, in the area where the Forwarder operations occurred. (Source: Dias Junior, 2002a).
M. de Souza Dias Junior 132
U (kg kg-1)
0.00 0.05 0.10 0.15 0.20 0.25 0.30 0.35
σ p (kP
a)
0
100
200
300
400
500
600
700
800
PT35 - 38 cm
1996 1998 2000
7% 7% 7%
63% 60% 41%
30% 33% 52%
σp = 10 (3.42 - 6.84 U) R2 = 0.87**Confidence Interval 95%
Forwarder 2000
Forwarder 1996Forwarder 1998
Figure 16. Relationship between precompression stress (σp) and moisture content (U) for a Plinthosol, at 0,35-0,38 m depth. The symbols represent the values of the precompression stress determined in soil samples collected in 1996, 1998 and 2000, in the area where the Forwarder operations occurred. (Source: Dias Junior, 2002a).
General Considerations
Several researchers have already demonstrated the causes and the effects of soil compaction. These studies showed that the soil compaction is a limiting factor in the agricultural production. The attributes of the soil conventionally monitored has not been capable to quantify the load support capacity of the soil, not allowing to foresee the levels of pressures that can be applied to the soils at different moisture conditions without additional soil compaction (structure degradation) happens. The
A Soil Mechanics Approach to Study Soil Compaction 133
researches done in the soil compressive behavior of some tropical soils indicate that the precompression stress may be used as an alternative measure of the load support capacity and as a quantitative indicator of the structure sustainability of the tropical soils. References Anderson, T.C. and Lukas, R.G. Precompression stress predicted using Su/p’ ratio.
1981. In: Yong, R.N. and Townsend, F.C., eds. Laboratory shear strength of soil. Symposium of the ASTM. p.502-515. (Spec. Tech. Pub., 740).
Arvidsson, J., 2001. Subsoil compaction caused by heavy sugarbeet harvesters in southern Sweden I. Soil physical properties and crop yield in six field experiments. Soil Till. Res. 60, 67-78.
Barnes, K.K; Carleton, W.M.; Taylor, H.M.; Throckmorton, R.I. and Vanden Berg, G.E. 1971. Compaction of agricultural soils. Am. Soc. Agric. Eng. Monogr., St. Joseph, 471p.
Bicki, T.J., and Siemens, J.C., 1991. Crop response to wheel traffic soil compaction. Trans. Am. Soc. Agric. Eng., 34, 909-913.
Bingner, R.L.; and Wells, L.G., 1992. Compact - a reclamation soil compaction model part I. model development. Trans. Am. Soc. Agric. Eng., 35: 405-413.
Brumund, W.F.; Jonas, E. and Ladd, C.C., 1976. Estimating in situ maximum past (preconsolidation) pressure of saturated clays from results of laboratory consolidometer test. In: Transportation Research Board, National Research Council. Estimation of Consolidation Settlement. Special Report 163. National Academy of Science. Washington, DC, pp. 4-12.
Burmister, D., 1951. The application of controlled test methods in consolidation testing. In: Fifty -Four Annual Meeting of the ASTM. Symposium on Consolidation Testing of Soils. Special Technical Publication 126. Atlantic City, NJ. 18 June 1951, Philadelphia, PA, pp. 83-98.
Canarache, A.; Horn, R. and Colibas, I., 2000. Compressibility of soils in a long term field experiment with intensive deep ripping in Romania. Soil Till. Res. 56, 185-196.
Canillas, E. C. and Salokhe, V. M., 2002. A decision support system for compaction assessment in agricultural soils. Soil Till. Res. 65, 221-230.
Casagrande, A., 1936. The determination of the pre-consolidation load and its practical significance. In: Int. Conf. on Soil Mech. and Found. Eng., Proc. of the ICSMFE. Cambridge, MA, 22-26 June 1936. Col. 3. Cambridge, MA, pp. 60-64.
Culley, J.L.B. and Larson, W.E., 1987. Susceptibility to compression of a clay loam Haplaquoll. Soil Sci. Soc. Am. J., 51, 562-567.
M. de Souza Dias Junior 134
Dauda, A. and Samari, A., 2002. Cowpea yield response to soil compaction under trator on a sandy loam soil in the semi-arid region of northern Nigeria. Soil Till. Res. 68, 17-22.
Defossez, P. and Richard, G., 2002. Models of soil compaction due to traffic and their evaluation. Soil Till. Res. 67, 41-64.
Dias Junior, M. S., 1994. Compression of three soils under long-term tillage and wheel traffic. Ph.D Thesis, Michigan State University.
Dias Junior, M. S., 2000. Compactação do solo. In R.F. Novais; V.H. Alvarez V and C.E.G.R. Schaefer (Editors). Topics in Soil Science. Soc. Bras. Ci. Solo. pp. 55-94.
Dias Junior, M. S., 2002a. Compactação do solo. Relatório de Pesquisa. Aracruz Celulose S.A. 72pp.
Dias Junior, M. S., 2002b. Avaliação de impactos de sistemas de colheita nas características físicas dos solos. Relatório de Pesquisa. Celulose Nipo-Brasileira S.A.113 pp.
Dias Junior, M.S. 1997. Uso da história de tensão e da variação da umidade como instrumento para evitar a compactação adicional do solo. In: IVO, W.M.P.M.; SILVA, A.A.G.; MOTA, D.M. and FERNANDES, M.F., eds. Workshop sobre avaliação e manejo dos recursos naturais em áreas de exploração de cana-de-açúcar. EMBRAPA, p.67-81.
Dias Junior, M.S. 2000. Compactação do solo. Relatório Técnico. 46p. Dias Junior, M.S., Ferreira, M.M., Fonseca, S., Silva, A.R., Ferreira, D.F., 1999.
Avaliação quantitativa da sustentabilidade estrutural dos solos em sistemas florestais na região de Aracruz – ES. R. Árv., 23, 371-380.
Dias Junior, M. S. and Miranda, E.E.V., 2000. Comportamento da curva de compactação de cinco solos da região de Lavras (MG). Ci. Agrot. 24, 337-346.
Dias Junior, M. S. and Pierce, F.J., 1995. A simple procedure for estimating preconsolidation pressure from soil compression curves. Soil Tech., 8, 139-151.
Dias Junior, M. S. and Pierce, F.J., 1996a. Influência da história de tensão e da umidade na modelagem da compactação do solo. In: V.H. ALVAREZ V; L.E.F. FONTES and M.P.F., FONTES (editors). O solo nos grandes domínios morfoclimáticos do Brasil e o desenvolvimento sustentado. Soc. Bras. Ci. Solo, Viçosa, MG. pp.445-452.
Dias Junior, M. S. and Pierce, F.J., 1996b. Revisão de literatura: O processo de compactação do solo e sua modelagem. R. Bras. Ci. Solo, 20, 175-182.
Dürr, C. and Aubertot, J. N., 2000. Emergence of seedling of sufar beet (Beta vulgairs L.) as affected by aggregate size, roughness and position of aggregates in the seedbed. Plant Soil, 219, 211-220.
Gupta, S.C.; Hadas, A. and Schafer, R.L., 1989. Modeling soil mechanical behavior during compaction. In W.E. Larson; G.R. Blake; R.R Allmaras; W.B. Voorhees and S.C. Gupta (editors). Mechanics and related process in
A Soil Mechanics Approach to Study Soil Compaction 135
structured agricultural soils. NATO Applied Sciences 172. Kluwer Academic Publishers, The Netherlands. pp.137-152.
Gupta, S.C.; Hadas, A.; Voorhees, W.B.; Wolf, D.; Larson, W.E. and Schneider, E.C., 1985. Development of quids for estimating the ease of compaction of world soils. Bet Dagan, Israel. Research Report, Binational Agric. Res. Development, University of Minnesota, 178 pp.
Gupta, S.C. and Raper, R.L. Prediction of soil compaction under vehicles. In: Soane, B.D. and van Ouwerkerk, C., eds. Soil compaction in crop production. Amsterdam, Elsevier, 1994. p.71-90.
Gysi, M., 2001. Compaction of a Eutric Cambisol under heavy wheel traffic in Switzerland: Field data and a critical state soil mechanics model approach. Soil Till. Res. 61, 133-142.
Hill, R.L. and Meza-Montalvo, M., 1990. Long- term wheel traffic effects on soil physical properties under different tillage systems. Soil Sci. Soc. Am. J., 54, 865-870.
Hillel, D., 1982. Introduction to Soil Physics. San Diego, Academic Press, 1982. 364pp.
Holtz, R.D. and Kovacs, W.D., 1981. An introduction to Geotechnical Engineering. Prentice-Hall, Inc., Englewood Cliffs, NJ, 733pp.
Horn, R.; van den Akker, J. J. H. And Arvidsson. J., 2000. Subsoil compaction. Sistribution, processes and consequences. Advances in Geoecology, 32, 462p.
Jamiolkowski, M., Ladd, C. C., Germaine, J. T. and Lancellota, R., 1985. New development in field and laboratory testing of soils. In: Publications Committee of XI ICSMFE (editor). Proc. of the Eleventh Int. Conf. on Soil Mech. and Found. Eng. San Francisco, Ca 12-16 August 1985. Netherlands, pp. 57-153.
Ishaq, M; Ibrahim, M.; Hassan, A.; Saeed, M. and Lal, R., 2001. Subsoil compaction effects on crop in Punjab, Pakistan: II. Root growth and nutrient uptake of wheat and sorghum. Soil Till. Res. 60, 153-161.
Jose, B.T.; Sridharan, A. and Abraham, B.M., 1989. Log-log method for determination of preconsolidation pressure. Geotech. Testing J., 12, 230-237.
Kondo, M.K. and Dias Junior, M.S., 1997. Compressibilidade de um Latossolo Vermelho amarelo sob diferentes usos. Anais do Congresso Brasileiro de Ciência do Solo, 26, Rio de Janeiro, RJ, pp. 26.
Kondo, M.K. and Dias Junior, M.S., 1999. Compressibilidade de três latossolos em função da umidade e uso. R. Bras. Ci. Solo, 23:211-218.
Larson, W.E.; Blake, G.R.; Allmaras, R.R.; Voorhees, W.B. and Gupta, S.C., 1989. Mechanics and related processes in structured agricultural soils. The Netherlands, Kluwer Academic Publishers. 273p. (NATO Applied Science, 172).
M. de Souza Dias Junior 136
Larson, W.E. and Gupta, S.C., 1980. Estimating critical stress in unsaturated soils from changes in pore water pressure during confined compression. Soil Sci. Soc. Am. J. 44, 1127-1132.
Larson, W.E.; Gupta, S.C. and Useche, R. A., 1980. Compression of agricultural soils from eight soil orders. Soil Sci. Soc. Am. J. 44, 450-457.
Lebert, M.; Burger, N. and Horn, R., 1989. Effects of dynamic and static loading on compaction of structured soils. In: W.E. Larson; G.R. Blake; R.R Allmaras; W.B. Voorhees and S.C. Gupta (editors). Mechanics and related process in structured agricultural soils. NATO Applied Sciences 172. Kluwer Academic Publishers, The Netherlands. pp.73-80.
Lebert, M. and Horn, R., 1991. A method to predict the mechanical strength of agricultural soils. Soil Till. Res., 19, 275-286.
Leonards, G.A., 1962. Foundation Engineering. New York, McGraw-Hill Book Company, 1136p.
MacNabb, D.H. and Boersma, L., 1993. Evaluation of the relationship between compressibility and shear strength of Andisols. Soil Sci. Soc. Am. J., 57:923-929.
Muller, L.; Tille, P. and Kretschmer, H., 1990. Trafficability and workability of alluvial clay soils in response to drainage status. Soil Till. Res. 16, 273- 287.
O'Sullivan, M.F., 1992. Uniaxial compaction effects on soil physical properties in relation to soil type and cultivation. Soil Til. Res., 24:275-286.
Pedrotti, A. and Dias Junior, M.S., 1996. Compactação do solo: como evitá-la. Agrop. Catarinense, 9, 50-52.
Radford, B. J.; Yule, D. F.; McGarry, D. and Playford, C., 2001. Crop response to applied soil compaction and to compaction repair treatment. Soil Till. Res. 61, 155-170.
Römkens, M.J.M. and Miller, R.D. 1971. Predicting root size and frequency from one-dimensional consolidation data – A mathematical model. Plant and Soil, 35:237-248.
Sällfors, G., 1975. Preconsolidation pressure of soft high plastic clays. Thesis. Department of Geotechnical Engineering, Gothenburg.
Schmertmann, J.H., 1955. The undisturbed consolidation behavior of clay. Trans. ASCE, 120, 1201-1233.
Servadio, P.; Marsili, A.; Pagliai, M.; Pellegrini., S. and Vignozzi., 2001. Effect on some clay soil qualities following the passage of rubber-tracked and wheeled tractors in central Italy. Soil Till. Res. 61, 143-155.
Silva, A.P. da; Libardi, P.L. and Camargo, O.A. 1986. Influência da compactação nas propriedades físicas de dois latossolos. R. Bras. Ci. Solo, 10:91-95.
Smucker, A.J.M. and Erickson, A.E., 1989. Tillage and compactive modifications of gaseous flow and soil aeration. In: W.E. Larson; G.R. Blake; R.R Allmaras; W.B. Voorhees and S.C. Gupta (editors). Mechanics and related process in structured agricultural soils. NATO Applied Sciences 172. Kluwer Academic Publishers, The Netherlands. pp. 205-221.
A Soil Mechanics Approach to Study Soil Compaction 137
Soane, B.D. and van Ouwerkerk, C., 1994. Soil compaction in crop production. Amsterdam, Elsevier, 660pp.
Stone, J.A., 1987. Compaction and the surface structure of a poorly drained soil. Transaction of the American Society of Agricultural Engineering. St. Joseph, 30, 1370-1373.
Tardieu, F. 1988. Analysis of the spatial variability of maize root density: I. Effect of wheels compaction on the spatial arrangement of roots. Plant Soil, 107,259-266.
Taylor, H.M., 1971. Effects of soil strength on seedling emergence, root growth and crop yield. In: Barnes, K.K.; Carleton, W.M.; Taylor, H.M.; Throckmorton, R.I. and Vanden berg, G.E. eds. Compaction of agricultural soils. St. Joseph. pp. 292-305.(ASAE. Monogr.)