a sageworks report for: sample narrative client · page 1 / 12 sample narrative client narrative...
TRANSCRIPT
Page 1 / 12
Sample Narrative Client Narrative Report
Industry: 333519 - Rolling Mill and Other Metalworking Machinery Manufacturing
Revenue:
$1M - $10M
Periods:
12 months against the same 12 months from the previous year
Prepared by:
Global Tax Management
By:
Jason Feist
Phone:
(513) 206-9673
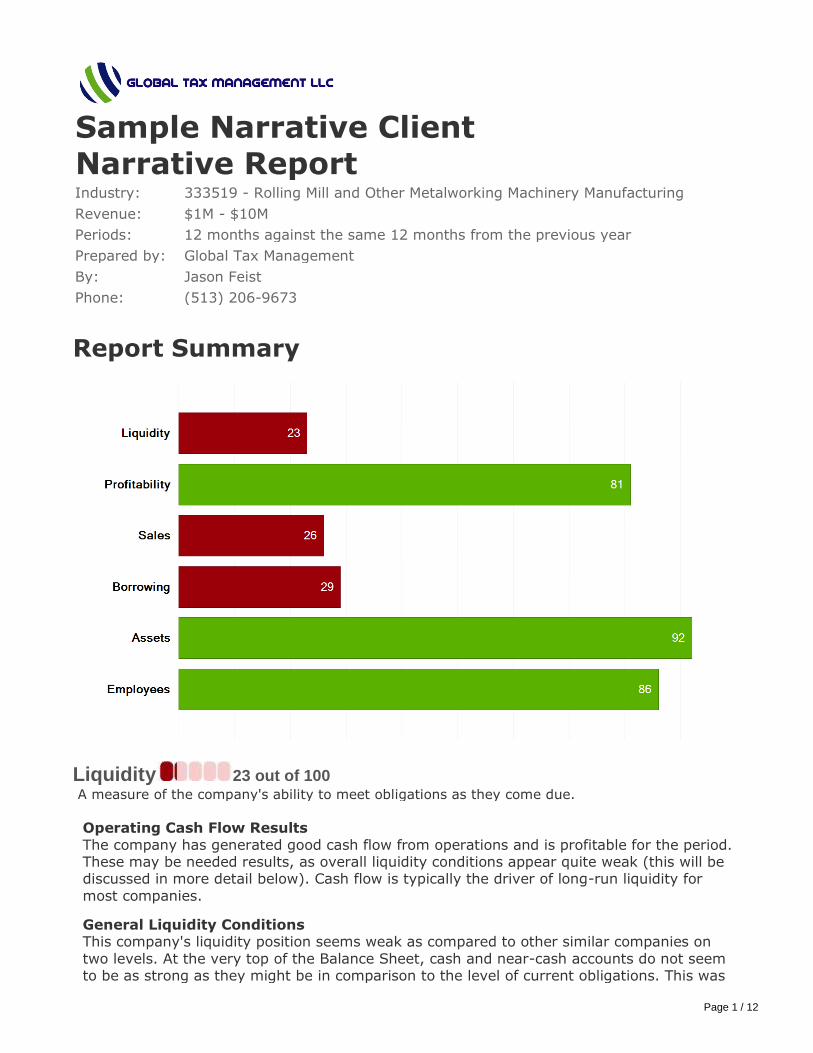
Report Summary
Liquidity 23 out of 100
A measure of the company's ability to meet obligations as they come due.
Operating Cash Flow Results
The company has generated good cash flow from operations and is profitable for the period. These may be needed results, as overall liquidity conditions appear quite weak (this will be discussed in more detail below). Cash flow is typically the driver of long-run liquidity for
most companies.
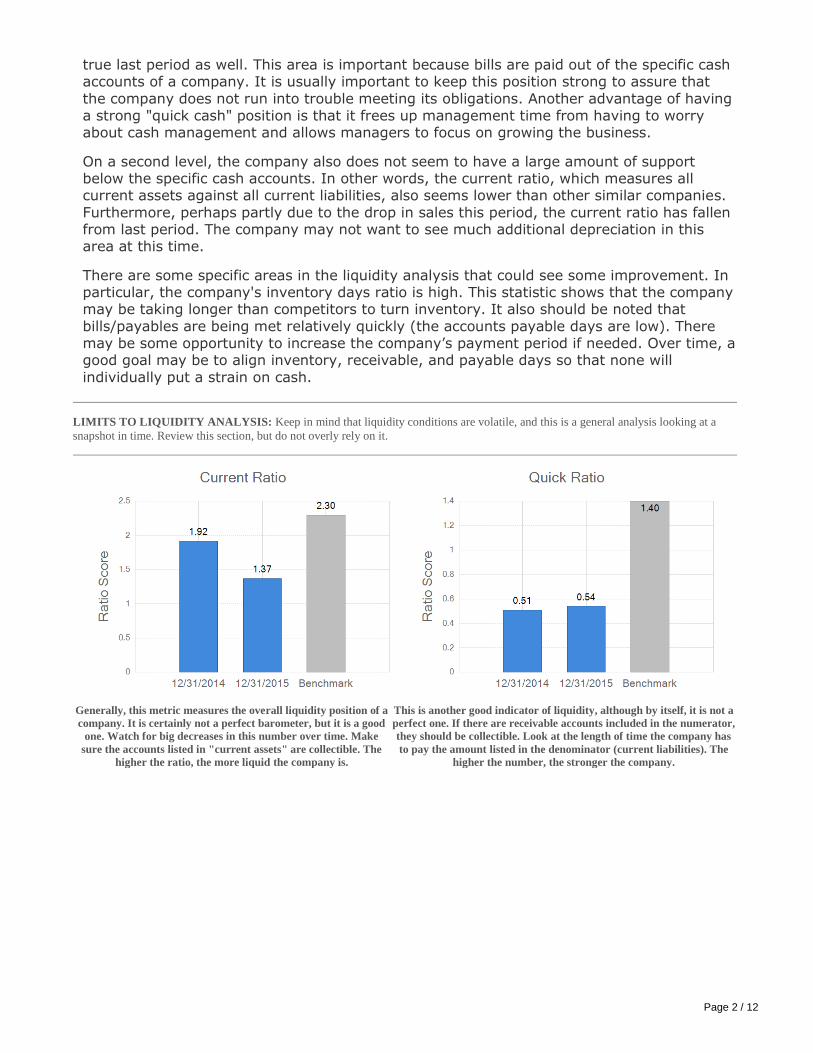
General Liquidity Conditions This company's liquidity position seems weak as compared to other similar companies on
two levels. At the very top of the Balance Sheet, cash and near-cash accounts do not seem to be as strong as they might be in comparison to the level of current obligations. This was
Page 2 / 12
true last period as well. This area is important because bills are paid out of the specific cash accounts of a company. It is usually important to keep this position strong to assure that
the company does not run into trouble meeting its obligations. Another advantage of having a strong "quick cash" position is that it frees up management time from having to worry about cash management and allows managers to focus on growing the business.
On a second level, the company also does not seem to have a large amount of support below the specific cash accounts. In other words, the current ratio, which measures all current assets against all current liabilities, also seems lower than other similar companies.
Furthermore, perhaps partly due to the drop in sales this period, the current ratio has fallen from last period. The company may not want to see much additional depreciation in this area at this time.
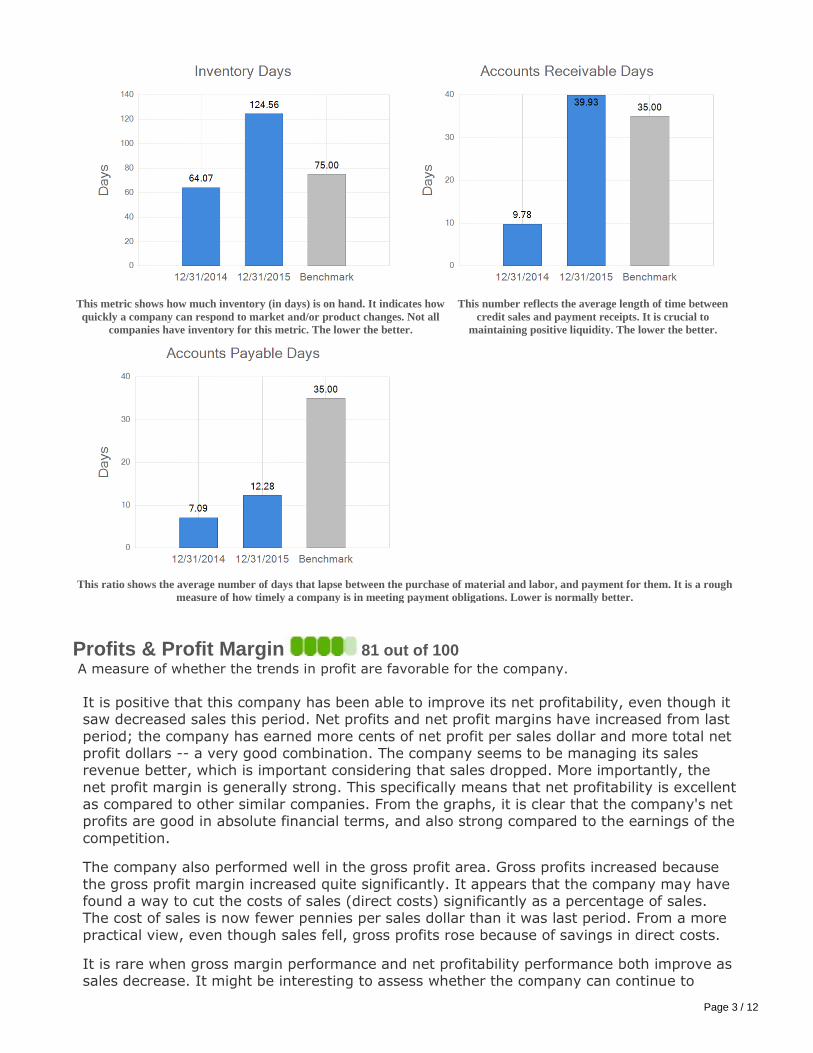
There are some specific areas in the liquidity analysis that could see some improvement. In particular, the company's inventory days ratio is high. This statistic shows that the company may be taking longer than competitors to turn inventory. It also should be noted that
bills/payables are being met relatively quickly (the accounts payable days are low). There may be some opportunity to increase the company’s payment period if needed. Over time, a good goal may be to align inventory, receivable, and payable days so that none will
individually put a strain on cash.
LIMITS TO LIQUIDITY ANALYSIS: Keep in mind that liquidity conditions are volatile, and this is a general analysis looking at a
snapshot in time. Review this section, but do not overly rely on it.
Generally, this metric measures the overall liquidity position of a
company. It is certainly not a perfect barometer, but it is a good
one. Watch for big decreases in this number over time. Make
sure the accounts listed in "current assets" are collectible. The
higher the ratio, the more liquid the company is.
This is another good indicator of liquidity, although by itself, it is not a
perfect one. If there are receivable accounts included in the numerator,
they should be collectible. Look at the length of time the company has
to pay the amount listed in the denominator (current liabilities). The
higher the number, the stronger the company.
Page 3 / 12
This metric shows how much inventory (in days) is on hand. It indicates how
quickly a company can respond to market and/or product changes. Not all
companies have inventory for this metric. The lower the better.
This number reflects the average length of time between
credit sales and payment receipts. It is crucial to
maintaining positive liquidity. The lower the better.
This ratio shows the average number of days that lapse between the purchase of material and labor, and payment for them. It is a rough
measure of how timely a company is in meeting payment obligations. Lower is normally better.
Profits & Profit Margin 81 out of 100
A measure of whether the trends in profit are favorable for the company.
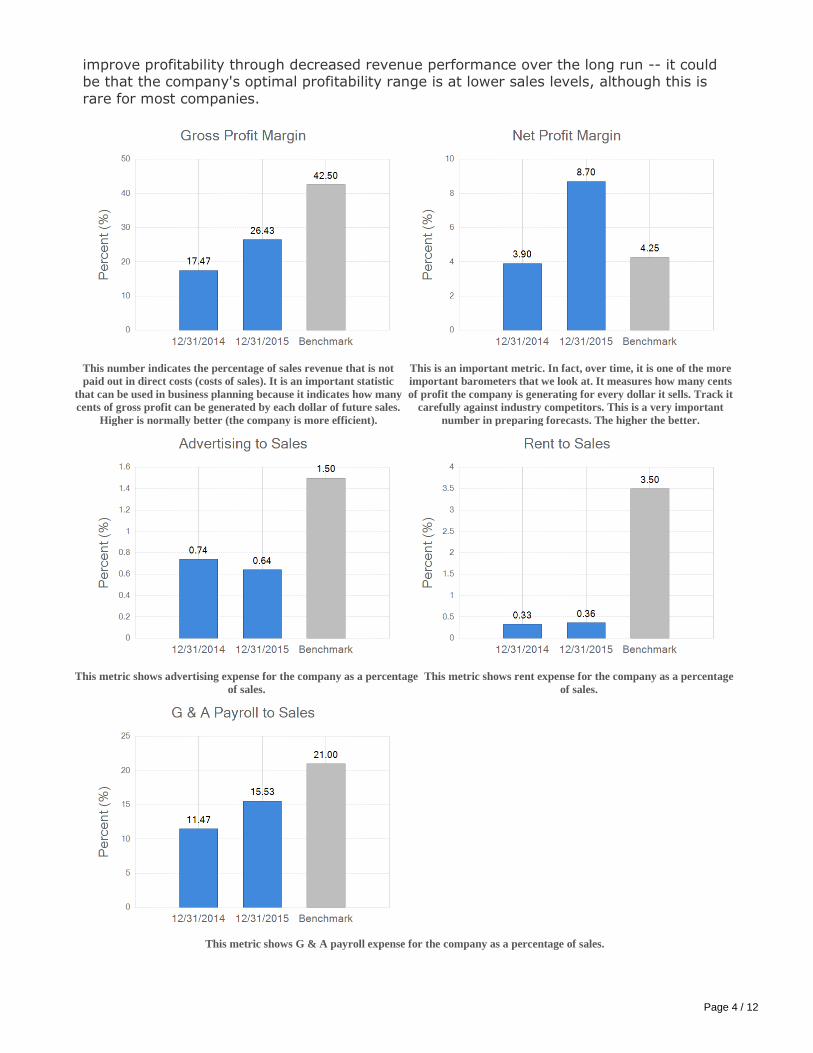
It is positive that this company has been able to improve its net profitability, even though it saw decreased sales this period. Net profits and net profit margins have increased from last
period; the company has earned more cents of net profit per sales dollar and more total net profit dollars -- a very good combination. The company seems to be managing its sales revenue better, which is important considering that sales dropped. More importantly, the
net profit margin is generally strong. This specifically means that net profitability is excellent as compared to other similar companies. From the graphs, it is clear that the company's net profits are good in absolute financial terms, and also strong compared to the earnings of the
competition.
The company also performed well in the gross profit area. Gross profits increased because
the gross profit margin increased quite significantly. It appears that the company may have found a way to cut the costs of sales (direct costs) significantly as a percentage of sales. The cost of sales is now fewer pennies per sales dollar than it was last period. From a more
practical view, even though sales fell, gross profits rose because of savings in direct costs.
It is rare when gross margin performance and net profitability performance both improve as sales decrease. It might be interesting to assess whether the company can continue to
Page 4 / 12
improve profitability through decreased revenue performance over the long run -- it could be that the company's optimal profitability range is at lower sales levels, although this is
rare for most companies.
This number indicates the percentage of sales revenue that is not
paid out in direct costs (costs of sales). It is an important statistic
that can be used in business planning because it indicates how many
cents of gross profit can be generated by each dollar of future sales.
Higher is normally better (the company is more efficient).
This is an important metric. In fact, over time, it is one of the more
important barometers that we look at. It measures how many cents
of profit the company is generating for every dollar it sells. Track it
carefully against industry competitors. This is a very important
number in preparing forecasts. The higher the better.
This metric shows advertising expense for the company as a percentage
of sales. This metric shows rent expense for the company as a percentage
of sales.
This metric shows G & A payroll expense for the company as a percentage of sales.
Page 5 / 12
Sales 26 out of 100
A measure of how sales are growing and whether the sales are satisfactory for the company.
The company's sales have fallen this period, while fixed assets remained relatively stable. This dynamic could negatively affect net profitability if sales continue to fall in the future.
Typically, companies want to see revenue increasing over time; this is true because the cost of business continually increases, no matter what the inflation rate is. Of course, as mentioned in the previous section, managers will want to look for longer-term results in this
area -- profitability is more important than sales generally.
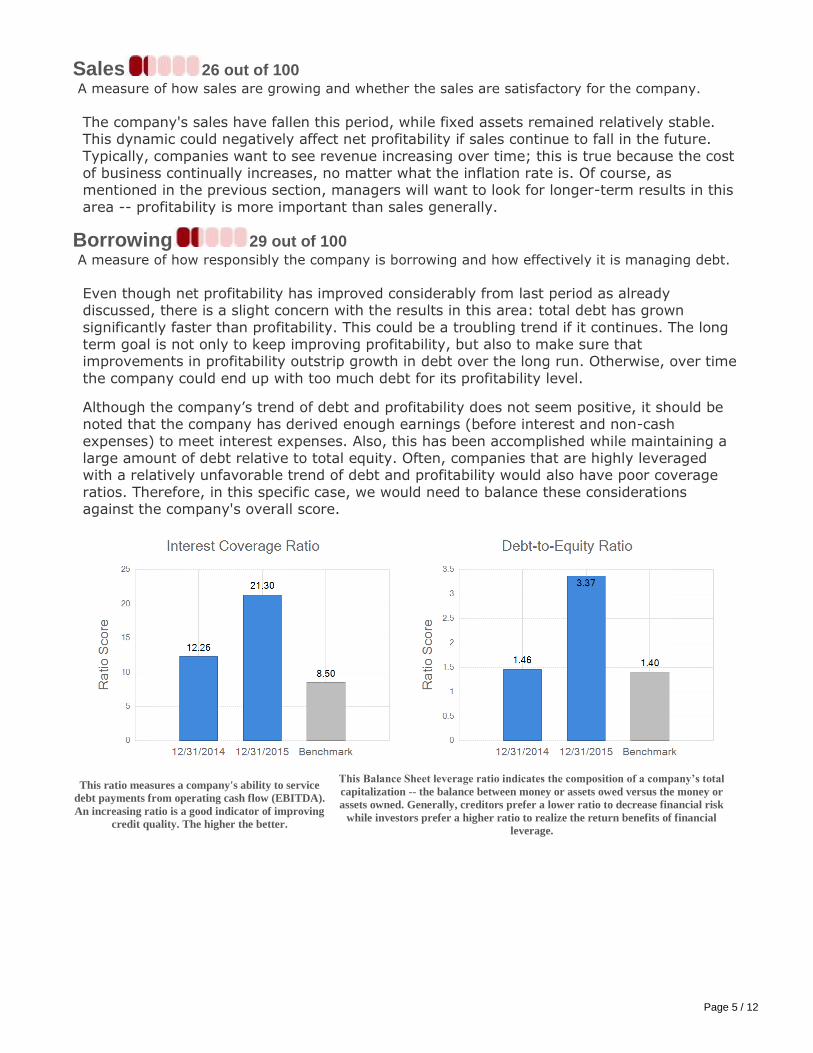
Borrowing 29 out of 100
A measure of how responsibly the company is borrowing and how effectively it is managing debt.
Even though net profitability has improved considerably from last period as already discussed, there is a slight concern with the results in this area: total debt has grown
significantly faster than profitability. This could be a troubling trend if it continues. The long term goal is not only to keep improving profitability, but also to make sure that improvements in profitability outstrip growth in debt over the long run. Otherwise, over time
the company could end up with too much debt for its profitability level.
Although the company’s trend of debt and profitability does not seem positive, it should be noted that the company has derived enough earnings (before interest and non-cash
expenses) to meet interest expenses. Also, this has been accomplished while maintaining a large amount of debt relative to total equity. Often, companies that are highly leveraged with a relatively unfavorable trend of debt and profitability would also have poor coverage
ratios. Therefore, in this specific case, we would need to balance these considerations against the company's overall score.
This ratio measures a company's ability to service
debt payments from operating cash flow (EBITDA).
An increasing ratio is a good indicator of improving
credit quality. The higher the better.
This Balance Sheet leverage ratio indicates the composition of a company’s total
capitalization -- the balance between money or assets owed versus the money or
assets owned. Generally, creditors prefer a lower ratio to decrease financial risk
while investors prefer a higher ratio to realize the return benefits of financial
leverage.
Page 6 / 12
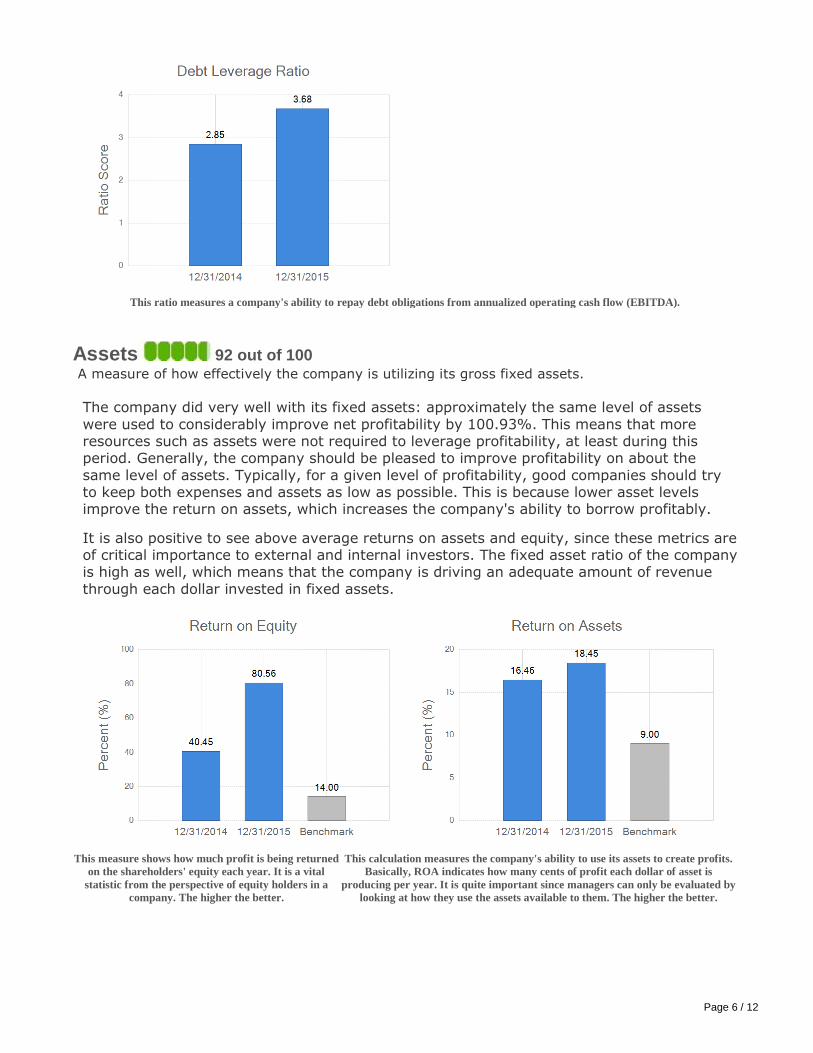
This ratio measures a company's ability to repay debt obligations from annualized operating cash flow (EBITDA).
Assets 92 out of 100
A measure of how effectively the company is utilizing its gross fixed assets.
The company did very well with its fixed assets: approximately the same level of assets
were used to considerably improve net profitability by 100.93%. This means that more resources such as assets were not required to leverage profitability, at least during this period. Generally, the company should be pleased to improve profitability on about the
same level of assets. Typically, for a given level of profitability, good companies should try to keep both expenses and assets as low as possible. This is because lower asset levels improve the return on assets, which increases the company's ability to borrow profitably.
It is also positive to see above average returns on assets and equity, since these metrics are of critical importance to external and internal investors. The fixed asset ratio of the company is high as well, which means that the company is driving an adequate amount of revenue
through each dollar invested in fixed assets.
This measure shows how much profit is being returned
on the shareholders' equity each year. It is a vital
statistic from the perspective of equity holders in a
company. The higher the better.
This calculation measures the company's ability to use its assets to create profits.
Basically, ROA indicates how many cents of profit each dollar of asset is
producing per year. It is quite important since managers can only be evaluated by
looking at how they use the assets available to them. The higher the better.
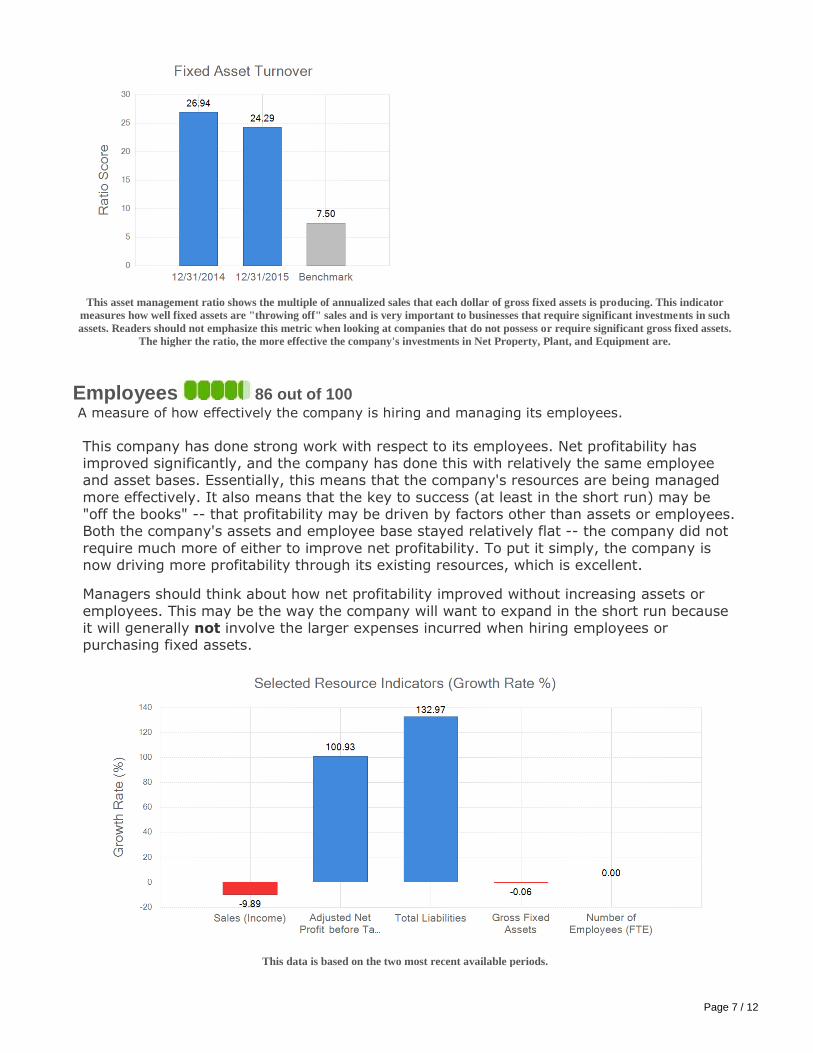
Page 7 / 12
This asset management ratio shows the multiple of annualized sales that each dollar of gross fixed assets is producing. This indicator
measures how well fixed assets are "throwing off" sales and is very important to businesses that require significant investments in such
assets. Readers should not emphasize this metric when looking at companies that do not possess or require significant gross fixed assets.
The higher the ratio, the more effective the company's investments in Net Property, Plant, and Equipment are.
Employees 86 out of 100
A measure of how effectively the company is hiring and managing its employees.
This company has done strong work with respect to its employees. Net profitability has improved significantly, and the company has done this with relatively the same employee and asset bases. Essentially, this means that the company's resources are being managed
more effectively. It also means that the key to success (at least in the short run) may be "off the books" -- that profitability may be driven by factors other than assets or employees. Both the company's assets and employee base stayed relatively flat -- the company did not
require much more of either to improve net profitability. To put it simply, the company is now driving more profitability through its existing resources, which is excellent.
Managers should think about how net profitability improved without increasing assets or
employees. This may be the way the company will want to expand in the short run because it will generally not involve the larger expenses incurred when hiring employees or purchasing fixed assets.
This data is based on the two most recent available periods.

Page 8 / 12
A NOTE ON SCORING: Each section of this report (Liquidity, Profits & Profit Margin, etc.) contains a numerical score/grade, which is
a rough measure of overall performance in the area. Each grade represents a score from 1 to 100, with 1 being the lowest score and 100
being the highest. Generally, a score above 50 would be a "good" score and a score below 50 would be a "poor" score. The scores are
derived by evaluating the company's trends, either positive or negative, over time and by comparing the company to industry averages for
different metrics.
Page 9 / 12
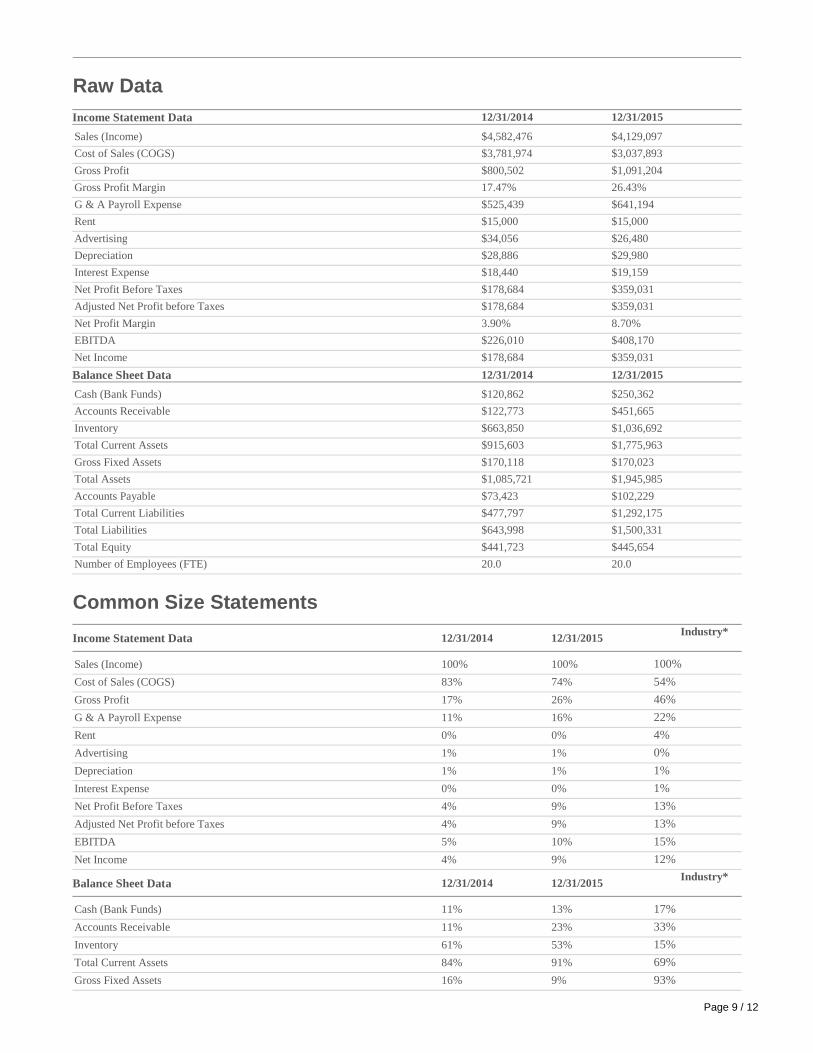
Raw Data
Income Statement Data 12/31/2014 12/31/2015
Sales (Income)
$4,582,476 $4,129,097
Cost of Sales (COGS)
$3,781,974 $3,037,893
Gross Profit
$800,502 $1,091,204
Gross Profit Margin
17.47% 26.43%
G & A Payroll Expense
$525,439 $641,194
Rent
$15,000 $15,000
Advertising
$34,056 $26,480
Depreciation
$28,886 $29,980
Interest Expense
$18,440 $19,159
Net Profit Before Taxes
$178,684 $359,031
Adjusted Net Profit before Taxes
$178,684 $359,031
Net Profit Margin
3.90% 8.70%
EBITDA
$226,010 $408,170
Net Income
$178,684 $359,031
Balance Sheet Data 12/31/2014 12/31/2015
Cash (Bank Funds)
$120,862 $250,362
Accounts Receivable
$122,773 $451,665
Inventory
$663,850 $1,036,692
Total Current Assets
$915,603 $1,775,963
Gross Fixed Assets
$170,118 $170,023
Total Assets
$1,085,721 $1,945,985
Accounts Payable
$73,423 $102,229
Total Current Liabilities
$477,797 $1,292,175
Total Liabilities
$643,998 $1,500,331
Total Equity
$441,723 $445,654
Number of Employees (FTE)
20.0 20.0
Common Size Statements
Income Statement Data 12/31/2014 12/31/2015 Industry*
Sales (Income)
100% 100% 100%
Cost of Sales (COGS)
83% 74% 54%
Gross Profit
17% 26% 46%
G & A Payroll Expense
11% 16% 22%
Rent
0% 0% 4%
Advertising
1% 1% 0%
Depreciation
1% 1% 1%
Interest Expense
0% 0% 1%
Net Profit Before Taxes
4% 9% 13%
Adjusted Net Profit before Taxes
4% 9% 13%
EBITDA
5% 10% 15%
Net Income
4% 9% 12%
Balance Sheet Data 12/31/2014 12/31/2015 Industry*
Cash (Bank Funds)
11% 13% 17%
Accounts Receivable
11% 23% 33%
Inventory
61% 53% 15%
Total Current Assets
84% 91% 69%
Gross Fixed Assets
16% 9% 93%
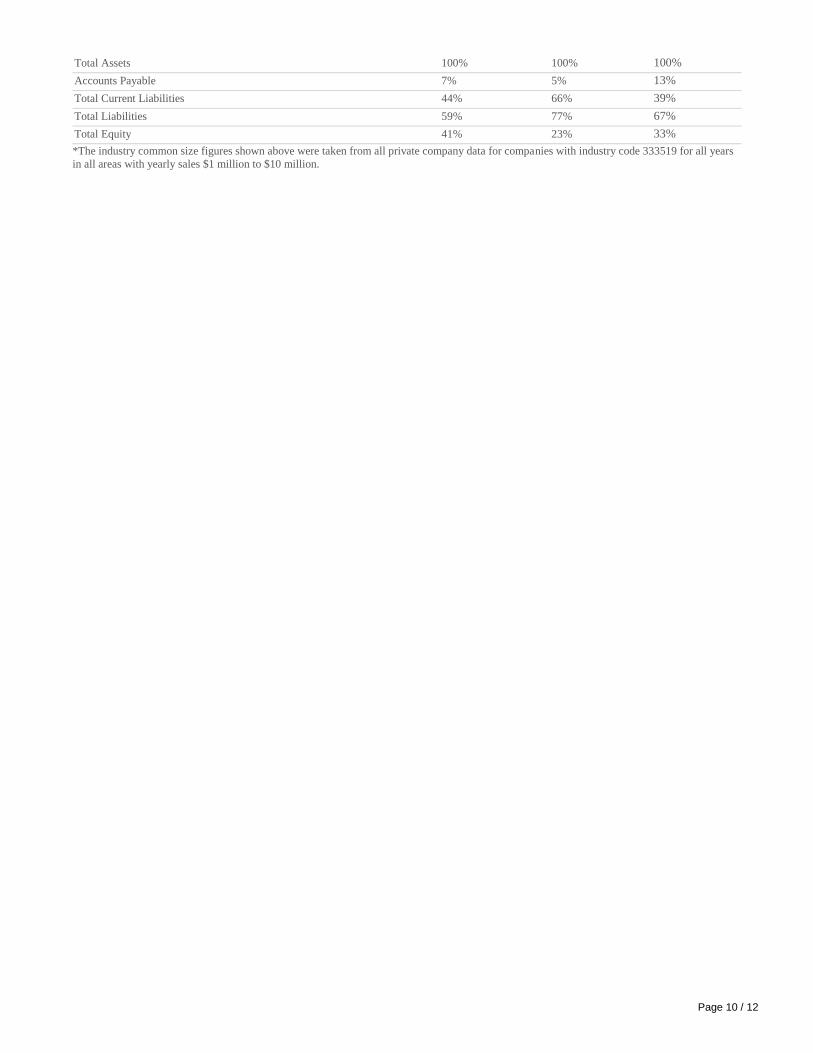
Page 10 / 12
Total Assets
100% 100% 100%
Accounts Payable
7% 5% 13%
Total Current Liabilities
44% 66% 39%
Total Liabilities
59% 77% 67%
Total Equity
41% 23% 33%
*The industry common size figures shown above were taken from all private company data for companies with industry code 333519 for all years
in all areas with yearly sales $1 million to $10 million.
Page 11 / 12
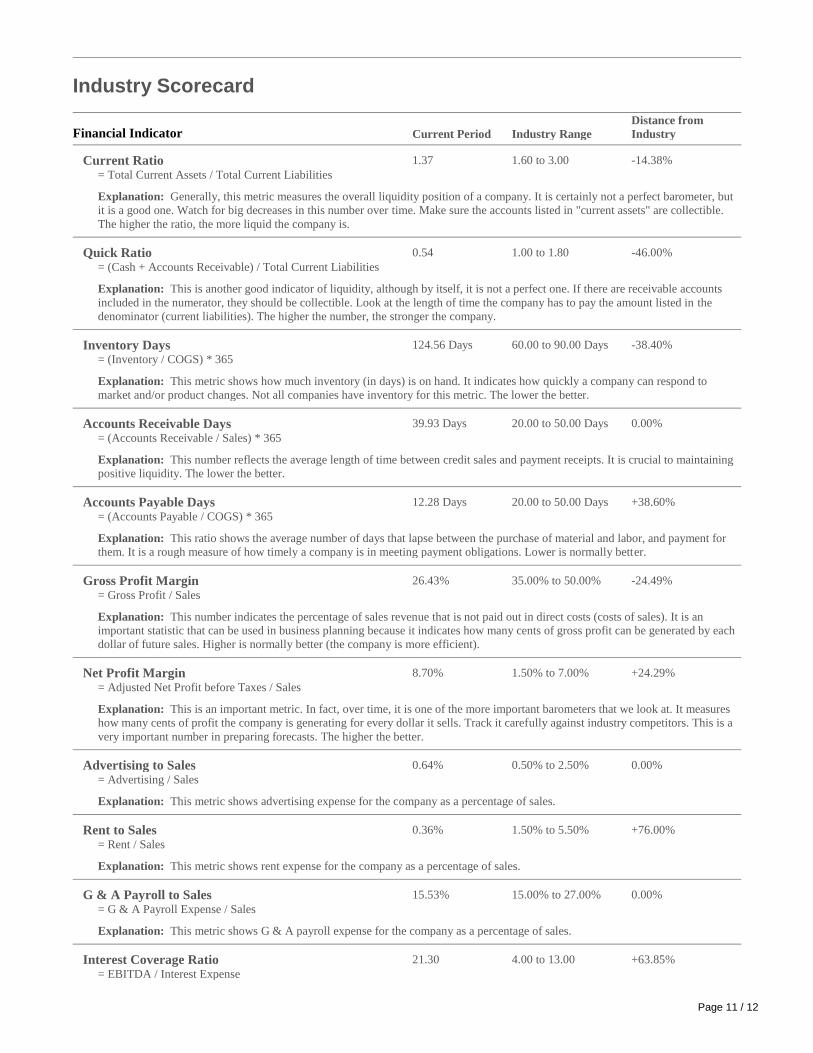
Industry Scorecard
Financial Indicator Current Period Industry Range
Distance from
Industry
Current Ratio 1.37 1.60 to 3.00 -14.38%
= Total Current Assets / Total Current Liabilities
Explanation: Generally, this metric measures the overall liquidity position of a company. It is certainly not a perfect barometer, but
it is a good one. Watch for big decreases in this number over time. Make sure the accounts listed in "current assets" are collectible.
The higher the ratio, the more liquid the company is.
Quick Ratio 0.54 1.00 to 1.80 -46.00%
= (Cash + Accounts Receivable) / Total Current Liabilities
Explanation: This is another good indicator of liquidity, although by itself, it is not a perfect one. If there are receivable accounts
included in the numerator, they should be collectible. Look at the length of time the company has to pay the amount listed in the
denominator (current liabilities). The higher the number, the stronger the company.
Inventory Days 124.56 Days 60.00 to 90.00 Days -38.40%
= (Inventory / COGS) * 365
Explanation: This metric shows how much inventory (in days) is on hand. It indicates how quickly a company can respond to
market and/or product changes. Not all companies have inventory for this metric. The lower the better.
Accounts Receivable Days 39.93 Days 20.00 to 50.00 Days 0.00%
= (Accounts Receivable / Sales) * 365
Explanation: This number reflects the average length of time between credit sales and payment receipts. It is crucial to maintaining
positive liquidity. The lower the better.
Accounts Payable Days 12.28 Days 20.00 to 50.00 Days +38.60%
= (Accounts Payable / COGS) * 365
Explanation: This ratio shows the average number of days that lapse between the purchase of material and labor, and payment for
them. It is a rough measure of how timely a company is in meeting payment obligations. Lower is normally better.
Gross Profit Margin 26.43% 35.00% to 50.00% -24.49%
= Gross Profit / Sales
Explanation: This number indicates the percentage of sales revenue that is not paid out in direct costs (costs of sales). It is an
important statistic that can be used in business planning because it indicates how many cents of gross profit can be generated by each
dollar of future sales. Higher is normally better (the company is more efficient).
Net Profit Margin 8.70% 1.50% to 7.00% +24.29%
= Adjusted Net Profit before Taxes / Sales
Explanation: This is an important metric. In fact, over time, it is one of the more important barometers that we look at. It measures
how many cents of profit the company is generating for every dollar it sells. Track it carefully against industry competitors. This is a
very important number in preparing forecasts. The higher the better.
Advertising to Sales 0.64% 0.50% to 2.50% 0.00%
= Advertising / Sales
Explanation: This metric shows advertising expense for the company as a percentage of sales.
Rent to Sales 0.36% 1.50% to 5.50% +76.00%
= Rent / Sales
Explanation: This metric shows rent expense for the company as a percentage of sales.
G & A Payroll to Sales 15.53% 15.00% to 27.00% 0.00%
= G & A Payroll Expense / Sales
Explanation: This metric shows G & A payroll expense for the company as a percentage of sales.
Interest Coverage Ratio 21.30 4.00 to 13.00 +63.85%
= EBITDA / Interest Expense
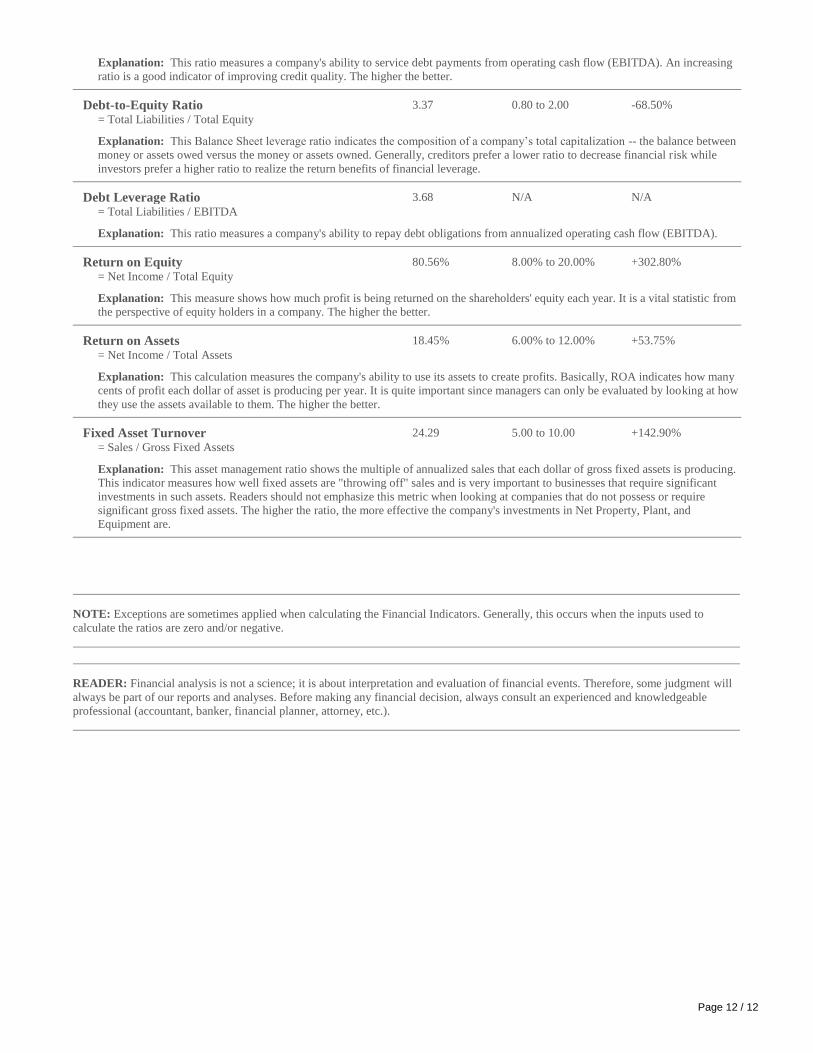
Page 12 / 12
Explanation: This ratio measures a company's ability to service debt payments from operating cash flow (EBITDA). An increasing
ratio is a good indicator of improving credit quality. The higher the better.
Debt-to-Equity Ratio 3.37 0.80 to 2.00 -68.50%
= Total Liabilities / Total Equity
Explanation: This Balance Sheet leverage ratio indicates the composition of a company’s total capitalization -- the balance between
money or assets owed versus the money or assets owned. Generally, creditors prefer a lower ratio to decrease financial risk while
investors prefer a higher ratio to realize the return benefits of financial leverage.
Debt Leverage Ratio 3.68 N/A N/A
= Total Liabilities / EBITDA
Explanation: This ratio measures a company's ability to repay debt obligations from annualized operating cash flow (EBITDA).
Return on Equity 80.56% 8.00% to 20.00% +302.80%
= Net Income / Total Equity
Explanation: This measure shows how much profit is being returned on the shareholders' equity each year. It is a vital statistic from
the perspective of equity holders in a company. The higher the better.
Return on Assets 18.45% 6.00% to 12.00% +53.75%
= Net Income / Total Assets
Explanation: This calculation measures the company's ability to use its assets to create profits. Basically, ROA indicates how many
cents of profit each dollar of asset is producing per year. It is quite important since managers can only be evaluated by looking at how
they use the assets available to them. The higher the better.
Fixed Asset Turnover 24.29 5.00 to 10.00 +142.90%
= Sales / Gross Fixed Assets
Explanation: This asset management ratio shows the multiple of annualized sales that each dollar of gross fixed assets is producing.
This indicator measures how well fixed assets are "throwing off" sales and is very important to businesses that require significant
investments in such assets. Readers should not emphasize this metric when looking at companies that do not possess or require
significant gross fixed assets. The higher the ratio, the more effective the company's investments in Net Property, Plant, and
Equipment are.
NOTE: Exceptions are sometimes applied when calculating the Financial Indicators. Generally, this occurs when the inputs used to
calculate the ratios are zero and/or negative.
READER: Financial analysis is not a science; it is about interpretation and evaluation of financial events. Therefore, some judgment will
always be part of our reports and analyses. Before making any financial decision, always consult an experienced and knowledgeable
professional (accountant, banker, financial planner, attorney, etc.).