a robust management option to simultaneously enhance soil ... · a robust management option to...
TRANSCRIPT

A Robust Management Option to Simultaneously Enhance Soil and Environmental Quality and
Sustain Crop Yields
Upendra Sainju
USDA-ARS
Northern Plains Agricultural Research Laboratory
Sidney, MT

Introduction
Intensive management practices in the last several decades have increased crop yields but also reduced soil and environmental quality by increasing soil erosion and acidity, N leaching, and greenhouse gas emissions (CO2, N2O, and CH4).
Little information is available about the impact of management practices that can simultaneously increase soil and environmental quality and sustain crop yields.
Improved management options are needed to increase soil C and N sequestration, reduce N fertilization rate and the potential for N leaching, mitigate greenhouse gas emissions, and sustain crop yield.

Objectives 1. Evaluate the effects of tillage, cropping sequence,
and N fertilization on dryland soil C and N levels, global warming potential, and crop yields and quality. 2. Identify management practices that Increase soil C and N sequestration, Decrease N fertilization rate, Reduce N losses through leaching, surface
runoff, volatilization, denitrification, and greenhouse gas (N2O) emissions.
Reduce net global warming potential and greenhouse gas intensity, and
Sustain crop yields and quality
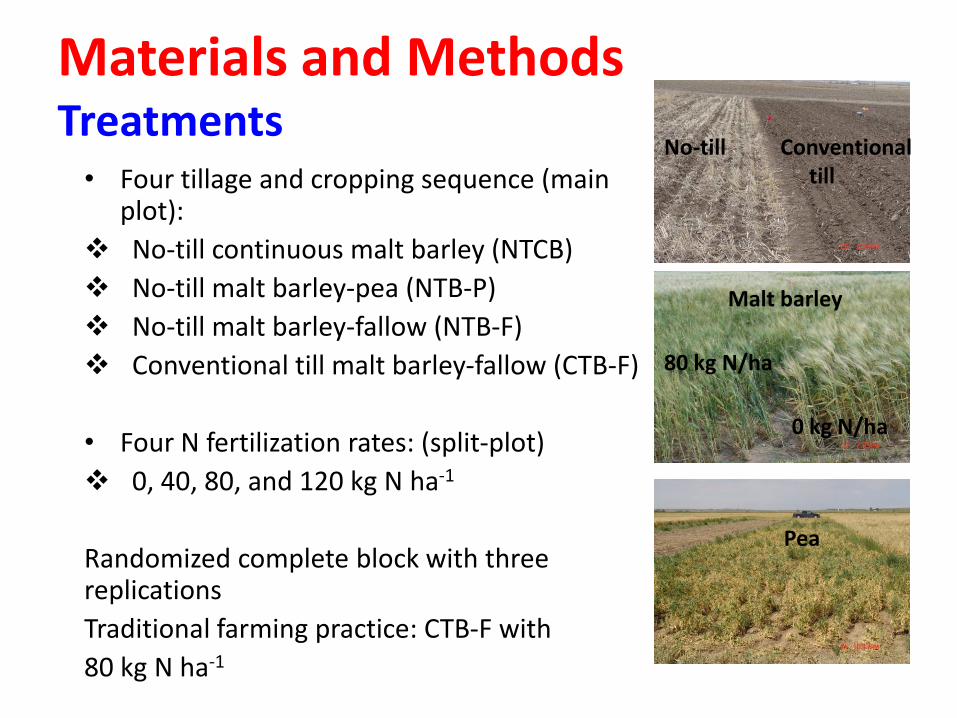
Materials and Methods Treatments • Four tillage and cropping sequence (main
plot):
No-till continuous malt barley (NTCB)
No-till malt barley-pea (NTB-P)
No-till malt barley-fallow (NTB-F)
Conventional till malt barley-fallow (CTB-F)
• Four N fertilization rates: (split-plot)
0, 40, 80, and 120 kg N ha-1
Randomized complete block with three replications
Traditional farming practice: CTB-F with
80 kg N ha-1
80 kg N/ha
0 kg N/ha
Pea
No-till Conventional till
Malt barley

Materials and Methods (contd..) Location: Sidney, MT Annual precipitation: 357 mm Air temperature: -8oF in January to 23oC in July and August Soil: Williams loam Duration: 2006-2011 Parameters: Soil organic C Soil total N Soil residual N (NH4 + NO3)-N Amount of N fertilizer applied N balance Global warming potential Greenhouse gas intensity Annualized grain yield Malt barley grain protein concentration Malt barley grain plumpness

160.0
170.0
180.0
190.0
200.0
210.0
0 40 80 120
CTB-F (49)† NTB-F (192)
NTB-P (470) NTCB (-195)
Linear (CTB-F (49)†) Linear (NTB-F (192))
Linear (NTB-P (470)) Linear (NTCB (-195))
LSD (0.05)
Mean Soil Organic Carbon (0-120 cm) (2006-2011)
Soil
org
anic
C (
Mg
C h
a-1)
N fertilization rate (kg N ha-1)
† Number in parenthesis indicate soil C sequestration rate (kg C ha-1 kg -1 N)

15.0
15.5
16.0
16.5
17.0
0 40 80 120
CTB-F (-3.3)† NTB-F (5.8)
NTB-P (30.0) NTCB(-0.5)
Linear (CTB-F (-3.3)†) Linear (NTB-F (5.8) )
Linear (NTB-P (30.0)) Linear (NTCB(-0.5) )
LSD (0.05)
Mean Soil Total Nitrogen (0-120 cm) (2006-2011)
Soil
tota
l N (
Mg
N h
a-1)
N fertilization rate (kg N ha-1)
Sainju (2013). Agron. J. 105:1253-1263.
† Number in parenthesis indicate soil N sequestration rate (kg CNha-1 kg -1 N)

50.0
100.0
150.0
200.0
250.0
0 40 80 120
CTB-F NTB-F NTB-P NTCB Linear (CTB-F) Linear (NTB-F) Linear (NTB-P) Linear (NTCB)
Mean Residual Soil Inorganic Nitrogen {(NH4 + NO3)-N} Content (0-120 cm) (2006-2011)
N fertilization rate (kg N ha-1)
LSD (0.05)
Soil
ino
rgan
ic N
(kg
N h
a-1)
Sainju (2013). Agron. J. 105:1253-1263.

Total Amount of Nitrogen Fertilizer Applied (2006-2011)
N f
ert
ilize
r ap
plie
d (
kg N
ha-1
)
N fertilization rate (kg N ha-1)
Amount of N fertilizer requirement = Desired N rate –Soil NO3-N content at 0-60 cm
0
100
200
300
400
500
0 40 80 120
CTB-F NTB-F NTB-P NTCB
-2,000
-1,500
-1,000
-500
0
500
0 40 80 120
CTB-F NTB-F
NTB-P NTCB
Poly. (CTB-F ) Poly. (NTB-F )
Poly. (NTB-P ) Poly. (NTCB )
LSD (0.05)
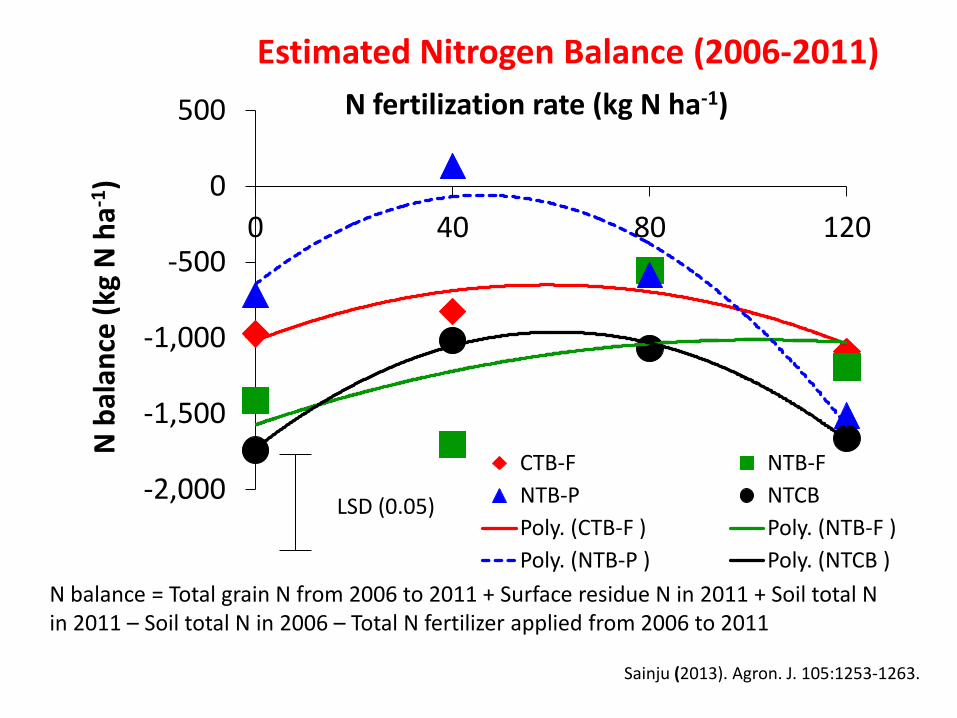
Estimated Nitrogen Balance (2006-2011)
N b
alan
ce (
kg N
ha-1
) N fertilization rate (kg N ha-1)
N balance = Total grain N from 2006 to 2011 + Surface residue N in 2011 + Soil total N in 2011 – Soil total N in 2006 – Total N fertilizer applied from 2006 to 2011
Sainju (2013). Agron. J. 105:1253-1263.

Calculations Net global warming potential based on soil respiration (GWPR) (Mosier et al., 2006): GWPR = CO2 equivalents (farm operations + N fertilization + soil respiration + N2O flux + CH4 flux) - CO2 equivalent (previous year’s crop residue). Net global warming potential based on soil organic C (GWPC)(Robertson and Grace, 2004; Mosier et al., 2005; Liebig et al., 2010): GWPC = CO2 equivalents (farm operations + N fertilization + N2O flux + CH4 flux) - CO2 equivalent (Soil organic C). Net greenhouse gas intensity based on soil respiration (GHGIR): GHGIR = GWPR / Annualized grain yield. Net greenhouse gas intensity based on soil organic C (GHGIC): GHGIC = GWPC / Annualized grain yield.

-2500
-2000
-1500
-1000
-500
0
500
CTB-F NTB-P NTCB
Mean Net Global Warming Potential (GWPR) and Greenhouse
Gas Intensity (GHGIR) Based on Soil Respiration (2008-2011)
-1.5
-1
-0.5
0
0.5
N fertilization rate 0 kg N ha-1 80 kg N ha-1
G
HG
I R
G
WP
R
(kg
CO
2 e
q. k
g-1 g
rain
)
(kg
CO
2 e
q. h
a-1)
LSD (0.05)
LSD (0.05)
Sainju et al. (2014). Soil Sci. Soc. Am. J. 78:248-261
0
500
1000
1500
CTB-F NTB-P NTCB
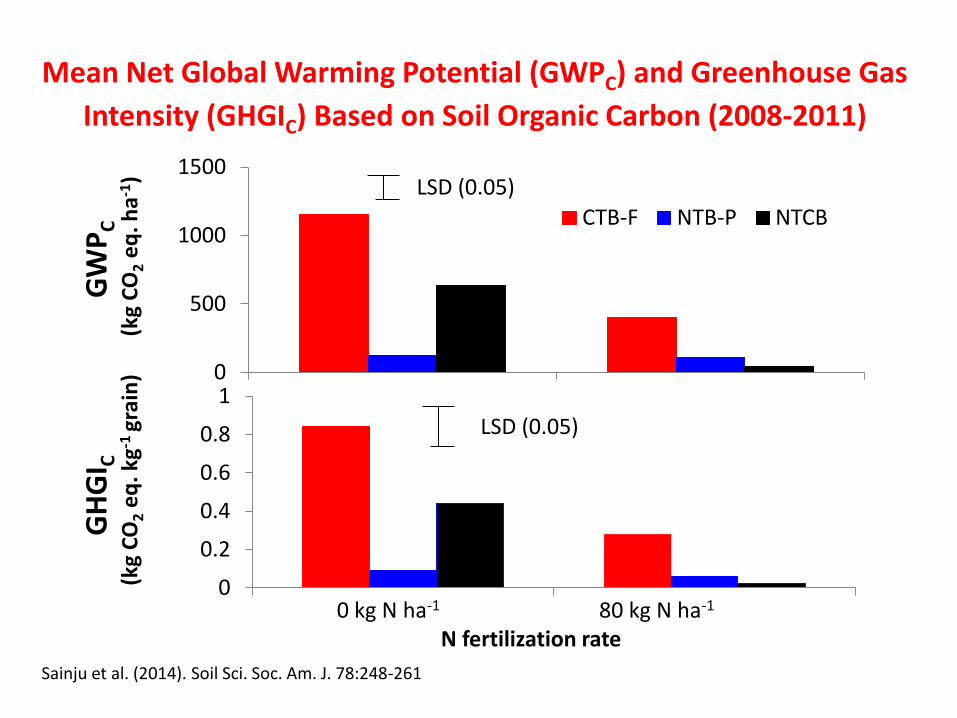
Mean Net Global Warming Potential (GWPC) and Greenhouse Gas
Intensity (GHGIC) Based on Soil Organic Carbon (2008-2011)
0
0.2
0.4
0.6
0.8
1
LSD (0.05)
LSD (0.05)
0 kg N ha-1 80 kg N ha-1 N fertilization rate
GH
GI C
G
WP
C
(kg
CO
2 e
q. k
g-1 g
rain
)
(k
g C
O2 e
q. h
a-1)
Sainju et al. (2014). Soil Sci. Soc. Am. J. 78:248-261

0.0
0.5
1.0
1.5
2.0
2.5
3.0
0 40 80 120
CTB-F NTB-F NTB-P NTCB Poly. (CTB-F) Poly. (NTB-F) Poly. (NTB-P) Poly. (NTCB)
Average Annualized Malt Barley Grain Yield (2006-2011)
N fertilization rate (kg N ha-1)
LSD (0.05)
Gra
in y
ield
(M
g h
a-1)
Sainju et al. (2013). Agron. J. 105:1-12
10.0
11.0
12.0
13.0
14.0
15.0
0 40 80 120
CTB-F NTB-F NTB-P NTCB Poly. (CTB-F) Poly. (NTB-F) Poly. (NTB-P) Poly. (NTCB)
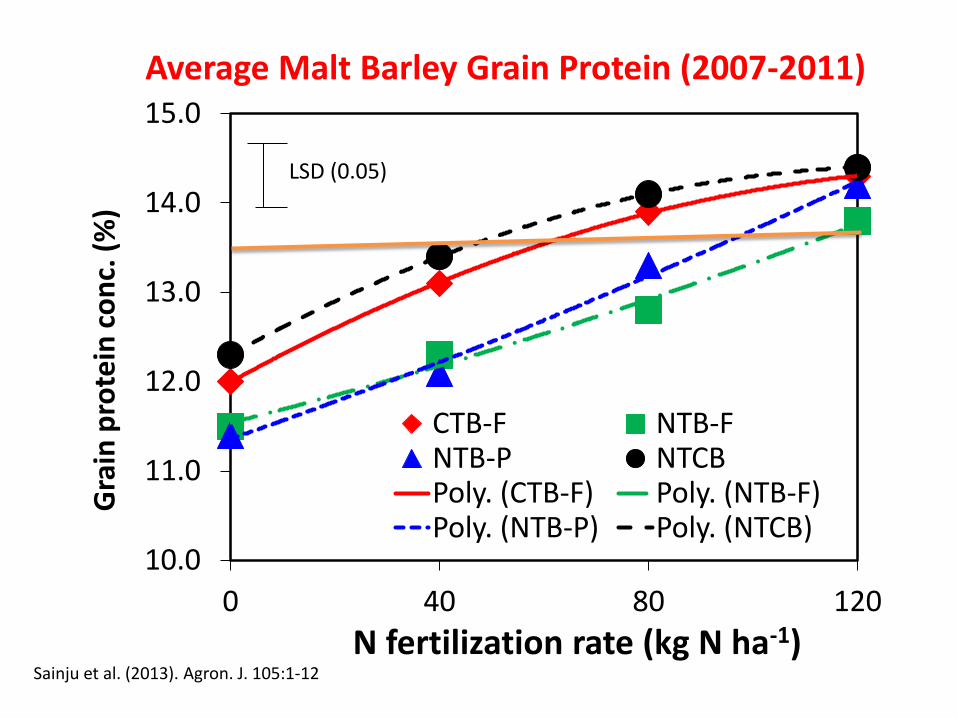
Average Malt Barley Grain Protein (2007-2011)
N fertilization rate (kg N ha-1)
LSD (0.05)
Gra
in p
rote
in c
on
c. (
%)
Sainju et al. (2013). Agron. J. 105:1-12

60.0
65.0
70.0
75.0
80.0
85.0
90.0
0 40 80 120
CTB-F NTB-F NTB-P NTCB Poly. (CTB-F) Poly. (NTB-F) Poly. (NTB-P) Poly. (NTCB)
Average Malt Barley Grain Plumpness (2007-2011)
N fertilization rate (kg N ha-1)
LSD (0.05)
Gra
in p
lum
pn
ess
(%
)
Sainju et al. (2013). Agron. J. 105:1-12

Improved vs. Traditional Farming Parameter NTB-P/40-80 vs. CTB-F/80† ___________________________________________________________ % Soil organic C 11 Soil total N 3 Residual soil inorganic N -32 Amount of N fertilizer applied -54 N balance 125 Global warming potential (Soil respiration) 622 Global warming potential (Soil organic C) 73 Greenhouse gas intensity (Soil respiration) 455 Greenhouse gas intensity (Soil organic C) 79 Annualized grain yield 44 Malt barley grain protein conc. -13 Malt barley grain plumpness 24 ______________________________________________________________ • † Number indicates N fertilization rate (kg N ha-1)

Conclusions Compared to traditional conventional till malt barley-fallow with 80 kg N ha-1, no-till malt barley-pea with 40 to 80 kg N ha-1 in dryland cropping systems can be used as a robust management option to
Increase soil C and N sequestration
Reduce N losses through leaching, volatilization, denitrification, and surface runoff
Decrease N fertilization rate
Mitigate greenhouse gas emissions
Sustain crop yields and quality

Acknowledgements
Joy Barsotti Michael Johnson
Jana Seright Mark Gaffri
Emily Reese Tyler Stevens
Ethan Schaff Andrew Lenssen
Christopher Russell Johnny Rieger