a review of the mcps revitalization/expansion program · a review of the mcps...
TRANSCRIPT
f f i c e o f L e g i s l a t i v e O v e r s i g h t
OOOO LLLL OOOO
Report Number 2015-12 July 28, 2015
Aron Trombka Stephanie Bryant
A Review of the MCPS
Revitalization/Expansion
Program
NOTE TO READERS
In preparing this report, OLO selected three nouns to describe activities to improve and
upgrade aging school facilities. These nouns have similar meanings but with
distinguishing differences. For the purpose of this report, the following definitions apply:
• Modernization refers to capital improvements to improve the educational and
physical conditions of aging school buildings.
• Revitalization/Expansion refers to the name applied to the MCPS modernization
program beginning in 2014.
• Reconstruction refers to the most frequent outcome of the MCPS
Revitalization/Expansion projects, namely, the complete or near complete
reconstruction of an existing school building in its current location.
Office of Legislative Oversight Report 2015-12 i
Executive Summary
A REVIEW OF THE MCPS REVITALIZATION/EXPANSION PROGRAM OLO Report Number 2015-12 July 28, 2015
The County Council directed the Office of Legislative Oversight (OLO) to prepare a report on the
Montgomery County Public Schools (MCPS) “Revitalization/Expansion” program. Formerly known as
the “Modernization” program, Revitalization/Expansion is the MCPS program to replace aging
school buildings.
Program Description and Policies
In the early 1990s, MCPS developed a standardized system, known as “Facilities Assessment with
Criteria and Testing (FACT),” to evaluate the condition of school buildings. MCPS updated the
FACT methodology and conducted a new round of assessments in 2011. The 2011 FACT
methodology included educational and infrastructure criteria (known as “parameters”). The
educational parameters evaluated school building characteristics that directly influence student
instruction while the infrastructure criteria evaluated the physical condition of the school buildings.
The FACT scoring system did not include a comparison of school enrollment with school capacity.
As a result, capacity considerations did not affect whether or when a particular school is included
in the Revitalization/Expansion program. Other MCPS capital programs, most notably building
additions, are intended to address capacity needs. However, once a school is scheduled for the
Revitalization/Expansion, MCPS may include capacity considerations in the project scope to
accommodate projected enrollment.
When developing the scope of a Revitalization/Expansion project, MCPS conducts a feasibility
study to determine the scope of the capital improvement project. Most often, this process results in
the complete or near complete reconstruction of the building. MCPS has concluded that building
reconstruction frequently costs less than building renovation or rehabilitation.
The MCPS Educational Facilities Master Plan indicates that all schools assessed in 2011 eventually
will be modernized in the order of their ranking in the Revitalization/Expansion program queue.
MCPS has not re-assessed the schools in the Revitalization/Expansion program queue since 2011 nor
does the school system plan to reassess the condition of these buildings in the future.
Age and Location of School Buildings and Modernizations
MCPS school buildings (elementary, middle, and high schools) have an average age of 25.1 years.
The oldest school buildings include reopened, special program, and holding schools.
OLO found that a geographic disparity, but not a bias, exists in the location of school
modernization projects. School modernizations track the MCPS construction history; the largest
concentration of modernizations has occurred in areas of the County with the oldest school
buildings (Downcounty Consortium and Southwest Quad Cluster). This trend will start to shift in
upcoming years as planned future modernization projects are focused in the Northwest and
Northeast Quad Clusters.
Over the past several decades, the average age of an MCPS school at the time of modernization
has increased from 32 years to 51 years. The CIP anticipates the 21 school Revitalization/Expansion
projects programmed for 2016 through 2023 will have an average age of 46 years when
completed. However, any changes to the planned schedule between 2016 and 2023 would alter the
average age.
Executive Summary
Office of Legislative Oversight Report 2015-12 ii
Capital Expenditures
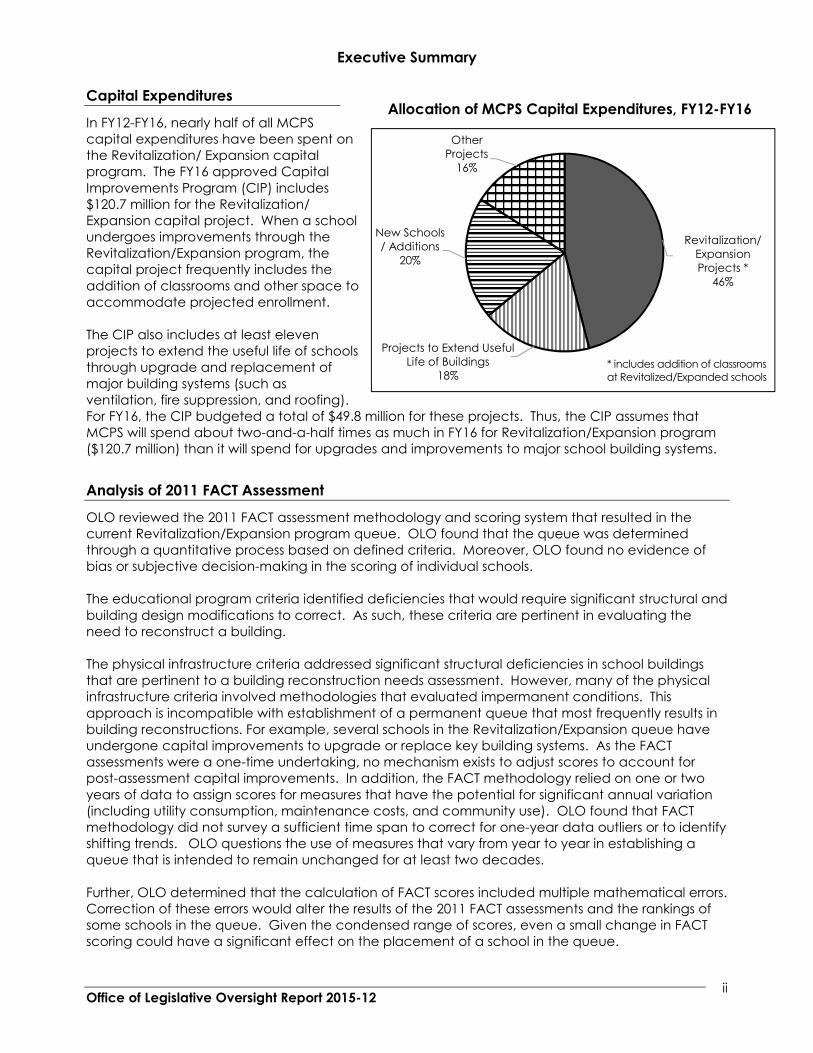
In FY12-FY16, nearly half of all MCPS
capital expenditures have been spent on
the Revitalization/ Expansion capital
program. The FY16 approved Capital
Improvements Program (CIP) includes
$120.7 million for the Revitalization/
Expansion capital project. When a school
undergoes improvements through the
Revitalization/Expansion program, the
capital project frequently includes the
addition of classrooms and other space to
accommodate projected enrollment.
The CIP also includes at least eleven
projects to extend the useful life of schools
through upgrade and replacement of
major building systems (such as
ventilation, fire suppression, and roofing).
For FY16, the CIP budgeted a total of $49.8 million for these projects. Thus, the CIP assumes that
MCPS will spend about two-and-a-half times as much in FY16 for Revitalization/Expansion program
($120.7 million) than it will spend for upgrades and improvements to major school building systems.
Analysis of 2011 FACT Assessment
OLO reviewed the 2011 FACT assessment methodology and scoring system that resulted in the
current Revitalization/Expansion program queue. OLO found that the queue was determined
through a quantitative process based on defined criteria. Moreover, OLO found no evidence of
bias or subjective decision-making in the scoring of individual schools.
The educational program criteria identified deficiencies that would require significant structural and
building design modifications to correct. As such, these criteria are pertinent in evaluating the
need to reconstruct a building.
The physical infrastructure criteria addressed significant structural deficiencies in school buildings
that are pertinent to a building reconstruction needs assessment. However, many of the physical
infrastructure criteria involved methodologies that evaluated impermanent conditions. This
approach is incompatible with establishment of a permanent queue that most frequently results in
building reconstructions. For example, several schools in the Revitalization/Expansion queue have
undergone capital improvements to upgrade or replace key building systems. As the FACT
assessments were a one-time undertaking, no mechanism exists to adjust scores to account for
post-assessment capital improvements. In addition, the FACT methodology relied on one or two
years of data to assign scores for measures that have the potential for significant annual variation
(including utility consumption, maintenance costs, and community use). OLO found that FACT
methodology did not survey a sufficient time span to correct for one-year data outliers or to identify
shifting trends. OLO questions the use of measures that vary from year to year in establishing a
queue that is intended to remain unchanged for at least two decades.
Further, OLO determined that the calculation of FACT scores included multiple mathematical errors.
Correction of these errors would alter the results of the 2011 FACT assessments and the rankings of
some schools in the queue. Given the condensed range of scores, even a small change in FACT
scoring could have a significant effect on the placement of a school in the queue.
Revitalization/
Expansion
Projects *
46%
Projects to Extend Useful
Life of Buildings
18%
New Schools
/ Additions
20%
Other
Projects
16%
Allocation of MCPS Capital Expenditures, FY12-FY16
* includes addition of classrooms
at Revitalized/Expanded schools
Executive Summary
Office of Legislative Oversight Report 2015-12 iii
Modernizations in Other School Districts
OLO studied the school modernization practices in five other jurisdictions: Anne Arundel County,
Baltimore County, Dallas, DeKalb County (GA), and Fairfax County. OLO selected school districts
that have similar characteristics to Montgomery County in regard to public school enrollment and
the age and number of school buildings. Similar to MCPS, each of the five school districts evaluate
the physical condition and educational suitability of school buildings.
However, OLO observed significant differences between MCPS and the other districts. Each district
employs a building evaluation process to assess the need for both school renovation and
reconstruction. In these districts, the most common outcome of the assessment process is targeted
renovations; only schools with the worst conditions are designated for reconstruction. Some school
districts use a methodology called the Facility Condition Index to compare the cost of building
renovation with the cost of building replacement. In comparison, MCPS Revitalization/ Expansion projects most frequently involve complete or near complete reconstruction of a school building.
Four of the five school districts studied include all school buildings – regardless of age – in their
facility assessments. This practice allows for the development of a systemwide inventory of all
school building deficiencies to be used for capital improvement planning purposes. In contrast, the
FACT process employed by MCPS almost exclusively assessed buildings over a designated age.
MCPS has a longer planned duration for its modernization queue than any school system studied by
OLO. The current MCPS queue is intended to remain unchanged for at least two decades. The
other school districts periodically (usually between five and ten years) re-assess the condition of
their schools and revise their capital improvements plan accordingly.
Each of the other school districts make school building assessment reports available to the public
via the internet. In 2011, MCPS posted the results of the FACT assessments on its website. At
present, however, the school-specific FACT results are not available online.
Discussion Questions
Based on the findings of this report, OLO suggests that the Council discuss the following questions
with MCPS representatives.
1. What should be the relationship between the Revitalization/Expansion program and other
elements of the MCPS Capital Improvements Program including projects to extend the
useful life of existing buildings (such as roof and HVAC replacements) and projects to
address capacity issues (such as additions)?
2. What is the optimal relative allocation of capital dollars spent on school building
modernizations versus improvements that extend the useful life of school buildings?
3. What should be the planned useful life of a school building? Under what circumstances
should a school building be reconstructed?
4. Should the 2011 FACT assessments be the basis for the sequencing of a school
modernization queue that could extend for at least 20 years? Should MCPS periodically re-
evaluate school conditions and their relative need for modernization?
5. What information about school building assessments should be made available to the
public?
iv OLO Report 2015-12 July 28, 2015
Office of Legislative Oversight Report 2015-12
A REVIEW OF THE MCPS REVITALIZATION/EXPANSION PROGRAM
TABLE OF CONTENTS
Executive Summary ................................................................................................................................ i
I. Authority, Scope, and Organization .......................................................................................... 1
II. Program History ........................................................................................................................ 3
III. MCPS Policies and Practices ................................................................................................... 12
IV. Capital Improvement Expenditures ......................................................................................... 15
V. Age and Location of School Buildings and Modernizations ................................................... 23
VI. Analysis of 2011 FACT Scoring ............................................................................................. 38
VII. School Modernization Programs in Other Jurisdictions .......................................................... 57
VIII. Findings and Discussion Questions ......................................................................................... 65
VI. Agency Comments .................................................................................................................. 69
Appendix A: Example MCPS Feasibility Study Process – Brown Station Elementary School
1
A Review of the MCPS Revitalization/Expansion Program
OLO Report 2015-12, Chapter I July 28, 2015
CHAPTER I. AUTHORITY, SCOPE, AND ORGANIZATION
A. Authority
Council Resolution 17-1183, FY 2015 Work Program for the Office of Legislative Oversight, adopted
July 29, 2014.
B. Project Scope and Methodology
The County Council directed the Office of Legislative Oversight (OLO) to prepare a report on the
Montgomery County Public Schools (MCPS) “Revitalization/Expansion” program. Formerly known as
the “Modernization” program, the Revitalization/Expansion program is the MCPS effort to replace aging
school buildings. The program is funded through the County’s capital budget and accounts for nearly
one-half of total annual MCPS capital expenditures.
This report describes the program history and the current MCPS policies and practices that shape program
implementation. The report provides information about planned capital expenditures for the
Revitalization/Expansion program as well as other MCPS capital projects intended to extend the useful
life of school buildings. To provide further context for the budget data, the report includes data on the
average age of the school buildings at the time of modernization and the geographic distribution of
modernization projects. The report contains an analysis of the scoring system that produced the current
Revitalization/Expansion program queue. Finally, the report presents information about school
modernization practices in other jurisdictions.
OLO staffers Aron Trombka and Stephanie Bryant prepared this report with editorial and production
assistance from Kelli Robinson. OLO conducted this study by reviewing MCPS policies and budget
documents, analyzing Revitalization/Expansion program reports and worksheets, and conducting
interviews with staff of MCPS and other public school systems.
C. Organization of Report
Chapter II, Program History, presents a brief history of the MCPS school modernization program and
details the assessment criteria used to evaluate schools for modernization.
Chapter III, Capital Funding, provides an overview of the policies and practices that govern MCPS’
capital improvements program, with particular emphasis on the Revitalization/Expansion program.
Chapter IV, Capital Improvement Expenditures, presents information about the expenditure levels
programmed in the Capital Improvements Program for MCPS Revitalization/Expansion projects as
well as building system improvements to extend the useful life of school buildings.
Chapter V, Age and Location of School Buildings and Modernizations, presents data and analysis
regarding the age of MCPS schools as well as the location and building age of modernization
projects.
Chapter VI, Analysis of 2011 FACT Scoring, examines the 2011 MCPS assessment of school buildings
and the placement of schools in the queue for reconstruction as part of the Revitalization/Expansion
program.
2
A Review of the MCPS Revitalization/Expansion Program
OLO Report 2015-12, Chapter I July 28, 2015
Chapter VII, School Modernization Programs in Other Jurisdictions, examines school modernization
programs in other jurisdictions with a focus on assessments, project prioritization, and public
availability and format of assessment scores.
Chapter VIII, Findings and Discussion Questions, summarizes the major findings of the report and
presents suggested questions for the Council to discuss MCPS.
Chapter IX, Agency Comments, includes comments from the MCPS Interim Superintendent on the
findings of this report.
D. Acknowledgements
OLO received a high level of cooperation from MCPS and Legislative Branch staff. We acknowledge the
invaluable contributions of:
• Bruce Crispell, MCPS
• Nicky Diamond, MCPS
• Adrienne Karamihas, MCPS
• Keith Levchenko, County Council Central Staff
• Essie McGuire, County Council Central Staff
• Merril E. Plait, Baltimore County Public Schools
• Lisa Seaman-Crawford, Anne Arundel County Public Schools
• Kevin Sneed, Fairfax County Public Schools
• James Song, MCPS
• Deborah Szyfer, MCPS
• Andrew Zuckerman, MCPS
3
A Review of the MCPS Revitalization/Expansion Program
OLO Report 2015-12, Chapter II July 28, 2015
CHAPTER II: PROGRAM HISTORY This chapter presents a brief history of the MCPS school modernization program and details the
assessment criteria used to evaluate schools for modernization. The chapter includes four sections:
• Section A. Previous School Modernization Projects
• Section B. 1993-1999 FACT Assessments
• Section C. 2011 FACT Assessments and Planned Future Modernizations
• Section D. Revitalization/Expansion Program: Duration of Queue and Scope of Projects
A. Previous School Modernization Projects
MCPS first began modernizing existing school buildings in the 1960s. During this era, MCPS evaluated
schools that were at least 30 years of age for possible modernization. At the time, MCPS considered a
school modernization to be “… the design, construction, and equipping process through which an aging
school facility is brought up to current educational standards … and through which its systems are
renewed and updated to meet, school, county, state, and federal codes and requirements.” 1 MCPS policy
acknowledged that modernizations may require the addition or redesign of space to meet educational
program requirements. 2
Between 1961 and 1992, MCPS modernized 30 elementary schools, five middle schools, and three high
schools.3
B. 1993-1999 FACT Assessments
MCPS developed a standardized system in 1992-93 to evaluate the physical condition and educational
program capability of school buildings known as “Facilities Assessment with Criteria and Testing
(FACT).” Under the FACT scoring system, schools in worse condition received lower scores than
schools in better condition. 4
MCPS developed the physical condition criteria based on advice from facilities and planning staff
members, experts from other jurisdictions, and the Maryland State Department of Education School
Construction Department. A team of technicians evaluated each school and applied weighted scores
based on a variety of building aspects, with a final score calculated at a maximum of 1,000 points. MCPS
instructional staff, planning and facilities staff, school principals, and parent-teacher association
representatives collaborated to develop the educational program assessment criteria. Based on a 1,000
1 Montgomery County Board of Education Policy FKB, October 9, 1991. Policy FKB was subsequently amended
in 2010 (see Chapter III of this report). 2 Ibid. 3 FY16 Educational Facilities Master Plan, Chapter 4.
4 Ibid., Appendix F. See also, Superintendent Joshua P. Starr to Members of the Montgomery County Board of
Education, “Recommendations for Facilities Assessment with Criteria and Testing Assessment Parameters:
Appendix A” [Memorandum], Office of the Superintendent of Schools, MCPS, June 15, 2010.
4
A Review of the MCPS Revitalization/Expansion Program
OLO Report 2015-12, Chapter II July 28, 2015
point scale, the educational program criteria assessed how well schools conformed with instructional
space, safety, security, and energy conservation standards.5
In 1993, MCPS applied the newly developed FACT assessment criteria to 37 elementary and secondary
schools. In 1996, MCPS assessed an additional 35 schools. Schools selected for assessment in 1996
were either built before 1970 and never modernized or were renovated before 1977. In 1999, MCPS
assessed seven high schools. Schools in subsequent assessment rounds were placed behind schools in the
established queue.6
C. 2011 FACT Assessments and Planned Future Modernizations
With the last three elementary schools from the previous modernization queue programmed for
completion in less than a decade, MCPS decided to update the FACT methodology and conduct a new
round of assessments in 2011. In 2014, MCPS renamed the school modernization effort as the
Revitalization/Expansion program. MCPS determined that the new name better reflected capital projects
that included both facility modernizations and capacity improvements.
1. Process of Updating the FACT Methodology
Beginning in March 2010, the Board of Education tasked MCPS staff to develop a process for updating
the FACT methodology. Over the next several months, MCPS instructional and facilities management
staff sought input on the proposed process from an advisory FACT Review Committee consisting of
parent-teacher associations, State and County Government officials and staff, and architectural
consultants.7 In updating the FACT evaluation criteria (called “parameters”), MCPS reviewed the
previous methodology to identify characteristics that were no longer appropriate to evaluate and to
identify more relevant criteria. One factor included in the previous FACT methodology, but not in the
2011 methodology, was the projected overutilization of a school. MCPS determined that many schools in
the queue also required additions prior to modernization. As noted by MCPS staff:
This resulted in schools which still held a place in the queue, based in part on
overutilization, were no longer over utilized. The new FACT methodology reflects
conditions at schools that are unlikely to be resolved prior to their
Revitalization/Expansion project.8
Similar to the 1992 FACT methodology, the advisory committee included both educational program and
physical infrastructure parameters in the revised 2011 FACT methodology. As in the previous
methodology, the educational program parameters compared building core and instructional space with
established facility standards. In addition, the 2011 methodology included parameters such as building
safety and security features.9
5 Superintendent Jerry Weast to Members of the Montgomery County Board of Education, “Recommendations for
Facilities Assessment with Criteria and Testing Assessment Parameters: Appendix A” [Memorandum], Office of the
Superintendent of Schools, MCPS, June 15, 2010, available at
http://www.montgomeryschoolsmd.org/boe/meetings/agenda/2009-10/2010-0622/FACT.pdf. 6 FY16 Educational Facilities Master Plan, Appendix F. 7 Memorandum from James Song, Director of MCPS Department of Facilities Management to Aron Trombka, OLO
Senior Legislative Analyst, March 17, 2015. 8 Memorandum from James Song, Director of MCPS Department of Facilities Management to Aron Trombka, OLO
Senior Legislative Analyst, May 8, 2015. 9 Ibid.
5
A Review of the MCPS Revitalization/Expansion Program
OLO Report 2015-12, Chapter II July 28, 2015
For the physical infrastructure parameters, the advisory committee identified current design requirements
for school sites and buildings, including environmental conditions, access for the disabled, and the
conditions of building systems (i.e. mechanical, plumbing, electrical, security, and fire protection).
According to MCPS, “the FACT Review Committee was well aware that facility conditions change over
time. Nevertheless, the prevailing view was that a comprehensive condition assessment needed to include
all the parameters that are included in FACT. In addition, these parameters were similar to those used in
the industry, as conveyed by the consultant EMG, Inc.”10
Working with the consulting firm, EMG, Inc., MCPS staff finalized the assessment criteria, developed a
scoring system, and assigned weights to various elements. The Board of Education adopted an updated
FACT methodology and the list of schools on July 8, 2010.11 The approved parameters are found on
pages 6 and 7 below.
2. FACT Assessment Criteria, Scoring, and Weights
The criteria incorporated into the 2011 FACT methodology included some aspects of the industry
standard, known as a Facility Condition Index (FCI), to measure a building’s condition. However, MCPS
elected to expand its facility evaluation criteria beyond the FCI standard. As stated in the approved
FACT methodology:
The usefulness of the FCI in this study was limited in that each facility was evaluated
based on deficiencies with respect to current educational specifications and program
requirements, space standards and modern building system needs. As such, the employed
methodology was developed to account for deficiencies beyond existing building
envelope and systems, and evaluated need for system upgrades instead of replacement
with “like kind”.12
To differentiate the new scoring system from the previous FACT assessments, the methodology was
based on a 600 point scale with buildings in worse condition receiving a higher score than buildings in
better condition. The FACT Review Committee, affirmed by the Superintendent and the Board of
Education, determined that the educational program and physical infrastructure parameters should be
weighed equally, with each receiving a possible maximum score of 300 points. (See page 41 for a tree
diagram portraying the point breakdown for each parameter). According to MCPS staff, MCPS weighted
the two parameter categories equally because “many of the factors interrelate and in a sense all the
conditions at a school affect the ability of the facility to serve students in an excellent learning
environment.”13
EMG assisted MCPS staff with assigning relative weights to the assessed characteristics. For the
educational program parameters, MCPS assigned 228 points (76% of the total educational program
points) to assessment of a building’s conformity with current space standards for the school core,
instruction spaces, classrooms, support areas, and administrative spaces. In addition, MCPS allocated 42
points (14%) to the presence of an open-space plan and 30 points (10%) related to controlled access to the
school.
10 Email correspondence from Bruce Crispell to Aron Trombka, July 16, 2015. 11 James Song, March 17, 2015. 12 “Montgomery County Public Schools Facility Assessment with Criteria and Testing (FACT) – Final Report,”
page 6. 13 James Song, May 8, 2015, page 3.
6
A Review of the MCPS Revitalization/Expansion Program
OLO Report 2015-12, Chapter II July 28, 2015
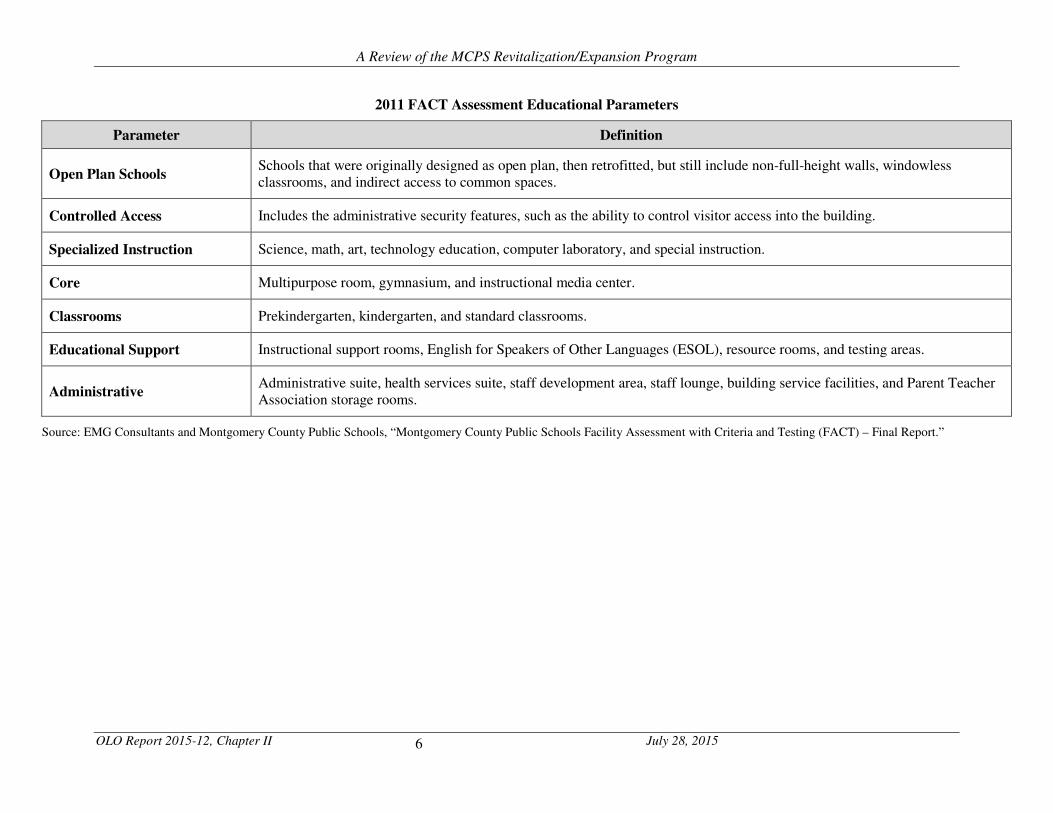
2011 FACT Assessment Educational Parameters
Parameter Definition
Open Plan Schools Schools that were originally designed as open plan, then retrofitted, but still include non-full-height walls, windowless
classrooms, and indirect access to common spaces.
Controlled Access Includes the administrative security features, such as the ability to control visitor access into the building.
Specialized Instruction Science, math, art, technology education, computer laboratory, and special instruction.
Core Multipurpose room, gymnasium, and instructional media center.
Classrooms Prekindergarten, kindergarten, and standard classrooms.
Educational Support Instructional support rooms, English for Speakers of Other Languages (ESOL), resource rooms, and testing areas.
Administrative Administrative suite, health services suite, staff development area, staff lounge, building service facilities, and Parent Teacher
Association storage rooms.
Source: EMG Consultants and Montgomery County Public Schools, “Montgomery County Public Schools Facility Assessment with Criteria and Testing (FACT) – Final Report.”
7
A Review of the MCPS Revitalization/Expansion Program
OLO Report 2015-12, Chapter II July 28, 2015
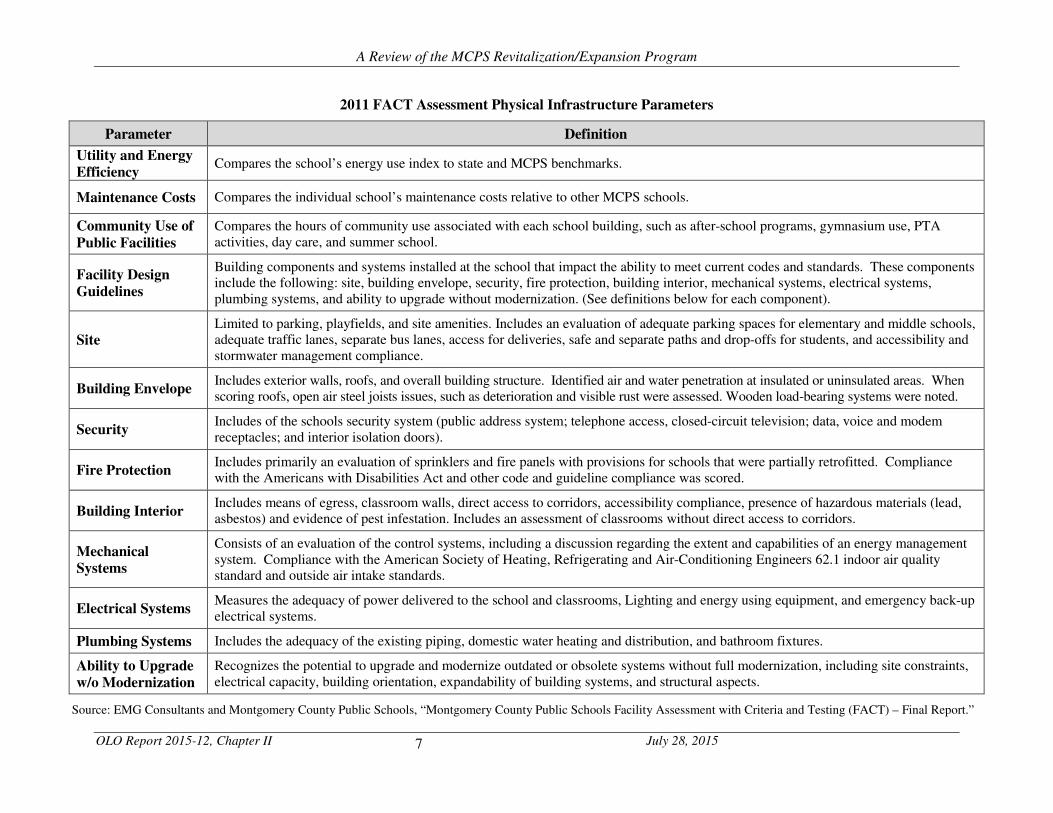
2011 FACT Assessment Physical Infrastructure Parameters
Source: EMG Consultants and Montgomery County Public Schools, “Montgomery County Public Schools Facility Assessment with Criteria and Testing (FACT) – Final Report.”
Parameter Definition
Utility and Energy
Efficiency Compares the school’s energy use index to state and MCPS benchmarks.
Maintenance Costs Compares the individual school’s maintenance costs relative to other MCPS schools.
Community Use of
Public Facilities
Compares the hours of community use associated with each school building, such as after-school programs, gymnasium use, PTA
activities, day care, and summer school.
Facility Design
Guidelines
Building components and systems installed at the school that impact the ability to meet current codes and standards. These components
include the following: site, building envelope, security, fire protection, building interior, mechanical systems, electrical systems,
plumbing systems, and ability to upgrade without modernization. (See definitions below for each component).
Site Limited to parking, playfields, and site amenities. Includes an evaluation of adequate parking spaces for elementary and middle schools,
adequate traffic lanes, separate bus lanes, access for deliveries, safe and separate paths and drop-offs for students, and accessibility and
stormwater management compliance.
Building Envelope Includes exterior walls, roofs, and overall building structure. Identified air and water penetration at insulated or uninsulated areas. When
scoring roofs, open air steel joists issues, such as deterioration and visible rust were assessed. Wooden load-bearing systems were noted.
Security Includes of the schools security system (public address system; telephone access, closed-circuit television; data, voice and modem
receptacles; and interior isolation doors).
Fire Protection Includes primarily an evaluation of sprinklers and fire panels with provisions for schools that were partially retrofitted. Compliance
with the Americans with Disabilities Act and other code and guideline compliance was scored.
Building Interior Includes means of egress, classroom walls, direct access to corridors, accessibility compliance, presence of hazardous materials (lead,
asbestos) and evidence of pest infestation. Includes an assessment of classrooms without direct access to corridors.
Mechanical
Systems
Consists of an evaluation of the control systems, including a discussion regarding the extent and capabilities of an energy management
system. Compliance with the American Society of Heating, Refrigerating and Air-Conditioning Engineers 62.1 indoor air quality
standard and outside air intake standards.
Electrical Systems Measures the adequacy of power delivered to the school and classrooms, Lighting and energy using equipment, and emergency back-up
electrical systems.
Plumbing Systems Includes the adequacy of the existing piping, domestic water heating and distribution, and bathroom fixtures.
Ability to Upgrade
w/o Modernization
Recognizes the potential to upgrade and modernize outdated or obsolete systems without full modernization, including site constraints,
electrical capacity, building orientation, expandability of building systems, and structural aspects.
8
A Review of the MCPS Revitalization/Expansion Program
OLO Report 2015-12, Chapter II July 28, 2015
For the physical infrastructure, MCPS assigned a total of 200 points (67% of the total) among nine
facility condition parameters including mechanical systems, building envelope, security, building interior,
fire protection, electrical systems, plumbing, and site conditions. Of the remaining points, MCPS
allocated 37.5 points (12.5%) each to utility/energy efficiency and maintenance costs. The final 25 points
were allocated to a measure of community use of the school facility.14
The FACT scoring system did not include a comparison of school enrollment with school capacity. As
stated in the description of the school assessment methodology, “characteristics that may change over
time or may be addressed by other capital programs, such as additions to relieve capacity shortages, also
are not included in the FACT methodology.” 15 As a result, capacity considerations do not affect whether
or when a particular school is included in the Revitalization/Expansion program.16 Nonetheless, once
MCPS includes a school in the Revitalization/Expansion program, the scope of the capital project may
address capacity concerns. As stated in the MCPS Educational Facilities Master Plan, “some schools that
are scheduled for Revitalization/Expansion projects also have increases in capacity as part of the project
to accommodate growing enrollment.” 17 Once a school identified for Revitalization/Expansion is
approved in the six-year CIP, the capital project may include the addition of classrooms and other space
to accommodate projected enrollment.
EMG developed scoring worksheets for schools examiners. Examiners measured a total of 132 items in
the area of educational program related parameters and 110 items in the area of physical infrastructure
parameters. 18 The scoring of the facilities developed a priority ranking, similar to the previous FACT
assessments. The schools assessed in 2011 are ranked below those already in the queue.
14 “Montgomery County Public Schools Facility Assessment with Criteria and Testing (FACT) – Final Report,”
pages 9-10. 15 EMG Consultants and Montgomery County Public Schools, “Montgomery County Public Schools Facility
Assessment with Criteria and Testing (FACT) – Final Report,” October 11, 2011, p. 6. 16 MCPS manages other capital projects to add space to schools for which projected enrollment exceeds building
capacity. The current CIP includes projects to build additions to six school buildings. 17 FY16 Educational Facilities Master Plan Program, page 3-5. 18 “Montgomery County Public Schools Facility Assessment with Criteria and Testing (FACT) – Final Report,”
pages 9-10.
9
A Review of the MCPS Revitalization/Expansion Program
OLO Report 2015-12, Chapter II July 28, 2015
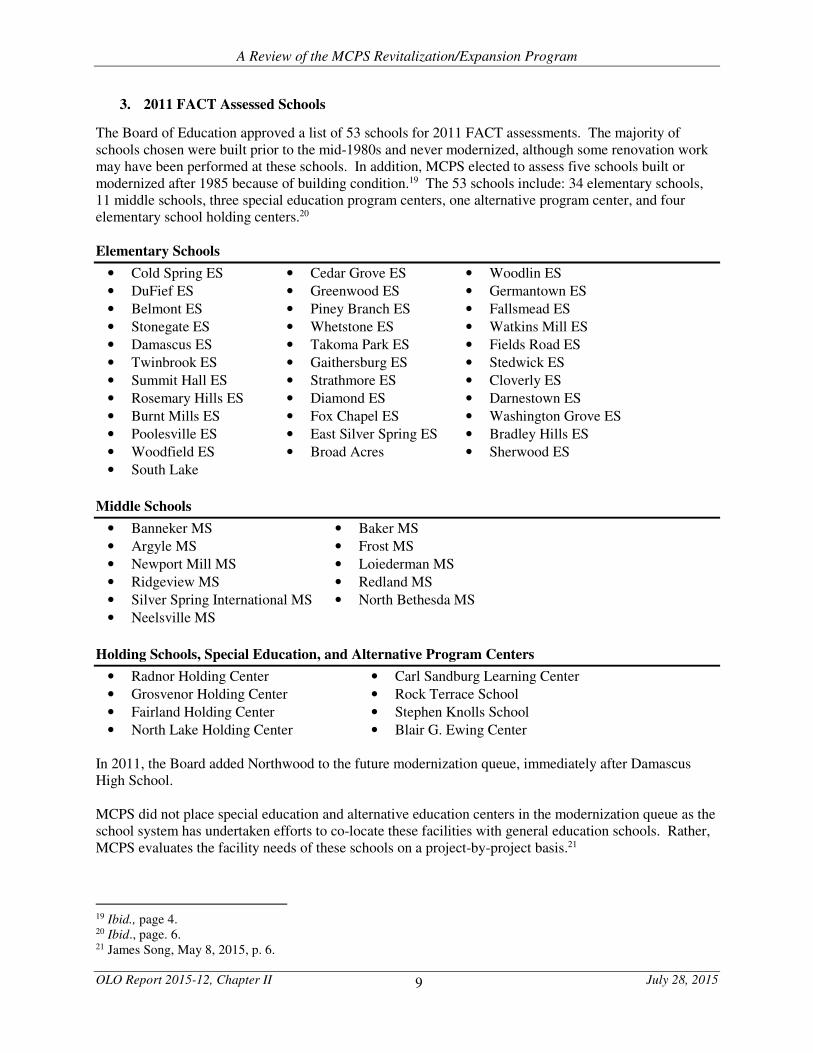
3. 2011 FACT Assessed Schools
The Board of Education approved a list of 53 schools for 2011 FACT assessments. The majority of
schools chosen were built prior to the mid-1980s and never modernized, although some renovation work
may have been performed at these schools. In addition, MCPS elected to assess five schools built or
modernized after 1985 because of building condition.19 The 53 schools include: 34 elementary schools,
11 middle schools, three special education program centers, one alternative program center, and four
elementary school holding centers.20
Elementary Schools
• Cold Spring ES
• DuFief ES
• Belmont ES
• Stonegate ES
• Damascus ES
• Twinbrook ES
• Summit Hall ES
• Rosemary Hills ES
• Burnt Mills ES
• Poolesville ES
• Woodfield ES
• South Lake
• Cedar Grove ES
• Greenwood ES
• Piney Branch ES
• Whetstone ES
• Takoma Park ES
• Gaithersburg ES
• Strathmore ES
• Diamond ES
• Fox Chapel ES
• East Silver Spring ES
• Broad Acres
• Woodlin ES
• Germantown ES
• Fallsmead ES
• Watkins Mill ES
• Fields Road ES
• Stedwick ES
• Cloverly ES
• Darnestown ES
• Washington Grove ES
• Bradley Hills ES
• Sherwood ES
Middle Schools
• Banneker MS
• Argyle MS
• Newport Mill MS
• Ridgeview MS
• Silver Spring International MS
• Neelsville MS
• Baker MS
• Frost MS
• Loiederman MS
• Redland MS
• North Bethesda MS
Holding Schools, Special Education, and Alternative Program Centers
• Radnor Holding Center
• Grosvenor Holding Center
• Fairland Holding Center
• North Lake Holding Center
• Carl Sandburg Learning Center
• Rock Terrace School
• Stephen Knolls School
• Blair G. Ewing Center
In 2011, the Board added Northwood to the future modernization queue, immediately after Damascus
High School.
MCPS did not place special education and alternative education centers in the modernization queue as the
school system has undertaken efforts to co-locate these facilities with general education schools. Rather,
MCPS evaluates the facility needs of these schools on a project-by-project basis.21
19 Ibid., page 4. 20 Ibid., page. 6. 21 James Song, May 8, 2015, p. 6.
10
A Review of the MCPS Revitalization/Expansion Program
OLO Report 2015-12, Chapter II July 28, 2015
4. Publication of the 2011 FACT Scores
MCPS publishes the total FACT score for each assessed school in Appendix F of the approved
Educational Facilities Master Plan and CIP. Elementary and middle schools scores are separately listed
and ranked in descending order (see page 39 of this report).
Special education and alternative program centers scores are included in the elementary and middle
school queues. MCPS does not publish holding school FACT scores.
MCPS provided OLO with the school-specific reports and worksheets from the 2011 FACT assessments.
In 2011, MCPS posted the results of the FACT assessments on its website. At present, however, the
school-specific FACT results are not available online.
D. Revitalization/Expansion Program: Duration of Queue and Scope of Projects
This section provides detail about the planned duration of the Revitalization/Expansion program queue
and the scope of construction projects developed under the program.
1. Duration of the Revitalization/Expansion Queue
The MCPS Educational Facilities Master Plan indicates that all schools assessed in 2011 eventually will
be reconstructed in the order of their ranking in the Revitalization/Expansion program queue. As stated in
Appendix F of the Master Plan:
As the current queue of schools scheduled for Revitalization/Expansion projects is
completed, schools [assessed in 2011] will be placed in the Revitalization/Expansion
queue according to their score. The movement of the newly assessed schools to the
Revitalization/Expansion queue will occur as planning and construction funds are
programmed in the six year CIP period. 22
MCPS has not re-assessed the schools in the Revitalization/Expansion program queue since 2011 nor
does the school system plan to reassess the condition of these buildings in the future.
2. Scope of Revitalization/Expansion Projects
Revitalization/Expansion projects rarely involve mere renovation of an existing structure. Rather,
Revitalization/Expansion projects frequently result in complete or near complete reconstruction of school
buildings. MCPS has concluded that reconstructing a building to current specifications often costs less
than renovating the building to the same specifications. As stated in the Educational Facilities Master
Plan:
The cost to revitalize/expand an older school so that it is educationally, technologically,
and physically up-to-date, is similar to the cost to construct a new school. In most cases,
a life cycle cost analysis shows it is more cost effective to replace an older school facility
rather than attempt to salvage portions of the old facility. 23
22 FY16 Educational Facilities Master Plan, page F-1. 23 Ibid., page 3-6.
11
A Review of the MCPS Revitalization/Expansion Program
OLO Report 2015-12, Chapter II July 28, 2015
The Public School Construction Program (PSCP) for the State of Maryland requires feasibility studies to
be submitted for each project that may include abandonment of an existing facility or demolition of more
than 50% of an existing structure. This submittal occurs prior to MCPS planning approval and must
contain a forty-year life cycle cost comparison of options ranging from renovation to replacement. The
analysis must contain the following cost elements for each option:
• Initial construction
• Demolition
• Additional site acquisition
• Temporary student housing and transportation
• Interest on or outstanding bond debt
• Forty-year maintenance costs
• Forty-year energy costs
The renovation costs data incorporates information contained with the feasibility study as it relates to
existing conditions of building components. For each component, the design team must evaluate the
quality of the original design and construction, the existing condition, and the remaining life expectancy.
These components include:
• Primary Structure (foundation, floor(s), roof)
• Building Envelope (walls, windows, doors)
• Secondary Systems (floor finishes, ceiling, interior wall)
• Mechanical Systems (HVAC, plumbing)
• Electrical Systems (base service, fire alarm, exit lighting, security, lighting)
• Electronic Communications (video, voice, data)
• Site Conditions/Utilities (roadways, parking, storm water drainage, sidewalks, playfields &
equipment, service access, utilities: water, sewer, electric, telephone)
In addition to components, several facility items must considered and reviewed for potential cost
implications. These include:
• Compliance with accessibility codes
• Compliance with fire and life safety codes
• Compliance with environmental regulations
• Historical significance, as determined by Maryland Historical Trust (MHT)
• Energy use, including embedded energy and sustainability factors
• Placement of students and staff during construction
Appendix A to this report includes an example of how MCPS uses the feasibility study process to
determine the scope of a school capital improvements project.
12
A Review of the MCPS Revitalization/Expansion Program
OLO Report 2015-12, Chapter III July 28, 2015
CHAPTER III: MCPS POLICIES AND PRACTICES This chapter provides an overview of the policies and practices that govern MCPS’ capital improvements
program, with particular emphasis on the school building Revitalization/Expansion program. The chapter
includes two sections:
• Section A. Facility Management Policies and Regulation
• Section B. Educational Facilities Master Plan
A. Facility Management Policies and Regulation
The Board of Education has established facility management guidelines regarding the maintenance,
improvement, and eventual replacement of the more than 200 MCPS school buildings. Two Board-
approved policy statements and a Superintendent-approved regulation govern school building facility
management, including the Revitalization/Expansion program.
1. Policy FKB
In 2010, the Board amended Policy FKB, Sustaining and Modernizing Montgomery County Public
Schools Facilities.1 The stated purpose of the Policy FKB is to “affirm the Board of Education’s
commitment to maintain all school facilities in conditions that maximize learning opportunities for every
student in the county.” In updating Policy FKB, the Board placed increased emphasis on extending the
useful life of school buildings by employing routine facility maintenance measures to defer the need for
building revitalization and expansion.
In addition to endorsing routine maintenance protocols, Policy FKB directs MCPS to perform scheduled
life-cycle replacements of major building systems (including heating, ventilation and air conditioning
systems, roofs, plumbing, information technology systems, and security systems). The Board adopted the
policy of systematic life-cycle replacement of building systems to “maintain all school facilities at
consistently high operational levels and maximize the life-span of existing physical plant asset.”
Nonetheless, the policy asserts that routine maintenance and replacement of major building systems
cannot extend the useful life of a facility indefinitely. The policy assumes that, after time, a school
building as originally designed and built will no longer meet MCPS educational and infrastructure
management standards. Policy FKB states that:
School facilities, building systems, and equipment all require various and continuing
levels of attention to achieve their expected life-cycle. MCPS views facility maintenance
as being on a continuum ranging from routine repairs to replacement of building systems
to complete modernization2 of facilities.3
1 Montgomery County Board of Education Policy FKB, Sustaining and Modernizing Montgomery County Public
Schools Facilities, December 7, 2010, https://www.montgomeryschoolsmd.org/departments/policy/pdf/fkb.pdf 2 The Board of Education most recently amended Policy FKB in December 2010, before MCPS replaced the term
“modernization” with “revitalization/expansion.” 3 Ibid., page 2.
13
A Review of the MCPS Revitalization/Expansion Program
OLO Report 2015-12, Chapter III July 28, 2015
2. Policy FAA
Policy FAA, Long-range Educational Facilities Planning, presents the Board’s strategy for identifying
long-term school infrastructure needs. 4 The Board first adopted Policy FAA in April 1986 and most
recently amended it in June 2014. The current policy statement cites enrollment trends as a primary
factor in school facility planning. According to the policy:
The fundamental goal of facilities planning is to provide a sound educational
environment for changing enrollment. The number of students, their geographic
distribution, and the demographic characteristics of this population all impact facilities
planning. 5
MCPS prepares two long-range facility planning documents: the six-year Capital Improvements Program
(CIP) and the Educational Facilities Master Plan (EFMP). These documents identify MCPS facility
construction and improvement projects. Policy FAA indicates that the CIP and EFMP should include
“enrollment projections, educational program needs, and available school capacity countywide and
identify:
• when new schools and additions will be needed to keep facilities current with enrollment levels
and educational program needs;
• funds for systemic maintenance and replacement projects to sustain schools in good condition and
extend their useful life;
• a schedule to revitalize/expand older school buildings in order to continue their use on a cost-
effective basis, and to keep facilities current with educational program needs;
• when school closures and consolidations are appropriate due to declining enrollment
levels; and
• facility utilization levels, capacity calculations, school enrollment size guidelines, and
school site size. 6
Most relevant to this report, the third bullet above requires MCPS to develop a long-term planning
schedule for the Revitalization/Expansion program.
3. Regulation FAA-RA
Regulation FAA-RA is the Superintendent-approved implementation plan for the Board of Education
Policy FAA.7 The regulation provides guidance on how MCPS should conduct the long-term facility
planning process. The MCPS Superintendent most recently revised FAA-RA in June 2015.
The revised regulation specifies the types of information to be included in the six-year Capital
Improvements Program (CIP) and the Educational Facilities Master Plan (EFMP). The regulation calls
for the planning documents to include six-year enrollment forecasts for each school as well as long-term
(10-to-15 year) forecasts for secondary schools. According to the regulation, enrollment forecasts “are
4 Montgomery County Board of Education Policy FAA, Long-range Educational Facilities Planning, June 17, 2014,
https://www.montgomeryschoolsmd.org/departments/policy/pdf/fkb.pdf 5 Ibid., page 1. 6 Ibid., page 3. 7 Montgomery County Public Schools Regulation FAA-RA, Long-range Educational Facilities Planning, June 6,
2015, http://www.montgomeryschoolsmd.org/departments/policy/pdf/faara.final.pdf
14
A Review of the MCPS Revitalization/Expansion Program
OLO Report 2015-12, Chapter III July 28, 2015
the basis for evaluating school space needs and initiating planning activities.” Regulation FAA-RA
further specifies preferred school enrollment ranges and student-to-classroom ratios to be used in
evaluating the level of school utilization.8 As directed by the regulation, MCPS is to annually update
enrollment forecasts and school utilization assessments for use in preparation of the Superintendent’s CIP
recommendations.
B. Educational Facilities Master Plan
MCPS annually publishes a single document that combines both the approved Educational Facilities
Master Plan. The approved FY16 Educational Facilities Master Plan includes two sections that address
the Revitalization/ Expansion program.
1. Chapter Three, Facility Planning Objectives
Chapter Three of the approved FY16 Educational Facilities Master Plan presents six objectives that guide
the MCPS facility planning process and the development of the CIP. The third objective is titled
“Sustaining and Revitalizing Facilities.” This objective opens with the following statement:
The Board of Education, superintendent of schools, and school community recognize the
necessity to maintain schools in good condition through a range of activities that includes
routine daily maintenance to the systematic replacement of building systems…. The
Board of Education, superintendent of schools, and school community also recognize that
even well-maintained facilities eventually reach the end of their useful life span and
require revitalization. Revitalization/Expansion projects update school facilities and
provide the variety of instructional spaces necessary to effectively deliver the current
curriculum.9
Chapter Three outlines the method for assessing the condition of school buildings and determining which
warrant inclusion in the Revitalization/Expansion program. MCPS employs a scoring system called the
“Facilities Assessment with Criteria and Testing (FACT)” to evaluate the condition of older school
buildings. The FACT methodology assigns scores based on a series of educational program and physical
infrastructure criteria.
2. Appendix F
Appendix F of the approved FY16 Educational Facilities Master Plan summarizes MCPS’ system for
assessing schools for inclusion in the Revitalization/Expansion program. The document states that “while
a primary factor in the need to revitalize a school is the age of the facility, a number of other factors also
are considered in assessing the condition of a school.” As described in Appendix F, the other factors
include “educational program” parameters (i.e. open plan schools, and controlled access) and “physical
infrastructure” parameters (facility design, utility and energy efficiency, and maintenance costs). The
FACT methodology assigns scoring for each specification as detailed in Chapter VI of this report.
The Educational Facilities Master Plan also includes a schedule of planned Revitalization/Expansion
projects. The Revitalization/Expansion program queue appears in Chapter VI of this report. The order of
schools in the queue correspond to the rankings in the FACT assessments; the queue is intended to remain
unchanged until each school on the list is reconstructed or otherwise improved.
8 The term “school utilization” refers to whether a school building is at, over, or under capacity. 9 FY16 Educational Facilities Master Plan, page 3-6.
15
A Review of the MCPS Revitalization/Expansion Program
OLO Report 2015-12, Chapter IV July 28, 2015
CHAPTER IV: CAPITAL IMPROVEMENT EXPENDITURES This chapter presents information about the expenditures programmed in the Capital Improvements Program (CIP) for MCPS Revitalization/Expansion projects as well as building system improvements to extend the useful life of school buildings. The chapter includes four sections:
• Section A. Overview of MCPS Capital Improvements Program
• Section B. Revitalization/Expansion Program Expenditures
• Section C. Projects to Extend the Useful Life of School Buildings
• Section D. Expenditures on Revitalization/Expansion versus Extending the Useful Life of Buildings
A. Overview of MCPS Capital Improvements Program
Over the past five years, the approved Capital Improvements Program (CIP), including Council-approved FY16 amendments, budgeted $1,269 million in capital improvements for MCPS facilities. For the purpose of this report, OLO divided the MCPS CIP into four categories:
• Revitalization/Expansion: Spending to replace schools through the Revitalization/Expansion program. As discussed below, the MCPS Revitalization/Expansion capital projects frequently include expansion of building space, and therefore also address school capacity needs.
• Projects to Extend the Useful Life of School Buildings: Aggregate spending on 11 MCPS capital projects as described Section C of this chapter.
• New Schools and Additions: Projects to construct new schools or to build additions to existing school buildings.
• Other Projects: Other MCPS CIP projects including Technology Modernization, Relocatable Classrooms, and Facility Planning.
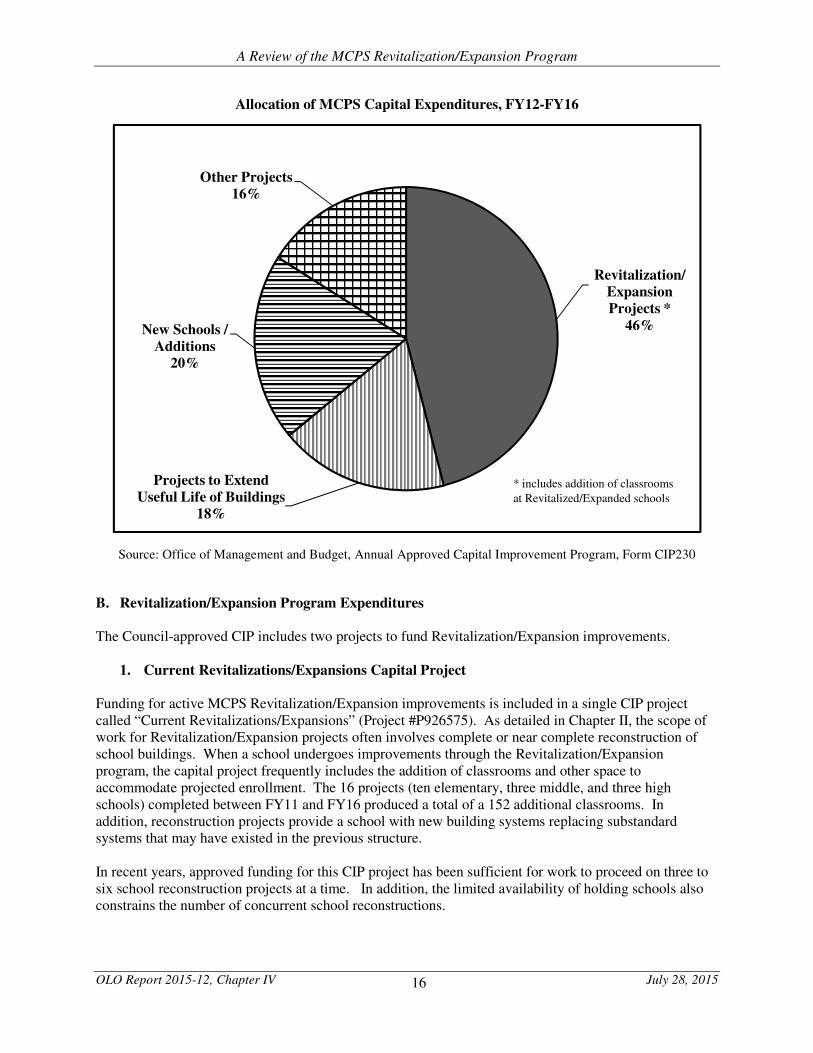
The pie chart on the next page shows the allocation of MCPS capital expenditures (from all revenue sources) combined for the five year period of FY12 through FY16. As shown in the table, Revitalization/Expansion projects, by far, comprise the largest portion of MCPS capital spending. For FY12 through FY16, Revitalization/Expansion expenditures totaled $578.2 million1 or nearly half of total MCPS capital expenditures. During this five-year period, MCPS spent more than twice as much on Revitalization/Expansion of existing schools than on individual projects to construct new schools and build additions.
1 This total reflects the costs for the Current Revitalizations/Expansions CIP project (#P926575).
16
A Review of the MCPS Revitalization/Expansion Program
OLO Report 2015-12, Chapter IV July 28, 2015
Allocation of MCPS Capital Expenditures, FY12-FY16
Source: Office of Management and Budget, Annual Approved Capital Improvement Program, Form CIP230
B. Revitalization/Expansion Program Expenditures
The Council-approved CIP includes two projects to fund Revitalization/Expansion improvements.
1. Current Revitalizations/Expansions Capital Project Funding for active MCPS Revitalization/Expansion improvements is included in a single CIP project called “Current Revitalizations/Expansions” (Project #P926575). As detailed in Chapter II, the scope of work for Revitalization/Expansion projects often involves complete or near complete reconstruction of school buildings. When a school undergoes improvements through the Revitalization/Expansion program, the capital project frequently includes the addition of classrooms and other space to accommodate projected enrollment. The 16 projects (ten elementary, three middle, and three high schools) completed between FY11 and FY16 produced a total of a 152 additional classrooms. In addition, reconstruction projects provide a school with new building systems replacing substandard systems that may have existed in the previous structure. In recent years, approved funding for this CIP project has been sufficient for work to proceed on three to six school reconstruction projects at a time. In addition, the limited availability of holding schools also constrains the number of concurrent school reconstructions.
Revitalization/Expansion Projects *
46%
Projects to Extend Useful Life of Buildings
18%
New Schools / Additions
20%
Other Projects16%
* includes addition of classrooms
at Revitalized/Expanded schools
17
A Review of the MCPS Revitalization/Expansion Program
OLO Report 2015-12, Chapter IV July 28, 2015
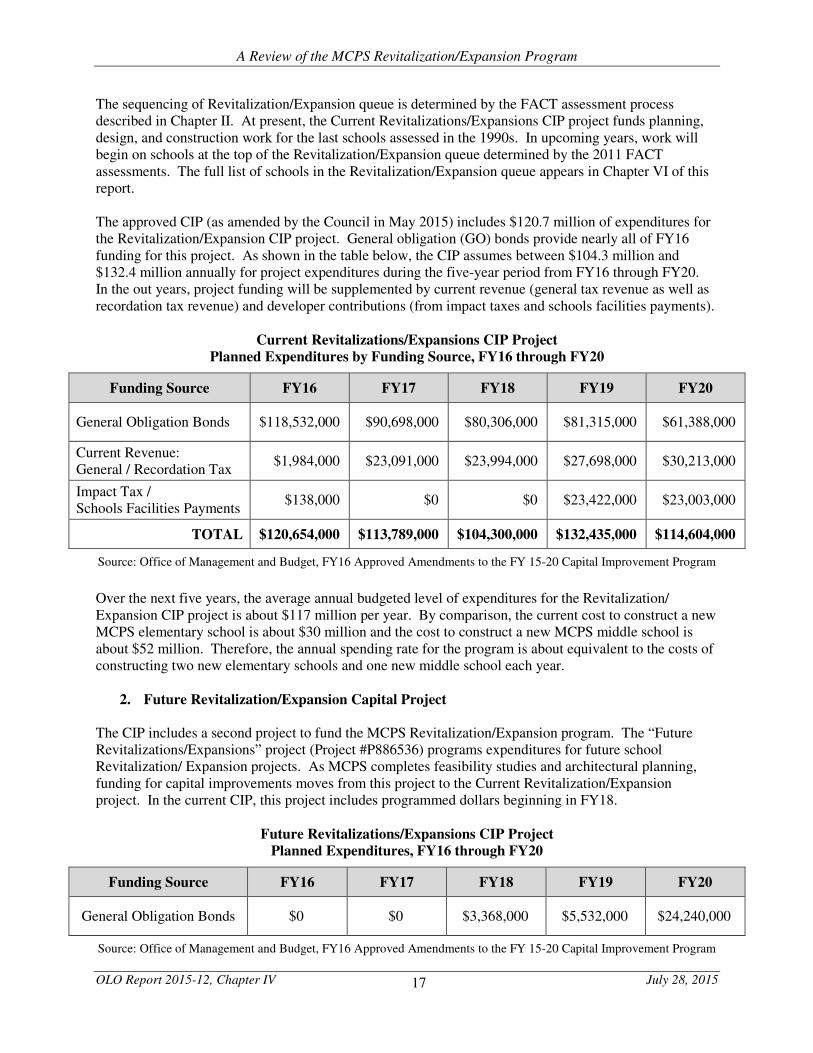
The sequencing of Revitalization/Expansion queue is determined by the FACT assessment process described in Chapter II. At present, the Current Revitalizations/Expansions CIP project funds planning, design, and construction work for the last schools assessed in the 1990s. In upcoming years, work will begin on schools at the top of the Revitalization/Expansion queue determined by the 2011 FACT assessments. The full list of schools in the Revitalization/Expansion queue appears in Chapter VI of this report. The approved CIP (as amended by the Council in May 2015) includes $120.7 million of expenditures for the Revitalization/Expansion CIP project. General obligation (GO) bonds provide nearly all of FY16 funding for this project. As shown in the table below, the CIP assumes between $104.3 million and $132.4 million annually for project expenditures during the five-year period from FY16 through FY20. In the out years, project funding will be supplemented by current revenue (general tax revenue as well as recordation tax revenue) and developer contributions (from impact taxes and schools facilities payments).
Current Revitalizations/Expansions CIP Project Planned Expenditures by Funding Source, FY16 through FY20
Funding Source FY16 FY17 FY18 FY19 FY20
General Obligation Bonds $118,532,000 $90,698,000 $80,306,000 $81,315,000 $61,388,000
Current Revenue: General / Recordation Tax
$1,984,000 $23,091,000 $23,994,000 $27,698,000 $30,213,000
Impact Tax / Schools Facilities Payments
$138,000 $0 $0 $23,422,000 $23,003,000
TOTAL $120,654,000 $113,789,000 $104,300,000 $132,435,000 $114,604,000
Source: Office of Management and Budget, FY16 Approved Amendments to the FY 15-20 Capital Improvement Program
Over the next five years, the average annual budgeted level of expenditures for the Revitalization/ Expansion CIP project is about $117 million per year. By comparison, the current cost to construct a new MCPS elementary school is about $30 million and the cost to construct a new MCPS middle school is about $52 million. Therefore, the annual spending rate for the program is about equivalent to the costs of constructing two new elementary schools and one new middle school each year.
2. Future Revitalization/Expansion Capital Project The CIP includes a second project to fund the MCPS Revitalization/Expansion program. The “Future Revitalizations/Expansions” project (Project #P886536) programs expenditures for future school Revitalization/ Expansion projects. As MCPS completes feasibility studies and architectural planning, funding for capital improvements moves from this project to the Current Revitalization/Expansion project. In the current CIP, this project includes programmed dollars beginning in FY18.
Future Revitalizations/Expansions CIP Project Planned Expenditures, FY16 through FY20
Funding Source FY16 FY17 FY18 FY19 FY20
General Obligation Bonds $0 $0 $3,368,000 $5,532,000 $24,240,000
Source: Office of Management and Budget, FY16 Approved Amendments to the FY 15-20 Capital Improvement Program
18
A Review of the MCPS Revitalization/Expansion Program
OLO Report 2015-12, Chapter IV July 28, 2015
General obligation bonds are the sole funding source for this project. The CIP includes $3.4 million of programmed expenditures in FY18 growing to $24.2 million in FY20. The combined programmed FY15 – FY20 CIP expenditures for the Current and Future Revitalization/Expansion capital projects total to $618.9 million, or about $123.8 million per year.
C. Projects to Extend the Useful Life of School Buildings As mentioned in the previous chapter, MCPS stated policy is to invest in facility upkeep and systematic life-cycle replacement of major building systems in order to maximize the useful life of school buildings. The MCPS Educational Facilities Master Plan states that “by providing a higher level of maintenance at schools, facilities will be in good condition for a longer period of time.”2 MCPS asserts that schools built or revitalized in the past 30 years “are generally of higher construction quality than schools built prior to 1985” and that “it is possible to extend the useful life through a high level of maintenance and replacement of building systems.” 3 The County CIP includes at least eleven projects upgrade school buildings and to replace school building systems. These capital projects serve to extend the useful life of MCPS facilities.
ADA Compliance
A number of existing MCPS facilities are at least partially inaccessible for a variety of disabling conditions. This project funds the installation of elevators, wheelchair lifts, restroom modifications, automatic door openers, access ramps, and curb cuts and other site-specific improvements to bring school buildings into compliance with the requirements of the Federal Americans with Disabilities Act (ADA).
Asbestos Abatement This project funds asbestos management services in MCPS facilities in accordance with the Federal Asbestos Hazard Emergency Response Act (AHERA).
Building Modifications and Program Improvements
This project provides limited facility modifications to support program offerings at schools that are not scheduled for Revitalization/Expansion. Improvements funded by this project include modifications to provide adequate space for new instructional programs and administrative support.
Energy Conservation The MCPS Energy Conservation Program is intended to reduce energy consumption in school buildings. This project funds implementation of the Energy Conservation Program by improving building mechanical systems, retrofitting building lighting and control systems, and controlling HVAC equipment through computer management systems.
Fire Safety Code Upgrades
This project provides funding to install sprinklers, escape windows, exit signs, fire alarm devices, exit stairs, and hood and fire suppression systems as necessary to comply with the County’s fire code.
2 FY16 Educational Facilities Master Plan, page 3-7. 3 Ibid., page 3-6.
19
A Review of the MCPS Revitalization/Expansion Program
OLO Report 2015-12, Chapter IV July 28, 2015
HVAC (Mechanical Systems) Replacement
This project funds the systematic replacement of heating, ventilating, air conditioning, automated temperature controls, and plumbing systems.
Improved (Safe) Access to Schools
This project funds vehicular and pedestrian access improvements at schools. Improvements include road widening and adding or modifying entrance and exits to schools.
Indoor Air Quality Improvements
This project funds mechanical retrofits and building envelope modifications necessary to correct indoor air quality problems in MCPS facilities. Remediation efforts include carpet removal, floor and ceiling tile replacement, and minor mechanical retrofits.
Planned Life Cycle Asset Replacement
The Planned Life Cycle Asset Replacement (PLAR) program is intended to provide for scheduled replacement of facility equipment and site features based on their age and condition. This project funds PLAR activities including code corrections, physical education facility improvements, exterior resurfacing, and replacement of doors, lighting, communication systems, and flooring.
Restroom Renovations This project provides funding for renovation of restroom plumbing fixtures, accessories, and room finishes in buildings that were built or renovated before 1985 (excluding schools with Revitalization/Expansion planning of construction funding in the six-year CIP).
Roof Replacement School building roofs have an expected life of 20 years. This project funds the planned replacement of roofs that have reached the end of their expected useful life.
As shown in the table on the following page, these eleven CIP projects have combined programmed FY16 capital expenditures of $49.8 million. The funding source for all of the programmed expenditures is County general obligation bonds. The largest project, by far, is HVAC (Mechanical Systems) Replacement with a FY16 appropriation of $16.0 million, an amount equal to nearly one-third of the combined total for the eleven projects. In past years, the State of Maryland has contributed to some of these capital projects, most notably the HVAC Replacement project. In FY15, the State contributed $7.6 million to support replacement of HVAC systems in MCPS buildings. As the amount of future State support for these projects is unknown, the CIP shows no State Aid in FY16 and beyond.

20
A Review of the MCPS Revitalization/Expansion Program
OLO Report 2015-12, Chapter IV July 28, 2015
Capital Improvement Projects to Extend the Useful Life of MCPS Buildings (FY16 Capital Budget Expenditure Amounts)
CIP Project Name (Project Number) County GO Bonds
ADA Compliance (P796235) $3,000,000
Asbestos Abatement (P816695) $1,145,000
Building Modifications and Program Improvements (P076506)
$3,500,000
Energy Conservation (P796222) $2,057,000
Fire Safety Code Upgrades (P016532) $2,000,000
HVAC (Mechanical Systems) Replacement (P816633) $16,000,000
Improved (Safe) Access to Schools (P975051) $1,200,000
Indoor Air Quality Improvements (P006503) $2,147,000
Planned Life Cycle Asset Replacement (P896586) $9,750,000
Restroom Renovations (P056501) $1,000,000
Roof Replacement (P766995) $8,000,000
TOTAL $49,799,000
Source: Office of Management and Budget, FY16 Approved Amendments to the FY 15-20 Capital Improvement Program
The Educational Facilities Master Plan indicates that MCPS intends to make facility upkeep and building systems replacement projects a funding priority in future years. The Master Plan states that “in the coming years, more funds will be directed to capital projects that sustain facilities in good condition for longer periods than have been feasible in the past.” 4 However, the current Council-approved approved CIP does not reflect the Master Plan policy. The table on the next page displays the aggregate planned spending for the 11 capital projects listed above for each of the next five years. The data show that expenditures for these 11 projects are planned to fall from $49.8 million in FY16 to $34.6 million in FY20, a 30% decrease.
4 Ibid., page 3-6.
21
A Review of the MCPS Revitalization/Expansion Program
OLO Report 2015-12, Chapter IV July 28, 2015
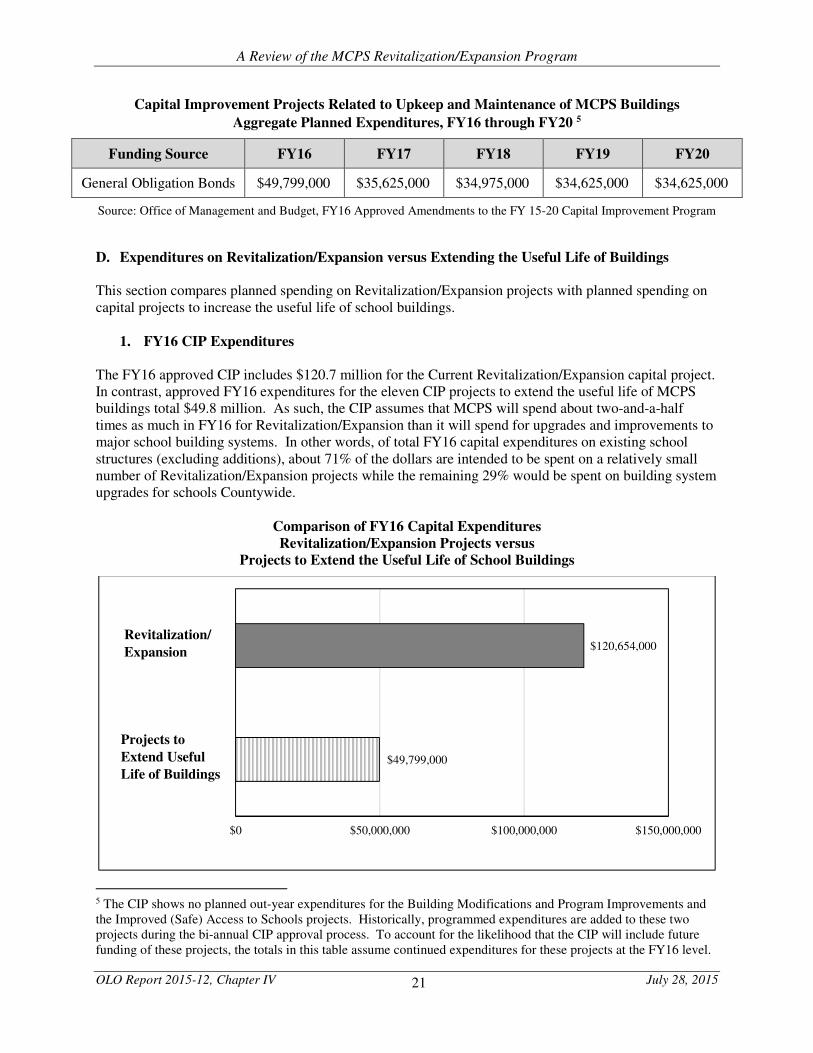
Capital Improvement Projects Related to Upkeep and Maintenance of MCPS Buildings
Aggregate Planned Expenditures, FY16 through FY20 5
Funding Source FY16 FY17 FY18 FY19 FY20
General Obligation Bonds $49,799,000 $35,625,000 $34,975,000 $34,625,000 $34,625,000
Source: Office of Management and Budget, FY16 Approved Amendments to the FY 15-20 Capital Improvement Program
D. Expenditures on Revitalization/Expansion versus Extending the Useful Life of Buildings This section compares planned spending on Revitalization/Expansion projects with planned spending on capital projects to increase the useful life of school buildings.
1. FY16 CIP Expenditures The FY16 approved CIP includes $120.7 million for the Current Revitalization/Expansion capital project. In contrast, approved FY16 expenditures for the eleven CIP projects to extend the useful life of MCPS buildings total $49.8 million. As such, the CIP assumes that MCPS will spend about two-and-a-half times as much in FY16 for Revitalization/Expansion than it will spend for upgrades and improvements to major school building systems. In other words, of total FY16 capital expenditures on existing school structures (excluding additions), about 71% of the dollars are intended to be spent on a relatively small number of Revitalization/Expansion projects while the remaining 29% would be spent on building system upgrades for schools Countywide.
Comparison of FY16 Capital Expenditures Revitalization/Expansion Projects versus
Projects to Extend the Useful Life of School Buildings
5 The CIP shows no planned out-year expenditures for the Building Modifications and Program Improvements and the Improved (Safe) Access to Schools projects. Historically, programmed expenditures are added to these two projects during the bi-annual CIP approval process. To account for the likelihood that the CIP will include future funding of these projects, the totals in this table assume continued expenditures for these projects at the FY16 level.
$49,799,000
$120,654,000
$0 $50,000,000 $100,000,000 $150,000,000
Revitalization/
Expansion
Projects to
Extend Useful
Life of Buildings
22
A Review of the MCPS Revitalization/Expansion Program
OLO Report 2015-12, Chapter IV July 28, 2015
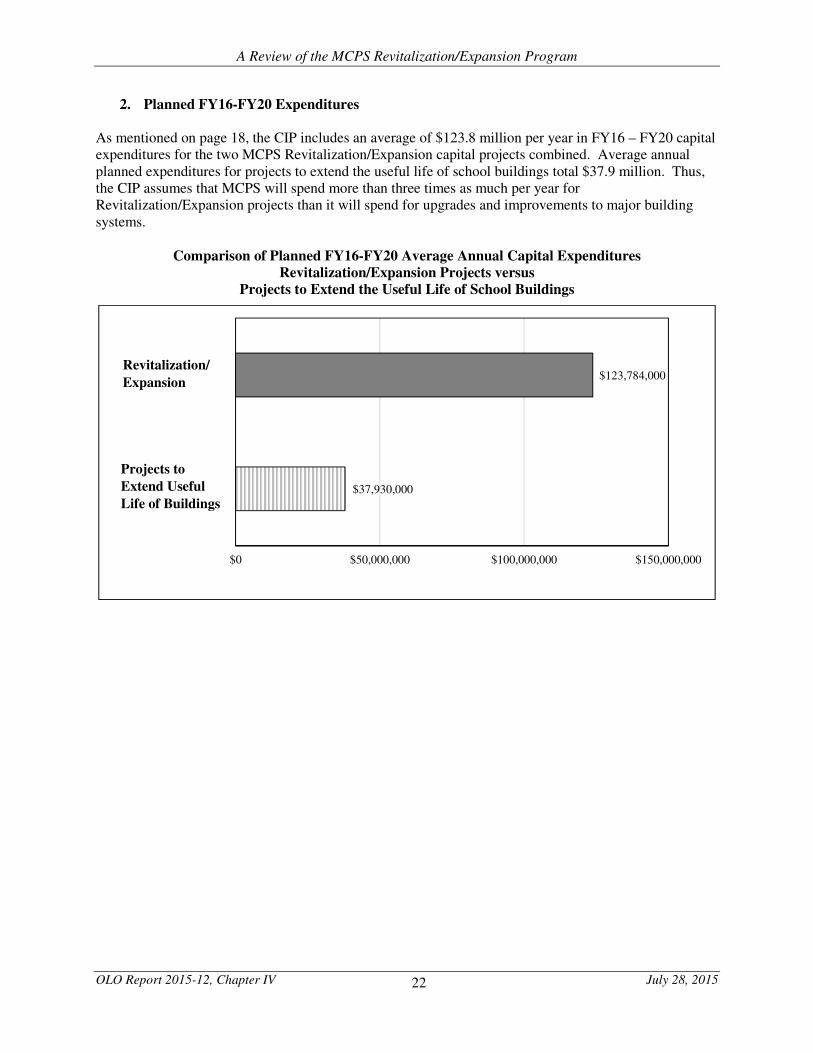
2. Planned FY16-FY20 Expenditures As mentioned on page 18, the CIP includes an average of $123.8 million per year in FY16 – FY20 capital expenditures for the two MCPS Revitalization/Expansion capital projects combined. Average annual planned expenditures for projects to extend the useful life of school buildings total $37.9 million. Thus, the CIP assumes that MCPS will spend more than three times as much per year for Revitalization/Expansion projects than it will spend for upgrades and improvements to major building systems.
Comparison of Planned FY16-FY20 Average Annual Capital Expenditures Revitalization/Expansion Projects versus
Projects to Extend the Useful Life of School Buildings
$37,930,000
$123,784,000
$0 $50,000,000 $100,000,000 $150,000,000
Revitalization/
Expansion
Projects to
Extend Useful
Life of Buildings
23
A Review of the MCPS Revitalization/Expansion Program
OLO Report 2015-12, Chapter V July 28, 2015
CHAPTER V: AGE AND LOCATION OF SCHOOL BUILDINGS AND MODERNIZATIONS This chapter presents data and analysis regarding the age of MCPS schools as well as the location and
building age of modernizations projects. The chapter includes seven sections:
• Section A. Source Data and Methodology
• Section B. Age and Location of School Buildings
• Section C. Current Age of School Buildings
• Section D. School Modernizations: Geographic Distribution of Projects and Age at Completion
• Section E. FACT 2011 Assessed Schools and Future Outlook
• Section F. Special Program and Holding Schools
• Section G. OLO Observations Regarding Building Age and Modernizations
A. Source Data and Methodology
For data on individual schools and Revitalization/ Expansion schedule, OLO staff relied on data included
in the approved FY16 Educational Facilities Master Plan. For this chapter, OLO divided elementary,
middle, and high schools into four geographic regions of the County known as “Quad Clusters” as
defined by MCPS in the FY16 Educational Facilities Master CIP.
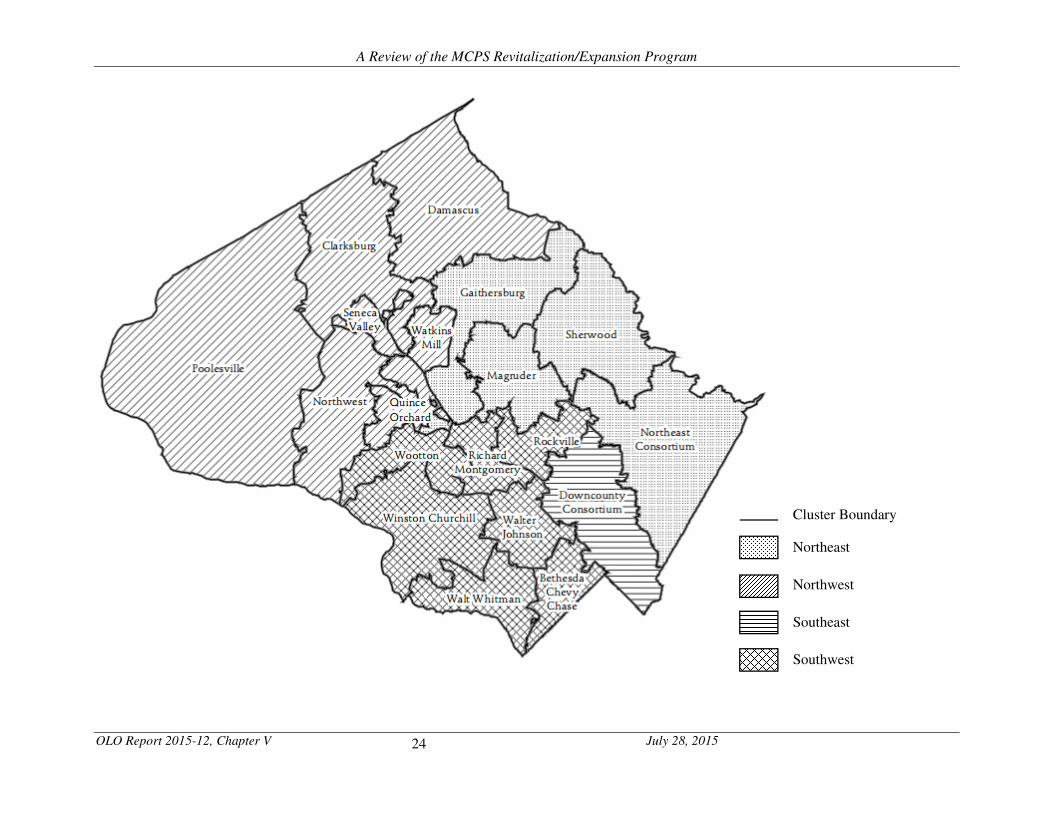
A map of the MCPS Quad Clusters appears on the following page. OLO staff named Quad Clusters by
their relative geographic location in the County:
• Northeast;
• Northwest;
• Downcounty Consortium; and
• Southwest.
The programmatic and design needs of career and technology, alternative education, special education,
and holding schools differ from those of other MCPS schools. Therefore, OLO did not include these
schools in the Quad Cluster analysis. Rather, OLO conducted a separate analysis of the age and
modernization history of these schools. (See Section F of this chapter).
24
A Review of the MCPS Revitalization/Expansion Program
OLO Report 2015-12, Chapter V July 28, 2015
Cluster Boundary
Southwest
Northwest
Southeast
Northeast
25
A Review of the MCPS Revitalization/Expansion Program
OLO Report 2015-12, Chapter V July 28, 2015
B. Age and Location of School Buildings
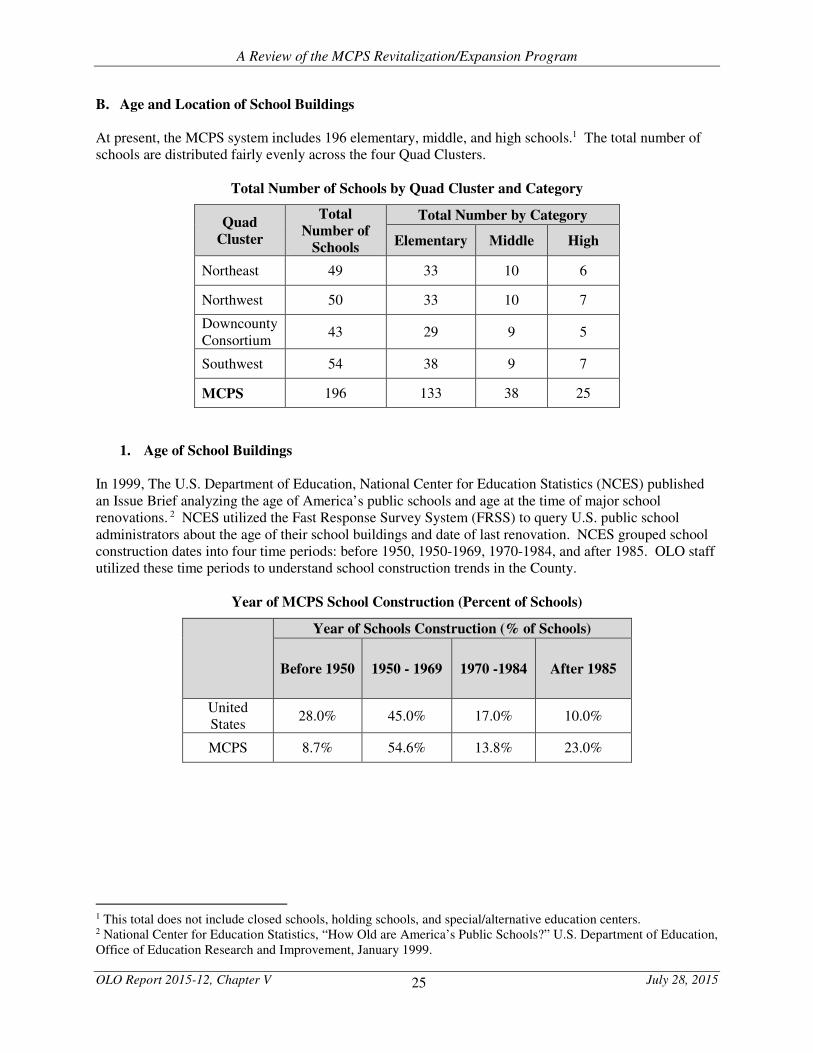
At present, the MCPS system includes 196 elementary, middle, and high schools.1 The total number of
schools are distributed fairly evenly across the four Quad Clusters.
Total Number of Schools by Quad Cluster and Category
Quad
Cluster
Total
Number of
Schools
Total Number by Category
Elementary Middle High
Northeast 49 33 10 6
Northwest 50 33 10 7
Downcounty
Consortium 43 29 9 5
Southwest 54 38 9 7
MCPS 196 133 38 25
1. Age of School Buildings
In 1999, The U.S. Department of Education, National Center for Education Statistics (NCES) published
an Issue Brief analyzing the age of America’s public schools and age at the time of major school
renovations. 2 NCES utilized the Fast Response Survey System (FRSS) to query U.S. public school
administrators about the age of their school buildings and date of last renovation. NCES grouped school
construction dates into four time periods: before 1950, 1950-1969, 1970-1984, and after 1985. OLO staff
utilized these time periods to understand school construction trends in the County.
Year of MCPS School Construction (Percent of Schools)
Year of Schools Construction (% of Schools)
Before 1950 1950 - 1969 1970 -1984 After 1985
United
States 28.0% 45.0% 17.0% 10.0%
MCPS 8.7% 54.6% 13.8% 23.0%
1 This total does not include closed schools, holding schools, and special/alternative education centers. 2 National Center for Education Statistics, “How Old are America’s Public Schools?” U.S. Department of Education,
Office of Education Research and Improvement, January 1999.
26
A Review of the MCPS Revitalization/Expansion Program
OLO Report 2015-12, Chapter V July 28, 2015
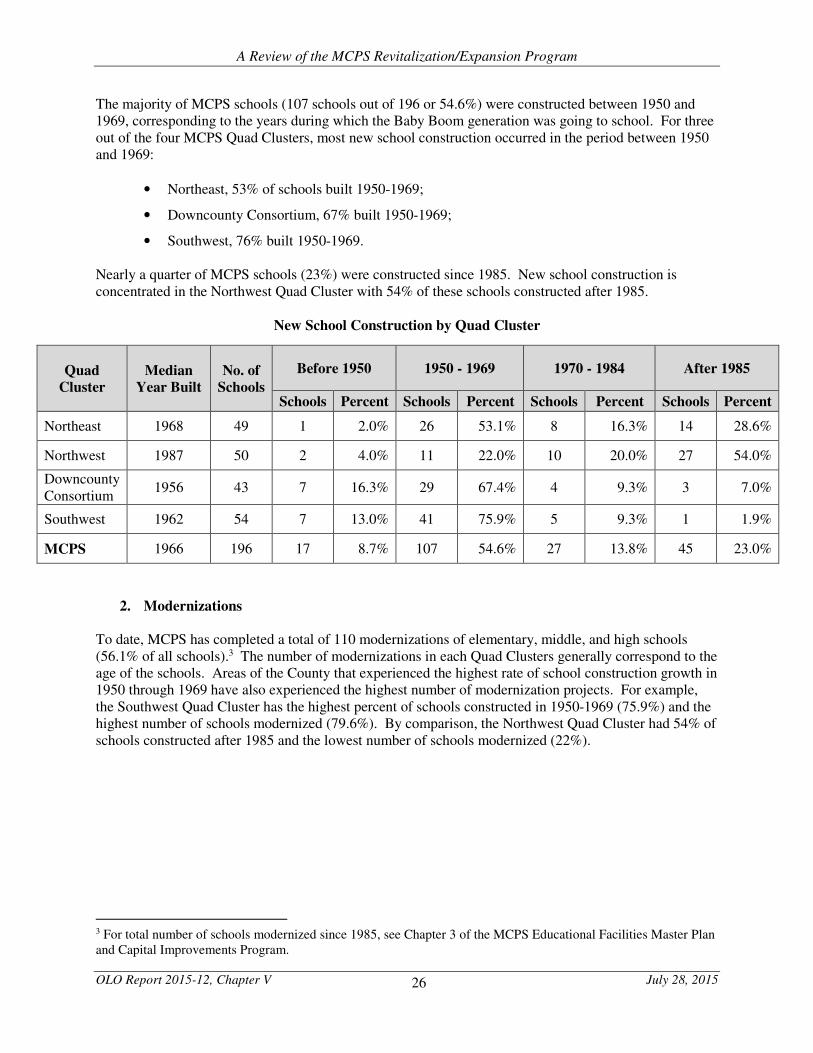
The majority of MCPS schools (107 schools out of 196 or 54.6%) were constructed between 1950 and
1969, corresponding to the years during which the Baby Boom generation was going to school. For three
out of the four MCPS Quad Clusters, most new school construction occurred in the period between 1950
and 1969:
• Northeast, 53% of schools built 1950-1969;
• Downcounty Consortium, 67% built 1950-1969;
• Southwest, 76% built 1950-1969.
Nearly a quarter of MCPS schools (23%) were constructed since 1985. New school construction is
concentrated in the Northwest Quad Cluster with 54% of these schools constructed after 1985.
New School Construction by Quad Cluster
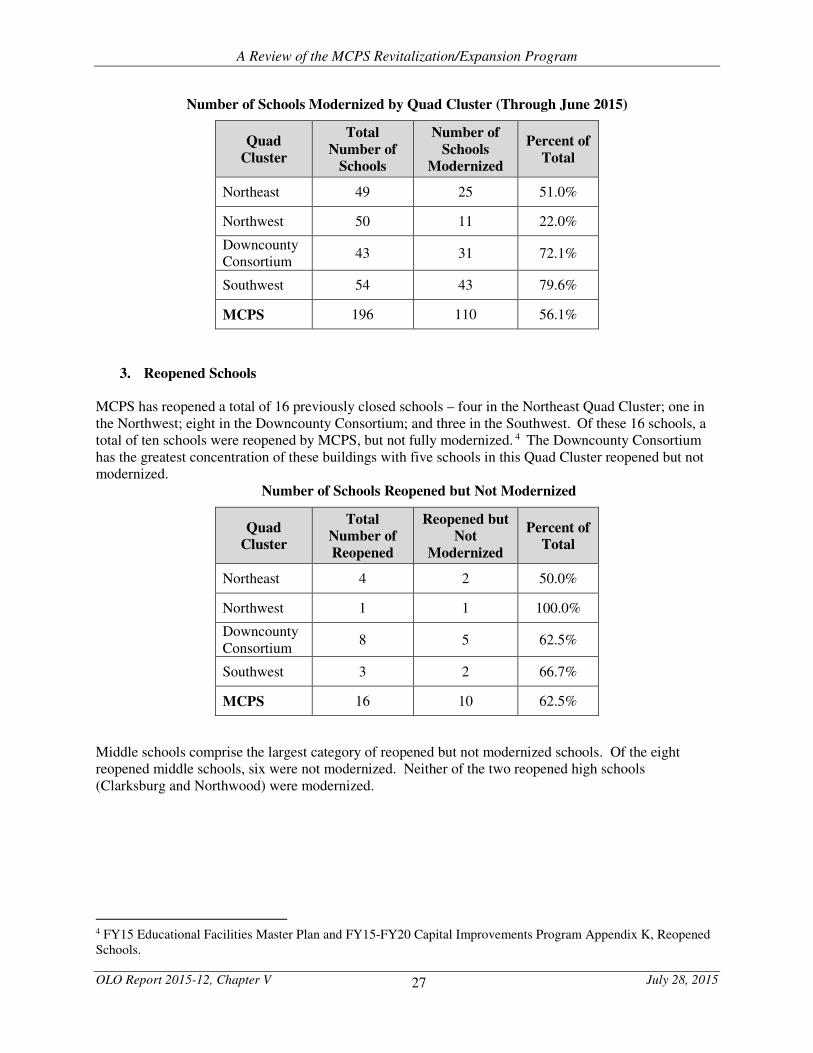
2. Modernizations
To date, MCPS has completed a total of 110 modernizations of elementary, middle, and high schools
(56.1% of all schools).3 The number of modernizations in each Quad Clusters generally correspond to the
age of the schools. Areas of the County that experienced the highest rate of school construction growth in
1950 through 1969 have also experienced the highest number of modernization projects. For example,
the Southwest Quad Cluster has the highest percent of schools constructed in 1950-1969 (75.9%) and the
highest number of schools modernized (79.6%). By comparison, the Northwest Quad Cluster had 54% of
schools constructed after 1985 and the lowest number of schools modernized (22%).
3 For total number of schools modernized since 1985, see Chapter 3 of the MCPS Educational Facilities Master Plan
and Capital Improvements Program.
Quad
Cluster
Median
Year Built
No. of
Schools
Before 1950 1950 - 1969 1970 - 1984 After 1985
Schools Percent Schools Percent Schools Percent Schools Percent
Northeast 1968 49 1 2.0% 26 53.1% 8 16.3% 14 28.6%
Northwest 1987 50 2 4.0% 11 22.0% 10 20.0% 27 54.0%
Downcounty
Consortium 1956 43 7 16.3% 29 67.4% 4 9.3% 3 7.0%
Southwest 1962 54 7 13.0% 41 75.9% 5 9.3% 1 1.9%
MCPS 1966 196 17 8.7% 107 54.6% 27 13.8% 45 23.0%
27
A Review of the MCPS Revitalization/Expansion Program
OLO Report 2015-12, Chapter V July 28, 2015
Number of Schools Modernized by Quad Cluster (Through June 2015)
Quad
Cluster
Total
Number of
Schools
Number of
Schools
Modernized
Percent of
Total
Northeast 49 25 51.0%
Northwest 50 11 22.0%
Downcounty
Consortium 43 31 72.1%
Southwest 54 43 79.6%
MCPS 196 110 56.1%
3. Reopened Schools
MCPS has reopened a total of 16 previously closed schools – four in the Northeast Quad Cluster; one in
the Northwest; eight in the Downcounty Consortium; and three in the Southwest. Of these 16 schools, a
total of ten schools were reopened by MCPS, but not fully modernized. 4 The Downcounty Consortium
has the greatest concentration of these buildings with five schools in this Quad Cluster reopened but not
modernized.
Number of Schools Reopened but Not Modernized
Quad
Cluster
Total
Number of
Reopened
Reopened but
Not
Modernized
Percent of
Total
Northeast 4 2 50.0%
Northwest 1 1 100.0%
Downcounty
Consortium 8 5 62.5%
Southwest 3 2 66.7%
MCPS 16 10 62.5%
Middle schools comprise the largest category of reopened but not modernized schools. Of the eight
reopened middle schools, six were not modernized. Neither of the two reopened high schools
(Clarksburg and Northwood) were modernized.
4 FY15 Educational Facilities Master Plan and FY15-FY20 Capital Improvements Program Appendix K, Reopened
Schools.
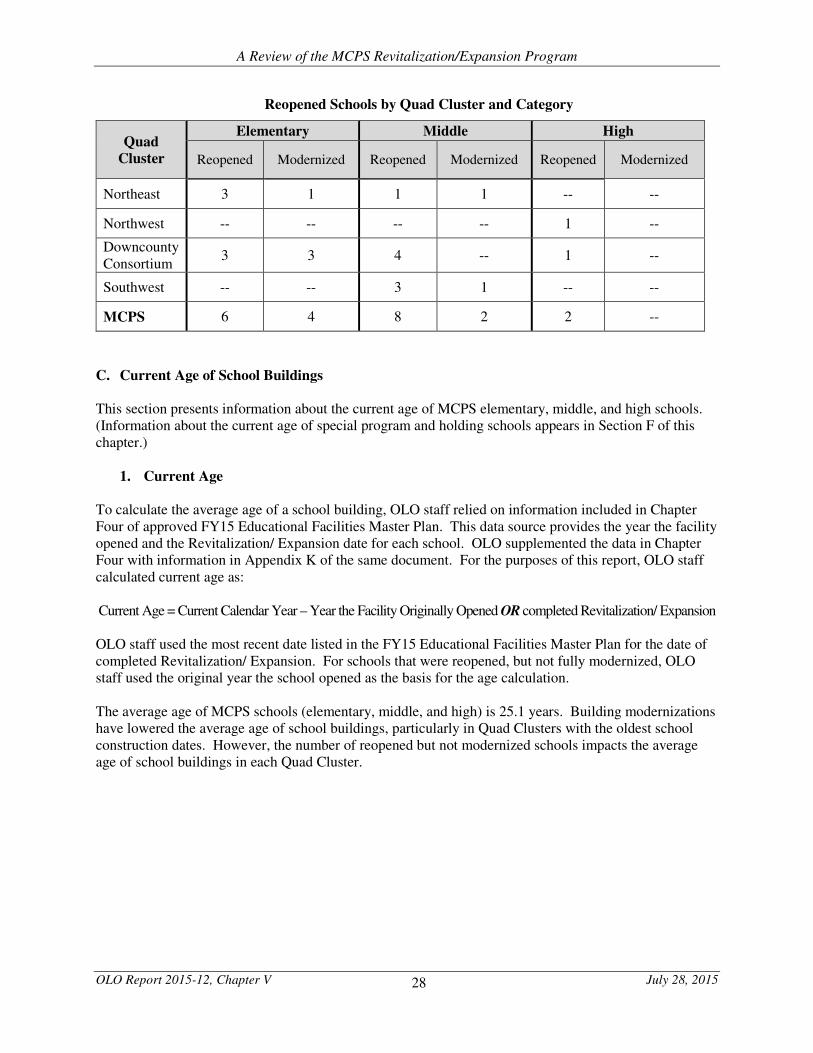
28
A Review of the MCPS Revitalization/Expansion Program
OLO Report 2015-12, Chapter V July 28, 2015
Reopened Schools by Quad Cluster and Category
Quad
Cluster
Elementary Middle High
Reopened Modernized Reopened Modernized Reopened Modernized
Northeast 3 1 1 1 -- --
Northwest -- -- -- -- 1 --
Downcounty
Consortium 3 3 4 -- 1 --
Southwest -- -- 3 1 -- --
MCPS 6 4 8 2 2 --
C. Current Age of School Buildings
This section presents information about the current age of MCPS elementary, middle, and high schools.
(Information about the current age of special program and holding schools appears in Section F of this
chapter.)
1. Current Age
To calculate the average age of a school building, OLO staff relied on information included in Chapter
Four of approved FY15 Educational Facilities Master Plan. This data source provides the year the facility
opened and the Revitalization/ Expansion date for each school. OLO supplemented the data in Chapter
Four with information in Appendix K of the same document. For the purposes of this report, OLO staff
calculated current age as:
Current Age = Current Calendar Year – Year the Facility Originally Opened OR completed Revitalization/ Expansion
OLO staff used the most recent date listed in the FY15 Educational Facilities Master Plan for the date of
completed Revitalization/ Expansion. For schools that were reopened, but not fully modernized, OLO
staff used the original year the school opened as the basis for the age calculation.
The average age of MCPS schools (elementary, middle, and high) is 25.1 years. Building modernizations
have lowered the average age of school buildings, particularly in Quad Clusters with the oldest school
construction dates. However, the number of reopened but not modernized schools impacts the average
age of school buildings in each Quad Cluster.
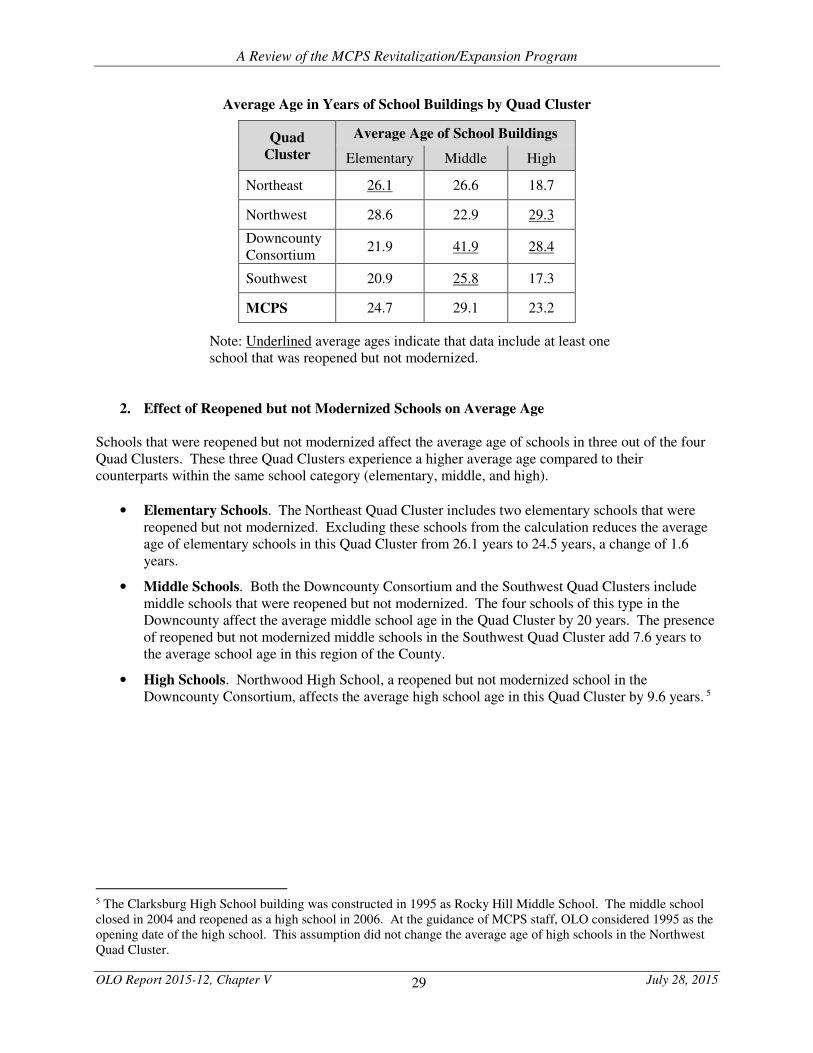
29
A Review of the MCPS Revitalization/Expansion Program
OLO Report 2015-12, Chapter V July 28, 2015
Average Age in Years of School Buildings by Quad Cluster
Quad
Cluster
Average Age of School Buildings
Elementary Middle High
Northeast 26.1 26.6 18.7
Northwest 28.6 22.9 29.3
Downcounty
Consortium 21.9 41.9 28.4
Southwest 20.9 25.8 17.3
MCPS 24.7 29.1 23.2
Note: Underlined average ages indicate that data include at least one
school that was reopened but not modernized.
2. Effect of Reopened but not Modernized Schools on Average Age
Schools that were reopened but not modernized affect the average age of schools in three out of the four
Quad Clusters. These three Quad Clusters experience a higher average age compared to their
counterparts within the same school category (elementary, middle, and high).
• Elementary Schools. The Northeast Quad Cluster includes two elementary schools that were
reopened but not modernized. Excluding these schools from the calculation reduces the average
age of elementary schools in this Quad Cluster from 26.1 years to 24.5 years, a change of 1.6
years.
• Middle Schools. Both the Downcounty Consortium and the Southwest Quad Clusters include
middle schools that were reopened but not modernized. The four schools of this type in the
Downcounty affect the average middle school age in the Quad Cluster by 20 years. The presence
of reopened but not modernized middle schools in the Southwest Quad Cluster add 7.6 years to
the average school age in this region of the County.
• High Schools. Northwood High School, a reopened but not modernized school in the
Downcounty Consortium, affects the average high school age in this Quad Cluster by 9.6 years. 5
5 The Clarksburg High School building was constructed in 1995 as Rocky Hill Middle School. The middle school
closed in 2004 and reopened as a high school in 2006. At the guidance of MCPS staff, OLO considered 1995 as the
opening date of the high school. This assumption did not change the average age of high schools in the Northwest
Quad Cluster.
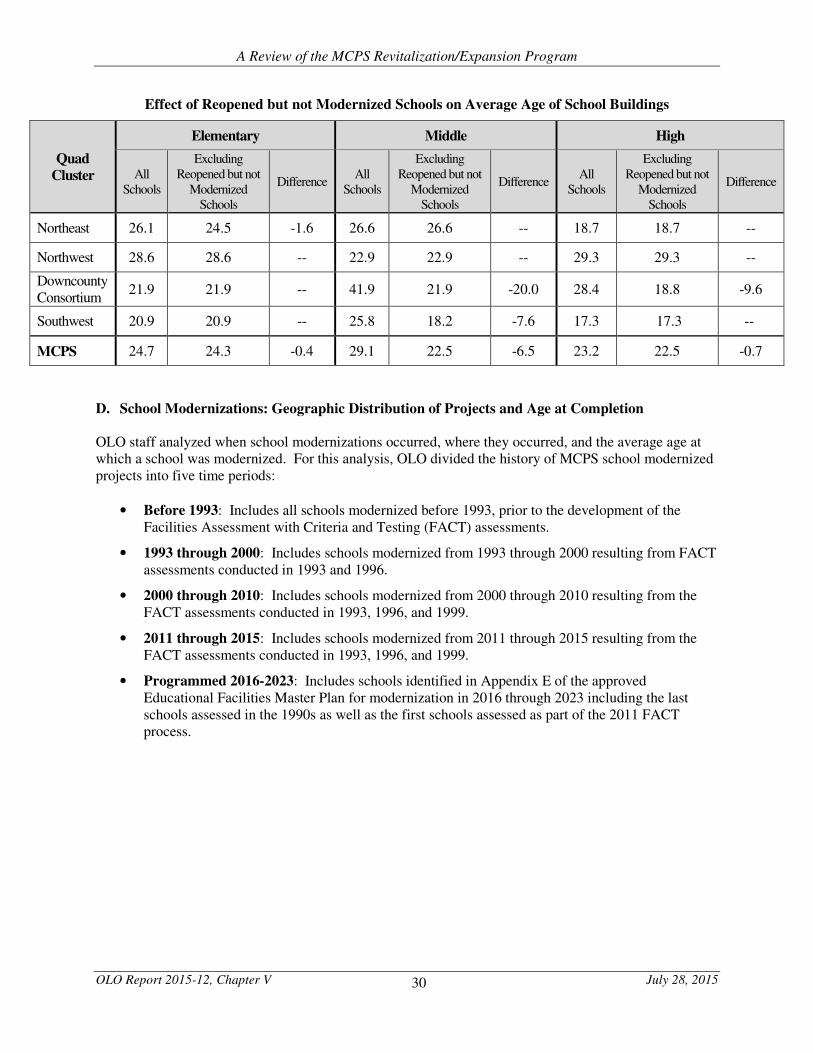
30
A Review of the MCPS Revitalization/Expansion Program
OLO Report 2015-12, Chapter V July 28, 2015
Effect of Reopened but not Modernized Schools on Average Age of School Buildings
Quad
Cluster
Elementary Middle High
All
Schools
Excluding
Reopened but not
Modernized
Schools
Difference All
Schools
Excluding
Reopened but not
Modernized
Schools
Difference All
Schools
Excluding
Reopened but not
Modernized
Schools
Difference
Northeast 26.1 24.5 -1.6 26.6 26.6 -- 18.7 18.7 --
Northwest 28.6 28.6 -- 22.9 22.9 -- 29.3 29.3 --
Downcounty
Consortium 21.9 21.9 -- 41.9 21.9 -20.0 28.4 18.8 -9.6
Southwest 20.9 20.9 -- 25.8 18.2 -7.6 17.3 17.3 --
MCPS 24.7 24.3 -0.4 29.1 22.5 -6.5 23.2 22.5 -0.7
D. School Modernizations: Geographic Distribution of Projects and Age at Completion
OLO staff analyzed when school modernizations occurred, where they occurred, and the average age at
which a school was modernized. For this analysis, OLO divided the history of MCPS school modernized
projects into five time periods:
• Before 1993: Includes all schools modernized before 1993, prior to the development of the
Facilities Assessment with Criteria and Testing (FACT) assessments.
• 1993 through 2000: Includes schools modernized from 1993 through 2000 resulting from FACT
assessments conducted in 1993 and 1996.
• 2000 through 2010: Includes schools modernized from 2000 through 2010 resulting from the
FACT assessments conducted in 1993, 1996, and 1999.
• 2011 through 2015: Includes schools modernized from 2011 through 2015 resulting from the
FACT assessments conducted in 1993, 1996, and 1999.
• Programmed 2016-2023: Includes schools identified in Appendix E of the approved
Educational Facilities Master Plan for modernization in 2016 through 2023 including the last
schools assessed in the 1990s as well as the first schools assessed as part of the 2011 FACT
process.
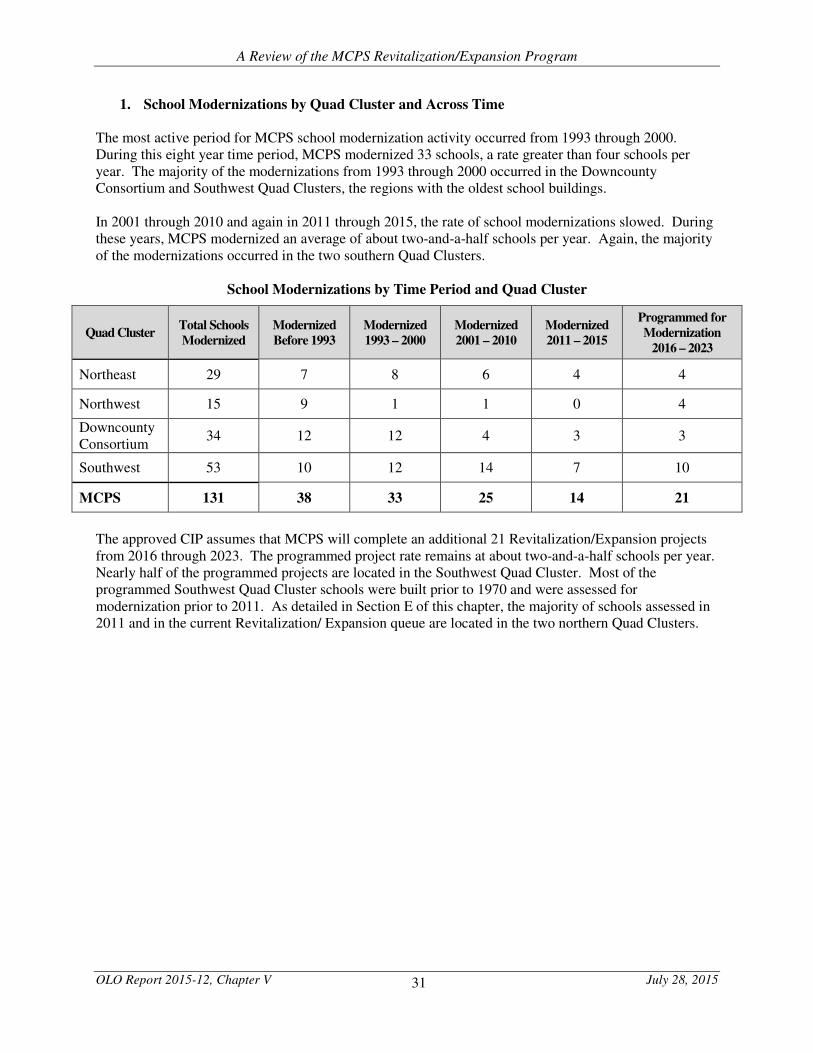
31
A Review of the MCPS Revitalization/Expansion Program
OLO Report 2015-12, Chapter V July 28, 2015
1. School Modernizations by Quad Cluster and Across Time
The most active period for MCPS school modernization activity occurred from 1993 through 2000.
During this eight year time period, MCPS modernized 33 schools, a rate greater than four schools per
year. The majority of the modernizations from 1993 through 2000 occurred in the Downcounty
Consortium and Southwest Quad Clusters, the regions with the oldest school buildings.
In 2001 through 2010 and again in 2011 through 2015, the rate of school modernizations slowed. During
these years, MCPS modernized an average of about two-and-a-half schools per year. Again, the majority
of the modernizations occurred in the two southern Quad Clusters.
School Modernizations by Time Period and Quad Cluster
Quad Cluster Total Schools
Modernized
Modernized
Before 1993
Modernized
1993 – 2000
Modernized
2001 – 2010
Modernized
2011 – 2015
Programmed for
Modernization
2016 – 2023
Northeast 29 7 8 6 4 4
Northwest 15 9 1 1 0 4
Downcounty
Consortium 34 12 12 4 3 3
Southwest 53 10 12 14 7 10
MCPS 131 38 33 25 14 21
The approved CIP assumes that MCPS will complete an additional 21 Revitalization/Expansion projects
from 2016 through 2023. The programmed project rate remains at about two-and-a-half schools per year.
Nearly half of the programmed projects are located in the Southwest Quad Cluster. Most of the
programmed Southwest Quad Cluster schools were built prior to 1970 and were assessed for
modernization prior to 2011. As detailed in Section E of this chapter, the majority of schools assessed in
2011 and in the current Revitalization/ Expansion queue are located in the two northern Quad Clusters.
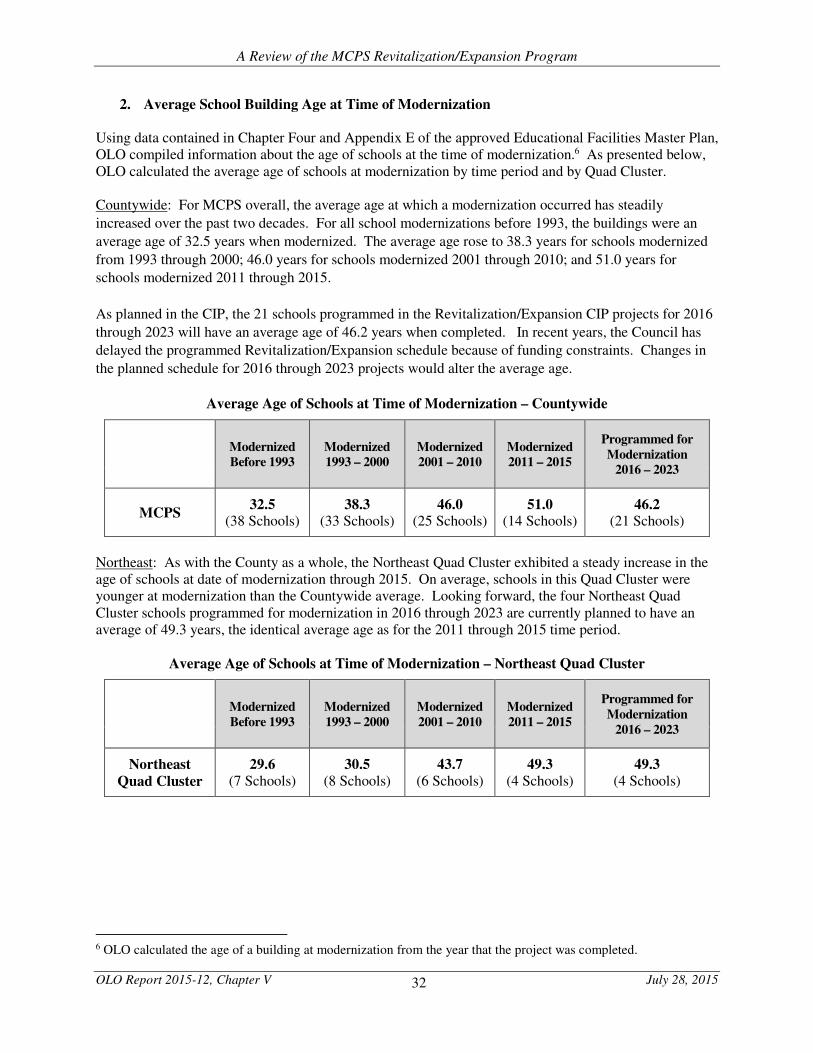
32
A Review of the MCPS Revitalization/Expansion Program
OLO Report 2015-12, Chapter V July 28, 2015
2. Average School Building Age at Time of Modernization
Using data contained in Chapter Four and Appendix E of the approved Educational Facilities Master Plan,
OLO compiled information about the age of schools at the time of modernization.6 As presented below,
OLO calculated the average age of schools at modernization by time period and by Quad Cluster.
Countywide: For MCPS overall, the average age at which a modernization occurred has steadily
increased over the past two decades. For all school modernizations before 1993, the buildings were an
average age of 32.5 years when modernized. The average age rose to 38.3 years for schools modernized
from 1993 through 2000; 46.0 years for schools modernized 2001 through 2010; and 51.0 years for
schools modernized 2011 through 2015.
As planned in the CIP, the 21 schools programmed in the Revitalization/Expansion CIP projects for 2016
through 2023 will have an average age of 46.2 years when completed. In recent years, the Council has
delayed the programmed Revitalization/Expansion schedule because of funding constraints. Changes in
the planned schedule for 2016 through 2023 projects would alter the average age.
Average Age of Schools at Time of Modernization – Countywide
Modernized
Before 1993
Modernized
1993 – 2000
Modernized
2001 – 2010
Modernized
2011 – 2015
Programmed for
Modernization
2016 – 2023
MCPS 32.5
(38 Schools) 38.3
(33 Schools) 46.0
(25 Schools) 51.0
(14 Schools) 46.2
(21 Schools)
Northeast: As with the County as a whole, the Northeast Quad Cluster exhibited a steady increase in the
age of schools at date of modernization through 2015. On average, schools in this Quad Cluster were
younger at modernization than the Countywide average. Looking forward, the four Northeast Quad
Cluster schools programmed for modernization in 2016 through 2023 are currently planned to have an
average of 49.3 years, the identical average age as for the 2011 through 2015 time period.
Average Age of Schools at Time of Modernization – Northeast Quad Cluster
Modernized
Before 1993
Modernized
1993 – 2000
Modernized
2001 – 2010
Modernized
2011 – 2015
Programmed for
Modernization
2016 – 2023
Northeast
Quad Cluster
29.6
(7 Schools) 30.5
(8 Schools) 43.7
(6 Schools) 49.3
(4 Schools) 49.3
(4 Schools)
6 OLO calculated the age of a building at modernization from the year that the project was completed.
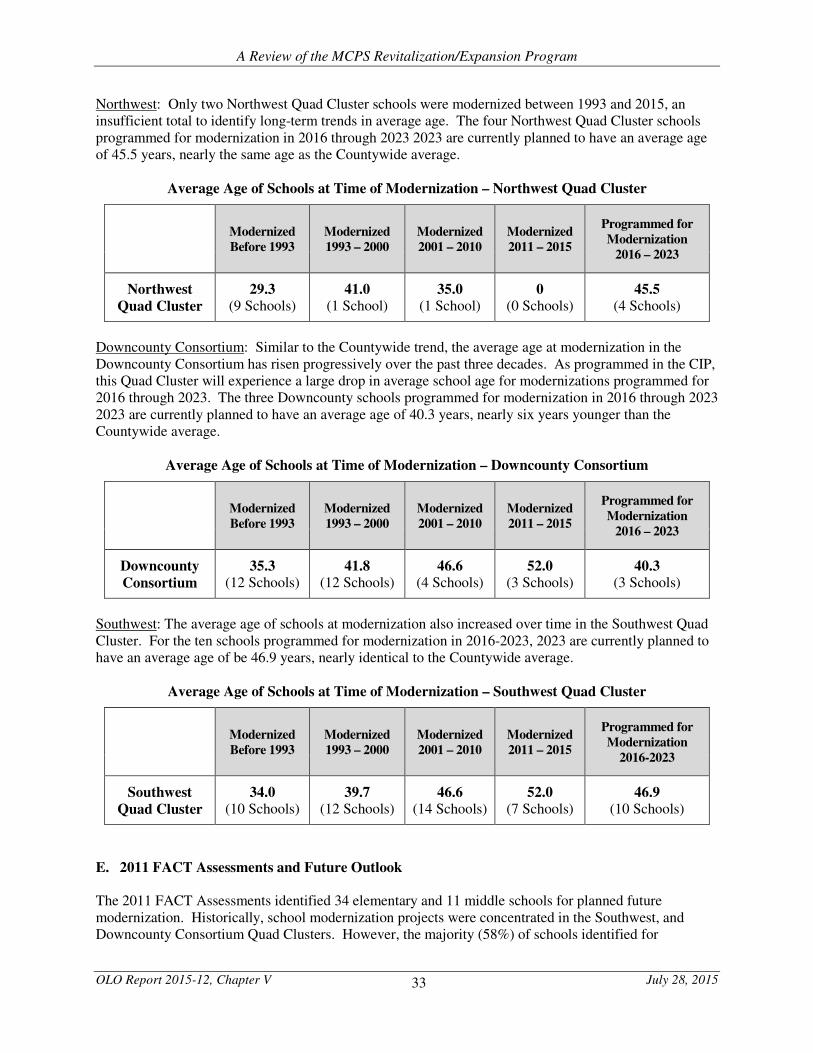
33
A Review of the MCPS Revitalization/Expansion Program
OLO Report 2015-12, Chapter V July 28, 2015
Northwest: Only two Northwest Quad Cluster schools were modernized between 1993 and 2015, an
insufficient total to identify long-term trends in average age. The four Northwest Quad Cluster schools
programmed for modernization in 2016 through 2023 2023 are currently planned to have an average age
of 45.5 years, nearly the same age as the Countywide average.
Average Age of Schools at Time of Modernization – Northwest Quad Cluster
Modernized
Before 1993
Modernized
1993 – 2000
Modernized
2001 – 2010
Modernized
2011 – 2015
Programmed for
Modernization
2016 – 2023
Northwest
Quad Cluster
29.3
(9 Schools) 41.0
(1 School) 35.0
(1 School) 0
(0 Schools) 45.5
(4 Schools)
Downcounty Consortium: Similar to the Countywide trend, the average age at modernization in the
Downcounty Consortium has risen progressively over the past three decades. As programmed in the CIP,
this Quad Cluster will experience a large drop in average school age for modernizations programmed for
2016 through 2023. The three Downcounty schools programmed for modernization in 2016 through 2023
2023 are currently planned to have an average age of 40.3 years, nearly six years younger than the
Countywide average.
Average Age of Schools at Time of Modernization – Downcounty Consortium
Modernized
Before 1993
Modernized
1993 – 2000
Modernized
2001 – 2010
Modernized
2011 – 2015
Programmed for
Modernization
2016 – 2023
Downcounty
Consortium
35.3
(12 Schools) 41.8
(12 Schools) 46.6
(4 Schools) 52.0
(3 Schools) 40.3
(3 Schools)
Southwest: The average age of schools at modernization also increased over time in the Southwest Quad
Cluster. For the ten schools programmed for modernization in 2016-2023, 2023 are currently planned to
have an average age of be 46.9 years, nearly identical to the Countywide average.
Average Age of Schools at Time of Modernization – Southwest Quad Cluster
Modernized
Before 1993
Modernized
1993 – 2000
Modernized
2001 – 2010
Modernized
2011 – 2015
Programmed for
Modernization
2016-2023
Southwest
Quad Cluster
34.0
(10 Schools) 39.7
(12 Schools) 46.6
(14 Schools) 52.0
(7 Schools) 46.9
(10 Schools)
E. 2011 FACT Assessments and Future Outlook
The 2011 FACT Assessments identified 34 elementary and 11 middle schools for planned future
modernization. Historically, school modernization projects were concentrated in the Southwest, and
Downcounty Consortium Quad Clusters. However, the majority (58%) of schools identified for
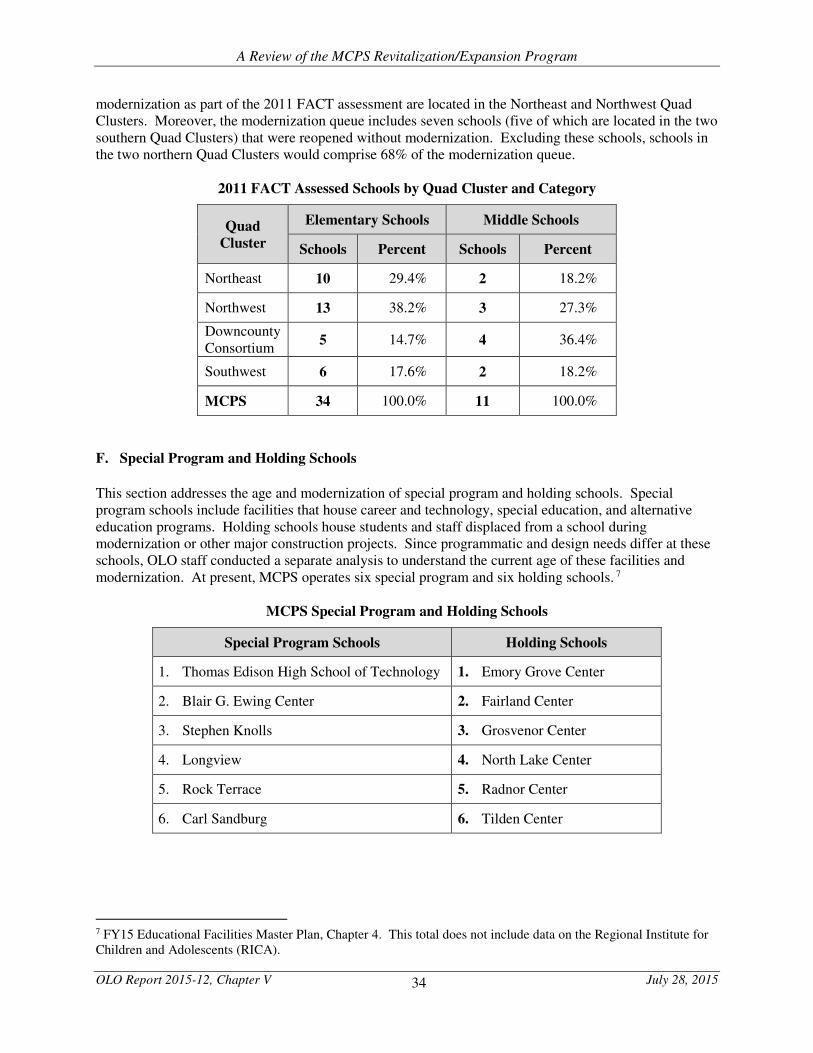
34
A Review of the MCPS Revitalization/Expansion Program
OLO Report 2015-12, Chapter V July 28, 2015
modernization as part of the 2011 FACT assessment are located in the Northeast and Northwest Quad
Clusters. Moreover, the modernization queue includes seven schools (five of which are located in the two
southern Quad Clusters) that were reopened without modernization. Excluding these schools, schools in
the two northern Quad Clusters would comprise 68% of the modernization queue.
2011 FACT Assessed Schools by Quad Cluster and Category
Quad
Cluster
Elementary Schools Middle Schools
Schools Percent Schools Percent
Northeast 10 29.4% 2 18.2%
Northwest 13 38.2% 3 27.3%
Downcounty
Consortium 5 14.7% 4 36.4%
Southwest 6 17.6% 2 18.2%
MCPS 34 100.0% 11 100.0%
F. Special Program and Holding Schools
This section addresses the age and modernization of special program and holding schools. Special
program schools include facilities that house career and technology, special education, and alternative
education programs. Holding schools house students and staff displaced from a school during
modernization or other major construction projects. Since programmatic and design needs differ at these
schools, OLO staff conducted a separate analysis to understand the current age of these facilities and
modernization. At present, MCPS operates six special program and six holding schools. 7
MCPS Special Program and Holding Schools
Special Program Schools Holding Schools
1. Thomas Edison High School of Technology 1. Emory Grove Center
2. Blair G. Ewing Center 2. Fairland Center
3. Stephen Knolls 3. Grosvenor Center
4. Longview 4. North Lake Center
5. Rock Terrace 5. Radnor Center
6. Carl Sandburg 6. Tilden Center
7 FY15 Educational Facilities Master Plan, Chapter 4. This total does not include data on the Regional Institute for
Children and Adolescents (RICA).
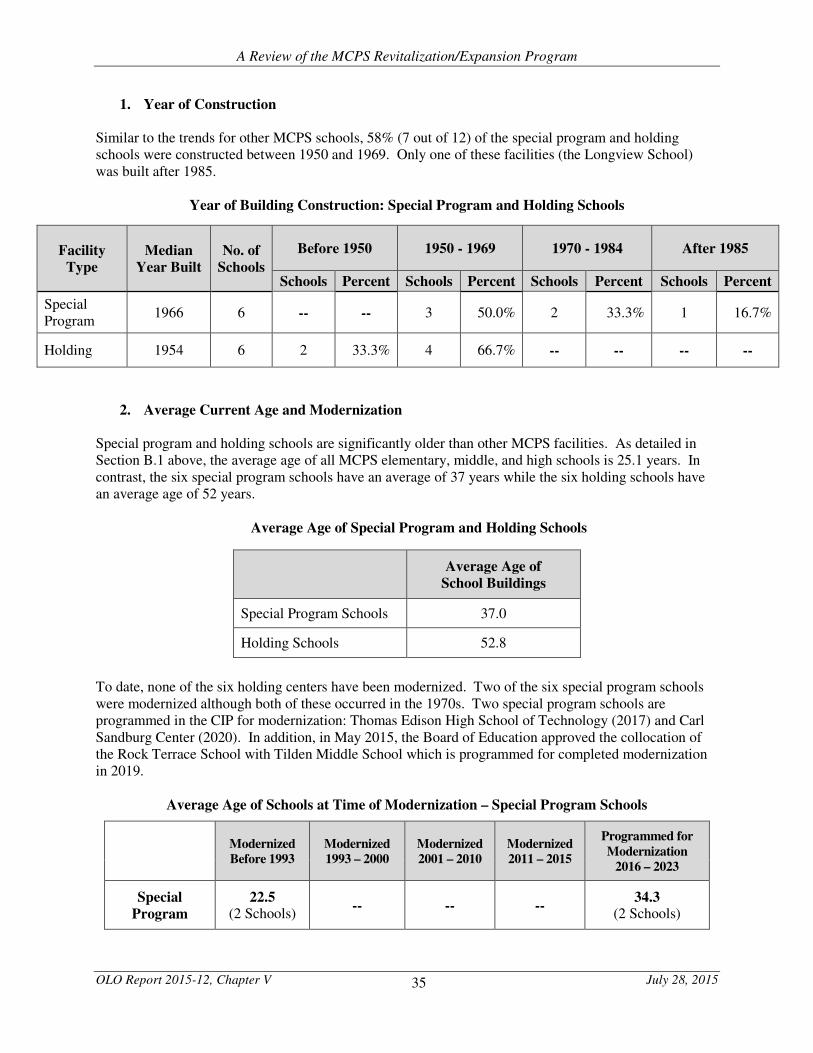
35
A Review of the MCPS Revitalization/Expansion Program
OLO Report 2015-12, Chapter V July 28, 2015
1. Year of Construction
Similar to the trends for other MCPS schools, 58% (7 out of 12) of the special program and holding
schools were constructed between 1950 and 1969. Only one of these facilities (the Longview School)
was built after 1985.
Year of Building Construction: Special Program and Holding Schools
2. Average Current Age and Modernization
Special program and holding schools are significantly older than other MCPS facilities. As detailed in
Section B.1 above, the average age of all MCPS elementary, middle, and high schools is 25.1 years. In
contrast, the six special program schools have an average of 37 years while the six holding schools have
an average age of 52 years.
Average Age of Special Program and Holding Schools
To date, none of the six holding centers have been modernized. Two of the six special program schools
were modernized although both of these occurred in the 1970s. Two special program schools are
programmed in the CIP for modernization: Thomas Edison High School of Technology (2017) and Carl
Sandburg Center (2020). In addition, in May 2015, the Board of Education approved the collocation of
the Rock Terrace School with Tilden Middle School which is programmed for completed modernization
in 2019.
Average Age of Schools at Time of Modernization – Special Program Schools
Modernized
Before 1993
Modernized
1993 – 2000
Modernized
2001 – 2010
Modernized
2011 – 2015
Programmed for
Modernization
2016 – 2023
Special
Program
22.5 (2 Schools)
-- -- -- 34.3
(2 Schools)
Facility
Type
Median
Year Built
No. of
Schools
Before 1950 1950 - 1969 1970 - 1984 After 1985
Schools Percent Schools Percent Schools Percent Schools Percent
Special
Program 1966 6 -- -- 3 50.0% 2 33.3% 1 16.7%
Holding 1954 6 2 33.3% 4 66.7% -- -- -- --
Average Age of
School Buildings
Special Program Schools 37.0
Holding Schools 52.8
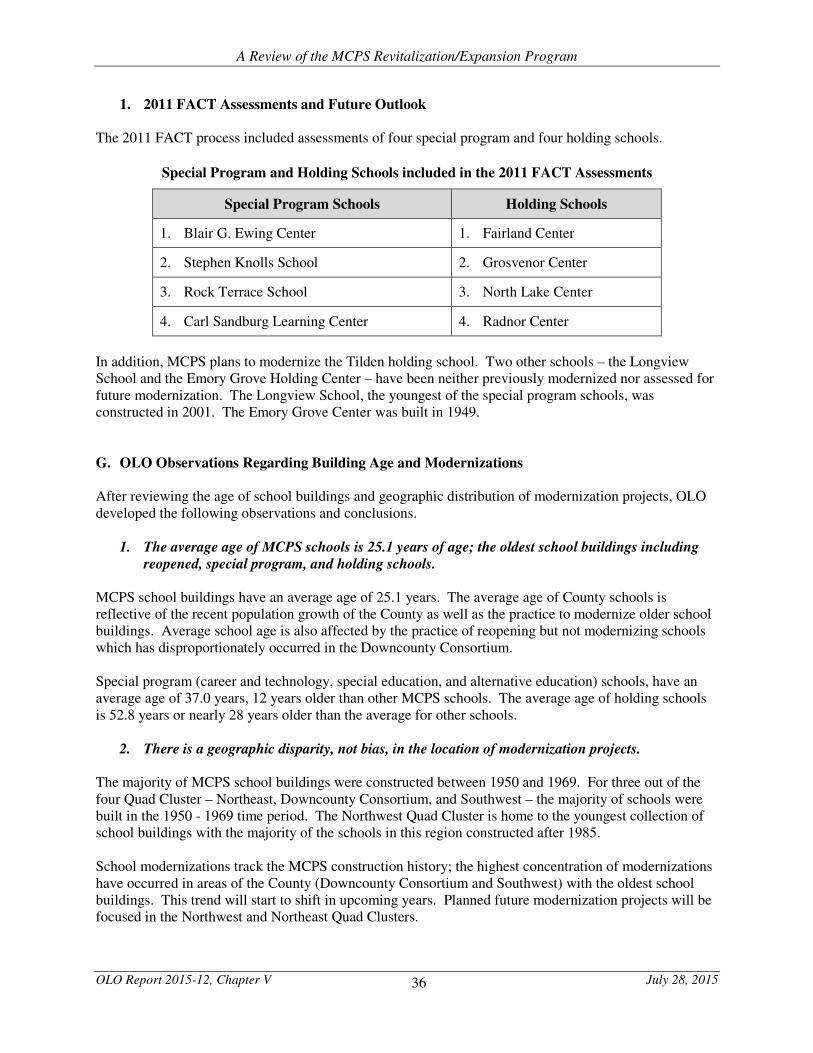
36
A Review of the MCPS Revitalization/Expansion Program
OLO Report 2015-12, Chapter V July 28, 2015
1. 2011 FACT Assessments and Future Outlook
The 2011 FACT process included assessments of four special program and four holding schools.
Special Program and Holding Schools included in the 2011 FACT Assessments
Special Program Schools Holding Schools
1. Blair G. Ewing Center 1. Fairland Center
2. Stephen Knolls School 2. Grosvenor Center
3. Rock Terrace School 3. North Lake Center
4. Carl Sandburg Learning Center 4. Radnor Center
In addition, MCPS plans to modernize the Tilden holding school. Two other schools – the Longview
School and the Emory Grove Holding Center – have been neither previously modernized nor assessed for
future modernization. The Longview School, the youngest of the special program schools, was
constructed in 2001. The Emory Grove Center was built in 1949.
G. OLO Observations Regarding Building Age and Modernizations
After reviewing the age of school buildings and geographic distribution of modernization projects, OLO
developed the following observations and conclusions.
1. The average age of MCPS schools is 25.1 years of age; the oldest school buildings including
reopened, special program, and holding schools.
MCPS school buildings have an average age of 25.1 years. The average age of County schools is
reflective of the recent population growth of the County as well as the practice to modernize older school
buildings. Average school age is also affected by the practice of reopening but not modernizing schools
which has disproportionately occurred in the Downcounty Consortium.
Special program (career and technology, special education, and alternative education) schools, have an
average age of 37.0 years, 12 years older than other MCPS schools. The average age of holding schools
is 52.8 years or nearly 28 years older than the average for other schools.
2. There is a geographic disparity, not bias, in the location of modernization projects.
The majority of MCPS school buildings were constructed between 1950 and 1969. For three out of the
four Quad Cluster – Northeast, Downcounty Consortium, and Southwest – the majority of schools were
built in the 1950 - 1969 time period. The Northwest Quad Cluster is home to the youngest collection of
school buildings with the majority of the schools in this region constructed after 1985.
School modernizations track the MCPS construction history; the highest concentration of modernizations
have occurred in areas of the County (Downcounty Consortium and Southwest) with the oldest school
buildings. This trend will start to shift in upcoming years. Planned future modernization projects will be
focused in the Northwest and Northeast Quad Clusters.
37
A Review of the MCPS Revitalization/Expansion Program
OLO Report 2015-12, Chapter V July 28, 2015
3. The age at which an MCPS school is modernized has steadily increased.
Over the past several decades, the average age of an MCPS school at time of modernization has increased
from 32 years to 51 years. The current approved CIP assumes that the 21 school modernizations
programmed for 2016 through 2023 will have an average age of 46 years when completed. However, any
changes in the planned schedule for 2016 through 2023 projects would alter the average age.
Some degree of variation exists among geographic regions of the County regarding the planned age of
schools at the time of future modernizations. The three Downcounty Consortium schools programmed
for modernization by 2023 2023 are currently planned to have an average age of 40 years while the four
Northeast Quad Cluster schools programmed for modernization by 2023 are currently planned to have an
average age of 49 years.

38
A Review of the MCPS Revitalization/Expansion Program
OLO Report 2015-12, Chapter VI July 28, 2015
CHAPTER VI: ANALYSIS OF 2011 FACT SCORING This chapter examines the 2011 MCPS assessment of school buildings and the placement of schools in the Revitalization/Expansion program queue. This chapter consist of four sections;
• Section A. FACT Scoring and the Revitalization/Expansion Queue
• Section B. Educational Program Parameters
• Section C. Physical Infrastructure Parameters
• Section D. OLO Observations Regarding FACT Scoring
A. FACT Scoring and the Revitalization/Expansion Queue
As described in Chapter II, MCPS developed a methodology to evaluate the condition of school buildings called “Facilities Assessment with Criteria and Testing” (FACT). In 2010, MCPS convened an advisory FACT Review Committee to review the evaluation criteria. The FACT process assigned points to each evaluated school based on a series of criteria (referred to as “parameters”). The FACT methodology assigned points for physical and educational building deficiencies found at the time of the evaluation. According to MCPS, “the FACT Review Committee was well aware that facility conditions change over time. Nevertheless, the prevailing view was that a comprehensive condition assessment needed to include all the parameters that are included in FACT.” 1 A school with a higher FACT score was found to be more deficient than a school with a lower score. MCPS completed the FACT evaluation of school buildings in 2011. MCPS placed schools in the Revitalization/Expansion program queue in descending order of their FACT scores. The Revitalization/Expansion Capital Improvements Program (CIP) project funds modernization of school buildings according to the order established by the 2011 FACT assessment. MCPS has not re-assessed the schools in the Revitalization/Expansion program queue since 2011 nor does the school system plan to reassess the condition of these buildings in the future. The full list of all schools in Revitalization/Expansion queue ranked by FACT score appears on the following page.
The ordering of schools in the Revitalization/Expansion queue has remained unchanged since 2011, reflecting the rank order established through the FACT scoring. Given current funding and holding school constraints, the Revitalization/Expansion capital project will accommodate work on about three to six school buildings at any given time. At this rate, reconstruction of all the schools in the queue could continue beyond the year 2040. The next section of this chapter defines and describes the scoring methodology for each of the FACT parameters. In addition, the section presents information about the scores assigned to individual schools. OLO prepared a table for each parameter showing the highest and lowest score assigned to the 34 elementary and 11 middle schools assessed in 2011. The tables also indicate the range between the highest and lowest score in order to show the extent to which scoring variations in each parameter influence the overall FACT scores assigned to schools.
1 Email correspondence from Bruce Crispell to Aron Trombka, July 16, 2015.
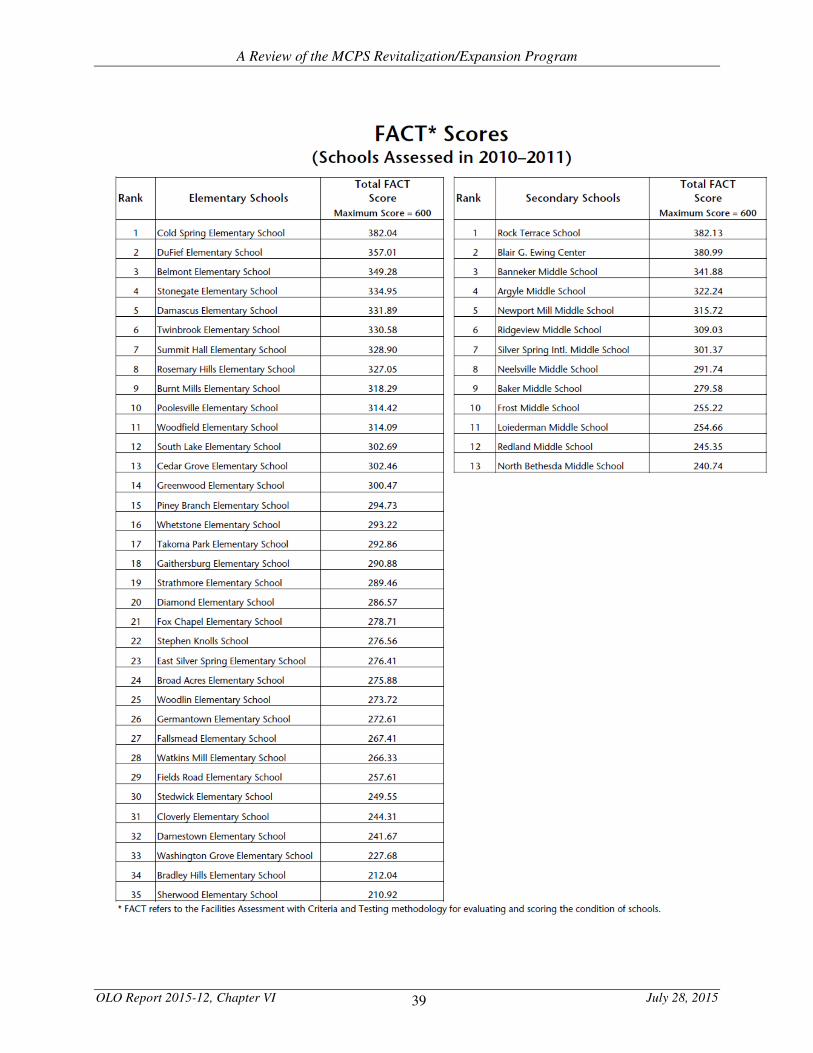
39
A Review of the MCPS Revitalization/Expansion Program
OLO Report 2015-12, Chapter VI July 28, 2015
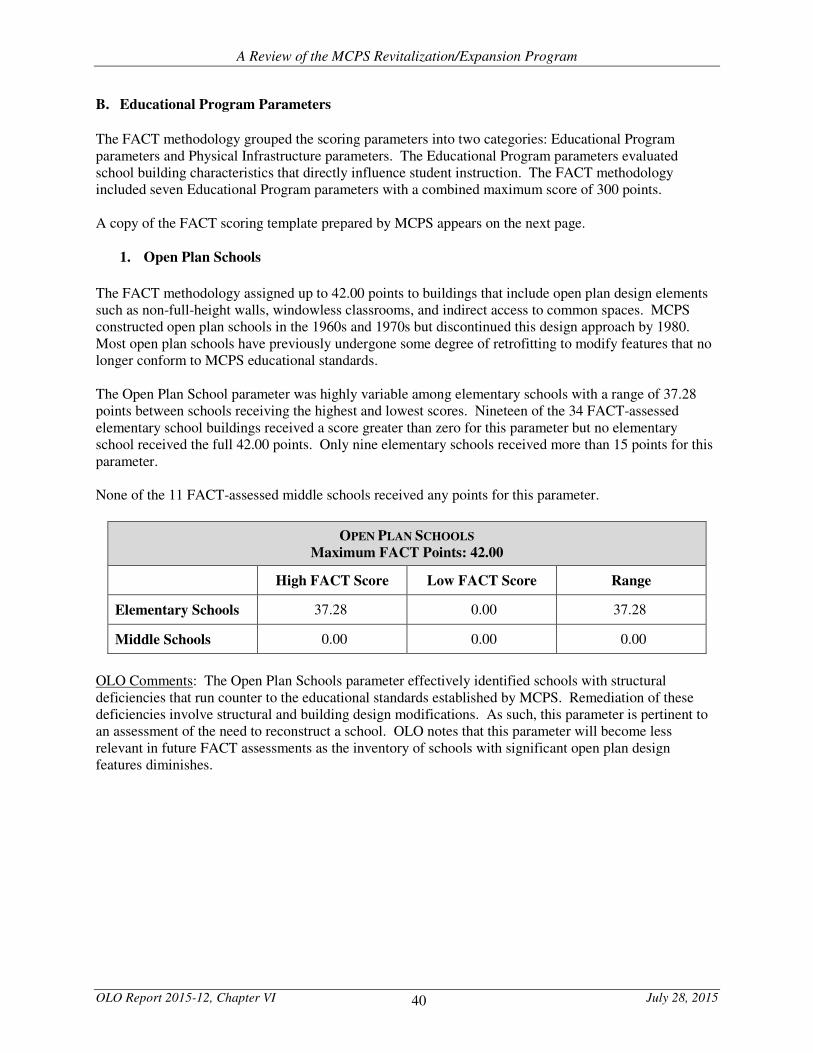
40
A Review of the MCPS Revitalization/Expansion Program
OLO Report 2015-12, Chapter VI July 28, 2015
B. Educational Program Parameters
The FACT methodology grouped the scoring parameters into two categories: Educational Program parameters and Physical Infrastructure parameters. The Educational Program parameters evaluated school building characteristics that directly influence student instruction. The FACT methodology included seven Educational Program parameters with a combined maximum score of 300 points. A copy of the FACT scoring template prepared by MCPS appears on the next page.
1. Open Plan Schools
The FACT methodology assigned up to 42.00 points to buildings that include open plan design elements such as non-full-height walls, windowless classrooms, and indirect access to common spaces. MCPS constructed open plan schools in the 1960s and 1970s but discontinued this design approach by 1980. Most open plan schools have previously undergone some degree of retrofitting to modify features that no longer conform to MCPS educational standards. The Open Plan School parameter was highly variable among elementary schools with a range of 37.28 points between schools receiving the highest and lowest scores. Nineteen of the 34 FACT-assessed elementary school buildings received a score greater than zero for this parameter but no elementary school received the full 42.00 points. Only nine elementary schools received more than 15 points for this parameter. None of the 11 FACT-assessed middle schools received any points for this parameter.
OPEN PLAN SCHOOLS
Maximum FACT Points: 42.00
High FACT Score Low FACT Score Range
Elementary Schools 37.28 0.00 37.28
Middle Schools 0.00 0.00 0.00
OLO Comments: The Open Plan Schools parameter effectively identified schools with structural deficiencies that run counter to the educational standards established by MCPS. Remediation of these deficiencies involve structural and building design modifications. As such, this parameter is pertinent to an assessment of the need to reconstruct a school. OLO notes that this parameter will become less relevant in future FACT assessments as the inventory of schools with significant open plan design features diminishes.
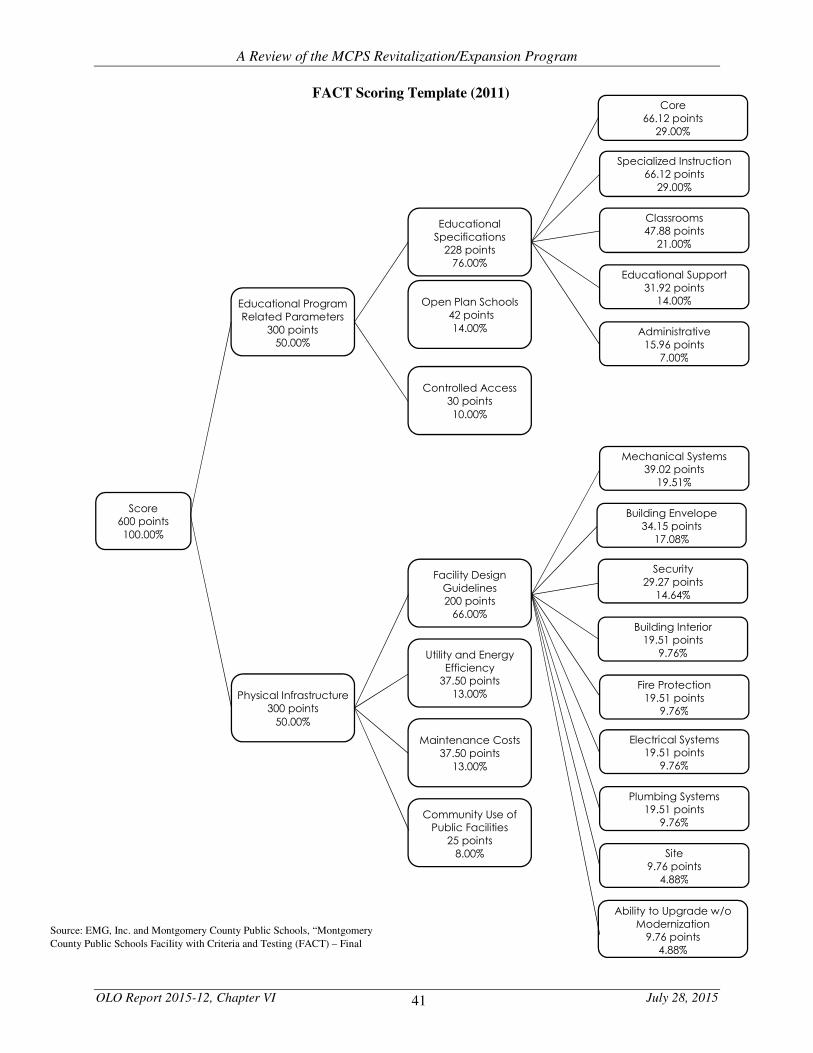
41
A Review of the MCPS Revitalization/Expansion Program
OLO Report 2015-12, Chapter VI July 28, 2015
FACT Scoring Template (2011)
Educational
Specifications
228 points
76.00%
Open Plan Schools
42 points
14.00%
Controlled Access
30 points
10.00%
Facility Design
Guidelines
200 points
66.00%
Utility and Energy
Efficiency
37.50 points
13.00%
Maintenance Costs
37.50 points
13.00%
Community Use of
Public Facilities
25 points
8.00%
Core
66.12 points
29.00%
Specialized Instruction
66.12 points
29.00%
Classrooms
47.88 points
21.00%
Educational Support
31.92 points
14.00%
Administrative
15.96 points
7.00%
Mechanical Systems
39.02 points
19.51%
Building Envelope
34.15 points
17.08%
Security
29.27 points
14.64%
Building Interior
19.51 points
9.76%
Fire Protection
19.51 points
9.76%
Electrical Systems
19.51 points
9.76%
Plumbing Systems
19.51 points
9.76%
Site
9.76 points
4.88%
Ability to Upgrade w/o
Modernization
9.76 points
4.88%
Score
600 points
100.00%
Educational Program
Related Parameters
300 points
50.00%
Physical Infrastructure
300 points
50.00%
Source: EMG, Inc. and Montgomery County Public Schools, “Montgomery
County Public Schools Facility with Criteria and Testing (FACT) – Final
Report,” p. 11.
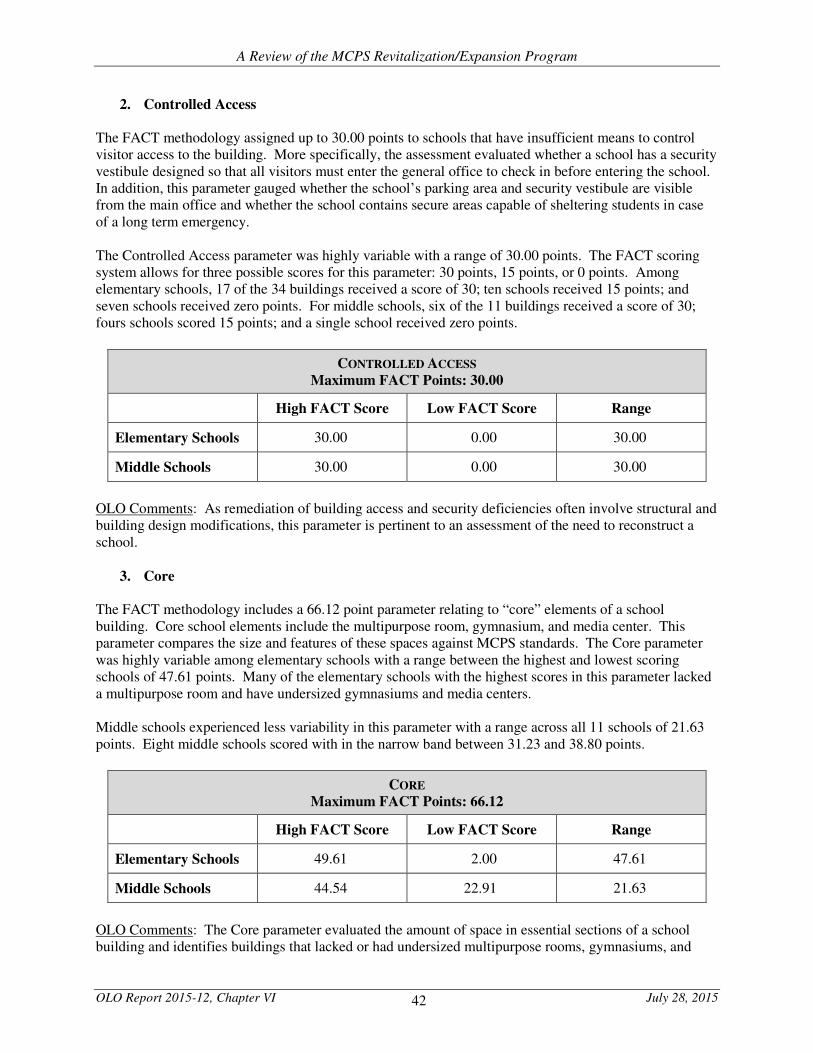
42
A Review of the MCPS Revitalization/Expansion Program
OLO Report 2015-12, Chapter VI July 28, 2015
2. Controlled Access The FACT methodology assigned up to 30.00 points to schools that have insufficient means to control visitor access to the building. More specifically, the assessment evaluated whether a school has a security vestibule designed so that all visitors must enter the general office to check in before entering the school. In addition, this parameter gauged whether the school’s parking area and security vestibule are visible from the main office and whether the school contains secure areas capable of sheltering students in case of a long term emergency. The Controlled Access parameter was highly variable with a range of 30.00 points. The FACT scoring system allows for three possible scores for this parameter: 30 points, 15 points, or 0 points. Among elementary schools, 17 of the 34 buildings received a score of 30; ten schools received 15 points; and seven schools received zero points. For middle schools, six of the 11 buildings received a score of 30; fours schools scored 15 points; and a single school received zero points.
CONTROLLED ACCESS
Maximum FACT Points: 30.00
High FACT Score Low FACT Score Range
Elementary Schools 30.00 0.00 30.00
Middle Schools 30.00 0.00 30.00
OLO Comments: As remediation of building access and security deficiencies often involve structural and building design modifications, this parameter is pertinent to an assessment of the need to reconstruct a school.
3. Core The FACT methodology includes a 66.12 point parameter relating to “core” elements of a school building. Core school elements include the multipurpose room, gymnasium, and media center. This parameter compares the size and features of these spaces against MCPS standards. The Core parameter was highly variable among elementary schools with a range between the highest and lowest scoring schools of 47.61 points. Many of the elementary schools with the highest scores in this parameter lacked a multipurpose room and have undersized gymnasiums and media centers. Middle schools experienced less variability in this parameter with a range across all 11 schools of 21.63 points. Eight middle schools scored with in the narrow band between 31.23 and 38.80 points.
CORE
Maximum FACT Points: 66.12
High FACT Score Low FACT Score Range
Elementary Schools 49.61 2.00 47.61
Middle Schools 44.54 22.91 21.63
OLO Comments: The Core parameter evaluated the amount of space in essential sections of a school building and identifies buildings that lacked or had undersized multipurpose rooms, gymnasiums, and
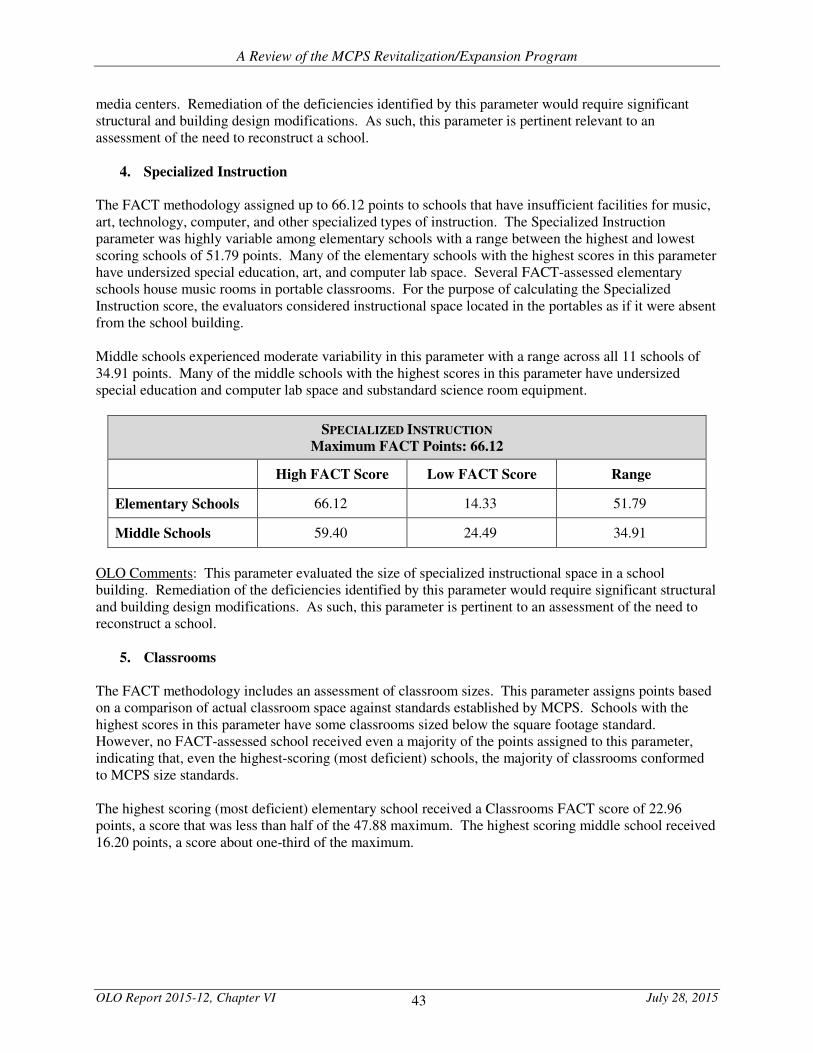
43
A Review of the MCPS Revitalization/Expansion Program
OLO Report 2015-12, Chapter VI July 28, 2015
media centers. Remediation of the deficiencies identified by this parameter would require significant structural and building design modifications. As such, this parameter is pertinent relevant to an assessment of the need to reconstruct a school.
4. Specialized Instruction The FACT methodology assigned up to 66.12 points to schools that have insufficient facilities for music, art, technology, computer, and other specialized types of instruction. The Specialized Instruction parameter was highly variable among elementary schools with a range between the highest and lowest scoring schools of 51.79 points. Many of the elementary schools with the highest scores in this parameter have undersized special education, art, and computer lab space. Several FACT-assessed elementary schools house music rooms in portable classrooms. For the purpose of calculating the Specialized Instruction score, the evaluators considered instructional space located in the portables as if it were absent from the school building. Middle schools experienced moderate variability in this parameter with a range across all 11 schools of 34.91 points. Many of the middle schools with the highest scores in this parameter have undersized special education and computer lab space and substandard science room equipment.
SPECIALIZED INSTRUCTION
Maximum FACT Points: 66.12
High FACT Score Low FACT Score Range
Elementary Schools 66.12 14.33 51.79
Middle Schools 59.40 24.49 34.91
OLO Comments: This parameter evaluated the size of specialized instructional space in a school building. Remediation of the deficiencies identified by this parameter would require significant structural and building design modifications. As such, this parameter is pertinent to an assessment of the need to reconstruct a school.
5. Classrooms The FACT methodology includes an assessment of classroom sizes. This parameter assigns points based on a comparison of actual classroom space against standards established by MCPS. Schools with the highest scores in this parameter have some classrooms sized below the square footage standard. However, no FACT-assessed school received even a majority of the points assigned to this parameter, indicating that, even the highest-scoring (most deficient) schools, the majority of classrooms conformed to MCPS size standards. The highest scoring (most deficient) elementary school received a Classrooms FACT score of 22.96 points, a score that was less than half of the 47.88 maximum. The highest scoring middle school received 16.20 points, a score about one-third of the maximum.
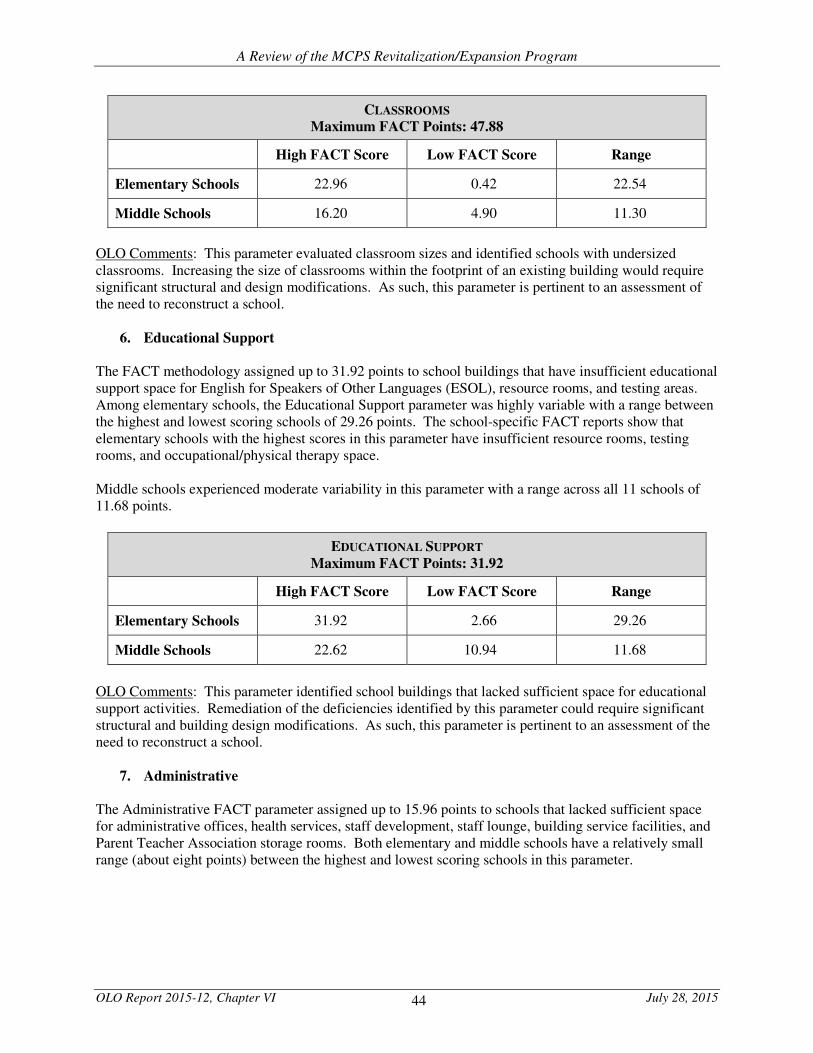
44
A Review of the MCPS Revitalization/Expansion Program
OLO Report 2015-12, Chapter VI July 28, 2015
CLASSROOMS
Maximum FACT Points: 47.88
High FACT Score Low FACT Score Range
Elementary Schools 22.96 0.42 22.54
Middle Schools 16.20 4.90 11.30
OLO Comments: This parameter evaluated classroom sizes and identified schools with undersized classrooms. Increasing the size of classrooms within the footprint of an existing building would require significant structural and design modifications. As such, this parameter is pertinent to an assessment of the need to reconstruct a school.
6. Educational Support
The FACT methodology assigned up to 31.92 points to school buildings that have insufficient educational support space for English for Speakers of Other Languages (ESOL), resource rooms, and testing areas. Among elementary schools, the Educational Support parameter was highly variable with a range between the highest and lowest scoring schools of 29.26 points. The school-specific FACT reports show that elementary schools with the highest scores in this parameter have insufficient resource rooms, testing rooms, and occupational/physical therapy space. Middle schools experienced moderate variability in this parameter with a range across all 11 schools of 11.68 points.
EDUCATIONAL SUPPORT
Maximum FACT Points: 31.92
High FACT Score Low FACT Score Range
Elementary Schools 31.92 2.66 29.26
Middle Schools 22.62 10.94 11.68
OLO Comments: This parameter identified school buildings that lacked sufficient space for educational support activities. Remediation of the deficiencies identified by this parameter could require significant structural and building design modifications. As such, this parameter is pertinent to an assessment of the need to reconstruct a school.
7. Administrative The Administrative FACT parameter assigned up to 15.96 points to schools that lacked sufficient space for administrative offices, health services, staff development, staff lounge, building service facilities, and Parent Teacher Association storage rooms. Both elementary and middle schools have a relatively small range (about eight points) between the highest and lowest scoring schools in this parameter.
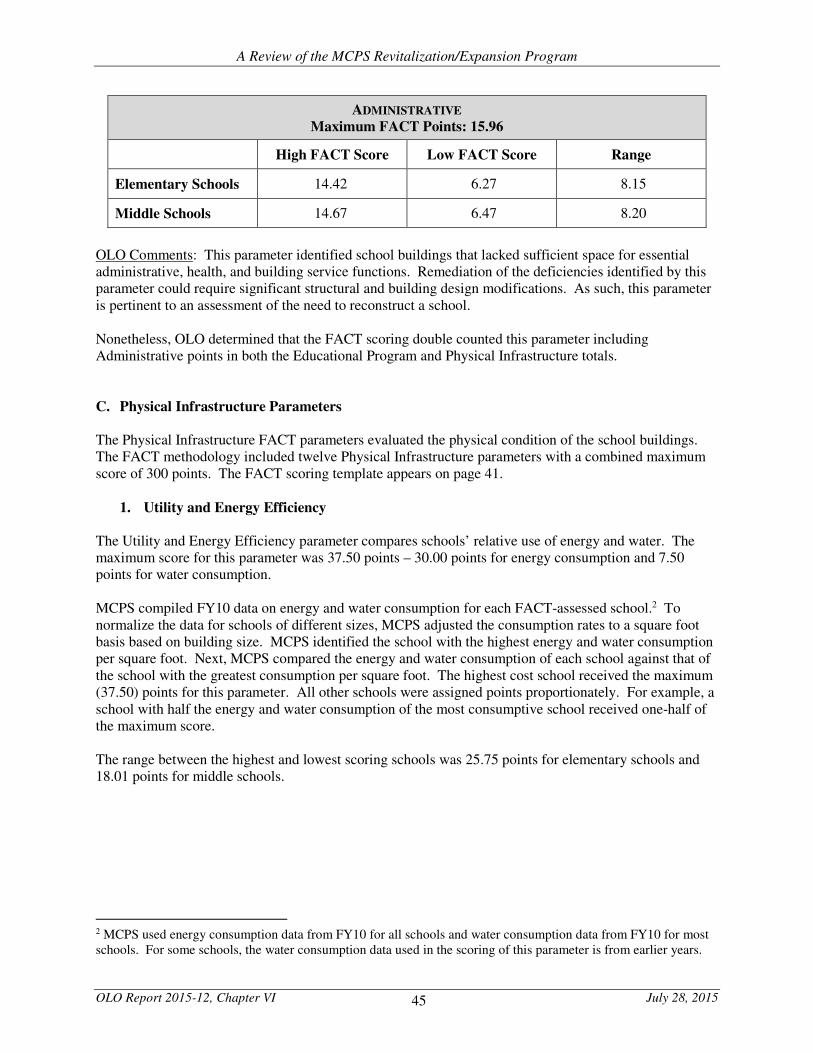
45
A Review of the MCPS Revitalization/Expansion Program
OLO Report 2015-12, Chapter VI July 28, 2015
ADMINISTRATIVE
Maximum FACT Points: 15.96
High FACT Score Low FACT Score Range
Elementary Schools 14.42 6.27 8.15
Middle Schools 14.67 6.47 8.20
OLO Comments: This parameter identified school buildings that lacked sufficient space for essential administrative, health, and building service functions. Remediation of the deficiencies identified by this parameter could require significant structural and building design modifications. As such, this parameter is pertinent to an assessment of the need to reconstruct a school. Nonetheless, OLO determined that the FACT scoring double counted this parameter including Administrative points in both the Educational Program and Physical Infrastructure totals.
C. Physical Infrastructure Parameters
The Physical Infrastructure FACT parameters evaluated the physical condition of the school buildings. The FACT methodology included twelve Physical Infrastructure parameters with a combined maximum score of 300 points. The FACT scoring template appears on page 41.
1. Utility and Energy Efficiency The Utility and Energy Efficiency parameter compares schools’ relative use of energy and water. The maximum score for this parameter was 37.50 points – 30.00 points for energy consumption and 7.50 points for water consumption. MCPS compiled FY10 data on energy and water consumption for each FACT-assessed school.2 To normalize the data for schools of different sizes, MCPS adjusted the consumption rates to a square foot basis based on building size. MCPS identified the school with the highest energy and water consumption per square foot. Next, MCPS compared the energy and water consumption of each school against that of the school with the greatest consumption per square foot. The highest cost school received the maximum (37.50) points for this parameter. All other schools were assigned points proportionately. For example, a school with half the energy and water consumption of the most consumptive school received one-half of the maximum score. The range between the highest and lowest scoring schools was 25.75 points for elementary schools and 18.01 points for middle schools.
2 MCPS used energy consumption data from FY10 for all schools and water consumption data from FY10 for most schools. For some schools, the water consumption data used in the scoring of this parameter is from earlier years.
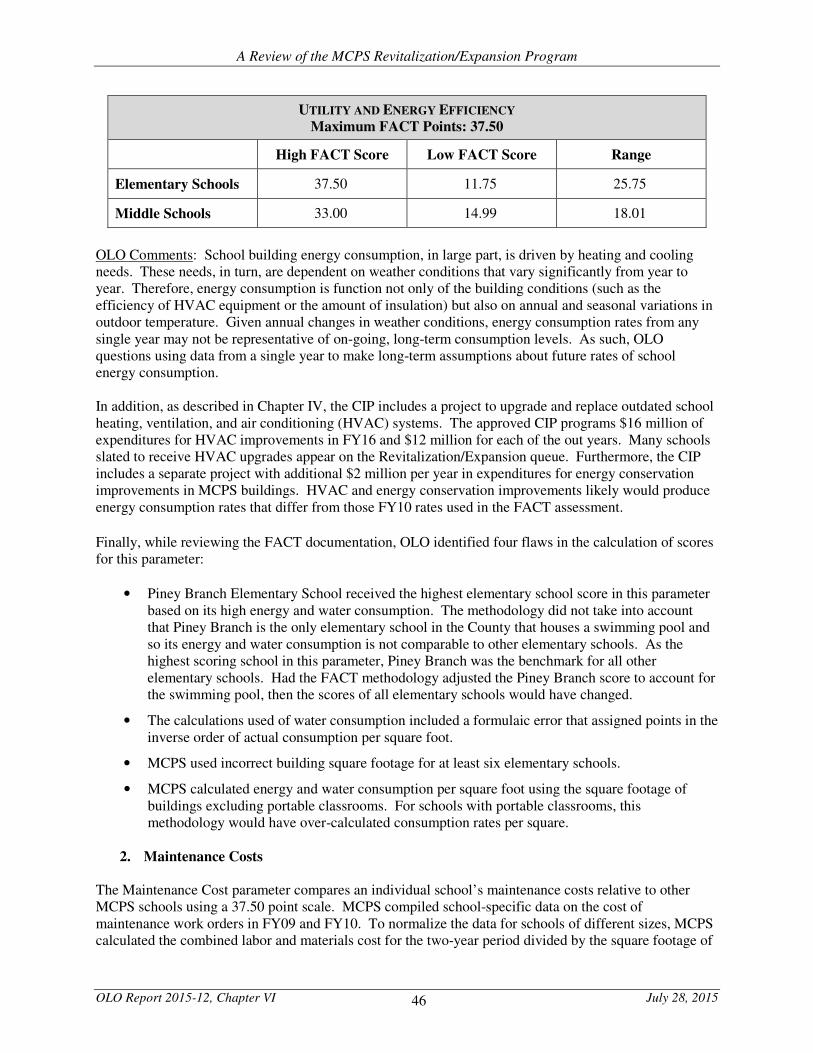
46
A Review of the MCPS Revitalization/Expansion Program
OLO Report 2015-12, Chapter VI July 28, 2015
UTILITY AND ENERGY EFFICIENCY
Maximum FACT Points: 37.50
High FACT Score Low FACT Score Range
Elementary Schools 37.50 11.75 25.75
Middle Schools 33.00 14.99 18.01
OLO Comments: School building energy consumption, in large part, is driven by heating and cooling needs. These needs, in turn, are dependent on weather conditions that vary significantly from year to year. Therefore, energy consumption is function not only of the building conditions (such as the efficiency of HVAC equipment or the amount of insulation) but also on annual and seasonal variations in outdoor temperature. Given annual changes in weather conditions, energy consumption rates from any single year may not be representative of on-going, long-term consumption levels. As such, OLO questions using data from a single year to make long-term assumptions about future rates of school energy consumption. In addition, as described in Chapter IV, the CIP includes a project to upgrade and replace outdated school heating, ventilation, and air conditioning (HVAC) systems. The approved CIP programs $16 million of expenditures for HVAC improvements in FY16 and $12 million for each of the out years. Many schools slated to receive HVAC upgrades appear on the Revitalization/Expansion queue. Furthermore, the CIP includes a separate project with additional $2 million per year in expenditures for energy conservation improvements in MCPS buildings. HVAC and energy conservation improvements likely would produce energy consumption rates that differ from those FY10 rates used in the FACT assessment.
Finally, while reviewing the FACT documentation, OLO identified four flaws in the calculation of scores for this parameter:
• Piney Branch Elementary School received the highest elementary school score in this parameter based on its high energy and water consumption. The methodology did not take into account that Piney Branch is the only elementary school in the County that houses a swimming pool and so its energy and water consumption is not comparable to other elementary schools. As the highest scoring school in this parameter, Piney Branch was the benchmark for all other elementary schools. Had the FACT methodology adjusted the Piney Branch score to account for the swimming pool, then the scores of all elementary schools would have changed.
• The calculations used of water consumption included a formulaic error that assigned points in the inverse order of actual consumption per square foot.
• MCPS used incorrect building square footage for at least six elementary schools.
• MCPS calculated energy and water consumption per square foot using the square footage of buildings excluding portable classrooms. For schools with portable classrooms, this methodology would have over-calculated consumption rates per square.
2. Maintenance Costs
The Maintenance Cost parameter compares an individual school’s maintenance costs relative to other MCPS schools using a 37.50 point scale. MCPS compiled school-specific data on the cost of maintenance work orders in FY09 and FY10. To normalize the data for schools of different sizes, MCPS calculated the combined labor and materials cost for the two-year period divided by the square footage of
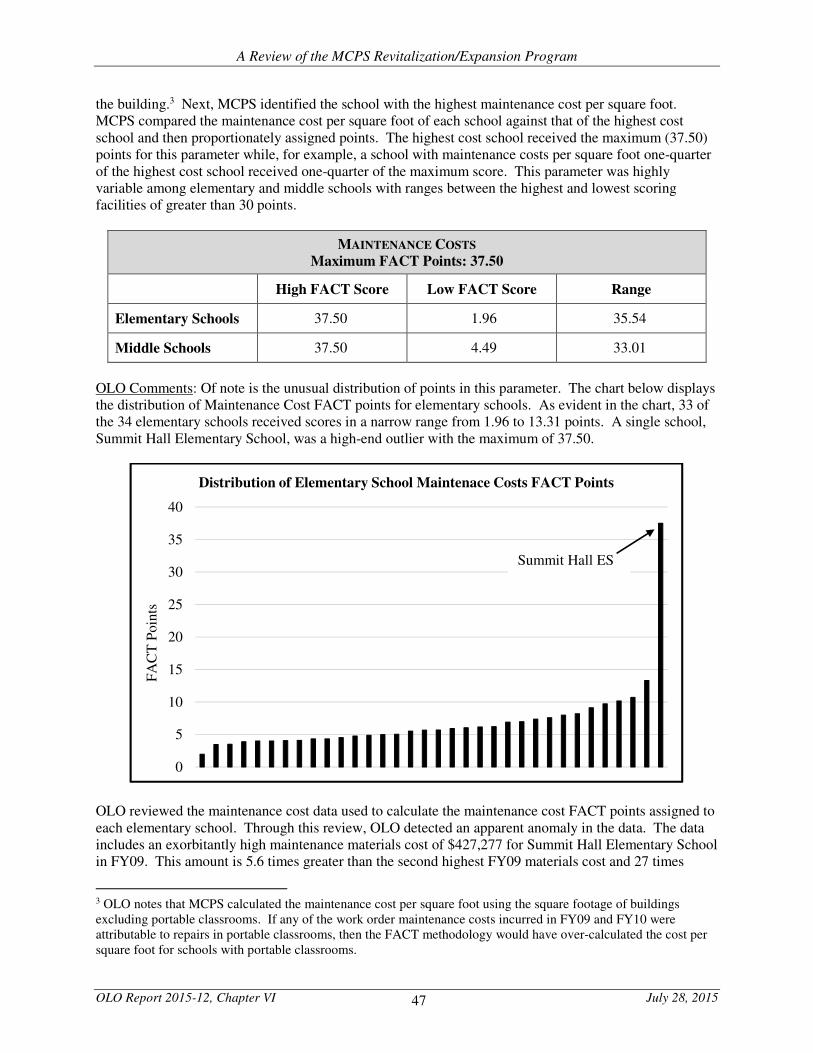
47
A Review of the MCPS Revitalization/Expansion Program
OLO Report 2015-12, Chapter VI July 28, 2015
the building.3 Next, MCPS identified the school with the highest maintenance cost per square foot. MCPS compared the maintenance cost per square foot of each school against that of the highest cost school and then proportionately assigned points. The highest cost school received the maximum (37.50) points for this parameter while, for example, a school with maintenance costs per square foot one-quarter of the highest cost school received one-quarter of the maximum score. This parameter was highly variable among elementary and middle schools with ranges between the highest and lowest scoring facilities of greater than 30 points.
MAINTENANCE COSTS
Maximum FACT Points: 37.50
High FACT Score Low FACT Score Range
Elementary Schools 37.50 1.96 35.54
Middle Schools 37.50 4.49 33.01
OLO Comments: Of note is the unusual distribution of points in this parameter. The chart below displays the distribution of Maintenance Cost FACT points for elementary schools. As evident in the chart, 33 of the 34 elementary schools received scores in a narrow range from 1.96 to 13.31 points. A single school, Summit Hall Elementary School, was a high-end outlier with the maximum of 37.50.
OLO reviewed the maintenance cost data used to calculate the maintenance cost FACT points assigned to each elementary school. Through this review, OLO detected an apparent anomaly in the data. The data includes an exorbitantly high maintenance materials cost of $427,277 for Summit Hall Elementary School in FY09. This amount is 5.6 times greater than the second highest FY09 materials cost and 27 times
3 OLO notes that MCPS calculated the maintenance cost per square foot using the square footage of buildings excluding portable classrooms. If any of the work order maintenance costs incurred in FY09 and FY10 were attributable to repairs in portable classrooms, then the FACT methodology would have over-calculated the cost per square foot for schools with portable classrooms.
0
5
10
15
20
25
30
35
40
FA
CT
Poin
ts
Distribution of Elementary School Maintenace Costs FACT Points
Summit Hall ES
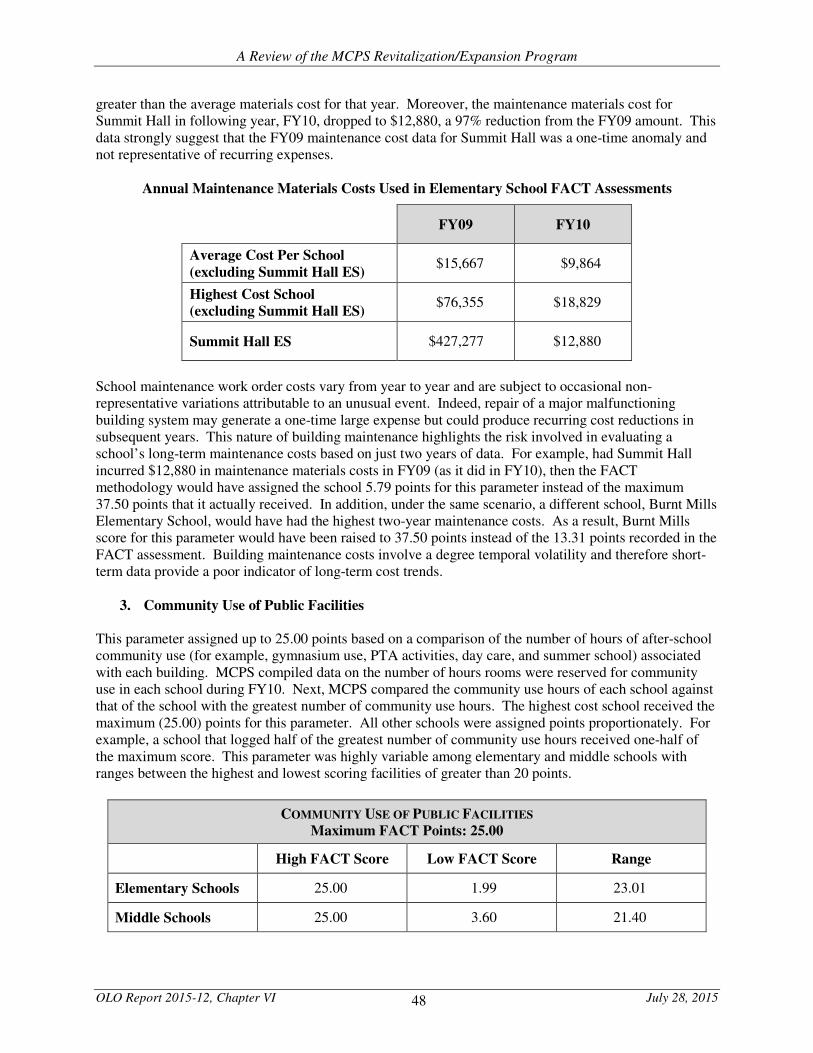
48
A Review of the MCPS Revitalization/Expansion Program
OLO Report 2015-12, Chapter VI July 28, 2015
greater than the average materials cost for that year. Moreover, the maintenance materials cost for Summit Hall in following year, FY10, dropped to $12,880, a 97% reduction from the FY09 amount. This data strongly suggest that the FY09 maintenance cost data for Summit Hall was a one-time anomaly and not representative of recurring expenses.
Annual Maintenance Materials Costs Used in Elementary School FACT Assessments
FY09 FY10
Average Cost Per School
(excluding Summit Hall ES) $15,667 $9,864
Highest Cost School
(excluding Summit Hall ES) $76,355 $18,829
Summit Hall ES $427,277 $12,880
School maintenance work order costs vary from year to year and are subject to occasional non-representative variations attributable to an unusual event. Indeed, repair of a major malfunctioning building system may generate a one-time large expense but could produce recurring cost reductions in subsequent years. This nature of building maintenance highlights the risk involved in evaluating a school’s long-term maintenance costs based on just two years of data. For example, had Summit Hall incurred $12,880 in maintenance materials costs in FY09 (as it did in FY10), then the FACT methodology would have assigned the school 5.79 points for this parameter instead of the maximum 37.50 points that it actually received. In addition, under the same scenario, a different school, Burnt Mills Elementary School, would have had the highest two-year maintenance costs. As a result, Burnt Mills score for this parameter would have been raised to 37.50 points instead of the 13.31 points recorded in the FACT assessment. Building maintenance costs involve a degree temporal volatility and therefore short-term data provide a poor indicator of long-term cost trends.
3. Community Use of Public Facilities This parameter assigned up to 25.00 points based on a comparison of the number of hours of after-school community use (for example, gymnasium use, PTA activities, day care, and summer school) associated with each building. MCPS compiled data on the number of hours rooms were reserved for community use in each school during FY10. Next, MCPS compared the community use hours of each school against that of the school with the greatest number of community use hours. The highest cost school received the maximum (25.00) points for this parameter. All other schools were assigned points proportionately. For example, a school that logged half of the greatest number of community use hours received one-half of the maximum score. This parameter was highly variable among elementary and middle schools with ranges between the highest and lowest scoring facilities of greater than 20 points.
COMMUNITY USE OF PUBLIC FACILITIES
Maximum FACT Points: 25.00
High FACT Score Low FACT Score Range
Elementary Schools 25.00 1.99 23.01
Middle Schools 25.00 3.60 21.40
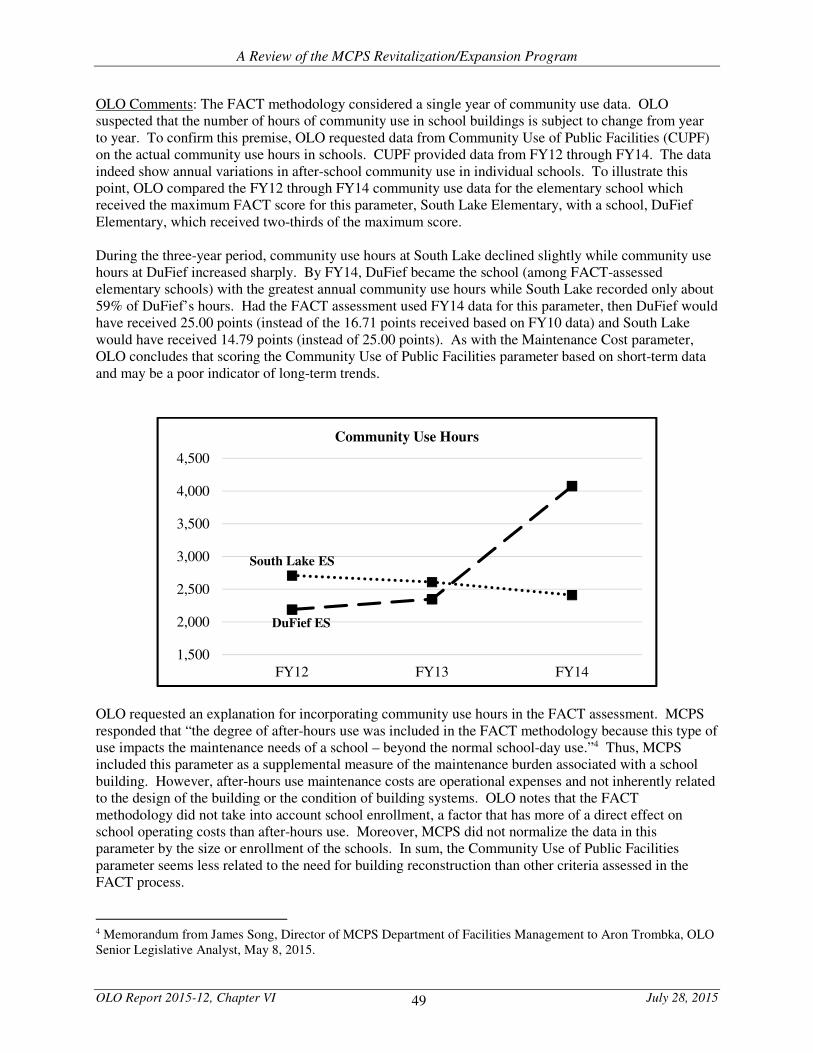
49
A Review of the MCPS Revitalization/Expansion Program
OLO Report 2015-12, Chapter VI July 28, 2015
OLO Comments: The FACT methodology considered a single year of community use data. OLO suspected that the number of hours of community use in school buildings is subject to change from year to year. To confirm this premise, OLO requested data from Community Use of Public Facilities (CUPF) on the actual community use hours in schools. CUPF provided data from FY12 through FY14. The data indeed show annual variations in after-school community use in individual schools. To illustrate this point, OLO compared the FY12 through FY14 community use data for the elementary school which received the maximum FACT score for this parameter, South Lake Elementary, with a school, DuFief Elementary, which received two-thirds of the maximum score. During the three-year period, community use hours at South Lake declined slightly while community use hours at DuFief increased sharply. By FY14, DuFief became the school (among FACT-assessed elementary schools) with the greatest annual community use hours while South Lake recorded only about 59% of DuFief’s hours. Had the FACT assessment used FY14 data for this parameter, then DuFief would have received 25.00 points (instead of the 16.71 points received based on FY10 data) and South Lake would have received 14.79 points (instead of 25.00 points). As with the Maintenance Cost parameter, OLO concludes that scoring the Community Use of Public Facilities parameter based on short-term data and may be a poor indicator of long-term trends.
OLO requested an explanation for incorporating community use hours in the FACT assessment. MCPS responded that “the degree of after-hours use was included in the FACT methodology because this type of use impacts the maintenance needs of a school – beyond the normal school-day use.”4 Thus, MCPS included this parameter as a supplemental measure of the maintenance burden associated with a school building. However, after-hours use maintenance costs are operational expenses and not inherently related to the design of the building or the condition of building systems. OLO notes that the FACT methodology did not take into account school enrollment, a factor that has more of a direct effect on school operating costs than after-hours use. Moreover, MCPS did not normalize the data in this parameter by the size or enrollment of the schools. In sum, the Community Use of Public Facilities parameter seems less related to the need for building reconstruction than other criteria assessed in the FACT process.
4 Memorandum from James Song, Director of MCPS Department of Facilities Management to Aron Trombka, OLO Senior Legislative Analyst, May 8, 2015.
DuFief ES
South Lake ES
1,500
2,000
2,500
3,000
3,500
4,000
4,500
FY12 FY13 FY14
Community Use Hours
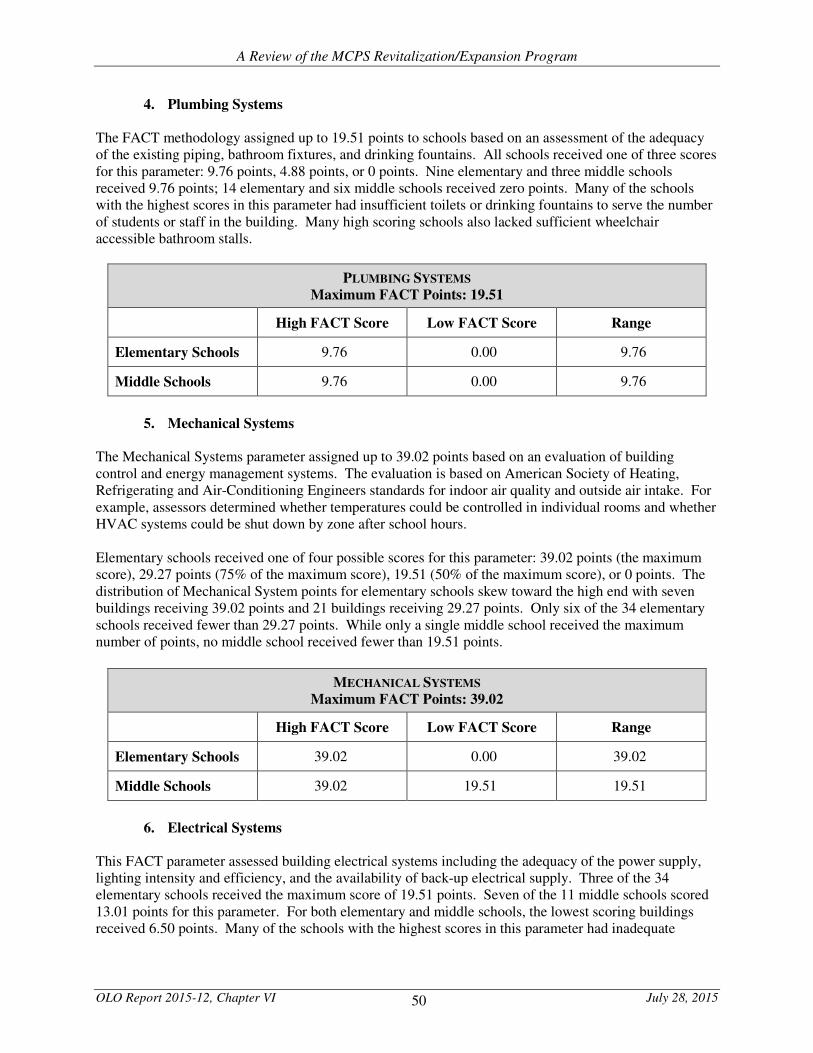
50
A Review of the MCPS Revitalization/Expansion Program
OLO Report 2015-12, Chapter VI July 28, 2015
4. Plumbing Systems The FACT methodology assigned up to 19.51 points to schools based on an assessment of the adequacy of the existing piping, bathroom fixtures, and drinking fountains. All schools received one of three scores for this parameter: 9.76 points, 4.88 points, or 0 points. Nine elementary and three middle schools received 9.76 points; 14 elementary and six middle schools received zero points. Many of the schools with the highest scores in this parameter had insufficient toilets or drinking fountains to serve the number of students or staff in the building. Many high scoring schools also lacked sufficient wheelchair accessible bathroom stalls.
PLUMBING SYSTEMS
Maximum FACT Points: 19.51
High FACT Score Low FACT Score Range
Elementary Schools 9.76 0.00 9.76
Middle Schools 9.76 0.00 9.76
5. Mechanical Systems The Mechanical Systems parameter assigned up to 39.02 points based on an evaluation of building control and energy management systems. The evaluation is based on American Society of Heating, Refrigerating and Air-Conditioning Engineers standards for indoor air quality and outside air intake. For example, assessors determined whether temperatures could be controlled in individual rooms and whether HVAC systems could be shut down by zone after school hours. Elementary schools received one of four possible scores for this parameter: 39.02 points (the maximum score), 29.27 points (75% of the maximum score), 19.51 (50% of the maximum score), or 0 points. The distribution of Mechanical System points for elementary schools skew toward the high end with seven buildings receiving 39.02 points and 21 buildings receiving 29.27 points. Only six of the 34 elementary schools received fewer than 29.27 points. While only a single middle school received the maximum number of points, no middle school received fewer than 19.51 points.
MECHANICAL SYSTEMS
Maximum FACT Points: 39.02
High FACT Score Low FACT Score Range
Elementary Schools 39.02 0.00 39.02
Middle Schools 39.02 19.51 19.51
6. Electrical Systems This FACT parameter assessed building electrical systems including the adequacy of the power supply, lighting intensity and efficiency, and the availability of back-up electrical supply. Three of the 34 elementary schools received the maximum score of 19.51 points. Seven of the 11 middle schools scored 13.01 points for this parameter. For both elementary and middle schools, the lowest scoring buildings received 6.50 points. Many of the schools with the highest scores in this parameter had inadequate
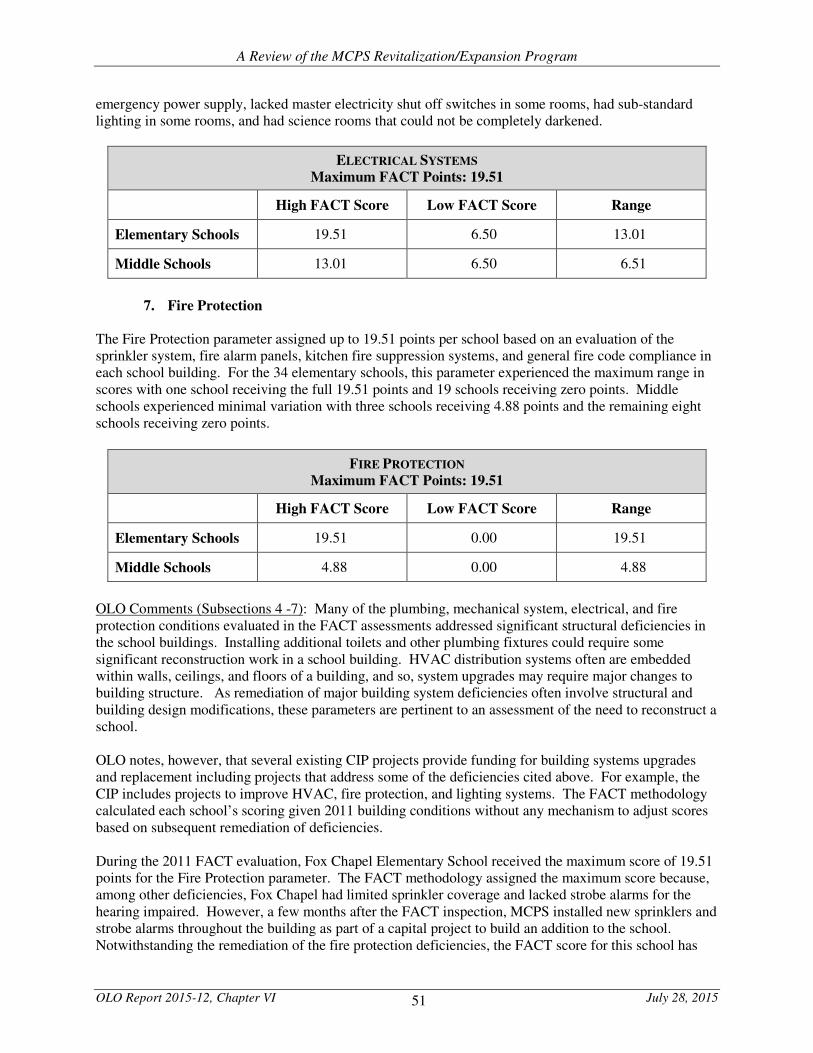
51
A Review of the MCPS Revitalization/Expansion Program
OLO Report 2015-12, Chapter VI July 28, 2015
emergency power supply, lacked master electricity shut off switches in some rooms, had sub-standard lighting in some rooms, and had science rooms that could not be completely darkened.
ELECTRICAL SYSTEMS
Maximum FACT Points: 19.51
High FACT Score Low FACT Score Range
Elementary Schools 19.51 6.50 13.01
Middle Schools 13.01 6.50 6.51
7. Fire Protection The Fire Protection parameter assigned up to 19.51 points per school based on an evaluation of the sprinkler system, fire alarm panels, kitchen fire suppression systems, and general fire code compliance in each school building. For the 34 elementary schools, this parameter experienced the maximum range in scores with one school receiving the full 19.51 points and 19 schools receiving zero points. Middle schools experienced minimal variation with three schools receiving 4.88 points and the remaining eight schools receiving zero points.
FIRE PROTECTION
Maximum FACT Points: 19.51
High FACT Score Low FACT Score Range
Elementary Schools 19.51 0.00 19.51
Middle Schools 4.88 0.00 4.88
OLO Comments (Subsections 4 -7): Many of the plumbing, mechanical system, electrical, and fire protection conditions evaluated in the FACT assessments addressed significant structural deficiencies in the school buildings. Installing additional toilets and other plumbing fixtures could require some significant reconstruction work in a school building. HVAC distribution systems often are embedded within walls, ceilings, and floors of a building, and so, system upgrades may require major changes to building structure. As remediation of major building system deficiencies often involve structural and building design modifications, these parameters are pertinent to an assessment of the need to reconstruct a school. OLO notes, however, that several existing CIP projects provide funding for building systems upgrades and replacement including projects that address some of the deficiencies cited above. For example, the CIP includes projects to improve HVAC, fire protection, and lighting systems. The FACT methodology calculated each school’s scoring given 2011 building conditions without any mechanism to adjust scores based on subsequent remediation of deficiencies. During the 2011 FACT evaluation, Fox Chapel Elementary School received the maximum score of 19.51 points for the Fire Protection parameter. The FACT methodology assigned the maximum score because, among other deficiencies, Fox Chapel had limited sprinkler coverage and lacked strobe alarms for the hearing impaired. However, a few months after the FACT inspection, MCPS installed new sprinklers and strobe alarms throughout the building as part of a capital project to build an addition to the school. Notwithstanding the remediation of the fire protection deficiencies, the FACT score for this school has
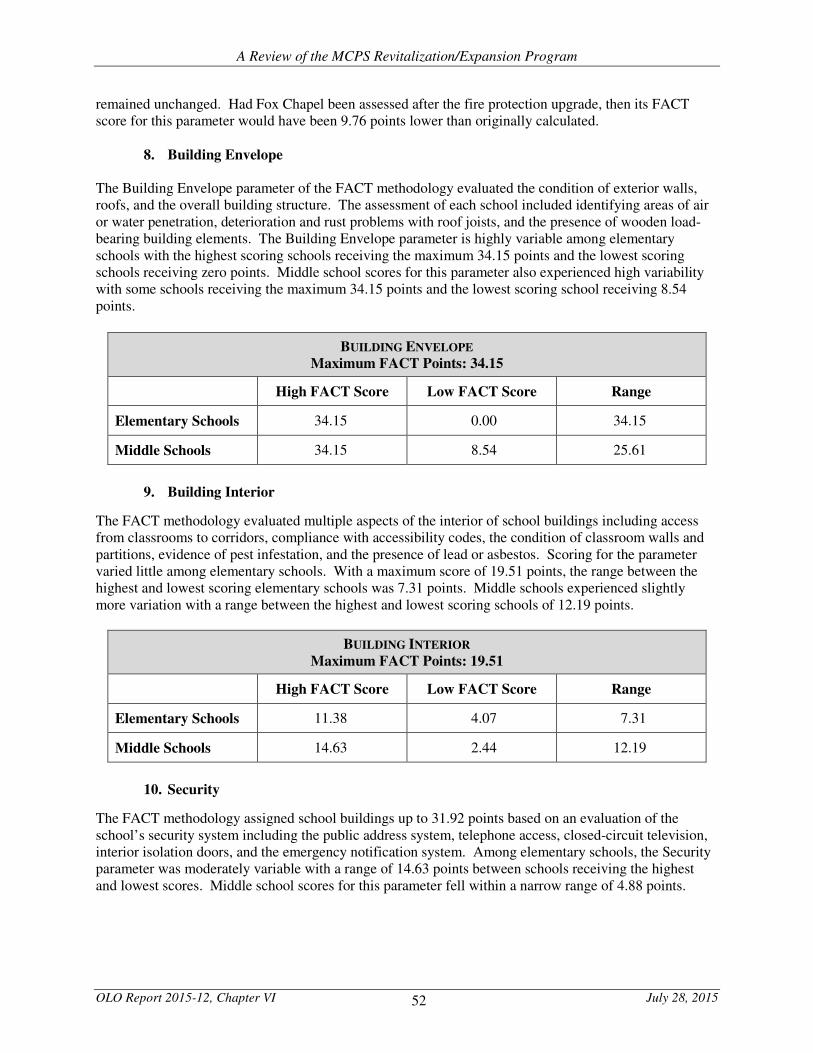
52
A Review of the MCPS Revitalization/Expansion Program
OLO Report 2015-12, Chapter VI July 28, 2015
remained unchanged. Had Fox Chapel been assessed after the fire protection upgrade, then its FACT score for this parameter would have been 9.76 points lower than originally calculated.
8. Building Envelope
The Building Envelope parameter of the FACT methodology evaluated the condition of exterior walls, roofs, and the overall building structure. The assessment of each school included identifying areas of air or water penetration, deterioration and rust problems with roof joists, and the presence of wooden load-bearing building elements. The Building Envelope parameter is highly variable among elementary schools with the highest scoring schools receiving the maximum 34.15 points and the lowest scoring schools receiving zero points. Middle school scores for this parameter also experienced high variability with some schools receiving the maximum 34.15 points and the lowest scoring school receiving 8.54 points.
BUILDING ENVELOPE
Maximum FACT Points: 34.15
High FACT Score Low FACT Score Range
Elementary Schools 34.15 0.00 34.15
Middle Schools 34.15 8.54 25.61
9. Building Interior
The FACT methodology evaluated multiple aspects of the interior of school buildings including access from classrooms to corridors, compliance with accessibility codes, the condition of classroom walls and partitions, evidence of pest infestation, and the presence of lead or asbestos. Scoring for the parameter varied little among elementary schools. With a maximum score of 19.51 points, the range between the highest and lowest scoring elementary schools was 7.31 points. Middle schools experienced slightly more variation with a range between the highest and lowest scoring schools of 12.19 points.
BUILDING INTERIOR
Maximum FACT Points: 19.51
High FACT Score Low FACT Score Range
Elementary Schools 11.38 4.07 7.31
Middle Schools 14.63 2.44 12.19
10. Security
The FACT methodology assigned school buildings up to 31.92 points based on an evaluation of the school’s security system including the public address system, telephone access, closed-circuit television, interior isolation doors, and the emergency notification system. Among elementary schools, the Security parameter was moderately variable with a range of 14.63 points between schools receiving the highest and lowest scores. Middle school scores for this parameter fell within a narrow range of 4.88 points.
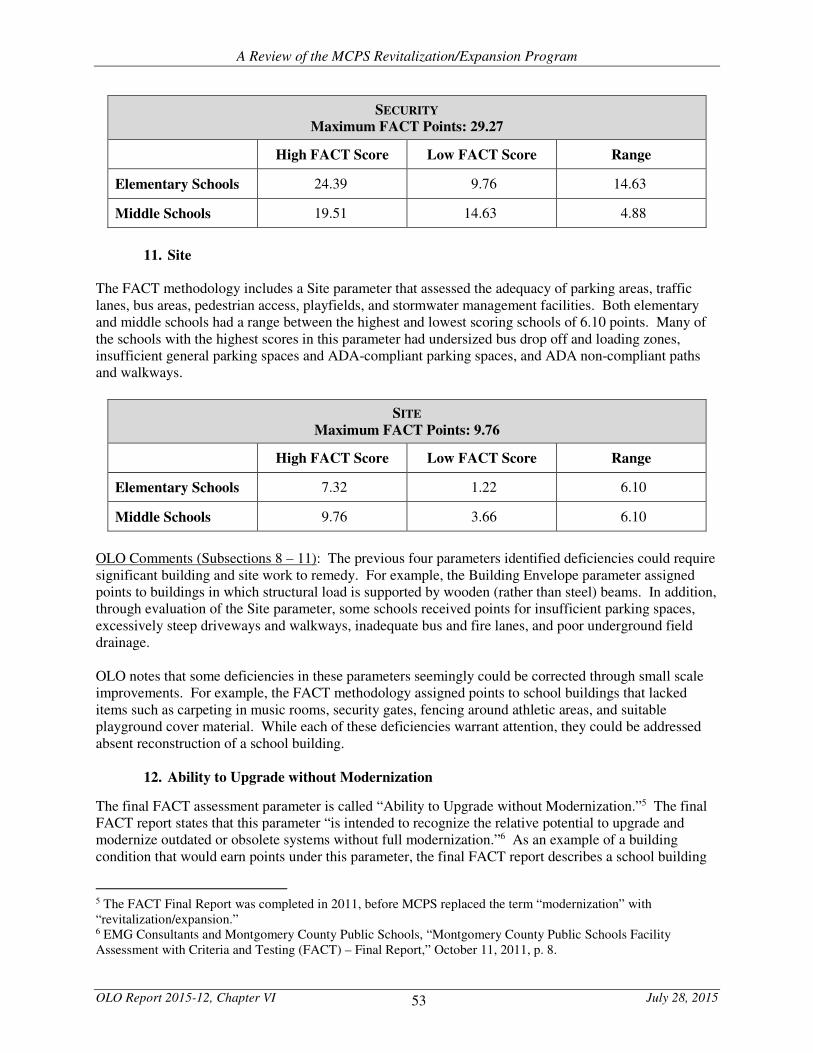
53
A Review of the MCPS Revitalization/Expansion Program
OLO Report 2015-12, Chapter VI July 28, 2015
SECURITY
Maximum FACT Points: 29.27
High FACT Score Low FACT Score Range
Elementary Schools 24.39 9.76 14.63
Middle Schools 19.51 14.63 4.88
11. Site The FACT methodology includes a Site parameter that assessed the adequacy of parking areas, traffic lanes, bus areas, pedestrian access, playfields, and stormwater management facilities. Both elementary and middle schools had a range between the highest and lowest scoring schools of 6.10 points. Many of the schools with the highest scores in this parameter had undersized bus drop off and loading zones, insufficient general parking spaces and ADA-compliant parking spaces, and ADA non-compliant paths and walkways.
SITE
Maximum FACT Points: 9.76
High FACT Score Low FACT Score Range
Elementary Schools 7.32 1.22 6.10
Middle Schools 9.76 3.66 6.10
OLO Comments (Subsections 8 – 11): The previous four parameters identified deficiencies could require significant building and site work to remedy. For example, the Building Envelope parameter assigned points to buildings in which structural load is supported by wooden (rather than steel) beams. In addition, through evaluation of the Site parameter, some schools received points for insufficient parking spaces, excessively steep driveways and walkways, inadequate bus and fire lanes, and poor underground field drainage. OLO notes that some deficiencies in these parameters seemingly could be corrected through small scale improvements. For example, the FACT methodology assigned points to school buildings that lacked items such as carpeting in music rooms, security gates, fencing around athletic areas, and suitable playground cover material. While each of these deficiencies warrant attention, they could be addressed absent reconstruction of a school building.
12. Ability to Upgrade without Modernization
The final FACT assessment parameter is called “Ability to Upgrade without Modernization.”5 The final FACT report states that this parameter “is intended to recognize the relative potential to upgrade and modernize outdated or obsolete systems without full modernization.”6 As an example of a building condition that would earn points under this parameter, the final FACT report describes a school building
5 The FACT Final Report was completed in 2011, before MCPS replaced the term “modernization” with “revitalization/expansion.” 6 EMG Consultants and Montgomery County Public Schools, “Montgomery County Public Schools Facility Assessment with Criteria and Testing (FACT) – Final Report,” October 11, 2011, p. 8.

54
A Review of the MCPS Revitalization/Expansion Program
OLO Report 2015-12, Chapter VI July 28, 2015
that would require extensive building interior reconstruction to accommodate the ductwork necessary to upgrade a substandard ventilation system. The final FACT report also cites other items evaluated under this parameter including site constraints, electrical capacity, building orientation, expandability of building systems, and structural aspects (such as floor-to-ceiling heights). Elementary schools had a narrow range (4.88 points) between the highest and lowest scoring schools in this parameter while middle schools had a wider range (8.54 points.)
ABILITY TO UPGRADE WITHOUT MODERNIZATION
Maximum FACT Points: 9.76
High FACT Score Low FACT Score Range
Elementary Schools 9.76 4.88 4.88
Middle Schools 9.76 1.22 8.54
OLO Comments: In reviewing the school-specific FACT scoring, OLO found that the assessment criteria for this parameter focused primarily on the topic of building expansion. Nearly all of the scoring criteria addressed the amount of unbuilt land area and the capacity of mechanical, electrical, and plumbing systems to accommodate building additions. D. OLO Observations Regarding 2011 FACT Scoring After reviewing the FACT methodology and scoring for all 19 scoring parameters, OLO developed the following observations and conclusions.
1. The FACT methodology provides a quantitative method for determining the sequence of the
Revitalization/Expansion queue.
The sequence of schools listed in the Revitalization/Expansion queue was determined through a quantitative process based on defined criteria. The methodology used to rank schools within the queue involved a series of distinct evaluations of measurable building conditions and properties. OLO’s review of the FACT process found no evidence of bias or subjective decision-making in the scoring of individual schools.
2. The Educational Program parameters used in the FACT methodology were pertinent to an
assessment of the need to reconstruct a school.
The MCPS Revitalization/Expansion program is essentially a school building reconstruction program. Projects funded through the Revitalization/Expansion CIP projects involve near complete demolition and reconstruction of school buildings with minimal salvage of existing structures. As such, the rankings of schools in the reconstruction queue should evaluate building conditions and characteristics inherently related to fixed structural design elements. The seven Educational Program FACT parameters each identify deficiencies that would require significant structural and building design modifications to correct. As such, OLO finds that the parameters in this category are pertinent to a building reconstruction needs assessment.
3. The Physical Infrastructure parameters addressed significant structural deficiencies in school
buildings.
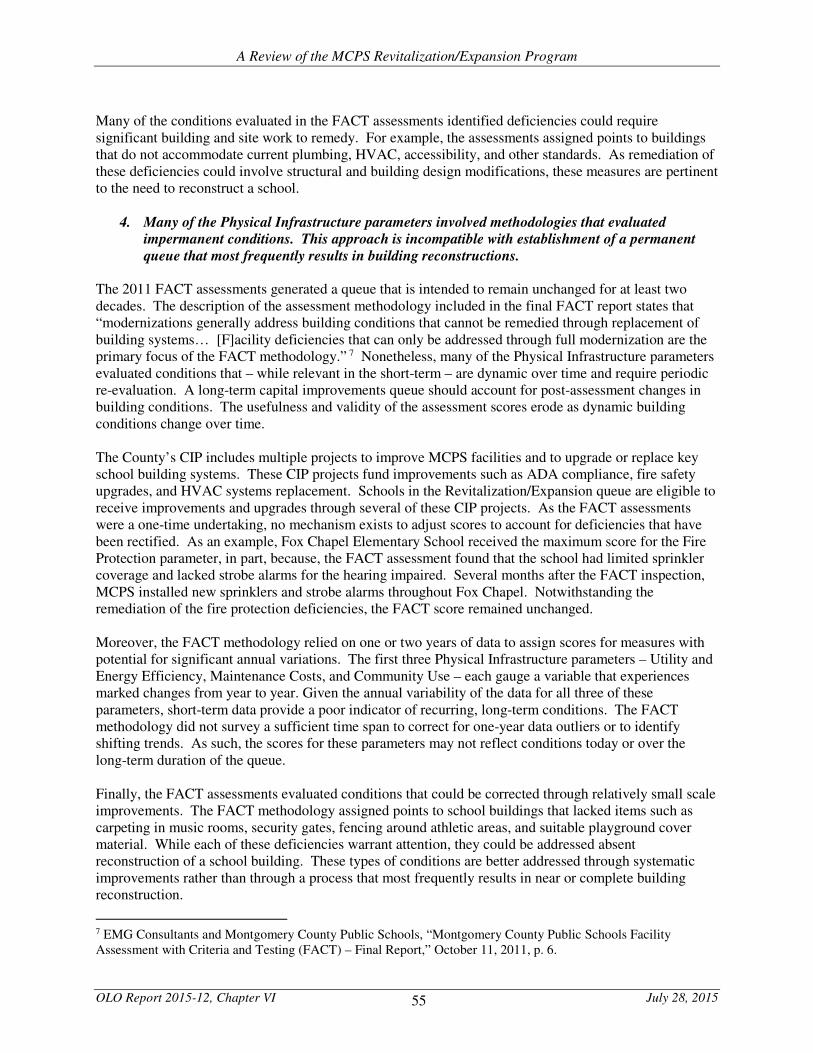
55
A Review of the MCPS Revitalization/Expansion Program
OLO Report 2015-12, Chapter VI July 28, 2015
Many of the conditions evaluated in the FACT assessments identified deficiencies could require significant building and site work to remedy. For example, the assessments assigned points to buildings that do not accommodate current plumbing, HVAC, accessibility, and other standards. As remediation of these deficiencies could involve structural and building design modifications, these measures are pertinent to the need to reconstruct a school.
4. Many of the Physical Infrastructure parameters involved methodologies that evaluated
impermanent conditions. This approach is incompatible with establishment of a permanent
queue that most frequently results in building reconstructions.
The 2011 FACT assessments generated a queue that is intended to remain unchanged for at least two decades. The description of the assessment methodology included in the final FACT report states that “modernizations generally address building conditions that cannot be remedied through replacement of building systems… [F]acility deficiencies that can only be addressed through full modernization are the primary focus of the FACT methodology.” 7 Nonetheless, many of the Physical Infrastructure parameters evaluated conditions that – while relevant in the short-term – are dynamic over time and require periodic re-evaluation. A long-term capital improvements queue should account for post-assessment changes in building conditions. The usefulness and validity of the assessment scores erode as dynamic building conditions change over time. The County’s CIP includes multiple projects to improve MCPS facilities and to upgrade or replace key school building systems. These CIP projects fund improvements such as ADA compliance, fire safety upgrades, and HVAC systems replacement. Schools in the Revitalization/Expansion queue are eligible to receive improvements and upgrades through several of these CIP projects. As the FACT assessments were a one-time undertaking, no mechanism exists to adjust scores to account for deficiencies that have been rectified. As an example, Fox Chapel Elementary School received the maximum score for the Fire Protection parameter, in part, because, the FACT assessment found that the school had limited sprinkler coverage and lacked strobe alarms for the hearing impaired. Several months after the FACT inspection, MCPS installed new sprinklers and strobe alarms throughout Fox Chapel. Notwithstanding the remediation of the fire protection deficiencies, the FACT score remained unchanged. Moreover, the FACT methodology relied on one or two years of data to assign scores for measures with potential for significant annual variations. The first three Physical Infrastructure parameters – Utility and Energy Efficiency, Maintenance Costs, and Community Use – each gauge a variable that experiences marked changes from year to year. Given the annual variability of the data for all three of these parameters, short-term data provide a poor indicator of recurring, long-term conditions. The FACT methodology did not survey a sufficient time span to correct for one-year data outliers or to identify shifting trends. As such, the scores for these parameters may not reflect conditions today or over the long-term duration of the queue. Finally, the FACT assessments evaluated conditions that could be corrected through relatively small scale improvements. The FACT methodology assigned points to school buildings that lacked items such as carpeting in music rooms, security gates, fencing around athletic areas, and suitable playground cover material. While each of these deficiencies warrant attention, they could be addressed absent reconstruction of a school building. These types of conditions are better addressed through systematic improvements rather than through a process that most frequently results in near or complete building reconstruction.
7 EMG Consultants and Montgomery County Public Schools, “Montgomery County Public Schools Facility Assessment with Criteria and Testing (FACT) – Final Report,” October 11, 2011, p. 6.
56
A Review of the MCPS Revitalization/Expansion Program
OLO Report 2015-12, Chapter VI July 28, 2015
5. OLO identified errors in the FACT score calculations.
The calculation of FACT scores included multiple errors; correction of these flaws would alter the results of the 2011 FACT assessments. OLO determined that the FACT scoring: (a) double counted points for the Administrative parameter; (b) used incorrect square footage data in the calculation of maintenance and utility consumption rates for some schools; (c) used Piney Branch Elementary School as the scoring benchmark in the Utility and Energy Efficiency parameter without accounting for the presence of a swimming pool at the school; (d) included a formulaic error in the calculation of relative water consumption rates; and (e) failed to adjust for a clear data outlier in the calculation of relative school maintenance costs. While OLO identified the above five errors, OLO did not conduct a complete audit of all FACT scoring calculations.
6. A small change in FACT scoring could have a significant effect on the placement of a school
in the Revitalization/Expansion queue. MCPS ordered schools in the Revitalization/Expansion program queue based on the FACT scoring conducted in 2011. Small differences in FACT scores would have affected the sequence of schools in the queue. For many schools, a one or two point change in their FACT score would have altered their placement in the queue. Among elementary schools, a mere 21 points separates the school in the 15th place on the queue from the school in the 25th place. Given that current funding levels and the limited availability of holding schools constrains the pace of Revitalization/Expansion projects, a difference of a few spots in the queue could affect the scheduling of a school’s modernization by multiple years.
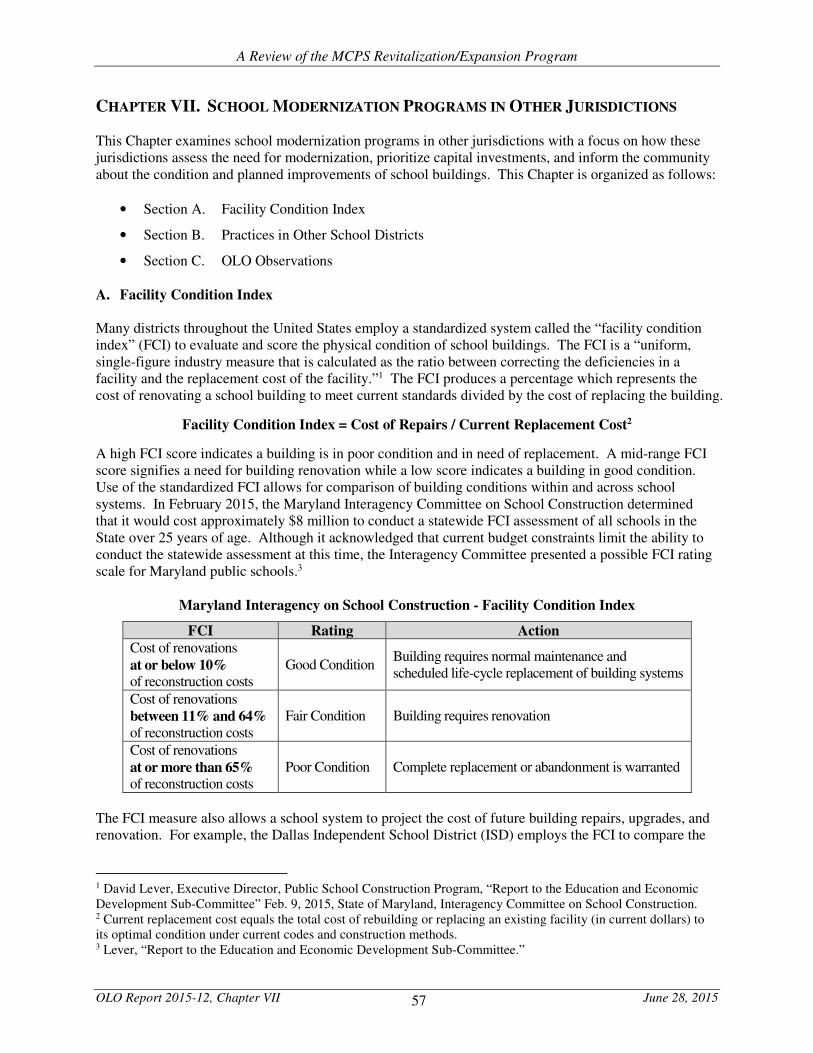
57
A Review of the MCPS Revitalization/Expansion Program
OLO Report 2015-12, Chapter VII June 28, 2015
CHAPTER VII. SCHOOL MODERNIZATION PROGRAMS IN OTHER JURISDICTIONS
This Chapter examines school modernization programs in other jurisdictions with a focus on how these jurisdictions assess the need for modernization, prioritize capital investments, and inform the community about the condition and planned improvements of school buildings. This Chapter is organized as follows:
• Section A. Facility Condition Index
• Section B. Practices in Other School Districts
• Section C. OLO Observations
A. Facility Condition Index
Many districts throughout the United States employ a standardized system called the “facility condition index” (FCI) to evaluate and score the physical condition of school buildings. The FCI is a “uniform, single-figure industry measure that is calculated as the ratio between correcting the deficiencies in a facility and the replacement cost of the facility.”1 The FCI produces a percentage which represents the cost of renovating a school building to meet current standards divided by the cost of replacing the building.
Facility Condition Index = Cost of Repairs / Current Replacement Cost2
A high FCI score indicates a building is in poor condition and in need of replacement. A mid-range FCI score signifies a need for building renovation while a low score indicates a building in good condition. Use of the standardized FCI allows for comparison of building conditions within and across school systems. In February 2015, the Maryland Interagency Committee on School Construction determined that it would cost approximately $8 million to conduct a statewide FCI assessment of all schools in the State over 25 years of age. Although it acknowledged that current budget constraints limit the ability to conduct the statewide assessment at this time, the Interagency Committee presented a possible FCI rating scale for Maryland public schools.3
Maryland Interagency on School Construction - Facility Condition Index
FCI Rating Action
Cost of renovations at or below 10% of reconstruction costs
Good Condition Building requires normal maintenance and scheduled life-cycle replacement of building systems
Cost of renovations between 11% and 64% of reconstruction costs
Fair Condition Building requires renovation
Cost of renovations at or more than 65% of reconstruction costs
Poor Condition Complete replacement or abandonment is warranted
The FCI measure also allows a school system to project the cost of future building repairs, upgrades, and renovation. For example, the Dallas Independent School District (ISD) employs the FCI to compare the
1 David Lever, Executive Director, Public School Construction Program, “Report to the Education and Economic Development Sub-Committee” Feb. 9, 2015, State of Maryland, Interagency Committee on School Construction. 2 Current replacement cost equals the total cost of rebuilding or replacing an existing facility (in current dollars) to its optimal condition under current codes and construction methods. 3 Lever, “Report to the Education and Economic Development Sub-Committee.”
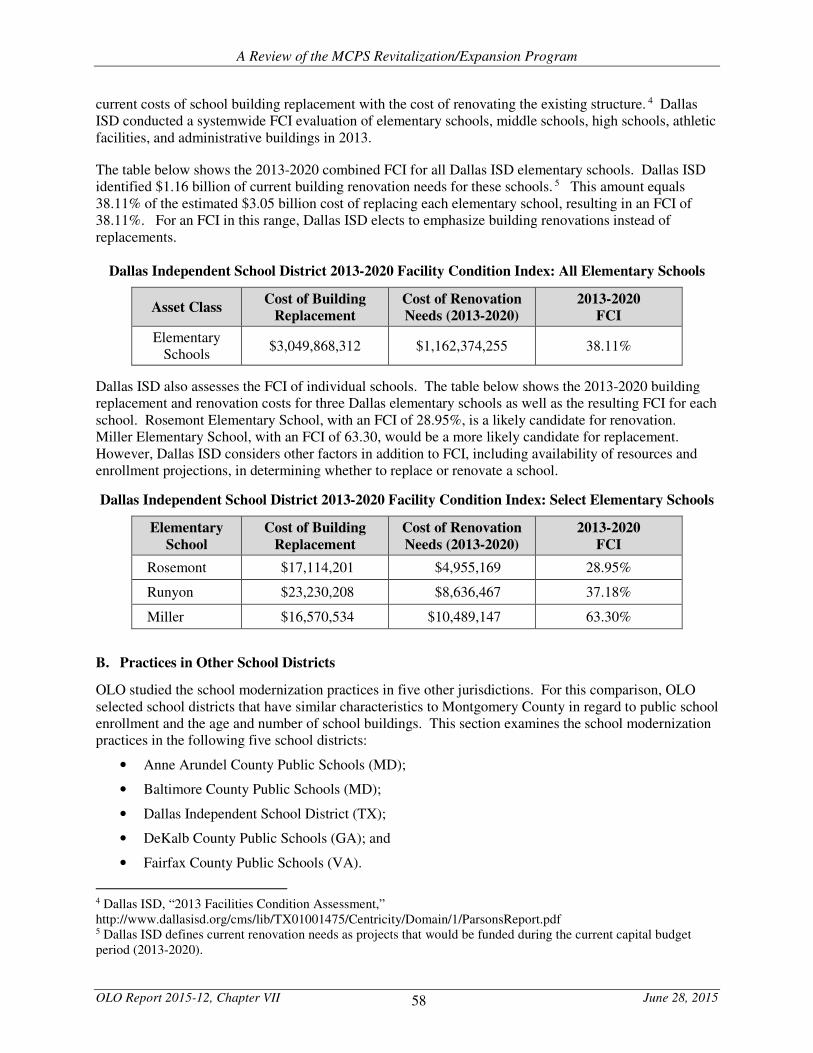
58
A Review of the MCPS Revitalization/Expansion Program
OLO Report 2015-12, Chapter VII June 28, 2015
current costs of school building replacement with the cost of renovating the existing structure. 4 Dallas ISD conducted a systemwide FCI evaluation of elementary schools, middle schools, high schools, athletic facilities, and administrative buildings in 2013.
The table below shows the 2013-2020 combined FCI for all Dallas ISD elementary schools. Dallas ISD identified $1.16 billion of current building renovation needs for these schools. 5 This amount equals 38.11% of the estimated $3.05 billion cost of replacing each elementary school, resulting in an FCI of 38.11%. For an FCI in this range, Dallas ISD elects to emphasize building renovations instead of replacements.
Dallas Independent School District 2013-2020 Facility Condition Index: All Elementary Schools
Asset Class Cost of Building
Replacement
Cost of Renovation
Needs (2013-2020)
2013-2020
FCI
Elementary Schools
$3,049,868,312 $1,162,374,255 38.11%
Dallas ISD also assesses the FCI of individual schools. The table below shows the 2013-2020 building replacement and renovation costs for three Dallas elementary schools as well as the resulting FCI for each school. Rosemont Elementary School, with an FCI of 28.95%, is a likely candidate for renovation. Miller Elementary School, with an FCI of 63.30, would be a more likely candidate for replacement. However, Dallas ISD considers other factors in addition to FCI, including availability of resources and enrollment projections, in determining whether to replace or renovate a school.
Dallas Independent School District 2013-2020 Facility Condition Index: Select Elementary Schools
Elementary
School
Cost of Building
Replacement
Cost of Renovation
Needs (2013-2020)
2013-2020
FCI
Rosemont $17,114,201 $4,955,169 28.95%
Runyon $23,230,208 $8,636,467 37.18%
Miller $16,570,534 $10,489,147 63.30%
B. Practices in Other School Districts
OLO studied the school modernization practices in five other jurisdictions. For this comparison, OLO selected school districts that have similar characteristics to Montgomery County in regard to public school enrollment and the age and number of school buildings. This section examines the school modernization practices in the following five school districts:
• Anne Arundel County Public Schools (MD);
• Baltimore County Public Schools (MD);
• Dallas Independent School District (TX);
• DeKalb County Public Schools (GA); and
• Fairfax County Public Schools (VA).
4 Dallas ISD, “2013 Facilities Condition Assessment,” http://www.dallasisd.org/cms/lib/TX01001475/Centricity/Domain/1/ParsonsReport.pdf 5 Dallas ISD defines current renovation needs as projects that would be funded during the current capital budget period (2013-2020).
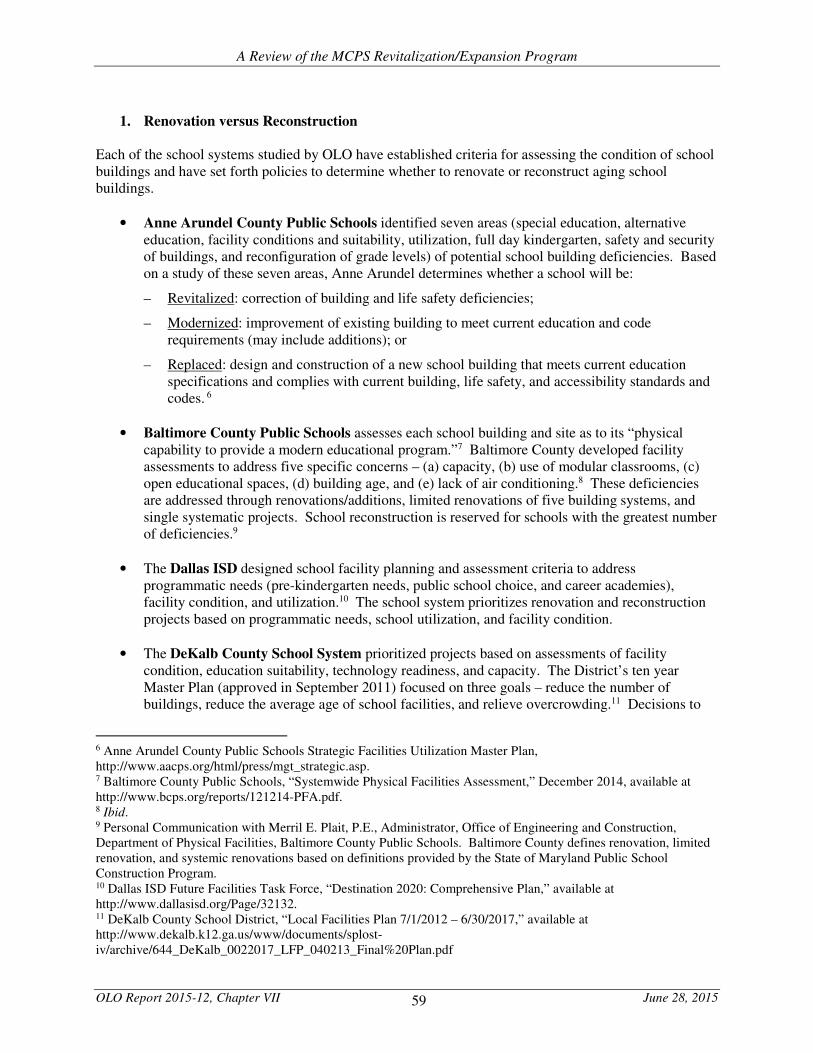
59
A Review of the MCPS Revitalization/Expansion Program
OLO Report 2015-12, Chapter VII June 28, 2015
1. Renovation versus Reconstruction
Each of the school systems studied by OLO have established criteria for assessing the condition of school buildings and have set forth policies to determine whether to renovate or reconstruct aging school buildings.
• Anne Arundel County Public Schools identified seven areas (special education, alternative education, facility conditions and suitability, utilization, full day kindergarten, safety and security of buildings, and reconfiguration of grade levels) of potential school building deficiencies. Based on a study of these seven areas, Anne Arundel determines whether a school will be:
– Revitalized: correction of building and life safety deficiencies;
– Modernized: improvement of existing building to meet current education and code requirements (may include additions); or
– Replaced: design and construction of a new school building that meets current education specifications and complies with current building, life safety, and accessibility standards and codes. 6
• Baltimore County Public Schools assesses each school building and site as to its “physical capability to provide a modern educational program.”7 Baltimore County developed facility assessments to address five specific concerns – (a) capacity, (b) use of modular classrooms, (c) open educational spaces, (d) building age, and (e) lack of air conditioning.8 These deficiencies are addressed through renovations/additions, limited renovations of five building systems, and single systematic projects. School reconstruction is reserved for schools with the greatest number of deficiencies.9
• The Dallas ISD designed school facility planning and assessment criteria to address programmatic needs (pre-kindergarten needs, public school choice, and career academies), facility condition, and utilization.10 The school system prioritizes renovation and reconstruction projects based on programmatic needs, school utilization, and facility condition.
• The DeKalb County School System prioritized projects based on assessments of facility condition, education suitability, technology readiness, and capacity. The District’s ten year Master Plan (approved in September 2011) focused on three goals – reduce the number of buildings, reduce the average age of school facilities, and relieve overcrowding.11 Decisions to
6 Anne Arundel County Public Schools Strategic Facilities Utilization Master Plan, http://www.aacps.org/html/press/mgt_strategic.asp. 7 Baltimore County Public Schools, “Systemwide Physical Facilities Assessment,” December 2014, available at http://www.bcps.org/reports/121214-PFA.pdf. 8 Ibid. 9 Personal Communication with Merril E. Plait, P.E., Administrator, Office of Engineering and Construction, Department of Physical Facilities, Baltimore County Public Schools. Baltimore County defines renovation, limited renovation, and systemic renovations based on definitions provided by the State of Maryland Public School Construction Program. 10 Dallas ISD Future Facilities Task Force, “Destination 2020: Comprehensive Plan,” available at http://www.dallasisd.org/Page/32132. 11 DeKalb County School District, “Local Facilities Plan 7/1/2012 – 6/30/2017,” available at http://www.dekalb.k12.ga.us/www/documents/splost-iv/archive/644_DeKalb_0022017_LFP_040213_Final%20Plan.pdf
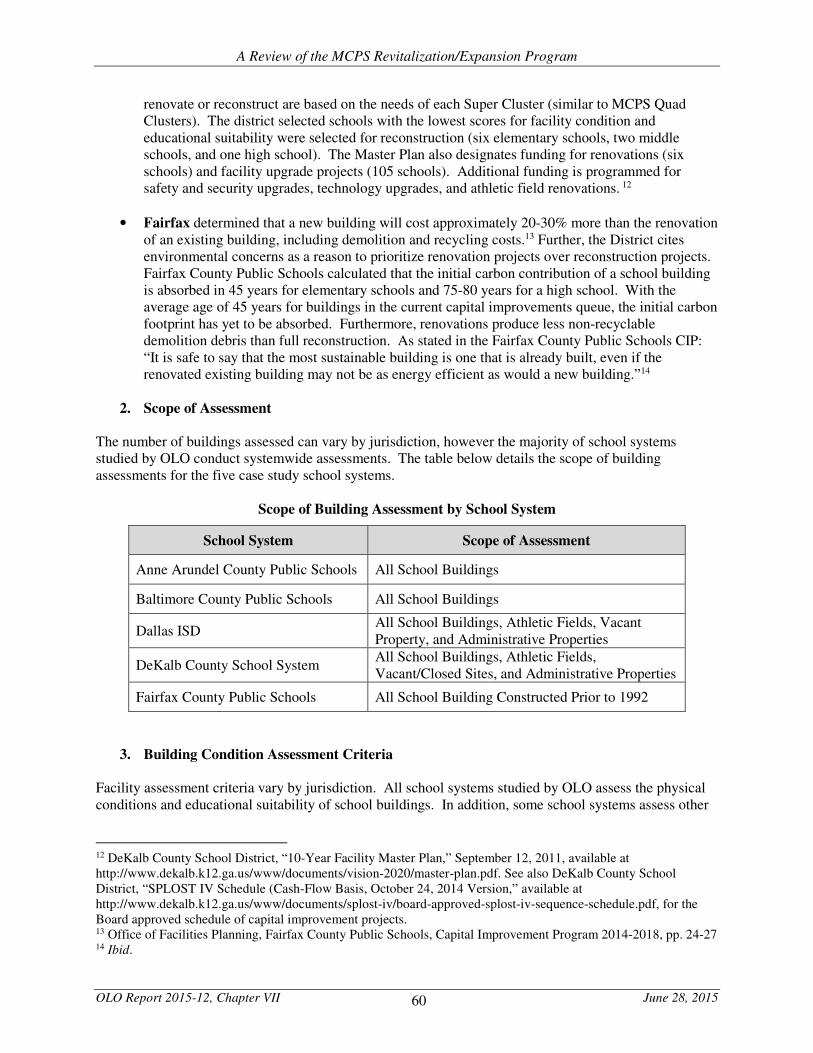
60
A Review of the MCPS Revitalization/Expansion Program
OLO Report 2015-12, Chapter VII June 28, 2015
renovate or reconstruct are based on the needs of each Super Cluster (similar to MCPS Quad Clusters). The district selected schools with the lowest scores for facility condition and educational suitability were selected for reconstruction (six elementary schools, two middle schools, and one high school). The Master Plan also designates funding for renovations (six schools) and facility upgrade projects (105 schools). Additional funding is programmed for safety and security upgrades, technology upgrades, and athletic field renovations. 12
• Fairfax determined that a new building will cost approximately 20-30% more than the renovation of an existing building, including demolition and recycling costs.13 Further, the District cites environmental concerns as a reason to prioritize renovation projects over reconstruction projects. Fairfax County Public Schools calculated that the initial carbon contribution of a school building is absorbed in 45 years for elementary schools and 75-80 years for a high school. With the average age of 45 years for buildings in the current capital improvements queue, the initial carbon footprint has yet to be absorbed. Furthermore, renovations produce less non-recyclable demolition debris than full reconstruction. As stated in the Fairfax County Public Schools CIP: “It is safe to say that the most sustainable building is one that is already built, even if the renovated existing building may not be as energy efficient as would a new building.”14
2. Scope of Assessment
The number of buildings assessed can vary by jurisdiction, however the majority of school systems studied by OLO conduct systemwide assessments. The table below details the scope of building assessments for the five case study school systems.
Scope of Building Assessment by School System
School System Scope of Assessment
Anne Arundel County Public Schools All School Buildings
Baltimore County Public Schools All School Buildings
Dallas ISD All School Buildings, Athletic Fields, Vacant Property, and Administrative Properties
DeKalb County School System All School Buildings, Athletic Fields, Vacant/Closed Sites, and Administrative Properties
Fairfax County Public Schools All School Building Constructed Prior to 1992
3. Building Condition Assessment Criteria
Facility assessment criteria vary by jurisdiction. All school systems studied by OLO assess the physical conditions and educational suitability of school buildings. In addition, some school systems assess other
12 DeKalb County School District, “10-Year Facility Master Plan,” September 12, 2011, available at http://www.dekalb.k12.ga.us/www/documents/vision-2020/master-plan.pdf. See also DeKalb County School District, “SPLOST IV Schedule (Cash-Flow Basis, October 24, 2014 Version,” available at http://www.dekalb.k12.ga.us/www/documents/splost-iv/board-approved-splost-iv-sequence-schedule.pdf, for the Board approved schedule of capital improvement projects. 13 Office of Facilities Planning, Fairfax County Public Schools, Capital Improvement Program 2014-2018, pp. 24-27 14 Ibid.
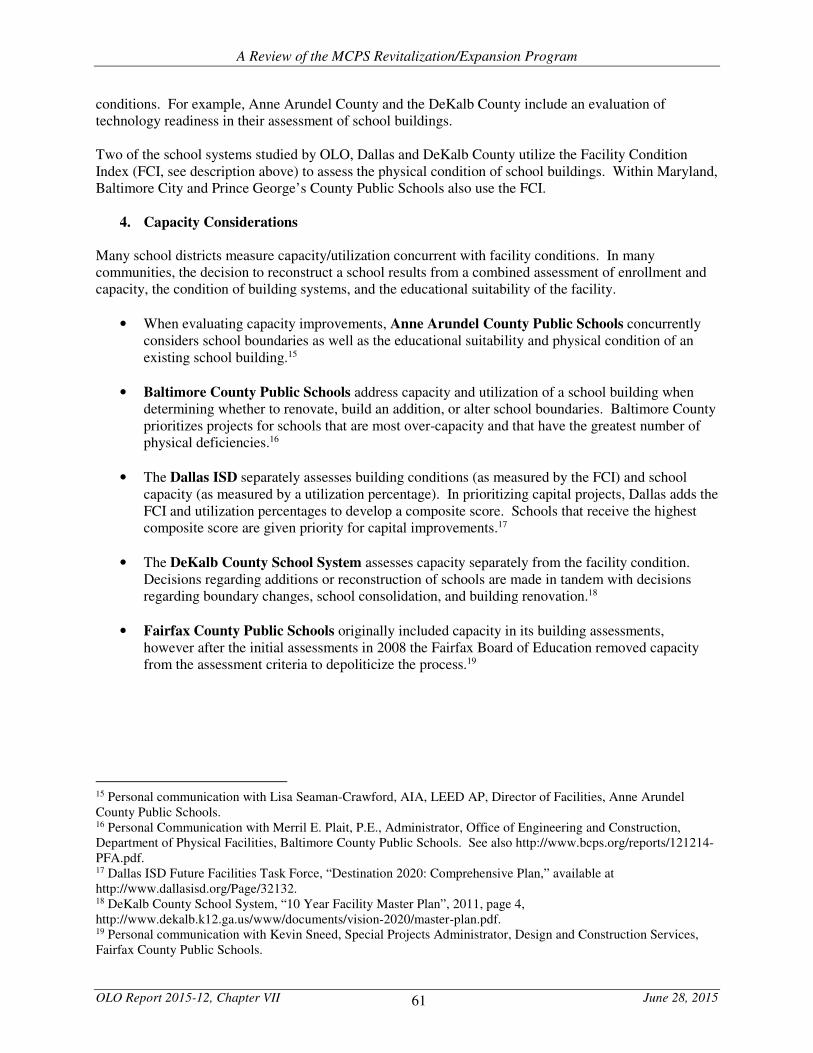
61
A Review of the MCPS Revitalization/Expansion Program
OLO Report 2015-12, Chapter VII June 28, 2015
conditions. For example, Anne Arundel County and the DeKalb County include an evaluation of technology readiness in their assessment of school buildings. Two of the school systems studied by OLO, Dallas and DeKalb County utilize the Facility Condition Index (FCI, see description above) to assess the physical condition of school buildings. Within Maryland, Baltimore City and Prince George’s County Public Schools also use the FCI.
4. Capacity Considerations Many school districts measure capacity/utilization concurrent with facility conditions. In many communities, the decision to reconstruct a school results from a combined assessment of enrollment and capacity, the condition of building systems, and the educational suitability of the facility.
• When evaluating capacity improvements, Anne Arundel County Public Schools concurrently considers school boundaries as well as the educational suitability and physical condition of an existing school building.15
• Baltimore County Public Schools address capacity and utilization of a school building when determining whether to renovate, build an addition, or alter school boundaries. Baltimore County prioritizes projects for schools that are most over-capacity and that have the greatest number of physical deficiencies.16
• The Dallas ISD separately assesses building conditions (as measured by the FCI) and school capacity (as measured by a utilization percentage). In prioritizing capital projects, Dallas adds the FCI and utilization percentages to develop a composite score. Schools that receive the highest composite score are given priority for capital improvements.17
• The DeKalb County School System assesses capacity separately from the facility condition. Decisions regarding additions or reconstruction of schools are made in tandem with decisions regarding boundary changes, school consolidation, and building renovation.18
• Fairfax County Public Schools originally included capacity in its building assessments, however after the initial assessments in 2008 the Fairfax Board of Education removed capacity from the assessment criteria to depoliticize the process.19
15 Personal communication with Lisa Seaman-Crawford, AIA, LEED AP, Director of Facilities, Anne Arundel County Public Schools. 16 Personal Communication with Merril E. Plait, P.E., Administrator, Office of Engineering and Construction, Department of Physical Facilities, Baltimore County Public Schools. See also http://www.bcps.org/reports/121214-PFA.pdf. 17 Dallas ISD Future Facilities Task Force, “Destination 2020: Comprehensive Plan,” available at http://www.dallasisd.org/Page/32132. 18 DeKalb County School System, “10 Year Facility Master Plan”, 2011, page 4, http://www.dekalb.k12.ga.us/www/documents/vision-2020/master-plan.pdf. 19 Personal communication with Kevin Sneed, Special Projects Administrator, Design and Construction Services, Fairfax County Public Schools.
62
A Review of the MCPS Revitalization/Expansion Program
OLO Report 2015-12, Chapter VII June 28, 2015
5. Reassessment of Building Conditions
As the conditions of school buildings change over time, many school districts recognize the need to periodically revisit the renovation and reconstruction queue. Some also routinely re-evaluate their assessment criteria. Often, school systems conduct comprehensive assessments, followed by subsequent updates after completion of capital improvements at a school.
• In 2005, Anne Arundel County Public Schools developed a ten-year plan for school building capital improvements. Schools were placed in a queue based on priority level as determined through the facility assessment process. As a result of fiscal constraints, the school system did complete the full list of priority projects by 2015. Currently, Anne Arundel Public Schools is developing an updated schedule to complete the remaining projects.20
• Baltimore County Public Schools finalized its most recent assessments in October of 2014. Reassessments will occur on a routine basis – as capital work is completed in a building, staff will update the assessment score. 21 At present, Baltimore County Public Schools is working on its “Schools for Our Future” program to modernize schools and address rising enrollment over the next 10 years.22
• Dallas ISD completed a comprehensive facility assessment study in 2013. The District established a 27 member committee known as the Future Facilities Task Force to develop a list of priority projects. In June 2015, the Task Force issued a draft plan to address school-by-school deficiencies including replacement schools to address severe overcrowding, additions, and replace failing infrastructure (roof, HVAC, etc.). The District is in the process of implementing this plan.23
• The DeKalb County School System mostly recently conducted comprehensive facility assessments in 2011. The school system recognizes the dynamic nature of building conditions. As stated in DeKalb’s ten-year school facility master plan:
The values of the combined scores are and will be fluid over the course the master plan. As facilities are improved and/or experience further decline, the value of the combined scores for each facility will change and the evaluation of the conditions to reflect these changes must be updated.24
20 Personal communication with Lisa Seaman-Crawford, AIA, LEED AP, Director of Facilities, Anne Arundel County Public Schools. 21 Personal Communication with Merril E. Plait, P.E., Administrator, Office of Engineering and Construction, Department of Physical Facilities, Baltimore County Public Schools. 22 Baltimore County Government, News Release, Executive Kevin Kamenetz: “State of Our County is Strong,” April 14, 2015, available at http://www.baltimorecountymd.gov/News/releases/0414budgetmessagenews.html. 23 Dallas ISD Future Facilities Taskforce available at http://www.dallasisd.org/Page/32132. See also Dallas ISD, “Trustees Briefed on Draft $1.59 Billon Plan to Address Critical Facility Needs,” June 25, 2015, available at https://thehub.dallasisd.org/2015/06/25/trustees-briefed-on-draft-1-59-billion-plan-to-address-critical-facility-needs/. 24 DeKalb County School System, “10 Year Facility Master Plan”, 2011, page 4, http://www.dekalb.k12.ga.us/www/documents/vision-2020/master-plan.pdf.
63
A Review of the MCPS Revitalization/Expansion Program
OLO Report 2015-12, Chapter VII June 28, 2015
DeKalb will conduct two-part facility condition assessments over the next year in preparation for the 2017-2022 capital improvements program. The first part of the assessment will examine the physical conditions of school buildings; the second part will look at educational suitability.25
• Fairfax County Public Schools last conducted building condition assessments in 2008. The school system plans to update assessment criteria in the Fall of 2015. When this is completed, the updated criteria will be applied to the schools in the current school modernization queue.26
6. Public Accessibility to School Building Condition Assessments
Although varying in format, each of the jurisdictions make facility condition reports and assessment scores available to the public.
• Anne Arundel County Public Schools provides a comprehensive facility assessment report on its website. This report contains the overall score of a building, a summary of scores for each assessment criteria, a list of deficiencies at each school, and recommendations to address each deficiency. 27
• Baltimore County Public Schools provides a comprehensive facility assessment report on its website. This report contains the overall score of a building, a summary of scores for each assessment criteria, and a list of deficiencies at each school. 28
• The Dallas ISD website allows the public to search by school name and to read the assessment report, a summary of scheduled building improvements, and the construction timeline.29
• The DeKalb County School System website posts a comprehensive facility assessment report that includes detailed information on building condition assessment methodology as well as the scoring from the most recent (2011) assessments.30
• Fairfax County Public Schools developed an online building condition dashboard which provides school specific data on building square feet, site acreage, floor ratio, year constructed and year renovated, and the number of portables and classrooms by grade. The school system also posts building condition score sheets online. 31
25 DeKalb County School District, “Building Spaces Project Team Conducts Facility Condition Assessments of DeKalb County School District Schoolhouses”, June 22, 2015, http://www.dekalb.k12.ga.us/www/news-and-events/wp-content/uploads/sites/6/2015/06/News-Release.SPACES-.6.22.15.pdf. 26 Personal communication with Kevin Sneed, Special Projects Administrator, Design and Construction Services, Fairfax County Public Schools 27 Anne Arundel County Public Schools, “Final Report,” http://www.aacps.org/html/press/mgt_strategic.asp. 28 Baltimore County Public Schools, “BCPS Systemwide Physical Facilities Assessment,” http://www.bcps.org/reports/121214-PFA.pdf 29 For individual school score sheets and school construction timelines, see “Our Students. Our Future. 2008 Dallas ISD Bond Program,” http://dallasisd2008bond.org/index.php/schools/detail/Clinton_P._Russell_Elementary_School/ 30 DeKalb County School System, “2011 Comprehensive Facility Assessment Report,” http://www.dekalb.k12.ga.us/www/documents/vision-2020/facility-report-(2011).pdf. 31 For individual score sheets for assessed schools, see Fairfax County Public Schools, “2008 Facility Evaluations,” http://www.fcps.edu/fts/designconst/facilityevaluations/index.shtml. For the Facility and Enrollment Dashboard, see Fairfax County Public Schools, “Dashboard Site, School year 2014-15,” http://www.fcps.edu/fts/dashboard/index.shtml.
64
A Review of the MCPS Revitalization/Expansion Program
OLO Report 2015-12, Chapter VII June 28, 2015
C. OLO Observations
The five school districts studied by OLO employ different practices to assess the need for school modernization. OLO found many practices that were common to all five districts. Similar to MCPS, each district evaluated school buildings for education suitability as well as for physical conditions. OLO notes the following areas where MCPS practices differ from most or all of the other school districts studied in this report.
• Each of the school districts studied by OLO use a building evaluation process to assess the need for both school renovation and reconstruction. In these districts, the most common outcome of the assessment process is targeted renovations; only schools with the worst conditions are designated for reconstruction. Some school districts use a methodology called the Facility Condition Index to compare the cost of building renovation with the cost of building replacement. In comparison, MCPS Revitalization/ Expansion projects most frequently involve complete or near complete reconstruction of a school building.
• Four of the five school districts studied by OLO include all school buildings – regardless of age – in their facility assessments. This practice allows for the development of a systemwide inventory of all school building deficiencies to be used for capital improvement planning purposes. In contrast, the FACT process employed by MCPS almost exclusively assessed buildings over a designated age.
• MCPS has a longer planned duration for its school modernization queue than any school system studied by OLO. The current MCPS’ queue is intended to remain unchanged for at least two decades. Other school districts periodically re-assess the condition of their schools and revise their capital improvements plan accordingly.
• All the school districts studied by OLO posted school building assessment reports available to the public via the Internet. In 2011, MCPS posted the results of the FACT assessments on its website. At present, however, the school-specific FACT results are not available online.
65
A Review of the MCPS Revitalization/Expansion Program
OLO Report 2015-12, Chapter VIII June 28, 2015
CHAPTER VIII: FINDINGS AND DISCUSSION QUESTIONS This chapter summarizes the major findings of this report and presents the discussion questions developed by the Office of Legislative Oversight (OLO) based on the findings. This chapter includes two sections:
• Section A. Summary of Report Findings
• Section B. Discussion Questions A. Summary of Report Findings
The major findings of this report include:
School Modernization Program History (Chapter 2)
• When developing the scope of a Revitalization/Expansion project, MCPS plans for the complete or near complete reconstruction of the building, rather than a renovation of the existing structure.
• Capacity considerations do not affect whether or when a school is included in the Revitalization/Expansion program. Other MCPS capital programs, most notably building additions, are intended to address capacity needs. However, once a school is scheduled for reconstruction through the Revitalization/Expansion program, MCPS will include capacity considerations in the project scope as needed to accommodate projected enrollment.
• MCPS has not re-assessed the schools in the Revitalization/Expansion program queue since 2011 nor does the school system plan to reassess the condition of these buildings in the future.
MCPS Policies and Practices (Chapter 3)
• The MCPS Board of Education approved a policy (Policy FKB) to emphasize capital projects that extend the useful life of school buildings and defer the need for building reconstruction.
Capital Improvements Expenditures (Chapter 4)
• During the five-year period from FY12 through FY16, school reconstruction expenditures totaled $578.2 million or nearly half of total MCPS capital expenditures. The scope of a school Revitalization/ Expansion capital project frequently includes the addition of classrooms.
• The County CIP includes at least eleven projects to upgrade schools and to replace school building systems. These capital projects serve to extend the useful life of MCPS facilities.
• The FY16 approved CIP includes $120.7 million for the Current Revitalization/Expansion capital project. In contrast, approved FY16 expenditures for the eleven CIP projects to extend the useful life of MCPS buildings total $49.8 million. As such, the CIP assumes that MCPS will spend about two-and-a-half times as much in FY16 for Revitalization/Expansion projects than it will spend for upgrades and improvements to major school building systems.
66
A Review of the MCPS Revitalization/Expansion Program
OLO Report 2015-12, Chapter VIII June 28, 2015
Age and Location of School Buildings and Modernizations (Chapter 5)
• MCPS school buildings have an average age of 25.1 years. The oldest school buildings include reopened, special program, and holding schools.
• There is geographic disparity, not bias, in the location of school modernization projects. School modernizations track the MCPS construction history; the highest concentration of modernizations have occurred in areas of the County with the oldest school buildings (the Downcounty Consortium and Southwest Quad Cluster). This trend will start to shift in upcoming years. Planned future modernization projects will be focused in the Northwest and Northeast Quad Clusters.
• Over the past several decades, the average age of an MCPS school at time of modernization has increased from 32 years to 51 years. The current approved CIP assumes that the 21 school Revitalization/Expansion projects programmed for 2016 through 2023 will have an average age of 46 years when completed. However, any changes in the planned schedule for 2016 through 2023 projects would alter the average age.
Analysis of 2011 FACT Scoring (Chapter 6)
• The sequence of schools listed in the Revitalization/Expansion queue was determined through a quantitative process known as Facility Assessment with Criteria and Testing (FACT) based on defined criteria. OLO’s review of the FACT process found no evidence of bias or subjective decision-making in the scoring of individual schools.
• The seven Educational Program FACT parameters each identified deficiencies that would require significant structural and building design modifications to correct. As such, OLO finds that the parameters in this category are pertinent to a building reconstruction needs assessment.
• The Physical Infrastructure parameters addressed significant structural deficiencies in school buildings that are pertinent to a building reconstruction needs assessment.
Many of the Physical Infrastructure parameters involved methodologies that evaluated impermanent conditions. This approach is incompatible with establishment of a permanent queue that most frequently results in building reconstructions. Several schools in the reconstruction queue have undergone capital improvements to upgrade or replace key building systems. As the FACT assessments were a one-time undertaking, no mechanism exists to adjust scores to account for deficiencies that have been rectified.
• The FACT methodology relied on one or two years of data to assign scores for measures that have the potential for significant annual variation (including utility consumption, maintenance costs, and community use). The FACT methodology did not survey a sufficient time span to correct for one-year data outliers or to identify shifting trends.
• The calculation of FACT scores included multiple errors; correction of these flaws would alter the results of the 2011 FACT assessments.
• A small change in FACT scoring could have a significant effect on the placement of a school in the Revitalization/Expansion program queue. For many schools, a one or two point change in their FACT score would have altered their ranking in the queue. Among elementary schools, a
67
A Review of the MCPS Revitalization/Expansion Program
OLO Report 2015-12, Chapter VIII June 28, 2015
mere 21 points separates the school in the 15th place on the queue from the school in the 25th place. Given that current funding levels and the limited availability of holding schools constrain the pace of reconstruction projects, a difference of a few spots in the queue could affect the scheduling of a school’s reconstruction by multiple years.
School Modernization Programs in Other Jurisdictions (Chapter 7)
• Each of the school districts studied by OLO use the building evaluation process to assess the need for both school renovation and reconstruction. In these districts, the most common outcome of the assessment process is targeted renovations; only schools with the worst conditions are designated for reconstruction. In comparison, MCPS Revitalization/ Expansion projects most frequently involve complete or near complete reconstruction of a school building.
• Four of the five school districts studied by OLO include all school buildings – regardless of age – in their facility assessments. This practice allows for the development of a systemwide inventory of all school building deficiencies to be used for capital improvement planning purposes. In contrast, the FACT process employed by MCPS almost exclusively assessed buildings over a designated age.
• MCPS has a longer planned duration for its school modernization queue than any school system studied by OLO. The current MCPS queue is intended to remain unchanged for at least two decades. Other schools districts periodically re-assess the condition of their schools and revise their capital improvements plan accordingly.
• Each of the other school districts studied by OLO make school building assessment reports available to the public via the Internet. In 2011, MCPS posted the results of the FACT assessments on its website. At present, however, the school-specific FACT results are not available online.
B. Discussion Questions
The County Charter grants the Council the authority to approve the Capital Improvement Program
including project-specific expenditure schedules and appropriations levels. The authority extends over
MCPS capital projects. Based on the findings of this report, OLO suggests that the Council discuss the
following questions with MCPS representatives.
1. What should be the relationship between the Revitalization/Expansion program and other
elements of the MCPS Capital Improvements Program including projects to extend the useful life
of existing buildings (such as roof and HVAC replacements) and projects to address capacity
issues (such as additions)?
2. What is the optimal relative allocation of capital dollars spent on school building modernizations
versus improvements that extend the useful life of school buildings?
3. What should be the planned useful life of a school building? Under what circumstances should a
school building be reconstructed?
68
A Review of the MCPS Revitalization/Expansion Program
OLO Report 2015-12, Chapter VIII June 28, 2015
4. Should the 2011 FACT assessments be the basis for the sequencing of a school modernization
queue that could extend for at least 20 years? Should MCPS periodically re-evaluate school
conditions and their relative need for modernization?
5. What information about school building assessments should be made available to the public?
69
A Review of the MCPS Revitalization/Expansion Program
OLO Report 2015-12, Chapter IX July 28, 2015
CHAPTER IX. AGENCY COMMENTS The Office of Legislative Oversight (OLO) circulated a final draft of this report to the Interim
Superintendent of the Montgomery County Public Schools. OLO appreciates the time taken by MCPS
staff to review the draft report and provide comments. The final report incorporates technical corrections
provided by the MCPS.
The written comments received from Interim Superintendent appear on the next page.
APPENDIX A
EXAMPLE MCPS FEASIBILITY STUDY PROCESS
BROWN STATION ELEMENTARY SCHOOL
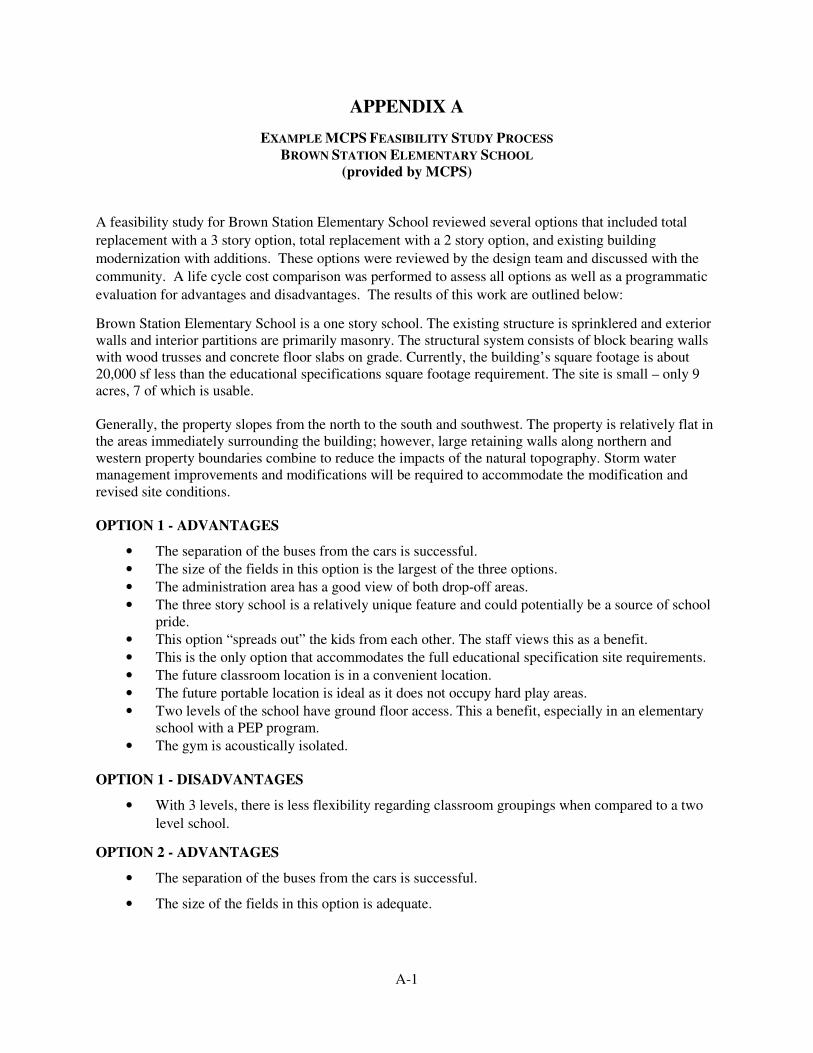
A-1
APPENDIX A
EXAMPLE MCPS FEASIBILITY STUDY PROCESS
BROWN STATION ELEMENTARY SCHOOL
(provided by MCPS)
A feasibility study for Brown Station Elementary School reviewed several options that included total
replacement with a 3 story option, total replacement with a 2 story option, and existing building
modernization with additions. These options were reviewed by the design team and discussed with the
community. A life cycle cost comparison was performed to assess all options as well as a programmatic
evaluation for advantages and disadvantages. The results of this work are outlined below:
Brown Station Elementary School is a one story school. The existing structure is sprinklered and exterior
walls and interior partitions are primarily masonry. The structural system consists of block bearing walls
with wood trusses and concrete floor slabs on grade. Currently, the building’s square footage is about
20,000 sf less than the educational specifications square footage requirement. The site is small – only 9
acres, 7 of which is usable.
Generally, the property slopes from the north to the south and southwest. The property is relatively flat in
the areas immediately surrounding the building; however, large retaining walls along northern and
western property boundaries combine to reduce the impacts of the natural topography. Storm water
management improvements and modifications will be required to accommodate the modification and
revised site conditions.
OPTION 1 - ADVANTAGES
• The separation of the buses from the cars is successful.
• The size of the fields in this option is the largest of the three options.
• The administration area has a good view of both drop-off areas.
• The three story school is a relatively unique feature and could potentially be a source of school
pride.
• This option “spreads out” the kids from each other. The staff views this as a benefit.
• This is the only option that accommodates the full educational specification site requirements.
• The future classroom location is in a convenient location.
• The future portable location is ideal as it does not occupy hard play areas.
• Two levels of the school have ground floor access. This a benefit, especially in an elementary
school with a PEP program.
• The gym is acoustically isolated.
OPTION 1 - DISADVANTAGES
• With 3 levels, there is less flexibility regarding classroom groupings when compared to a two
level school.
OPTION 2 - ADVANTAGES
• The separation of the buses from the cars is successful.
• The size of the fields in this option is adequate.
A-2
OPTION 2 - DISADVANTAGES
• The walk from the entrance to the farthest classroom is quite long.
• The location of the future classrooms is not ideal as it will require the contractors using the
fields to gain access to that area of the school.
OPTION 3 - ADVANTAGES
• The “loop” circulation is a benefit according to the staff.
OPTION 3 - DISADVANTAGES
• This option provides the smallest area for open space on the site.
• This option is difficult to resolve architecturally.
• This option will be particularly challenging due to the low ceiling heights of the existing
school due to the wood trusses.
All of the options evaluated have the ability to provide the required spaces in the building portion of the
educational specification; however, Option 3 will not meet the educational specification site requirements.
In addition, Option 2 was not well received by the school staff because of the distance between the
entrance and the farthest classroom.
The building, parking lot and fields are all in similar locations in all of the options. The most significant
differences between the options include the amount of school to be retained, the site circulation and the
number of stories of the final design.
Neither the community nor the school staff liked Option 3 due to the site challenges it proposed, being a
relatively large footprint on a small site and the remoteness of the new parking lot. In addition, the
existing structure is wood and the existing school has low ceilings which would dictate a less efficient
mechanical upgrade design. While Options 1 and 2 received a favorable response, it was determined that
the priority of both the staff and the community is for the modernized school to have the smallest
footprint possible to allow for the largest play area possible. This led the Feasibility Study participants to
recommend Option 1 be implemented.
In accordance with the consensus of the Feasibility Study participants, it is recommended that Option 1,
as depicted herein, and its associated site improvements, be implemented. Only Option 1 improves the
overall function of the building and site and fulfills all MCPS Program Requirements.
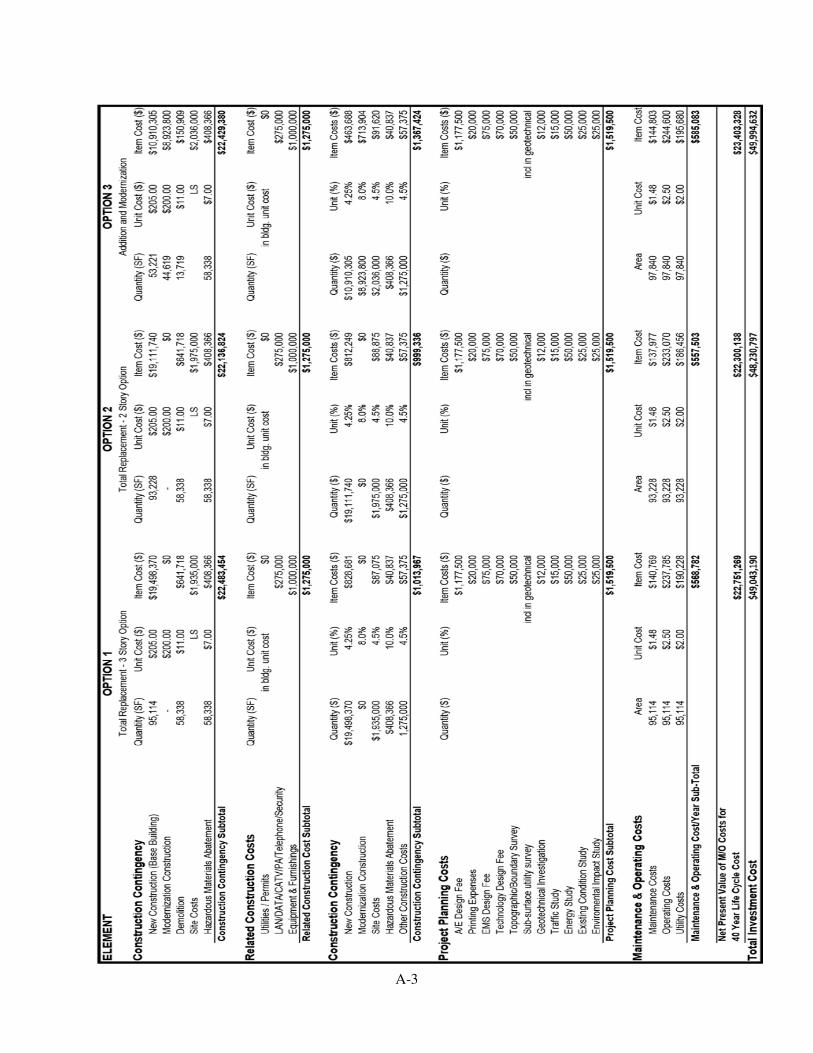
A-3
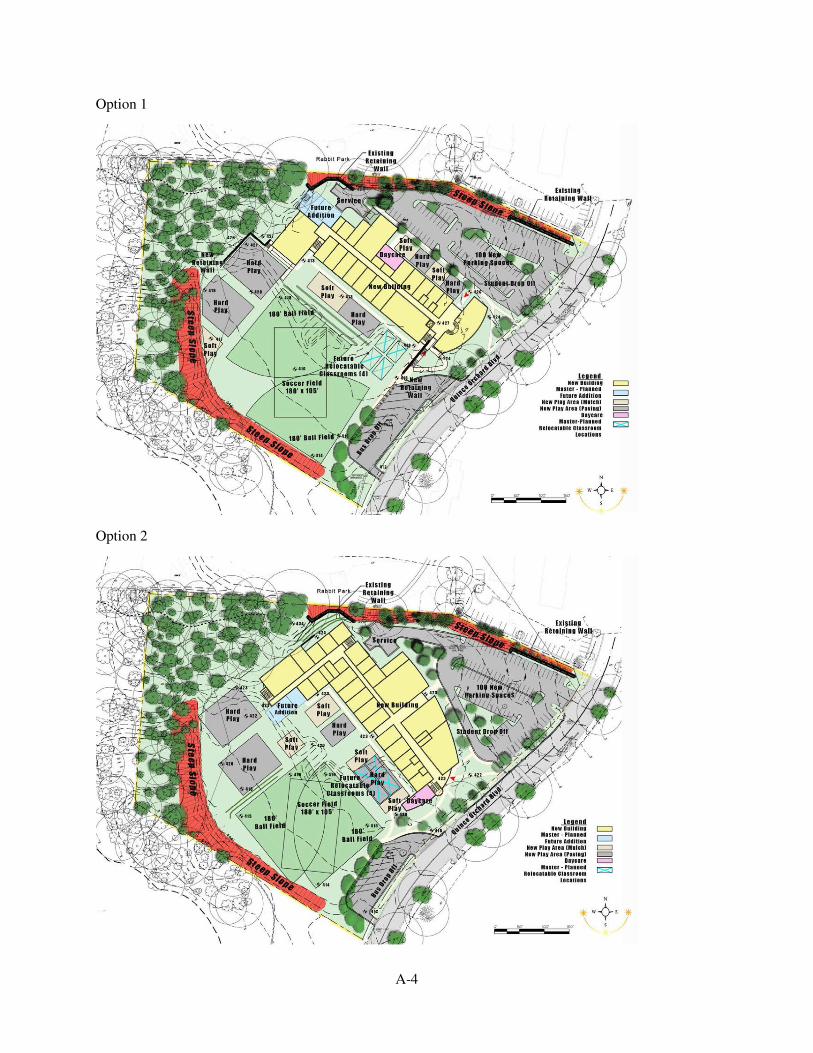
A-4
Option 1
Option 2
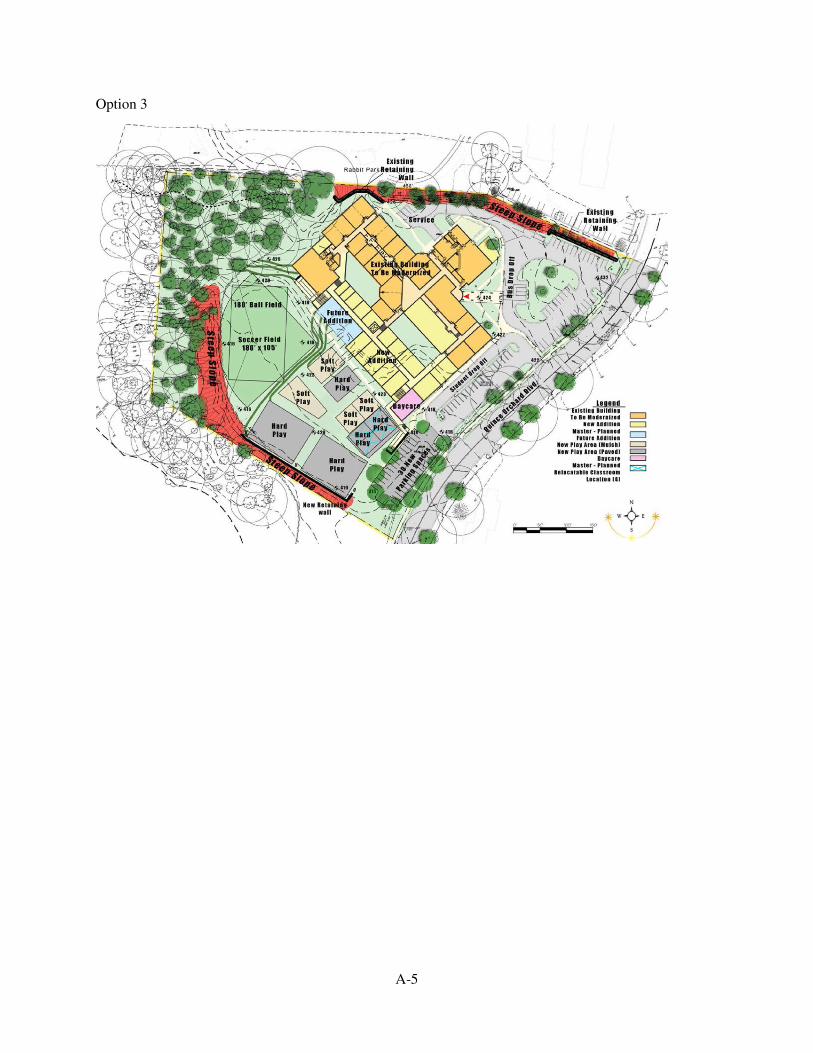
A-5
Option 3