a review of roller-integrated … and vennapusa 2010...a review of roller-integrated compaction...
TRANSCRIPT

A REVIEW OF ROLLER-INTEGRATED
COMPACTION MONITORING TECHNOLOGIES
FOR EARTHWORKS
Final Report ER10-04
Prepared By
David J. White, Ph.D. Associate Professor and holder of Wegner Professorship
Director, EERC Email: [email protected]
Pavana KR. Vennapusa, Ph.D.
Research Assistant Professor Email: [email protected]
Earthworks Engineering Research Center (EERC) Department of Civil Construction and Environmental Engineering
Iowa State University 2711 South Loop Drive, Suite 4700
Ames, IA 50010-8664 Phone: 515-294-7910 www.eerc.iastate.edu
April 1, 2010

ii
TABLE OF CONTENTS
ACKNOWLEDGMENTS ............................................................................................................ IV
NOTATIONS .................................................................................................................................. V
INTRODUCTION ...........................................................................................................................1
DEVELOPMENT OF CCC TECHNOLOGIES .............................................................................2
OVERVIEW OF CCC/IC TECHNOLGIES AND DOCUMENTATION SYSTEMS ...................3
Measurement Technologies ........................................................................................................ 3 Compaction Meter Value (CMV) ........................................................................................3 Oscillometer Value (OMV) .................................................................................................4 Compaction Control Value (CCV) ......................................................................................4 Roller-Integrated Stiffness (ks) ............................................................................................5 Omega Value .......................................................................................................................6 Vibratory Modulus (EVIB) Value .........................................................................................7 Machine Drive Power (MDP) ..............................................................................................8
Influence of Drum Behavior on CCC/IC Values ........................................................................ 9 Manufacturers, Roller Types, and Documentation Systems ..................................................... 10
FIELD CORRELATION STUDIES..............................................................................................15
SPECIFICATIONS ........................................................................................................................22
Overview of Current Specifications .......................................................................................... 22 New Developmental Specifications and Concepts ................................................................... 25
REFERENCES ..............................................................................................................................27

iii
LIST OF FIGURES Figure 1. Overview of CCC/IC compaction monitoring systems ....................................................1 Figure 2. Illustration of changes in drum harmonics with increasing ground stiffness (modified
from Thurner and Sandström 1980) .....................................................................................4 Figure 3. Changes in amplitude spectrum with increasing ground stiffness (modified from
Scherocman et al. 2007) .......................................................................................................5 Figure 4. Lumped parameter two-degree-of-freedom spring dashpot model representing vibratory
compactor and soil behavior (reproduced from Yoo and Selig 1980) .................................5 Figure 5. Ammann two-piece eccentric mass assembly and AFC of vibration amplitude and
frequency (picture courtesy of Ammann) ............................................................................6 Figure 6. One-degree-of-freedom lumped parameter model representation of vibratory compactor
(reproduced from Kröber et al. 2001) ..................................................................................7 Figure 7. BOMAG roller eccentric mass assembly and vectoring to vary the vertical excitation
force (left) and principle of BOMAG’s automatic feedback control (AFC) system (right) (courtesy of BOMAG) .........................................................................................................8
Figure 8. Influence of soil modulus and drum behavior on IC-MVs (from Adam and Kopf 2004)10 Figure 9. Influence of drum behavior on IC-MVs relative to soil modulus (based on numerical
simulations from Adam and Kopf 2004) (Note kB = ks) ....................................................10 Figure 10. Ammann and Case rollers (padfoot and smooth rum) equipped with roller-integrated
ks measurement system on-board display units with ACE-Plus® software .......................12 Figure 11. BOMAG rollers (padfoot and smooth rum) equipped with roller-integrated EVIB
measurement system on-board display units with BCM-05® software .............................12 Figure 12. Caterpillar rollers (padfoot and smooth rum) equipped with roller-integrated MDP and
CMV measurement systems on-board display unit with AcuGrade® software .................13 Figure 13. Dynapac rollers (padfoot and smooth rum) equipped with roller-integrated CMV
measurement system and on-board display unit with DCA® software ..............................13 Figure 14. Sakai rollers (padfoot and smooth rum) equipped with roller-integrated CCV
measurement system and on-board display unit with Aithon-MT® software ....................14 Figure 15. Trimble CB430 on-board display unit with roller-integrated CMV measurement
system ................................................................................................................................14 Figure 16. Various in-situ QC/QA test measurements: (a) nuclear moisture-density gauge; (b)
electrical density gauge; (c) light weight deflectometers; (d) soil stiffness gauge; (e) static plate load test; (f) falling weight deflectometer; (g) Briaud compaction device; (h) seismic pavement analyzer; (i) Clegg hammer; (j) shelby tube sampling; (k) dynamic cone penetrometer; (l) static cone penetrometer; and (m) heavy test rolling ....................16
Figure 17. Illustration of differences in measurement influence depths for different measurements (modified from White 2008) ......................................................................22
LIST OF TABLES Table 1. Key features of different CCC/IC systems (as of 2009) ..................................................11 Table 2. Summary of field correlation studies ...............................................................................17 Table 3. Summary of current CCC/IC specifications (modified from White et al. 2008a) ...........24

iv
ACKNOWLEDGMENTS
This study was funded by US FHWA research project DTFH61-07-C-R0032 “Accelerated Implementation of Intelligent Compaction Technology for Embankment Subgrade Soils, Aggregate Base, and Asphalt Pavement Materials”.

v
NOTATIONS
a Theoretical vibration amplitude (eccentric moment divided by the drum mass) a* Actual measured vibration amplitude (double integral of acceleration data) A Acceleration at fundamental frequency AX Acceleration at X-order harmonic A’ Machine acceleration AFC Automatic feedback control b machine internal loss coefficient used in MDP calculation B Contact width of the drum BCD Briaud compaction device CBR California bearing ratio CCC Continuous compaction control CCV Caterpillar compaction value CMV Compaction meter value COV Coefficient of variation (calculated as the ratio of mean and standard deviation) EVIB Vibratory modulus determined from the roller f Vibration frequency F Shape factor Fs Drum force FWD Falling weight deflectometer g Acceleration of gravity Gs Specific gravity GPS Global positioning system h Separation distance IC-MV Intelligent compaction measurement value ks Roller-integrated stiffness LL Liquid limit LWD Light weight deflectometer m Machine internal loss coefficient used in MDP calculation md drum mass mere Eccentric moment of the unbalanced mass MDP Caterpillar Machine drive power MDP40 See description in text MDP80 See description in text Pg Gross power needed to move the machine PLT Static Plate Load Test Point-MV In-situ point measurement value R’ Radius of the roller drum R2 Coefficient of determination RMV Resonant meter value W Roller weight zd Drum displacement α Slope angle (roller pitch from a sensor) Phase angle

1
INTRODUCTION
Development and evaluation of continuous compaction control (CCC) measurement technologies was initiated over three decades ago in Europe for use on vibratory rollers compacting granular soils (Forssblad 1980 and Thurner and Sandström 1980). Since its inception, the concept has been expanded to different measurement technologies and materials and is available commercially for different roller configurations. For vibratory roller configurations, CCC involves measurement and analysis of output from an accelerometer mounted to the roller drum and can provide a spatial record of compaction quality when linked to position measurements and a documentation system (Figure 1). When the measurement system provides automatic feedback control (AFC) for roller vibration amplitude and/or frequency, it is referred to as “intelligent” compaction (IC). Roller measurement values calculated based on accelerometer measurements use one of two different approaches: (1) calculate a ratio of selected frequency harmonics for a set time interval, or (2) calculate ground stiffness or elastic modulus based on a drum-ground interaction model and some assumptions. An alternative to accelerometer-based vibratory measurements is the measurement of rolling resistance/machine drive power and can be applied to both vibratory and non-vibratory roller operations. Regardless of the technology, the premise of CCC/IC is that the measurement values are related to traditional compaction measurements and will be useful as part of effective earthwork compaction operations and QC/QA practices. The purpose of this report is to provide an overview of the literature in areas of: (a) developmental history of CCC/IC; (b) CCC/IC technologies, manufacturers, and documentation systems; (c) factors influencing the CCC/IC measurements; (d) field correlation studies and factors influencing the correlations; and (e) specification attributes and concepts.
On‐board computerdisplay unit
Scale
a: 0.7 mm
f: 30 Hz
Mode: AutoPass: 1
Machine‐integrated sensors to measure drum/machine response to soil behavior
GPS‐ referenced roller position
Operation parameters
GPS‐ referenced color‐coded compaction value
GPS linked to on‐site base station
Figure 1. Overview of CCC/IC compaction monitoring systems
2
DEVELOPMENT OF CCC TECHNOLOGIES
The concept of CCC/IC was first investigated by Dr. Heinz Thurner of the Swedish Road Administration in 1974 by relating drum harmonics to soil compaction properties. Field trials were conducted by Dr. Thurner by instrumenting Dynapac vibratory smooth drum rollers using accelerometers on granular soils. Results from these field trials provided evidence that the ratio of the acceleration amplitude of the first harmonic and the acceleration amplitude of the fundamental frequency of the vibrating drum was an indicator of soil stiffness/modulus. In 1975, Dr. Thurner partnered with Åke Sandström and founded Geodynamik to continue research and development on CCC/IC. In 1976, CompactometerTM Compaction Meter Value (CMV) measurement was developed by Geodynamik in cooperation with the Dynapac Research Department. In 1980, five technical articles were presented on the CMV measurement technology and its applications (Thurner 1980, Thurner and Sandström 1980, Forssblad 1980, Hansbo and Pramborg 1980, and Machet 1980) at the First International Conference on Compaction held in Paris. In 1983, Geodynamik introduced the Oscillometer Value (OMV) for oscillatory rollers which is a dimensionless value obtained from the amplitude of the horizontal acceleration of the drum. HAMM AG adopted the OMV measurement technology (Thurner and Sandström 2000) for use on their smooth drum oscillatory rollers, but virtually no published information is available in the English literature on OMV relationships with soil properties. In the early 1980s, BOMAG developed the Terrameter® system measuring the Omega value (BTM 1983). The Omega value provides a measure of the compaction energy transmitted to the soil using accelerometer data. Hoover (1985) published a research report from a field study evaluating the Omega value on three different types of granular soils which showed encouraging results. Later in 2000, BOMAG replaced the Omega value by introducing the Vibratory Modulus (EVIB) value which uses acceleration data to determine drum displacement, an estimated applied force, and a dynamic roller-soil model (Kröber et al. 2001). In the late 1990s, Ammann introduced the roller-integrated stiffness (ks) measurement value, which provides a measure of quasi-static stiffness using the measured drum displacement, estimated applied force, and a spring-dashpot model representing roller-soil interaction (Anderegg and Kauffmann 2004). Currently, Dynapac, Trimble, and Caterpillar use the CMV measurement technology as part of their CCC/IC systems by linking CMV data with GPS measurements for on-board real time display. Trimble offers a retrofit CCC system for smooth drum vibratory rollers (see White and Vennapusa 2009). In 2004, Sakai introduced Compaction Control Value (CCV) which is also a dimensionless parameter similar to CMV (Scherocman et al. 2007). In 2003, a research collaboration project between the Iowa Department of Transportation, Federal highway Administration ((FHWA), and Caterpillar was initiated to evaluate Caterpillar’s Machine Drive Power (MDP) system for use on granular and cohesive soils. The MDP system is based on the principal of rolling resistance due to drum sinkage, and the approach works in both the vibratory and static modes. The measurement system has been investigated in field trials

3
since 2003 (Tehrani and Meehan 2009, White et al. 2004, 2005, White and Thompson 2008, Thompson and White 2008) and has recently been recently used on a full-scale earthwork compaction project in Minnesota (White et al. 2009a, b). Currently, BOMAG, Ammann, and Dynapac offer AFC/IC systems, wherein the vibration amplitude, and/or frequency are automatically adjusted when drum jumping is determined or when a preset threshold roller measurement value is reached. Some of the potential advantages cited in the literature (e.g., Adam and Kopf 2004) for using AFC for soil compaction are increased chance of more rapid compaction (i.e., less passes) and improved uniformity of soil properties. Based on this literature review, these benefits are not well quantified in the technical literature. OVERVIEW OF CCC/IC TECHNOLGIES AND DOCUMENTATION SYSTEMS
Measurement Technologies
Compaction Meter Value (CMV)
Compaction meter value (CMV) is a dimensionless compaction parameter developed by
Geodynamik that depends on roller dimensions, (i.e., drum diameter and weight) and roller operation parameters (e.g., frequency, amplitude, speed), and is determined using the dynamic roller response (Sandström 1994). The concept of development of different harmonic components of drum vibration with increasing ground stiffness is illustrated in (Figure 2). CMV is calculated using Eq. 1, where C is a constant (300), A2 = the acceleration of the first harmonic component of the vibration, A = the acceleration of the fundamental component of the vibration (Sandström and Pettersson 2004).
A
AC CMV 2 (1)
The Geodynamik system also measures the resonant meter value (RMV) which provides an indication of the drum behavior (e.g. continuous contact, partial uplift, double jump, rocking motion, and chaotic motion) and is calculated using Eq. 2, where A0.5 = subharmonic acceleration amplitude caused by jumping (the drum skips every other cycle). Dynapac reports the value as bouncing value (BV). It is important to note that the drum behavior affects the CMV measurements (Brandl and Adam 1997) and therefore must be interpreted in conjunction with the RMV or BV measurements (Vennapusa et al. 2010).
A
AC BVor RMV 0.5
(2)
Dynapac uses a preselected threshold BV as an indicator of roller jumping to adjust the amplitude in AFC mode compaction. Similarly, Caterpillar used RMV to adjust amplitude on a smooth drum vibratory roller used on a project (White et al. 2008b).

4
Soft Rubber ‐ 1 Uncompacted Sand Compacted Sand
f
A
2f
A
2f
A
2
A A
A2
A2
A
h h1 < h
A0.5
0.5
Increasing ground stiffness
Figure 2. Illustration of changes in drum harmonics with increasing ground stiffness (modified from Thurner and Sandström 1980)
Oscillometer Value (OMV)
Oscillometer Value (OMV) is an index dimensionless parameter developed specifically
for oscillatory rollers, and is obtained from the amplitude of the horizontal acceleration of the drum center (when there is no slip) from an accelerometer mounted on the bearing plate in horizontal direction (Thurner and Sandström 2000). The OMV reflects the horizontal force transferred from the drum to the soil and hence the horizontal stiffness of the soil surface under dynamic loading. Thurner (1993) noted that the OMV is quite insensitive to moderate variations (from about 28 to 32 Hz) in the excitation frequency.
Compaction Control Value (CCV)
The CCV determination takes the acceleration data from the first (0.5Ω), fundamental
(Ω), and higher-order harmonics (1.5Ω, 2Ω, 2.5Ω, 3Ω) into account by using Eq. 3. Research conducted by Sakai (Scherocman et al. 2007) found that as the ground stiffness increases and the roller drum starts to enter into a “jumping” motion, vibration accelerations at various frequency components are developed as illustrated in Figure 3.
100AA
AAAAACCV
5.0
35.225.15.0
(3)

5
f
A
2 f
A
2 f
A
2
A A
A2A2
A
32.51.50.5
A0.5
A1.5
A2.5A3
Increasing ground stiffness
Figure 3. Changes in amplitude spectrum with increasing ground stiffness (modified from Scherocman et al. 2007)
Roller-Integrated Stiffness (ks)
The roller-integrated stiffness (ks) measurement system was introduced by Ammann
based on a lumped parameter two-degree-of-freedom spring dashpot system illustrated in Figure 4 (Anderegg and Kauffmann 2004). The spring dashpot model has been found effective in representing the drum-ground interaction behavior (Yoo and Selig 1980). The drum inertia force and eccentric force time histories are determined from drum acceleration data and eccentric position (neglecting frame inertia). The drum displacement (zd) is determined by double integrating the measured peak drum accelerations.
zd
csks
mf
ksuspcsusp
fe(t)
zf
Equivalent frame weight
Suspension stiffnessand damping
Drum weightand dynamicforce generated
Soil stiffnessand damping
md
Fs
Figure 4. Lumped parameter two-degree-of-freedom spring dashpot model representing vibratory compactor and soil behavior (reproduced from Yoo and Selig 1980)
The ks value is determined using Eq. 4, where f is the excitation frequency, md is the drum mass, mere is the eccentric moment of the unbalanced mass, is the phase angle, a is vibration amplitude. The ks value represents a quasi-static stiffness value and is reportedly independent of the excitation frequency between 25 to 40 Hz (Anderegg and Kaufmann 2004).

6
a
cosrmmf4k eed22
s
(4)
The ks measurement system has the capability to perform compaction in a manual mode and in an automatic feedback control (AFC) mode. The AFC operations in the Case roller are controlled by the Ammann Compaction Expert (ACE) plus system. Three AFC operation settings are possible using the ACE plus system (Anderegg et al. 2006):
1. Low performance setting: Maximum applied force = 14 kN with vibration amplitude (a*) varying from 0.4 to 1.5 mm.
2. Medium performance setting: Maximum applied force = 20 kN with vibration amplitude (a*) varying from 1.0 to 2.0 mm.
3. High performance setting: Maximum applied force > 25 kN with vibration amplitude (a*) varying from 2.0 to 3.0 mm.
When operated in AFC mode, as sub-harmonic vibrations occur, the roller automatically adjusts the eccentric mass moment to adjust the vibration amplitude and excitation frequency (Anderegg et al. 2006). Correlation studies relating ks to soil dry unit weight, strength, and stiffness are documented in the literature (Anderegg and Kaufmann 2004).
Figure 5. Ammann two-piece eccentric mass assembly and AFC of vibration amplitude and frequency (picture courtesy of Ammann)
Omega Value
Omega value provides a measure of the energy transmitted to the soil. The concept is illustrated by the schematic of the forces acting on the drum as a one-degree-of-freedom lumped parameter model in Figure 6, where: Fs is the force transmitted to the soil, zd is the drum displacement, żd is the drum acceleration, md is the static mass of the drum, mf is the mass of the

7
drum frame, is the excitation frequency, moeo is the eccentric mass moment, and g is the acceleration due to gravity.
Fs
md g
moeo2 cos(t)
md zd
mf g
zd
Figure 6. One-degree-of-freedom lumped parameter model representation of vibratory compactor (reproduced from Kröber et al. 2001)
Fs is determined by summing the static force (roller mass), drum inertia and the eccentric force ignoring the frame inertia. Accelerometer mounted on the drum provides the drum acceleration time history. The Omega value is then determined by integrating the transmitted force Fs and drum displacement zd time history over two consecutive cycles of vibration using Eq. 5 (Kröber 1988).
Omega = T2
(– (md)żd + (md + mf)g + mo eo2) żd dt (5)
Vibratory Modulus (EVIB) Value
The vibratory modulus (EVIB) value is calculated using the one-degree-of-freedom
lumped parameter model (Figure 6) and Lundeberg’s theoretical solution (Lundberg 1939) for a rigid cylinder on an elastic half-space. A detailed description of the EVIB measurement technology is provided by Kröber et al. (2001). Previous studies (Krober 1998 and Krober et al. 2001) reported that the EVIB value is related to the modulus determined from a static plate load test. The drum force (Fs) and displacement (zd) behaviour is related to EVIB (see Eq. 6) using Lundberg’s analytical solution. According to Hertz (1895), the contact width of a cylindrical drum (B) can be calculated using the geometry of the drum, applied force, and the material properties (see Eq. 6). The two equations (Eqs. 6 and 7) are numerically solved to determine the EVIB value.
B
Lln8864.1
2
L
F
E
-1 z s
VIB
2
d (6)
where L
F
E
)1('R16B s
VIB
2
(7)
Where, η = Poisson’s ratio of the material, L = length of the drum, B = contact width of the drum, and R’ = radius of the drum.

8
The automatic feedback control (AFC) system developed by BOMAG uses a concept of counter-rotating eccentric mass assembly that is directionally vectored to vary the vertical excitation force on the soil (see Figure 7). If the counter-rotating masses are opposite each other in their rotation cycles, the eccentric force is zero. On the other hand, when the counter-rotating masses pass each other, the eccentric force is at maximum. The AFC system automatically adjusts the amplitude (by adjusting the vectors) depending on the pre-selected settings or the drum behavior (see Figure 7). Two different AFC settings are available as described below.
(1) Pre-selected target EVIB and a maximum amplitude amax value: In this setting, the vibration amplitude is reduced below the amax value when EVIB ≥ target EVIB, and the amplitude is at the amax value when EVIB < target EVIB.
(2) Pre-selected amax value: In this setting, the vibration amplitude is controlled based on the drum double jump behavior (described more in detail below) as measured by the jump value. When the jump value increases above 0, the amplitude is lowered to 0.6 mm.
Figure 7. BOMAG roller eccentric mass assembly and vectoring to vary the vertical excitation force (left) and principle of BOMAG’s automatic feedback control (AFC) system
(right) (courtesy of BOMAG)
Machine Drive Power (MDP)
Machine drive power (MDP) technology relates mechanical performance of the roller
during compaction to the properties of the compacted soil. Detailed background information on the MDP system is provided by White et al. (2005). MDP is calculated using Eq. 8.
bmvg
'ASinWvPMDP g
(8)
where MDP = machine drive power (kJ/s), Pg = gross power needed to move the machine (kJ/s), W = roller weight (kN), A’ = machine acceleration (m/s2), g = acceleration of gravity (m/s2), α =

9
slope angle (roller pitch from a sensor), v = roller velocity (m/s), and m (kJ/m) and b (kJ/s) = machine internal loss coefficients specific to a particular machine (White et al. 2005). MDP is a relative value referencing the material properties of the calibration surface, which is generally a hard compacted surface (MDP = 0 kJ/s). Positive MDP values therefore indicate material that is less compact than the calibration surface, while negative MDP values indicate material that is more compacted than the calibration surface (i.e. less roller drum sinkage). In a recent field study documented by White et al. (2009b) and field studies conducted as part of this pooled fund research project (Kansas and Mississippi field project from this research study), the MDP values are referred to as MDP80 or MDP40 depending on the modified settings. These modified values were recalculated to range between 1 and 150 using Eqs. 9 and 10.
)MDP(37.1150MDP80 (9)
)MDP(75.2150MDP40 (10)
For MDP80 calculation, the calibration surface with MDP = 0 kJ/s was scaled to MDP80 = 150, and a soft surface with MDP = 108.47 kJ/s (80000 lb-ft/s) was scaled to MDP80 = 1. For MDP40
calculation, the calibration surface with MDP = 0 kJ/s was scaled to MDP40 = 150 and a soft surface with MDP = 54.23 kJ/s (40000 lb-ft/s) was scaled to MDP40 = 1.
Influence of Drum Behavior on CCC/IC Values
Previous experimental and numerical investigations (e.g., Adam and Kopf 2004) on roller drum-soil interaction identified five different drum behavior modes which are dependent on the soil stiffness and roller operational settings (i.e., amplitude, frequency, and speed). These five modes include: continuous contact, partial uplift, double jump, rocking motion, and chaotic motion (see Figure 8). The accelerometer based CCC/IC values (i.e., CMV, RMV, Omega, EVIB, and ks) are influenced by these different drum modes (see Figure 9). For CMV measurement technology the drum jump behavior is assessed using the RMV or BV measurements. According to Adam and Kopf (2004), RMV or BV = 0 indicates that the drum is in a continuous contact or partial uplift mode. For RMV or BV > 0, the drum enters double jump mode and transitions into rocking and chaotic modes with increasing soil stiffness. Based on numerical studies, Adam and Kopf (2004) demonstrated the change in CMV relative to soil stiffness and drum behavior as shown in Figure 9. For EVIB measurement technology, the drum behavior is assessed using Jump value. Jump = 0 indicates the drum is in continuous contact or partial uplift mode and Jump > 0 (1 or 2) indicates the drum is in either in double jump, rocking, or chaotic mode. AFC systems should help control the drum behavior to prevent the drum jumping by automatically adjusting the vibration amplitude and/or frequency.

10
Figure 8. Influence of soil modulus and drum behavior on IC-MVs (from Adam and Kopf 2004)
Figure 9. Influence of drum behavior on IC-MVs relative to soil modulus (based on numerical simulations from Adam and Kopf 2004) (Note kB = ks)
Manufacturers, Roller Types, and Documentation Systems
Currently, at least six manufacturers (Ammann, BOMAG, Case/Ammann, Caterpillar, Dynapac, and Sakai) offer CCC/IC on their machines (note that Case uses Ammann CCC/IC technology on their rollers). All the manufacturers employ proprietary data filtering, recording, and display methods using proprietary software’s. A summary of key features from each manufacturer is presented in Table 1. Figure 10 to Figure 15 show different roller configurations and display software’s by different manufacturers.

11
Table 1. Key features of different CCC/IC systems (as of 2009)
Feature Ammann/Case BOMAG Caterpillar Dynapac Sakai Trimble
CCC/IC Value ks (MN/m) EVIB (MPa)
MDP40 (shown as CCV in the output) and CMV
CMV CCV CMV
Drum Configuration
Padfoot, Smooth Drum
Smooth Drum
Padfoot and Smooth Drum
Padfoot and Smooth Drum
Smooth Drum (Retrofit) Smooth Drum
Display Software
ACE-Plus ® BCM05® AccuGrade® DCA® Aithon MT® AccuGrade®
Output Documentation
Date/Time, Location (Latitude/ Longitude/ Elevation), Machine length/width, Direction (forward/ backward), Vibration (On/Off), Stiffness (ks), Amplitude (actual), Speed, Frequency
Date/Time, Location (Northing/ Easting/ Elevation at center of the roller drum), EVIB, Frequency, Amplitude (actual), Speed, Jump
Date/Time, Location (Northing/Easting/ Elevation of left and right ends of the roller drum), Speed, CCV, CMV, RMV, Frequency, Amplitude, Direction (forward/ backward), Vibration (On/Off)
Location (Latitude/ Longitude/ Elevation), Direction (forward/ backward), CMV, Bouncing, Frequency, Speed, Amplitude
Date/Time, Location (Northing/ Easting/ Elevation), CCV, Temperature, Frequency, Direction (forward/ backward), Vibration (On/Off), GPS Quality
Date/Time, Location (Northing/Easting/ Elevation of left and right ends of the roller drum), Speed, CCV, CMV, RMV, Frequency, Amplitude, Direction (forward/ backward), Vibration (On/Off)
Output Export File
*.txt *.csv *.csv *.txt *.csv *.csv
Automatic Feedback Control (AFC)
Yes Yes No Yes No No

12
Figure 10. Ammann and Case rollers (padfoot and smooth rum) equipped with roller-integrated ks measurement system on-board display units with ACE-Plus® software
Figure 11. BOMAG rollers (padfoot and smooth rum) equipped with roller-integrated EVIB measurement system on-board display units with BCM-05® software
13
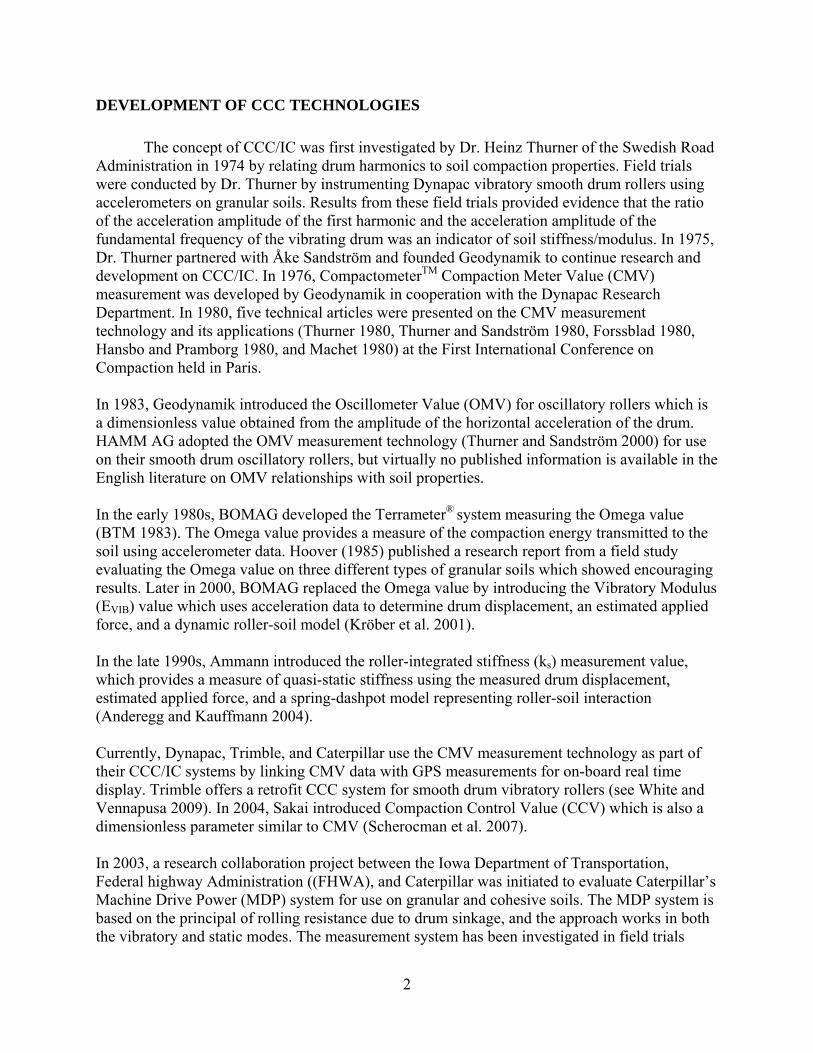
Figure 12. Caterpillar rollers (padfoot and smooth rum) equipped with roller-integrated MDP and CMV measurement systems on-board display unit with AcuGrade® software
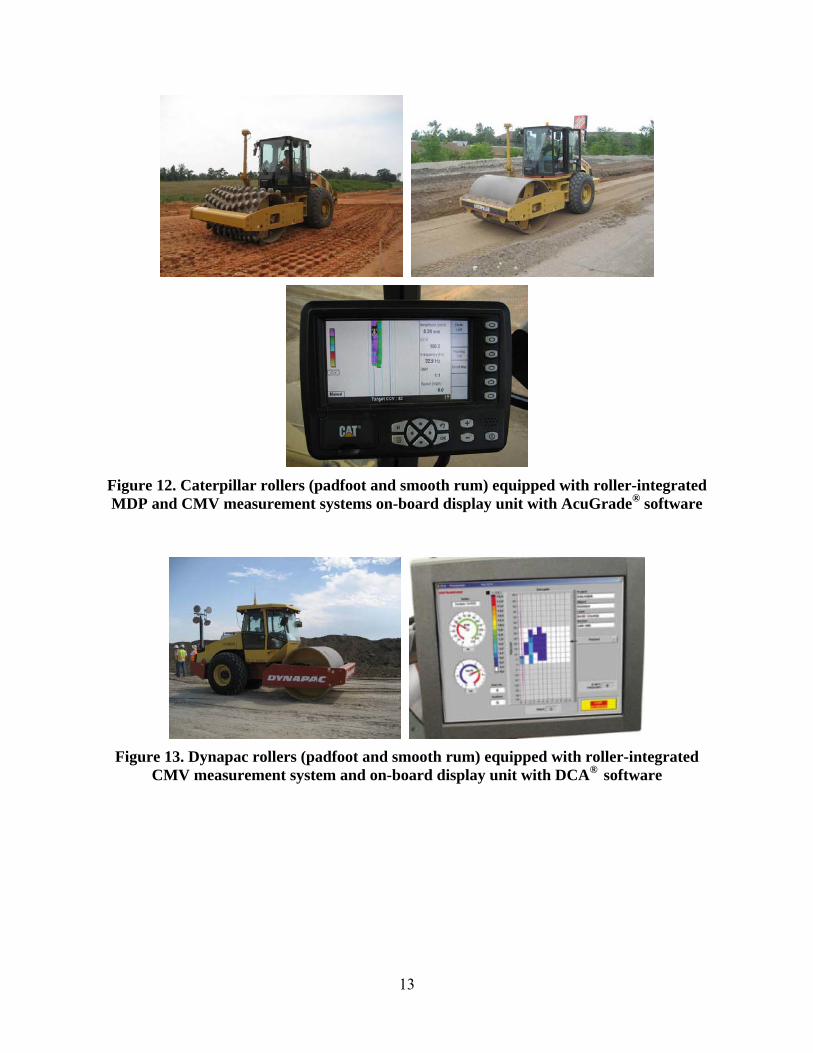
Figure 13. Dynapac rollers (padfoot and smooth rum) equipped with roller-integrated CMV measurement system and on-board display unit with DCA® software

14
Figure 14. Sakai rollers (padfoot and smooth rum) equipped with roller-integrated CCV measurement system and on-board display unit with Aithon-MT® software
Figure 15. Trimble CB430 on-board display unit with roller-integrated CMV measurement system

15
FIELD CORRELATION STUDIES
Correlation studies relating different CCC/IC measurements to soil dry unit weight, strength, and stiffness/modulus properties in-situ are documented in the technical literature. A variety of in-situ test QC/QA devices have been used in the documented correlation studies (Figure 16):
Density and moisture content — nuclear gauge (Figure 16a), electrical density gauge (Figure 16b), water balloon method, sand cone replacement method, radio isotope method, and drive core method.
Stiffness or Modulus — light weight deflectometer (LWD) (Figure 16c), soil stiffness gauge (SSG) (Figure 16d), static plate load test (PLT) (Figure 16e), falling weight deflectometer (FWD) (Figure 16f), Briaud compaction device (Figure 16g), dynamic seismic pavement analyzer (D-SPA) (Figure 16h), Clegg hammer (Figure 16i), pressure meter, and screw plate.
Strength or California bearing ratio — shelby tube sampling and laboratory testing (Figure 16j); dynamic cone penetrometer (DCP) (Figure 16k), cone penetration testing (CPT) (Figure 16l), rut depth measurements under heavy test rolling (Figure 16m)
Other — surface settlement monitoring under compaction passes using GPS or total station surveying, etc.
A summary of field correlation studies documented in the literature is provided in Table 2. A comprehensive correlation study involving field evaluation of five different CCC/IC technologies on 17 different soil types from multiple project sites is documented in NCHRP 21-09 (2010). A list of factors that commonly affected the correlations between CCC/IC and in-situ test measurements are identified from that study are as follows:
1. Heterogeneity in underlying layer support conditions 2. High moisture content variation 3. Narrow range of measurements 4. Machine operation setting variation (e.g., amplitude, frequency, speed) and roller
“jumping”) 5. Non-uniform drum/soil contact conditions 6. Uncertainty in spatial pairing of point measurements and roller MVs 7. Limited number of measurements 8. Not enough information to interpret the results 9. Intrinsic measurement errors associated with the roller MVs and in-situ point
measurements Of all the factors above, heterogeneity in support conditions of layers underlying the compaction layer is identified as the major factor that affects the correlations (NCHRP 21-09 2010). This is largely due to differences in measurement influence depths between the roller and the in-situ point-MVs (see Figure 17). An approach of using the underlying layer CCC/IC measurements and in-situ point-MV information, and incorporating those into multiple regression analysis is described in NCHRP 21-09 (2010).

16
(a) (b) (c) (d)
(e) (f) (g)
(h) (i) (j)
(k) (m)(l)
Figure 16. Various in-situ QC/QA test measurements: (a) nuclear moisture-density gauge; (b) electrical density gauge; (c) light weight deflectometers; (d) soil stiffness gauge; (e)
static plate load test; (f) falling weight deflectometer; (g) Briaud compaction device; (h) seismic pavement analyzer; (i) Clegg hammer; (j) shelby tube sampling; (k) dynamic cone
penetrometer; (l) static cone penetrometer; and (m) heavy test rolling

17
Table 2. Summary of field correlation studies
Reference Project location
Roller Type;
CCC/IC Soil type(s) QC/QA
Point-MVs Key findings/
Comments
Forssblad (1980)
Sweden Dynapac SD; CMV
Morainic soil, fine rock fill, and coarse rock fill
Water balloon volumeter (for density), PLT, FWD, and surface settlement
Linear correlations have been observed between CMV and Point-MVs. Moisture content should be considered in correlations for fine grained soils. Roller results in a composite value in layered soil condition. CMV measurements are affected by roller speed (higher speeds result in lower CMV).
Hansbo and Pramborg (1980)
Stockholm, Sweden
Dynapac SD; CMV
Gravelly sand, silty sand, and fine sand
Sand cone (for moisture and density), pressuremeter, PLT, screw-plate, CPT, and DCP
Compaction growth curves showed improvement in CMV and other mechanical properties (i.e., modulus and cone resistance) with increasing pass. Relative compaction measurement was not sensitive to changes in compaction.
Floss et al. (1983)
Munich II airport, Munich, Germany
Dynapac Dual SD; CMV
Sandy to silty gravel fill
Bentonite displacement, water balloon method, and sand cone (for moisture and density), PLT, and DCP
Correlations generally showed increasing CMV with increasing density, modulus, and DCP penetration blows (per 0.6 m penetration). Correlations with modulus and penetration blows were generally better than density. CMV measurements are dependent on speed, vibration frequency and amplitude, type of soil, grain composition, water content, and strength of subsoil.
Brandl and Adam (1997)
— BOMAG SD; CMV
— PLT
Correlation between CMV and PLT modulus (initial) showed different regression trends for partial uplift and double jump operating conditions. Regressions in partial uplift and double jump conditions yielded R2 = 0.9 and 0.6, respectively.
Nohse et al. (1999)
2nd Tomei Exp. way, Japan
Sakai SD; CMV
Clayey gravel Radio-isotope (for density)
On calibration test strips, average dry density and CMV increased with increasing roller passes. Linear regression relationships with R2 > 0.9 were observed for correlations between dry density and CMV.
Kröber et al. (2001)
— BOMAG SD; EVIB
Silty gravel PLT
Correlations from calibration test strips between EVIB and PLT initial and reload modulus (EV1 and EV2) showed strong correlation with R2 > 0.9.
Gorman and Mooney (2003); Mooney et al. (2003)
Oklahoma
Ingersoll Rand SD; Total harmonic distortion (THD)
Well-graded sand
DCP
Trends in relationship between THD and DPI generally showed decreasing penetration resistance with increasing THD. Strength of the correlations improve significantly if the sub-lift material was stiffer.

18
Reference Project location
Roller Type;
CCC/IC Soil type(s) QC/QA
Point-MVs Key findings/
Comments
Preisig et al. (2003); Anderegg and Kaufmann (2004)
Bern, Switzerland
Ammann dual SD; ks
Eight project sites with sandy gravel materials
PLT
Correlations between ks and PLT initial and reload (EV1 and EV2) modulus showed R2 = 0.68 and 0.56, respectively. If only data points with EV2/EV1 ratio < 3.5 (i.e., areas with less plastic deformation during reloading) are considered, the R2 values improve to about 0.80.
White et al. (2004, 2005)
Edwards, Illinois
Caterpillar PD; MDP
Lean clay NG, Drive core, DCP, and Clegg hammer
Correlations between MDP and in-situ test measurements using simple and multiple regression analyses are presented. MDP correlated relatively better with dry unit weight (R2 = 0.86) than with DCP (R2 = 0.38) or CIV (R2 = 0.46). Including moisture content via multiple regression analysis greatly improves the R2 values for DCP and CIV (R2 > 0.9). These results were developed by averaging data over 20m long strip per pass.
Camargo et al. (2006)
Atwater test site, Minnesota
BOMAG SD; EVIB
Select granular subbase
LWD, DCP, and SSG
No statistically significant correlation between Point-MVs and EVIB values, however, the COV observed in LWD and SSG measurements were similar to COV in EVIB measurements. Narrow range of measurements contributed to weak correlations.
Hossain et al. (2006)
US65 and I-70, Kansas
BOMAG SD; EVIB
Well-graded silty sand
NG and DCP
EVIB measurements are sensitive to soil moisture content. Weak correlation was observed between EVIB and CBR determined from DCP, and NG. (EVIB
measurements obtained in AFC mode which are influenced by changing amplitude).
Peterson et al. (2006)
MnRoad, Albertville, Minnesota
BOMAG SD; EVIB
Silty sand, railroad ballast, and well-graded granite
DCP, SSG, LWD, PLT, FWD, NG, and sand cone (for moisture and density)
Influence of applied stress on soil modulus determined by different test methods, and influence of measurement influence depth and differences between different test methods are discussed in this paper.
Petersen and Peterson (2006)
TH53, Duluth, Minnesota
Caterpillar SD; CMV and MDP
LWD, DCP and SSG
Weak correlations were obtained on a point-by-point basis comparison between in-situ test measurements and roller measurements, likely due to the depth and stress dependency of soil modulus, and the heterogeneity of the soils. Good correlations were obtained between CMV values and DCP measurements for depths between 200 and 40 mm depth.

19
Reference Project location
Roller Type;
CCC/IC Soil type(s) QC/QA
Point-MVs Key findings/
Comments
White et al. (2006a, b)
Edwards, Illinois
Caterpillar PD; MDP
Well-graded silty sand
NG and DCP
Average machine power values showed a decreasing (logarithmic) trend, dry unit weight values showed an asymptotic increase, and DCP index showed an asymptotic decrease with increasing roller pass. Correlations between MDP and Point-MVs showed good correlations (R2 = 0.5 to 0.9). Incorporating moisture content into analysis is critical to improve correlations for dry unit weight.
White et al. (2006b); Thompson and White (2008)
Edwards, Illinois
Caterpillar PD; MDP
Silt and lean clay
NG, DCP, Clegg Hammer, and LWD
Correlations between MDP and Poin-MVs are presented using simple and multiple regression analysis. Averaging the data along the full length of the test strip (per pass) improved the regressions. Multiple regression analysis by incorporating moisture content as a regression parameter further improved the correlations.
Thompson et al. (2008) and White et al. (2007a)
US14, Janesville, Minnesota
Ammann SD; ks
Sandy lean clay subgrade, and poorly graded sand base layer
LWD, PLT, DCP, Clegg Hammer, and NG
ks correlated well with PLT with R2 = 0.80 and the R2 values with other measurements ranged from 0.30 to 0.61 on subgrade. Poor R2 values were observed on the e base layer due to narrow range of measurements.
White et al. (2007a); White et al. (2008b)
TH64, Ackley, MN
Caterpillar SD, CMV
Poorly graded sand and well-graded sand with silt
LWD, DCP, and NG
Project scale correlations by averaging data from different areas on the project are presented, which showed R2 values ranging from 0.52 for density and 0.79 for DPI. Correlations with LWD showed poor correlations due to the effect of loose surficial material. The COV observed in the CMV data was similar to DCP and LWD measurements but not to density measurements.
White et al. (2007b); White and Thompson (2008)
Edwards, Illinois
Caterpillar SD; MDP and CMV
Reclaimed asphalt, clayey gravel, silty gravel, poorly graded gravel, and silt
NG, DCP, Clegg hammer, and LWD
Averaging the data along the full length of the test strip (per pass) improved the correlations between MDP, CMV, and Point-MVs. The relationships were independent of soil type. Compaction curves of MDP, CMV, and Point-MVs showed improvement in soil compaction with increasing roller pass. CMV measurements reflected the properties of the underlying subgrade layer.
White et al. (2007b)
Edwards, Illinois
Caterpillar PD; MDP
Sandy lean clay
NG and DCP
Based on average measurements over the length of the test strip (~20 m); correlations between MDP and Point-MVs (R2 = 0.87 for density and 0.96 for DCP)

20
Reference Project location
Roller Type;
CCC/IC Soil type(s) QC/QA
Point-MVs Key findings/
Comments
White et al. (2008c); Vennapusa et al. (2009)
Edwards, Illinois
Caterpillar PD; MDP
Crushed gravel base
DCP and LWD
Correlations were obtained on a test bed with multiple lifts placed on a concrete base and a soft subgrade base. Correlations between MDP and Point-MVs yielded R2 = 0.66 to 0.85 for spatially nearest point data, and R2 = 0.74 to 0.92 for averaged data (over the length of concrete or soft subgrade).
White et al. (2009a, b)
TH60, Bigelow, Minnesota
Caterpillar PD; MDP80 and Caterpillar SD; CMV
Sandy lean clay to lean clay with sand
Heavy test roller, DCP, LWD, and PLT
Correlations were obtained on multiple calibration test strips and production areas from the project. MDP80 and LWD modulus correlation showed two different trends (R2 = 0.35 and 0.65) over the range of measurements as the MDP80 reached an asymptotic value of about 150 which is the maximum value on the calibration hard surface. CMV correlation with LWD modulus produced R2 = 0.70, and with rut depth produced R2 = 0.64.
White et al. (2009b)
TH36, North St. Paul, Minnesota
Caterpillar SD; CMV
Granular subbase and select granular base
DCP, SSG, Clegg Hammer, LWD, PLT, FWD, and CPT
Correlations between CMV and Point-MVs from calibration and production test areas based on spatially nearest point data are presented. Positive trends are generally observed with R2 > 0.5 (for LWD, FWD, PLT, SSG, and Clegg) with exception of one test bed (FWD, LWD, and CPT) with limited/narrow range of measurements.
White et al. (2009b)
US10, Staples, Minnesota
Caterpillar SD; CMV
Poorly graded sand with silt to silty sand
LWD, PLT, and DCP
Correlations between CMV and Point-MVs from calibration and production test areas based on spatially nearest point data are presented. Correlations between CMV and Point-MVs showed R2 value ranging from 0.2 to 0.9. The primary factors contributing to scatter are attributed to differences in measurement influence depths, applied stresses, and the loose surface of the sandy soils on the project. Correlations between CMV and LWD or DCP measurements improved using measurements at about 150-mm below the compaction surface.

21
Reference Project location
Roller Type;
CCC/IC Soil type(s) QC/QA
Point-MVs Key findings/
Comments
White et al. (2009b)
CSAH 2, Olmsted County, Minnesota
Caterpillar PD; MDP80
Sandy lean clay
LWD
MDP80 values were influenced by the travel direction of the roller due to localized slope changes and roller speed. Correlations between MDP80 and LWD generally showed R2 > 0.6 (with exception of one case) when regressions were performed by separating data sets with different travel directions and speed. Data was combined by performing multiple regression analysis incorporating travel speed and direction which showed correlations with R2 = 0.93.
NCHRP 21-09 (2010)
Minnesota, Colorado, North Carolina, Florida, and Maryland
Caterpillar (PD and SD; MDP and CMV), Dynapac (PD and SD; CMV), Sakai (SD, CCV), BOMAG (PD, SD, EVIB), Case/ Ammann (SD, ks)
Two types of cohesive subgrade materials, five types of granular subgrades, and six types of granular base materiasl
NG, DCP, LWD, FWD, PLT, Clegg hammer, SSG
Simple linear correlations between CCC/IC and compaction layer point-MVs are possible for a compaction layer underlain by relatively homogenous and stiff/stable supporting layer. Heteroge-neous conditions in the underlying layers, however, can adversely affect the relationships. A multiple regression analysis approach is described that includes parameter values to represent underlying layer conditions to improve correlations. Modulus measurements generally capture the variation in CCC/IC values better than traditional dry unit weight measurements. DCP tests are effective in detecting deeper “weak” areas (at depths > 300 mm) that are commonly identified by CCC/IC values and not by compaction layer point-MVs. High variability in soil properties across the drum width and soil moisture content contribute to scatter in relationships. Averaging measurements across the drum width, and incorporating moisture content into multiple regression analysis, when statistically significant, can help mitigate the scatter to some extent. Relatively constant machine operation settings are critical for calibration strips (i.e., constant amplitude, frequency, and speed) and correlations are generally better for low amplitude settings (e.g., 0.7 to 1.1 mm).

22
Width (m)0 1 2 3 4 5 6 7
Dep
th (
m)
0.0
0.3
0.6
0.9
1.2
1.5
1.8
2.1
2.4
2.7
3.0
300 mm LWD/FWDa
Nuclear Density Gaugec
DynamicCone Penetrometer(DCP)
Notes:a Influence depths for LWD/FWD are assumed ~ 1 x B (width)b Influence depth of soil stiffness gauge ~ 230 mm (Florida DOT , 2003)cMaximum penetration depth for Nuclear density gauge = 0.3 mdAccording to Method of Equivalent Thickness by Odemark (1949)
Soil StiffnessGaugeb
Typical penetration depth ~ 1m
Extensionup to ~ 3m
B = 2.1 m
B = 0.3 mCompaction layer
Influence depth = 1.0 to 1.2m
Impact ForceFrom Rollers
X X X X X X X2.1 m
In‐situ point test measurementsArea over which the roller MV’s are averaged
Distance = Roller travel in approx. 0.1 to 0.5 sec.
1.5 m (ISSMGE 2005)
X
0.3 m spacingGeophones
Deflection Basind
Figure 17. Illustration of differences in measurement influence depths for different measurements (modified from White 2008)
SPECIFICATIONS
Overview of Current Specifications
Some agencies (Swedish Road Administration, Federal Ministry of Transport of the Federal Republic of Germany, The Austrian Federal Road Administration, International Society for Soil Mechanics and Geotechnical Engineering, and Mn/DOT) have developed specifications to facilitate implementation of CCC/IC into earthwork construction practices. Table 3 provides a summary of key elements of the current CCC/IC specifications. A brief review of these specifications is presented by White et al. (2008b). The specifications typically require performing either PLT or LWD on calibration strips to determine average target values (typically based on 3 to 5 measurements) and use the same for quality assurance later in production areas. The German specification suggests performing at least three PLTs in locations of low, medium, and high degree of compaction during calibration process. Further, it is specified that linear regression relationships between roller measurement values and plate load test results should achieve a regression coefficient, R ≥ 0.7.

23
White and Vennapusa (2009) documented the following as the key attributes required in CCC/IC specifications and noted that the largest dissimilarities exist in the current specifications with the attribute item number 10.
1. Descriptions of the rollers and configurations, 2. Guidelines for roller operations (speed, vibration frequency, vibration amplitude, and
track overlap), 3. Records to be reported (time of measurement, roller operations/mode, soil type, moisture
content, layer thickness, etc.), 4. Repeatability and reproducibility measurements for IC measurement values (IC-MVs), 5. Ground conditions (smoothness, levelness, isolated soft/wet spots) 6. Calibration procedures for rollers and selection of calibration areas, 7. Regression analysis between IC-MVs and point measurements, 8. Number and location of quality control (QC) and quality assurance (QA) tests, 9. Operator training, and 10. Acceptance procedures/corrective actions based on achievement of minimum MV-TVs
(MV target values) and associated variability.

24
Table 3. Summary of current CCC/IC specifications (modified from White et al. 2008a)
Reference Equipment Field Size Location Specs Documentation Compaction Specs Speed Freq. Mn/DOT (2007a, b)
Smooth drum or padfoot vibratory roller (25,000 lbs.)
300 ft x 32 ft (mini-mum at base). Max 4 ft. thick.
One calibration/ control strip per type or source of grading material
Compaction, stiffness, moisture, QC activities, and corrective actions (weekly report)
90% of the stiffness measurements must be at 90% of the compaction target value.
Same during calibration and production compaction
ISSMGE (2005)
Roller chosen by experience
100 m by the width of the site
Homogenous, even surface. Track overlap ≤ 10% drum width.
Rolling pattern, sequence of compaction and measuring passes; amplitude, speed, dynamic measuring values, frequency, jump operation, and corresponding locations
Correlation coefficient ≥ 0.7. Minimum value ≥ 95% of Ev1, and mean should be ≥ 105% (or ≥ 100% during jump mode). Dynamic measuring values should be lower than the specified minimum for ≤ 10% of the track. Measured minimum should be ≥ 80% of the specified minimum. Standard deviation (of the mean) must be ≤ 20% in one pass.
Constant 2–6 km/h (± 0.2 km/h)
Constant (± 2 Hz)
Austria — RVS 8S.02.6. (1999)
Vibrating roller compactors with rubber wheels and smooth drums suggested
100 m long by the width of the site
No inhomogeneities close to surface (materials or water content). Track overlap ≤ 10% drum width.
Compaction run plan, sequence of compaction and measurement runs, velocity, amplitude, frequency, speed, dynamic measuring values, jump operation, and corresponding locations
Correlation coefficient ≥ 0.7. Minimum value ≥ 95% of Ev1, and median should be ≥ 105% (or ≥ 100% during jump mode). Dynamic measuring values should be lower than the specified minimum for ≤ 10% of the track. Measured minimum should be ≥ 80% of the set minimum. Measured maximum in a run cannot exceed the set maximum (150% of the determined minimum).Standard deviation (of the median) must be ≤ 20% in one pass.
Constant 2–6 km/h (± 0.2 km/h)
Constant (± 2 Hz)
Germany — ZTVE StB/TP BF-StB (1994)
Self-propelled rollers with rubber tire drive are preferred; towed vibratory rollers with towing vehicle are suitable.
Each calibration area must cover at least 3 partial fields ~20 m. long
Level and free of puddles. Similar soil type, water content, layer thickness, and bearing capacity of support layers. Track overlap ≤ 10% machine width.
Dynamic measuring value; frequency; speed; jump operation; amplitude; distance; time of measurement; roller type; soil type; water content; layer thickness; date, time, file name, or registration number; weather conditions; position of test tracks and rolling direction; absolute height or application position; local conditions and embankments in marginal areas; machine parameters; and perceived deviations
The correlation coefficient resulting from a regression analysis must be ≥ 0.7. Individual area units (the width of the roller drum) must have a dynamic measuring value within 10% of adjacent area to be suitable for calibration.
Constant
Sweden — ROAD 94 (1994)
Vibratory or oscillating single-drum roller. Min. linear load 15–30 kN. Roller-mounted compaction meter optional.
Thickness of largest layer 0.2–0.6 m.
Layer shall be homogenous and non-frozen. Protective layers < 0.5 m may be compacted with sub-base.
— Bearing capacity or degree of compaction requirements may be met. Mean of compaction values for two inspection points ≥ 89% for sub-base under roadbase and for protective layers over 0.5 m thick; mean should be ≥ 90% for roadbases. Required mean for two bearing capacity ratios varies depending on layer type.
Constant 2.5–4.0 km/h
—

25
New Developmental Specifications and Concepts
The following specification options and concepts (Options 1 to 5) were discussed at a national level workshop participated by representatives from many state and federal agencies, contractors, and manufacturers (see White and Vennapusa 2009). These specification options differ in the required level of upfront calibration work, data analysis, and the level of confidence in the quality of the completed work. Option 1: Roller based QC with pre-selected CCC/IC target values For this specification option, an appropriate MV-TV is pre-selected based on documented case histories/literature, a database of information from local projects, laboratory tests, calibration tests on test beds of known engineering properties, mechanical apparatus simulating a range of soil conditions, and/or numerical modeling. The contractor uses the preselected MV-TV primarily for QC. QA is evaluated using a combination of IC-MVs and in situ QA point measurements. This option will become more beneficial as experience and data become available through implementation of IC on earthwork projects. Option 2: CCC/IC maps to target locations for QA test measurements IC-MV geo-referenced maps are used in this specification option to identify “weak” areas to focus on QA point measurements. Proper QC measures (e.g., controlling moisture content, lift thickness, etc.) should be followed during compaction. The contractor should provide the IC-MV map to the field inspector for selection of QA test locations. Judgment is involved with selecting the number of tests and test locations. Acceptance is based on achievement of target QA point measurement values in roller identified “weak” areas. If in-situ test QA criteria are not met, additional compaction passes should be performed and/or QC operations should be adjusted (e.g. moisture, lift thickness, etc.) and retested for QA.
Option 3: CCC/IC target values from compaction curves to target locations for QA point measurements This specification option evaluates the change in IC-MVs with successive passes as an indicator of compaction quality. As the number of roller passes increases, the change in MV between passes normally decreases. A production area is monitored by evaluating the percent change in IC-MVs between successive passes. Once the percent change of ≤ 5% over 90% (these percentages can be adjusted based on judgment and field experience) of the production area between roller passes is achieved, the production area is considered fully compacted. This option is more effective for controlled field conditions with relatively uniform materials, moisture content, and lift thickness and serves as a QC process control for the roller operator. Judgment is involved with selecting the number of tests and test locations. Acceptance is similar to Option 1, in that QA testing is targeted in areas with relatively low IC-MVs.

26
Option 4: Calibration of CCC/IC measurements to QA point measurements This specification option requires calibration of IC-MVs to QA point measurements from a representative calibration test strip prior to performing production QA testing. The MV-TV is established from project QA criteria through regression analysis and applying prediction intervals. For modulus/strength measurements simple linear regression analysis is generally suitable, while for correlation to dry unit weight/relative compaction measurements, multiple regression analysis including moisture content as a variable may be needed. If underlying layer support conditions are heterogeneous, relationships are likely improved by performing multiple regression analysis with IC-MV or point measurement data from underlying layers. Acceptance of the production area is based on achievement of MV-TV at the selected prediction interval (80% is suggested) and achievement of target QA point measurement values in the areas with MVs < MV-TV.
Option 5: Performance based QA specification with incentive based payment One of the shortcomings of the existing CCC/IC specifications might be that the acceptance criteria (specifically the target limits) are dependent on specific IC technology. This specification option, although requires a more rigorous statistical analysis framework (see White et al. 2009b), could provide a consistent means for specifying acceptance criteria. The acceptance criteria for this option are: (a) the overall level of critical soil engineering properties over an area achieve the MV-TV, and (b) the variability of critical soil engineering properties over an area is no more than some specified maximal amount (e.g., COV%). These acceptance criteria are established based on regression analysis from calibration, applying prediction intervals, accounting for the repeatability and reproducibility errors associated with IC-MVs and point measurements, and a selected probability or risk level in acceptance decisions. This approach could provide a link to performance-based specifications and a quantitative mechanism to define incentive-based payment.

27
REFERENCES Adam, D., and Kopf, F. (2004). “Operational devices for compaction optimization and quality control (Continuous Compaction Control & Light Falling Weight Device).” Proc., of the Intl. Seminar on Geotechnics in Pavement and Railway Design and Construction, December, Athens, Greece (Invited paper), 97-106. Anderegg R., and Kaufmann, K. (2004). “Intelligent compaction with vibratory rollers - feedback control systems in automatic compaction and compaction control,” Transportation Research Record No. 1868, Journal of the Transportation Research Board, National Academy Press, 124-134. Anderegg, R., von Felten, D., and Kaufmann, K. (2006). “Compaction monitoring using intelligent soil compactors.” Proc., GeoCongress 2006: Geotechnical Engineering in the Information Technology Age, February, Atlanta, CD-ROM. Brandl, H., and Adam, D. (1997). “Sophisticated Continuous Compaction Control of Soils and Granular Materials” Proc., XIVth Intl. Conf. on Soil Mechanics & Foundation Engineering, Vol. 1, September, Hamburg, Germany. BTM (1983). BOMAG Terrameter – Product Bulletin, BOMAG-AMCA International, Postfach 180, West Germany. Camargo, F., Larsen, B., Chadbourn, B., Roberson, R., and Siekmeier, J. (2006). “Intelligent compaction: a Minnesota case history.” Proc., 54th Annual University of Minnesota Geotech.Conf., February, Minneapolis, CD-ROM. Floss, R., Gruber, N.,and Obermayer, J. (1983). “A dynamical test method for continuous compaction control.” Proc. 8th European Conf. on Soil Mechanics and Foundation Engineering, Rathmayer, H.G., and Saari, K.H.O., Eds., May, Helsinki, 25-30. Forssblad, L. (1980). “Compaction meter on vibrating rollers for improved compaction control”, Proc., Intl. Conf. on Compaction, Vol. II, 541-546, Paris. Gorman, P. and Mooney, M. (2003). "Monitoring roller vibration during compaction of crushed rock," Proc., 20th Intl. Symp. on Automation and Robotics in Construction, Eindhoven, Netherlands, Ger Maas & Frans van Gassel, Eds., 415-419. Hansbo, S., and Pramborg, B. (1980). “Compaction control.” Proc., Intl. Conf. on Compaction, Vol. II, 559-564, Paris. Hertz, H. (1895). Über die Berührung fester elasticscher Körper, Gesammelte Werke, Bd. 1. Leipzig.
28
Hossain, M., Mulandi, J., Keach, L., Hunt, M., and Romanoschi, S. (2006). “Intelligent compaction control.” Proc., 2006 Airfield and Highway Pavement Specialty Conf., ASCE, May, Atlanta, Ga. Hoover, J.M. (1985). In-situ stability of smooth-drum vibratory compacted soils with BOMAG Terrameter, Engineering Research Instititute, ERI Project No. 1722, Iowa State University, Ames, Iowa, March. ISSMGE. (2005). Roller-Integrated continuous compaction control (CCC): Technical Contractual Provisions, Recommendations, TC3: Geotechnics for Pavements in Transportation Infrastructure. International Society for Soil Mechanics and Geotechnical Engineering. Kauffman, K., Anderegg, R. (2008). “3D-Construction Applications III GPS-based Compaction Technology”, 1st Intl. Conf. on Machine Control & Guidance 2008, ETH Zurich, Switzerland. Kröber, W. (1988). “Untersuchung der dynamischen Vorgänge bei der Vibrationsverdichtung von Böden,” Ph.D. Dissertation, Schriftenreihe, Heft 11, Lehrstuhl und Prüfamt für Grundbau, Bodenmechanik und Felsmechanik der Technischen Universität München (in German). Kröber, W., Floss, E., Wallrath, W. (2001). “Dynamic soil stiffness as quality criterion for soil compaction,” Geotechnics for Roads, Rail Tracks and Earth Structures, A.A.Balkema Publishers, Lisse /Abingdon/ Exton (Pa) /Tokyo, 189-199. Lundberg, G. (1939). Elastische Berührung zweier Halbräume, Forschung, auf dem Gebiete des Ingenieurwesens, Band 10, Göteborg, 201–211. Machet, J.M. (1980). “Compactor-mounted control devices”, Proc., Intl. Conf.on Compaction, Vol. II, 577-581, Paris. Mn/DOT. (2007a). Excavation and embankment – (QC/QA) IC quality compaction (2105) pilot specification for granular treatment S.P.0301-47. Minnesota Department of Transportation, St. Paul, Mn. Mn/DOT. (2007b). Excavation and embankment – (QC/QA) IC quality compaction (2105) pilot specification for non-granular soils S.P.6211-81. Minnesota Department of Transportation, St. Paul, Mn. Mooney, M.A., Gorman, P.B., Tawfik, E.F., Gonzalez, J.N. and Akanda, A.S. (2003). Exploring Vibration-Based Intelligent Soil Compaction, Oklahoma Department of Transportation Report, Item 2146. NCHRP 21-09. (2010). Intelligent soil compaction systems – NCHRP 21-09, National Cooperative Highway Research Program, Transportation Research Board, Washington, D.C. (in print).

29
Newman, K., and White, D. (2008). “Rapid assessment of cement/fiber stabilized soil using roller-integrated compaction monitoring.” Transportation Research Record, 2059, 95-102. Nohse, Y., Uchiyama, K., Kanamori, Y., Kase, J., Kawai, Y., Masumura, K., and Tateyama, K. (1999). “An attempt applying a new control system for the vibratory compaction using GPS and CMV in the embankment construction (Part 1).” Proc. of the 13th Intl. Conf. of the ISTVS: Okinowa, Japan, 295-300. Petersen, L., and Peterson, R. (2006). Intelligent Compaction and In-Situ Testing at Mn/DOT TH53, Final Report MN/RC-2006-13, May, Minnesota Department of Transportation, St. Paul, Mn. Petersen, D., Siekmeier, J., Nelson, C., Peterson, R. (2006). “Intelligent soil compaction – technology, results and a roadmap toward widespread use.” Transportation Research Record No. 1975, Journal of the Trasnsportation Research Board, National Academy Press, 81-88. Preisig, M., Caprez, M., and Amann, P. (2003). “Validation of continuous compaction control (CCC) methods.” Workshop on Soil Compaction, September, Hamburg. ROAD 94 (1994). General technical construction specification for roads – Unbound Pavement Layers, Road and Traffic Division, Sweden. RVS 8S.02.6. (1999). “Continuous compactor integrated compaction – Proof (proof of compaction),” Technical Contract Stipulations RVS 8S.02.6 – Earthworks, Federal Ministry for Economic Affairs, Vienna. Sandström, Å. (1994). Numerical simulation of a vibratory roller on cohesionless soil, Internal Report, Geodynamik, Stockholm, Sweden. Sandström A.J., and Pettersson, C.B. (2004). "Intelligent systems for QA/QC in soil compaction", Proc., 83rd Annual Transportation Research Board Meeting, January 11-14. Washington, D.C. Scherocman, J., Rakowski, S., and Uchiyama, K. (2007). “Intelligent compaction, does it exist?” 2007 Canadian Technical Asphalt Association (CTAA) Conference, Victoria, BC, July. Tehrani, F.S. and Meehan, C.J. (2009). “Continuous compaction control: Preliminary data from a Delaware case Study.” Eighth Intl. Conf. on the Bearing Capacity of Roads, Railways, and Airfields (BCR2A’09), June 29 – July 2, Champaign, Illinois. Thompson, M., and White, D. (2008). “Estimating compaction of cohesive soils from machine drive power.” J.of Geotech. and Geoenviron. Engrg, ASCE, 134(12), 1771-1777. Thompson, M., White, D., Gieselman, H., and Siekmeier, J. (2008). “Variable feedback control intelligent compaction to evaluate subgrade and granular pavement layers – Field study at

30
Minnesota US 14.” Proc., 87th Annual Transportation Research Board Meeting, Washington, D.C. Thurner, H. (1980). “The compactometer principle: Contribution to the discussion in Session IV.” Proc., Intl. Conf. on Compaction, Vol. II, Paris. Thurner, H. (1993). “ Continuous compaction control - specifications and experience.” Proc., XII IRF World Congress, 951-956, Madrid. Thurner, H. and Sandström, Å. (1980). “A new device for instant compaction control.” Proc., Intl. Conf. on Compaction, Vol. II, 611-614, Paris. Thurner, H., Sandström, Å. (2000). “Continuous Compaction Control, CCC.” Workshop on Compaction of Soils and Granular Materials, Modeling of Compacted Materials, Compaction Management and Continuous Control, International Society of Soil Mechanics and Geotechnical Engineering (European Technical Committee), 237-246, Paris. Vennapusa, P., White, D.J., Gieselman, H. (2009). “Influence of support conditions on roller-integrated machine drive power measurements for granular base.” Intl. Foundation Congress and Equipment Expo (IFCEE) 2009, 15-19 March, Orlando, Florida. Vennapusa, P., White, D.J., Morris, M. (2010). “Geostatistical analysis for spatially referenced roller-integrated compaction measurements, J. of Geotech. and Geoenv. Engrg., ASCE, (in print). White, D.J., (2008). Report of the Workshop on Intelligent Compaction for Soils and HMA, ER08-01, April 2-4, 2008, Des Moines, Iowa, Iowa State University, Ames, Iowa. White, D.J, and Thompson, M. (2008). “Relationships between in-situ and roller-integrated compaction measurements for granular soils.” J.of Geotech. and Geoenviron. Engrg, ASCE, 134(12), 1763-1770. White, D.J., Vennapusa, P. (2009). Report of the Workshop on Intelligent Technologies for Earthworks, EERC Publication ER09-02, Earthworks Engineering Research Center, Iowa State University, Ames, Iowa. White, D.J, Jaselskis, E., Schaefer, V., Cackler, T., Drew, I., and Li, L. (2004). Field Evaluation of Compaction Monitoring Technology: Phase I, Final Report, Iowa DOT Project TR-495, Iowa State University, Ames, Ia. White, D.J, Jaselskis, E., Schaefer, V., and Cackler, E. (2005). “Real-time compaction monitoring in cohesive soils from machine response.” Transportation Research Record No. 1936, National Academy Press, 173-180.

31
White, D.J, Morris, M., and Thompson, M. (2006a), “Power-based compaction monitoring using vibratory padfoot,” Proc., GeoCongress 2006: Geotechnical Engineering in the Information Technology Age, Atlanta, CD-ROM. White, D.J, Thompson, M., Jovaag, K., Morris, M., Jaselskis, E., Schaefer, V. and Cackler, E. (2006b). Field evaluation of compaction monitoring technology: Phase II. Final Report, Iowa DOT Project TR-495, Iowa State University, Ames, Ia. White, D.J, Thompson, M., Vennapusa, P. (2007a). Field Validation of Intelligent Compaction Monitoring Technology for Unbound Materials, Mn/DOT Report No. MN/RC 2007-10, Iowa State University, Ia. White, D.J, Thompson, M., Vennapusa, P. (2007b). Field study of compaction monitoring systems: self-propelled non-vibratory 825G and vibratory smooth drum CS-533 E rollers, Final Report, Center of Transportation Research and Education, Iowa State University, Ames, Ia. White, D., Vennapusa, P., Gieselman, H. (2008a). “Roller-integrated compaction monitoring technology: Field evaluation, spatial visualization, and specifications.” Proc., 12th Intl. Conf. of Intl. Assoc. for Computer Methods and Advances in Geomechanics (IACMAG), 1-6 October, Goa, India. White, D., Thopmson, M., Vennapusa, P., and Siekmeier, J. (2008b). “Implementing intelligent compaction specifications on Minnesota TH 64: Synopsis of measurement values, data management, and geostatistical analysis.” Transportation Research Record, 2045, 1-9. White, D. J., Vennapusa, P., Gieselman, H. (2008c). Investigation of Dual Roller-Integrated MDP/CMV Compaction Monitoring Technologies and Measurement Influence Depth, Center of Transportation Research and Education, Iowa State University, Ames, Iowa, August. White, D.J., Vennapusa, P., Gieselman, H., Johanson, L., Siekmeier, J. (2009a). “Alternatives to heavy test rolling for cohesive subgrade assessment,” Eighth Intl. Conf. on the Bearing Capacity of Roads, Railways, and Airfields (BCR2A’09), June 29 – July 2, Champaign, Illinois. White, D.J., Vennapusa, P., Zhang, J., Gieselman, H., Morris, M. (2009b). Implementation of Intelligent Compaction Performance Based Specifications in Minnesota, EERC Publication ER09-03, MN/RC 2009-14, Minnesota Department of Transportation, St. Paul, Minnesota, March. Yoo, T., and Selig, E. (1980). “New concepts for vibratory compaction of soil”, Proc., Intl. Conf. on Compaction, Vol. II, 703-707,Paris. ZTVE StB/TP BF-StB. (1994). Surface Covering Dynamic Compaction Control Methods – German Specifications and Regulations, Additional Technical Contractual Conditions and Guidelines for Earthwork in Road Construction and Technical Testing Instructions for Soil and Rock in Road Construction, Research Society of Road and Traffic, Germany.