a report on the completed acquisition by euro car parts of ...€¦ · a report on the completed...
TRANSCRIPT
A report on the completed acquisition by Euro Car Parts of the assets of the Andrew Page business
Appendices and glossary
Appendix 1.1: Terms of reference and conduct of the inquiry
Appendix 5.1: Price matching and discounts
Appendix 5.2: Catchment area analysis
Appendix 6.1: Likelihood of AP exiting the market
Appendix 6.2: Alternative purchasers of AP or its assets
Appendix 6.3: List of acquired depots and whether alternative purchaser
Appendix 7.1: Framework for assessing Theory of Harm 1 in cases where the counterfactual is the purchase of the AP depot by an alternative bidder
Appendix 7.2: Local area assessments
Appendix 7.3: Evidence on other suppliers for local assessments
Appendix 7.4: Barriers to entry
Appendix 8.1: Tender data analysis
Appendix 8.2: Evidence on other suppliers to Key Accounts
Appendix 10.1: Views on the scope of the divestiture package
Glossary
A1
APPENDIX 1.1
Terms of reference and conduct of the inquiry
1. In exercise of its duty under section 22(1) of the Enterprise Act 2002 (the Act) the Competition and Markets Authority (CMA) believes that it is or may be the case that:
(a) a relevant merger situation has been created, in that:
(i) enterprises carried on by Euro Car Parts Limited, a wholly-owned subsidiary of LKQ Euro Limited, whose ultimate parent is LKQ Corporation, have ceased to be distinct from the enterprise consisting of the Andrew Page business carried on by Andrew Page Limited, Solid Auto (U.K.) Limited, and Colton Parts Company Limited; and
(ii) the condition specified in section 23(1)(b) of the Act is satisfied; and
(b) the creation of that situation has resulted, or may be expected to result, in a substantial lessening of competition within a market or markets in the United Kingdom for goods or services, including the supply of independent aftermarket car parts to the independent motor trade for (i) key account customers in the UK, and (ii) local customers in 92 local overlap areas.
2. Therefore, in exercise of its duty under section 22(1) of the Act, the CMA hereby makes a reference to its chair for the constitution of a group under Schedule 4 to the Enterprise and Regulatory Reform Act 2013 in order that the group may investigate and report, within a period ending on 5 November 2017, on the following questions in accordance with section 35(1) of the Act:
(a) whether a relevant merger situation has been created; and
(b) if so, whether the creation of that situation has resulted, or may be expected to result, in a substantial lessening of competition within any market or markets in the United Kingdom for goods or services.
Rachel Merelie Executive Director, Markets and Mergers Competition and Markets Authority 22 May 2017
A2
Conduct of the inquiry
3. We published biographies of the panel members of the inquiry group on 26 May 2017 and the administrative timetable for the inquiry was published on our webpages on 2 June 2017. On 15 June 2017, we published an issues statement on our webpages, setting out the areas of concern on which the inquiry would focus. On 14 September, we published our provisional findings on the Merger and a notice of possible remedies.
4. We invited a wide range of interested third parties to comment on the Merger. We sent detailed questionnaires to a number of larger car parts suppliers, Key Accounts and over 200 short questionnaires to smaller independent suppliers of car parts. We conducted a survey of 1,890 independent garage and workshop customers of ECP and AP, publishing the findings on our case page. We also held phone calls with selected third parties. We also used evidence from the CMA’s phase 1 inquiry into the Merger. We have published a list of third party calls on our case page which we have held during the course of the investigation.
5. We received written evidence from the Parties and non-confidential versions of their responses to the Phase I decision, the issues statement, notice of remedies and provisional findings are on the case page.
6. On 19 June 2017, members of the inquiry group, accompanied by staff, visited several depots of ECP and AP. In the course of our inquiry, we sent to the Parties a number of working papers and an annotated issues statement for comment. In addition to a number of meetings and calls with the Parties, we also held a hearing with ECP on 16 August 2017. We held a response hearing with ECP on 5 October 2017 to discuss the provisional findings and possible remedies.
7. A non-confidential version of this final report will be available on the case page.
8. We would like to thank those who have assisted us in our inquiry.
A5.1-1
APPENDIX 5.1
Price matching and discounts
Introduction
1. This appendix provides an overview of the data on price matching and discounts that has been provided by ECP and the analysis that has been carried out using this data.
2. The data in question comprises i) a detailed dataset on price matching activity by ECP, broken down by depot and competitor (the “IPM data”); ii) a dataset on the average level of discount ECP provides to customers at each of its depots (the “ECP discounting data”) and iii) a dataset on ECP’s branch margins.
Background
3. In this section, we summarise the pricing structure used by ECP, including the various discounts it offers to local customers, and describe the data ECP has provided on its pricing and discounts.
ECP Pricing Structure
Customer terms
4. []
5. []
6. []
7. []
Competitor price matching
8. Beyond the terms discounts, ECP also offers to match prices of competitors, and uses an ‘Instant Price Match’ (IPM) system to do so. Sales staff can use the system to request a price match when:
(a) a customer requests a lower price than the price it would normally pay because of a lower competitor offer, and
A5.1-2
(b) the price requested is below the minimum price sales staff can offer on a discretionary basis.1
When a price match is requested the sales staff must log the identity of the competitor which offered the lower price.
9. []
10. []2
Other discounts
11. ECP also offers discounts for other reasons, such as for the purchase of significant volumes or in recompense for late deliveries.
12. [].
Table 1: ECP discounts
Type of discount
Total value of discounts
% of gross sales
Terms [] [] IPM [] [] Other [] [] Total [] []
Data collected on discounts
13. ECP tracks the usage of the IPM system, and has provided a dataset covering each individual competitor price match made using the system between April 2016 and December 2016. For each price match, the data includes the following information:
(a) The ECP depot at which the price match was requested;
(b) The identity of the competitor whose price was being matched;
(c) The original ECP price, the competitor price and the final price offered by ECP (which was not always as low as the competitor price);
(d) The customer number for the customer requesting the price match; and
(e) The number for the part for which the price match was requested.
1 [] 2 Response to Phase I decision, p 3.24.
A5.1-3
14. ECP has also provided a file which maps, as far as possible, the competitors listed in the IPM data to the competitor lists at each ECP depot provided by ECP, and includes further details on each competitor including the type of supplier (e.g. OEM parts supplier). These details are only provided for the competitors to the subset of ECP depots for which data was requested to ECP using our formal powers.
Price matching analysis
15. In this section, we discuss the analysis of ECP’s price matching (IPM) data, including:
(a) The Parties’ views on how the data should and should not be used to inform the competitive assessment; and
(b) Our analysis of the data.
Parties’ views
16. The Parties’ have submitted that, while it may provide an indication of the number of effective competitors in each area, the IPM data is not useful for assessing the relative closeness of competitors.3 The Parties’ submissions can be divided into two broad categories: i) arguments that the IPM data only reflects a limited portion of the competition ECP faces and ii) arguments that the IPM data systematically over-represents AP.
Arguments that IPM data reflects a limited portion of competition
17. The Parties said that the IPM data only represents a minority of the competitor price matching carried out by ECP, [].4
18. However, it is not clear why this in itself should mean that the IPM data does not accurately reflect closeness of competition – if a particular competitor is price matched frequently through the IPM system, then we would also expect that it would be price matched frequently through other means as well. In other words, there is no reason to expect that a specific competitor would be more likely to lead ECP to offer price matches through the IPM system and less likely to lead ECP to offer other forms of discount.
19. Moreover, the IPM system is the only type of competitor price matching which requires sales advisers to log the name of the competitor whose price is being
3 Parties’ Response to Phase I Decision, p 3.22. 4 Parties’ Response to Phase I Decision, p 3.24.
A5.1-4
matched. Therefore, the IPM data has the potential to provide direct evidence of the competitive strength of particular competitors and it would be more difficult to use data on other types of price matching in the same way.
20. The Parties have also argued that only the most aggressive competitors are included in the IPM data [].
21. The Parties have also argued that the IPM data only represents price competition and does not reflect other potentially important dimensions of competition (e.g. reliability, delivery times and relationship). The Parties submitted, therefore, that a supplier which is more reliable than ECP but has higher prices might be a very close competitor, but the IPM data would not reflect this.
22. Evidence from the customer survey5 indicates that, while speed of delivery and quality of parts are the most important criteria for selecting a supplier, price remains an important element of customer choice. As a result, we believe that the IPM data provides relevant insights into which competitors in an area compete closely with ECP at least in relation to this aspect of competition.
Arguments that IPM systematically over-represents AP
23. The Parties have argued that AP is over-represented in the IPM data because it was pursuing an ‘unsustainable’ pricing policy in the pre-acquisition period covered by the data because of its financial difficulties. The Parties argued that as AP was offering very low prices in this period, it was price matched disproportionately often.
24. []
25. If AP’s prevalence in the IPM data was driven by unsustainably low pricing in the period shortly before it went into administration, we would expect AP to appear less frequently in the IPM data after it was acquired by ECP. Figure 1 below shows the number and share of price matches against AP each month across all ECP depots in the IPM data, for the period for which data is available.
Figure 1: Price matches against AP by all ECP depots
[] 26. [].
5 Euro Car Parts and Andrew Page consumer research report by DJS Research
A5.1-5
27. Even if AP is overrepresented to some extent, we believe that it is still possible to use the IPM data to assess closeness of competition so long as the results are interpreted carefully in light of this potential distortion. In particular, by using the IPM data only from the period after the acquisition, we do not risk overestimating the closeness of (price) competition from AP as a result of its pricing policy in the period before it entered into administration.
28. Another reason the Parties suggest for AP receiving a disproportionately high share of price matches in the IPM data is that sales advisers do not always record data accurately, []
29. If being listed first made a competitor more likely to be chosen by ECP sales staff when recording price matches, we would expect that any given competitor would receive a higher share of price matches when it is the first competitor in the list than when it is not. As shown by Table 2 below, this is not the case. AP receives a similar average share of price matches per depot whether or not it is listed first. Moreover, although the number of examples of other competitors being listed first is fairly small, it is clear that these competitors receive a much lower share of price matches when listed first than AP does.
Table 2: Share of price matches received by competitors listed first
[] 30. We therefore do not consider there to be any evidence to support the
submission that the order in which competitors were listed in the IPM system resulted in AP being materially over-represented in the data.
Our use of the competitor price matching data
31. We have used the price matching data as part of our assessment in order to:
(a) Inform our view on the closeness of competition between ECP and AP;
(b) Inform our assessment of the competitive constraint from OEM and specialist parts suppliers; and
(c) Directly as part of our competitive assessment in specific local areas.
32. Before using the IPM data, we made the following adjustments:
(a) To take into account Parties’ submission that the IPM may have systematically over-represented AP in the period prior to the acquisition, we have used each competitor’s share of the post-acquisition price matching as a sensitivity test; and
A5.1-6
(b) In addition to this adjustment, we have removed from the data as far as possible any price matching activity outside the relevant product market.
Ensuring relevance of data
33. To begin with, we limited the data set to approved competitor price matches – i.e. we excluded price matches which were not related to competitors (the data includes price matches for other reasons, such as honouring an incorrect price that was previously quoted) and price matches which were rejected or cancelled.
34. The IPM data includes price matching activity that is not related to the supply of car parts to the independent motor trade, but rather relates to sales to other customer types including retail customers and other motor factors.
35. We addressed this issue by removing such price matches from the IPM data as far as was reasonably possible. As a first step, we identified and removed individual competitors in the data which are known not to supply local customers in the independent motor trade, such as FPS (a ‘superfactor’, i.e. a supplier which only supplies motor factors rather than trade customers).6 These competitors accounted for [] of the price matches at the ECP depots included in the customer survey.7
36. As the data identifies the customer number in each price match, we also removed price matches to retail customers, as ECP’s customer data identifies these as being in a separate category to trade customers. Price matches to retail customers accounted for [] of the price matches at ECP depots in overlap areas. ECP’s customer data does not clearly identify motor factors (for which ECP would be competing with superfactors rather than with other motor factors such as AP), so price matches to these customers cannot be removed as easily.
Closeness of competition between ECP and AP
37. Whilst we acknowledge the Parties’ concerns with regard to AP’s over-representation in the pre-acquisition IPM data, we consider that we may still
6 Apart from FPS, we also removed Neepsend Motor Factors, Premier Car Parts and Darlington Motor Factors, all of whom were listed by the Parties as being mainly active in retail and not directly competing with the Parties for the supply of IAM parts to the IMT. We also removed Motorists Discount Centres, which is also active primarily in retail. 7 We focus on the depots included in the customer survey because these will approximately correspond to the ECP depots which overlap with AP depots. However, since the depots included in the survey were selected on the basis of the average catchment areas used in Phase I, there may be some differences from the depots determined to overlap with AP depots on the basis of the individual catchment areas calculated for our local competitive assessment.
A5.1-7
use the data to assess how closely ECP and AP compete in each local area, and also how closely ECP competes with other local suppliers, using the data from the post-acquisition period to avoid the distortions that the Parties argue exist as a result of AP’s ‘unsustainable’ pre-acquisition pricing policy.
38. The IPM data for each ECP depot has been used to examine:
(a) AP’s rank in the IPM data for the ECP depot (i.e. whether it is the competitor matched most often, second most often, third most often, etc.);
(b) AP’s share of price matches made at the ECP depot; and
(c) The extent to which other competitors are price matched by the ECP depot.
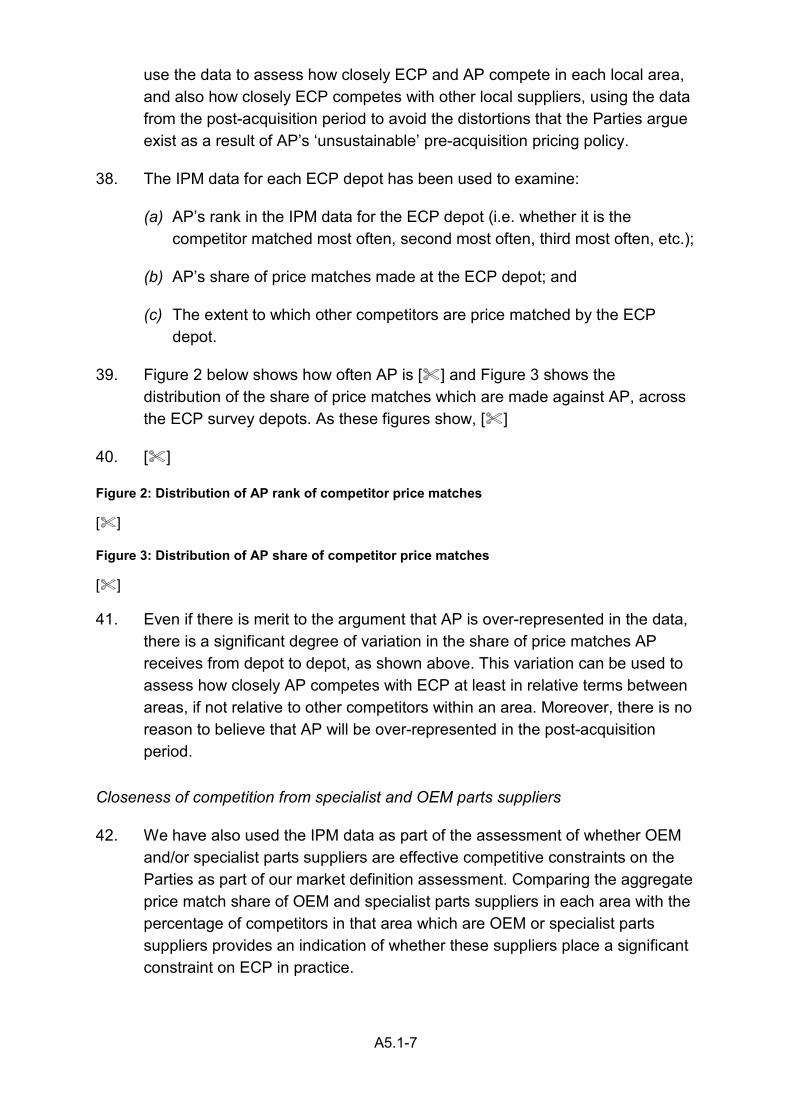
39. Figure 2 below shows how often AP is [] and Figure 3 shows the distribution of the share of price matches which are made against AP, across the ECP survey depots. As these figures show, []
40. []
Figure 2: Distribution of AP rank of competitor price matches
[] Figure 3: Distribution of AP share of competitor price matches
[] 41. Even if there is merit to the argument that AP is over-represented in the data,
there is a significant degree of variation in the share of price matches AP receives from depot to depot, as shown above. This variation can be used to assess how closely AP competes with ECP at least in relative terms between areas, if not relative to other competitors within an area. Moreover, there is no reason to believe that AP will be over-represented in the post-acquisition period.
Closeness of competition from specialist and OEM parts suppliers
42. We have also used the IPM data as part of the assessment of whether OEM and/or specialist parts suppliers are effective competitive constraints on the Parties as part of our market definition assessment. Comparing the aggregate price match share of OEM and specialist parts suppliers in each area with the percentage of competitors in that area which are OEM or specialist parts suppliers provides an indication of whether these suppliers place a significant constraint on ECP in practice.
A5.1-8
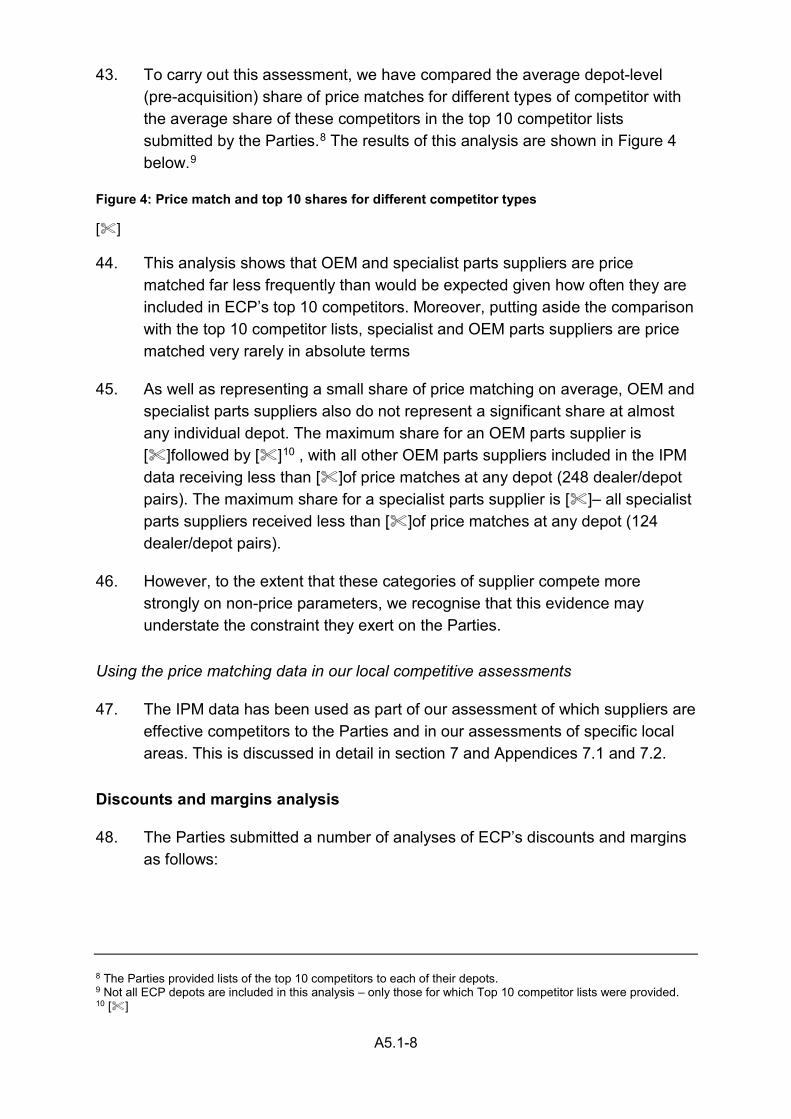
43. To carry out this assessment, we have compared the average depot-level (pre-acquisition) share of price matches for different types of competitor with the average share of these competitors in the top 10 competitor lists submitted by the Parties.8 The results of this analysis are shown in Figure 4 below.9
Figure 4: Price match and top 10 shares for different competitor types
[] 44. This analysis shows that OEM and specialist parts suppliers are price
matched far less frequently than would be expected given how often they are included in ECP’s top 10 competitors. Moreover, putting aside the comparison with the top 10 competitor lists, specialist and OEM parts suppliers are price matched very rarely in absolute terms
45. As well as representing a small share of price matching on average, OEM and specialist parts suppliers also do not represent a significant share at almost any individual depot. The maximum share for an OEM parts supplier is []followed by []10 , with all other OEM parts suppliers included in the IPM data receiving less than []of price matches at any depot (248 dealer/depot pairs). The maximum share for a specialist parts supplier is []– all specialist parts suppliers received less than []of price matches at any depot (124 dealer/depot pairs).
46. However, to the extent that these categories of supplier compete more strongly on non-price parameters, we recognise that this evidence may understate the constraint they exert on the Parties.
Using the price matching data in our local competitive assessments
47. The IPM data has been used as part of our assessment of which suppliers are effective competitors to the Parties and in our assessments of specific local areas. This is discussed in detail in section 7 and Appendices 7.1 and 7.2.
Discounts and margins analysis
48. The Parties submitted a number of analyses of ECP’s discounts and margins as follows:
8 The Parties provided lists of the top 10 competitors to each of their depots. 9 Not all ECP depots are included in this analysis – only those for which Top 10 competitor lists were provided. 10 []
A5.1-9
(a) CRA’s cross-sectional discount analysis – submitted in response to the Phase I Decision, this analysed data on ECP’s discounts across different depots.
(b) CRA’s cross-sectional margins analysis – submitted at the end of August, this analysis is similar to CRA’s cross-sectional discount analysis but uses margins rather than discounts.
(c) CRA’s AP closure analysis – also submitted at the end of August, this assessed the effects of the closure of an AP depot on margins at nearby ECP depots.11
(d) CRA’s additional margins analysis – submitted in response to our Provisional Findings, this examined the relationship between ECP’s margins and the number of suppliers in a sample of local areas.
49. In this section, we provide a brief summary of these analyses and discuss our view on their implications for our competitive assessments.
CRA’s cross-sectional discount analysis
50. This analysis compares the level of discounting (measured as the total value of discounts as a percentage of gross sales value at each depot) between depots where ECP faces AP as a competitor and depots where it does not. The analysis is based on sales and discounts in the period between April and August 2016. Given that, as described above, [], this analysis is effectively an analysis of ECP’s pricing.12
51. The analysis has three parts:
(a) First, a simple comparison between discount levels at the 96 ECP depots which were considered to overlap with an AP depot in the Phase I investigation and discount levels at the 101 ECP depots which were not;
(b) Second, a comparison that also controls for the total number of competitor fascia in the area based on the analysis in the Phase I investigation (between ECP depots with one competitor which is AP and those with one competitor which is not AP, between ECP depots with two competitors
11 The Parties also submitted in their response to the Phase I Decision a similar analysis of the effects of the closure of AP depots but focussing on the effects on total sales. Given the similarities with this analysis that focusses on margins, and since the Parties did not refer to the total sales analysis in the Main Party Hearing or in their response to our Provisional Findings, we do not discuss that earlier analysis in detail here. 12 []
A5.1-10
one of which is AP and those with two competitors neither of which are AP, etc.); and
(c) Third, a comparison between discount levels at ECP depots that overlap with an AP depot and discount levels at ECP depots that overlap with each of nine other competitors or overlap with independents (these categories are overlapping – e.g. many depots which overlap with AP also overlap with PA).
52. In each part CRA presents a graphical analysis showing the discount levels for each depot in each category as well as the average discount level for each category, then also presents a regression analysis which includes controls for the region and the urbanicity of the ECP depot.
53. In the first two parts, CRA concludes that the presence or absence of AP makes no significant difference to ECP’s level of discounting, and in the third part CRA concludes that ECP’s level of discounting is no higher when AP is present than it is when other competitors are present.13
54. Overall, CRA submitted that its cross-sectional analysis of discounts demonstrates that there is no evidence that ECP discounts at a higher level in areas where it overlaps with AP, and that this is inconsistent with AP being a key competitive constraint on ECP. The Parties also argued that this analysis demonstrates that ECP faces a wide set of competitors, including OEM and specialist parts suppliers.
CRA’s cross-sectional margins analysis
55. At the end of August, the Parties submitted a supplementary analysis focusing on ECP branch margins rather than ECP discounts. This analysis repeated the first and second parts of the cross-sectional discount analysis described above for margins rather than discounts, and added a regression analysis of whether margins were influenced by a) AP’s presence, b) PA’s presence and c) the number of other competitor fascia present. For the first two analyses, results were similar to those in CRA’s discounts analysis, while for the third analysis CRA found that AP’s presence, PA’s presence and the number of other competitors present had no significant influence on ECP’s margins.
13 The primary analysis presented by CRA is based on a) assessing overlaps on the basis of only counting competitors within the catchment area of ECP’s depot and b) only counting the 86 competitors that were considered to be effective competitors in the Phase I Decision. In annexes, they also present results which assess overlaps on the basis of double catchment areas, and results which count the 150 competitors that were considered to be effective competitors earlier in Phase I. However, the results do not differ materially under these alternative specifications, and so we do not discuss these variations further.
A5.1-11
56. As with the discounts analysis, the margins analysis is based on the competitor set and the catchment areas used in the Phase I investigation. CRA submits that the results of its margin analysis suggest that either the catchment areas or the competitor set or both were measured inaccurately, and therefore the CMA should consider a wider competitor set.
CRA’s AP closure analysis
57. The Parties also submitted a graphical and an econometric analysis of the effects of the closure of a number of AP depots on the margins at nearby ECP depots.14 For the purposes of assessing such effects, the econometric analysis used margins for all of the ECP depots which were not close to an AP depot which closed as a control.
58. CRA submitted that, whilst the analysis showed that an AP closure led to a statistically significant effect on ECP branch margins, this effect was economically very small. As a result, the Parties submitted that this analysis suggests that, whenever ECP lost AP as a constraint in the past, it was not able to materially increase its margins, confirming the presence of sufficient other competitive constraints.
CRA’s additional margins analysis
59. In their response to our Provisional Findings, the Parties submitted that we should have conducted a similar analysis to their cross-sectional analyses but using a competitor set based on the evidence collected during our investigation. To illustrate the possibility of doing this, the Parties submitted an analysis of the relationship between ECP’s margins and the number of competitors in an area based on our Provisional Findings. They noted that these comparisons found no difference in the margins for ECP depots in areas with 3 competitors or fewer compared to areas with 4 or more competitors.
60. The Parties argued that this analysis showed that we had underestimated the competitive constraints (eg from smaller motor factors and OEM parts suppliers) faced by the Parties in each local area. Consequently, the Parties’
14 In response to the Phase I Decision, the Parties submitted a similar analysis of the effects of the closure of AP depots but focussing on the effects on total sales at neighbouring ECP depots. Given the similarities with this subsequent analysis that focusses on margins, and because the Parties did not refer to the total sales analysis in the Main Party Hearing or in their response to our Provisional Findings we do not discuss that earlier analysis in detail further. However, we note that many of the same concerns apply to that earlier analysis that focusses on total sales, in particular about the extent to which evidence regarding the closure of AP depots can inform our competitive assessments and the appropriateness of the control group used (in that case all ECP depots which do not overlap with an AP depot).
A5.1-12
submitted that this evidence does not support a SLC finding in cases where our analysis identified fewer than 4 suppliers.
Our assessment
61. Given the similarities between CRA’s cross-sectional analyses of discounts and margins we consider them together before considering CRA’s AP closure analysis.
CRA’s cross-sectional analyses of discounts and margins
62. CRA’s cross-sectional analyses do not find a clear and significant relationship between the number of competitors in an area and ECP’s level of discounting or ECP’s margins. In other words, the analysis provides no clear evidence that ECP offers higher discounts (and therefore lower prices) or earns lower margins when it faces more competitors. However, this analysis should be viewed taking account of a number of important caveats:
(a) The quality of the available data and in part the design of CRA’s analysis may prevent the effect of competition on ECP’s discounting and margins from being accurately identified (these factors are discussed further below);
(b) To the extent that non-price parameters of competition are an important part of how ECP varies its offering in response to local competition, these effects are missed by an analysis which only covers discounts (although this would not necessarily explain why the analysis of margins also found no effect from competition, as improving non-price parameters of competition would be expected to result in higher costs and therefore lower margins).
63. Even setting these concerns aside, we believe that the inferences which can be drawn are more limited than those which the Parties have submitted (see below). In combination, these factors have led us to conclude that CRA’s cross-sectional analyses are not informative of the relationship between outcomes and the number of competitors.
Observations on the quality of the available data and the design of CRA’s cross-sectional analyses
64. Our observations on CRA’s cross-sectional analyses relate to three areas:
(a) the quality of the available information on the number of competitors in each area which is used in CRA’s analysis;
A5.1-13
(b) the quality of the available information about other factors which may affect discounts and margins; and
(c) the number of observations available for the analyses and the design of the analyses.
• The quality of the available information on the number of competitors in each area which is used in the analysis
65. Accurately identifying the relationship between ECP’s discounts and margins and the number of competitors faced by ECP in each local area requires reliable information about the number of different suppliers in each local area. The competitor set on which CRA’s analysis is based is the competitor set used during the Phase I investigation. It may be that this competitor set is poorly specified, excluding genuinely viable competitors (as the Parties have argued) and possibly also including suppliers which are not effective competitors.
66. The competitor set is particularly likely to be poorly identified for the ECP depots where AP was not present. This is because the Phase I investigation naturally focused on areas in which AP was present, meaning that the number of competitors to ECP depots in areas where AP was not present is more likely to be underestimated. This is likely to bias the results against finding that ECP’s discounts are higher or its margins are lower when AP is present, because the actual level of competition ECP faces in areas when AP is not present will be higher than implied by the data (and so discounts are likely to be higher and margins are likely to be lower).
67. Consequently, it seems likely that the variables used in the analyses are not a good measure of the competitive constraint ECP faces in each area. As described in Appendices 5.2 and 7.1, for our assessment of competition in each local area, we have taken a different approach to identifying catchment areas and effective competitors to that taken in the Phase I investigation (although again focusing on the areas where AP is present).
• The quality of the available information about the other factors which are likely to affect discounts and margins
68. There are likely to be a variety of different factors which determine the level of discounts and margins at each depot. For example, factors such as customer mix and the mix of parts purchased from a depot, costs, the precise location of competitors and the level of demand or number of customers are likely to
A5.1-14
differ between areas and are also likely to affect ECP’s discounting and ECP’s margins.15
69. Adequately controlling for such factors is important for two reasons. First, it increases the precision of the analyses, allowing the effects of changes in the number of competitors to be identified with a reasonable degree of precision. If a number of important factors which influence margins and discounts cannot be adequately controlled for, it is unlikely that the analyses will be able accurately to identify the relationship between changes in competition and in ECP’s margins and discounts. In such circumstances, any relationship between the number of competitors and margins or discounts is likely to be obscured by other variation in the data.
70. For example, it is likely that ECP would face a very different competitive constraint from three competitors within a mile of its branch which are all serving the same set of customers than it would from three competitors located 10 miles away and predominately serving a different set of customers. If an analysis does not attempt to distinguish between these two scenarios, it will tend to underestimate the competitive constraint created by three competitors which are located close by.
71. Second, if these additional factors affect both ECP’s discounts or margins and the number of competitors in an area, failing to control for these factors could bias the results. For example, high demand for car parts in an area (eg because of a large number of garages or high levels of car ownership) is likely both to increase prices (and therefore margins) and attract more suppliers in an area. This would cause a positive bias in the results because a greater number of competitors would incorrectly be associated with higher margins.16
72. In its regression analyses, CRA attempts to control for some of these factors by including controls for the region the depot is in and for the type of area (ie whether it is in an urban or rural area).17 However, these are very broad categories and it is likely that, within these regions, there will remain significant variation in the unobserved factors which influence discounting and margins. In our view, the inability to control adequately for these factors significantly reduces the confidence there can be that the results of CRA’s
15 In their response to our Provisional Findings, the Parties submitted that we had not sufficiently articulated our reasons for concern here and how it might affect the analyses. Consequently, we have explained our concerns in more detail in the following paragraphs. 16 Similarly, higher local demand is likely to increase a depot’s gross sales leading to a decrease in the percentage value of discounts and decreasing the pressure to discount in order to attract customers whilst also increasing the number of suppliers in an area. Such an effect is likely to create a negative bias unless it is adequately controlled for. 17 CRA controls for 9 regions (East Anglia, London, Midlands, North West, Scotland, South East, South West, Wales and Yorkshire) and 4 levels of urbanicity (Urban City & Town, Urban Minor or Major Conurbation, Rural and Very Rural).
A5.1-15
analyses accurately reflect the impact of competition on ECP’s discounting and margins.
• The number of observations and the design of the analyses
73. This part of CRA’s analyses is based on a cross-sectional comparison between different ECP sites using a relatively small number of observations. The relatively small number of observations makes it challenging to account adequately for the different factors which affect discounting and margins, and to accurately identify the relationship between margins or discounts and the number of competitors.
74. This is especially so in the parts of CRA’s analysis where, when including the number of competitors, the sample is cut into a large number of groups. In some cases, the CRA’s analyses involve comparisons across 10 different groups – areas with 1, 2, 3, 4 or 5+ competitors, including or not including AP. Since the sample is not large to begin with (197 data points), some of these groups are very small, e.g. only one ECP depot had 5 or more competitors, none of which were AP. It is therefore unsurprising that CRA is unable to find many statistically significant results in this part of the analyses.
• The interpretation of the results of CRA’s cross-sectional analyses
75. Even if we were to take the results of CRA’s cross-sectional analyses at face value, we consider that the inferences which can be drawn are more limited than those which the Parties have submitted.
76. CRA’s results from its analysis of discounts appear to indicate that ECP does not offer higher discounts in areas where it overlaps with AP than in areas where it does not overlap with AP, even after controlling for the total number of competitors in the area.
77. However, this does not necessarily imply that AP is not a significant competitive constraint on ECP where AP is present. The comparison CRA makes in its discounts analysis is between areas with (e.g.) AP and two other competitors and areas with no AP but three other competitors – in other words, holding the total number of competitors constant. It may be the case that the reason ECP does not discount more in the first type of area is not because AP is not a significant constraint, but rather because ECP faces similarly strong constraints from the other competitors it faces where AP is absent. In that case, the removal of AP as a constraint could still potentially result in a significant lessening of competition in a specific local area.
A5.1-16
78. CRA’s subsequent margin analysis includes a variation which controls for the number of competitors other than AP instead of controlling for the number of competitors including AP. If the number of competitors was measured accurately, this form of analysis would not be subject to the same issue described above, i.e. the finding that ECP’s margins are no lower when AP is present could not be explained by the presence of other equally strong competitors in areas where AP is absent. However, as noted above, it seems likely that the competitor set identified during the Phase I investigation and used in this analysis does not effectively control for the number of competitors ECP faces in each area.
The Parties’ additional margins analysis provided in response to our Provisional Findings
79. Regarding the specific margin comparisons submitted by the Parties following Provisional findings, these comparisons are based on a very small number of ECP depots; the groups with fewer than 4 suppliers contain only 3 depots in one case and only 5 depots in the other case. The number of observations involved also means that it is not feasible to account adequately for any of the other factors which lead to variations in margins across branches. Therefore, we do not believe that this is sufficiently robust evidence to support the Parties’ submission that SLCs will not arise in markets with fewer than 4 suppliers.18
80. We also consider that any further analysis of the relationship between ECP’s margins and the number of suppliers in an area would have imposed disproportionate constraints on the CMA’s resources and time in light of its limited additional value to the CMA’s assessment (see a section 7), the statutory timetable of the investigation and the difficulties of carrying such analysis. This is because:
(a) Any additional analysis would also have to overcome the other difficulties outlined above, and in particular the difficulties in accounting for other factors which may affect discounts and margins at a local level. Our view is that these difficulties would mean that the evidential value of any further analysis of discounts or margins would be limited even if it were possible to identify the competitors to each ECP depot more accurately
(b) In many areas, significant additional analysis would be required in order to identify a competitor set which would be suitable to use in the analysis. As the Parties noted, our Provisional Findings specified the total number of
18 We comment more generally on the Parties’ submission that we have used a 4-3 cut-off in our competitive assessments in Section 7.
A5.1-17
competitors in only the 22 areas where it was necessary to conduct a detailed analysis of the number of competitors in an area to reach our provisional conclusions.19 In many of these cases, we identified a different number of competitors than the number of competitors which had been considered in our initial high level filter20 and Appendix 7.2 illustrates the extent of the additional analysis which was required in those cases. We consider that a similar analysis would need to be conducted for the remaining areas before an accurate competitor set could be identified. We note that conducting a similar analysis for the remaining local areas for which we have evidence would have imposed material constraints on the CMA’s resources and time.
(c) Additionally, the focus of our evidence gathering and analysis has been on areas where AP is present. There are a substantial number of ECP depots which do not overlap with an AP depot. As a result, any analysis is likely to underestimate the number of competitors to ECP depots in areas where AP is not present. This would significantly limit the number of areas where the competitors to ECP could be accurately identified and, therefore, the likely value of any such analysis.
CRA’s AP closure analysis
81. CRA’s AP closure analysis is a difference-in-difference analysis which compares the evolution of margins at ECP depots which were near to a closed AP depot with the evolution of margins at ECP depots which were not near to an AP depot which closed. Any change in average margins at the ECP depots which were near to a closed AP depot, above the average change in margins at ECP depots which were not, is attributed to the closure of the AP depot. In their response to our Provisional Findings, the Parties submitted that our critique did not consider this analysis and its implications.21
82. We agree that in principle, CRA’s AP closure analysis can resolve many of the methodological challenges faced by a cross-sectional analysis because it can account for factors which affect margins at individual depots but do not vary over time, and for factors which affect margins at all depots in the same
19 As the Parties’ noted in their response to our Provisional Findings. In many areas, it was not necessary to consider the exact number of competitors to the Parties to reach a conclusion because, for example, there was no alternative bidder for the AP depot, the alternative bidder was already present in the area or the overlap between the Parties was minimal. 20 For example, at the filtering stage of the analysis, we provisionally identified four suppliers who might compete with AP York and five suppliers who might compete with ECP York. However, in our detailed assessment we concluded that there was only one competitor who did in fact compete with the Parties in this area. 21 In response to the Phase I Decision, the Parties submitted a similar analysis of the effects of the closure of AP depots but focussing on the effects on total sales at neighbouring ECP depots. As noted above, we do not discuss that earlier analysis in detail here but note that many of the concerns discussed here also apply to that earlier analysis.
A5.1-18
way. However, we believe that the implications of this analysis for our competitive assessments is limited for the following reasons.
83. First, CRA’s analysis assesses the effects of the closure of AP depots which were not the subject of any bids during the AP sales process or which were closed down by AP in the period prior to the sales process.22 This suggests that these depots were not commercially attractive. By contrast, in cases where there was an alternative bidder for an AP depot, our assessment requires us to consider whether a merger between two commercially attractive depots will lead to a SLC in a specific local area.
84. It seems likely that a commercially unattractive depot will exert far less of a competitive constraint in the period prior to its closure than a commercially attractive depot is likely to exert. Therefore, one would expect the loss of competition following a merger with a commercially attractive competitor to be significantly greater than any loss of competition following the closure of a depot which was no longer commercially attractive. Consequently, it is not clear that an analysis of the effects of these depot closures is likely to be representative of the effects of a merger involving commercially attractive depots.
85. Second, CRA submitted that its analysis establishes that the closure of these AP depots did not materially affect the competitive constraint faced by ECP in the areas concerned. The Parties said that the results of the analyses were inconsistent with AP providing a key constraint on ECP.23 However, any such finding is specific to the local areas concerned, none of which are being considered as part of our assessment. Competition for IMT customers is local and therefore, our assessment requires us to reach a decision on whether the Merger will lead to a SLC in specific local areas. Competitive conditions (for example, the number, identity and location of competitors) vary across local areas. Consequently, evidence that, for example, the closure of the AP Chelmsford depot had relatively little impact on margins at ECP Chelmsford provides little insight into whether the Merger is likely to result in a SLC in Wakefield, unless it is known that the competitive conditions in Chelmsford and Wakefield are sufficiently similar.
86. The Parties have not provided any evidence regarding competitive conditions in the areas where an AP depot closed and it would not have been realistic for
22 In this regard, we note that many of the AP depots concerned are those which ECP decided not to purchase, in part, due to the poor financial performance of these depots. 23 More generally, we consider that the evidence clearly demonstrates that ECP and AP compete with each other in local areas where both Parties are present. This can be seen from a range of evidence including: i) [] ii) the ECP IPM data discussed in this Appendix, iii) the results of the Survey and iv) the evidence in specific local areas which is discussed in detail in Appendix 7.2.
A5.1-19
the CMA to do so within the context of our investigation given that this would have involved local assessments of areas outside the scope of the Merger.
87. We set out our provisional view on each of the areas where we provisionally concluded that a SLC may be expected to arise in our Provisional Findings. The Parties have made submissions on those areas and, as discussed in Appendix 7.2, we have considered each of these submissions.
88. Finally, we also have some reservations about the ability of this approach to accurately identify the effects of the closure of an AP depot on the margins of a nearby ECP depot given the available data. The methodology used by CRA is most likely to accurately identify any effect if there are a large number of AP closures and/or ECP depots which are affected by these closures24 and when the control group used accurately captures what would have happened to ECP’s margins in areas where an AP depot closed.25
89. In this case the analysis is based on the closure of a relatively small number of AP depots. Additionally, the control group used is all of the ECP depots which do not overlap with an AP depot which closed. This is a very broad group. As a result, we have concerns that margin patterns in the control group are unlikely to be representative of margin patterns at the overlapping ECP depots prior to the AP closures. Consistent with this we note that:
(a) The graphical evidence of margins provided by CRA suggests that there are fluctuations in depot margins over time (including in the periods prior to the AP closures) which are not common to all ECP depots.
(b) The available evidence indicates that ECP operates a variety of different types and size of depot and that local competitive conditions vary across different areas such that using a broad control group is unlikely to be appropriate. For example, there is considerable variation in the size of ECP’s depots, with some having 2016 sales value of [] and [] customers and others having 2016 sales value of []and [] customers.
24 This allows any systematic effect of the closure of an AP depot on ECP’s margins to be distinguished from other variation in the data. 25 This ensures that any effect which is identified can reasonably be attributed to the closure of the AP depot. It is more likely to apply when there are relatively few factors which affect margins at individual depots over time.
A5.2-1
APPENDIX 5.2
Catchment area analysis
Introduction
1. This appendix sets out our catchment area analysis. A catchment area is the smallest geographic area from which a depot derives a given percentage of its revenue. This analysis has informed our findings on geographic market definition and has been used to identify areas where the Parties may compete to a material extent as part of our competitive assessment of the effects of the Merger.
Data
2. AP and ECP provided us with data setting out the details of sales in 2016 to their customers from a selection of depots. For AP this data covered all of the 101 AP depots which ECP acquired but only included information for customers with annual purchases of £1,000 or more. For ECP the data covered the 111 ECP depots which are located near to an AP depot. Both the AP and ECP data included information on customer locations.
3. We did not analyse data for two AP depots: AP Gatwick and AP Isle of Wight:
(a) AP Gatwick – we did not analyse this depot since Gatwick Airport is its sole customer, so this depot is not representative of AP’s other depots. Additionally, ECP does not compete to supply Gatwick Airport.1
(b) AP Isle of Wight – we did not analyse this AP depot since there are no ECP depots located on the Isle of Wight. As a result, we concluded that ECP does not compete to supply customers located on the Isle of Wight.
4. The data provided by the Parties contained information on a number of different types of customer including trade customers, retail customers and Key Accounts. The catchment area analysis is used to inform our assessment of the effects of the Merger on the supply of car parts to local IMT customers. Therefore, we restricted our catchment area analysis to trade customers only.
5. []
6. To calculate the catchment areas for each depot, we needed to determine the location of each customer. We used the postcode information contained in the
1 [].
A5.2-2
Parties’ data to identify the location of each customer using the National Postcode Database.
7. We were unable to locate a number of customers because either the Parties did not provide a postcode for the customer,2 the postcode provided was incomplete or the postcode provided did not exist. In many cases there was no realistic prospect of being able to locate a customer (eg because the customer collected from the depot). Overall, we were able to locate most of the customers for both AP and ECP, so we were not concerned by our inability to locate a small number of customers.3
Methodology for calculating catchment areas
8. We estimate catchment areas by calculating the smallest geographic area from which a depot derives a given percentage of its revenue. We term the percentage of the depot’s revenue that defines the boundaries of the catchment areas the ‘revenue threshold’.
9. The CMA typically defines catchment areas using an 80% revenue threshold (an ‘80% catchment area’).4 That is, 80% of the depot’s revenue comes from customers located in the catchment area. In some cases, it may be appropriate to use a different revenue threshold. In this case, we have focused our analysis on 80% catchment areas. However, we have also calculated catchment areas for 60%, 70% and 90% revenue thresholds to understand the impact of the choice of threshold on the size of the catchment area. We have calculated catchment areas on the basis of straight line distances.
10. In some previous cases5 average catchment areas, rather than depot specific catchment areas, have been used in the analysis. This has often reflected limitations in the available data or concerns that catchment areas vary significantly over time.
11. In this case, we have the customer data required to calculate catchment areas for each depot. Since we do not believe that catchment areas fluctuate significantly over time and we do not have significant concerns about the
2 In many instances this was because a customer collected their orders. 3 We were able to locate 93% of all AP customers and 84% of all ECP customers by value. These figures rose to 95% and 99% respectively once we excluded cases where there was no prospect of locating the customer. There were no AP depots where we were unable to locate less than 87% of customers by value and no ECP depots where we were unable to locate less than 95% of customers by value. 4 See CMA Retail mergers commentary (April 2017), paragraph 2.20 5 For example, Anglo American plc./Lafarge S.A. merger inquiry (2012).
A5.2-3
quality of the available data6 we have used depot specific catchment areas in our assessment.
12. This approach ensures that our catchment areas reflect the characteristics of each local area being considered. There may be genuine reasons why catchment areas would be bigger in some areas than others and using an average catchment area could mask these differences. This may be especially true for catchment areas calculated on the basis of straight line distance, since a given straight line distances may equate to a significantly different delivery time in different localities. In such cases, averaging would run the risk of assigning too small a catchment area to some depots, thereby leading to an erroneous conclusion that they do not overlap with another depot. This would lead us incorrectly to screen out depots where there is a possibility of a SLC arising.
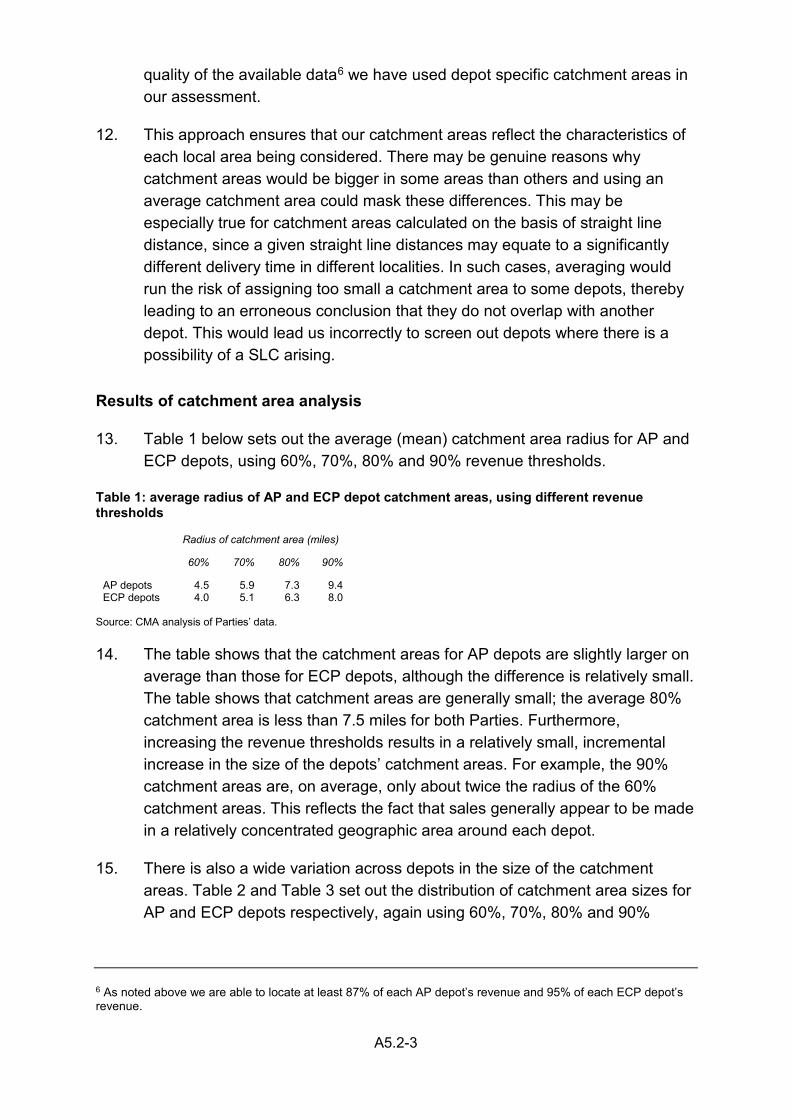
Results of catchment area analysis
13. Table 1 below sets out the average (mean) catchment area radius for AP and ECP depots, using 60%, 70%, 80% and 90% revenue thresholds.
Table 1: average radius of AP and ECP depot catchment areas, using different revenue thresholds
Radius of catchment area (miles)
60% 70% 80% 90%
AP depots 4.5 5.9 7.3 9.4 ECP depots 4.0 5.1 6.3 8.0
Source: CMA analysis of Parties’ data. 14. The table shows that the catchment areas for AP depots are slightly larger on
average than those for ECP depots, although the difference is relatively small. The table shows that catchment areas are generally small; the average 80% catchment area is less than 7.5 miles for both Parties. Furthermore, increasing the revenue thresholds results in a relatively small, incremental increase in the size of the depots’ catchment areas. For example, the 90% catchment areas are, on average, only about twice the radius of the 60% catchment areas. This reflects the fact that sales generally appear to be made in a relatively concentrated geographic area around each depot.
15. There is also a wide variation across depots in the size of the catchment areas. Table 2 and Table 3 set out the distribution of catchment area sizes for AP and ECP depots respectively, again using 60%, 70%, 80% and 90%
6 As noted above we are able to locate at least 87% of each AP depot’s revenue and 95% of each ECP depot’s revenue.
A5.2-4
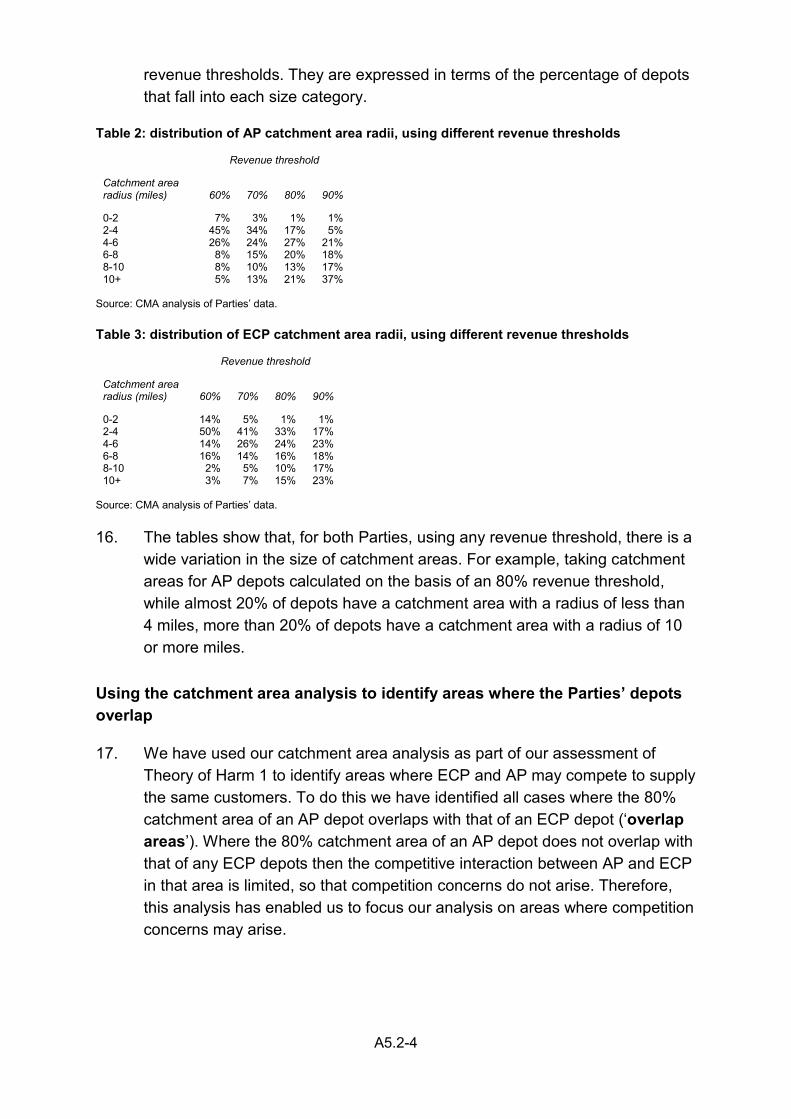
revenue thresholds. They are expressed in terms of the percentage of depots that fall into each size category.
Table 2: distribution of AP catchment area radii, using different revenue thresholds
Revenue threshold
Catchment area radius (miles) 60% 70% 80% 90%
0-2 7% 3% 1% 1% 2-4 45% 34% 17% 5% 4-6 26% 24% 27% 21% 6-8 8% 15% 20% 18% 8-10 8% 10% 13% 17% 10+ 5% 13% 21% 37%
Source: CMA analysis of Parties’ data. Table 3: distribution of ECP catchment area radii, using different revenue thresholds
Revenue threshold
Catchment area radius (miles) 60% 70% 80% 90%
0-2 14% 5% 1% 1% 2-4 50% 41% 33% 17% 4-6 14% 26% 24% 23% 6-8 16% 14% 16% 18% 8-10 2% 5% 10% 17% 10+ 3% 7% 15% 23%
Source: CMA analysis of Parties’ data. 16. The tables show that, for both Parties, using any revenue threshold, there is a
wide variation in the size of catchment areas. For example, taking catchment areas for AP depots calculated on the basis of an 80% revenue threshold, while almost 20% of depots have a catchment area with a radius of less than 4 miles, more than 20% of depots have a catchment area with a radius of 10 or more miles.
Using the catchment area analysis to identify areas where the Parties’ depots overlap
17. We have used our catchment area analysis as part of our assessment of Theory of Harm 1 to identify areas where ECP and AP may compete to supply the same customers. To do this we have identified all cases where the 80% catchment area of an AP depot overlaps with that of an ECP depot (‘overlap areas’). Where the 80% catchment area of an AP depot does not overlap with that of any ECP depots then the competitive interaction between AP and ECP in that area is limited, so that competition concerns do not arise. Therefore, this analysis has enabled us to focus our analysis on areas where competition concerns may arise.
A5.2-5
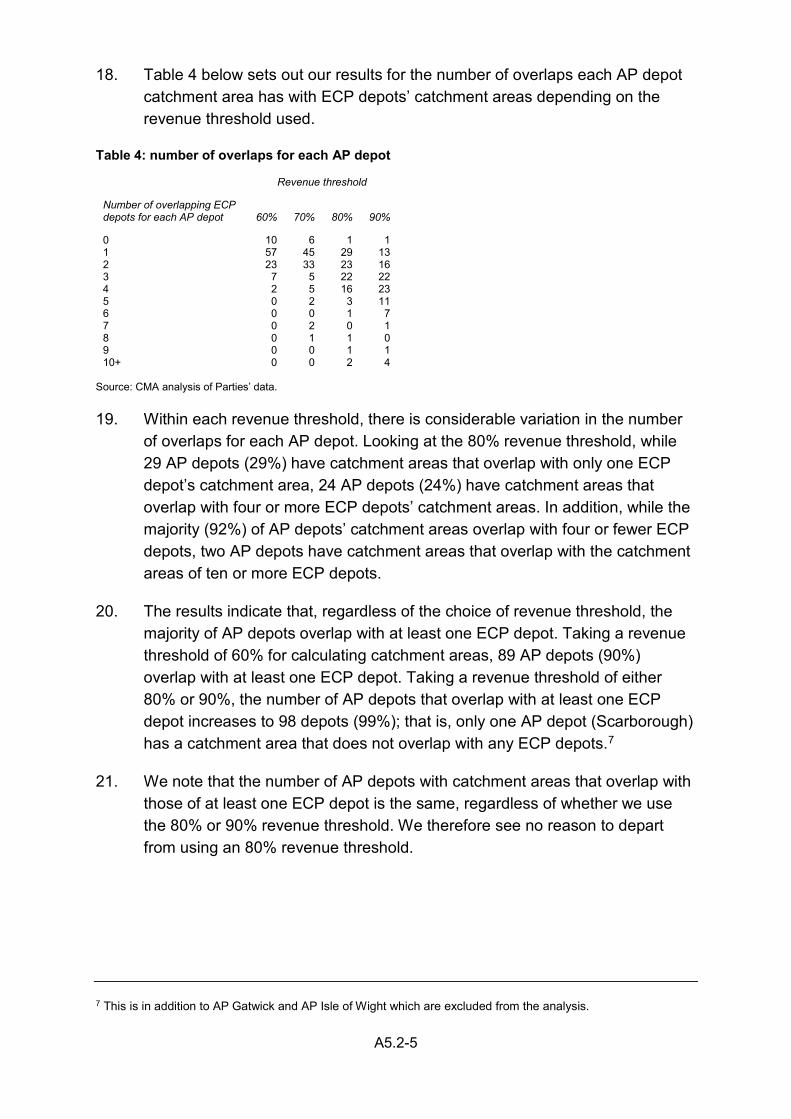
18. Table 4 below sets out our results for the number of overlaps each AP depot catchment area has with ECP depots’ catchment areas depending on the revenue threshold used.
Table 4: number of overlaps for each AP depot
Revenue threshold
Number of overlapping ECP depots for each AP depot 60% 70% 80% 90%
0 10 6 1 1 1 57 45 29 13 2 23 33 23 16 3 7 5 22 22 4 2 5 16 23 5 0 2 3 11 6 0 0 1 7 7 0 2 0 1 8 0 1 1 0 9 0 0 1 1 10+ 0 0 2 4
Source: CMA analysis of Parties’ data. 19. Within each revenue threshold, there is considerable variation in the number
of overlaps for each AP depot. Looking at the 80% revenue threshold, while 29 AP depots (29%) have catchment areas that overlap with only one ECP depot’s catchment area, 24 AP depots (24%) have catchment areas that overlap with four or more ECP depots’ catchment areas. In addition, while the majority (92%) of AP depots’ catchment areas overlap with four or fewer ECP depots, two AP depots have catchment areas that overlap with the catchment areas of ten or more ECP depots.
20. The results indicate that, regardless of the choice of revenue threshold, the majority of AP depots overlap with at least one ECP depot. Taking a revenue threshold of 60% for calculating catchment areas, 89 AP depots (90%) overlap with at least one ECP depot. Taking a revenue threshold of either 80% or 90%, the number of AP depots that overlap with at least one ECP depot increases to 98 depots (99%); that is, only one AP depot (Scarborough) has a catchment area that does not overlap with any ECP depots.7
21. We note that the number of AP depots with catchment areas that overlap with those of at least one ECP depot is the same, regardless of whether we use the 80% or 90% revenue threshold. We therefore see no reason to depart from using an 80% revenue threshold.
7 This is in addition to AP Gatwick and AP Isle of Wight which are excluded from the analysis.
A5.2-6
Using the catchment area analysis to identify the extent of overlap between the Parties’ depots
22. Identifying whether the 80% catchment areas of two depots overlap is a useful starting point, but it is also only a binary test and does not account for the extent of any overlap between the Parties’ depots in a particular area and the extent to which two depots actually compete to supply the same customers. For example, it is possible that some of the depots identified as overlapping compete to only a limited extent. In such cases, any competitive interaction is likely to be more limited than in cases where the catchment areas overlap significantly and two depots supply the same customers.
23. To inform our analysis we have calculated a ‘Sales Overlap Measure’ for each depot. This measure uses the customer location information to calculate the percentage of a depot’s 2016 sales revenue which is derived from customers which are located within the 80% catchment area of the other Party’s depot(s).
24. This measure provides more information than a simple assessment of whether catchment areas overlap.8 Therefore, we have incorporated this measure into our competitive assessment as part of our filtering of local areas (see Section 7 and Appendix 7.1).
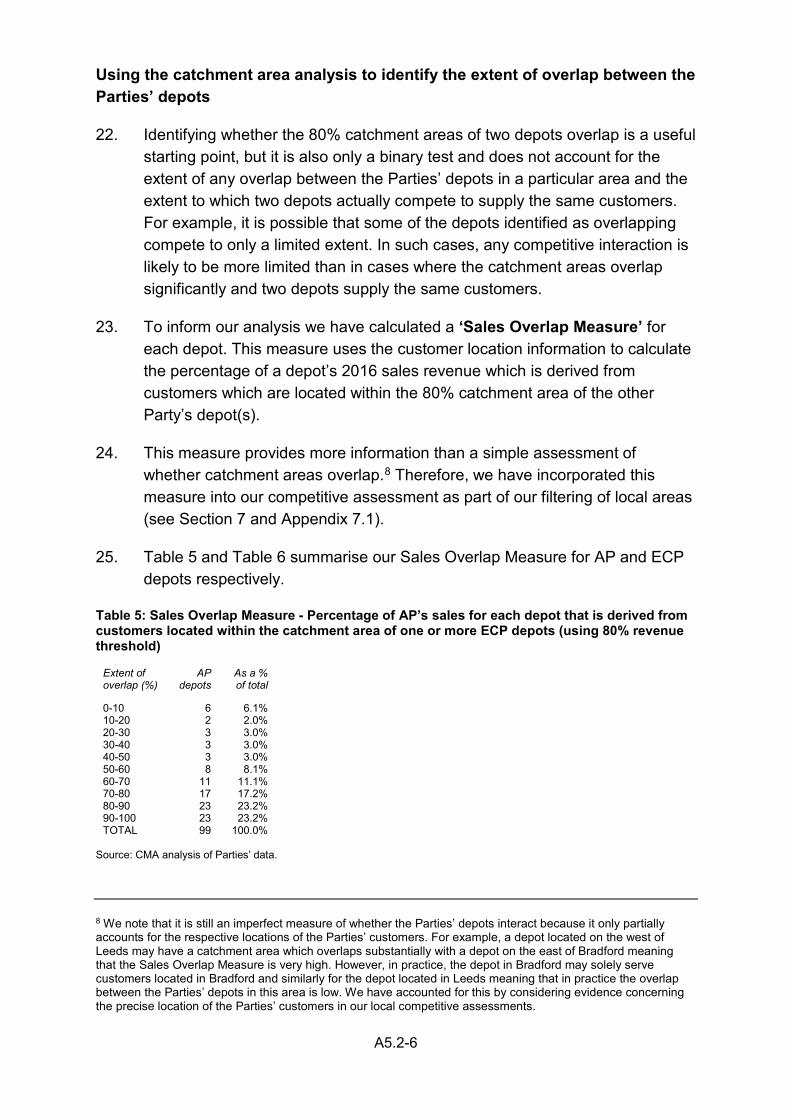
25. Table 5 and Table 6 summarise our Sales Overlap Measure for AP and ECP depots respectively.
Table 5: Sales Overlap Measure - Percentage of AP’s sales for each depot that is derived from customers located within the catchment area of one or more ECP depots (using 80% revenue threshold)
Extent of overlap (%)
AP depots
As a % of total
0-10 6 6.1% 10-20 2 2.0% 20-30 3 3.0% 30-40 3 3.0% 40-50 3 3.0% 50-60 8 8.1% 60-70 11 11.1% 70-80 17 17.2% 80-90 23 23.2% 90-100 23 23.2% TOTAL 99 100.0%
Source: CMA analysis of Parties’ data. 8 We note that it is still an imperfect measure of whether the Parties’ depots interact because it only partially accounts for the respective locations of the Parties’ customers. For example, a depot located on the west of Leeds may have a catchment area which overlaps substantially with a depot on the east of Bradford meaning that the Sales Overlap Measure is very high. However, in practice, the depot in Bradford may solely serve customers located in Bradford and similarly for the depot located in Leeds meaning that in practice the overlap between the Parties’ depots in this area is low. We have accounted for this by considering evidence concerning the precise location of the Parties’ customers in our local competitive assessments.
A5.2-7
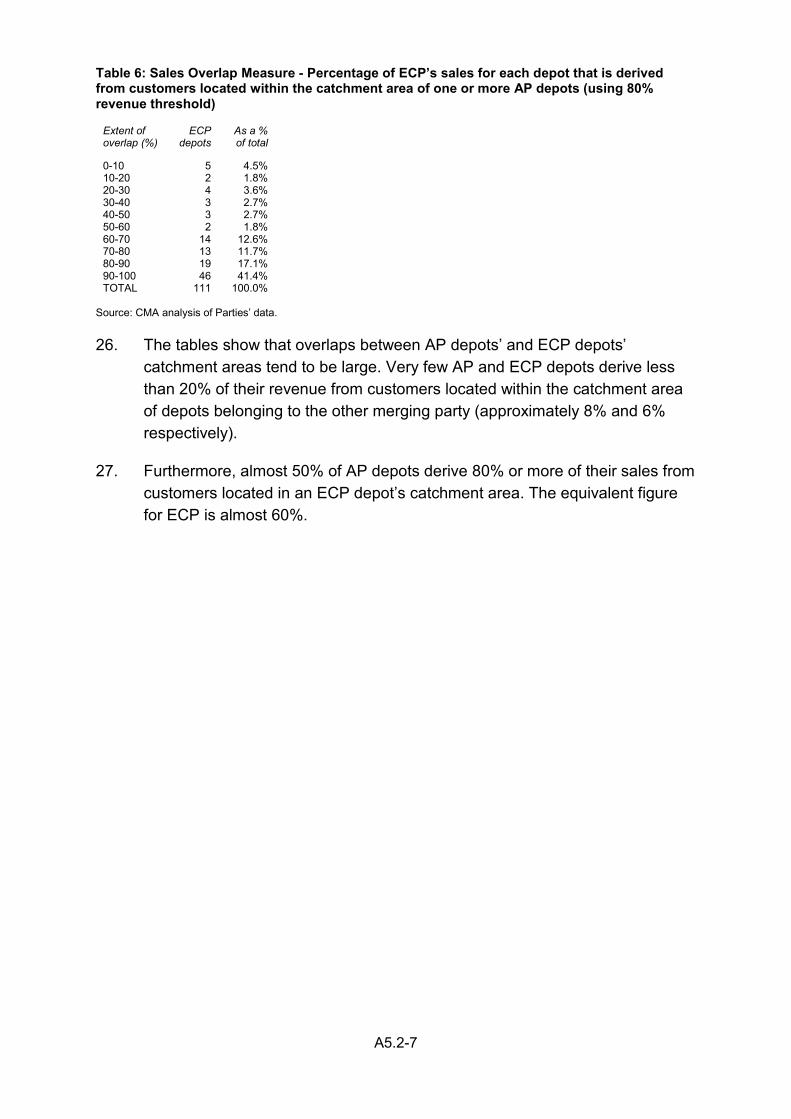
Table 6: Sales Overlap Measure - Percentage of ECP’s sales for each depot that is derived from customers located within the catchment area of one or more AP depots (using 80% revenue threshold)
Extent of overlap (%)
ECP depots
As a % of total
0-10 5 4.5% 10-20 2 1.8% 20-30 4 3.6% 30-40 3 2.7% 40-50 3 2.7% 50-60 2 1.8% 60-70 14 12.6% 70-80 13 11.7% 80-90 19 17.1% 90-100 46 41.4% TOTAL 111 100.0%
Source: CMA analysis of Parties’ data. 26. The tables show that overlaps between AP depots’ and ECP depots’
catchment areas tend to be large. Very few AP and ECP depots derive less than 20% of their revenue from customers located within the catchment area of depots belonging to the other merging party (approximately 8% and 6% respectively).
27. Furthermore, almost 50% of AP depots derive 80% or more of their sales from customers located in an ECP depot’s catchment area. The equivalent figure for ECP is almost 60%.
A6.1-1
APPENDIX 6.1
Likelihood of AP exiting the market
Introduction
1. Our Merger Assessment Guidelines state that, in the context of a firm exiting for reasons of financial failure, consideration is given both to whether the firm is unable to meet its financial obligations in the near future, and to whether it is unable to restructure itself successfully.1
2. In this appendix, we consider evidence supporting our assessment (section 6) of whether it was likely that AP would have continued to operate as a going concern beyond the completion date of the Merger or whether it would have exited the market. This evidence relates to:
(a) AP’s sustainability;
(b) the availability to AP of additional funding; and
(c) the actions taken by AP management to improve AP’s financial position.
3. As part of our assessment, we examined AP’s financial information over five financial years (ie FY12 to FY16) and its internal documents, and spoke to AP’s former shareholders, Phoenix and Endless, AP’s former CEO, Mark Saunders,2 and PwC (acting as the administrators for the seller, ie AP).
AP’s sustainability
4. Given AP’s financial year end was 30 September3 and the Merger was completed on 4 October 2016, AP’s FY16 results reflect a full 12 months of trading before the transfer of AP’s trade and assets to ECP. AP’s historical financial information is set out in further detail in Annex 1 of this Appendix.
1 Paragraph 4.3.14 of the Merger Assessment Guidelines. 2 Mark Saunders joined AP in February 2014 as an interim Chief Operating Officer when Endless co-invested in AP, before being appointed AP’s permanent CEO in February 2015. 3 AP’s reporting financial year-end changed in 2014. However, as requested in our information request, AP prepared all of its historical financial results to a September year-end to enable year-on-year comparisons to be made.
A6.1-2
AP’s historical financial performance
AP’s historical revenues
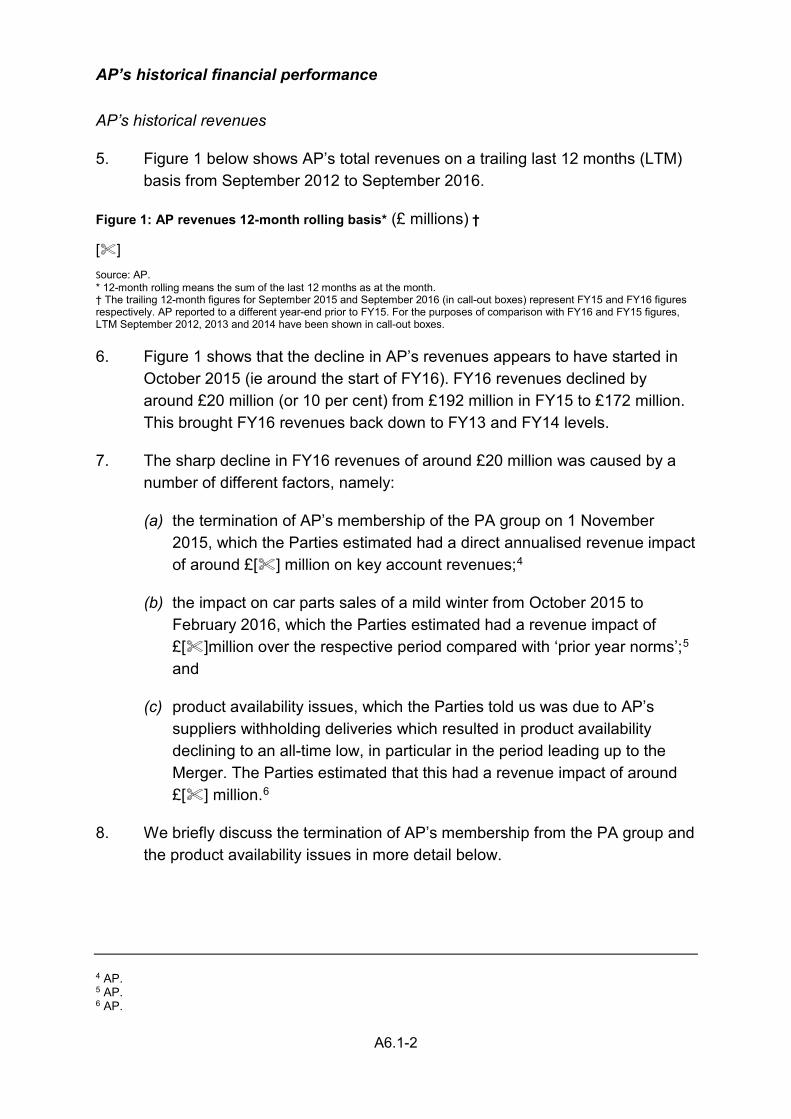
5. Figure 1 below shows AP’s total revenues on a trailing last 12 months (LTM) basis from September 2012 to September 2016.
Figure 1: AP revenues 12-month rolling basis* (£ millions) †
[] Source: AP. * 12-month rolling means the sum of the last 12 months as at the month. † The trailing 12-month figures for September 2015 and September 2016 (in call-out boxes) represent FY15 and FY16 figures respectively. AP reported to a different year-end prior to FY15. For the purposes of comparison with FY16 and FY15 figures, LTM September 2012, 2013 and 2014 have been shown in call-out boxes. 6. Figure 1 shows that the decline in AP’s revenues appears to have started in
October 2015 (ie around the start of FY16). FY16 revenues declined by around £20 million (or 10 per cent) from £192 million in FY15 to £172 million. This brought FY16 revenues back down to FY13 and FY14 levels.
7. The sharp decline in FY16 revenues of around £20 million was caused by a number of different factors, namely:
(a) the termination of AP’s membership of the PA group on 1 November 2015, which the Parties estimated had a direct annualised revenue impact of around £[] million on key account revenues;4
(b) the impact on car parts sales of a mild winter from October 2015 to February 2016, which the Parties estimated had a revenue impact of £[]million over the respective period compared with ‘prior year norms’;5 and
(c) product availability issues, which the Parties told us was due to AP’s suppliers withholding deliveries which resulted in product availability declining to an all-time low, in particular in the period leading up to the Merger. The Parties estimated that this had a revenue impact of around £[] million.6
8. We briefly discuss the termination of AP’s membership from the PA group and the product availability issues in more detail below.
4 AP. 5 AP. 6 AP.
A6.1-3
AP’s departure from the PA group
9. The Parties told us that, after PA acquired GSF in September 2015, it no longer saw a benefit in having AP as an associate member, and served notice on AP that it would terminate AP’s membership of its group as of 1 November 2015.7
10. The importance to AP of its membership of the PA group was highlighted by the former AP CEO, who told us that AP’s membership of the PA group had granted AP ‘access to’ Key Accounts, as well as to the group’s services, which included chasing customer invoices on behalf of its affiliate members. He added that the termination of AP’s membership resulted in a ‘sudden decline’ in Key Account revenues. He told us that, while AP continued to participate in national account tenders, the ‘reality’ was that AP did not have the national coverage to be awarded ‘primary supplier’ status – at best it would be awarded ‘secondary supplier’ status.8 Phoenix also told us that AP’s role in Key Accounts was mostly one of ‘local supply fulfilment’ for a national contract held by PA or another market player.9
Product availability issues
11. In relation to product availability issues, Phoenix told us that AP’s parts suppliers were making credit terms more challenging, and this had the consequence of putting further pressure on AP’s cashflows.10 The former AP CEO told us that AP had started to pay its suppliers late from around October/November 2015 (around the start of FY16).11 The Parties told us that AP was highly dependent on its supplier base, and once its suppliers ‘lost confidence and began to restrict the supply of parts to AP, the business deteriorated rapidly’.12 The Parties told us that availability of ‘fast-moving’ products was particularly poor, which resulted in AP having to source from local ‘in-day’ suppliers at higher prices, which eroded AP’s margins. The Parties added that, as AP’s stock levels declined, its customers were moving away to its competitors, which resulted in a sharp decline in its sales.13
12. The Parties told us that, partly as a result of poor stock availability, AP’s depots were ‘in the habit of price-cutting to try to retain sales’, and that
7 AP. 8 CMA call with Mark Saunders, former AP CEO (16 June 2017). 9 CMA call with Phoenix (16 June 2017). 10 CMA call with Phoenix (16 June 2017). 11 CMA call with Mark Saunders, former AP CEO (16 June 2016). 12 Parties. 13 AP.
A6.1-4
ineffective management controls had meant that any ‘branch staff could sell below product cost’.14
13. AP’s situation with suppliers worsened when, in early September 2016, [] (AP’s largest credit insurer, which provided over £10 million of cover) removed future credit insurance cover for AP. This was followed by the removal of cover by AP’s other main credit insurers. The Parties told us that, without the confidence of the insurance market, AP could not trade effectively unless it obtained significant further investment. The Parties told us that from early September 2016, AP increasingly experienced supply restrictions, particularly from suppliers where insurers had pulled cover.15
14. We considered that the withdrawal of credit insurance cover towards the end of FY16, exacerbated AP’s cashflow pressures and would have presented considerable challenges to AP’s future trading in FY17, making the prospect of a recovery in the near future unlikely.
AP’s historic profitability
15. Based on AP’s Profit and Loss account in Table 1 of Annex 1 of this Appendix, AP’s gross margins in FY16 of [] per cent remained broadly stable on prior year levels of []per cent in FY15 and [] per cent in FY14. However, AP’s FY16 EBITDA performance showed a significant and sharp decline on historical levels, with EBITDA declining from £[] million in FY15 to £[] million in FY16.
16. Figure 2 below shows AP’s LTM EBITDA from September 2012 to September 2016.
Figure 2: AP EBITDA 12-month rolling basis* (£ millions) †
[] Source: AP * 12-month rolling means the sum of the last 12 months as at the month. † The trailing 12-month figures for September 2015 and September 2016 (in call-out boxes) represent FY15 and FY16 figures respectively. AP reported to a different year-end prior to FY15. For the purposes of comparison with FY16 and FY15 figures, LTM September 2012, 2013 and 2014 have been shown in call-out boxes. 17. The Parties told us that AP’s FY16 staff costs increased by around £0.9
million compared with the prior year because of living wage increases on 1 October 2015 and 1 April 2016, which affected just over 40 per cent of AP’s total workforce.16
14 AP. 15 AP. 16 AP.
A6.1-5
18. Whilst there were a number of events during FY16 which had an adverse impact on AP’s revenues and costs, the former AP CEO told us that the main underlying cause of AP’s financial failure could be traced back to AP’s decision to open its national distribution centre in Markham Vale in October 2012, and the poor implementation of its expansion strategy.17 [] told us that, in its opinion, the opening of the national distribution centre in 2012 created an overhead structure for a much larger business.18
19. As part of AP’s expansion plans, AP had opened its Markham Vale national distribution centre and acquired Camberley Auto Factors in 2012, increasing its depot total by 27 to 93, and so extending AP’s reach into the South of England;19 in July 2014, AP acquired 18 depots, three hubs and £[]million of stock out of the administration of Unipart Automotive.20 Furthermore, in March 2016, AP acquired Solid Auto (UK) Ltd, a company specialising in car parts for Asian vehicles, for £[].21
20. [] told us that it understood from anecdotes that the opening of the national distribution centre was part of a wider strategy to grow the number of depots from around 80 to between 150 and 200. It also understood that the acquisition of Camberley Auto Factors did not go to plan post acquisition and the poor performance of AP against this backdrop meant that finding funding for future growth in depots would be difficult. It considered that even if AP could have grown its daily sales rate back to historical levels, it would have struggled to restore EBITDA to historical levels of around £[] million.22
21. The Parties also told us that AP’s attempt to implement a ‘central warehouse strategy’ by setting up its national distribution centre in Markham Vale was a contributing factor to AP entering into administration. The Parties considered that the Markham Vale national distribution centre was too big for AP’s scale and that AP did not have the necessary logistics to support its expansion strategy.23
22. We note that, despite the sharp decline in AP’s FY16 revenues, its overheads in FY16 of £[]million remained broadly in line with prior year overheads of £[]million (see Table 1, Annex 1 of this Appendix), but increased as a percentage of revenues from around [] per cent in FY15 to around [] per cent in FY16.
17 CMA call with Mark Saunders, former AP CEO (16 June 2016). 18 CMA call with [] 19 PwC’s letter to AP’s known creditors (10 October 2016). 20 PwC’s letter to AP’s known creditors (10 October 2016). 21 AP. 22 CMA call with [] 23 Parties.
A6.1-6
23. Of the total overheads figure, the national distribution centre represented a relatively significant proportion, accounting for £[] million in FY16 and £[] million in FY15 (excluding the rebate figures included within the national distribution centre cost line). A large proportion of national distribution centre costs was staff costs, which, as mentioned above, had been adversely affected by the increases in the living wage during FY16.
24. We consider that given AP’s relatively high operational gearing levels, this had made AP’s profits and cashflows particularly vulnerable to a downturn in revenues, as occurred in FY16.
AP’s forecast cash flows
25. Based on AP’s cashflow analysis produced in July 2016, which forecast AP’s cashflows from August to November 2016, AP would have required a cash injection of £4.3 million by early October 2016 and a further £6.9 million by early November 2016 in order to maintain AP’s trading levels without significant ‘on-stop’ activity.24 We note that this total funding requirement of around £11 million by November 2016 did not take into the account the potential adverse impact on AP’s cashflows of the withdrawal of credit insurance cover in September 2016 mentioned above. Therefore, the likely future funding requirement may have been higher.
26. The Parties told us that in August 2016, PwC was brought in to advise AP management on next steps, and that it confirmed the cashflow shortfall and the timeframe for an accelerated sale process.25 We note that PwC’s target completion date for any sale was 5 October 2016, and that this was because of AP’s funding requirement.
27. In the lead-up to October 2016, AP’s total borrowings continued to rise, with AP’s total net debt increasing from around £36 million as at September 2014 to around £66 million as at July 2016 (excluding accrued interest on shareholder loans, as well as vehicle lease creditors of around £3 million and £8 million respectively).26
Availability of additional funding
28. We next considered whether AP could have secured the necessary additional funding from its existing equity and debt investors or from third parties, which
24 AP. 25 AP. 26 []
A6.1-7
would have enabled AP to remain solvent, and possibly to restructure the business to improve its profitability and cashflows.
29. As mentioned above, AP’s cashflow forecasts indicated a total funding gap of around £11 million by November 2016.27
Further investment from equity investors
30. In August 2016, AP management had approached AP’s shareholders, Phoenix and Endless, to secure an additional £[] million of funding to enable a solvent solution to be explored.28
31. Endless told us that, at the start of FY16, AP’s poor trading had already resulted in AP requiring further funding, which Endless and Phoenix provided in late 2015. It added that when AP’s trading did not recover, Endless and Phoenix provided further funding in, or around, June 2016.29 The Parties told us that Phoenix and Endless combined had provided additional funding of £[] million in November 2015 and £[] million in June 2016.30
32. The minutes of AP’s Board meeting in September 2016 noted that, while Phoenix did ‘not have any appetite to explore any further options’ with AP, Endless was ‘prepared to meet’ its proportion of the funding requirement and to work with AP management ‘to explore further options and may be prepared to fund an alternative option’.31
33. Phoenix told us that it had already invested a considerable amount of equity, and that it was no longer in a position to make any additional investment.32
34. The Parties told us, however, that Endless reviewed a potential funding option in August 2016, and ‘analysed a range of potential site footprints’ (ie selected AP depots), and was ‘seeking to find the right balance of new investment alongside a reasonably assured future profit stream’.33
35. Endless told us that it had considered a range of restructuring options around this time, including an option to unwind the national distribution centre and operate AP on a smaller scale. However, it told us that this would have required the existing investors to take significant losses on their existing investments, and required new equity funding estimated at a very significant
27 AP. 28 PwC’s letter to AP’s known creditors (10 October 2016). 29 CMA call with Endless (21 June 2016). 30 AP. 31 AP. 32 CMA call with Phoenix (16 June 2016). 33 AP.
A6.1-8
level from which it was difficult to see a commensurate return, and said that this had made this option unsupportable.34
Further investment from debt investors
36. The Parties told us that AP had in place a principal £50 million working capital facility with PNC.35 As this was an asset-based debt facility, the amount that could be drawn down by AP was dependent on its trading levels, and the Parties told us that based on AP’s historical trading levels, this was effectively a £40 million credit line.36
37. The Parties told us that in August 2016, AP management had explored with PNC the possibility of an additional [] top-up facility.37
38. However, the former AP CEO told us that in the period leading -up to the accelerated sale process, PNC was becoming increasingly concerned by the level of its debt exposure, and that PNC had sought regular updates from AP management both before, and during, the accelerated sale process.38
39. The Parties told us that on 13 September 2016 (a day after the accelerated sale process formally commenced), PNC indicated that it would not provide any ‘over-lending’ on AP’s debt facility, but would instead support the business during the accelerated sale process.39 AP’s Board meeting minutes around this time confirmed that PNC was supportive of the accelerated sale process, eg by allowing AP to make business critical payments,40 and that PNC wanted to achieve the ‘best outcome’ for AP’s creditors.41
Further investment from third-party investors
40. Phoenix told us that in the months leading up to AP going into administration, AP had attempted to raise additional equity or debt from third parties, but had failed to do so. It added that it was clear by the time AP went into administration that AP had exhausted all of its available funding options.42
41. AP’s attempts to raise additional funding from third parties included discussions between AP management and TPG Capital to secure mezzanine
34 CMA call with Endless (21 June 2016). 35 AP. 36 AP. 37 AP. 38 CMA call with Mark Saunders, former AP CEO (16 June 2016). 39 AP. 40 AP. 41 AP. 42 CMA call with Phoenix (16 June 2016).
A6.1-9
debt funding of around £7 million.43 However, the minutes of AP’s Board meeting noted the views of one AP Director that the mezzanine funding option seemed ‘remote’, particularly as it did not in ‘of itself present a solution’.44
42. According to AP’s Board meeting minutes in September 2016, AP management was also exploring a ‘potential strategic tie-up’ with Unipart and Tetrosyl, which could have formed ‘part of a composite’ pre-pack process.45 However, it is clear that these did not materialise.
Sale of AP depots
43. We also noted that, in August and early September 2016, before the accelerated sale process formally commenced on 12 September 2016, AP management had approached a handful of third parties, including MPD and AAG, to sell what AP management described as the ‘lowest performing branches’. The minutes of AP’s Board meetings noted that MPD had put in an ‘indicative offer’ of []for 16 depots and their associated stock (estimated £[]million consideration), and had ‘demonstrated its liquidity position and proof of funds to the sum of £[] million’.46
44. MPD’s ‘indicative offer’ to AP’s management was progressed through to the accelerated sale process (discussed in more detail in Appendix 6.2).
Actions taken by AP’s shareholders and management to restructure the business
45. We considered what actions had been taken by AP’s shareholders and management to improve its financial position, and whether it was likely that AP could have been restructured successfully and remained solvent. We note that some of the attempts by AP management to secure additional funding mentioned above would also be relevant to whether AP could have been restructured.
46. The Parties told us that, at around the time Endless came on board in February 2014, AP had been experiencing financial difficulties towards the end of 2013 and early 2014. This led to the restructuring that resulted in Endless co-investing in AP alongside Phoenix.47 Endless told us that, when it
43 AP. 44 AP. 45 AP. 46 AP. 47 AP.
A6.1-10
invested in AP in March 2014, it was at a time when AP was close to failing financially.48
47. Endless told us that it specialised in investing in distressed and turnaround situations, and that, when it became involved, it first sought to build a ‘credible management team’ and restore AP’s stock availability levels.49 Phoenix told us that, following Endless’s investment, management changes were made to bring in management with experience of business turnarounds.50 The former AP CEO added that Endless sought to stabilise AP’s business, and return the business to a position where it would no longer be ‘haemorrhaging cash’.51
48. AP’s FY15 revenues and EBITDA showed a considerable improvement on prior year levels, eg EBITDA increased from £[]million in FY14 to £[] million in FY15 (see Table 1, Annex 1 of this Appendix). The Parties told us that FY15 total revenues increased by 12 per cent on prior year to £192 million, with independent aftermarket car part sales up 13 per cent. The Parties added that Key Account sales also grew significantly, as a result of AP’s relationship with the PA group.52
49. However, the former AP CEO told us that, whilst on the face of it FY15’s revenue and EBITDA performance looked like an improvement on prior year, AP’s underlying performance was distorted by its acquisition of Unipart’s depots.53 Endless also told us that AP’s acquisition of depots from the insolvency of Unipart Automotive in 2014, and the associated purchase of stock at a low value, created one-off profits on sale of this stock, and disguised the fact that AP’s underlying business was still ‘struggling’.54
50. Whilst the significant decline in AP’s FY16 revenues was largely caused by events that took place during that financial year, we consider that AP’s overheads cost base was a significant contributing factor to AP’s poor FY16 EBITDA (and in turn, its cashflow) performance. This supports the views of the Parties, [] and the former AP CEO that the cost base associated with the national distribution centre was unsustainable and unsuited for the size of business AP was operating at the time.55 We consider that any business restructuring would, at least, have needed to address AP’s overheads cost
48 CMA call with Endless (21 June 2016). 49 CMA call with Endless (21 June 2016). 50 CMA call with Phoenix (16 June 2016). 51 CMA call with Mark Saunders, former AP CEO (16 June 2016). 52 AP. 53 CMA call with Mark Saunders, former AP CEO (16 June 2016). 54 CMA call with Endless (21 June 2016). 55 Parties, CMA calls with [] and Mark Saunders, former AP CEO (16 June 2016).
A6.1-11
base, or expand the business to ensure that the national distribution centre could be utilised efficiently.
51. The Parties told us that a ‘Strategic Options’ paper was presented before the AP Board in March/April 2016, which set out three options:56
(a) Low-capital plan: whereby AP would ‘trade-on’ with an ‘incremental strategy of growth’, supported by a combination of internal cash generation and potentially, an asset-based loan. The Parties told us that this option entailed a number of risks, including losing market position and management/staff engagement.
(b) Funded expansion plan: whereby AP would grow its depot footprint to more than 160 depots, by organically opening new depots and/or acquiring other small/medium-sized motor factors. The estimated cost of this option was around £40 million, on top of an increase in an asset-based loan.
(c) Exit plan: a sale of AP.
52. The Parties told us that the ‘Strategic Options’ paper recommended the ‘Exit plan’, given the level of interest from potential purchasers, and because the timing seemed ‘right’ from a ‘trading perspective’.57
53. Phoenix told us that, during the Summer of 2016, AP management had embarked on a cost-cutting exercise, but added that these actions were insufficient to stop or reverse AP’s deteriorating financial position.58
54. In the months leading up to AP’s additional funding requirement in October 2016, AP management pursued a number of different options outlined above (including seeking potential new investors), in addition to a sale of the business. Even as late as 5 September 2016 (around a week before the accelerated sale process formally commenced), AP management agreed that ‘planned insolvency or an accelerated sales process should be considered as a ‘contingency plan’, while various options were still being explored’.59 Furthermore, the AP Board agreed to continue to explore ‘alternative options’ in parallel with the accelerated sale process.60
56 [] 57 AP. 58 CMA call with Phoenix (16 June 2016). 59 AP. 60 AP.
A6.1-12
55. As late as 20 September 2016 (a day before the accelerated sale process deadline for indicative bids), AP management was still exploring the possibility of whether a ‘solvent solution’ was available. The AP Board meeting minutes of 20 September 2016 noted that if ‘no solvent solution appeared to be deliverable’, AP management would discuss with PNC whether it would make funds available to allow certain stock purchases to be made to preserve value in the business pending conclusion of any sale process.61
56. Finally, in a letter to AP’s creditors on 10 October 2016 (after the sale to ECP was concluded), PwC set out why an accelerated sale was in the best interests of creditors and had been the preferred option over a number of alternatives:62
(a) No action: PwC stated that, given AP’s increasing cash difficulties and precipitative action by unpaid creditors, continuing to trade would almost inevitably have to winding up petitions being filed by creditors, and AP entering ‘compulsory liquidation’.
(b) Trading in administration: this option would involve AP continuing to trade, but with a sale of the business taking place later, which might enhance net realisations. However, PwC stated that AP had already explored all reasonable options, and that there was little prospect of finding a buyer that might offer a price significantly more than ECP’s offer. It added that this option would also incur additional professional costs, potential duress payments to critical suppliers, and continuing losses.
(c) Liquidation (or immediate closure): this option would have led to an immediate cessation of trade, which PwC stated would not result in maximising recoveries of trade debtors and stock, and would result in significant preferential claims from employees.
(d) Company Voluntary Arrangement: assuming an agreement could be reached with at least 75 per cent of creditors, this option would have led to a legally binding agreement with creditors. However, PwC stated that the increasing cash pressures facing the business, the lack of additional sources of funding to enable AP to continue trading and the time required to implement a Company Voluntary Arrangement, would have made this an option unviable.
57. PwC also told us that, absent the Merger, it would have sought to transact with one or both of the alternative purchasers (ie PA and MPD), and that
61 AP. 62 PwC’s letter to AP’s known creditors (10 October 2016).
A6.1-13
those sites which could not be sold through these transactions would have been likely to have been required to be sold out of administration on a break-up basis. It added that it was unlikely that any unsold depots would have remained in the market as it was unlikely that it would have sought to continue to trade from the unsold depots in administration, as a decision to continue trading would have incurred considerable additional costs and potential losses (similar to those detailed above under the ‘Trading in administration’ option), and resulted in the crystallisation of significant additional creditor liabilities.63
63 Letter from PwC to CMA (15 June 2017).
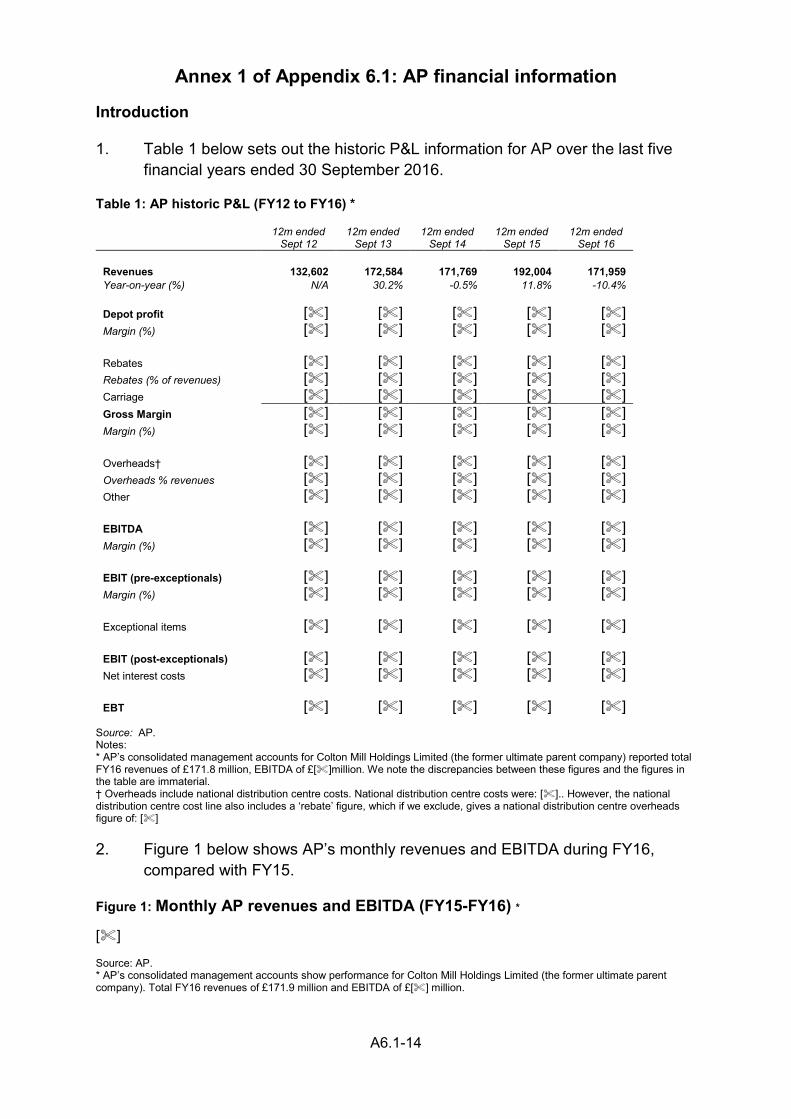
A6.1-14
Annex 1 of Appendix 6.1: AP financial information
Introduction
1. Table 1 below sets out the historic P&L information for AP over the last five financial years ended 30 September 2016.
Table 1: AP historic P&L (FY12 to FY16) *
12m ended
Sept 12 12m ended
Sept 13 12m ended
Sept 14 12m ended
Sept 15 12m ended
Sept 16
Revenues 132,602 172,584 171,769 192,004 171,959 Year-on-year (%) N/A 30.2% -0.5% 11.8% -10.4%
Depot profit [] [] [] [] [] Margin (%) [] [] [] [] []
Rebates [] [] [] [] [] Rebates (% of revenues) [] [] [] [] [] Carriage [] [] [] [] [] Gross Margin [] [] [] [] [] Margin (%) [] [] [] [] []
Overheads† [] [] [] [] [] Overheads % revenues [] [] [] [] [] Other [] [] [] [] []
EBITDA [] [] [] [] [] Margin (%) [] [] [] [] []
EBIT (pre-exceptionals) [] [] [] [] [] Margin (%) [] [] [] [] []
Exceptional items [] [] [] [] []
EBIT (post-exceptionals) [] [] [] [] [] Net interest costs [] [] [] [] []
EBT [] [] [] [] []
Source: AP. Notes: * AP’s consolidated management accounts for Colton Mill Holdings Limited (the former ultimate parent company) reported total FY16 revenues of £171.8 million, EBITDA of £[]million. We note the discrepancies between these figures and the figures in the table are immaterial. † Overheads include national distribution centre costs. National distribution centre costs were: [].. However, the national distribution centre cost line also includes a ‘rebate’ figure, which if we exclude, gives a national distribution centre overheads figure of: [] 2. Figure 1 below shows AP’s monthly revenues and EBITDA during FY16,
compared with FY15.
Figure 1: Monthly AP revenues and EBITDA (FY15-FY16) *
[]
Source: AP. * AP’s consolidated management accounts show performance for Colton Mill Holdings Limited (the former ultimate parent company). Total FY16 revenues of £171.9 million and EBITDA of £[] million.
A6.2-1
Appendix 6.2
Alternative purchasers of AP or its assets
Introduction
1. In this appendix, we set out evidence relevant to our assessment (set out in section 6) of whether, absent the Merger, the most likely outcome for a depot would have been: (a) an acquisition by an alternative purchaser; or (b) exit from the local area.
Relevant background information on the accelerated sale process
2. AP’s forecast cashflows indicated that it would run out of cash in early October 2016, and PwC told us that, a funding solution therefore needed to be put in place by then. It also told us that on 12 September 2016, the AP Board, having taken advice, concluded that it would have to start a sale process immediately to have any prospect of concluding that process by the first week in October 2016.1
3. The accelerated sale process began on 12 September 2016, managed by PwC. PwC sought interest from over 40 trading businesses located in the UK and elsewhere, and a number of private equity houses.
4. PwC told us that 21 September 2016 was given as a deadline for indicative bids, and that by 21 September 2016, the only bids received were for AP’s trade and assets. PwC said that, at the time of the indicative bids, it was ‘already clear that there were going to be no bids that would have resulted in a sale of the equity (ie AP shares) and a resolution of the funding problem’. PwC told us that, accordingly, Notices of Intention to appoint administrators were filed by AP’s Directors on 22 September 2016, and that these notices expired on 5 October 2016. It told us that this drove the timetable for the completion of the transaction and appointment of administrators.2
5. Only ECP made an offer for substantially the whole of AP, whilst PA offered to acquire 39 depots and MPD offered to acquire 23 depots. Nine of the depots that PA and MPD offered to acquire overlapped, ie a total of 53 depots were bid for by either PA or MPD. Neither PA nor MPD put in a bid to acquire the head office or the national distribution centre.3
1 Letter from PwC to the CMA (7 July 2017). 2 Letter from PwC to the CMA (7 July 2017). 3 Parties’ non-confidential response to the Issues Statement.
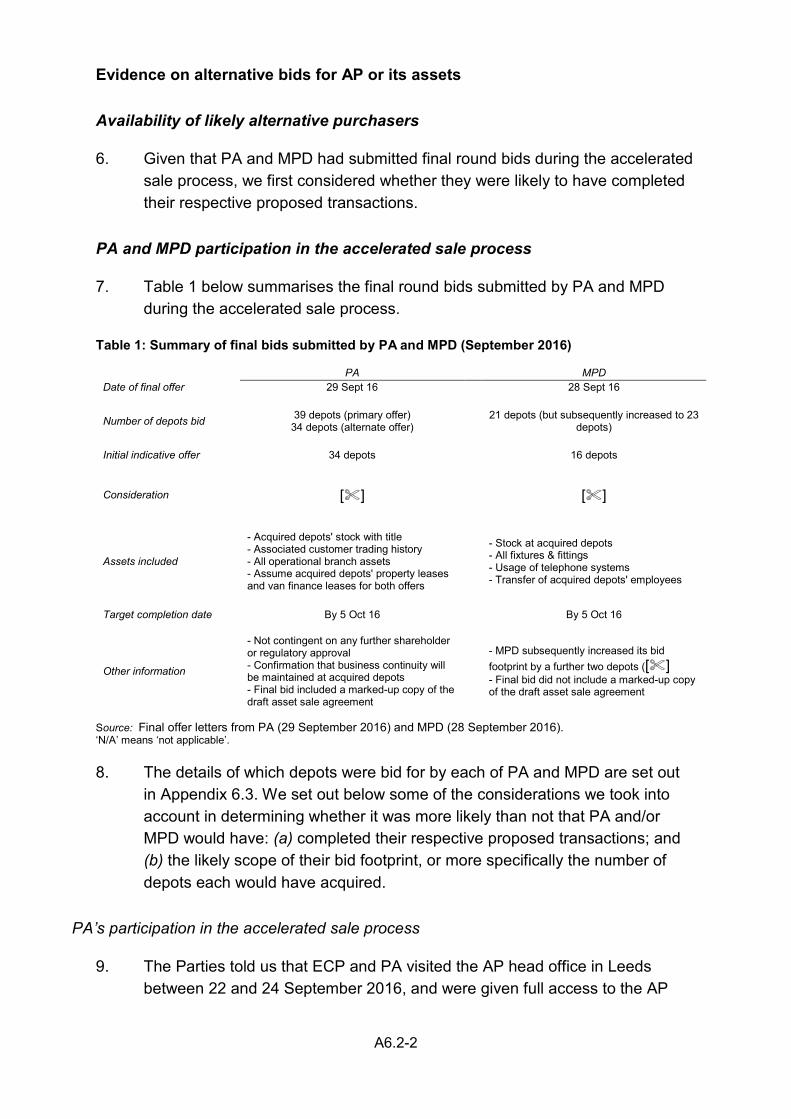
A6.2-2
Evidence on alternative bids for AP or its assets
Availability of likely alternative purchasers
6. Given that PA and MPD had submitted final round bids during the accelerated sale process, we first considered whether they were likely to have completed their respective proposed transactions.
PA and MPD participation in the accelerated sale process
7. Table 1 below summarises the final round bids submitted by PA and MPD during the accelerated sale process.
Table 1: Summary of final bids submitted by PA and MPD (September 2016) PA MPD Date of final offer 29 Sept 16 28 Sept 16
Number of depots bid 39 depots (primary offer) 34 depots (alternate offer)
21 depots (but subsequently increased to 23 depots)
Initial indicative offer 34 depots 16 depots
Consideration [] []
Assets included
- Acquired depots' stock with title - Associated customer trading history - All operational branch assets - Assume acquired depots' property leases and van finance leases for both offers
- Stock at acquired depots - All fixtures & fittings - Usage of telephone systems - Transfer of acquired depots' employees
Target completion date By 5 Oct 16 By 5 Oct 16
Other information
- Not contingent on any further shareholder or regulatory approval - Confirmation that business continuity will be maintained at acquired depots - Final bid included a marked-up copy of the draft asset sale agreement
- MPD subsequently increased its bid footprint by a further two depots ([] - Final bid did not include a marked-up copy of the draft asset sale agreement
Source: Final offer letters from PA (29 September 2016) and MPD (28 September 2016). ‘N/A’ means ‘not applicable’. 8. The details of which depots were bid for by each of PA and MPD are set out
in Appendix 6.3. We set out below some of the considerations we took into account in determining whether it was more likely than not that PA and/or MPD would have: (a) completed their respective proposed transactions; and (b) the likely scope of their bid footprint, or more specifically the number of depots each would have acquired.
PA’s participation in the accelerated sale process
9. The Parties told us that ECP and PA visited the AP head office in Leeds between 22 and 24 September 2016, and were given full access to the AP
A6.2-3
management team to respond to any detailed questions, as well as having full access to AP’s data room from mid-September onwards.4
10. PA told us that it typically acquired depots in locations where it was not yet present, and that its interest in the selected AP’s depots was related to its ‘appetite’ for winning more national accounts.5 In its final offer letter to PwC dated 29 September 2016, PA stated that ‘the acquisition of the branches’ that formed part of its offer, ‘would be an expansion’ of its ‘branch network’.6 PA also told us that, given its ‘working assumption’ that AP would be sold to more than one buyer, it had only made a bid for the 39 depots it considered ‘most attractive’ in the context of how these depots would have complemented its existing depot network.7 PA did not put in an offer for AP’s head office or national distribution centre.8
11. PA told us that, had it been approached to increase its offer, it would have had the ‘appetite’ to acquire additional depots to ‘get the deal done’.9 However, PA was unable to be specific about which additional depots it would have considered in any increased footprint bid.
MPD’s participation in the accelerated sale process
12. PwC told us that, on commencement of its engagement to run a sales process, it was informed by AP’s Chairman that conversations with MPD with regard the sale of certain depots were already underway, and that MPD had expressed an interest in 16 depots on 9 September 2016. They added that MPD had provided proof of funding to the AP Chairman, indicating funds available of around £[] million.10
13. PwC told us that it became involved in discussions with MPD on 22 September 2016 and, on 23 September 2016, MPD was provided with a draft ‘Sale Agreement’ and ‘Licence to occupy’ (ie in respect of AP’s properties) to consider as part of the bidding process. It added that MPD was given access to the data room on 25 September 2016, and received an Information Memorandum on 26 September 2016. PwC told us that a final offer was received on 28 September 2016 to purchase 21 sites, with a further two sites bid for on 30 September 2016.11
4 AP. 5 PA (14 December 2016). 6 PA final offer letter to PwC (29 September 2016). 7 CMA call with PA (15 June 2017). 8 PA final offer letter to PwC (29 September 2016). 9 CMA call with PA (15 June 2017). 10 Letter from PwC to the CMA (7 July 2017). 11 Letter from PwC to the CMA (7 July 2017).
A6.2-4
14. PwC told us that, on 29 September 2016, it approached MPD to explain that of the 21 bid sites, eight overlapped with at least one competing offer, and invited: (a) an offer of a higher value for the eight ‘overlapping sites’; and (b) an offer for additional sites. PwC also told us that MPD responded on 30 September 2016 noting: (a) no movement in the offer value; and (b) a willingness to purchase two additional sites.12 These two additional sites were [].13
15. PwC told us that:14
(a) on 1 October 2016, it wrote to MPD noting that the offer put forward from MPD would ‘not be sufficient in isolation (by value or number of depots) and would require a number of other depots to be purchased by other parties’; and
(b) on 5 October 2016, it informed MPD that its bid was unsuccessful.
16. MPD told us that it operated 11 regional hubs, which also operated as depots. It told us that each regional hub services around eight to ten depots, and that the AP depots it had bid for could be supplied by its existing regional hubs. It also told us that the depots it had bid for would enable it to increase its presence in the South of England.15
17. MPD told us that, of the 23 depots it had bid for, only two depots, namely [], overlapped with its own depot in each area. It added that if it had acquired all 23 depots, it would have closed [], and transferred the sales of the closed depot to the nearby depot.16
18. MPD also told us that it would have funded the acquisition out of existing funds, and that it would have bid for more depots if it had been required to do so.17 However, MPD was unable to specify how many, or which, additional depots it might have bid for.
19. MPD told us that it had the following sources of funds immediately available to it:18
(a) it had access to cash of [] (from its shareholder); and
12 Letter from PwC to the CMA (7 July 2017). 13 PwC’s e-mail to the CMA (19 July 2017). 14 Letter from PwC to the CMA (7 July 2017). 15 CMA call with MPD (23 June 2017) 16 CMA call with MPD (17 July 2017). 17 CMA call with MPD (23 June 2017). 18 CMA call with MPD (23 June 2017).
A6.2-5
(b) based on the unencumbered portion of its existing debtor book, it could have drawn down a []on its existing invoice discounting facility.
20. In relation to other (less immediate) sources of funding, MPD told us that it could have raised significant additional funding against its shareholders’ property assets (valued at [], with current borrowings of []); and its lender had recently indicated that it was prepared to offer to part fund any acquisition of additional stock.19
21. MPD also explained that:20
(a) it did not bid for AP’s Leeds head office (which would only have been necessary if it had been bidding for all of AP’s depots); and
(b) it did not wish to acquire the national distribution centre as it believed that this had been part of the reason for AP’s financial failure.
22. We note that the former AP CEO considered both PA and MPD to be ‘credible bidders’, but added that MPD would not have been a credible bidder for the whole of AP. He explained that MPD was ‘privately owned’, and was ‘too small’ to acquire the whole of AP.21 We also note that MPD had in the past acquired depots in distressed sale processes. MPD told us that it had acquired five motor factors (a total of around 50 depots) over the last five years, and had acquired a similar number of depots in a single transaction as its proposed AP transaction.22
Other alternative purchaser candidates
23. In relation to whether it was possible for PwC to extend its accelerated sale process deadline to allow for more time to find other potential purchasers, PwC told us that, whilst there was no statutory deadline within which to find a purchaser in the accelerated sale process, the target for completion of 5 October 2016 was a result of the serious nature of AP’s financial position. It told us that any sale had to be completed by that date, ie before the company became insolvent and unable to pursue its commercial activities. It added that the Notice of Intention to Appoint Administrators (and with it the moratorium protecting the assets of AP from creditor action) expired on 5 October 2016.23
19 CMA call with MPD (23 June 2017). 20 CMA call with MPD (23 June 2017). 21 CMA call with Mark Saunders, former AP CEO (16 June 2017). 22 CMA call with MPD (23 June 2017). 23 CMA call with PwC (27 June 2017).
A6.2-6
24. We reviewed the Parties’ submissions, AP’s Board meeting minutes and contacted Phoenix, Endless, the former AP CEO, PwC and a selection of third parties which had engaged in the previous AP sales processes. On the basis of that review and those contacts, we established a shortlist of possible alternative purchaser candidates. This shortlist was based on the level of their past engagement in one or more of AP’s sale processes since late 2014. The shortlist comprised (other than PA and MPD discussed above): AAG, Halfords, and Marubeni.
25. We consider the evidence on each of these additional alternative purchaser candidates in turn below.
AAG as an alternative purchaser candidate
26. PwC told us that on 15 September 2016, it had contacted AAG in relation to its possible participation in the accelerated sale process, and that AAG declined to participate.24 [].25
27. AAG told us that it had been involved in two sets of discussions in the past to acquire AP: first, during the sale process run by William Blair for the whole of AP in mid-2016, and second, in August 2016 when AP management offered to sell it 36 depots:26
(a) [].27
(b) In relation to the 36 depots it was offered by AP management in August 2016, AAG told us that only seven of these were ‘mature’ AP depots, and that it would not have bid for these seven depots, as: (i) their geographical locations were not complementary to its existing portfolio; and (ii) the offered depots were performing ‘poorly’ in terms of their daily sales rates.28
28. AAG [].29
Halfords as an alternative purchaser candidate
29. Halfords told us that in the first half of 2016, it had rejected pursuing an acquisition of AP on the grounds that there was an insufficiently compelling strategic reason to do so. Halfords told us that an acquisition of AP would
24 PwC’s e-mail to the CMA (19 July 2017), ‘Interested parties control sheet’ 25 CMA call with the AAG (3 July 2017). 26 CMA call with the AAG (3 July 2016). 27 CMA call with the AAG (3 July 2016). 28 CMA call with AAG (10 April 2017). 29 CMA call with AAG (10 April 2017).
A6.2-7
have represented a vertical acquisition of an upstream activity for its autocentres business, and that as part of its own due diligence, it commissioned Boston Consulting Group to undertake a strategic review of AP’s market.30 This report concluded that whilst Halfords could realise ‘substantial synergies’ by acquiring AP (eg ‘buying synergies), the aftermarket car parts market was not particularly attractive, eg experiencing low growth with low wholesaler margins, and that acquiring AP was not required to protect Halford’s ‘B2C’ (autocentres) business.31
30. Halfords also told us that in September 2016, it was approached by PwC in relation to a ‘distressed sale’ of AP.32
31. We note that Halfords was initially among the ‘three strongest options’ mentioned in the minutes of AP Board meeting on 20 September 2016 (a day before indicative bids were due), alongside ECP and PA, and that Halfords was described as having been interested in an ‘equity deal’ (ie a share purchase transaction).33 However, Halfords did not submit an indicative bid.
Marubeni as an alternative purchaser candidate
32. Marubeni told us that it had been interested in acquiring AP since September 2015, and had engaged in the William Blair-run sale process at the time. However, it told us that it did not submit an indicative bid, and by the time it was approached by PwC to participate in the accelerated sale process, it was no longer interested in the opportunity.34
33. The minutes of AP’s Board meeting on 26 August 2016 noted that Marubeni would have needed four to five months to complete any transaction, and that a sale to Marubeni was ‘not a particularly strong option for [AP] to pursue given its current cashflow forecasts’. The minutes further noted that this transaction looked ‘increasingly less deliverable, particularly given the recent downturn in [AP’s] trading’.35
34. The Parties also told us that negotiations with Marubeni had reached the stage of a ‘pre-offer’ that was ‘still subject to layers of internal Marubeni approval’, and that it was ‘clear that Marubeni would not be able to complete until January 2017’, which would have been too late.36
30 CMA call with Mark Saunders, former AP CEO (16 June 2017). 31 Halfords submission, ‘Boston Consulting Group presentation ‘Project Panther’, 16 June 2016. 32 CMA call with Mark Saunders, former AP CEO (16 June 2017). 33 AP. 34 CMA call with Marubeni (16 June 2016). 35 AP. 36 AP.
A6.2-8
Post-transaction issues in relation to the AP depots
35. We considered whether, absent the Merger, the post-transaction issues and investment requirement in relation to the AP depots highlighted by ECP would have made it likely that PA and/or MPD would have closed the depots they had acquired, rather than make the necessary investment.
Parties’ views
36. ECP told us that it had had to incur additional costs in relation to issues which only came to light after completion, and believed that these issues called into question whether the alternative partial bids from PA and MPD could actually have materialised in reality:37
(a) Stock issues: it had to invest an additional £[] million consideration over the purchase price just to ensure continuity of supply because the AP stock had not been paid for, ie Retention of Title (RoT) issues; and
(b) Vehicle repossession: it had to invest an additional £[] million to acquire vehicles at risk of repossession.
37. ECP told us that on top of the £[]million it had paid for the AP business, a subsequent cash infusion of around £[] million was required or around £[] per depot (ie £[] million divided by 101 depots) to make the AP depots viable post-transaction.38
38. In relation to PA, ECP told us that it was not clear that PA would have been willing to close the transaction once it learned of the lack of inventory, RoT claims, and issues with the vehicle fleet. It told us that PA would have had to invest nearly £[] million (or £[]multiplied by 39 depots) on top of the purchase price to bring the 39 AP depots it would have acquired to a ‘satisfactory trading position’.39
39. In relation to MPD, ECP told us that MPD could not have financed the investment necessary to make AP viable. It told us that:40
(a) MPD would have needed to spend around £[] million41 to resolve the issues at the 21 depots for which it had bid (based on its final offer letter), and that it was ‘not credible’ to suggest that MPD could have raised those
37 ECP. 38 ECP. 39 ECP. 40 ECP. 41 ECP calculated the £[]million required for the 21 depots bid for by MPD based on its post-transaction cash infusion of around £[] per depot, or £[]million divided by the 101 depots it had acquired (source: ECP).
A6.2-9
sums based on its balance sheet, and therefore the assets would most likely have been returned to the administrators.
(b) MPD’s financial position appeared to be relatively weak based on its accounts for the year to 31 December 2015: (i) its cash balance on 31 December 2015 was £48,000; (ii) it had total net assets of £6.5 million; and (iii) its profits for the year was £830,000.
(c) It was difficult to see how MPD would have been able to fund around £[] per depot (in addition to the purchase price) that ECP had found necessary to deal with the issues it discovered on taking ownership of the assets. It added that MPD would have needed to assume significant additional debt or carried out equity financing in order to make this possible. It also told us that, given that the AP assets were loss making, it was more likely that MPD would have handed the assets back to the administrators.
Other evidence on post-transaction issues
40. PA and MPD told us that they had budgeted significant additional investments into replenishing stock at AP depots post-completion: (i) PA had budgeted a significant amount of around £[] million of additional investment; and (ii) MPD had budgeted around £[] million of additional investment.
41. PA also told us that its £[] million offer for 39 depots reflected the ‘distressed nature’ of the business, and added that it did not separately value the stock. It told us that any additional RoT issue would not have lowered its consideration which it offered.42
42. MPD told us that some of the AP stock would have been obsolete, so there would have been no value in that stock. It added that it was difficult to estimate the scale of any RoT issues, but that this was a risk that any acquirer would normally take on when making an offer in a distressed sale. It also told us that in relation to resolving any RoT issues, there was normally the option of negotiating with suppliers.43
43. [] told us that, in terms of resolving RoT issues, there were a number of ways to work with suppliers while maintaining a good working relationship, including the negotiation of a ‘stock cleanse’, negotiating future volume agreements, and/or a time extension to make future cash payments.44
42 CMA call with PA (15 June 2016). 43 CMA call with MPD (23 June 2017). 44 CMA call with [market competitor] []
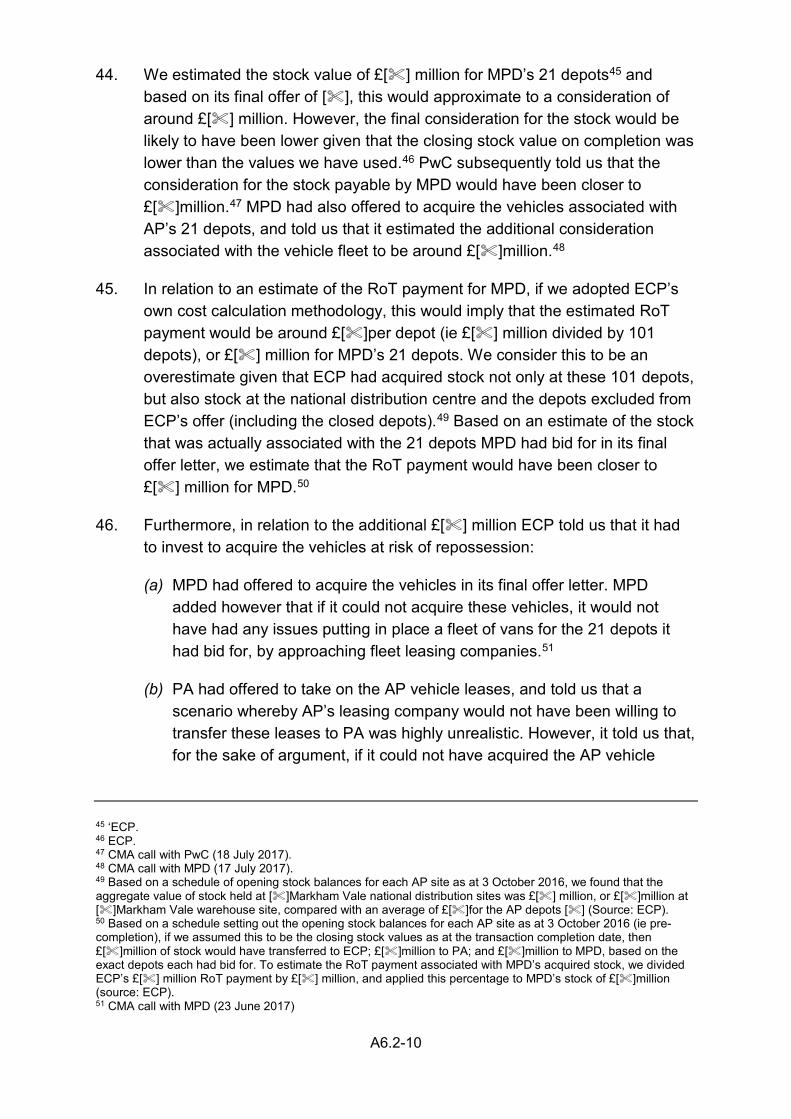
A6.2-10
44. We estimated the stock value of £[] million for MPD’s 21 depots45 and based on its final offer of [], this would approximate to a consideration of around £[] million. However, the final consideration for the stock would be likely to have been lower given that the closing stock value on completion was lower than the values we have used.46 PwC subsequently told us that the consideration for the stock payable by MPD would have been closer to £[]million.47 MPD had also offered to acquire the vehicles associated with AP’s 21 depots, and told us that it estimated the additional consideration associated with the vehicle fleet to be around £[]million.48
45. In relation to an estimate of the RoT payment for MPD, if we adopted ECP’s own cost calculation methodology, this would imply that the estimated RoT payment would be around £[]per depot (ie £[] million divided by 101 depots), or £[] million for MPD’s 21 depots. We consider this to be an overestimate given that ECP had acquired stock not only at these 101 depots, but also stock at the national distribution centre and the depots excluded from ECP’s offer (including the closed depots).49 Based on an estimate of the stock that was actually associated with the 21 depots MPD had bid for in its final offer letter, we estimate that the RoT payment would have been closer to £[] million for MPD.50
46. Furthermore, in relation to the additional £[] million ECP told us that it had to invest to acquire the vehicles at risk of repossession:
(a) MPD had offered to acquire the vehicles in its final offer letter. MPD added however that if it could not acquire these vehicles, it would not have had any issues putting in place a fleet of vans for the 21 depots it had bid for, by approaching fleet leasing companies.51
(b) PA had offered to take on the AP vehicle leases, and told us that a scenario whereby AP’s leasing company would not have been willing to transfer these leases to PA was highly unrealistic. However, it told us that, for the sake of argument, if it could not have acquired the AP vehicle
45 ‘ECP. 46 ECP. 47 CMA call with PwC (18 July 2017). 48 CMA call with MPD (17 July 2017). 49 Based on a schedule of opening stock balances for each AP site as at 3 October 2016, we found that the aggregate value of stock held at []Markham Vale national distribution sites was £[] million, or £[]million at []Markham Vale warehouse site, compared with an average of £[]for the AP depots [] (Source: ECP). 50 Based on a schedule setting out the opening stock balances for each AP site as at 3 October 2016 (ie pre-completion), if we assumed this to be the closing stock values as at the transaction completion date, then £[]million of stock would have transferred to ECP; £[]million to PA; and £[]million to MPD, based on the exact depots each had bid for. To estimate the RoT payment associated with MPD’s acquired stock, we divided ECP’s £[] million RoT payment by £[] million, and applied this percentage to MPD’s stock of £[]million (source: ECP). 51 CMA call with MPD (23 June 2017)

A6.2-11
leases, this would not have been a ‘deal breaker’, as it would have had plenty of opportunities with alternative leasing providers to put a vehicle fleet in place, and added that this could have been done in a matter of hours. It added that, in the very unlikely event that even this could not be done in a short space of time, it would have gone to a fleet rental company, such as Hertz, as a temporary measure.52
52 CMA call with PA (17 July 2017).
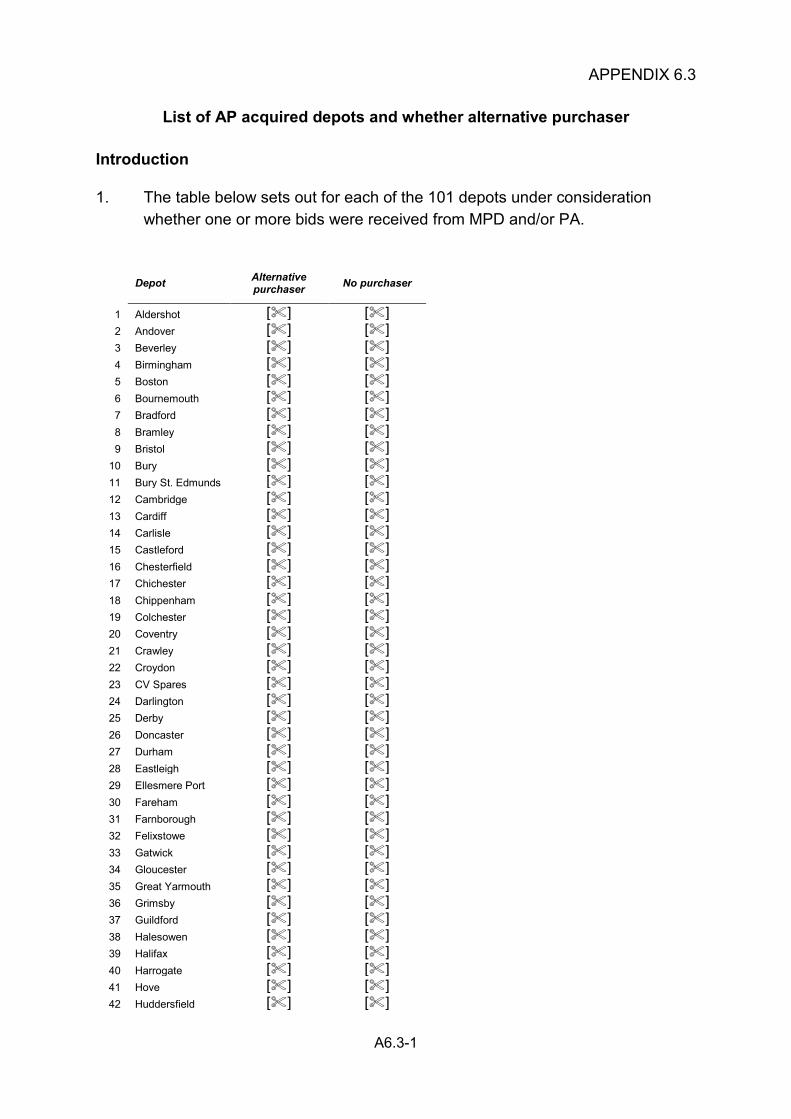
A6.3-1
APPENDIX 6.3
List of AP acquired depots and whether alternative purchaser
Introduction
1. The table below sets out for each of the 101 depots under consideration whether one or more bids were received from MPD and/or PA.
Depot Alternative purchaser No purchaser
1 Aldershot [] [] 2 Andover [] [] 3 Beverley [] [] 4 Birmingham [] [] 5 Boston [] [] 6 Bournemouth [] [] 7 Bradford [] [] 8 Bramley [] [] 9 Bristol [] []
10 Bury [] [] 11 Bury St. Edmunds [] [] 12 Cambridge [] [] 13 Cardiff [] [] 14 Carlisle [] [] 15 Castleford [] [] 16 Chesterfield [] [] 17 Chichester [] [] 18 Chippenham [] [] 19 Colchester [] [] 20 Coventry [] [] 21 Crawley [] [] 22 Croydon [] [] 23 CV Spares [] [] 24 Darlington [] [] 25 Derby [] [] 26 Doncaster [] [] 27 Durham [] [] 28 Eastleigh [] [] 29 Ellesmere Port [] [] 30 Fareham [] [] 31 Farnborough [] [] 32 Felixstowe [] [] 33 Gatwick [] [] 34 Gloucester [] [] 35 Great Yarmouth [] [] 36 Grimsby [] [] 37 Guildford [] [] 38 Halesowen [] [] 39 Halifax [] [] 40 Harrogate [] [] 41 Hove [] [] 42 Huddersfield [] []
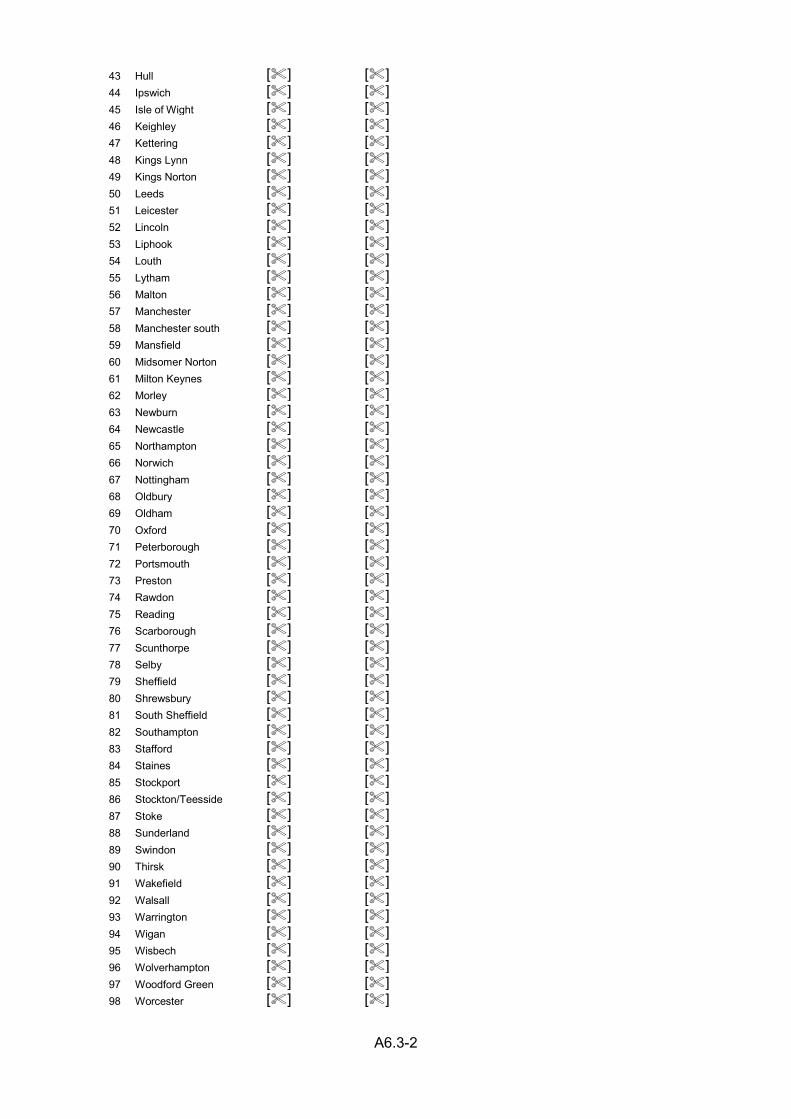
A6.3-2
43 Hull [] [] 44 Ipswich [] [] 45 Isle of Wight [] [] 46 Keighley [] [] 47 Kettering [] [] 48 Kings Lynn [] [] 49 Kings Norton [] [] 50 Leeds [] [] 51 Leicester [] [] 52 Lincoln [] [] 53 Liphook [] [] 54 Louth [] [] 55 Lytham [] [] 56 Malton [] [] 57 Manchester [] [] 58 Manchester south [] [] 59 Mansfield [] [] 60 Midsomer Norton [] [] 61 Milton Keynes [] [] 62 Morley [] [] 63 Newburn [] [] 64 Newcastle [] [] 65 Northampton [] [] 66 Norwich [] [] 67 Nottingham [] [] 68 Oldbury [] [] 69 Oldham [] [] 70 Oxford [] [] 71 Peterborough [] [] 72 Portsmouth [] [] 73 Preston [] [] 74 Rawdon [] [] 75 Reading [] [] 76 Scarborough [] [] 77 Scunthorpe [] [] 78 Selby [] [] 79 Sheffield [] [] 80 Shrewsbury [] [] 81 South Sheffield [] [] 82 Southampton [] [] 83 Stafford [] [] 84 Staines [] [] 85 Stockport [] [] 86 Stockton/Teesside [] [] 87 Stoke [] [] 88 Sunderland [] [] 89 Swindon [] [] 90 Thirsk [] [] 91 Wakefield [] [] 92 Walsall [] [] 93 Warrington [] [] 94 Wigan [] [] 95 Wisbech [] [] 96 Wolverhampton [] [] 97 Woodford Green [] [] 98 Worcester [] []

A6.3-3
99 Worthing [] [] 100 Yeovil [] [] 101 York [] []
* [] † See section 7 for our assessment of the appropriate counterfactual in each of these areas. Source: CMA
A7.1-1
APPENDIX 7.1
Framework for assessing the competitive effects of the Merger on local IMT customers in cases where the counterfactual is an
alternative purchaser
Introduction
1. Our overall framework for assessing Theory of Harm 1 (the loss of actual competition in the supply of IAM car parts to local IMT customers) involves the following four stages:
(a) Stage 1: Defining the relevant markets (both product and geographic) – see Section 5;
(b) Stage 2: Identifying instances where ECP and AP depots overlap based on their catchment areas and where the Parties may therefore compete to a material extent – see Appendix 5.2;
(c) Stage 3: Identifying the relevant counterfactual for each AP depot – see Section 6;
(d) Stage 4: Assessing the impact of the Merger on competition relative to the counterfactual in each local area.
2. This appendix sets out our approach to Stage 4 in cases where the counterfactual is the purchase of the AP depot by an alternative bidder. Our approach involves the following four steps:
(a) Step 1: Use the available evidence to identify the “Effective Competitors” to the Parties across all of their depots;
(b) Step 2: For each AP depot with an alternative bidder and for each of the overlapping ECP depots identify which of the Effective Competitors are actually present in the area and are therefore “Actual Competitors” to that depot;
(c) Step 3: Apply initial filters to identify areas where competition concerns are more likely to arise and to prioritise further analysis; and
(d) Step 4: Conduct local competitive assessments for the depots identified by our filters as potentially giving rise to competition concerns.
A7.1-2
3. This approach is consistent with the framework described in the CMA’s Retail mergers commentary1 and has been used in a number of recent cases.2
4. Step 3 of our approach involves the use of filters. The purpose of a filter is to use a simple rule to screen out areas where competition concerns are unlikely, thus allowing the CMA to focus on the remaining overlap areas. The risk in applying a filter is that the filter does not identify an area for further analysis when a more in depth analysis of that area would indicate that competition concerns arise. For this reason, the CMA takes a conservative approach to filtering, using filters which are intentionally overly inclusive.
5. In this case an important input into the filters is the process for identifying Effective and Actual Competitors (Steps 1 and 2) which determines which suppliers are considered at the filtering stage of our analysis. In selecting the criteria used to identify Effective and Actual Competitors we have reflected the need to take a conservative approach at the filtering stage of the analysis.
6. As explained in Step 4, when undertaking a more detailed analysis of any local area we have used all of the available evidence for that area and have not restricted our analysis to those competitors which were identified as Effective or Actual Competitors for the purposes of filtering. Appendices 7.2 and 7.3 contain our detailed local competitive assessments.
Step 1: Identifying Effective Competitors
7. The first step in our analysis is to identify those suppliers which are competitors to the Parties. For the purpose of the filtering stage of our analysis an “Effective Competitor” is a supplier for which there is sufficient evidence to conclude that the supplier is an “Actual Competitor” to at least one ECP or AP depot. Therefore, these suppliers will be those for which we have sufficient evidence to conclude that they are capable of competing with ECP and AP to a material extent for the purposes of the filtering.
8. We identify these suppliers using the available information for all ECP and AP depots for which we have information. Therefore, we do not confine this stage of the analysis to, for example, only the areas where ECP and AP’s 80% catchment areas overlap or to AP depots where there was an alternative
1 Retail mergers commentary (CMA62) - https://www.gov.uk/government/uploads/system/uploads/attachment_data/file/607524/retail-mergers-commentary.pdf, in particular section 3. 2 For example, the Celesio/Sainsbury’s (2016) Phase 2 merger inquiry or the Rank/Gala (2013) Phase 2 merger inquiry.
A7.1-3
bidder. This approach ensures that we maximise the information available with which to identify Effective Competitors.
9. We identify a supplier as an Effective Competitor whenever at least one of the following criteria is met:
(a) The supplier accounted for at least 10% of the price matches in the ECP IPM data at an ECP depot following ECP’s acquisition of AP.
(b) The supplier received a score of 9 points or more from Survey respondents at a given AP or ECP depot. We assigned points to a supplier on the following basis:
(i) 3 points – the Survey respondent referred to the supplier in response to at least one of Q16 (Who is your main supplier?), Q17 (Who is your second supplier?) or Q27 (Which other suppliers could have met your requirements? [Unprompted]).
(ii) 1 point – the Survey respondent did not refer to the supplier in response to Q16, Q17 or Q27 but does refer to the supplier in response to at least one of Q18 (Who is your third supplier?) or Q29 (Could … have met your requirements? [Prompted]).
(c) The supplier is listed in ECP’s 2015 promotion data.
10. The rationale for each criterion is described further below and we have considered the Parties’ submissions on our approach at paragraphs 62-90 below.
11. We have only considered general motor factors as Effective Competitors. This approach reflects the evidence set out in Section 5, which indicates that OEM and specialist parts suppliers are not an effective competitive constraint on general motor factors, such as the Parties, since they only compete with general motor factors in a limited number of circumstances.
12. The “Set of Effective Competitors” is the set of suppliers for which there is sufficient evidence to conclude that the supplier imposes a significant competitive constraint on, and is therefore an Actual Competitor to, at least one ECP or AP depot.
13. Many general motor factors have several depots located in different areas. Therefore, for these suppliers, we have assumed that the service offered is similar across all of the supplier’s sites and therefore that all of the depots of this supplier can be an Effective Competitor and are included in the Set of Effective Competitors.
A7.1-4
14. In practice, this means that if the evidence shows that, for example, Jayar is an Effective Competitor to ECP’s depot in Croydon, we will also assume that other depots operated by Jayar in other parts of the country are capable of competing with other AP and ECP depots. However, whether Jayar is an Actual Competitor in a specific area will depend on the precise characteristics of that area and in particular the ability of that competitor to supply the Parties’ customers in that specific local area. Thus, Jayar might ultimately not be an Actual Competitor to AP in Colchester if the two depots are located such that they serve customers located in distinct geographic areas.
Rationale for the criteria used to identify Effective Competitors
10% of price matches at an ECP depot following ECP’s acquisition of AP
15. We used a percentage threshold rather than an absolute threshold since a percentage threshold accounts for variation in the size of different depots. 10% is used as a threshold to ensure that we only identify suppliers where there is clear evidence that they compete with ECP across a material range of the products ECP supplies. For example, a supplier may compete with ECP but only on a small subset of the products ECP supplies or to supply a small subset of customers. As a result, such a supplier exerts only a limited competitive constraint on ECP overall. A 10% threshold helps to ensure that such suppliers are not inadvertently identified as Effective Competitors where no or very little constraint exists.
16. We focus on the period following ECP’s acquisition of AP to address concerns that AP may be over-represented and other suppliers under-represented in the data prior to this date (see Appendix 5.1).3
A supplier received 9 points or more from Survey respondents at a given AP or ECP depot
17. The Survey asked respondents the following questions:
(a) S1: In the last three months, who have you bought any car parts from?
(b) Q14: You told me earlier that you’d bought parts from [SUPPLIER NAMES]. Which of these suppliers do you have an account with?
3 Following the Main Party Hearing, the Parties submitted that we had included data relating to September 2016 at this stage of our analysis, when in fact the transaction was not completed until October 2016 (at which point we note that there was a step-change in AP’s pricing). Given the timing of this submission, we decided to account for this in our local competitive assessments in areas where it may materially affect our analysis, rather than at the filtering stage.
A7.1-5
(c) Q16: Who would you say is your main supplier, the one you spend most money with?
(d) Q17: And who is the next biggest?
(e) Q18: And the next biggest?
(f) Q27: If this branch of [ECP/AP] had been closed for refurbishment for a period of six months which other suppliers could have met your requirements instead?
(g) Q29: Would [SUPPLIER NAME] have met your requirements?
18. To identify Effective Competitors, we use the responses to Q16, Q17, Q18, Q27 and Q29. This is because these questions are most likely to identify suppliers which compete effectively with ECP and AP.
19. We did not use S1 and Q14 to identify Effective Competitors because the responses to these questions may identify suppliers who offer a service which is complementary to that offered by the Parties. For example, a customer may have purchased car parts from an OEM parts supplier in the last 3 months. Therefore, that OEM parts supplier is mentioned in response to S1. However, the customer may only use the OEM parts supplier to purchase specialist parts which suppliers such as ECP/AP do not stock. Therefore, the OEM parts supplier offers a complementary service to ECP and AP. By contrast, a customer’s main supplier is far more likely to be a substitute for ECP or AP since the supplier is likely to fulfil a wide range of requirements.
20. At this stage in our analysis, we also weighted the responses to each Survey question as described in paragraph 9(b). This approach gives more weight to the unprompted responses (Q16, Q17 and Q27) which are more likely to reflect the actual decisions individuals will or do make. However, it also ensures that information for all of the questions concerning choices between different suppliers is incorporated to some extent at the filtering stage of our analysis.4
21. We gave less weight to the responses to Q18 (Who is your third supplier?) and Q29 (Could … have met your requirements? [Prompted]) at the filtering stage of our analysis for the following reasons:
(a) Q18: This question asked who was the third supplier used by the respondent. Responses to this question are more likely to identify
4 As noted below, we have considered the full Survey responses as part of our detailed local competitive assessments.
A7.1-6
suppliers who offer services which are complementary to, rather than directly substitutable for those of the Parties. This is consistent with the fact that respondents were more likely to describe their third supplier as a specialist or an OEM parts supplier.5
(b) Q29: This question prompted respondents to consider whether they could have used specific alternative suppliers for their last purchase. We consider that respondents may have said ‘yes’ in response to Q29 because a supplier may technically have been able to fulfil their order (e.g. because the supplier is a car dealership or retailer which does stock some car parts) but, in reality, would have been unlikely to do so (e.g. because the supplier does not deliver). This interpretation is consistent with the following observations.
(i) In 28% of cases in which at least one respondent at a depot said that it could have used a supplier when prompted (Q29), no respondents at that depot had actually used that supplier in the last 3 months. Additionally, in at least 74% of cases where a respondent said that they could have used a supplier when prompted (Q29) the respondent had not actually used that supplier in the last 3 months.6
(ii) In contrast, in 87% of cases where at least one respondent at a depot said that it could have used a supplier unprompted (Q27), at least one respondent at the depot had actually used the supplier in the last 3 months.7 Similarly, in 74% of cases that a supplier was mentioned unprompted at Q27, the respondent had also used that supplier in the last 3 months.8
22. We identified a supplier as an Effective Competitor whenever the supplier received a score of 9 or more from respondents at an individual depot. We did not award points cumulatively, for example if a Survey respondent mentioned a supplier in relation to Q16 and Q27 the supplier was only awarded 3 points in relation to that Survey respondent. This is to ensure that a supplier is only identified as an Effective Competitor if the supplier was mentioned by multiple respondents. This ensures that suppliers are not identified as Effective
5 Only 62% of respondents described their third supplier as a general supplier compared to 72% for the second supplier and 74% for the first supplier. Once some obvious errors in the way that respondents had classified suppliers were corrected (eg respondents who viewed ECP as a specialist) these figures are 71%, 86% and 89% respectively. 6 74% is a lower bound because this assumes that all respondents who mentioned a supplier who they had used in the last 3 months (in response to S01) would have said yes they could have used that supplier when prompted. 7 This is also in a context where respondents had used an average of 3.3 suppliers in the last 3 months and listed (without prompting) an average of 1.6 suppliers other than the ECP or AP depot in question who could have fulfilled their last purchase. 8 This is also consistent with the Survey responses for suppliers such as Halfords and FPS (see paragraph 65(b)).
A7.1-7
Competitors (for the purposes of filtering) based on atypical customer responses (eg a Volkswagen dealer whose purchases from ECP are not reflective of most of ECP’s customers).
23. The scoring system means that, for example, a supplier is identified as an Effective Competitor based on the Survey if 3 respondents at the same depot identified a supplier as their main supplier, or if 2 respondents at a depot identified a supplier as their second supplier and 3 other respondents at the same depot said that the supplier could have been an alternative for their last purchaser when prompted.
Limitations of the Survey
24. There are two particular limitations of the Survey which we have accounted for at this stage in our analysis:
(a) The Parties provided lists of who they viewed as the top 10 competitors to each of their depots. The intention was that respondents would be asked about all of the suppliers on these lists at Q29 (the prompted alternative supplier question) if the respondent had not been mentioned the supplier at Q27 (the unprompted question). However, in practice, this did not always occur.
(b) For some depots there were fewer than 10 responses as a result of low response rates and/or the quality of the information the Parties were able to provide.
• Challenge 1: Some respondents were not asked about all of the suppliers at Q29
25. There are two reasons why a respondent may not have been asked about a supplier at Q29 when they should have been. First, the Parties provided lists of who they viewed as the top 10 competitors to each of their depots. The intention was that respondents would be asked about all of the suppliers on these lists at Q29 (the prompted alternative supplier question) if the respondent had not mentioned the supplier in response to Q27 (the unprompted question). In practice, respondents were not asked about suppliers which had been mentioned at S1 even if the supplier was not mentioned at Q27.
A7.1-8
26. Secondly, in some cases the incorrect pre-populated list was used by the survey company.9 As a result, respondents were not prompted to respond about all of the suppliers they should have been. This issue affected 16610 (9%) of interviews.11
27. The effect of this is that responses about specific suppliers are missing in 8% of cases.12 In the majority of cases only 1 respondent at a depot13 was not prompted to respond about a specific supplier and in almost all cases 2 or fewer respondents at a depot were not prompted about a specific supplier.14
28. We have accounted for this feature of the Survey evidence in our assessment and in particular we note that:
(a) The scoring system is used to identify Effective and Actual Competitors at the filtering stage of our analysis. In our scoring system the response to Q29 is immaterial whenever a respondent has already mentioned the supplier at Q16, Q17 or Q18. In practice, this is often the case.15
(b) Additionally, in some cases, the missing responses at Q29 does not affect whether a supplier is identified as an Effective Competitor because:16
(i) our proposed weighting system means that the supplier would not have been identified as an Effective Competitor on the basis of the responses at that depot even if every respondent who was not prompted at Q29 had said that they would in fact have used that supplier.
(ii) the supplier is already identified as an Effective Competitor on the basis of the other responses at that depot.
9 This issue only affects the information collected at Q29 since the dataset was recoded to address the other questions (eg to ensure that if GSF was mentioned at S01 but was inadvertently missing from the pre-populated list the response would initially have been coded against “Other supplier” but has subsequently been recoded as “GSF”). 10 Overall, the issue affected 322 interviews but in 156 of these cases a variant of a supplier’s name was presented (eg TPS was displayed rather than Trade Parts Specialist). 11 Additionally some of the cases arise because some respondents were asked about too many suppliers (ie they were prompted about suppliers who were not on the pre-populated lists). In these cases we have inadvertently been able to capture some additional information about the suppliers use which we would not have otherwise had access to. 12 In other words, of the 17,428 respondent-supplier pairs for whom there should be responses at Q27 or Q29, 1,457 are missing. 13 There are 2,357 supplier-depot pairs, of which 36% (841) are missing at least one response at Q27 or Q29. Of those where a response is missing 47% (481) are missing only one response. 14 Of the 841 suppliers with missing responses 82% (692) are missing two or fewer responses. 15 Of the 2,357 supplier-depot pairs the supplier’s score would only have differed in 20% of cases and in only 5% of cases would the supplier’s score have differed by more than 2 points. 16 Of the 841 suppliers where at least one response is missing, the response to Q29 has the potential to affect whether a supplier is identified as an Effective Competitor in only 45 cases.
A7.1-9
(c) Furthermore, in some cases the supplier would be identified as an Effective Competitor on the basis of the responses at another depot and will have been considered at the filtering stage of our analysis in any case.17
(d) When conducting more detailed local competitive assessments (Step 4) we have considered the specific details of the Survey evidence in that area. In doing so we have considered instances where respondents were incorrectly not asked about suppliers at Q29.
• Challenge 2: Reduced number of responses at some depots
29. The target was to achieve 10 customer responses at each depot. However, this was not possible for 26 depots because of a combination of differing response rates, the number of customers at each depot and the quality of customer contact information available.
30. To account for these reduced response rates we have adjusted the thresholds required for a supplier to be classified as an Effective Competitor as follows:
(a) Depots with 8 or 9 responses – 8 points
(b) Depots with less than 8 responses – 7 points
31. These adjusted thresholds make the requirements less stringent at depots where there were fewer responses, whilst ensuring that a supplier is only classified as an Effective Competitor when it was identified by several customers. This ensures that suppliers are not incorrectly identified as Effective Competitors based on a single idiosyncratic customer or purchase.
The supplier is listed in ECP’s 2015 promotion data
32. ECP’s 2015 promotion data relates to a promotion run by ECP in July 2015
where each branch manager was asked to identify [] customers which would be targeted for promotions []. The data collected includes information about the customer targeted and the customer’s main supplier (based on the ECP branch manager’s knowledge).
33. Suppliers listed in this data are included because the purpose was to target specific customers which might switch a significant value of purchases across a significant range of products to ECP from their current supplier. It is therefore, likely that the customer was using an alternative supplier which is a
17 Of the 841 suppliers where at least one response is missing only 15 suppliers would not be identified as an Effective Competitor on the basis of Survey evidence from another depot.
A7.1-10
viable alternative (and therefore a competitor) to ECP across a material range of the products ECP supplies.
Step 2: For each ECP and AP depot, identify which Effective Competitors are actually present in that area and are Actual Competitors to that depot
34. Having identified the Set of Effective Competitors, we identified the Actual Competitors for i) each AP depot where the counterfactual is an alternative bidder and ii) each ECP depot which overlaps with these AP depots.18 We refer to the specific ECP or AP depot being considered as the “focal depot” and we identify the Actual Competitors to each focal depot in the following two ways.
35. First, we included any suppliers in the Set of Effective Competitors which satisfy at least one of the following criteria:
(a) The competitor accounts for at least 10% of the price matches in the ECP IPM data at the focal ECP depot following ECP’s acquisition of AP.
(b) The supplier received a score of 9 points or more from Survey respondents at the focal depot where points are assigned on the following basis:
(i) 3 points – the Survey respondent referred to the supplier in response to either Q16 (Who is your main supplier?), Q17 (Who is your second supplier?) or Q27 (Which other suppliers could have met your requirements? [Unprompted]).
(ii) 1 point – the Survey respondent did not refer to the supplier in response to Q16, Q17 or Q27 but did refer to the supplier in response to at least one of Q18 (Who is your third supplier?) or Q29 (Could … have met your requirements? [Prompted]).
(c) The competitor is listed in ECP’s 2015 promotion data for the focal ECP depot.
36. These criteria are the same as those used to identify Effective Competitors described at paragraph 9, albeit tailored to the focal depot being considered. This ensures that our approach to identifying Actual Competitors for each
18 Therefore, Steps 2-4 are applied to each AP depot which overlaps with at least one ECP depot and to all of the overlapping ECP depots.
A7.1-11
focal depot is consistent with that used to identify Effective Competitors at Step 1.19
37. Second, we identify whether any other suppliers from the Set of Effective Competitors (as identified at Step 1) are located sufficiently close to the focal depot to be regarded as Actual Competitors to the focal depot. This step addresses the limitations of the available evidence and in particular the fact that the Survey is the only source of evidence at a local level for each AP depot.
38. To identify suppliers who are located sufficiently close to the focal depot to be regarded as Actual Competitors we take a similar approach as that used to identify instances where ECP and AP depots overlap and where they compete to a material extent. As Appendix 5.2 describes, we do this on the basis of whether the ECP and AP 80% catchment areas overlap using the Parties’ data.
39. We do not have access to equivalent data which would allow us to calculate catchment areas for competitors. Therefore, we use, as a proxy, the catchment area of the focal depot. We identify all of the Effective Competitors who are within twice the radius of the focal depot’s catchment area as Actual Competitors to the focal depot. For example, if the focal depot’s catchment area has a 5 miles radius, this process will identify all Effective Competitors within a 10 mile radius as Actual Competitors to the focal depot. This approach is analogous to assuming that the competitor’s catchment area is the same as the focal depot’s.
Step 3: Apply filters to identify depots where competition concerns are more likely to arise
40. As noted above, in cases involving a significant number of local areas the CMA typically uses filters to screen out overlap areas where there are unlikely to be competition concerns. This allows the CMA to focus on the remaining areas, which can be analysed in more detail. In this case, we have not used the filter as the basis for concluding that a SLC arises in any individual local area. Rather, where we have concluded that a SLC arises this is based on the detailed assessments of the evidence concerning the local area undertaken at Step 4.
19 In other words our analysis at Step 1 will not lead us to identify suppliers as Effective Competitors based on evidence from the focal depot who are then not identified as Actual Competitors to the focal depot.
A7.1-12
41. We incorporated the following criteria into our filters: i) the Sales Overlap Measure, ii) a fascia count and iii) a store count. These individual criteria are described in more detail below before we describe the filters we have used.
Sales Overlap Measure
42. An ECP and AP depot will be capable of exerting a greater competitive constraint on each other the more effectively both depots are able to supply the same customers. For example, the loss of competition as a result of the Merger will likely be greater if ECP and AP compete to supply 80% of an AP depot’s customers than if they compete for only 5% of an AP depot’s customers.
43. To account for this at the filtering stage we use the Sales Overlap Measure which is discussed in Appendix 5.2. This is the percentage of a depot’s 2016 sales revenue which is derived from customers located within the 80% catchment area of the other Party’s depot(s).
Fascia count
44. A fascia count identifies the number of Actual Competitors (identified as per Step 2 above) which will remain after the Merger for each focal depot. The measure does not account for the number of distinct depots operated by a supplier in a given area, i.e. a supplier with 4 depots in an area counts as a single fascia as does a supplier with only 1 depot.
45. A fascia count is informative as to the number of independent competitors in an area and therefore, the overall competitive constraint faced by the Parties in an area.
46. In our filters, we used a fascia count within 1.5x the focal depot’s catchment area. This ensures that, at the filtering stage, our analysis focuses on those suppliers which are located close to the focal depot and are more likely to provide a competitive constraint on that depot. We have considered evidence regarding suppliers located more distantly (as well as more specific evidence about the suppliers considered at the filtering stage) at Step 4 in our more detailed competitive assessments.
Store count
47. A store count identifies the number of depots operated by each Actual Competitor in the relevant area. As a result, it does account for the number of distinct depots operated by each supplier in an area such that a supplier operating two depots is given twice the weight of a supplier operating just one
A7.1-13
depot. Therefore, a store count is informative as to the intensity of competition from different suppliers in a local area.
48. For example, if a competitor has two stores in an area, it is more likely that the competitor is competing with the focal depot to supply a greater percentage of the focal depot’s customers. Likewise, when ECP (for example) operates multiple depots in an area it is more likely that ECP serves the customers (and more of the customers) served by an AP depot.
49. In our filter, we used the Parties’ share of stores located within 1.5x the focal depot’s catchment area. This ensures that, at the filtering stage, our analysis focuses on those suppliers which are located close to the focal depot and are more likely to provide a significant competitive constraint on that depot. We have considered evidence regarding suppliers located more distantly (as well as more specific evidence about the suppliers considered at the filtering stage) at Step 4 in our more detailed competitive assessments.
Filters
50. We have incorporated these three criteria into two filters: i) a fascia count filter and ii) a store count filter. In each case we took into account that the greater the extent to which the Parties compete to supply the same customers (as measured by the Sales Overlap Measure for purposes of the filter), the greater the loss of competition is likely to arise as a result of the Merger. In applying the two filters we therefore, considered that more competition was required from third party suppliers (measured by the fascia or store count in our filter) to conclude that the Merger does not give rise to competition concerns in that area.
51. As noted above, we calculate both our fascia count and store count measures based on the number of depots located within 1.5x the focal depot’s catchment area. This ensures that our filter is cautious and does not exclude areas for further analysis where competition concerns may arise. We have considered evidence regarding suppliers located at a greater distance than this (as well as more specific evidence about the suppliers considered at the filtering stage) in our more detailed assessments at Step 4.
52. Each of our filters created a red and green flag for each focal depot depending on the Sales Overlap Measure and the fascia count or share of store count as shown in Table 1 and Table 2 below. As discussed below, we have conducted a more detailed analysis for each depot given at least 1 red flag by our filters.
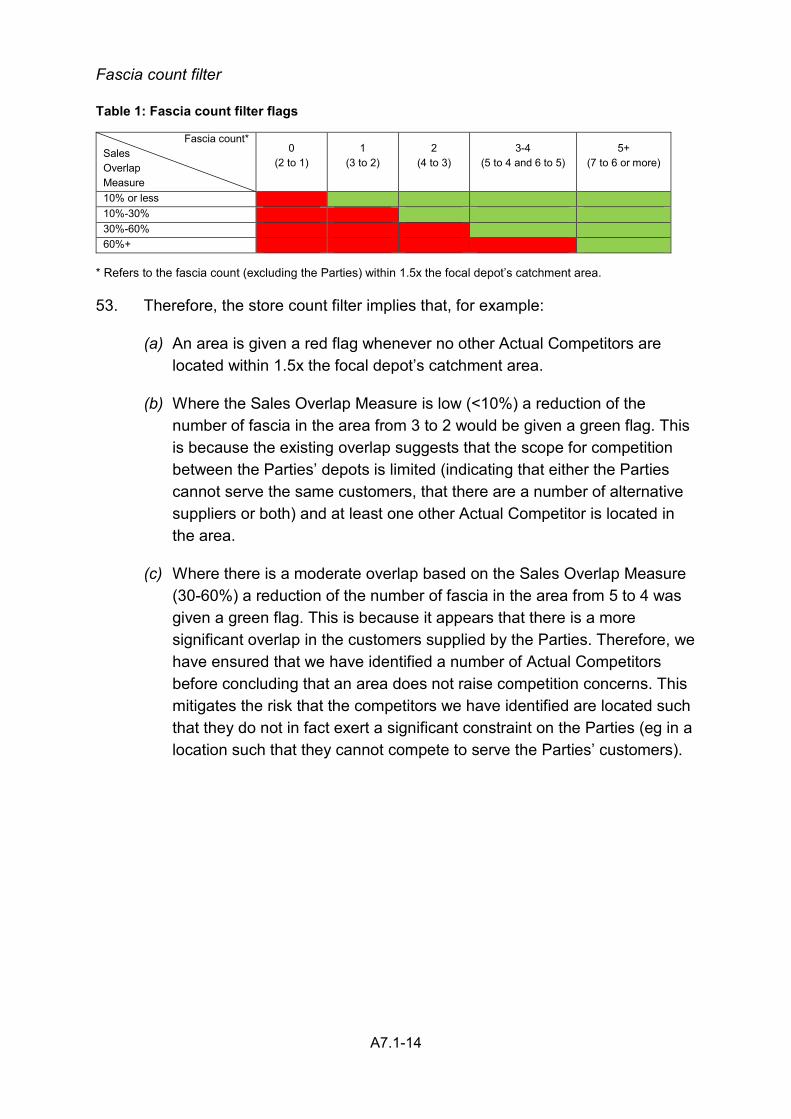
A7.1-14
Fascia count filter
Table 1: Fascia count filter flags
Fascia count* Sales Overlap Measure
0 (2 to 1)
1 (3 to 2)
2 (4 to 3)
3-4 (5 to 4 and 6 to 5)
5+ (7 to 6 or more)
10% or less 10%-30% 30%-60% 60%+
* Refers to the fascia count (excluding the Parties) within 1.5x the focal depot’s catchment area. 53. Therefore, the store count filter implies that, for example:
(a) An area is given a red flag whenever no other Actual Competitors are located within 1.5x the focal depot’s catchment area.
(b) Where the Sales Overlap Measure is low (<10%) a reduction of the number of fascia in the area from 3 to 2 would be given a green flag. This is because the existing overlap suggests that the scope for competition between the Parties’ depots is limited (indicating that either the Parties cannot serve the same customers, that there are a number of alternative suppliers or both) and at least one other Actual Competitor is located in the area.
(c) Where there is a moderate overlap based on the Sales Overlap Measure (30-60%) a reduction of the number of fascia in the area from 5 to 4 was given a green flag. This is because it appears that there is a more significant overlap in the customers supplied by the Parties. Therefore, we have ensured that we have identified a number of Actual Competitors before concluding that an area does not raise competition concerns. This mitigates the risk that the competitors we have identified are located such that they do not in fact exert a significant constraint on the Parties (eg in a location such that they cannot compete to serve the Parties’ customers).
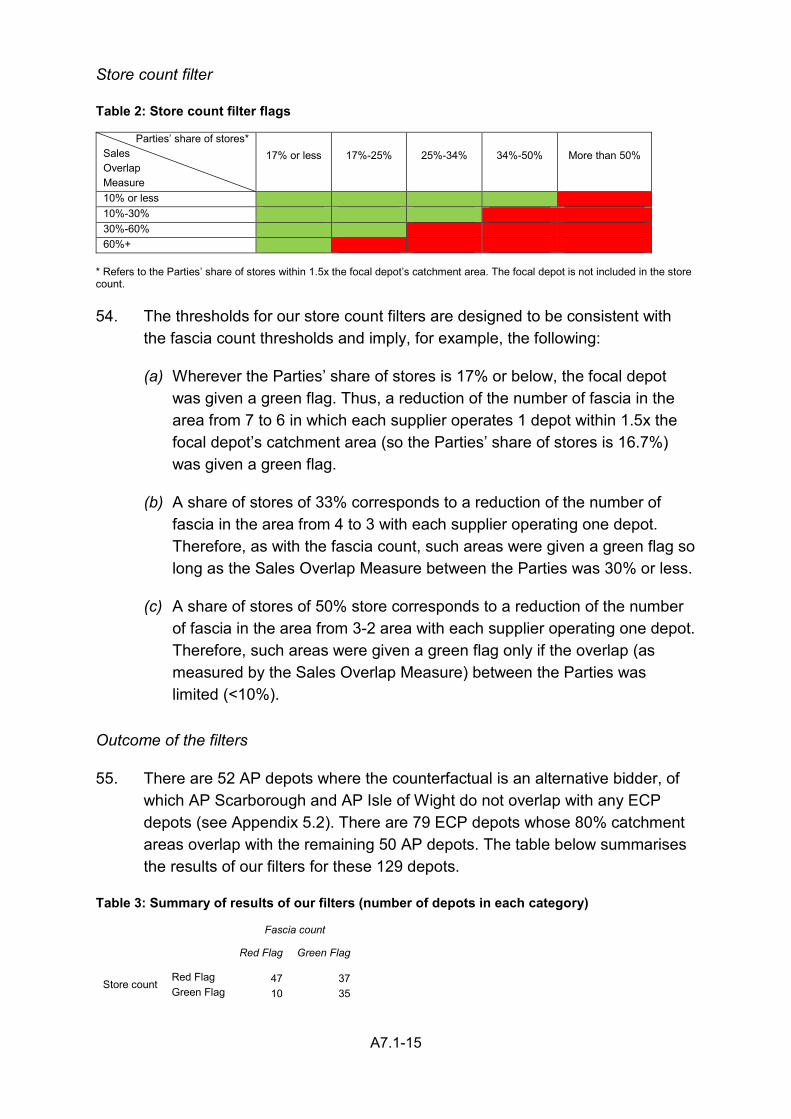
A7.1-15
Store count filter
Table 2: Store count filter flags
Parties’ share of stores* Sales Overlap Measure
17% or less 17%-25% 25%-34% 34%-50% More than 50%
10% or less 10%-30% 30%-60% 60%+
* Refers to the Parties’ share of stores within 1.5x the focal depot’s catchment area. The focal depot is not included in the store count. 54. The thresholds for our store count filters are designed to be consistent with
the fascia count thresholds and imply, for example, the following:
(a) Wherever the Parties’ share of stores is 17% or below, the focal depot was given a green flag. Thus, a reduction of the number of fascia in the area from 7 to 6 in which each supplier operates 1 depot within 1.5x the focal depot’s catchment area (so the Parties’ share of stores is 16.7%) was given a green flag.
(b) A share of stores of 33% corresponds to a reduction of the number of fascia in the area from 4 to 3 with each supplier operating one depot. Therefore, as with the fascia count, such areas were given a green flag so long as the Sales Overlap Measure between the Parties was 30% or less.
(c) A share of stores of 50% store corresponds to a reduction of the number of fascia in the area from 3-2 area with each supplier operating one depot. Therefore, such areas were given a green flag only if the overlap (as measured by the Sales Overlap Measure) between the Parties was limited (<10%).
Outcome of the filters
55. There are 52 AP depots where the counterfactual is an alternative bidder, of which AP Scarborough and AP Isle of Wight do not overlap with any ECP depots (see Appendix 5.2). There are 79 ECP depots whose 80% catchment areas overlap with the remaining 50 AP depots. The table below summarises the results of our filters for these 129 depots.
Table 3: Summary of results of our filters (number of depots in each category)
Fascia count
Red Flag Green Flag
Store count Red Flag 47 37 Green Flag 10 35
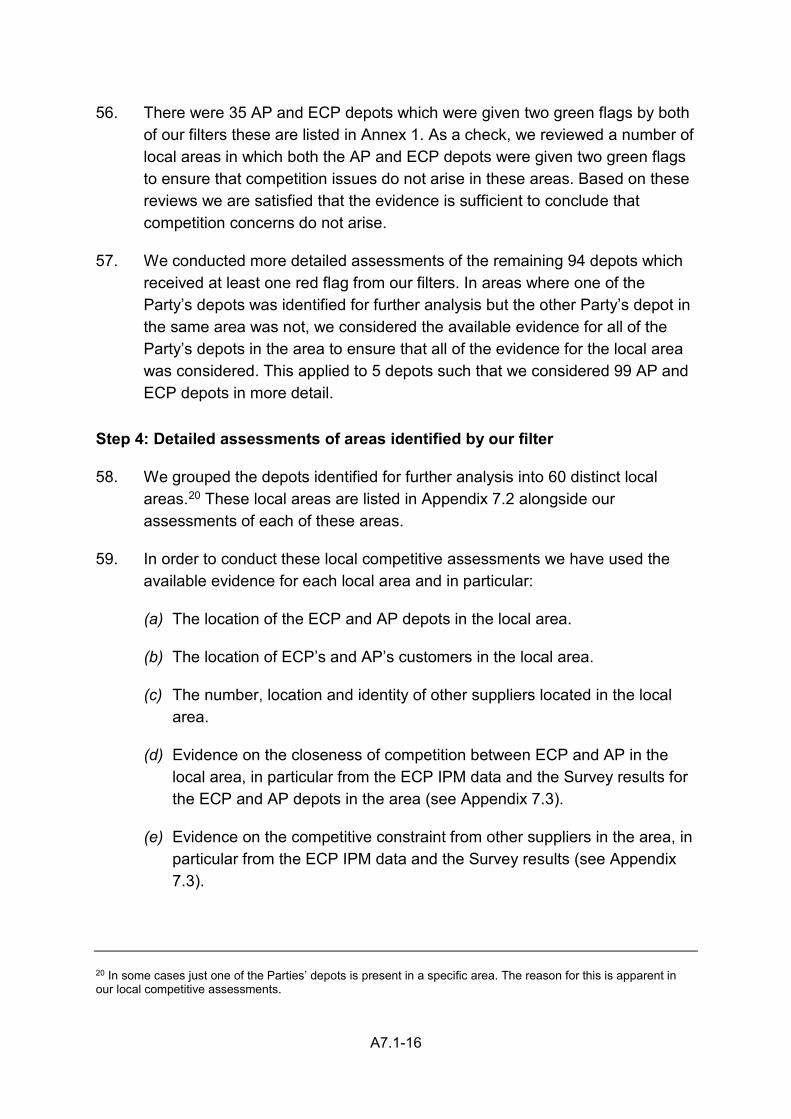
A7.1-16
56. There were 35 AP and ECP depots which were given two green flags by both of our filters these are listed in Annex 1. As a check, we reviewed a number of local areas in which both the AP and ECP depots were given two green flags to ensure that competition issues do not arise in these areas. Based on these reviews we are satisfied that the evidence is sufficient to conclude that competition concerns do not arise.
57. We conducted more detailed assessments of the remaining 94 depots which received at least one red flag from our filters. In areas where one of the Party’s depots was identified for further analysis but the other Party’s depot in the same area was not, we considered the available evidence for all of the Party’s depots in the area to ensure that all of the evidence for the local area was considered. This applied to 5 depots such that we considered 99 AP and ECP depots in more detail.
Step 4: Detailed assessments of areas identified by our filter
58. We grouped the depots identified for further analysis into 60 distinct local areas.20 These local areas are listed in Appendix 7.2 alongside our assessments of each of these areas.
59. In order to conduct these local competitive assessments we have used the available evidence for each local area and in particular:
(a) The location of the ECP and AP depots in the local area.
(b) The location of ECP’s and AP’s customers in the local area.
(c) The number, location and identity of other suppliers located in the local area.
(d) Evidence on the closeness of competition between ECP and AP in the local area, in particular from the ECP IPM data and the Survey results for the ECP and AP depots in the area (see Appendix 7.3).
(e) Evidence on the competitive constraint from other suppliers in the area, in particular from the ECP IPM data and the Survey results (see Appendix 7.3).
20 In some cases just one of the Parties’ depots is present in a specific area. The reason for this is apparent in our local competitive assessments.
A7.1-17
60. In assessing the evidence in each local area we have considered all of the available evidence concerning all of the suppliers which are located in the local area.21 Therefore, we have not, for example, restricted our analysis to those suppliers which were identified as Actual or Effective Competitors for the purposes of filtering.
61. We have also used the Survey results as part of our local assessments. 1,890 local IMT customers were interviewed as part of the Survey. Therefore, we believe that the Survey provides a robust basis for inference about the population of the Parties’ local IMT customers across the Surveyed depots. However, the number of Survey responses at each depot was small; a target was set of 10 responses per depot.22 This is insufficient for robust inferences to be made about the population of customers at each depot and the results for individual depots have not been reported in this way. Instead, each individual response has been considered and used in a more qualitative way and alongside the other available evidence relevant to the local area.
The Parties’ submissions on our methodology for local competitive assessments
62. The Parties’ provided lists of suppliers which they submitted competed with each of their depots to supply car parts to local IMT customers. The Parties also made submissions on the following areas regarding our methodology:
(a) Our use of the Survey at the filtering stage of our analysis and in particular the use of different weights for responses to different questions.
(b) OEM and specialist parts suppliers are a significant competitive constraint on the Parties and should therefore be considered at the filtering stage of our analysis.
(c) The use of a store count as well as a fascia count in our filters.
(d) The use of distance in our filters which means that competitors located just outside 1.5x the focal depot’s catchment area are ignored and that a competitor may be considered as part of the filter for an AP depot but not a nearby ECP depot (or vice-versa).
21 As noted in Appendix 7.2 our maps only show competitors who were identified as Actual Competitors to each focal depot and OEM parts suppliers. This is to keep the amount of information displayed on each map manageable. In each of our local assessments we have considered the maps alongside the more detailed evidence for each area recorded in Appendix 7.3. 22 In practice this target was not achieved for 26 depots and for some depots more than 10 responses were received.

A7.1-18
(e) The use of the ECP IPM data in our analysis.
(f) The use of the Sales Overlap Measure in our analysis.
The Parties’ competitor list submissions
63. The Parties provided lists of the suppliers which they submitted competed with each of their depots, including an indication of the suppliers they considered to be the top 5 and top 10 competitors to each depot.
64. These lists provided a starting point for our analysis. For example, they were used to identify the locations of different suppliers, were the basis for the pre-populated lists used in the Survey and they informed our local competitive assessments where we considered whether alternative suppliers might be present in specific local areas which our methodology had not identified.
65. However, we did not place significant weight on the lists themselves as evidence of the competitors faced by the Parties in each local area without corroborating evidence from, for example, the Survey or ECP’s IPM data because:
(a) the Parties provided no specific evidence about the majority of these suppliers and the services they offered;
(b) the evidence shows that the Parties’ submissions included a material number of suppliers which do not compete with the Parties in the relevant market. For example:
(i) Halfords was listed as a competitor to 10 AP depots23 and 4 ECP depots.24 However, Halfords has confirmed that it is not a wholesale distributor of car parts to the independent motor trade and, thus, is not active at the relevant level of the supply chain. This was reflected in the Survey where no respondents mentioned Halfords unprompted when asked about possible alternative suppliers and only 8 of 132 said that Halfords could have met their requirements when prompted.25
We also note that Halfords does not offer the just in time delivery service which is a key characteristic of the service offered by the Parties and, as the Survey shows, is a significant requirement for many customers. Additionally, Halfords explored the possibility of
23 [] 24 [] 25 Responses to Q27 and Q29 of the Survey.
A7.1-19
acquiring AP precisely because Halfords was not active at the relevant level of the supply chain and in part because it might allow Halfords to open its autocentres on Sundays which it could not currently do because its key suppliers did not operate on those days.
(ii) FPS was listed as a competitor by 7 ECP depots.26 However, FPS has confirmed that it is not a wholesale distributor of car parts to the independent motor trade and, thus, is not active at the relevant level of the supply chain.
(iii) There are a significant number of suppliers which the Parties submitted are competitors to their depots but these suppliers had not been used by any Survey respondent and no respondents said they would use these suppliers as an alternative when prompted.27 Desk research highlighted a number of examples where it was clear that the listed suppliers do not compete in the relevant market.28
66. In this regard, we also noted that there is a significant disparity between the lists provided by the Parties to us and the lists which had been provided by branch managers in 2015 when ECP was establishing its IPM system. []. Of the competitors included in ECP’s top 10 competitor lists, just under half ([]) were included in the IPM lists. This figure increases to about two thirds ([]) when considering the top 5 lists. Of the competitors included in the IPM lists, [] were included in the top 10 lists and [] were in the top 5 lists.
The use of the Survey evidence in our analysis
67. The Parties noted that the Survey is an important source of information in each local area, so that small changes in the interpretation of the Survey results have the potential to have significant effects on the analysis. The Parties made a number of submissions regarding the scoring system used to identify Effective and Actual Competitors at the filtering stage of our analysis. For example, the Parties noted that the scoring system applied different weights to the responses to different questions and in particular to the prompted and unprompted question. They noted that a different scoring system would have led to more Effective and Actual Competitors being identified, producing different results and reducing the number of areas where a more detailed analysis was required. ECP also submitted that the survey only considered a maximum of 10 potential competitor branches, but many of
26 [] 27 There were 522 unique supplier names in the Survey and this applied to 48 suppliers. 28 For example, [] Catalytic Support Systems (a specialist supplier of wire mesh products) as a competitor (http://www.catalyticsupportsystems.com/). [] listed Yukspeed (a supplier of rally parts, especially for Ford Escorts) as a competitor (http://www.yukspeed.com/).
A7.1-20
these were branches of the same competitors. As a result, in many cases survey was limited to a lower number potential competitors than required to pass the fascia test.
68. The Parties also cited the example of the VTech/LeapFrog Phase 2 Merger Inquiry (where the analysis was based on responses to a prompted question) to argue that equal reliance should be placed on the responses to both the prompted and unprompted Survey responses. We note that the CMA in fact typically bases its analysis on responses to unprompted diversion questions. This approach was not followed in the VTech/LeapFrog case because the questionnaire used was originally designed for an online survey where analysing the results of an unprompted question would not have been feasible.
69. We agreed that a different scoring system would have produced different results. We have explained the rationale for the scoring system we have used and the basis for giving different weights to the responses to different questions at paragraphs 17-23.
70. Furthermore, the objective of a filter is to identify areas where competition concerns do not arise so that additional analysis can be concentrated on areas where competition concerns may arise whilst not filtering out areas where a more detailed analysis would indicate that competition concerns could arise. As a result, it is important that a filter is overly inclusive. The Parties’ argument is that our filter is overly inclusive and that fewer detailed local assessments are required.
71. This is the result of a deliberate choice, ie to take a conservative approach with respect to the filtering exercise and therefore to carry out a larger number of detailed local assessments before concluding that a SLC may arise in any local area. In these assessments, we have considered the individual Survey responses in each local area for all of the suppliers (ie not only those identified as Actual or Effective Competitors for the purposes of filtering) alongside the other available evidence, eg the available evidence on the precise service offered by each supplier.
72. The Parties also noted that responses were only recorded against the top 10 competitor lists provided by the Parties. This step was taken to ensure that interviewers had a manageable list of suppliers against which they could record responses. However, it also meant that, if a Survey respondent mentioned another supplier which was not on the interviewer’s list, the response was initially recorded under “Other Supplier”. We have reviewed the free text responses, which were the basis of responses which were recorded under “Other Supplier”, where relevant in our competitive assessments.
A7.1-21
The role of OEM and specialist parts suppliers
73. The Parties have argued that OEM and specialist parts suppliers are strong competitors to the Parties and should be accounted for as part of the competitive assessment.
74. Section 5 explains our view on the competitive constraint from OEM and specialist parts suppliers and includes our views on the Parties’ submission. As we explain there, we consider that, in general, this constraint is limited because of the limited range of circumstances in which these suppliers compete with the Parties.
The use of store count in our analysis
75. The Parties submitted that, because suppliers deliver products, customers care only about whether a supplier is able to deliver in the required timeframe and does not care about the precise location of the supplier. Consequently, the Parties submitted that physical closeness is not a good proxy for closeness of competition. They also submitted that the number of depots from which a supplier can serve a customer is also immaterial for the same reason. As a result, the Parties argued that a store count should not be used as part of our filter.
76. As explained in paragraphs 47-49 we have incorporated a store count in our filter to capture the fact that when a competitor operates multiple depots in an area it is more likely that it will compete to supply a greater proportion of the focal depot’s customers. Likewise, when ECP operates multiple depots in an area, it is more likely that ECP serves the customers (and more of the customers) served by an AP depot. As a result, a store count is intended to reflect the intensity of competition in a local area from other suppliers and the potential loss of competition from the Merger.
77. Furthermore, we have used the store count as only one of the criteria in our filtering process, which for the reasons set out above is designed as a conservative exercise to identify depots for further, more detailed assessment where a wider range of information is used. In our detailed local competitive assessments, we have considered, amongst other evidence, the precise locations of the Parties’ customers, the Parties’ depots and the depots of other suppliers to reach a view on the extent of competitive interaction between the Parties in each local area and the competition from other suppliers within that local area.
A7.1-22
The use of distance in our filters
78. Our filters are based only on suppliers located within 1.5x the focal depot’s catchment area. The Parties provided a number of examples of suppliers which they submitted competed within the Parties in specific local areas but were located more distantly than 1.5x the focal depot’s catchment area so had not been included at the filtering stage.
79. We agreed with the Parties that there are examples of where this is the case. We have considered these cases as part of our more detailed local competitive assessments when we have considered the precise locations of suppliers, their ability to serve the Parties’ customers and the available evidence concerning these suppliers for each local area. This applies regardless of whether a supplier was identified as an Actual or Effective Competitor or was included at the filtering stage of our analysis.
The use of the ECP IPM data in our analysis
80. The Parties’ have submitted that:
(a) Our treatment of the ECP IPM data and the ECP 2015 promotion data is inconsistent. They argued that we have included any supplier in the ECP 2015 promotion database in the filtering stage of our analysis and should look to include any supplier listed in the ECP IPM data on the basis of an absolute, rather than a percentage, threshold.
(b) AP is over-represented in the ECP IPM data prior to October 2016. As a result, in order to consider which competitors other than AP are Effective Competitors, we should exclude AP from the data when using the ECP IPM data to allow data prior to October 2016 to be used.
(c) Using the share of price matches is misleading and a more informative measure is the absolute number of price matches for each supplier at a given depot.
Use of the ECP IPM data and the ECP 2015 promotion data
81. Paragraph 33 explains why we have used the ECP 2015 promotion data and, in particular, our view that suppliers listed in the ECP 2015 promotion data are likely to be viable alternatives (and therefore competitors) to ECP across a material part of the range of the products ECP supplies.
82. This is not the case for the ECP IPM data, which records price matches on a product by product basis. Therefore, as we noted at paragraph 15, a supplier who only competes with ECP to supply a small subset of products or
A7.1-23
customers may appear in the ECP IPM data but it does so infrequently, which accurately reflects the limited competitive constraint from such a supplier. Consequently, we consider there to be differences in the information contained in the ECP IPM data and the ECP 2015 promotion data and this is reflected in our analysis.
83. In our detailed local competitive assessments we have considered both whether a supplier is listed in the ECP 2015 promotion data and its share in the ECP IPM data (regardless of whether it meets a certain threshold) alongside a range of other evidence.
The inclusion of AP in the ECP IPM data
84. The ECP IPM data is informative as to the relative strength of price competition from different suppliers faced by ECP in each local area. If AP were to be excluded from the ECP IPM data, then any subsequent analysis (eg the choice of thresholds at the filtering stage of the analysis or the interpretation of the ECP IPM data in a detailed local competitive assessment) would have to account for the fact that, in some cases a significant number of price matches had been excluded from the data. This would have to be done on a case by case basis and would result in the loss of much of the relevant information contained within the ECP IPM data. Therefore, we do not consider that excluding AP from ECP’s IPM data would be practical, nor do we believe that it would improve the quality of the information used in our competitive assessment.
The use of the share of price matches in the analysis
85. The Parties suggested that the absolute number of price matches should be used because:
(a) ‘it is not distorted by any unusual activity in a given branch’
(b) the Parties believe that it can be used for a longer period and ‘would allow the CMA to capture matches of competitors that may have been temporarily less active during October to December for one reason or another’.
86. Our reasons for using the share of price matches is given at paragraph 15 and the Parties’ submissions do not alter that assessment.
87. We also note that:
A7.1-24
(a) We have considered the share of price matches for each supplier over the entire period, as well as the share of price matches following ECP’s acquisition of AP, as part of our detailed competitive assessments.
(b) The Parties have not explained why any specific competitor ‘may have been temporarily less active during October to December’. Furthermore, we consider any such variations over time (if significant) to be potentially informative as to the strength of competition from different suppliers.
The use of the Sales Overlap Measure in our analysis
88. The Parties submitted that our Sales Overlap Measure is a poor measure of closeness of competition in the context of this market where supplier deliver products to customers, making the precise geographical location of suppliers less important.
89. Paragraphs 42-43 explain the reasons why we have used the Sales Value Measure at the filtering stage of the analysis and why we consider it to be an informative measure of the closeness of competition between the Parties for use at the filtering stage of our analysis.
90. We note that, in our detailed local competitive assessments, we have considered, amongst other evidence, the precise locations of the Parties’ customers, the Parties’ depots and the depots of suppliers, to reach a view on the extent of competitive interaction between the Parties in each local area and the competition from other suppliers within that local area. The Sales Overlap Measure has not played a role at that stage of our analysis.
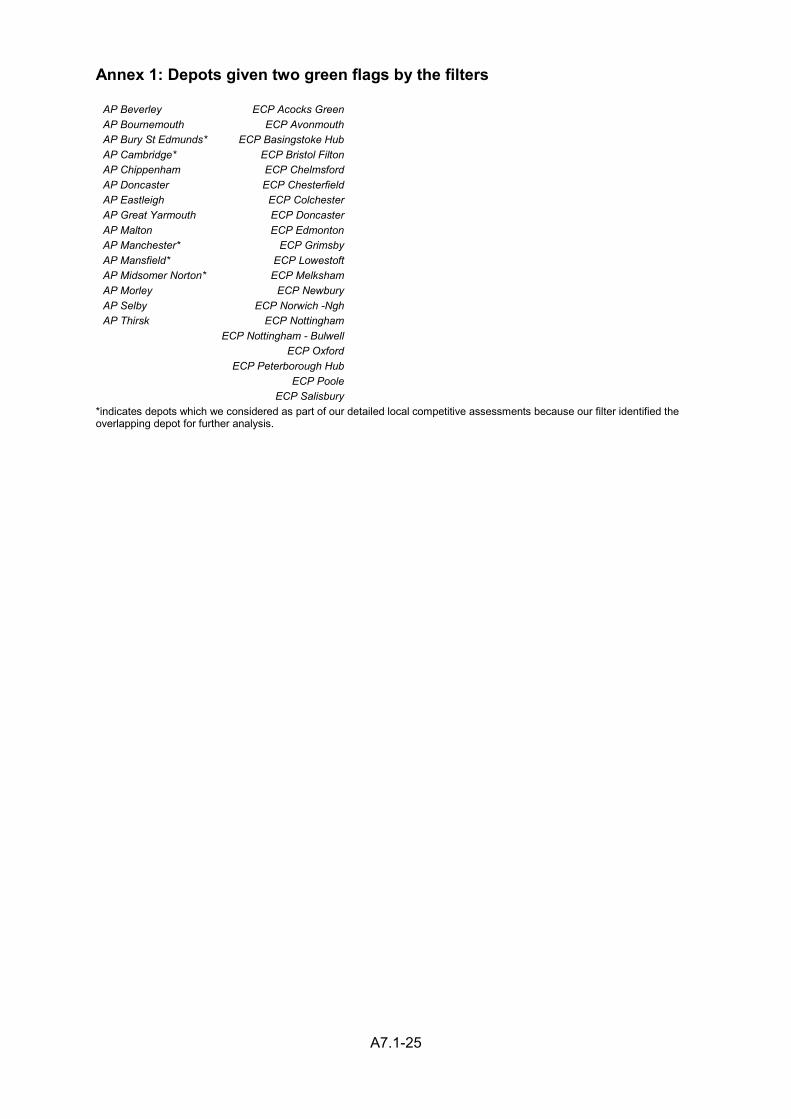
A7.1-25
Annex 1: Depots given two green flags by the filters
AP Beverley ECP Acocks Green AP Bournemouth ECP Avonmouth AP Bury St Edmunds* ECP Basingstoke Hub AP Cambridge* ECP Bristol Filton AP Chippenham ECP Chelmsford AP Doncaster ECP Chesterfield AP Eastleigh ECP Colchester AP Great Yarmouth ECP Doncaster AP Malton ECP Edmonton AP Manchester* ECP Grimsby AP Mansfield* ECP Lowestoft AP Midsomer Norton* ECP Melksham AP Morley ECP Newbury AP Selby ECP Norwich -Ngh AP Thirsk ECP Nottingham ECP Nottingham - Bulwell ECP Oxford ECP Peterborough Hub ECP Poole ECP Salisbury
*indicates depots which we considered as part of our detailed local competitive assessments because our filter identified the overlapping depot for further analysis.
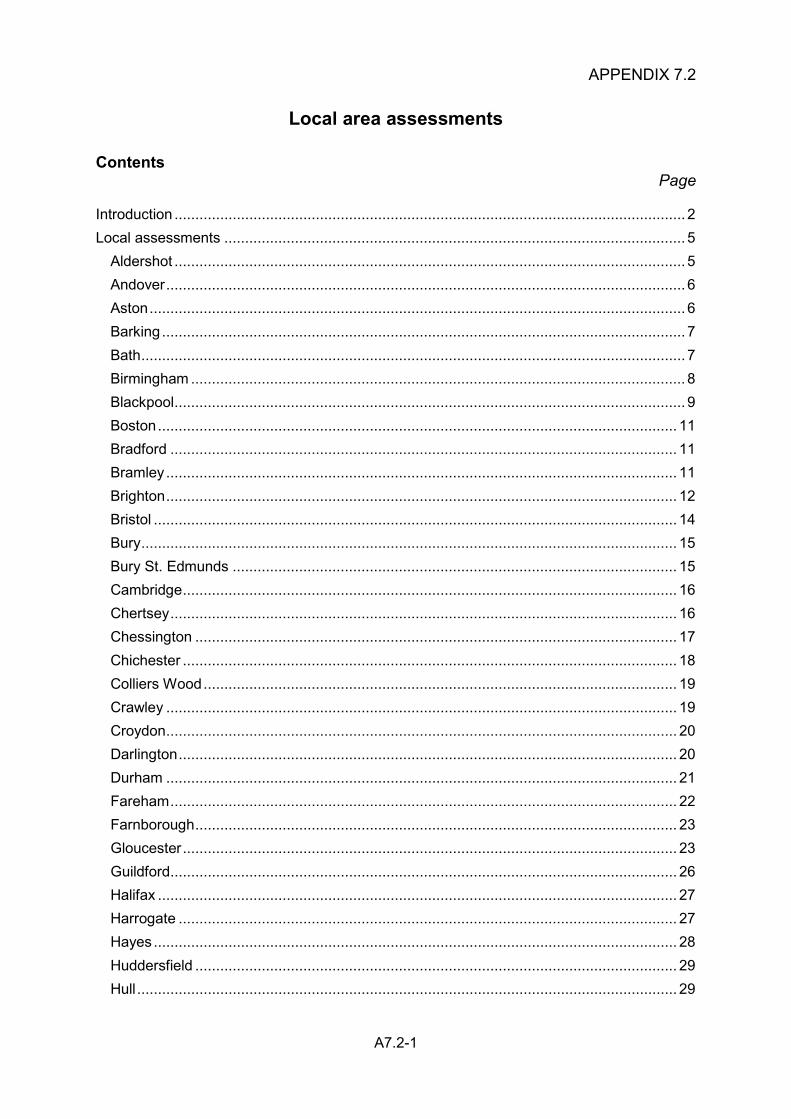
A7.2-1
APPENDIX 7.2
Local area assessments
Contents Page
Introduction ........................................................................................................................... 2 Local assessments ............................................................................................................... 5
Aldershot ........................................................................................................................... 5 Andover ............................................................................................................................. 6 Aston ................................................................................................................................. 6 Barking .............................................................................................................................. 7 Bath ................................................................................................................................... 7 Birmingham ....................................................................................................................... 8 Blackpool ........................................................................................................................... 9 Boston ............................................................................................................................. 11 Bradford .......................................................................................................................... 11 Bramley ........................................................................................................................... 11 Brighton ........................................................................................................................... 12 Bristol .............................................................................................................................. 14 Bury ................................................................................................................................. 15 Bury St. Edmunds ........................................................................................................... 15 Cambridge ....................................................................................................................... 16 Chertsey .......................................................................................................................... 16 Chessington .................................................................................................................... 17 Chichester ....................................................................................................................... 18 Colliers Wood .................................................................................................................. 19 Crawley ........................................................................................................................... 19 Croydon ........................................................................................................................... 20 Darlington ........................................................................................................................ 20 Durham ........................................................................................................................... 21 Fareham .......................................................................................................................... 22 Farnborough .................................................................................................................... 23 Gloucester ....................................................................................................................... 23 Guildford .......................................................................................................................... 26 Halifax ............................................................................................................................. 27 Harrogate ........................................................................................................................ 27 Hayes .............................................................................................................................. 28 Huddersfield .................................................................................................................... 29 Hull .................................................................................................................................. 29
A7.2-2
Ipswich ............................................................................................................................ 30 Isleworth .......................................................................................................................... 30 Keighley .......................................................................................................................... 31 King’s Lynn ...................................................................................................................... 32 Kings Norton.................................................................................................................... 33 Kingston .......................................................................................................................... 34 Leeds .............................................................................................................................. 34 Liphook ............................................................................................................................ 35 Manchester ..................................................................................................................... 37 Mansfield ......................................................................................................................... 38 Newcastle ........................................................................................................................ 38 Norwich ........................................................................................................................... 39 Oxford ............................................................................................................................. 40 Reading ........................................................................................................................... 41 Scunthorpe ...................................................................................................................... 41 Southampton ................................................................................................................... 43 Stockport ......................................................................................................................... 44 Stockton .......................................................................................................................... 45 Sunderland ...................................................................................................................... 45 Sutton .............................................................................................................................. 47 Swindon .......................................................................................................................... 48 Wakefield ........................................................................................................................ 49 Woking ............................................................................................................................ 52 Wokingham ..................................................................................................................... 53 Woodford Green .............................................................................................................. 53 Worthing .......................................................................................................................... 54 Yeovil .............................................................................................................................. 56 York ................................................................................................................................. 56
Introduction
1. This appendix sets out our detailed local assessments for each of the 94 focal depots identified by our filters as depots in relation to which competition concerns may arise.
2. For each focal depot, we provide a map of the local area and a table showing details about the focal depot, before summarising our competitive assessment for the relevant local area. Appendix 7.3 provides a more detailed summary of the information we have considered about the suppliers in each local area.
3. Where appropriate, we have grouped depots together into local areas to ensure that we consider all of the available evidence regarding competition to
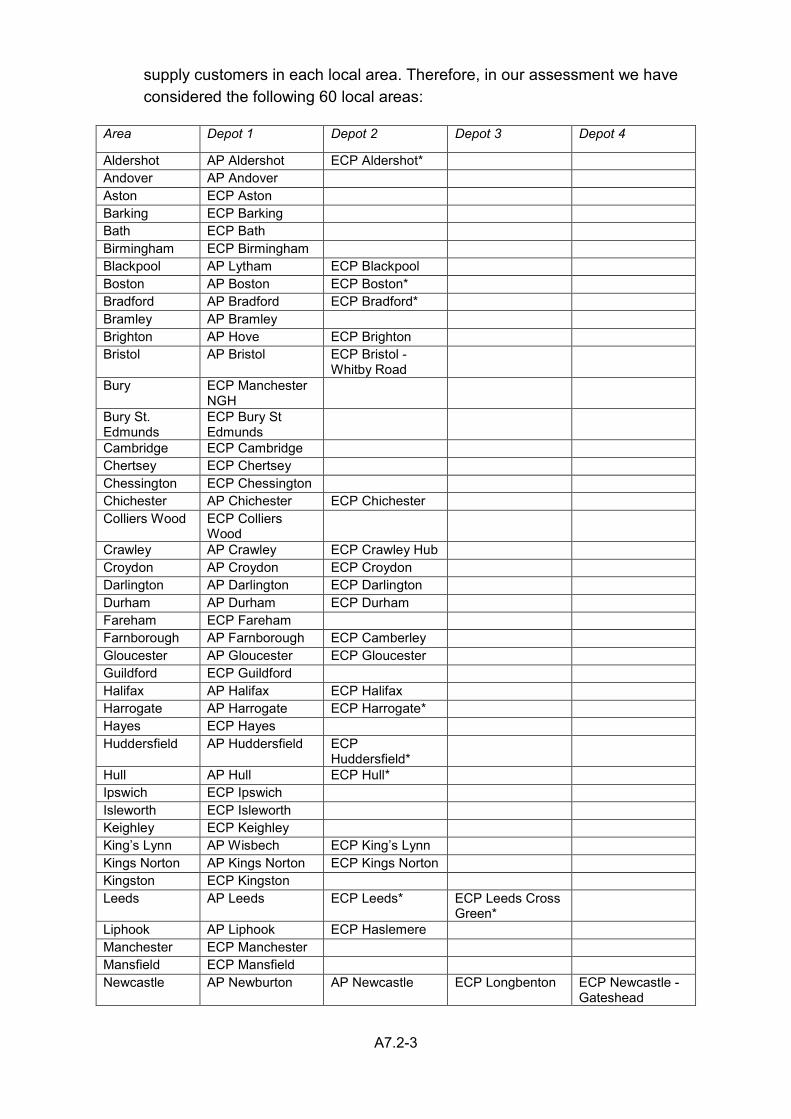
A7.2-3
supply customers in each local area. Therefore, in our assessment we have considered the following 60 local areas:
Area Depot 1 Depot 2 Depot 3 Depot 4
Aldershot AP Aldershot ECP Aldershot*
Andover AP Andover Aston ECP Aston
Barking ECP Barking
Bath ECP Bath
Birmingham ECP Birmingham
Blackpool AP Lytham ECP Blackpool
Boston AP Boston ECP Boston*
Bradford AP Bradford ECP Bradford*
Bramley AP Bramley
Brighton AP Hove ECP Brighton
Bristol AP Bristol ECP Bristol - Whitby Road
Bury ECP Manchester NGH
Bury St. Edmunds
ECP Bury St Edmunds
Cambridge ECP Cambridge
Chertsey ECP Chertsey
Chessington ECP Chessington
Chichester AP Chichester ECP Chichester
Colliers Wood ECP Colliers Wood
Crawley AP Crawley ECP Crawley Hub
Croydon AP Croydon ECP Croydon
Darlington AP Darlington ECP Darlington
Durham AP Durham ECP Durham
Fareham ECP Fareham
Farnborough AP Farnborough ECP Camberley
Gloucester AP Gloucester ECP Gloucester
Guildford ECP Guildford
Halifax AP Halifax ECP Halifax
Harrogate AP Harrogate ECP Harrogate*
Hayes ECP Hayes
Huddersfield AP Huddersfield ECP Huddersfield*
Hull AP Hull ECP Hull*
Ipswich ECP Ipswich
Isleworth ECP Isleworth
Keighley ECP Keighley
King’s Lynn AP Wisbech ECP King’s Lynn
Kings Norton AP Kings Norton ECP Kings Norton
Kingston ECP Kingston
Leeds AP Leeds ECP Leeds* ECP Leeds Cross Green*
Liphook AP Liphook ECP Haslemere
Manchester ECP Manchester
Mansfield ECP Mansfield
Newcastle AP Newburton AP Newcastle ECP Longbenton ECP Newcastle - Gateshead
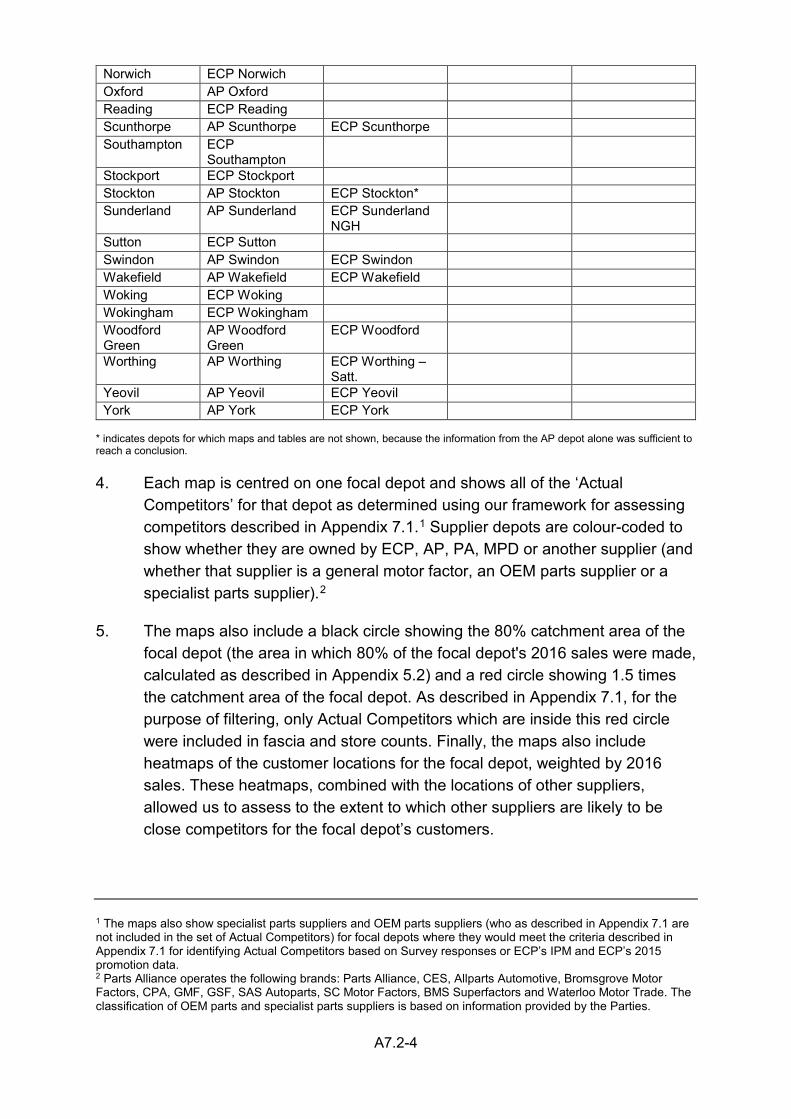
A7.2-4
Norwich ECP Norwich
Oxford AP Oxford
Reading ECP Reading
Scunthorpe AP Scunthorpe ECP Scunthorpe
Southampton ECP Southampton
Stockport ECP Stockport
Stockton AP Stockton ECP Stockton*
Sunderland AP Sunderland ECP Sunderland NGH
Sutton ECP Sutton
Swindon AP Swindon ECP Swindon
Wakefield AP Wakefield ECP Wakefield
Woking ECP Woking
Wokingham ECP Wokingham
Woodford Green
AP Woodford Green
ECP Woodford
Worthing AP Worthing ECP Worthing – Satt.
Yeovil AP Yeovil ECP Yeovil
York AP York ECP York
* indicates depots for which maps and tables are not shown, because the information from the AP depot alone was sufficient to reach a conclusion. 4. Each map is centred on one focal depot and shows all of the ‘Actual
Competitors’ for that depot as determined using our framework for assessing competitors described in Appendix 7.1.1 Supplier depots are colour-coded to show whether they are owned by ECP, AP, PA, MPD or another supplier (and whether that supplier is a general motor factor, an OEM parts supplier or a specialist parts supplier).2
5. The maps also include a black circle showing the 80% catchment area of the focal depot (the area in which 80% of the focal depot's 2016 sales were made, calculated as described in Appendix 5.2) and a red circle showing 1.5 times the catchment area of the focal depot. As described in Appendix 7.1, for the purpose of filtering, only Actual Competitors which are inside this red circle were included in fascia and store counts. Finally, the maps also include heatmaps of the customer locations for the focal depot, weighted by 2016 sales. These heatmaps, combined with the locations of other suppliers, allowed us to assess to the extent to which other suppliers are likely to be close competitors for the focal depot’s customers.
1 The maps also show specialist parts suppliers and OEM parts suppliers (who as described in Appendix 7.1 are not included in the set of Actual Competitors) for focal depots where they would meet the criteria described in Appendix 7.1 for identifying Actual Competitors based on Survey responses or ECP’s IPM and ECP’s 2015 promotion data. 2 Parts Alliance operates the following brands: Parts Alliance, CES, Allparts Automotive, Bromsgrove Motor Factors, CPA, GMF, GSF, SAS Autoparts, SC Motor Factors, BMS Superfactors and Waterloo Motor Trade. The classification of OEM parts and specialist parts suppliers is based on information provided by the Parties.
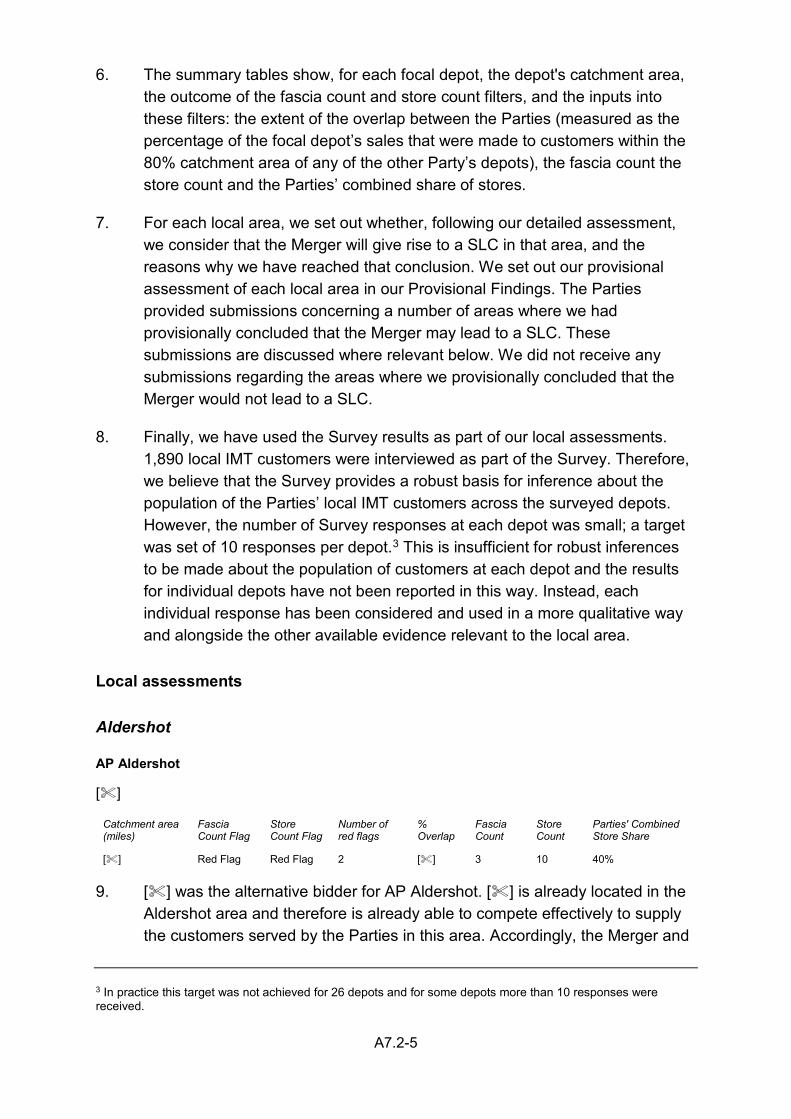
A7.2-5
6. The summary tables show, for each focal depot, the depot's catchment area, the outcome of the fascia count and store count filters, and the inputs into these filters: the extent of the overlap between the Parties (measured as the percentage of the focal depot’s sales that were made to customers within the 80% catchment area of any of the other Party’s depots), the fascia count the store count and the Parties’ combined share of stores.
7. For each local area, we set out whether, following our detailed assessment, we consider that the Merger will give rise to a SLC in that area, and the reasons why we have reached that conclusion. We set out our provisional assessment of each local area in our Provisional Findings. The Parties provided submissions concerning a number of areas where we had provisionally concluded that the Merger may lead to a SLC. These submissions are discussed where relevant below. We did not receive any submissions regarding the areas where we provisionally concluded that the Merger would not lead to a SLC.
8. Finally, we have used the Survey results as part of our local assessments. 1,890 local IMT customers were interviewed as part of the Survey. Therefore, we believe that the Survey provides a robust basis for inference about the population of the Parties’ local IMT customers across the surveyed depots. However, the number of Survey responses at each depot was small; a target was set of 10 responses per depot.3 This is insufficient for robust inferences to be made about the population of customers at each depot and the results for individual depots have not been reported in this way. Instead, each individual response has been considered and used in a more qualitative way and alongside the other available evidence relevant to the local area.
Local assessments
Aldershot
AP Aldershot
[]
Catchment area (miles)
Fascia Count Flag
Store Count Flag
Number of red flags
% Overlap
Fascia Count
Store Count
Parties' Combined Store Share
[] Red Flag Red Flag 2 [] 3 10 40% 9. [] was the alternative bidder for AP Aldershot. [] is already located in the
Aldershot area and therefore is already able to compete effectively to supply the customers served by the Parties in this area. Accordingly, the Merger and
3 In practice this target was not achieved for 26 depots and for some depots more than 10 responses were received.
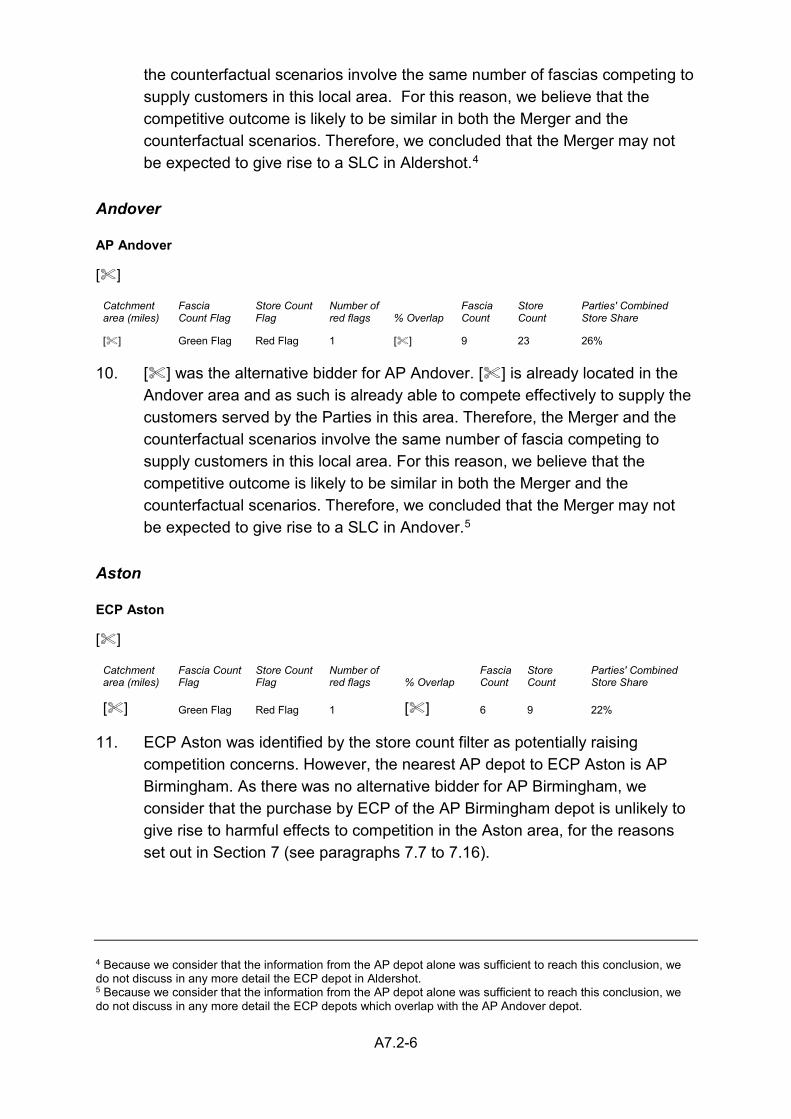
A7.2-6
the counterfactual scenarios involve the same number of fascias competing to supply customers in this local area. For this reason, we believe that the competitive outcome is likely to be similar in both the Merger and the counterfactual scenarios. Therefore, we concluded that the Merger may not be expected to give rise to a SLC in Aldershot.4
Andover
AP Andover
[]
Catchment area (miles)
Fascia Count Flag
Store Count Flag
Number of red flags % Overlap
Fascia Count
Store Count
Parties' Combined Store Share
[] Green Flag Red Flag 1 [] 9 23 26% 10. [] was the alternative bidder for AP Andover. [] is already located in the
Andover area and as such is already able to compete effectively to supply the customers served by the Parties in this area. Therefore, the Merger and the counterfactual scenarios involve the same number of fascia competing to supply customers in this local area. For this reason, we believe that the competitive outcome is likely to be similar in both the Merger and the counterfactual scenarios. Therefore, we concluded that the Merger may not be expected to give rise to a SLC in Andover.5
Aston
ECP Aston
[]
Catchment area (miles)
Fascia Count Flag
Store Count Flag
Number of red flags % Overlap
Fascia Count
Store Count
Parties' Combined Store Share
[] Green Flag Red Flag 1 [] 6 9 22% 11. ECP Aston was identified by the store count filter as potentially raising
competition concerns. However, the nearest AP depot to ECP Aston is AP Birmingham. As there was no alternative bidder for AP Birmingham, we consider that the purchase by ECP of the AP Birmingham depot is unlikely to give rise to harmful effects to competition in the Aston area, for the reasons set out in Section 7 (see paragraphs 7.7 to 7.16).
4 Because we consider that the information from the AP depot alone was sufficient to reach this conclusion, we do not discuss in any more detail the ECP depot in Aldershot. 5 Because we consider that the information from the AP depot alone was sufficient to reach this conclusion, we do not discuss in any more detail the ECP depots which overlap with the AP Andover depot.
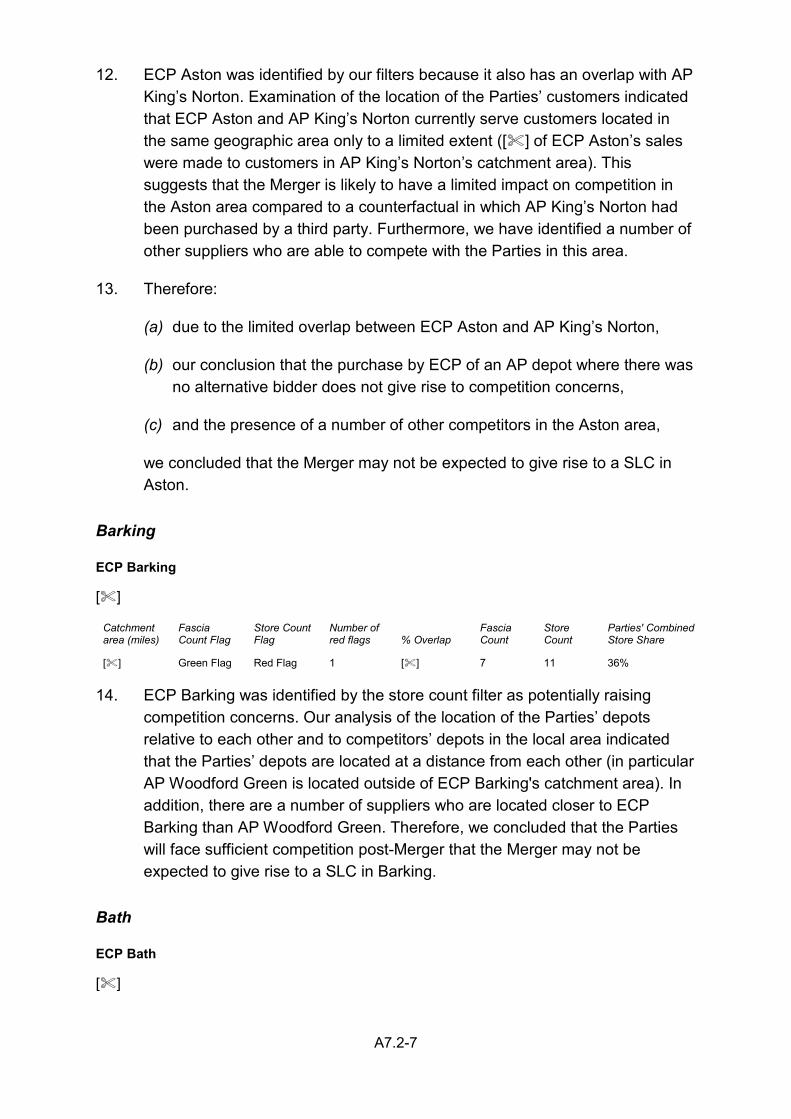
A7.2-7
12. ECP Aston was identified by our filters because it also has an overlap with AP King’s Norton. Examination of the location of the Parties’ customers indicated that ECP Aston and AP King’s Norton currently serve customers located in the same geographic area only to a limited extent ([] of ECP Aston’s sales were made to customers in AP King’s Norton’s catchment area). This suggests that the Merger is likely to have a limited impact on competition in the Aston area compared to a counterfactual in which AP King’s Norton had been purchased by a third party. Furthermore, we have identified a number of other suppliers who are able to compete with the Parties in this area.
13. Therefore:
(a) due to the limited overlap between ECP Aston and AP King’s Norton,
(b) our conclusion that the purchase by ECP of an AP depot where there was no alternative bidder does not give rise to competition concerns,
(c) and the presence of a number of other competitors in the Aston area,
we concluded that the Merger may not be expected to give rise to a SLC in Aston.
Barking
ECP Barking
[]
Catchment area (miles)
Fascia Count Flag
Store Count Flag
Number of red flags % Overlap
Fascia Count
Store Count
Parties' Combined Store Share
[] Green Flag Red Flag 1 [] 7 11 36% 14. ECP Barking was identified by the store count filter as potentially raising
competition concerns. Our analysis of the location of the Parties’ depots relative to each other and to competitors’ depots in the local area indicated that the Parties’ depots are located at a distance from each other (in particular AP Woodford Green is located outside of ECP Barking's catchment area). In addition, there are a number of suppliers who are located closer to ECP Barking than AP Woodford Green. Therefore, we concluded that the Parties will face sufficient competition post-Merger that the Merger may not be expected to give rise to a SLC in Barking.
Bath
ECP Bath
[]
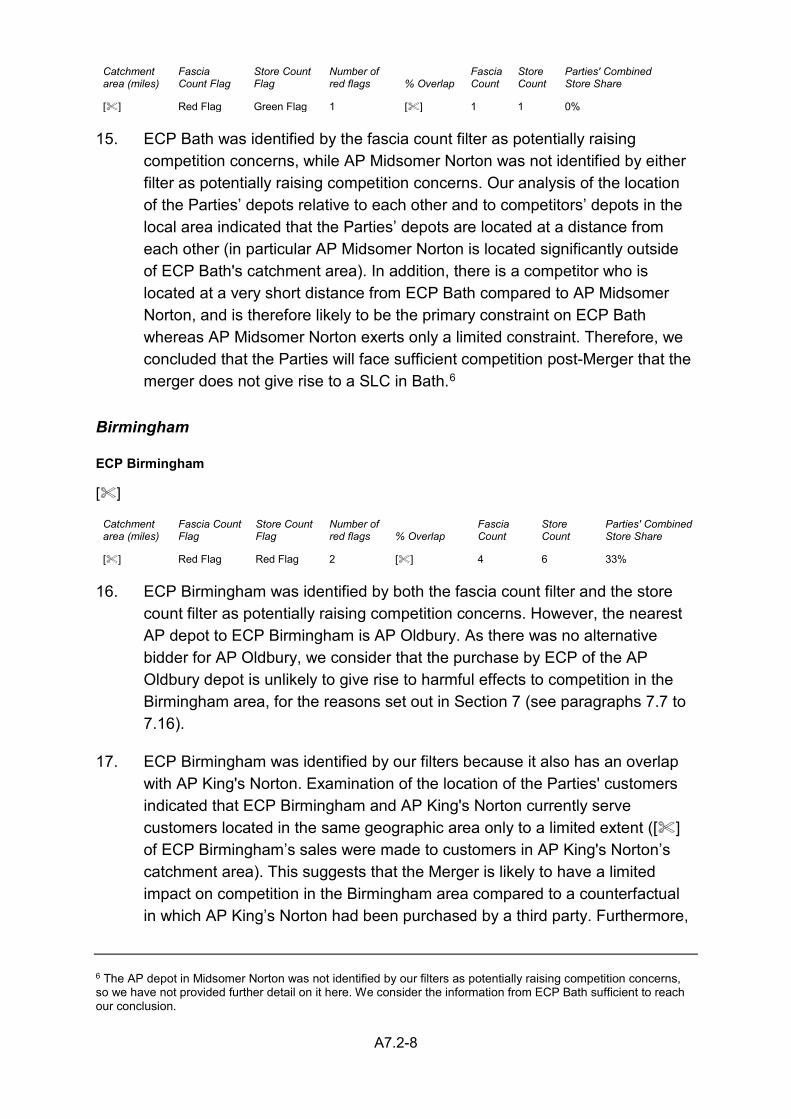
A7.2-8
Catchment area (miles)
Fascia Count Flag
Store Count Flag
Number of red flags % Overlap
Fascia Count
Store Count
Parties' Combined Store Share
[] Red Flag Green Flag 1 [] 1 1 0% 15. ECP Bath was identified by the fascia count filter as potentially raising
competition concerns, while AP Midsomer Norton was not identified by either filter as potentially raising competition concerns. Our analysis of the location of the Parties’ depots relative to each other and to competitors’ depots in the local area indicated that the Parties’ depots are located at a distance from each other (in particular AP Midsomer Norton is located significantly outside of ECP Bath's catchment area). In addition, there is a competitor who is located at a very short distance from ECP Bath compared to AP Midsomer Norton, and is therefore likely to be the primary constraint on ECP Bath whereas AP Midsomer Norton exerts only a limited constraint. Therefore, we concluded that the Parties will face sufficient competition post-Merger that the merger does not give rise to a SLC in Bath.6
Birmingham
ECP Birmingham
[]
Catchment area (miles)
Fascia Count Flag
Store Count Flag
Number of red flags % Overlap
Fascia Count
Store Count
Parties' Combined Store Share
[] Red Flag Red Flag 2 [] 4 6 33% 16. ECP Birmingham was identified by both the fascia count filter and the store
count filter as potentially raising competition concerns. However, the nearest AP depot to ECP Birmingham is AP Oldbury. As there was no alternative bidder for AP Oldbury, we consider that the purchase by ECP of the AP Oldbury depot is unlikely to give rise to harmful effects to competition in the Birmingham area, for the reasons set out in Section 7 (see paragraphs 7.7 to 7.16).
17. ECP Birmingham was identified by our filters because it also has an overlap with AP King's Norton. Examination of the location of the Parties' customers indicated that ECP Birmingham and AP King's Norton currently serve customers located in the same geographic area only to a limited extent ([] of ECP Birmingham’s sales were made to customers in AP King's Norton’s catchment area). This suggests that the Merger is likely to have a limited impact on competition in the Birmingham area compared to a counterfactual in which AP King’s Norton had been purchased by a third party. Furthermore,
6 The AP depot in Midsomer Norton was not identified by our filters as potentially raising competition concerns, so we have not provided further detail on it here. We consider the information from ECP Bath sufficient to reach our conclusion.
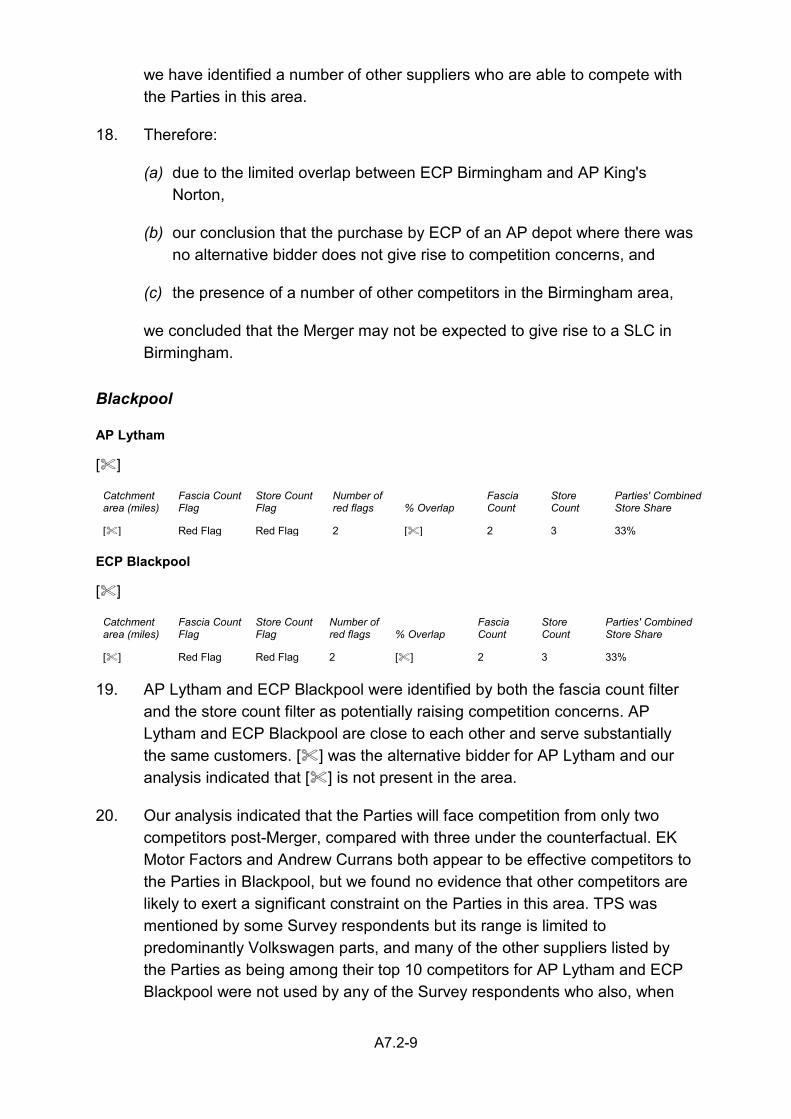
A7.2-9
we have identified a number of other suppliers who are able to compete with the Parties in this area.
18. Therefore:
(a) due to the limited overlap between ECP Birmingham and AP King's Norton,
(b) our conclusion that the purchase by ECP of an AP depot where there was no alternative bidder does not give rise to competition concerns, and
(c) the presence of a number of other competitors in the Birmingham area,
we concluded that the Merger may not be expected to give rise to a SLC in Birmingham.
Blackpool
AP Lytham
[]
Catchment area (miles)
Fascia Count Flag
Store Count Flag
Number of red flags % Overlap
Fascia Count
Store Count
Parties' Combined Store Share
[] Red Flag Red Flag 2 [] 2 3 33% ECP Blackpool
[]
Catchment area (miles)
Fascia Count Flag
Store Count Flag
Number of red flags % Overlap
Fascia Count
Store Count
Parties' Combined Store Share
[] Red Flag Red Flag 2 [] 2 3 33% 19. AP Lytham and ECP Blackpool were identified by both the fascia count filter
and the store count filter as potentially raising competition concerns. AP Lytham and ECP Blackpool are close to each other and serve substantially the same customers. [] was the alternative bidder for AP Lytham and our analysis indicated that [] is not present in the area.
20. Our analysis indicated that the Parties will face competition from only two competitors post-Merger, compared with three under the counterfactual. EK Motor Factors and Andrew Currans both appear to be effective competitors to the Parties in Blackpool, but we found no evidence that other competitors are likely to exert a significant constraint on the Parties in this area. TPS was mentioned by some Survey respondents but its range is limited to predominantly Volkswagen parts, and many of the other suppliers listed by the Parties as being among their top 10 competitors for AP Lytham and ECP Blackpool were not used by any of the Survey respondents who also, when
A7.2-10
prompted, consistently stated that they would not use these suppliers. These suppliers also did not feature in the ECP IPM data to a significant extent or ECP’s 2015 promotion data.
21. In response to our Provisional Findings the Parties submitted that we should consider Motocare Manchester and Talbot Trade Supplies as ‘effective competitors’ in this area. To support this they referred to the ICDP supplier survey and to customer invoices.
22. In our view, the evidence does not indicate that Motocare Manchester or Talbot Trade Suppliers are a significant competitive constraint on the Parties in this area. Specifically:
(a) Motocare Manchester was only listed as a top 10 competitor in the area by ECP.7 None of the 14 ECP Survey respondents viewed Motocare Manchester as an alternative to ECP for their last purchase (even when prompted) and none of these respondents had used this supplier in the last 3 months, although one AP Survey respondent did refer to them. This supplier also did not feature in the ECP IPM data or the ECP 2015 promotion data for this area. This supplier also indicated to ICDP that they did not serve the Lytham area, where a substantial proportion of the Parties’ customers are located.
(b) Talbot Trade Supplies was only listed as a top 10 competitor in the area by AP. It was not referred to by any Survey respondents (either at the AP or the ECP depot). In addition, this supplier also did not feature in the ECP IPM data or the ECP 2015 promotion data for this area.
23. Therefore, we concluded that the Merger may be expected to give rise to a SLC in Blackpool because:
(a) The Parties’ depots compete closely to supply customers in the local area;
(b) After the Merger, ECP will only be constrained by two competitors; and
(c) The alternative purchaser in the counterfactual, [], does not currently compete with the Parties. The acquisition of the AP depot by [] would maintain a significant source of competitive constraint on ECP, which will otherwise be lost as a result of the Merger.
7 Notably AP listed Halfords as a competitor ahead of Motocare Manchester.

A7.2-11
Boston
AP Boston
[]
Catchment area (miles)
Fascia Count Flag
Store Count Flag
Number of red flags % Overlap
Fascia Count
Store Count
Parties' Combined Store Share
[] Red Flag Green Flag 1 [] 3 7 14% 24. [] was the alternative bidder for AP Boston. [] is already located in the
Boston area and as such is already able to compete effectively to supply the customers served by the Parties in this area. Therefore, the Merger and the counterfactual scenarios involve the same number of fascia competing to supply customers in this local area. For this reason, we believe that the competitive outcome is likely to be similar in both the Merger and the counterfactual scenarios. Therefore, we concluded that the Merger may not be expected to give rise to a SLC in Boston.8
Bradford
AP Bradford
[]
Catchment area (miles)
Fascia Count Flag
Store Count Flag
Number of red flags % Overlap
Fascia Count
Store Count
Parties' Combined Store Share
[] Red Flag Red Flag 2 [] 4 8 25% 25. [] was the alternative bidder for AP Bradford. [] is already located in the
Bradford area [] and as such is already able to compete effectively to supply the customers served by the Parties in this area. Therefore, the Merger and the counterfactual scenarios involve the same number of fascia competing to supply customers in this local area. For this reason, we believe that the competitive outcome is likely to be similar in both the Merger and the counterfactual scenarios. Therefore, we concluded that the Merger may not be expected to give rise to a SLC in Bradford.9
Bramley
AP Bramley
[]
8 Because we consider that the information from the AP depot alone was sufficient to reach this conclusion, we do not discuss in any more detail the ECP depot in Boston. 9 Because we consider that the information from the AP depot alone was sufficient to reach this conclusion, we do not discuss in any more detail the ECP depot in Bradford.
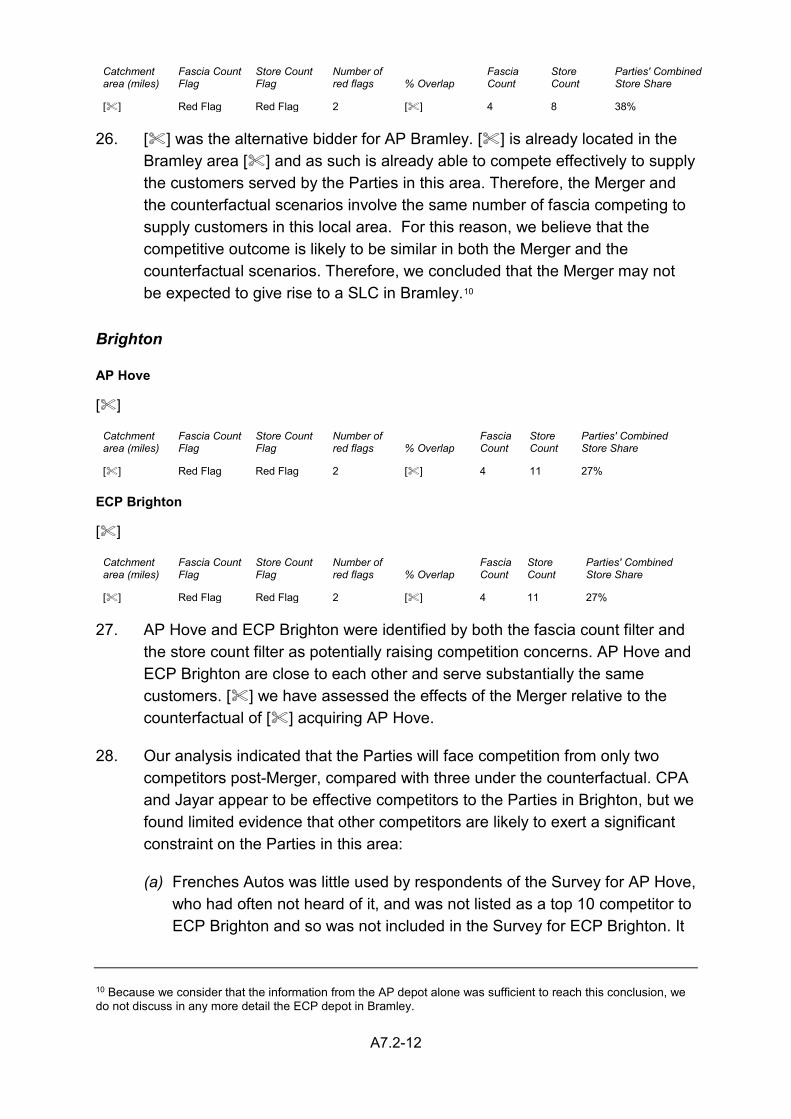
A7.2-12
Catchment area (miles)
Fascia Count Flag
Store Count Flag
Number of red flags % Overlap
Fascia Count
Store Count
Parties' Combined Store Share
[] Red Flag Red Flag 2 [] 4 8 38% 26. [] was the alternative bidder for AP Bramley. [] is already located in the
Bramley area [] and as such is already able to compete effectively to supply the customers served by the Parties in this area. Therefore, the Merger and the counterfactual scenarios involve the same number of fascia competing to supply customers in this local area. For this reason, we believe that the competitive outcome is likely to be similar in both the Merger and the counterfactual scenarios. Therefore, we concluded that the Merger may not be expected to give rise to a SLC in Bramley.10
Brighton
AP Hove
[]
Catchment area (miles)
Fascia Count Flag
Store Count Flag
Number of red flags % Overlap
Fascia Count
Store Count
Parties' Combined Store Share
[] Red Flag Red Flag 2 [] 4 11 27% ECP Brighton
[]
Catchment area (miles)
Fascia Count Flag
Store Count Flag
Number of red flags % Overlap
Fascia Count
Store Count
Parties' Combined Store Share
[] Red Flag Red Flag 2 [] 4 11 27% 27. AP Hove and ECP Brighton were identified by both the fascia count filter and
the store count filter as potentially raising competition concerns. AP Hove and ECP Brighton are close to each other and serve substantially the same customers. [] we have assessed the effects of the Merger relative to the counterfactual of [] acquiring AP Hove.
28. Our analysis indicated that the Parties will face competition from only two competitors post-Merger, compared with three under the counterfactual. CPA and Jayar appear to be effective competitors to the Parties in Brighton, but we found limited evidence that other competitors are likely to exert a significant constraint on the Parties in this area:
(a) Frenches Autos was little used by respondents of the Survey for AP Hove, who had often not heard of it, and was not listed as a top 10 competitor to ECP Brighton and so was not included in the Survey for ECP Brighton. It
10 Because we consider that the information from the AP depot alone was sufficient to reach this conclusion, we do not discuss in any more detail the ECP depot in Bramley.
A7.2-13
did not feature in the ECP Brighton IPM data or the ECP 2015 promotion data for this area. Frenches Autos is also located in Worthing at some distance from the Parties’ depots, and the Parties’ customers.
(b) TPS only competes with the Parties in relation to a limited range of the parts they supply as TPS predominantly supplies Volkswagen parts.
(c) Although a number of ECP Brighton Survey respondents said they could use Autolec Motor Factors, it is located 11 miles away from the Parties’ depots, and the Parties’ sales are largely concentrated around their depots in Brighton itself. This indicated that Autolec Motor Factors’ ability to compete with the Parties in this area is limited.
(d) Other suppliers which the Parties submitted were competitors in Brighton were either not viewed by Survey respondents as alternatives to the Parties or were OEM parts suppliers, which only exert a limited competitive constraint on general motor factors such as the Parties, as discussed in Section 5.
29. In response to our Provisional Findings the Parties’ submitted that we should consider Autolec Motor Factors, EBC Motor Factors and TPS to be effective competitors to the Parties in this area. In our view the evidence does not indicate that these suppliers are a significant competitive constraint on the Parties in this area. In particular:
(a) EBC Motor Factors was not listed as a top 10 competitor by either Party and was subsequently only referred to by 2 of 21 Survey respondents in the area. In addition, this supplier also does not feature in the ECP IPM or the ECP 2015 promotion data for this area. EBC’s response to ICDP supplier survey also indicated that they did not supply customers in Hove. Consequently, we do not believe that EBC is an effective competitor to the Parties in this area.
(b) The Parties did not submit additional evidence specific to the Brighton area in support of their arguments that TPS is an effective competitor. We refer to section 5 above for why we believe that the competitive constraint from OEM parts suppliers such as TPS is limited.
(c) In response to the Parties’ submission, we sought additional evidence from Autolec on the areas served from its Newhaven depot. Autolec informed us that its position in Newhaven means that it is only able to serve customers located on the eastern side of Brighton and is unable to serve customers located in the centre and to the west of Brighton effectively. This was supported by the sales data provided by Autolec. Consistent with this, we noted that the Survey respondents who referred
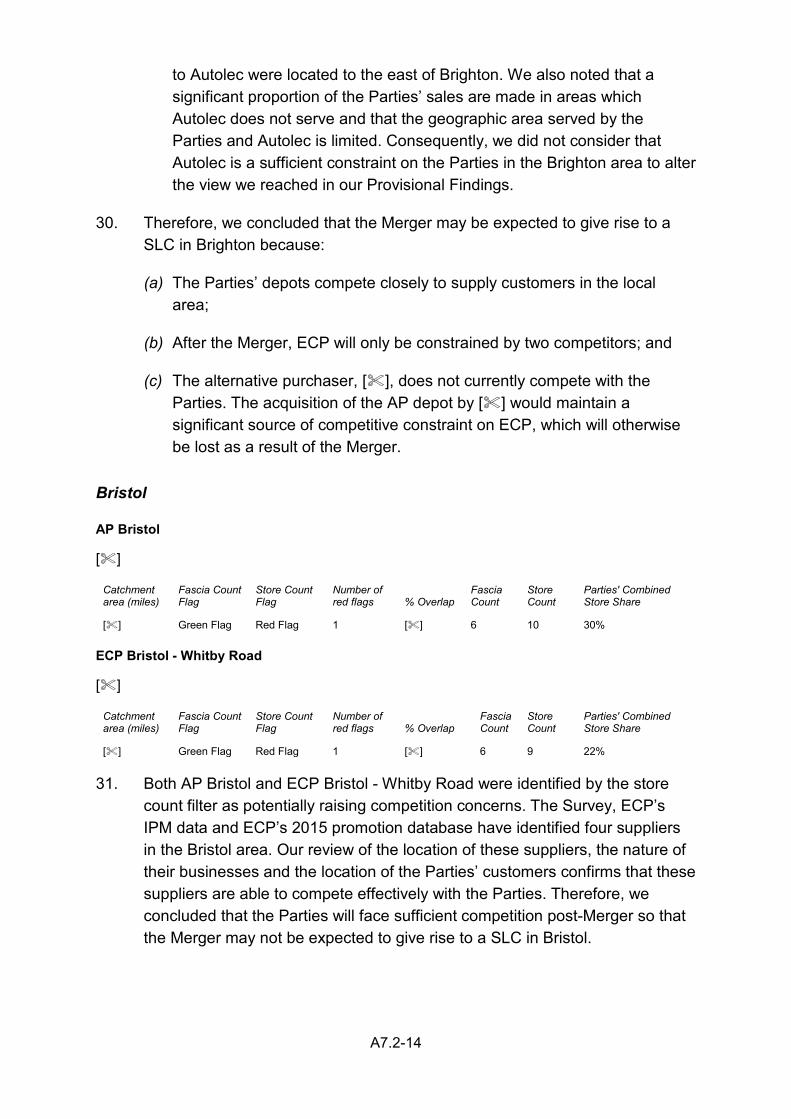
A7.2-14
to Autolec were located to the east of Brighton. We also noted that a significant proportion of the Parties’ sales are made in areas which Autolec does not serve and that the geographic area served by the Parties and Autolec is limited. Consequently, we did not consider that Autolec is a sufficient constraint on the Parties in the Brighton area to alter the view we reached in our Provisional Findings.
30. Therefore, we concluded that the Merger may be expected to give rise to a SLC in Brighton because:
(a) The Parties’ depots compete closely to supply customers in the local area;
(b) After the Merger, ECP will only be constrained by two competitors; and
(c) The alternative purchaser, [], does not currently compete with the Parties. The acquisition of the AP depot by [] would maintain a significant source of competitive constraint on ECP, which will otherwise be lost as a result of the Merger.
Bristol
AP Bristol
[]
Catchment area (miles)
Fascia Count Flag
Store Count Flag
Number of red flags % Overlap
Fascia Count
Store Count
Parties' Combined Store Share
[] Green Flag Red Flag 1 [] 6 10 30% ECP Bristol - Whitby Road
[]
Catchment area (miles)
Fascia Count Flag
Store Count Flag
Number of red flags % Overlap
Fascia Count
Store Count
Parties' Combined Store Share
[] Green Flag Red Flag 1 [] 6 9 22% 31. Both AP Bristol and ECP Bristol - Whitby Road were identified by the store
count filter as potentially raising competition concerns. The Survey, ECP’s IPM data and ECP’s 2015 promotion database have identified four suppliers in the Bristol area. Our review of the location of these suppliers, the nature of their businesses and the location of the Parties’ customers confirms that these suppliers are able to compete effectively with the Parties. Therefore, we concluded that the Parties will face sufficient competition post-Merger so that the Merger may not be expected to give rise to a SLC in Bristol.
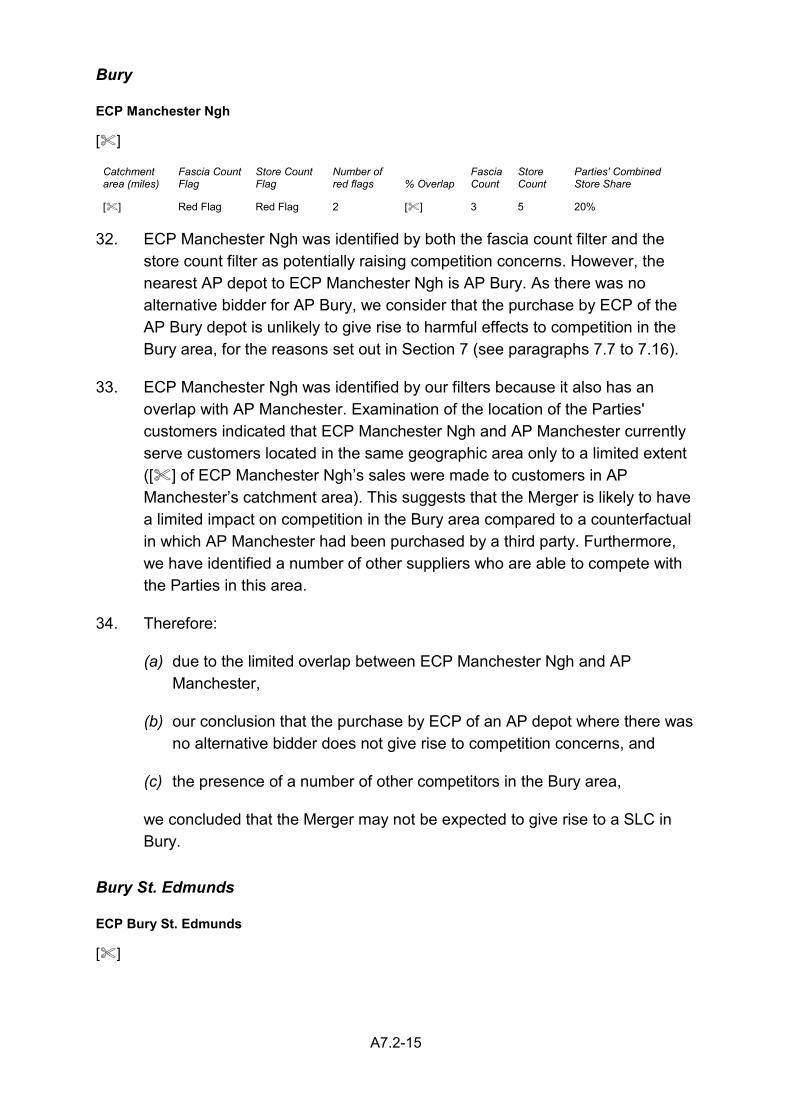
A7.2-15
Bury
ECP Manchester Ngh
[]
Catchment area (miles)
Fascia Count Flag
Store Count Flag
Number of red flags % Overlap
Fascia Count
Store Count
Parties' Combined Store Share
[] Red Flag Red Flag 2 [] 3 5 20% 32. ECP Manchester Ngh was identified by both the fascia count filter and the
store count filter as potentially raising competition concerns. However, the nearest AP depot to ECP Manchester Ngh is AP Bury. As there was no alternative bidder for AP Bury, we consider that the purchase by ECP of the AP Bury depot is unlikely to give rise to harmful effects to competition in the Bury area, for the reasons set out in Section 7 (see paragraphs 7.7 to 7.16).
33. ECP Manchester Ngh was identified by our filters because it also has an overlap with AP Manchester. Examination of the location of the Parties' customers indicated that ECP Manchester Ngh and AP Manchester currently serve customers located in the same geographic area only to a limited extent ([] of ECP Manchester Ngh’s sales were made to customers in AP Manchester’s catchment area). This suggests that the Merger is likely to have a limited impact on competition in the Bury area compared to a counterfactual in which AP Manchester had been purchased by a third party. Furthermore, we have identified a number of other suppliers who are able to compete with the Parties in this area.
34. Therefore:
(a) due to the limited overlap between ECP Manchester Ngh and AP Manchester,
(b) our conclusion that the purchase by ECP of an AP depot where there was no alternative bidder does not give rise to competition concerns, and
(c) the presence of a number of other competitors in the Bury area,
we concluded that the Merger may not be expected to give rise to a SLC in Bury.
Bury St. Edmunds
ECP Bury St. Edmunds
[]
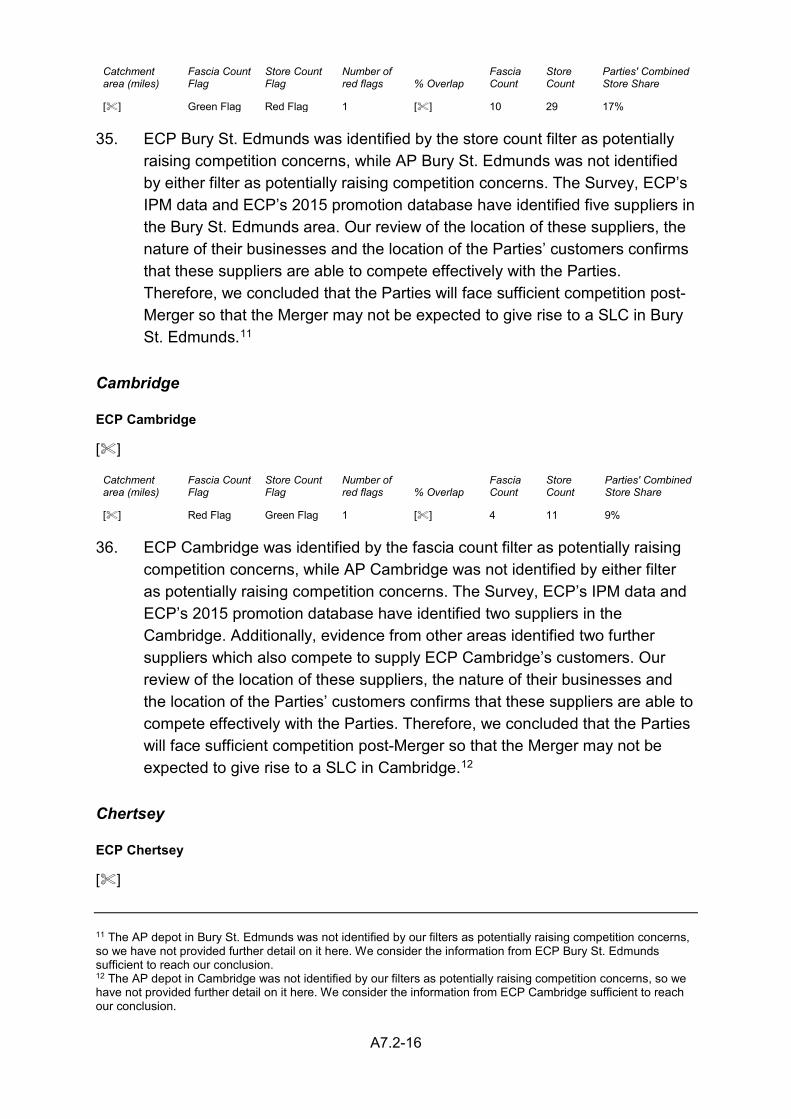
A7.2-16
Catchment area (miles)
Fascia Count Flag
Store Count Flag
Number of red flags % Overlap
Fascia Count
Store Count
Parties' Combined Store Share
[] Green Flag Red Flag 1 [] 10 29 17% 35. ECP Bury St. Edmunds was identified by the store count filter as potentially
raising competition concerns, while AP Bury St. Edmunds was not identified by either filter as potentially raising competition concerns. The Survey, ECP’s IPM data and ECP’s 2015 promotion database have identified five suppliers in the Bury St. Edmunds area. Our review of the location of these suppliers, the nature of their businesses and the location of the Parties’ customers confirms that these suppliers are able to compete effectively with the Parties. Therefore, we concluded that the Parties will face sufficient competition post-Merger so that the Merger may not be expected to give rise to a SLC in Bury St. Edmunds.11
Cambridge
ECP Cambridge
[]
Catchment area (miles)
Fascia Count Flag
Store Count Flag
Number of red flags % Overlap
Fascia Count
Store Count
Parties' Combined Store Share
[] Red Flag Green Flag 1 [] 4 11 9% 36. ECP Cambridge was identified by the fascia count filter as potentially raising
competition concerns, while AP Cambridge was not identified by either filter as potentially raising competition concerns. The Survey, ECP’s IPM data and ECP’s 2015 promotion database have identified two suppliers in the Cambridge. Additionally, evidence from other areas identified two further suppliers which also compete to supply ECP Cambridge’s customers. Our review of the location of these suppliers, the nature of their businesses and the location of the Parties’ customers confirms that these suppliers are able to compete effectively with the Parties. Therefore, we concluded that the Parties will face sufficient competition post-Merger so that the Merger may not be expected to give rise to a SLC in Cambridge.12
Chertsey
ECP Chertsey
[] 11 The AP depot in Bury St. Edmunds was not identified by our filters as potentially raising competition concerns, so we have not provided further detail on it here. We consider the information from ECP Bury St. Edmunds sufficient to reach our conclusion. 12 The AP depot in Cambridge was not identified by our filters as potentially raising competition concerns, so we have not provided further detail on it here. We consider the information from ECP Cambridge sufficient to reach our conclusion.
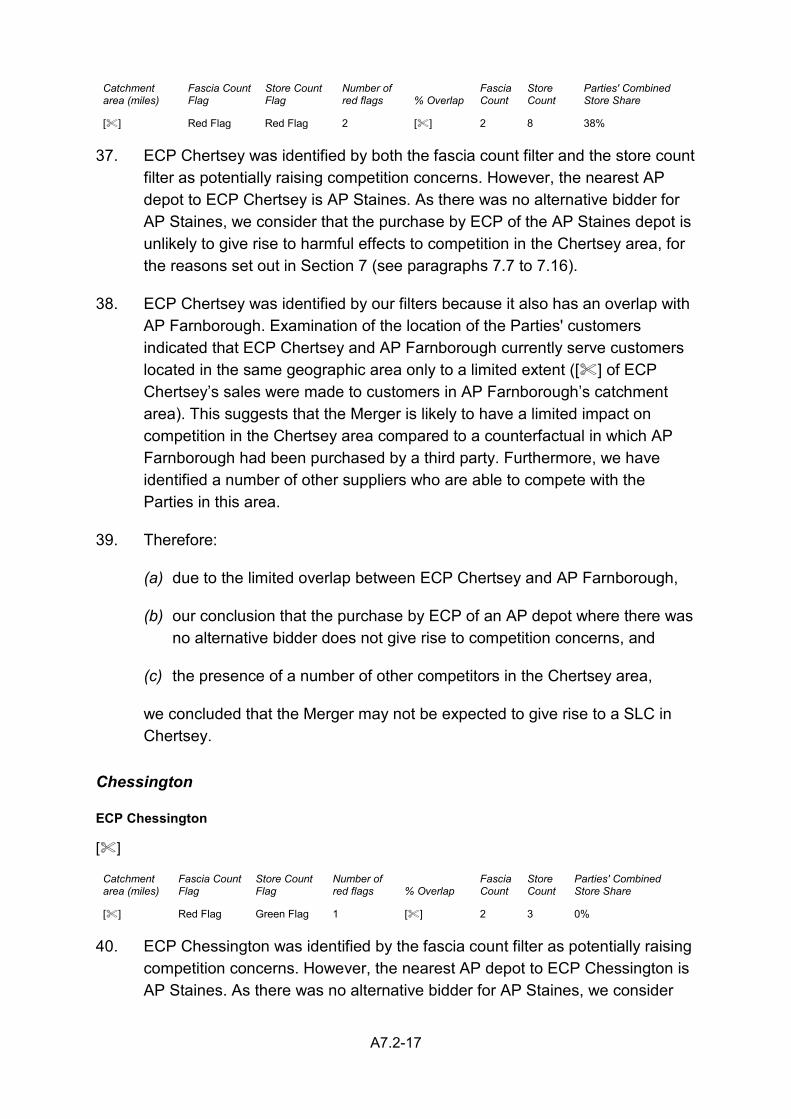
A7.2-17
Catchment area (miles)
Fascia Count Flag
Store Count Flag
Number of red flags % Overlap
Fascia Count
Store Count
Parties' Combined Store Share
[] Red Flag Red Flag 2 [] 2 8 38% 37. ECP Chertsey was identified by both the fascia count filter and the store count
filter as potentially raising competition concerns. However, the nearest AP depot to ECP Chertsey is AP Staines. As there was no alternative bidder for AP Staines, we consider that the purchase by ECP of the AP Staines depot is unlikely to give rise to harmful effects to competition in the Chertsey area, for the reasons set out in Section 7 (see paragraphs 7.7 to 7.16).
38. ECP Chertsey was identified by our filters because it also has an overlap with AP Farnborough. Examination of the location of the Parties' customers indicated that ECP Chertsey and AP Farnborough currently serve customers located in the same geographic area only to a limited extent ([] of ECP Chertsey’s sales were made to customers in AP Farnborough’s catchment area). This suggests that the Merger is likely to have a limited impact on competition in the Chertsey area compared to a counterfactual in which AP Farnborough had been purchased by a third party. Furthermore, we have identified a number of other suppliers who are able to compete with the Parties in this area.
39. Therefore:
(a) due to the limited overlap between ECP Chertsey and AP Farnborough,
(b) our conclusion that the purchase by ECP of an AP depot where there was no alternative bidder does not give rise to competition concerns, and
(c) the presence of a number of other competitors in the Chertsey area,
we concluded that the Merger may not be expected to give rise to a SLC in Chertsey.
Chessington
ECP Chessington
[]
Catchment area (miles)
Fascia Count Flag
Store Count Flag
Number of red flags % Overlap
Fascia Count
Store Count
Parties' Combined Store Share
[] Red Flag Green Flag 1 [] 2 3 0% 40. ECP Chessington was identified by the fascia count filter as potentially raising
competition concerns. However, the nearest AP depot to ECP Chessington is AP Staines. As there was no alternative bidder for AP Staines, we consider
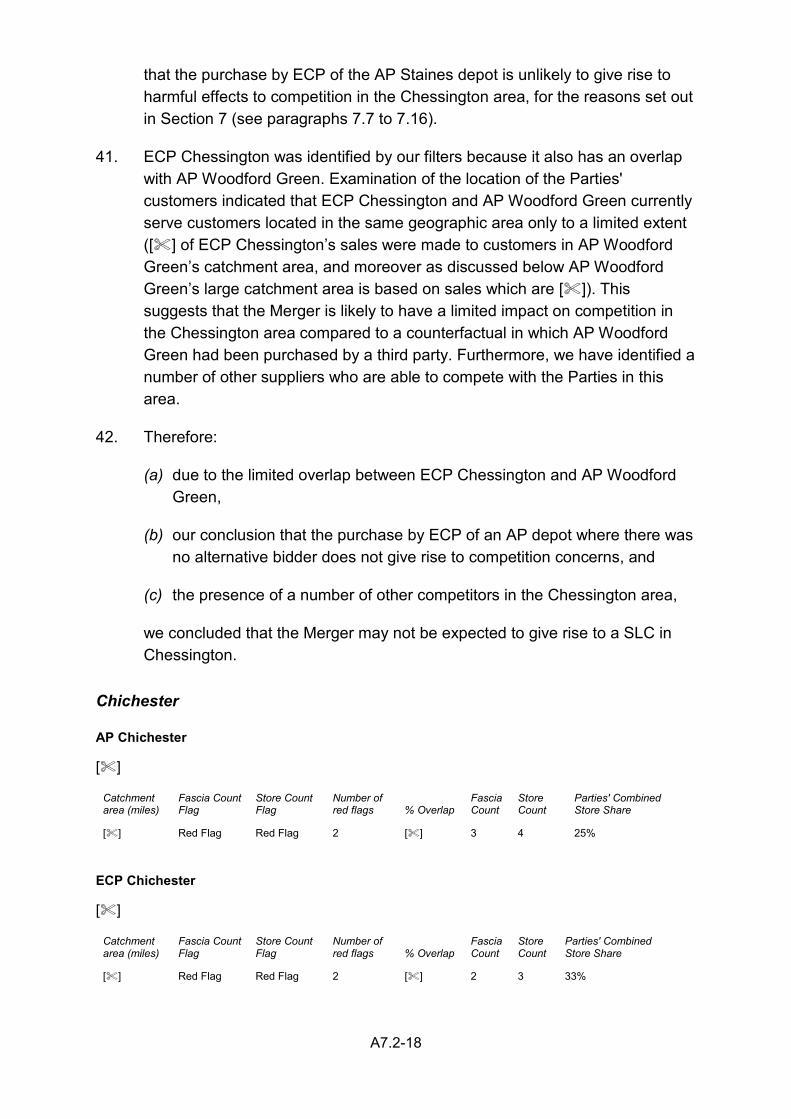
A7.2-18
that the purchase by ECP of the AP Staines depot is unlikely to give rise to harmful effects to competition in the Chessington area, for the reasons set out in Section 7 (see paragraphs 7.7 to 7.16).
41. ECP Chessington was identified by our filters because it also has an overlap with AP Woodford Green. Examination of the location of the Parties' customers indicated that ECP Chessington and AP Woodford Green currently serve customers located in the same geographic area only to a limited extent ([] of ECP Chessington’s sales were made to customers in AP Woodford Green’s catchment area, and moreover as discussed below AP Woodford Green’s large catchment area is based on sales which are []). This suggests that the Merger is likely to have a limited impact on competition in the Chessington area compared to a counterfactual in which AP Woodford Green had been purchased by a third party. Furthermore, we have identified a number of other suppliers who are able to compete with the Parties in this area.
42. Therefore:
(a) due to the limited overlap between ECP Chessington and AP Woodford Green,
(b) our conclusion that the purchase by ECP of an AP depot where there was no alternative bidder does not give rise to competition concerns, and
(c) the presence of a number of other competitors in the Chessington area,
we concluded that the Merger may not be expected to give rise to a SLC in Chessington.
Chichester
AP Chichester
[]
Catchment area (miles)
Fascia Count Flag
Store Count Flag
Number of red flags % Overlap
Fascia Count
Store Count
Parties' Combined Store Share
[] Red Flag Red Flag 2 [] 3 4 25% ECP Chichester
[]
Catchment area (miles)
Fascia Count Flag
Store Count Flag
Number of red flags % Overlap
Fascia Count
Store Count
Parties' Combined Store Share
[] Red Flag Red Flag 2 [] 2 3 33%
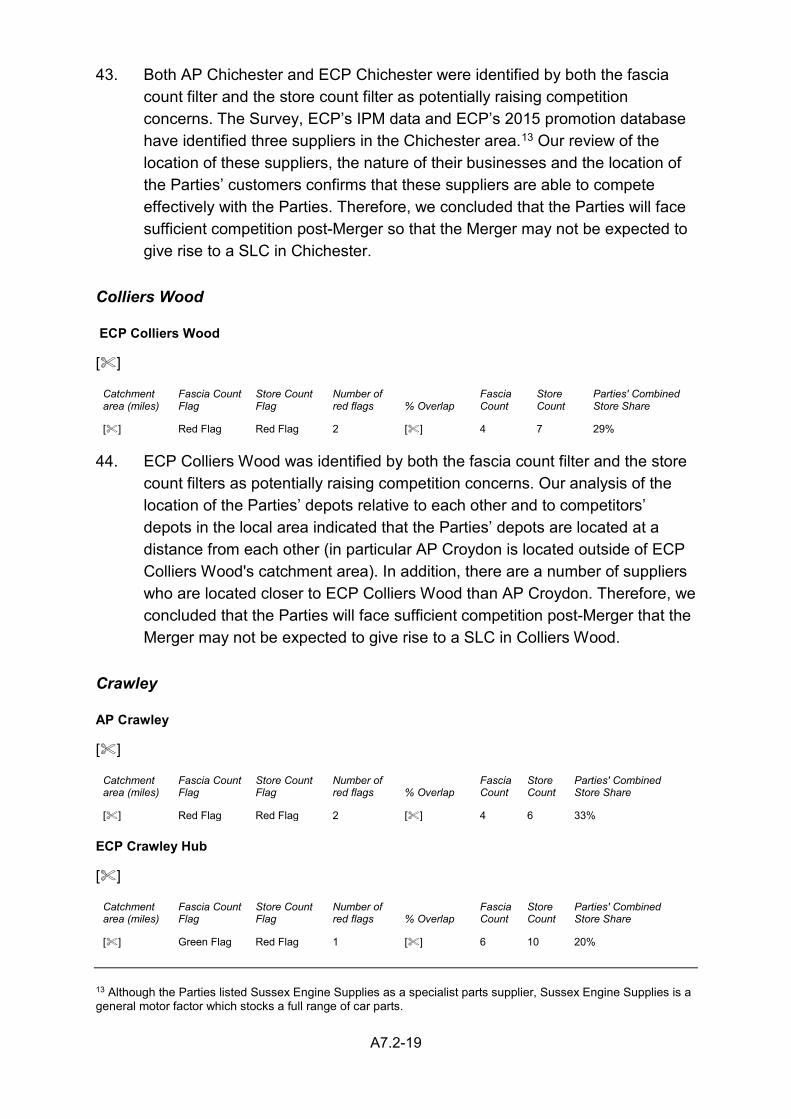
A7.2-19
43. Both AP Chichester and ECP Chichester were identified by both the fascia count filter and the store count filter as potentially raising competition concerns. The Survey, ECP’s IPM data and ECP’s 2015 promotion database have identified three suppliers in the Chichester area.13 Our review of the location of these suppliers, the nature of their businesses and the location of the Parties’ customers confirms that these suppliers are able to compete effectively with the Parties. Therefore, we concluded that the Parties will face sufficient competition post-Merger so that the Merger may not be expected to give rise to a SLC in Chichester.
Colliers Wood
ECP Colliers Wood
[]
Catchment area (miles)
Fascia Count Flag
Store Count Flag
Number of red flags % Overlap
Fascia Count
Store Count
Parties' Combined Store Share
[] Red Flag Red Flag 2 [] 4 7 29% 44. ECP Colliers Wood was identified by both the fascia count filter and the store
count filters as potentially raising competition concerns. Our analysis of the location of the Parties’ depots relative to each other and to competitors’ depots in the local area indicated that the Parties’ depots are located at a distance from each other (in particular AP Croydon is located outside of ECP Colliers Wood's catchment area). In addition, there are a number of suppliers who are located closer to ECP Colliers Wood than AP Croydon. Therefore, we concluded that the Parties will face sufficient competition post-Merger that the Merger may not be expected to give rise to a SLC in Colliers Wood.
Crawley
AP Crawley
[]
Catchment area (miles)
Fascia Count Flag
Store Count Flag
Number of red flags % Overlap
Fascia Count
Store Count
Parties' Combined Store Share
[] Red Flag Red Flag 2 [] 4 6 33% ECP Crawley Hub
[]
Catchment area (miles)
Fascia Count Flag
Store Count Flag
Number of red flags % Overlap
Fascia Count
Store Count
Parties' Combined Store Share
[] Green Flag Red Flag 1 [] 6 10 20% 13 Although the Parties listed Sussex Engine Supplies as a specialist parts supplier, Sussex Engine Supplies is a general motor factor which stocks a full range of car parts.
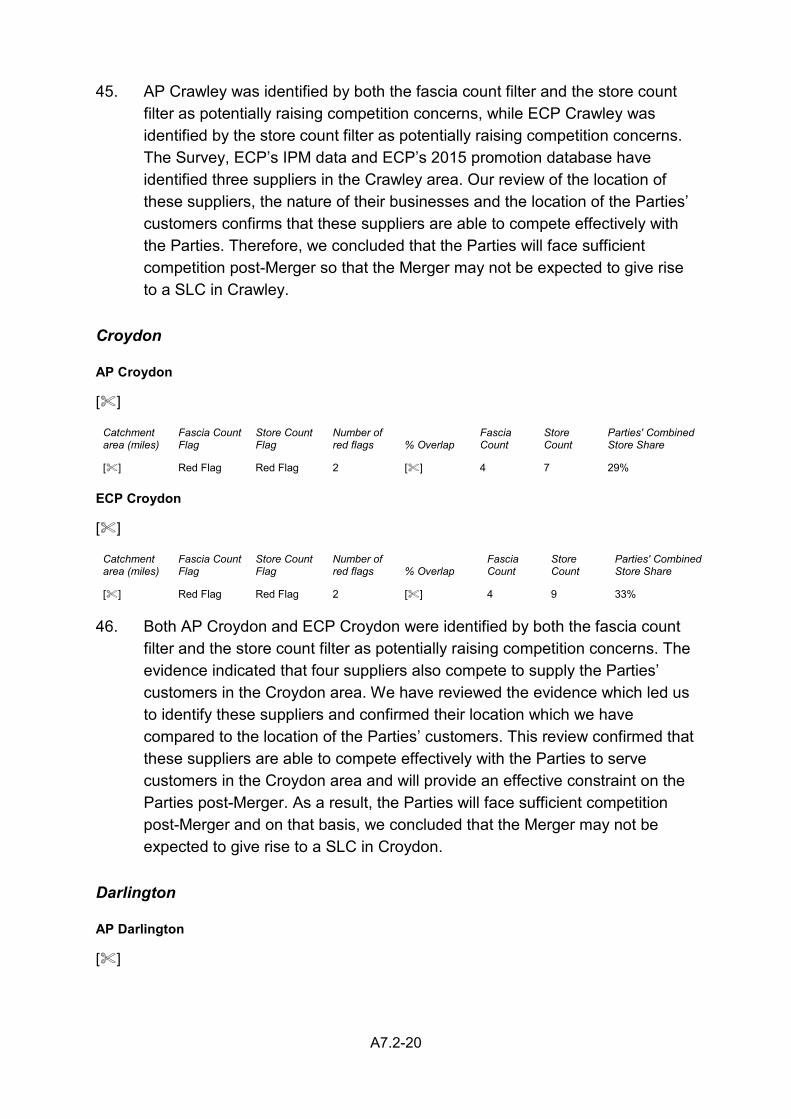
A7.2-20
45. AP Crawley was identified by both the fascia count filter and the store count
filter as potentially raising competition concerns, while ECP Crawley was identified by the store count filter as potentially raising competition concerns. The Survey, ECP’s IPM data and ECP’s 2015 promotion database have identified three suppliers in the Crawley area. Our review of the location of these suppliers, the nature of their businesses and the location of the Parties’ customers confirms that these suppliers are able to compete effectively with the Parties. Therefore, we concluded that the Parties will face sufficient competition post-Merger so that the Merger may not be expected to give rise to a SLC in Crawley.
Croydon
AP Croydon
[]
Catchment area (miles)
Fascia Count Flag
Store Count Flag
Number of red flags % Overlap
Fascia Count
Store Count
Parties' Combined Store Share
[] Red Flag Red Flag 2 [] 4 7 29% ECP Croydon
[]
Catchment area (miles)
Fascia Count Flag
Store Count Flag
Number of red flags % Overlap
Fascia Count
Store Count
Parties' Combined Store Share
[] Red Flag Red Flag 2 [] 4 9 33% 46. Both AP Croydon and ECP Croydon were identified by both the fascia count
filter and the store count filter as potentially raising competition concerns. The evidence indicated that four suppliers also compete to supply the Parties’ customers in the Croydon area. We have reviewed the evidence which led us to identify these suppliers and confirmed their location which we have compared to the location of the Parties’ customers. This review confirmed that these suppliers are able to compete effectively with the Parties to serve customers in the Croydon area and will provide an effective constraint on the Parties post-Merger. As a result, the Parties will face sufficient competition post-Merger and on that basis, we concluded that the Merger may not be expected to give rise to a SLC in Croydon.
Darlington
AP Darlington
[]
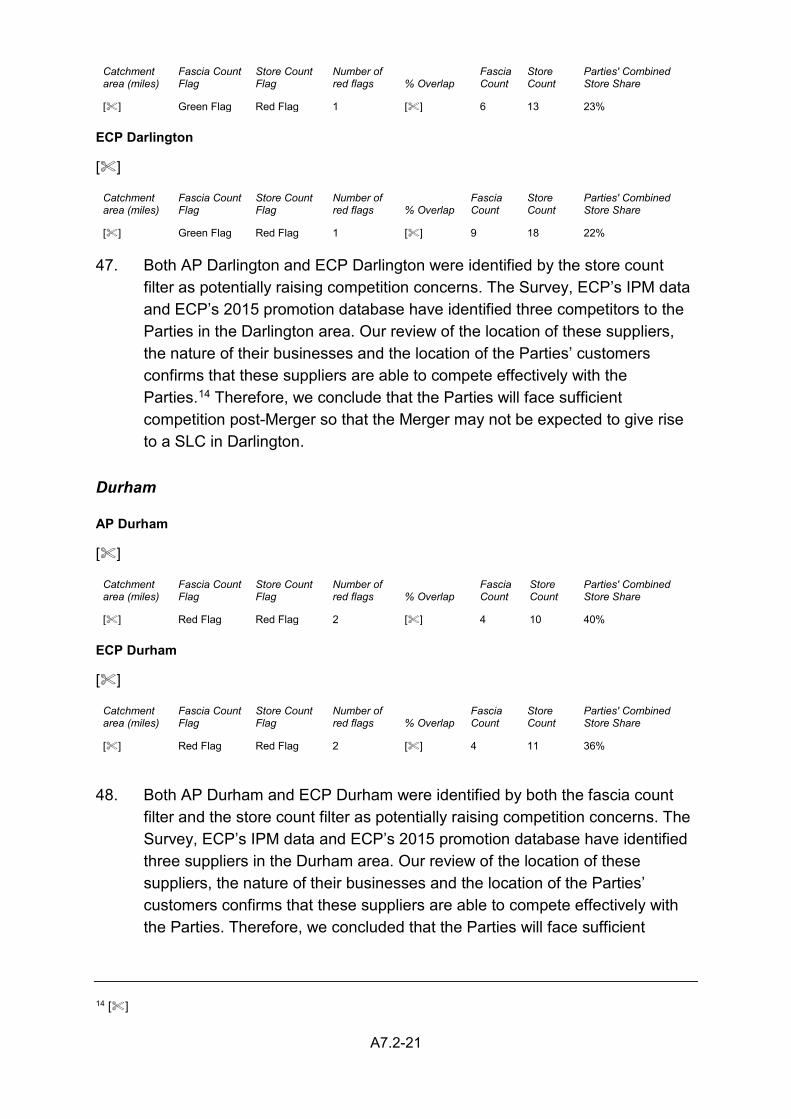
A7.2-21
Catchment area (miles)
Fascia Count Flag
Store Count Flag
Number of red flags % Overlap
Fascia Count
Store Count
Parties' Combined Store Share
[] Green Flag Red Flag 1 [] 6 13 23% ECP Darlington
[]
Catchment area (miles)
Fascia Count Flag
Store Count Flag
Number of red flags % Overlap
Fascia Count
Store Count
Parties' Combined Store Share
[] Green Flag Red Flag 1 [] 9 18 22% 47. Both AP Darlington and ECP Darlington were identified by the store count
filter as potentially raising competition concerns. The Survey, ECP’s IPM data and ECP’s 2015 promotion database have identified three competitors to the Parties in the Darlington area. Our review of the location of these suppliers, the nature of their businesses and the location of the Parties’ customers confirms that these suppliers are able to compete effectively with the Parties.14 Therefore, we conclude that the Parties will face sufficient competition post-Merger so that the Merger may not be expected to give rise to a SLC in Darlington.
Durham
AP Durham
[]
Catchment area (miles)
Fascia Count Flag
Store Count Flag
Number of red flags % Overlap
Fascia Count
Store Count
Parties' Combined Store Share
[] Red Flag Red Flag 2 [] 4 10 40% ECP Durham
[]
Catchment area (miles)
Fascia Count Flag
Store Count Flag
Number of red flags % Overlap
Fascia Count
Store Count
Parties' Combined Store Share
[] Red Flag Red Flag 2 [] 4 11 36% 48. Both AP Durham and ECP Durham were identified by both the fascia count
filter and the store count filter as potentially raising competition concerns. The Survey, ECP’s IPM data and ECP’s 2015 promotion database have identified three suppliers in the Durham area. Our review of the location of these suppliers, the nature of their businesses and the location of the Parties’ customers confirms that these suppliers are able to compete effectively with the Parties. Therefore, we concluded that the Parties will face sufficient
14 []
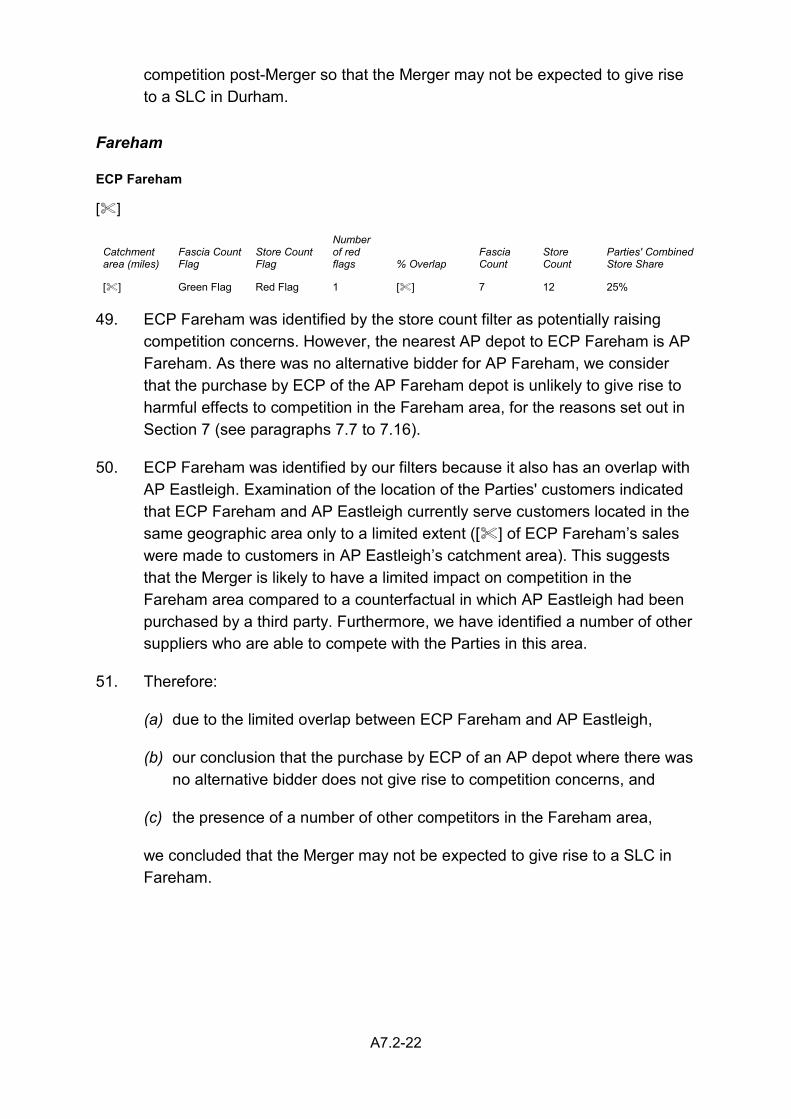
A7.2-22
competition post-Merger so that the Merger may not be expected to give rise to a SLC in Durham.
Fareham
ECP Fareham
[]
Catchment area (miles)
Fascia Count Flag
Store Count Flag
Number of red flags % Overlap
Fascia Count
Store Count
Parties' Combined Store Share
[] Green Flag Red Flag 1 [] 7 12 25% 49. ECP Fareham was identified by the store count filter as potentially raising
competition concerns. However, the nearest AP depot to ECP Fareham is AP Fareham. As there was no alternative bidder for AP Fareham, we consider that the purchase by ECP of the AP Fareham depot is unlikely to give rise to harmful effects to competition in the Fareham area, for the reasons set out in Section 7 (see paragraphs 7.7 to 7.16).
50. ECP Fareham was identified by our filters because it also has an overlap with AP Eastleigh. Examination of the location of the Parties' customers indicated that ECP Fareham and AP Eastleigh currently serve customers located in the same geographic area only to a limited extent ([] of ECP Fareham’s sales were made to customers in AP Eastleigh’s catchment area). This suggests that the Merger is likely to have a limited impact on competition in the Fareham area compared to a counterfactual in which AP Eastleigh had been purchased by a third party. Furthermore, we have identified a number of other suppliers who are able to compete with the Parties in this area.
51. Therefore:
(a) due to the limited overlap between ECP Fareham and AP Eastleigh,
(b) our conclusion that the purchase by ECP of an AP depot where there was no alternative bidder does not give rise to competition concerns, and
(c) the presence of a number of other competitors in the Fareham area,
we concluded that the Merger may not be expected to give rise to a SLC in Fareham.
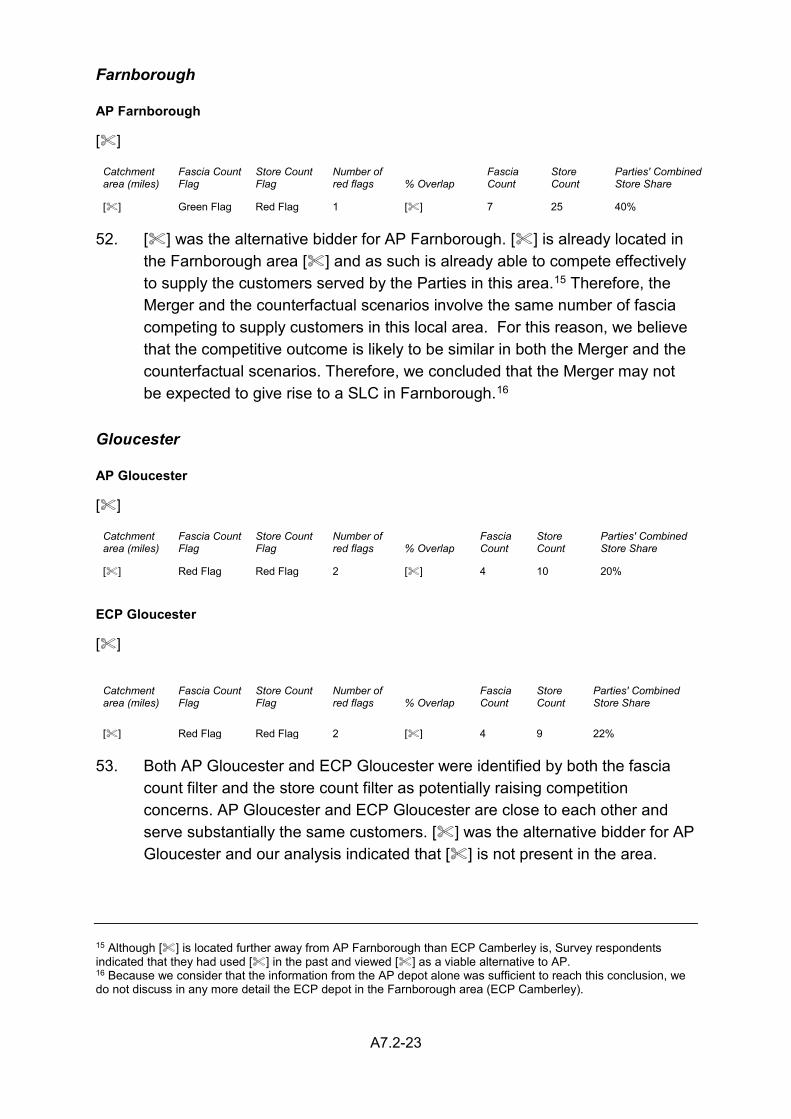
A7.2-23
Farnborough
AP Farnborough
[]
Catchment area (miles)
Fascia Count Flag
Store Count Flag
Number of red flags % Overlap
Fascia Count
Store Count
Parties' Combined Store Share
[] Green Flag Red Flag 1 [] 7 25 40% 52. [] was the alternative bidder for AP Farnborough. [] is already located in
the Farnborough area [] and as such is already able to compete effectively to supply the customers served by the Parties in this area.15 Therefore, the Merger and the counterfactual scenarios involve the same number of fascia competing to supply customers in this local area. For this reason, we believe that the competitive outcome is likely to be similar in both the Merger and the counterfactual scenarios. Therefore, we concluded that the Merger may not be expected to give rise to a SLC in Farnborough.16
Gloucester
AP Gloucester
[]
Catchment area (miles)
Fascia Count Flag
Store Count Flag
Number of red flags % Overlap
Fascia Count
Store Count
Parties' Combined Store Share
[] Red Flag Red Flag 2 [] 4 10 20% ECP Gloucester
[]
Catchment area (miles)
Fascia Count Flag
Store Count Flag
Number of red flags % Overlap
Fascia Count
Store Count
Parties' Combined Store Share
[] Red Flag Red Flag 2 [] 4 9 22% 53. Both AP Gloucester and ECP Gloucester were identified by both the fascia
count filter and the store count filter as potentially raising competition concerns. AP Gloucester and ECP Gloucester are close to each other and serve substantially the same customers. [] was the alternative bidder for AP Gloucester and our analysis indicated that [] is not present in the area.
15 Although [] is located further away from AP Farnborough than ECP Camberley is, Survey respondents indicated that they had used [] in the past and viewed [] as a viable alternative to AP. 16 Because we consider that the information from the AP depot alone was sufficient to reach this conclusion, we do not discuss in any more detail the ECP depot in the Farnborough area (ECP Camberley).
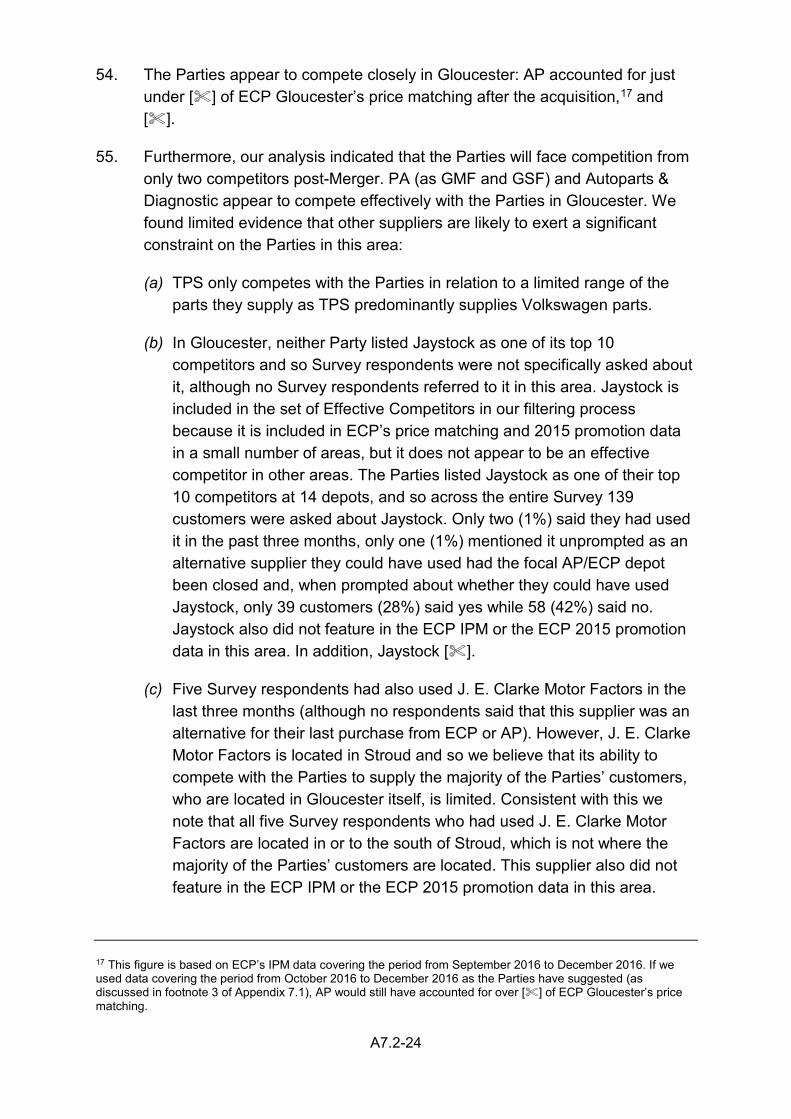
A7.2-24
54. The Parties appear to compete closely in Gloucester: AP accounted for just under [] of ECP Gloucester’s price matching after the acquisition,17 and [].
55. Furthermore, our analysis indicated that the Parties will face competition from only two competitors post-Merger. PA (as GMF and GSF) and Autoparts & Diagnostic appear to compete effectively with the Parties in Gloucester. We found limited evidence that other suppliers are likely to exert a significant constraint on the Parties in this area:
(a) TPS only competes with the Parties in relation to a limited range of the parts they supply as TPS predominantly supplies Volkswagen parts.
(b) In Gloucester, neither Party listed Jaystock as one of its top 10 competitors and so Survey respondents were not specifically asked about it, although no Survey respondents referred to it in this area. Jaystock is included in the set of Effective Competitors in our filtering process because it is included in ECP’s price matching and 2015 promotion data in a small number of areas, but it does not appear to be an effective competitor in other areas. The Parties listed Jaystock as one of their top 10 competitors at 14 depots, and so across the entire Survey 139 customers were asked about Jaystock. Only two (1%) said they had used it in the past three months, only one (1%) mentioned it unprompted as an alternative supplier they could have used had the focal AP/ECP depot been closed and, when prompted about whether they could have used Jaystock, only 39 customers (28%) said yes while 58 (42%) said no. Jaystock also did not feature in the ECP IPM or the ECP 2015 promotion data in this area. In addition, Jaystock [].
(c) Five Survey respondents had also used J. E. Clarke Motor Factors in the last three months (although no respondents said that this supplier was an alternative for their last purchase from ECP or AP). However, J. E. Clarke Motor Factors is located in Stroud and so we believe that its ability to compete with the Parties to supply the majority of the Parties’ customers, who are located in Gloucester itself, is limited. Consistent with this we note that all five Survey respondents who had used J. E. Clarke Motor Factors are located in or to the south of Stroud, which is not where the majority of the Parties’ customers are located. This supplier also did not feature in the ECP IPM or the ECP 2015 promotion data in this area.
17 This figure is based on ECP’s IPM data covering the period from September 2016 to December 2016. If we used data covering the period from October 2016 to December 2016 as the Parties have suggested (as discussed in footnote 3 of Appendix 7.1), AP would still have accounted for over [] of ECP Gloucester’s price matching.
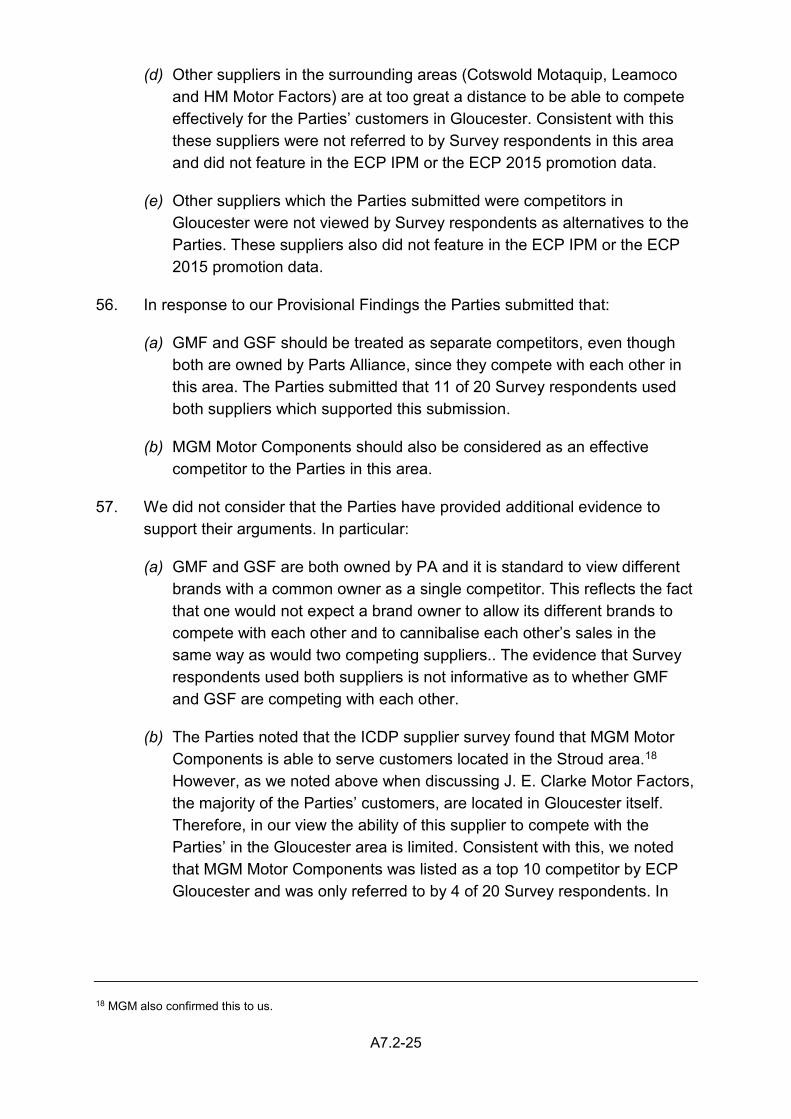
A7.2-25
(d) Other suppliers in the surrounding areas (Cotswold Motaquip, Leamoco and HM Motor Factors) are at too great a distance to be able to compete effectively for the Parties’ customers in Gloucester. Consistent with this these suppliers were not referred to by Survey respondents in this area and did not feature in the ECP IPM or the ECP 2015 promotion data.
(e) Other suppliers which the Parties submitted were competitors in Gloucester were not viewed by Survey respondents as alternatives to the Parties. These suppliers also did not feature in the ECP IPM or the ECP 2015 promotion data.
56. In response to our Provisional Findings the Parties submitted that:
(a) GMF and GSF should be treated as separate competitors, even though both are owned by Parts Alliance, since they compete with each other in this area. The Parties submitted that 11 of 20 Survey respondents used both suppliers which supported this submission.
(b) MGM Motor Components should also be considered as an effective competitor to the Parties in this area.
57. We did not consider that the Parties have provided additional evidence to support their arguments. In particular:
(a) GMF and GSF are both owned by PA and it is standard to view different brands with a common owner as a single competitor. This reflects the fact that one would not expect a brand owner to allow its different brands to compete with each other and to cannibalise each other’s sales in the same way as would two competing suppliers.. The evidence that Survey respondents used both suppliers is not informative as to whether GMF and GSF are competing with each other.
(b) The Parties noted that the ICDP supplier survey found that MGM Motor Components is able to serve customers located in the Stroud area.18 However, as we noted above when discussing J. E. Clarke Motor Factors, the majority of the Parties’ customers, are located in Gloucester itself. Therefore, in our view the ability of this supplier to compete with the Parties’ in the Gloucester area is limited. Consistent with this, we noted that MGM Motor Components was listed as a top 10 competitor by ECP Gloucester and was only referred to by 4 of 20 Survey respondents. In
18 MGM also confirmed this to us.
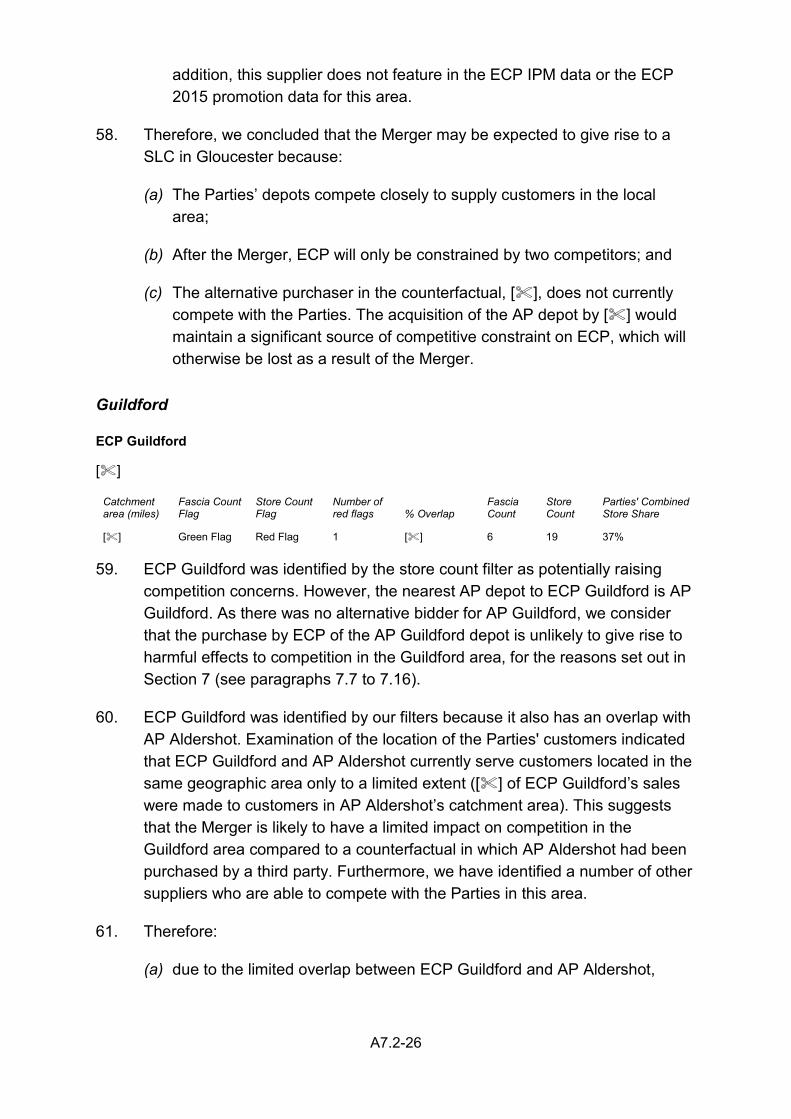
A7.2-26
addition, this supplier does not feature in the ECP IPM data or the ECP 2015 promotion data for this area.
58. Therefore, we concluded that the Merger may be expected to give rise to a SLC in Gloucester because:
(a) The Parties’ depots compete closely to supply customers in the local area;
(b) After the Merger, ECP will only be constrained by two competitors; and
(c) The alternative purchaser in the counterfactual, [], does not currently compete with the Parties. The acquisition of the AP depot by [] would maintain a significant source of competitive constraint on ECP, which will otherwise be lost as a result of the Merger.
Guildford
ECP Guildford
[]
Catchment area (miles)
Fascia Count Flag
Store Count Flag
Number of red flags % Overlap
Fascia Count
Store Count
Parties' Combined Store Share
[] Green Flag Red Flag 1 [] 6 19 37% 59. ECP Guildford was identified by the store count filter as potentially raising
competition concerns. However, the nearest AP depot to ECP Guildford is AP Guildford. As there was no alternative bidder for AP Guildford, we consider that the purchase by ECP of the AP Guildford depot is unlikely to give rise to harmful effects to competition in the Guildford area, for the reasons set out in Section 7 (see paragraphs 7.7 to 7.16).
60. ECP Guildford was identified by our filters because it also has an overlap with AP Aldershot. Examination of the location of the Parties' customers indicated that ECP Guildford and AP Aldershot currently serve customers located in the same geographic area only to a limited extent ([] of ECP Guildford’s sales were made to customers in AP Aldershot’s catchment area). This suggests that the Merger is likely to have a limited impact on competition in the Guildford area compared to a counterfactual in which AP Aldershot had been purchased by a third party. Furthermore, we have identified a number of other suppliers who are able to compete with the Parties in this area.
61. Therefore:
(a) due to the limited overlap between ECP Guildford and AP Aldershot,
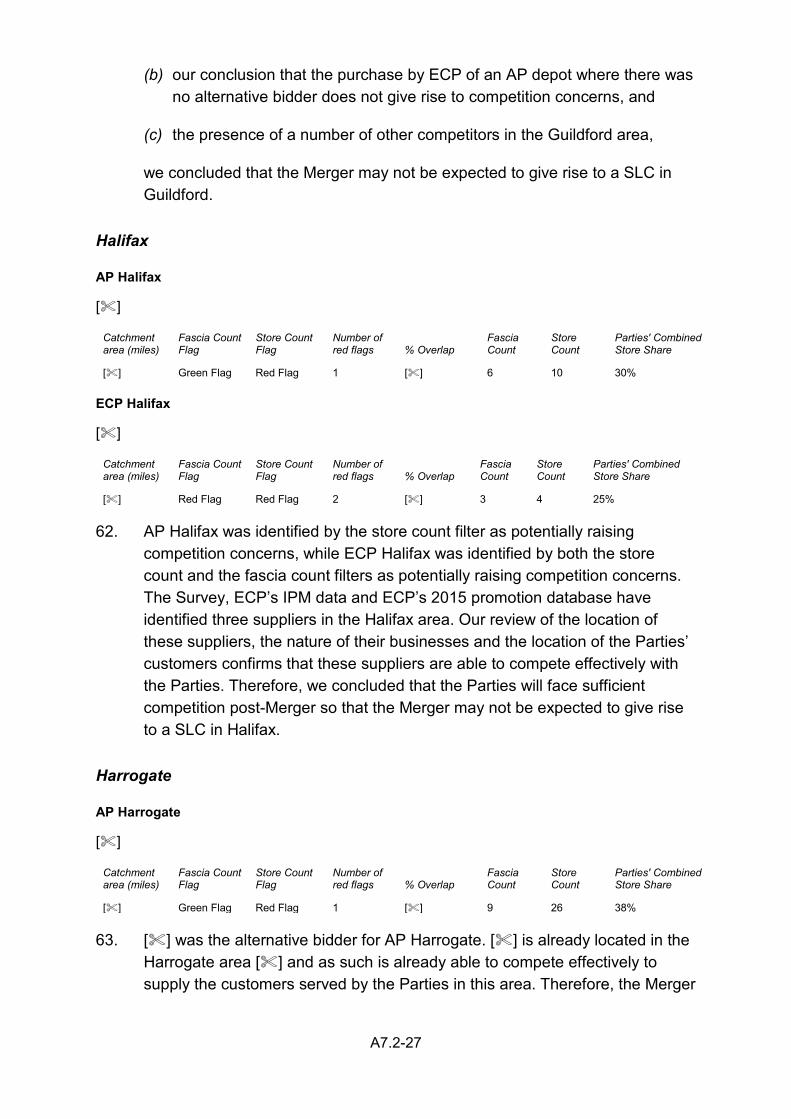
A7.2-27
(b) our conclusion that the purchase by ECP of an AP depot where there was no alternative bidder does not give rise to competition concerns, and
(c) the presence of a number of other competitors in the Guildford area,
we concluded that the Merger may not be expected to give rise to a SLC in Guildford.
Halifax
AP Halifax
[]
Catchment area (miles)
Fascia Count Flag
Store Count Flag
Number of red flags % Overlap
Fascia Count
Store Count
Parties' Combined Store Share
[] Green Flag Red Flag 1 [] 6 10 30% ECP Halifax
[]
Catchment area (miles)
Fascia Count Flag
Store Count Flag
Number of red flags % Overlap
Fascia Count
Store Count
Parties' Combined Store Share
[] Red Flag Red Flag 2 [] 3 4 25% 62. AP Halifax was identified by the store count filter as potentially raising
competition concerns, while ECP Halifax was identified by both the store count and the fascia count filters as potentially raising competition concerns. The Survey, ECP’s IPM data and ECP’s 2015 promotion database have identified three suppliers in the Halifax area. Our review of the location of these suppliers, the nature of their businesses and the location of the Parties’ customers confirms that these suppliers are able to compete effectively with the Parties. Therefore, we concluded that the Parties will face sufficient competition post-Merger so that the Merger may not be expected to give rise to a SLC in Halifax.
Harrogate
AP Harrogate
[]
Catchment area (miles)
Fascia Count Flag
Store Count Flag
Number of red flags % Overlap
Fascia Count
Store Count
Parties' Combined Store Share
[] Green Flag Red Flag 1 [] 9 26 38% 63. [] was the alternative bidder for AP Harrogate. [] is already located in the
Harrogate area [] and as such is already able to compete effectively to supply the customers served by the Parties in this area. Therefore, the Merger
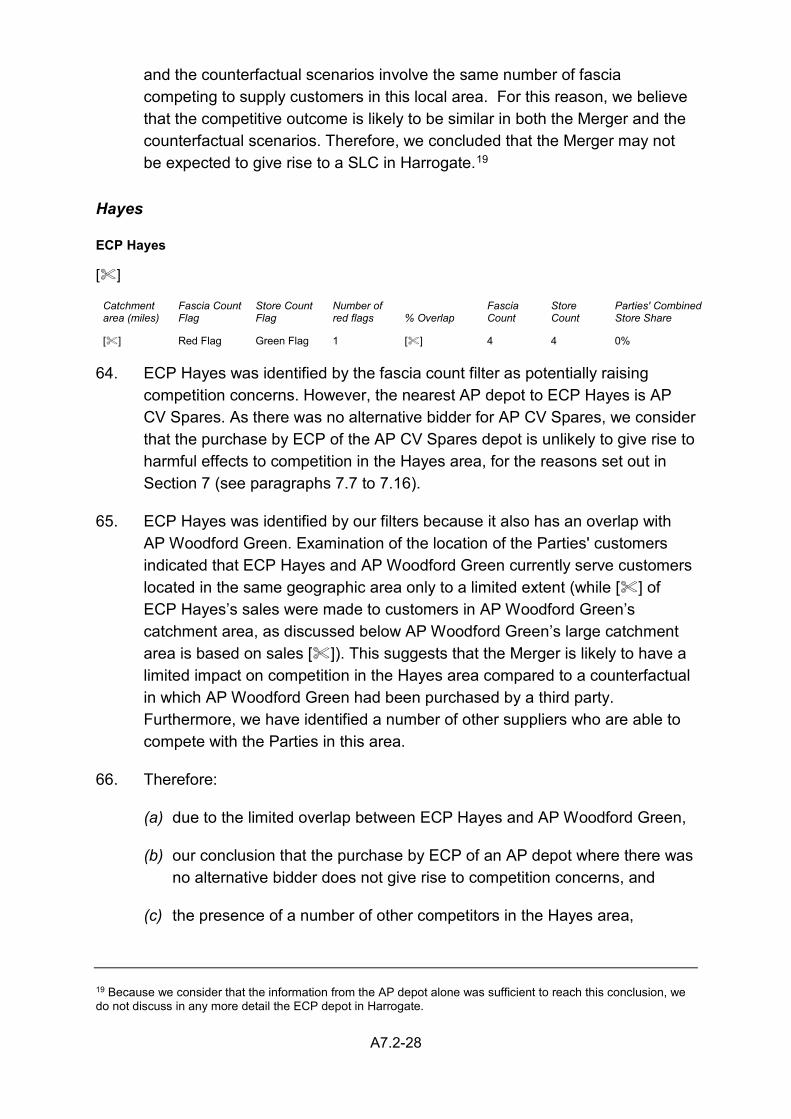
A7.2-28
and the counterfactual scenarios involve the same number of fascia competing to supply customers in this local area. For this reason, we believe that the competitive outcome is likely to be similar in both the Merger and the counterfactual scenarios. Therefore, we concluded that the Merger may not be expected to give rise to a SLC in Harrogate.19
Hayes
ECP Hayes
[]
Catchment area (miles)
Fascia Count Flag
Store Count Flag
Number of red flags % Overlap
Fascia Count
Store Count
Parties' Combined Store Share
[] Red Flag Green Flag 1 [] 4 4 0% 64. ECP Hayes was identified by the fascia count filter as potentially raising
competition concerns. However, the nearest AP depot to ECP Hayes is AP CV Spares. As there was no alternative bidder for AP CV Spares, we consider that the purchase by ECP of the AP CV Spares depot is unlikely to give rise to harmful effects to competition in the Hayes area, for the reasons set out in Section 7 (see paragraphs 7.7 to 7.16).
65. ECP Hayes was identified by our filters because it also has an overlap with AP Woodford Green. Examination of the location of the Parties' customers indicated that ECP Hayes and AP Woodford Green currently serve customers located in the same geographic area only to a limited extent (while [] of ECP Hayes’s sales were made to customers in AP Woodford Green’s catchment area, as discussed below AP Woodford Green’s large catchment area is based on sales []). This suggests that the Merger is likely to have a limited impact on competition in the Hayes area compared to a counterfactual in which AP Woodford Green had been purchased by a third party. Furthermore, we have identified a number of other suppliers who are able to compete with the Parties in this area.
66. Therefore:
(a) due to the limited overlap between ECP Hayes and AP Woodford Green,
(b) our conclusion that the purchase by ECP of an AP depot where there was no alternative bidder does not give rise to competition concerns, and
(c) the presence of a number of other competitors in the Hayes area,
19 Because we consider that the information from the AP depot alone was sufficient to reach this conclusion, we do not discuss in any more detail the ECP depot in Harrogate.
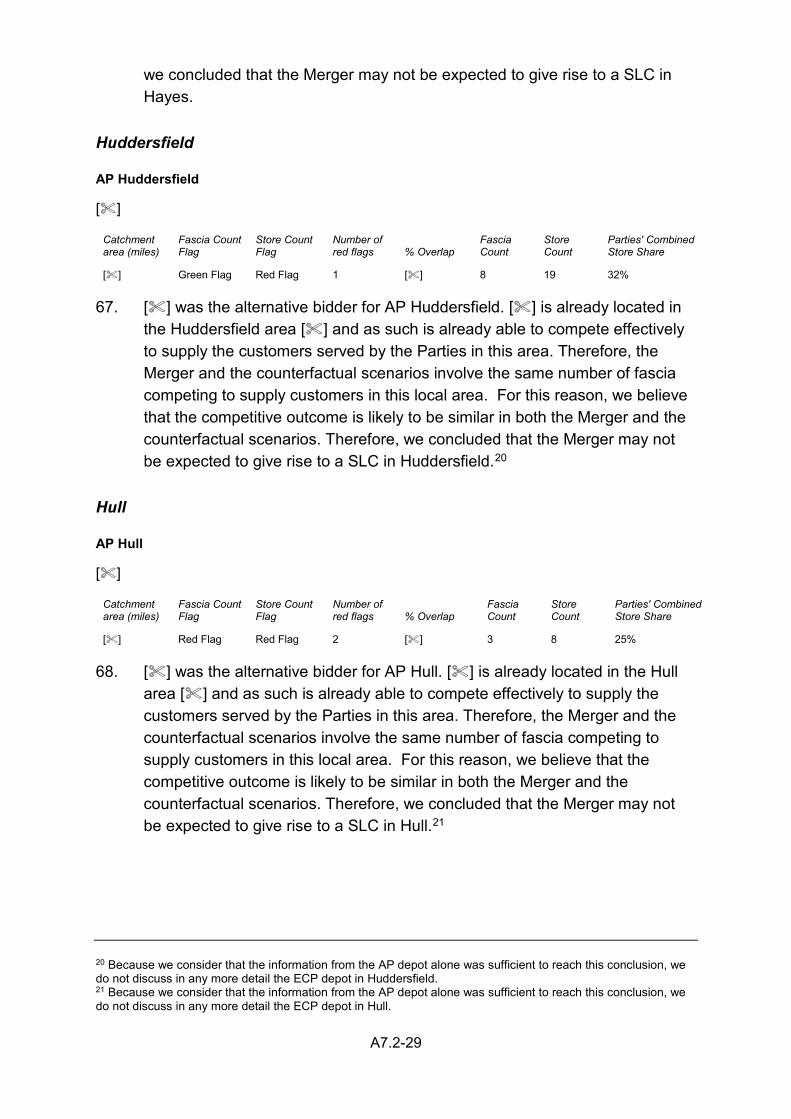
A7.2-29
we concluded that the Merger may not be expected to give rise to a SLC in Hayes.
Huddersfield
AP Huddersfield
[]
Catchment area (miles)
Fascia Count Flag
Store Count Flag
Number of red flags % Overlap
Fascia Count
Store Count
Parties' Combined Store Share
[] Green Flag Red Flag 1 [] 8 19 32% 67. [] was the alternative bidder for AP Huddersfield. [] is already located in
the Huddersfield area [] and as such is already able to compete effectively to supply the customers served by the Parties in this area. Therefore, the Merger and the counterfactual scenarios involve the same number of fascia competing to supply customers in this local area. For this reason, we believe that the competitive outcome is likely to be similar in both the Merger and the counterfactual scenarios. Therefore, we concluded that the Merger may not be expected to give rise to a SLC in Huddersfield.20
Hull
AP Hull
[]
Catchment area (miles)
Fascia Count Flag
Store Count Flag
Number of red flags % Overlap
Fascia Count
Store Count
Parties' Combined Store Share
[] Red Flag Red Flag 2 [] 3 8 25% 68. [] was the alternative bidder for AP Hull. [] is already located in the Hull
area [] and as such is already able to compete effectively to supply the customers served by the Parties in this area. Therefore, the Merger and the counterfactual scenarios involve the same number of fascia competing to supply customers in this local area. For this reason, we believe that the competitive outcome is likely to be similar in both the Merger and the counterfactual scenarios. Therefore, we concluded that the Merger may not be expected to give rise to a SLC in Hull.21
20 Because we consider that the information from the AP depot alone was sufficient to reach this conclusion, we do not discuss in any more detail the ECP depot in Huddersfield. 21 Because we consider that the information from the AP depot alone was sufficient to reach this conclusion, we do not discuss in any more detail the ECP depot in Hull.
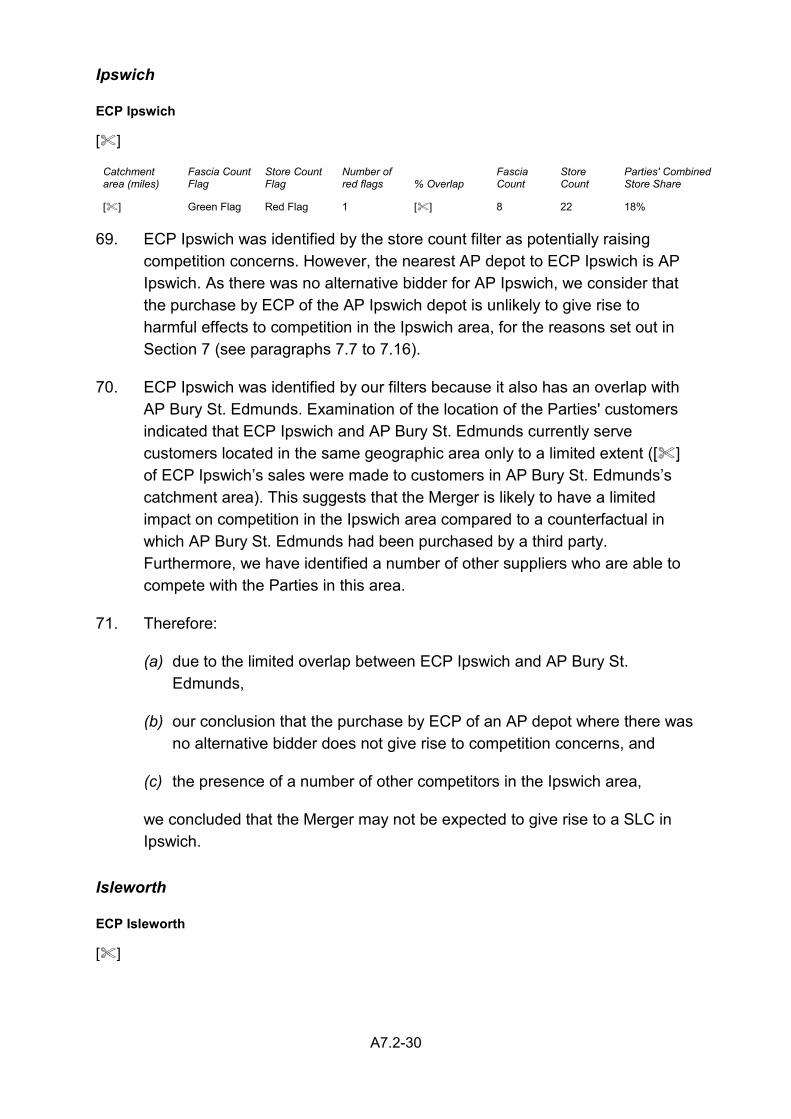
A7.2-30
Ipswich
ECP Ipswich
[]
Catchment area (miles)
Fascia Count Flag
Store Count Flag
Number of red flags % Overlap
Fascia Count
Store Count
Parties' Combined Store Share
[] Green Flag Red Flag 1 [] 8 22 18% 69. ECP Ipswich was identified by the store count filter as potentially raising
competition concerns. However, the nearest AP depot to ECP Ipswich is AP Ipswich. As there was no alternative bidder for AP Ipswich, we consider that the purchase by ECP of the AP Ipswich depot is unlikely to give rise to harmful effects to competition in the Ipswich area, for the reasons set out in Section 7 (see paragraphs 7.7 to 7.16).
70. ECP Ipswich was identified by our filters because it also has an overlap with AP Bury St. Edmunds. Examination of the location of the Parties' customers indicated that ECP Ipswich and AP Bury St. Edmunds currently serve customers located in the same geographic area only to a limited extent ([] of ECP Ipswich’s sales were made to customers in AP Bury St. Edmunds’s catchment area). This suggests that the Merger is likely to have a limited impact on competition in the Ipswich area compared to a counterfactual in which AP Bury St. Edmunds had been purchased by a third party. Furthermore, we have identified a number of other suppliers who are able to compete with the Parties in this area.
71. Therefore:
(a) due to the limited overlap between ECP Ipswich and AP Bury St. Edmunds,
(b) our conclusion that the purchase by ECP of an AP depot where there was no alternative bidder does not give rise to competition concerns, and
(c) the presence of a number of other competitors in the Ipswich area,
we concluded that the Merger may not be expected to give rise to a SLC in Ipswich.
Isleworth
ECP Isleworth
[]
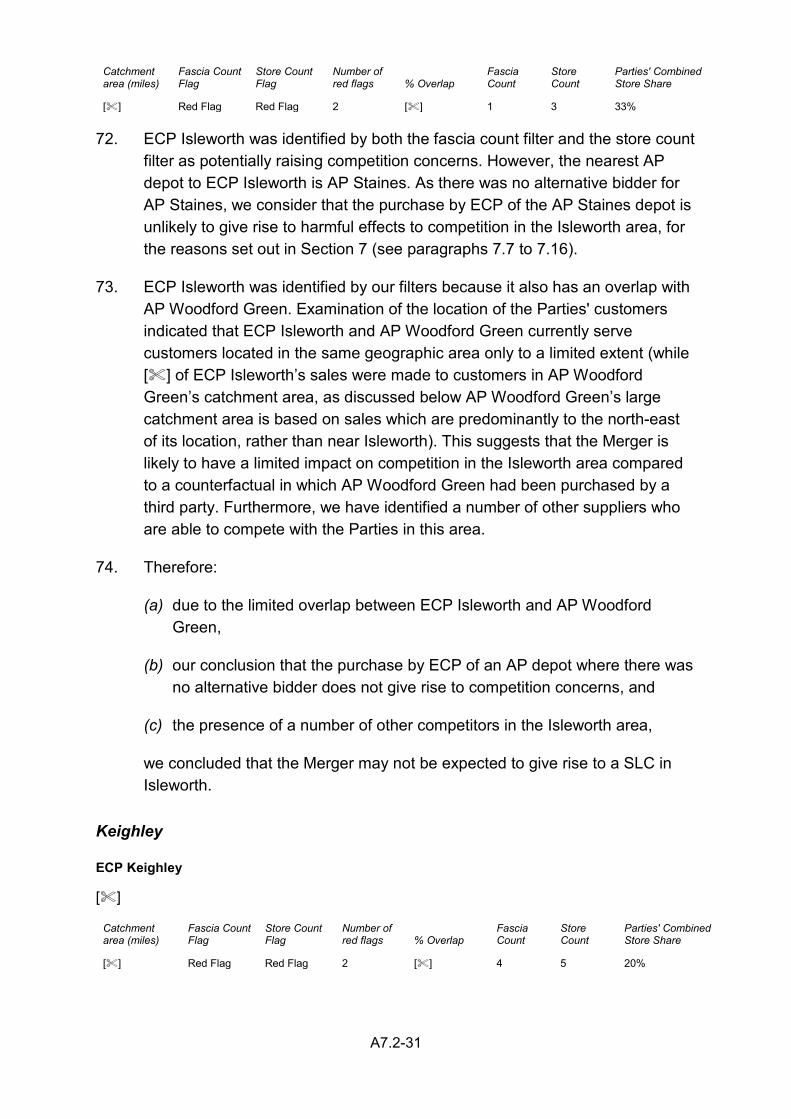
A7.2-31
Catchment area (miles)
Fascia Count Flag
Store Count Flag
Number of red flags % Overlap
Fascia Count
Store Count
Parties' Combined Store Share
[] Red Flag Red Flag 2 [] 1 3 33% 72. ECP Isleworth was identified by both the fascia count filter and the store count
filter as potentially raising competition concerns. However, the nearest AP depot to ECP Isleworth is AP Staines. As there was no alternative bidder for AP Staines, we consider that the purchase by ECP of the AP Staines depot is unlikely to give rise to harmful effects to competition in the Isleworth area, for the reasons set out in Section 7 (see paragraphs 7.7 to 7.16).
73. ECP Isleworth was identified by our filters because it also has an overlap with AP Woodford Green. Examination of the location of the Parties' customers indicated that ECP Isleworth and AP Woodford Green currently serve customers located in the same geographic area only to a limited extent (while [] of ECP Isleworth’s sales were made to customers in AP Woodford Green’s catchment area, as discussed below AP Woodford Green’s large catchment area is based on sales which are predominantly to the north-east of its location, rather than near Isleworth). This suggests that the Merger is likely to have a limited impact on competition in the Isleworth area compared to a counterfactual in which AP Woodford Green had been purchased by a third party. Furthermore, we have identified a number of other suppliers who are able to compete with the Parties in this area.
74. Therefore:
(a) due to the limited overlap between ECP Isleworth and AP Woodford Green,
(b) our conclusion that the purchase by ECP of an AP depot where there was no alternative bidder does not give rise to competition concerns, and
(c) the presence of a number of other competitors in the Isleworth area,
we concluded that the Merger may not be expected to give rise to a SLC in Isleworth.
Keighley
ECP Keighley
[]
Catchment area (miles)
Fascia Count Flag
Store Count Flag
Number of red flags % Overlap
Fascia Count
Store Count
Parties' Combined Store Share
[] Red Flag Red Flag 2 [] 4 5 20%
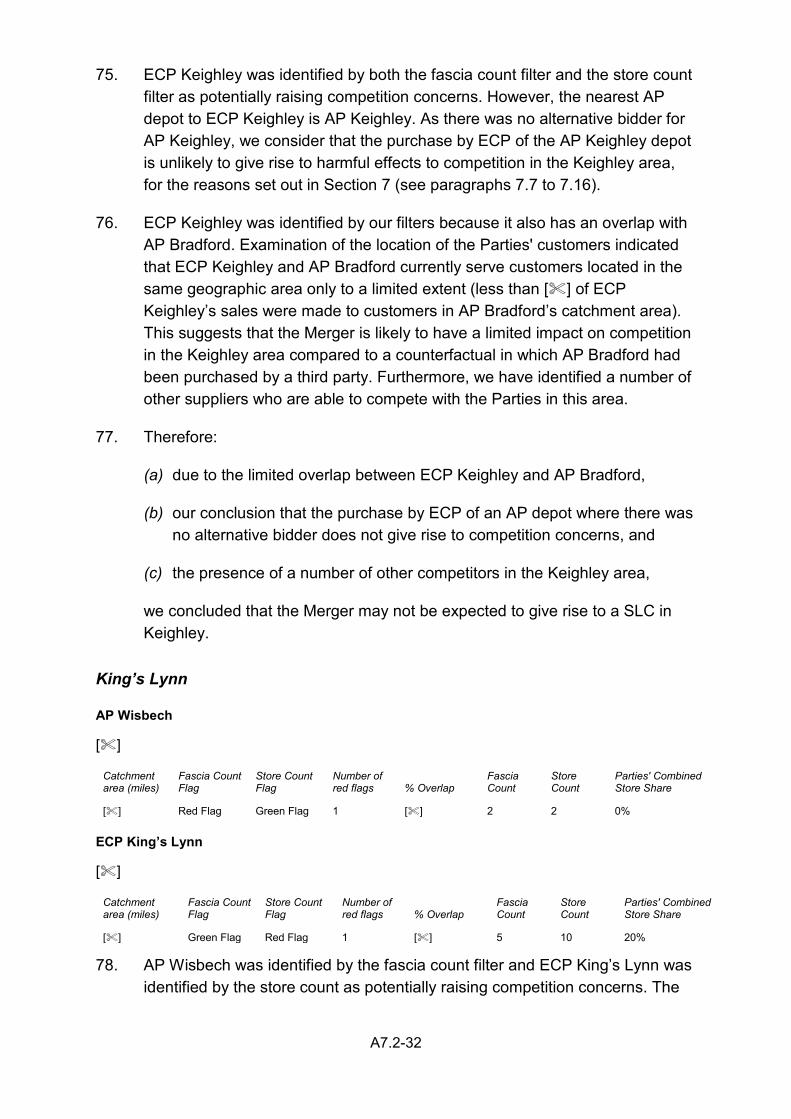
A7.2-32
75. ECP Keighley was identified by both the fascia count filter and the store count filter as potentially raising competition concerns. However, the nearest AP depot to ECP Keighley is AP Keighley. As there was no alternative bidder for AP Keighley, we consider that the purchase by ECP of the AP Keighley depot is unlikely to give rise to harmful effects to competition in the Keighley area, for the reasons set out in Section 7 (see paragraphs 7.7 to 7.16).
76. ECP Keighley was identified by our filters because it also has an overlap with AP Bradford. Examination of the location of the Parties' customers indicated that ECP Keighley and AP Bradford currently serve customers located in the same geographic area only to a limited extent (less than [] of ECP Keighley’s sales were made to customers in AP Bradford’s catchment area). This suggests that the Merger is likely to have a limited impact on competition in the Keighley area compared to a counterfactual in which AP Bradford had been purchased by a third party. Furthermore, we have identified a number of other suppliers who are able to compete with the Parties in this area.
77. Therefore:
(a) due to the limited overlap between ECP Keighley and AP Bradford,
(b) our conclusion that the purchase by ECP of an AP depot where there was no alternative bidder does not give rise to competition concerns, and
(c) the presence of a number of other competitors in the Keighley area,
we concluded that the Merger may not be expected to give rise to a SLC in Keighley.
King’s Lynn
AP Wisbech
[]
Catchment area (miles)
Fascia Count Flag
Store Count Flag
Number of red flags % Overlap
Fascia Count
Store Count
Parties' Combined Store Share
[] Red Flag Green Flag 1 [] 2 2 0% ECP King’s Lynn
[]
Catchment area (miles)
Fascia Count Flag
Store Count Flag
Number of red flags % Overlap
Fascia Count
Store Count
Parties' Combined Store Share
[] Green Flag Red Flag 1 [] 5 10 20% 78. AP Wisbech was identified by the fascia count filter and ECP King’s Lynn was
identified by the store count as potentially raising competition concerns. The
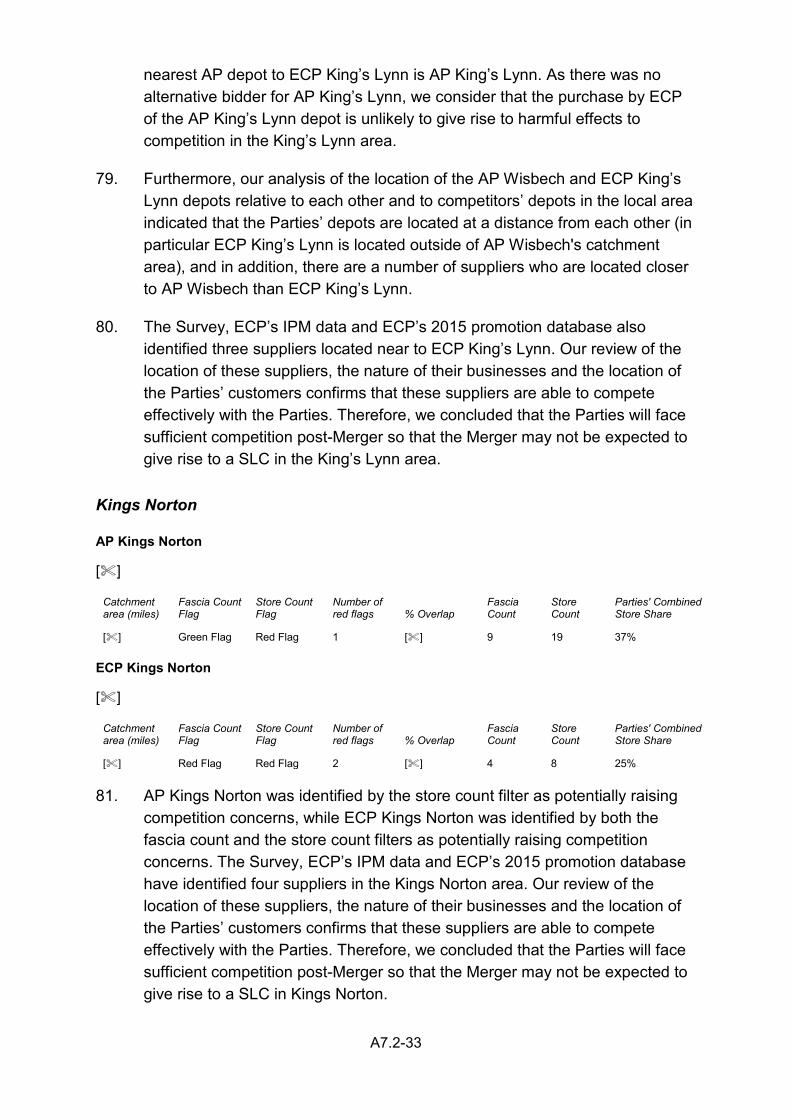
A7.2-33
nearest AP depot to ECP King’s Lynn is AP King’s Lynn. As there was no alternative bidder for AP King’s Lynn, we consider that the purchase by ECP of the AP King’s Lynn depot is unlikely to give rise to harmful effects to competition in the King’s Lynn area.
79. Furthermore, our analysis of the location of the AP Wisbech and ECP King’s Lynn depots relative to each other and to competitors’ depots in the local area indicated that the Parties’ depots are located at a distance from each other (in particular ECP King’s Lynn is located outside of AP Wisbech's catchment area), and in addition, there are a number of suppliers who are located closer to AP Wisbech than ECP King’s Lynn.
80. The Survey, ECP’s IPM data and ECP’s 2015 promotion database also identified three suppliers located near to ECP King’s Lynn. Our review of the location of these suppliers, the nature of their businesses and the location of the Parties’ customers confirms that these suppliers are able to compete effectively with the Parties. Therefore, we concluded that the Parties will face sufficient competition post-Merger so that the Merger may not be expected to give rise to a SLC in the King’s Lynn area.
Kings Norton
AP Kings Norton
[]
Catchment area (miles)
Fascia Count Flag
Store Count Flag
Number of red flags % Overlap
Fascia Count
Store Count
Parties' Combined Store Share
[] Green Flag Red Flag 1 [] 9 19 37% ECP Kings Norton
[]
Catchment area (miles)
Fascia Count Flag
Store Count Flag
Number of red flags % Overlap
Fascia Count
Store Count
Parties' Combined Store Share
[] Red Flag Red Flag 2 [] 4 8 25% 81. AP Kings Norton was identified by the store count filter as potentially raising
competition concerns, while ECP Kings Norton was identified by both the fascia count and the store count filters as potentially raising competition concerns. The Survey, ECP’s IPM data and ECP’s 2015 promotion database have identified four suppliers in the Kings Norton area. Our review of the location of these suppliers, the nature of their businesses and the location of the Parties’ customers confirms that these suppliers are able to compete effectively with the Parties. Therefore, we concluded that the Parties will face sufficient competition post-Merger so that the Merger may not be expected to give rise to a SLC in Kings Norton.
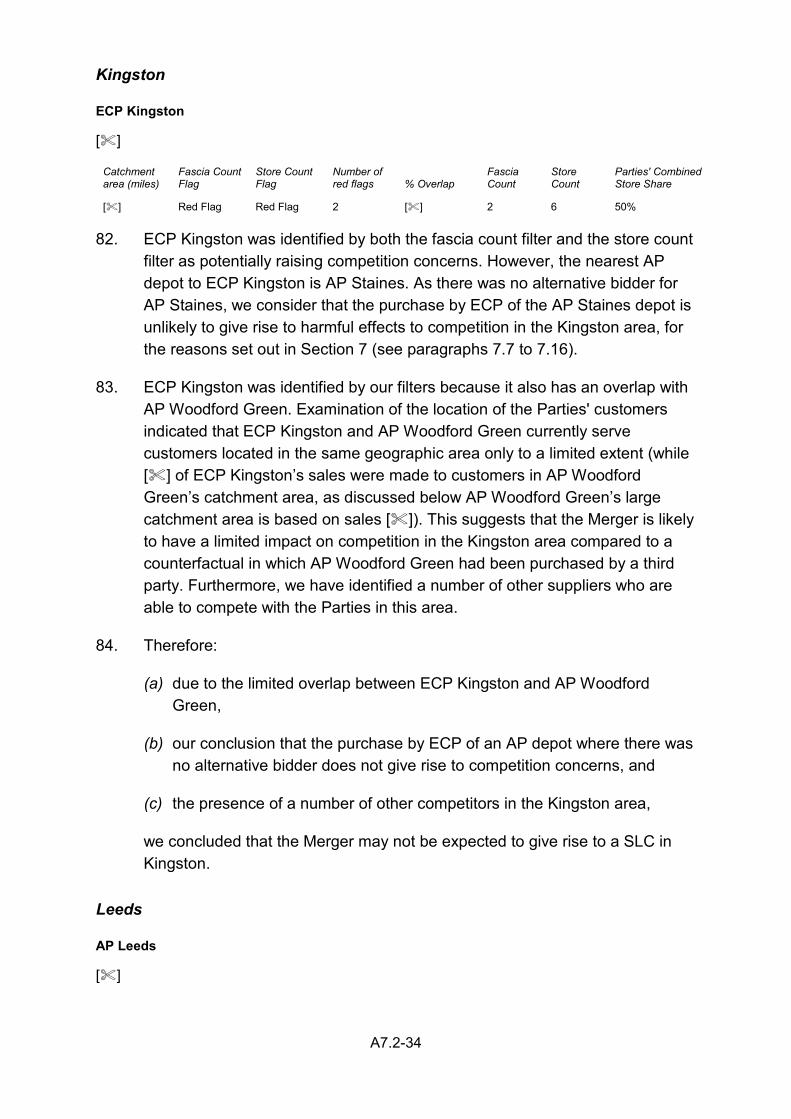
A7.2-34
Kingston
ECP Kingston
[]
Catchment area (miles)
Fascia Count Flag
Store Count Flag
Number of red flags % Overlap
Fascia Count
Store Count
Parties' Combined Store Share
[] Red Flag Red Flag 2 [] 2 6 50% 82. ECP Kingston was identified by both the fascia count filter and the store count
filter as potentially raising competition concerns. However, the nearest AP depot to ECP Kingston is AP Staines. As there was no alternative bidder for AP Staines, we consider that the purchase by ECP of the AP Staines depot is unlikely to give rise to harmful effects to competition in the Kingston area, for the reasons set out in Section 7 (see paragraphs 7.7 to 7.16).
83. ECP Kingston was identified by our filters because it also has an overlap with AP Woodford Green. Examination of the location of the Parties' customers indicated that ECP Kingston and AP Woodford Green currently serve customers located in the same geographic area only to a limited extent (while [] of ECP Kingston’s sales were made to customers in AP Woodford Green’s catchment area, as discussed below AP Woodford Green’s large catchment area is based on sales []). This suggests that the Merger is likely to have a limited impact on competition in the Kingston area compared to a counterfactual in which AP Woodford Green had been purchased by a third party. Furthermore, we have identified a number of other suppliers who are able to compete with the Parties in this area.
84. Therefore:
(a) due to the limited overlap between ECP Kingston and AP Woodford Green,
(b) our conclusion that the purchase by ECP of an AP depot where there was no alternative bidder does not give rise to competition concerns, and
(c) the presence of a number of other competitors in the Kingston area,
we concluded that the Merger may not be expected to give rise to a SLC in Kingston.
Leeds
AP Leeds
[]
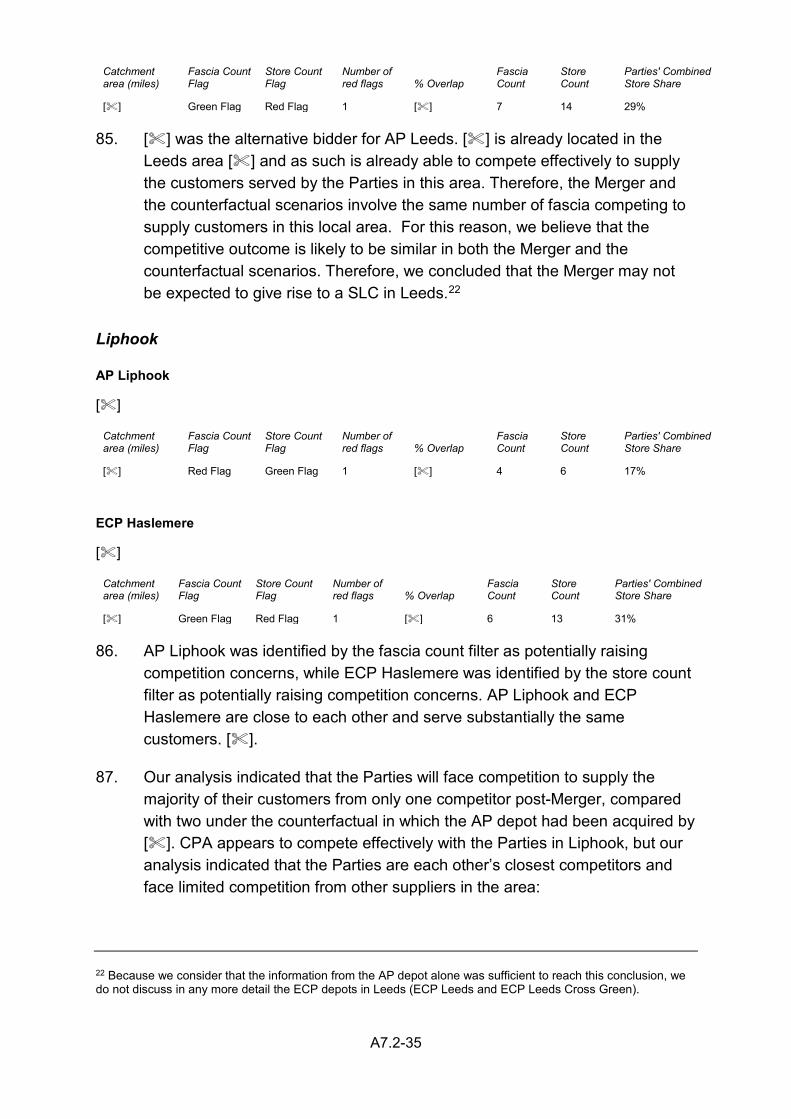
A7.2-35
Catchment area (miles)
Fascia Count Flag
Store Count Flag
Number of red flags % Overlap
Fascia Count
Store Count
Parties' Combined Store Share
[] Green Flag Red Flag 1 [] 7 14 29% 85. [] was the alternative bidder for AP Leeds. [] is already located in the
Leeds area [] and as such is already able to compete effectively to supply the customers served by the Parties in this area. Therefore, the Merger and the counterfactual scenarios involve the same number of fascia competing to supply customers in this local area. For this reason, we believe that the competitive outcome is likely to be similar in both the Merger and the counterfactual scenarios. Therefore, we concluded that the Merger may not be expected to give rise to a SLC in Leeds.22
Liphook
AP Liphook
[]
Catchment area (miles)
Fascia Count Flag
Store Count Flag
Number of red flags % Overlap
Fascia Count
Store Count
Parties' Combined Store Share
[] Red Flag Green Flag 1 [] 4 6 17%
ECP Haslemere
[]
Catchment area (miles)
Fascia Count Flag
Store Count Flag
Number of red flags % Overlap
Fascia Count
Store Count
Parties' Combined Store Share
[] Green Flag Red Flag 1 [] 6 13 31% 86. AP Liphook was identified by the fascia count filter as potentially raising
competition concerns, while ECP Haslemere was identified by the store count filter as potentially raising competition concerns. AP Liphook and ECP Haslemere are close to each other and serve substantially the same customers. [].
87. Our analysis indicated that the Parties will face competition to supply the majority of their customers from only one competitor post-Merger, compared with two under the counterfactual in which the AP depot had been acquired by []. CPA appears to compete effectively with the Parties in Liphook, but our analysis indicated that the Parties are each other’s closest competitors and face limited competition from other suppliers in the area:
22 Because we consider that the information from the AP depot alone was sufficient to reach this conclusion, we do not discuss in any more detail the ECP depots in Leeds (ECP Leeds and ECP Leeds Cross Green).
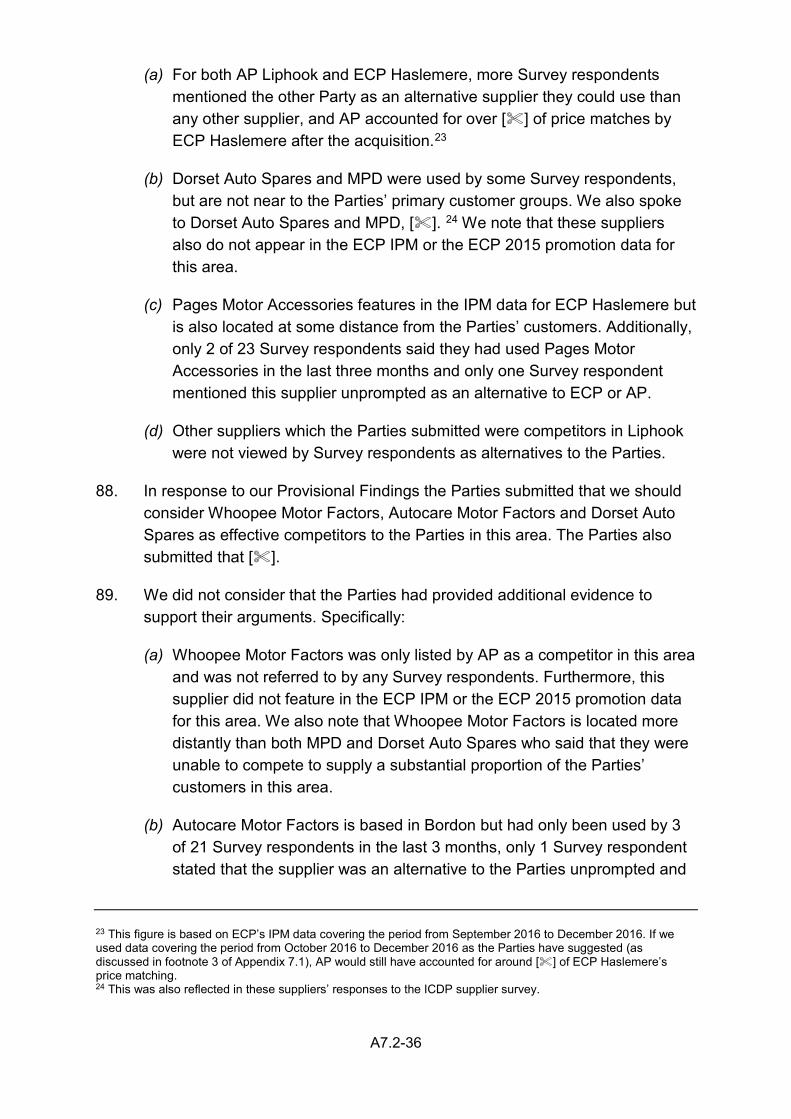
A7.2-36
(a) For both AP Liphook and ECP Haslemere, more Survey respondents mentioned the other Party as an alternative supplier they could use than any other supplier, and AP accounted for over [] of price matches by ECP Haslemere after the acquisition.23
(b) Dorset Auto Spares and MPD were used by some Survey respondents, but are not near to the Parties’ primary customer groups. We also spoke to Dorset Auto Spares and MPD, []. 24 We note that these suppliers also do not appear in the ECP IPM or the ECP 2015 promotion data for this area.
(c) Pages Motor Accessories features in the IPM data for ECP Haslemere but is also located at some distance from the Parties’ customers. Additionally, only 2 of 23 Survey respondents said they had used Pages Motor Accessories in the last three months and only one Survey respondent mentioned this supplier unprompted as an alternative to ECP or AP.
(d) Other suppliers which the Parties submitted were competitors in Liphook were not viewed by Survey respondents as alternatives to the Parties.
88. In response to our Provisional Findings the Parties submitted that we should consider Whoopee Motor Factors, Autocare Motor Factors and Dorset Auto Spares as effective competitors to the Parties in this area. The Parties also submitted that [].
89. We did not consider that the Parties had provided additional evidence to support their arguments. Specifically:
(a) Whoopee Motor Factors was only listed by AP as a competitor in this area and was not referred to by any Survey respondents. Furthermore, this supplier did not feature in the ECP IPM or the ECP 2015 promotion data for this area. We also note that Whoopee Motor Factors is located more distantly than both MPD and Dorset Auto Spares who said that they were unable to compete to supply a substantial proportion of the Parties’ customers in this area.
(b) Autocare Motor Factors is based in Bordon but had only been used by 3 of 21 Survey respondents in the last 3 months, only 1 Survey respondent stated that the supplier was an alternative to the Parties unprompted and
23 This figure is based on ECP’s IPM data covering the period from September 2016 to December 2016. If we used data covering the period from October 2016 to December 2016 as the Parties have suggested (as discussed in footnote 3 of Appendix 7.1), AP would still have accounted for around [] of ECP Haslemere’s price matching. 24 This was also reflected in these suppliers’ responses to the ICDP supplier survey.
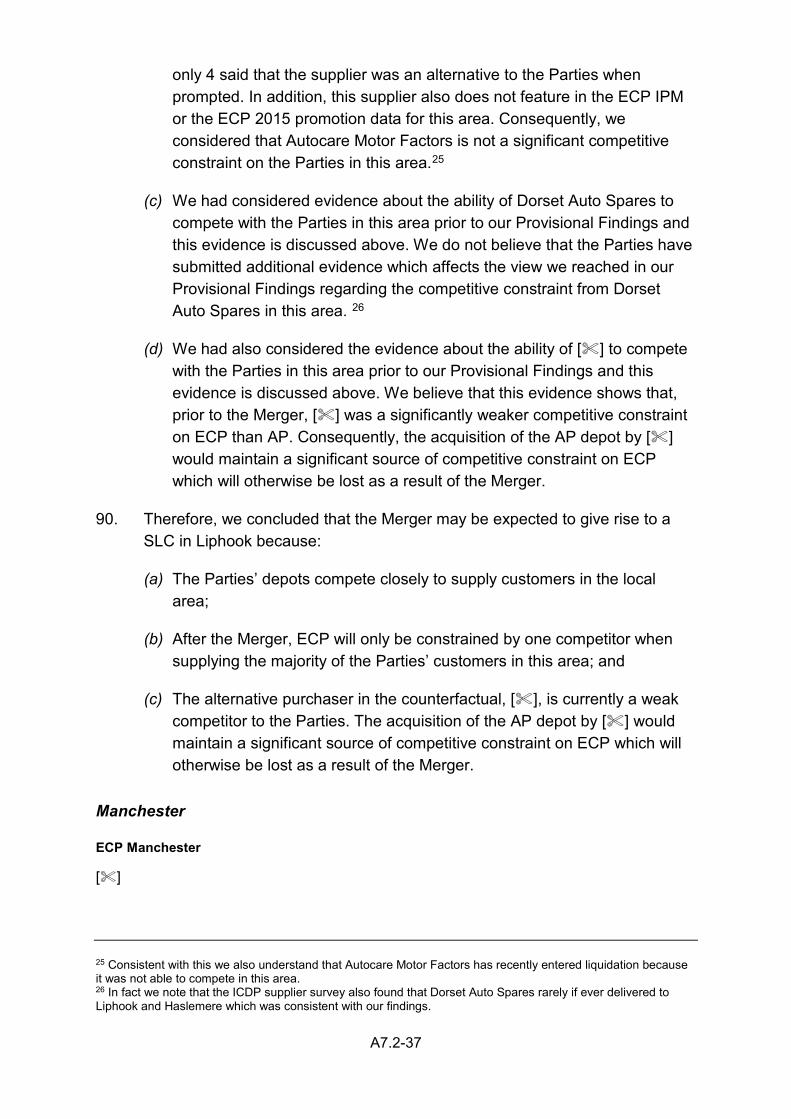
A7.2-37
only 4 said that the supplier was an alternative to the Parties when prompted. In addition, this supplier also does not feature in the ECP IPM or the ECP 2015 promotion data for this area. Consequently, we considered that Autocare Motor Factors is not a significant competitive constraint on the Parties in this area.25
(c) We had considered evidence about the ability of Dorset Auto Spares to compete with the Parties in this area prior to our Provisional Findings and this evidence is discussed above. We do not believe that the Parties have submitted additional evidence which affects the view we reached in our Provisional Findings regarding the competitive constraint from Dorset Auto Spares in this area. 26
(d) We had also considered the evidence about the ability of [] to compete with the Parties in this area prior to our Provisional Findings and this evidence is discussed above. We believe that this evidence shows that, prior to the Merger, [] was a significantly weaker competitive constraint on ECP than AP. Consequently, the acquisition of the AP depot by [] would maintain a significant source of competitive constraint on ECP which will otherwise be lost as a result of the Merger.
90. Therefore, we concluded that the Merger may be expected to give rise to a SLC in Liphook because:
(a) The Parties’ depots compete closely to supply customers in the local area;
(b) After the Merger, ECP will only be constrained by one competitor when supplying the majority of the Parties’ customers in this area; and
(c) The alternative purchaser in the counterfactual, [], is currently a weak competitor to the Parties. The acquisition of the AP depot by [] would maintain a significant source of competitive constraint on ECP which will otherwise be lost as a result of the Merger.
Manchester
ECP Manchester
[]
25 Consistent with this we also understand that Autocare Motor Factors has recently entered liquidation because it was not able to compete in this area. 26 In fact we note that the ICDP supplier survey also found that Dorset Auto Spares rarely if ever delivered to Liphook and Haslemere which was consistent with our findings.
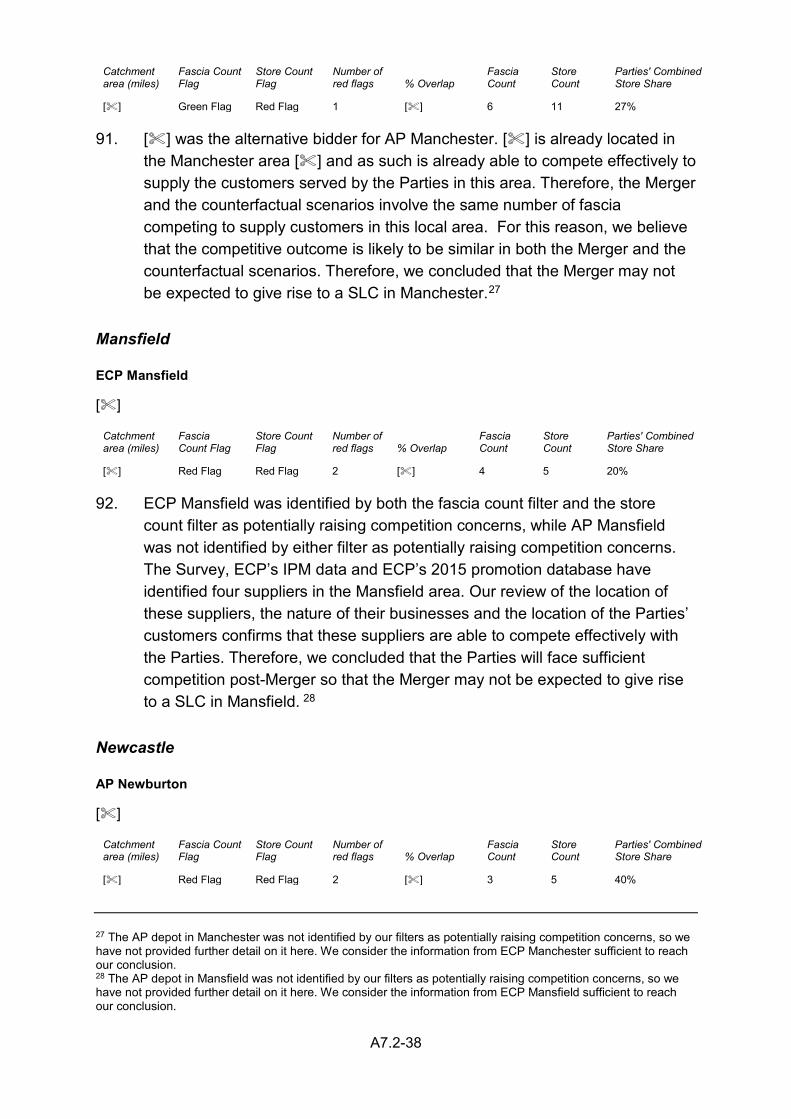
A7.2-38
Catchment area (miles)
Fascia Count Flag
Store Count Flag
Number of red flags % Overlap
Fascia Count
Store Count
Parties' Combined Store Share
[] Green Flag Red Flag 1 [] 6 11 27% 91. [] was the alternative bidder for AP Manchester. [] is already located in
the Manchester area [] and as such is already able to compete effectively to supply the customers served by the Parties in this area. Therefore, the Merger and the counterfactual scenarios involve the same number of fascia competing to supply customers in this local area. For this reason, we believe that the competitive outcome is likely to be similar in both the Merger and the counterfactual scenarios. Therefore, we concluded that the Merger may not be expected to give rise to a SLC in Manchester.27
Mansfield
ECP Mansfield
[]
Catchment area (miles)
Fascia Count Flag
Store Count Flag
Number of red flags % Overlap
Fascia Count
Store Count
Parties' Combined Store Share
[] Red Flag Red Flag 2 [] 4 5 20% 92. ECP Mansfield was identified by both the fascia count filter and the store
count filter as potentially raising competition concerns, while AP Mansfield was not identified by either filter as potentially raising competition concerns. The Survey, ECP’s IPM data and ECP’s 2015 promotion database have identified four suppliers in the Mansfield area. Our review of the location of these suppliers, the nature of their businesses and the location of the Parties’ customers confirms that these suppliers are able to compete effectively with the Parties. Therefore, we concluded that the Parties will face sufficient competition post-Merger so that the Merger may not be expected to give rise to a SLC in Mansfield. 28
Newcastle
AP Newburton
[]
Catchment area (miles)
Fascia Count Flag
Store Count Flag
Number of red flags % Overlap
Fascia Count
Store Count
Parties' Combined Store Share
[] Red Flag Red Flag 2 [] 3 5 40%
27 The AP depot in Manchester was not identified by our filters as potentially raising competition concerns, so we have not provided further detail on it here. We consider the information from ECP Manchester sufficient to reach our conclusion. 28 The AP depot in Mansfield was not identified by our filters as potentially raising competition concerns, so we have not provided further detail on it here. We consider the information from ECP Mansfield sufficient to reach our conclusion.
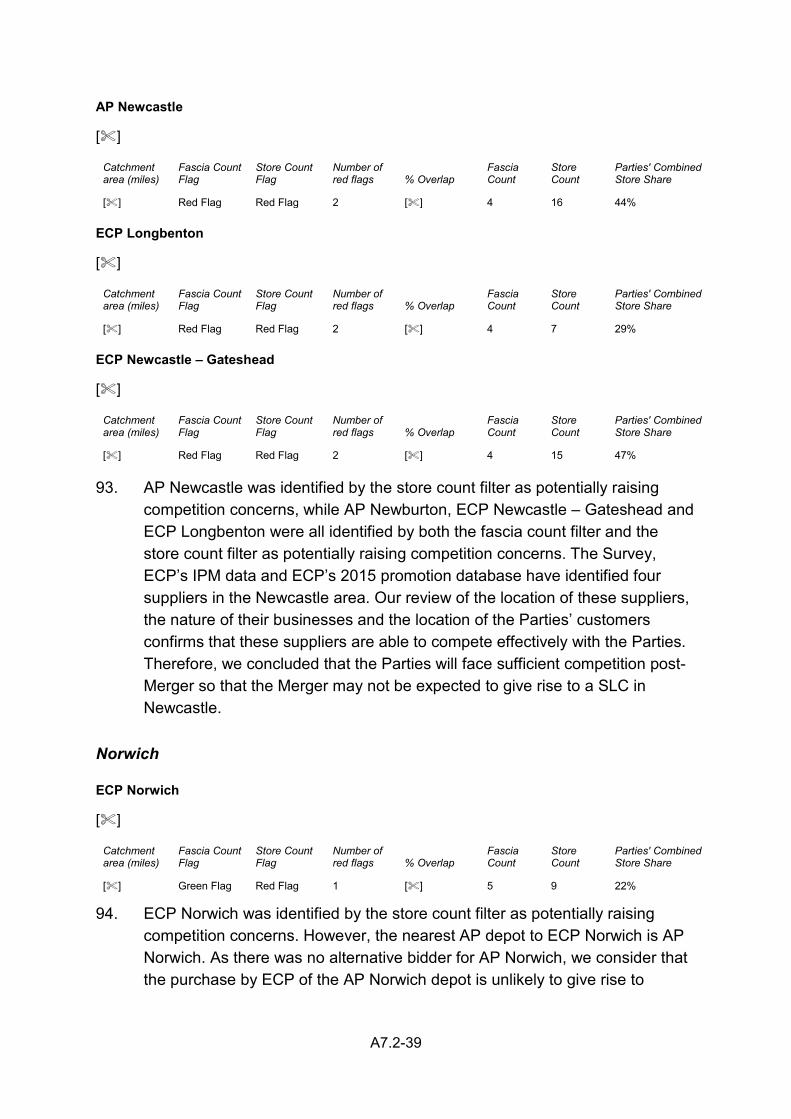
A7.2-39
AP Newcastle
[]
Catchment area (miles)
Fascia Count Flag
Store Count Flag
Number of red flags % Overlap
Fascia Count
Store Count
Parties' Combined Store Share
[] Red Flag Red Flag 2 [] 4 16 44% ECP Longbenton
[]
Catchment area (miles)
Fascia Count Flag
Store Count Flag
Number of red flags % Overlap
Fascia Count
Store Count
Parties' Combined Store Share
[] Red Flag Red Flag 2 [] 4 7 29% ECP Newcastle – Gateshead
[]
Catchment area (miles)
Fascia Count Flag
Store Count Flag
Number of red flags % Overlap
Fascia Count
Store Count
Parties' Combined Store Share
[] Red Flag Red Flag 2 [] 4 15 47% 93. AP Newcastle was identified by the store count filter as potentially raising
competition concerns, while AP Newburton, ECP Newcastle – Gateshead and ECP Longbenton were all identified by both the fascia count filter and the store count filter as potentially raising competition concerns. The Survey, ECP’s IPM data and ECP’s 2015 promotion database have identified four suppliers in the Newcastle area. Our review of the location of these suppliers, the nature of their businesses and the location of the Parties’ customers confirms that these suppliers are able to compete effectively with the Parties. Therefore, we concluded that the Parties will face sufficient competition post-Merger so that the Merger may not be expected to give rise to a SLC in Newcastle.
Norwich
ECP Norwich
[]
Catchment area (miles)
Fascia Count Flag
Store Count Flag
Number of red flags % Overlap
Fascia Count
Store Count
Parties' Combined Store Share
[] Green Flag Red Flag 1 [] 5 9 22% 94. ECP Norwich was identified by the store count filter as potentially raising
competition concerns. However, the nearest AP depot to ECP Norwich is AP Norwich. As there was no alternative bidder for AP Norwich, we consider that the purchase by ECP of the AP Norwich depot is unlikely to give rise to
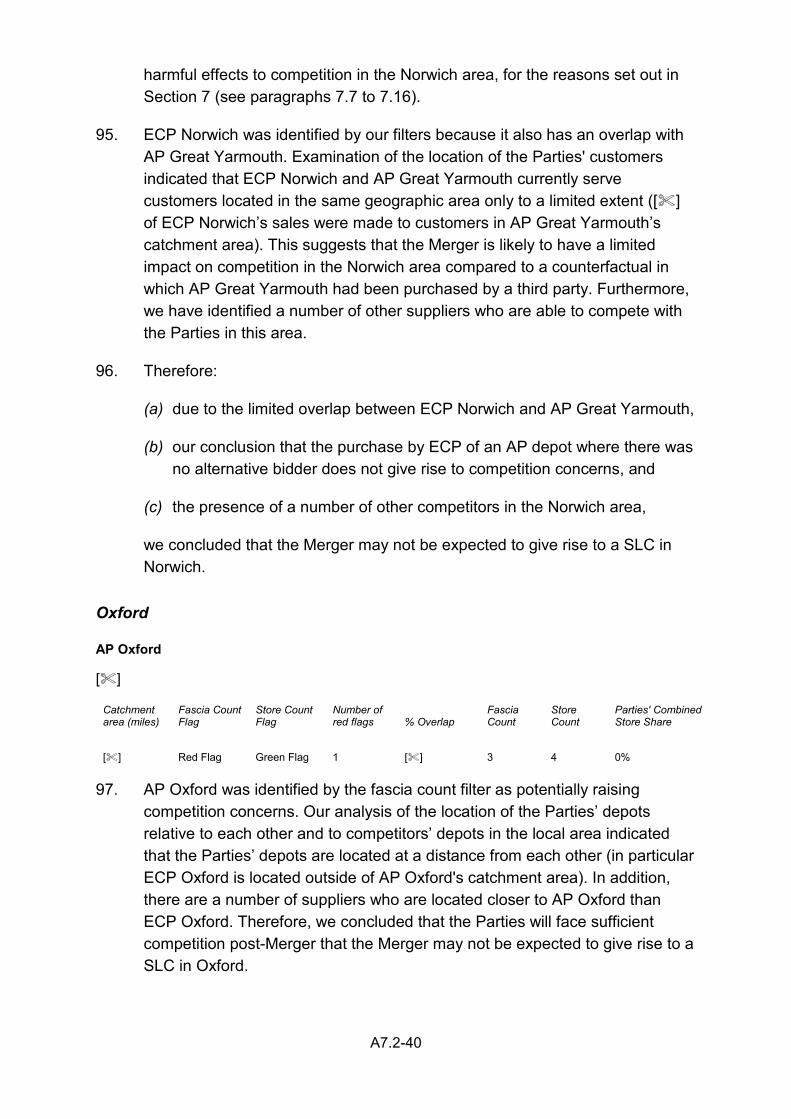
A7.2-40
harmful effects to competition in the Norwich area, for the reasons set out in Section 7 (see paragraphs 7.7 to 7.16).
95. ECP Norwich was identified by our filters because it also has an overlap with AP Great Yarmouth. Examination of the location of the Parties' customers indicated that ECP Norwich and AP Great Yarmouth currently serve customers located in the same geographic area only to a limited extent ([] of ECP Norwich’s sales were made to customers in AP Great Yarmouth’s catchment area). This suggests that the Merger is likely to have a limited impact on competition in the Norwich area compared to a counterfactual in which AP Great Yarmouth had been purchased by a third party. Furthermore, we have identified a number of other suppliers who are able to compete with the Parties in this area.
96. Therefore:
(a) due to the limited overlap between ECP Norwich and AP Great Yarmouth,
(b) our conclusion that the purchase by ECP of an AP depot where there was no alternative bidder does not give rise to competition concerns, and
(c) the presence of a number of other competitors in the Norwich area,
we concluded that the Merger may not be expected to give rise to a SLC in Norwich.
Oxford
AP Oxford
[]
Catchment area (miles)
Fascia Count Flag
Store Count Flag
Number of red flags % Overlap
Fascia Count
Store Count
Parties' Combined Store Share
[] Red Flag Green Flag 1 [] 3 4 0% 97. AP Oxford was identified by the fascia count filter as potentially raising
competition concerns. Our analysis of the location of the Parties’ depots relative to each other and to competitors’ depots in the local area indicated that the Parties’ depots are located at a distance from each other (in particular ECP Oxford is located outside of AP Oxford's catchment area). In addition, there are a number of suppliers who are located closer to AP Oxford than ECP Oxford. Therefore, we concluded that the Parties will face sufficient competition post-Merger that the Merger may not be expected to give rise to a SLC in Oxford.
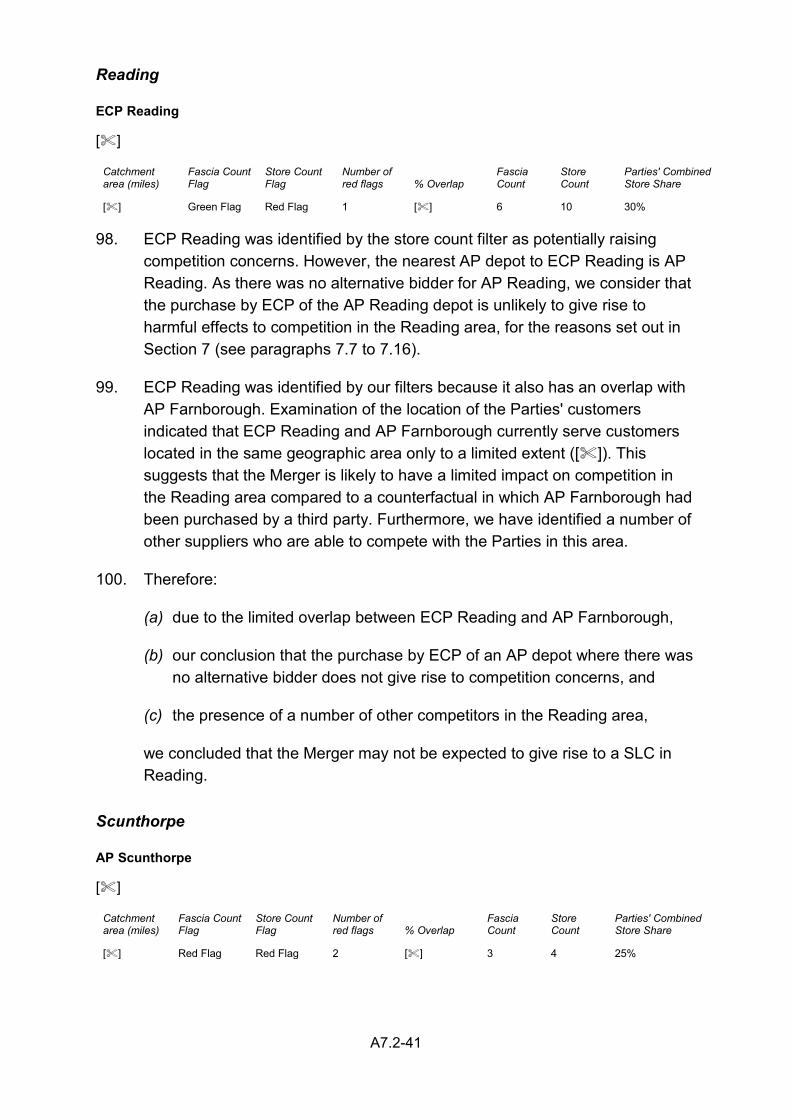
A7.2-41
Reading
ECP Reading
[]
Catchment area (miles)
Fascia Count Flag
Store Count Flag
Number of red flags % Overlap
Fascia Count
Store Count
Parties' Combined Store Share
[] Green Flag Red Flag 1 [] 6 10 30% 98. ECP Reading was identified by the store count filter as potentially raising
competition concerns. However, the nearest AP depot to ECP Reading is AP Reading. As there was no alternative bidder for AP Reading, we consider that the purchase by ECP of the AP Reading depot is unlikely to give rise to harmful effects to competition in the Reading area, for the reasons set out in Section 7 (see paragraphs 7.7 to 7.16).
99. ECP Reading was identified by our filters because it also has an overlap with AP Farnborough. Examination of the location of the Parties' customers indicated that ECP Reading and AP Farnborough currently serve customers located in the same geographic area only to a limited extent ([]). This suggests that the Merger is likely to have a limited impact on competition in the Reading area compared to a counterfactual in which AP Farnborough had been purchased by a third party. Furthermore, we have identified a number of other suppliers who are able to compete with the Parties in this area.
100. Therefore:
(a) due to the limited overlap between ECP Reading and AP Farnborough,
(b) our conclusion that the purchase by ECP of an AP depot where there was no alternative bidder does not give rise to competition concerns, and
(c) the presence of a number of other competitors in the Reading area,
we concluded that the Merger may not be expected to give rise to a SLC in Reading.
Scunthorpe
AP Scunthorpe
[]
Catchment area (miles)
Fascia Count Flag
Store Count Flag
Number of red flags % Overlap
Fascia Count
Store Count
Parties' Combined Store Share
[] Red Flag Red Flag 2 [] 3 4 25%
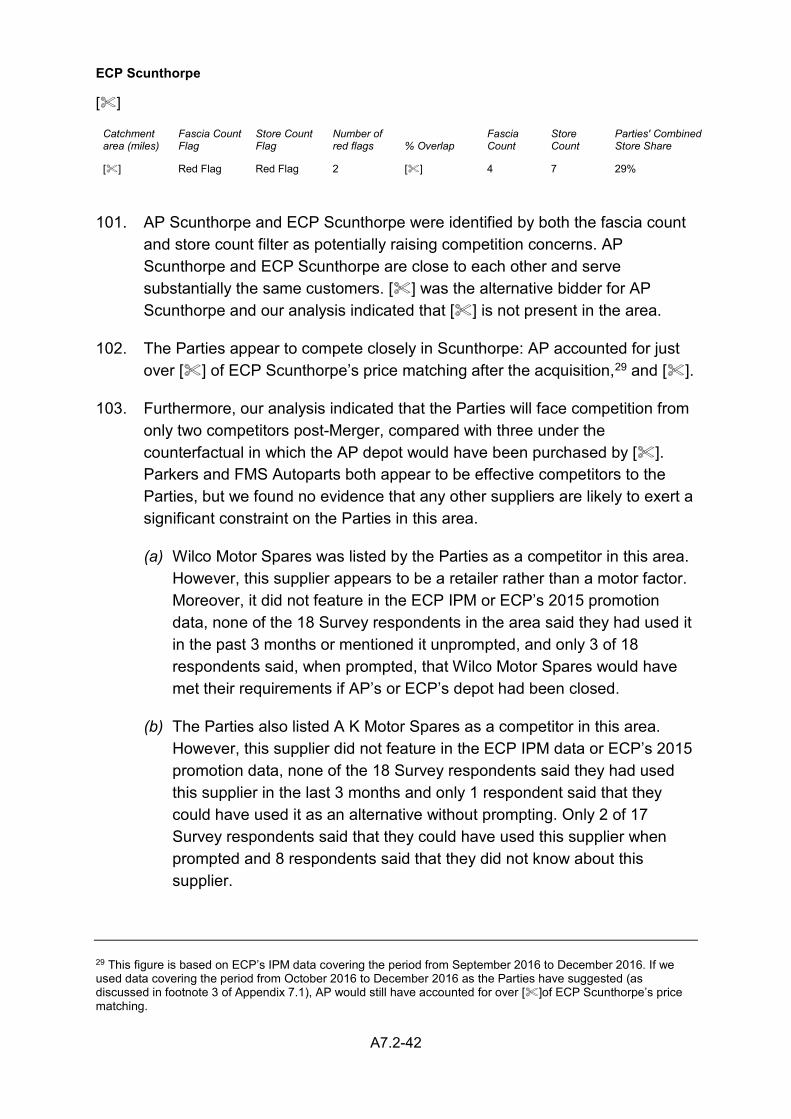
A7.2-42
ECP Scunthorpe
[]
Catchment area (miles)
Fascia Count Flag
Store Count Flag
Number of red flags % Overlap
Fascia Count
Store Count
Parties' Combined Store Share
[] Red Flag Red Flag 2 [] 4 7 29%
101. AP Scunthorpe and ECP Scunthorpe were identified by both the fascia count and store count filter as potentially raising competition concerns. AP Scunthorpe and ECP Scunthorpe are close to each other and serve substantially the same customers. [] was the alternative bidder for AP Scunthorpe and our analysis indicated that [] is not present in the area.
102. The Parties appear to compete closely in Scunthorpe: AP accounted for just over [] of ECP Scunthorpe’s price matching after the acquisition,29 and [].
103. Furthermore, our analysis indicated that the Parties will face competition from only two competitors post-Merger, compared with three under the counterfactual in which the AP depot would have been purchased by []. Parkers and FMS Autoparts both appear to be effective competitors to the Parties, but we found no evidence that any other suppliers are likely to exert a significant constraint on the Parties in this area.
(a) Wilco Motor Spares was listed by the Parties as a competitor in this area. However, this supplier appears to be a retailer rather than a motor factor. Moreover, it did not feature in the ECP IPM or ECP’s 2015 promotion data, none of the 18 Survey respondents in the area said they had used it in the past 3 months or mentioned it unprompted, and only 3 of 18 respondents said, when prompted, that Wilco Motor Spares would have met their requirements if AP’s or ECP’s depot had been closed.
(b) The Parties also listed A K Motor Spares as a competitor in this area. However, this supplier did not feature in the ECP IPM data or ECP’s 2015 promotion data, none of the 18 Survey respondents said they had used this supplier in the last 3 months and only 1 respondent said that they could have used it as an alternative without prompting. Only 2 of 17 Survey respondents said that they could have used this supplier when prompted and 8 respondents said that they did not know about this supplier.
29 This figure is based on ECP’s IPM data covering the period from September 2016 to December 2016. If we used data covering the period from October 2016 to December 2016 as the Parties have suggested (as discussed in footnote 3 of Appendix 7.1), AP would still have accounted for over []of ECP Scunthorpe’s price matching.
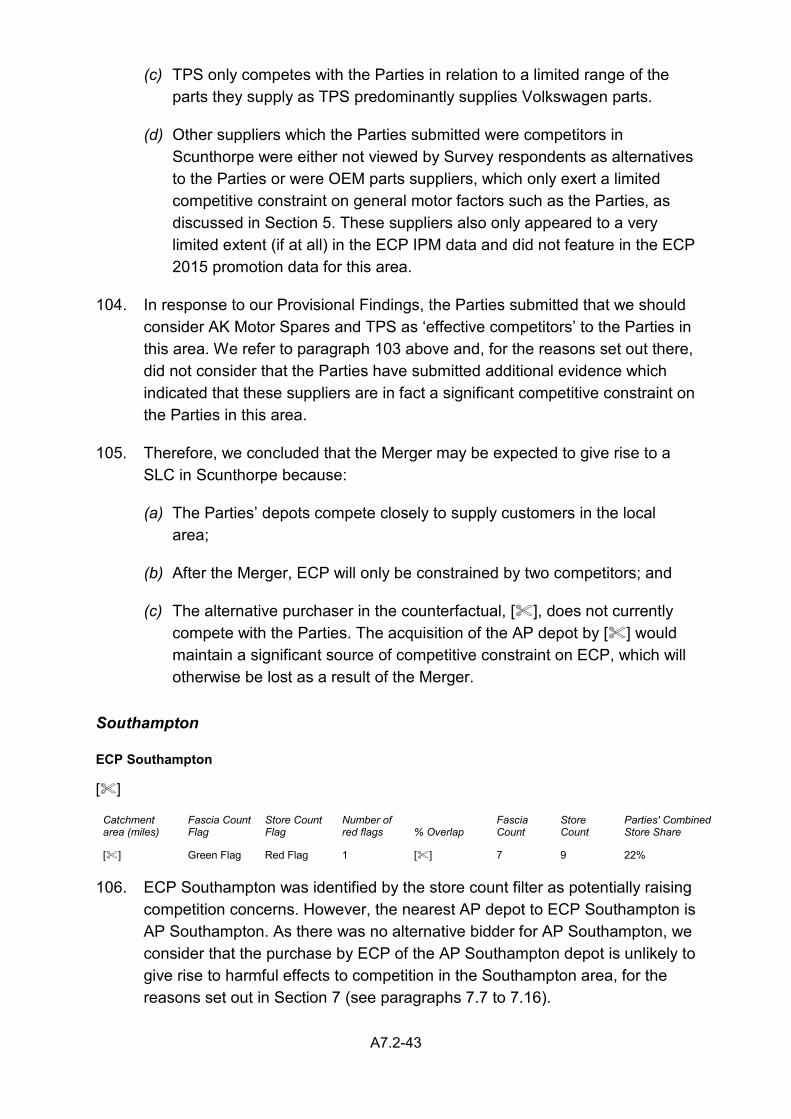
A7.2-43
(c) TPS only competes with the Parties in relation to a limited range of the parts they supply as TPS predominantly supplies Volkswagen parts.
(d) Other suppliers which the Parties submitted were competitors in Scunthorpe were either not viewed by Survey respondents as alternatives to the Parties or were OEM parts suppliers, which only exert a limited competitive constraint on general motor factors such as the Parties, as discussed in Section 5. These suppliers also only appeared to a very limited extent (if at all) in the ECP IPM data and did not feature in the ECP 2015 promotion data for this area.
104. In response to our Provisional Findings, the Parties submitted that we should consider AK Motor Spares and TPS as ‘effective competitors’ to the Parties in this area. We refer to paragraph 103 above and, for the reasons set out there, did not consider that the Parties have submitted additional evidence which indicated that these suppliers are in fact a significant competitive constraint on the Parties in this area.
105. Therefore, we concluded that the Merger may be expected to give rise to a SLC in Scunthorpe because:
(a) The Parties’ depots compete closely to supply customers in the local area;
(b) After the Merger, ECP will only be constrained by two competitors; and
(c) The alternative purchaser in the counterfactual, [], does not currently compete with the Parties. The acquisition of the AP depot by [] would maintain a significant source of competitive constraint on ECP, which will otherwise be lost as a result of the Merger.
Southampton
ECP Southampton
[]
Catchment area (miles)
Fascia Count Flag
Store Count Flag
Number of red flags % Overlap
Fascia Count
Store Count
Parties' Combined Store Share
[] Green Flag Red Flag 1 [] 7 9 22% 106. ECP Southampton was identified by the store count filter as potentially raising
competition concerns. However, the nearest AP depot to ECP Southampton is AP Southampton. As there was no alternative bidder for AP Southampton, we consider that the purchase by ECP of the AP Southampton depot is unlikely to give rise to harmful effects to competition in the Southampton area, for the reasons set out in Section 7 (see paragraphs 7.7 to 7.16).
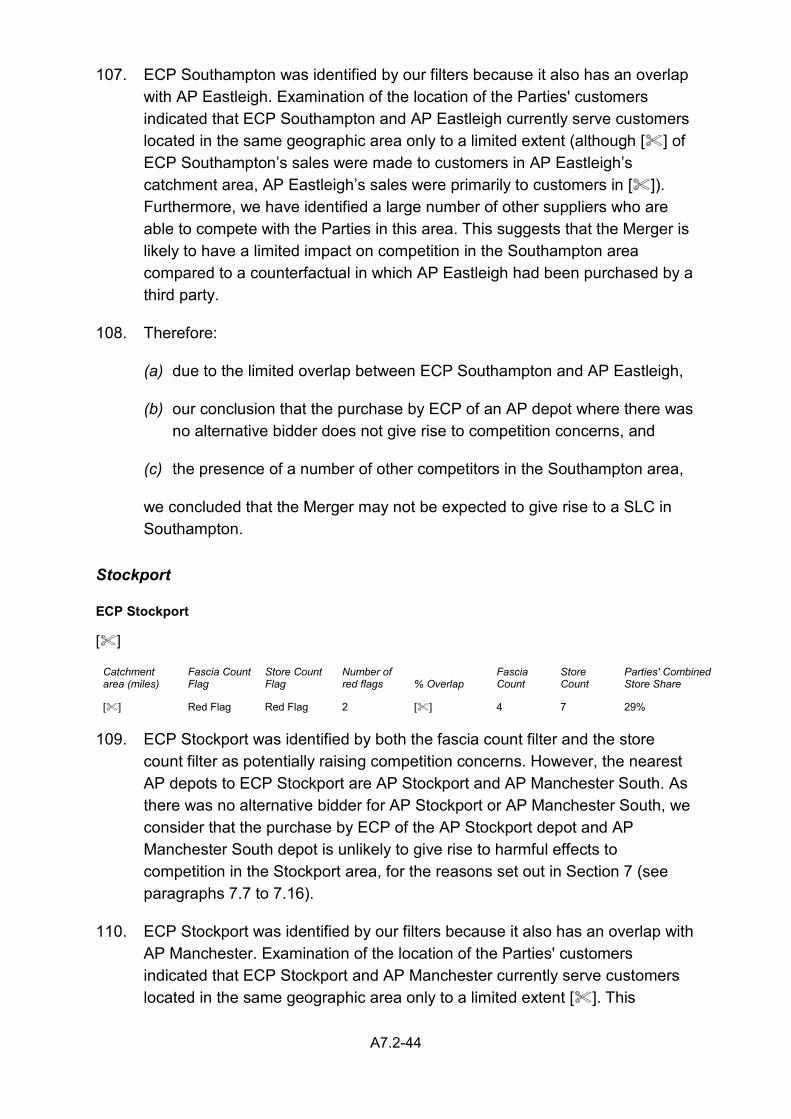
A7.2-44
107. ECP Southampton was identified by our filters because it also has an overlap with AP Eastleigh. Examination of the location of the Parties' customers indicated that ECP Southampton and AP Eastleigh currently serve customers located in the same geographic area only to a limited extent (although [] of ECP Southampton’s sales were made to customers in AP Eastleigh’s catchment area, AP Eastleigh’s sales were primarily to customers in []). Furthermore, we have identified a large number of other suppliers who are able to compete with the Parties in this area. This suggests that the Merger is likely to have a limited impact on competition in the Southampton area compared to a counterfactual in which AP Eastleigh had been purchased by a third party.
108. Therefore:
(a) due to the limited overlap between ECP Southampton and AP Eastleigh,
(b) our conclusion that the purchase by ECP of an AP depot where there was no alternative bidder does not give rise to competition concerns, and
(c) the presence of a number of other competitors in the Southampton area,
we concluded that the Merger may not be expected to give rise to a SLC in Southampton.
Stockport
ECP Stockport
[]
Catchment area (miles)
Fascia Count Flag
Store Count Flag
Number of red flags % Overlap
Fascia Count
Store Count
Parties' Combined Store Share
[] Red Flag Red Flag 2 [] 4 7 29% 109. ECP Stockport was identified by both the fascia count filter and the store
count filter as potentially raising competition concerns. However, the nearest AP depots to ECP Stockport are AP Stockport and AP Manchester South. As there was no alternative bidder for AP Stockport or AP Manchester South, we consider that the purchase by ECP of the AP Stockport depot and AP Manchester South depot is unlikely to give rise to harmful effects to competition in the Stockport area, for the reasons set out in Section 7 (see paragraphs 7.7 to 7.16).
110. ECP Stockport was identified by our filters because it also has an overlap with AP Manchester. Examination of the location of the Parties' customers indicated that ECP Stockport and AP Manchester currently serve customers located in the same geographic area only to a limited extent []. This
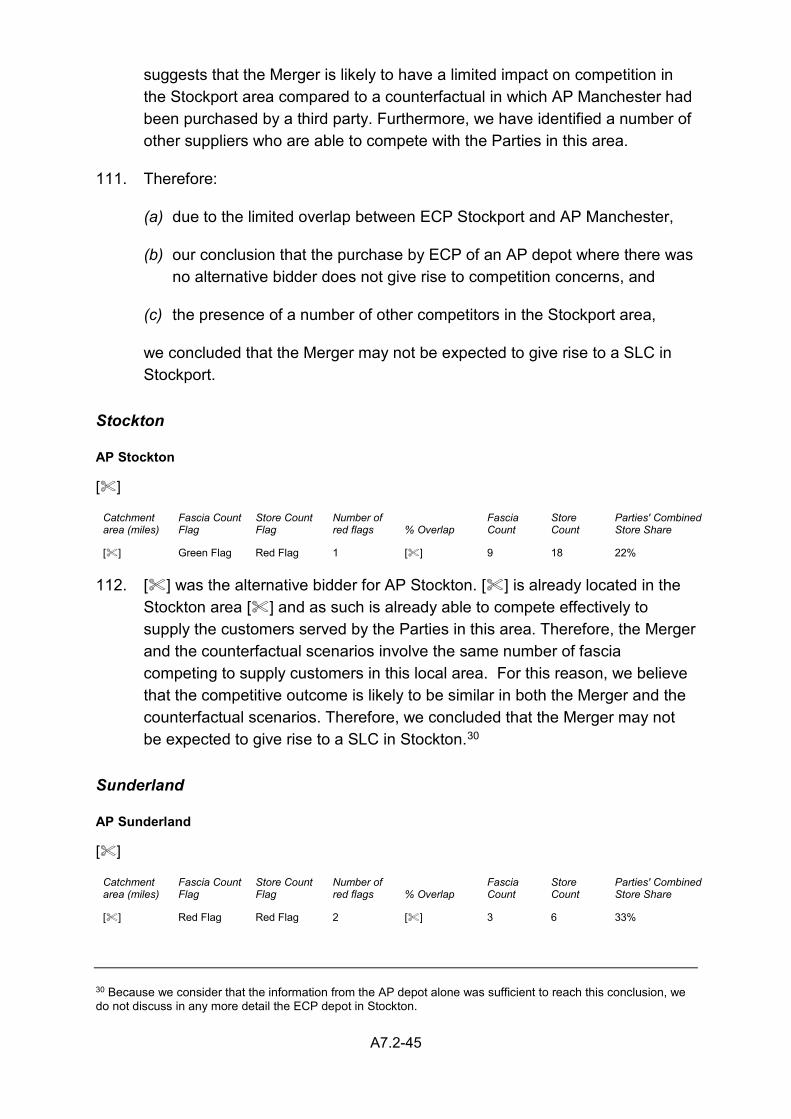
A7.2-45
suggests that the Merger is likely to have a limited impact on competition in the Stockport area compared to a counterfactual in which AP Manchester had been purchased by a third party. Furthermore, we have identified a number of other suppliers who are able to compete with the Parties in this area.
111. Therefore:
(a) due to the limited overlap between ECP Stockport and AP Manchester,
(b) our conclusion that the purchase by ECP of an AP depot where there was no alternative bidder does not give rise to competition concerns, and
(c) the presence of a number of other competitors in the Stockport area,
we concluded that the Merger may not be expected to give rise to a SLC in Stockport.
Stockton
AP Stockton
[]
Catchment area (miles)
Fascia Count Flag
Store Count Flag
Number of red flags % Overlap
Fascia Count
Store Count
Parties' Combined Store Share
[] Green Flag Red Flag 1 [] 9 18 22% 112. [] was the alternative bidder for AP Stockton. [] is already located in the
Stockton area [] and as such is already able to compete effectively to supply the customers served by the Parties in this area. Therefore, the Merger and the counterfactual scenarios involve the same number of fascia competing to supply customers in this local area. For this reason, we believe that the competitive outcome is likely to be similar in both the Merger and the counterfactual scenarios. Therefore, we concluded that the Merger may not be expected to give rise to a SLC in Stockton.30
Sunderland
AP Sunderland
[]
Catchment area (miles)
Fascia Count Flag
Store Count Flag
Number of red flags % Overlap
Fascia Count
Store Count
Parties' Combined Store Share
[] Red Flag Red Flag 2 [] 3 6 33%
30 Because we consider that the information from the AP depot alone was sufficient to reach this conclusion, we do not discuss in any more detail the ECP depot in Stockton.
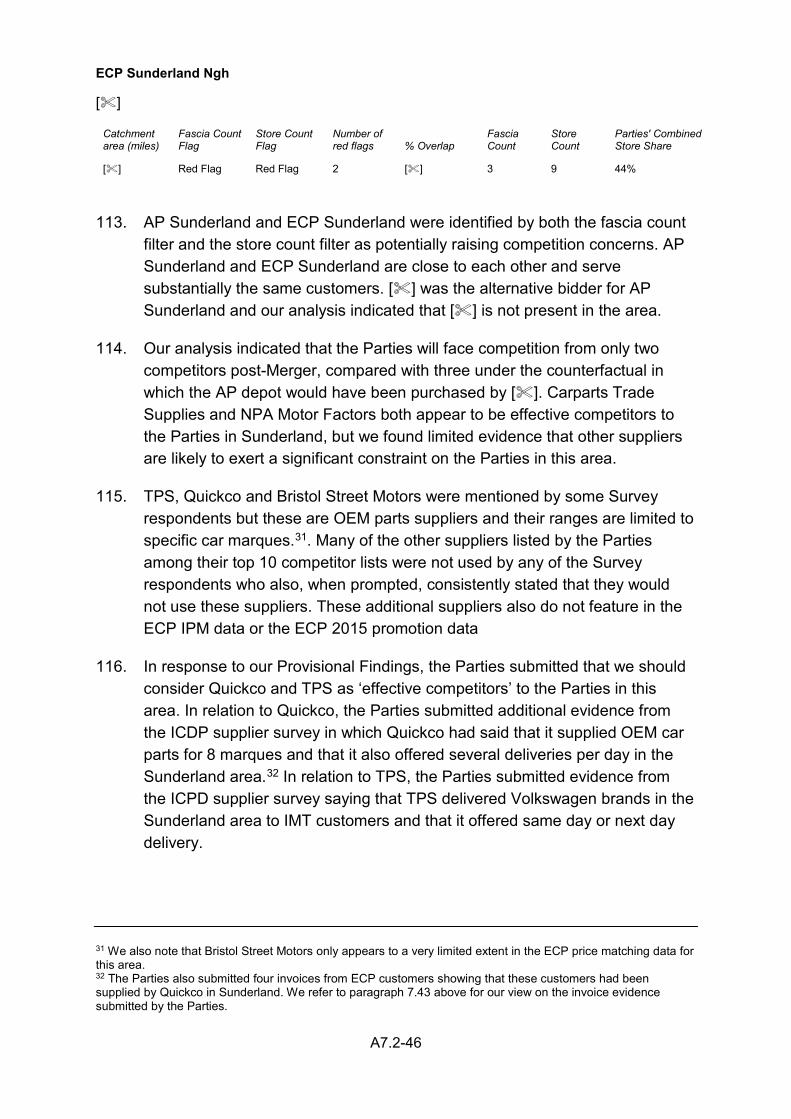
A7.2-46
ECP Sunderland Ngh
[]
Catchment area (miles)
Fascia Count Flag
Store Count Flag
Number of red flags % Overlap
Fascia Count
Store Count
Parties' Combined Store Share
[] Red Flag Red Flag 2 [] 3 9 44%
113. AP Sunderland and ECP Sunderland were identified by both the fascia count filter and the store count filter as potentially raising competition concerns. AP Sunderland and ECP Sunderland are close to each other and serve substantially the same customers. [] was the alternative bidder for AP Sunderland and our analysis indicated that [] is not present in the area.
114. Our analysis indicated that the Parties will face competition from only two competitors post-Merger, compared with three under the counterfactual in which the AP depot would have been purchased by []. Carparts Trade Supplies and NPA Motor Factors both appear to be effective competitors to the Parties in Sunderland, but we found limited evidence that other suppliers are likely to exert a significant constraint on the Parties in this area.
115. TPS, Quickco and Bristol Street Motors were mentioned by some Survey respondents but these are OEM parts suppliers and their ranges are limited to specific car marques.31. Many of the other suppliers listed by the Parties among their top 10 competitor lists were not used by any of the Survey respondents who also, when prompted, consistently stated that they would not use these suppliers. These additional suppliers also do not feature in the ECP IPM data or the ECP 2015 promotion data
116. In response to our Provisional Findings, the Parties submitted that we should consider Quickco and TPS as ‘effective competitors’ to the Parties in this area. In relation to Quickco, the Parties submitted additional evidence from the ICDP supplier survey in which Quickco had said that it supplied OEM car parts for 8 marques and that it also offered several deliveries per day in the Sunderland area.32 In relation to TPS, the Parties submitted evidence from the ICPD supplier survey saying that TPS delivered Volkswagen brands in the Sunderland area to IMT customers and that it offered same day or next day delivery.
31 We also note that Bristol Street Motors only appears to a very limited extent in the ECP price matching data for this area. 32 The Parties also submitted four invoices from ECP customers showing that these customers had been supplied by Quickco in Sunderland. We refer to paragraph 7.43 above for our view on the invoice evidence submitted by the Parties.
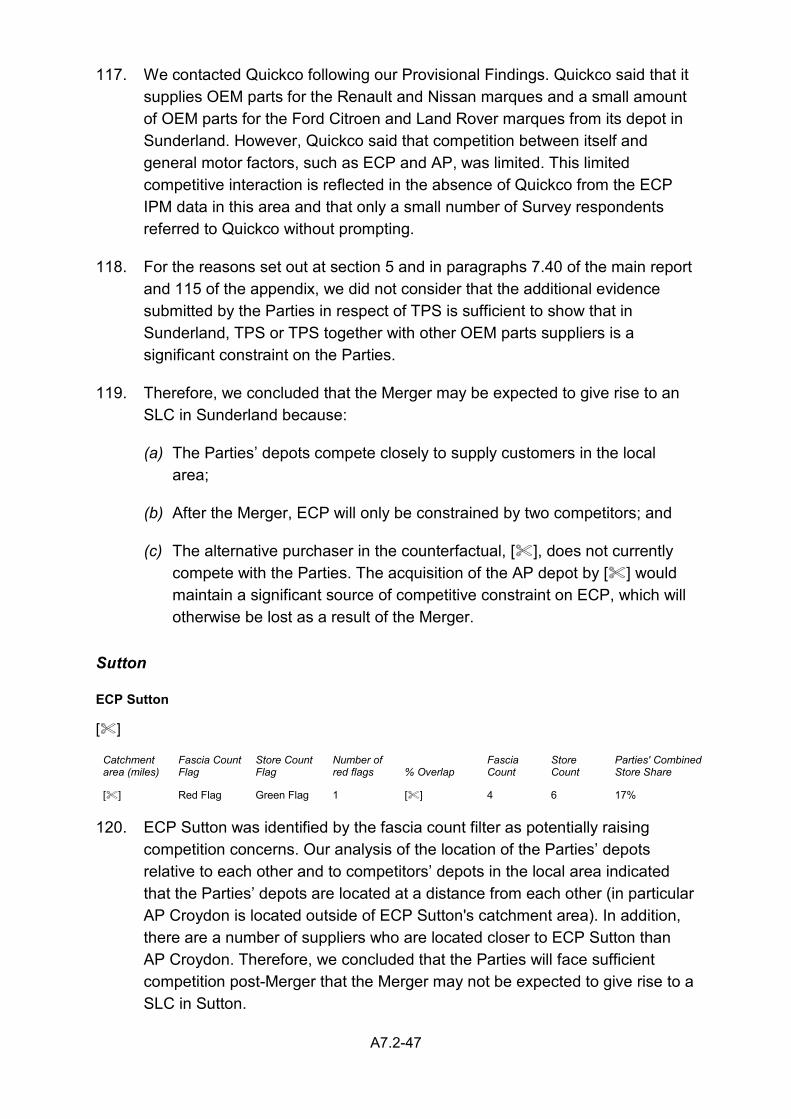
A7.2-47
117. We contacted Quickco following our Provisional Findings. Quickco said that it supplies OEM parts for the Renault and Nissan marques and a small amount of OEM parts for the Ford Citroen and Land Rover marques from its depot in Sunderland. However, Quickco said that competition between itself and general motor factors, such as ECP and AP, was limited. This limited competitive interaction is reflected in the absence of Quickco from the ECP IPM data in this area and that only a small number of Survey respondents referred to Quickco without prompting.
118. For the reasons set out at section 5 and in paragraphs 7.40 of the main report and 115 of the appendix, we did not consider that the additional evidence submitted by the Parties in respect of TPS is sufficient to show that in Sunderland, TPS or TPS together with other OEM parts suppliers is a significant constraint on the Parties.
119. Therefore, we concluded that the Merger may be expected to give rise to an SLC in Sunderland because:
(a) The Parties’ depots compete closely to supply customers in the local area;
(b) After the Merger, ECP will only be constrained by two competitors; and
(c) The alternative purchaser in the counterfactual, [], does not currently compete with the Parties. The acquisition of the AP depot by [] would maintain a significant source of competitive constraint on ECP, which will otherwise be lost as a result of the Merger.
Sutton
ECP Sutton
[]
Catchment area (miles)
Fascia Count Flag
Store Count Flag
Number of red flags % Overlap
Fascia Count
Store Count
Parties' Combined Store Share
[] Red Flag Green Flag 1 [] 4 6 17% 120. ECP Sutton was identified by the fascia count filter as potentially raising
competition concerns. Our analysis of the location of the Parties’ depots relative to each other and to competitors’ depots in the local area indicated that the Parties’ depots are located at a distance from each other (in particular AP Croydon is located outside of ECP Sutton's catchment area). In addition, there are a number of suppliers who are located closer to ECP Sutton than AP Croydon. Therefore, we concluded that the Parties will face sufficient competition post-Merger that the Merger may not be expected to give rise to a SLC in Sutton.
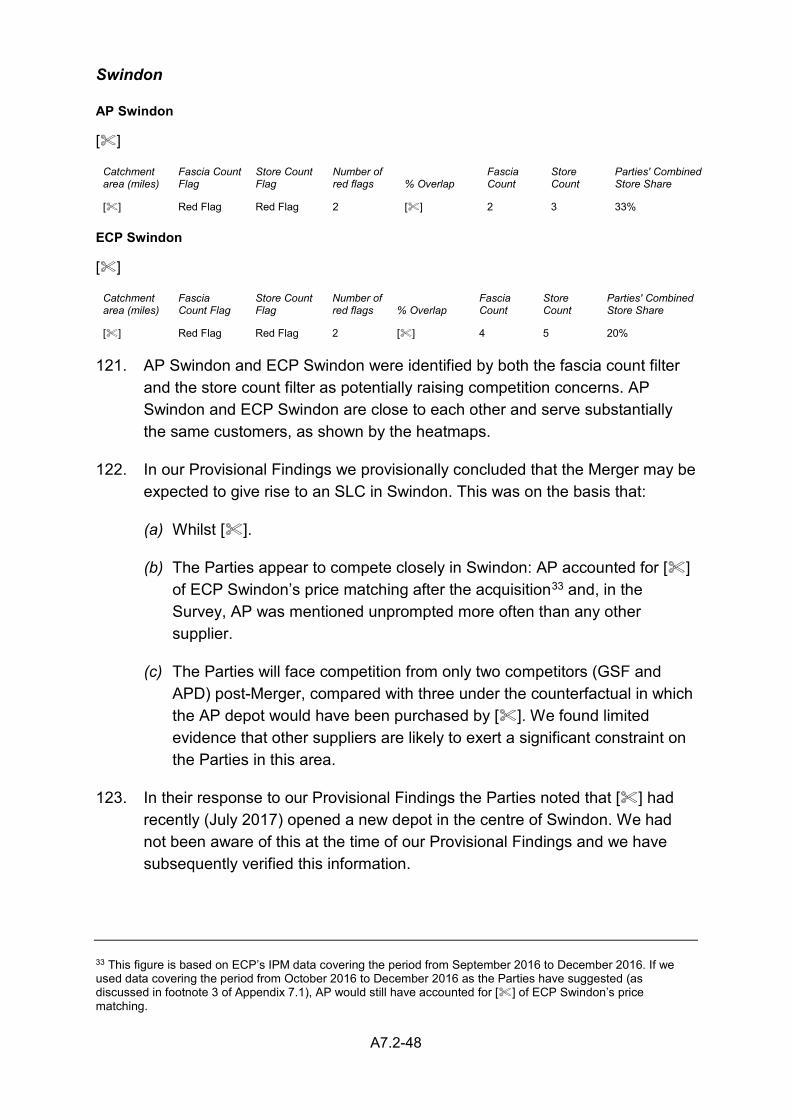
A7.2-48
Swindon
AP Swindon
[]
Catchment area (miles)
Fascia Count Flag
Store Count Flag
Number of red flags % Overlap
Fascia Count
Store Count
Parties' Combined Store Share
[] Red Flag Red Flag 2 [] 2 3 33% ECP Swindon
[]
Catchment area (miles)
Fascia Count Flag
Store Count Flag
Number of red flags % Overlap
Fascia Count
Store Count
Parties' Combined Store Share
[] Red Flag Red Flag 2 [] 4 5 20% 121. AP Swindon and ECP Swindon were identified by both the fascia count filter
and the store count filter as potentially raising competition concerns. AP Swindon and ECP Swindon are close to each other and serve substantially the same customers, as shown by the heatmaps.
122. In our Provisional Findings we provisionally concluded that the Merger may be expected to give rise to an SLC in Swindon. This was on the basis that:
(a) Whilst [].
(b) The Parties appear to compete closely in Swindon: AP accounted for [] of ECP Swindon’s price matching after the acquisition33 and, in the Survey, AP was mentioned unprompted more often than any other supplier.
(c) The Parties will face competition from only two competitors (GSF and APD) post-Merger, compared with three under the counterfactual in which the AP depot would have been purchased by []. We found limited evidence that other suppliers are likely to exert a significant constraint on the Parties in this area.
123. In their response to our Provisional Findings the Parties noted that [] had recently (July 2017) opened a new depot in the centre of Swindon. We had not been aware of this at the time of our Provisional Findings and we have subsequently verified this information.
33 This figure is based on ECP’s IPM data covering the period from September 2016 to December 2016. If we used data covering the period from October 2016 to December 2016 as the Parties have suggested (as discussed in footnote 3 of Appendix 7.1), AP would still have accounted for [] of ECP Swindon’s price matching.
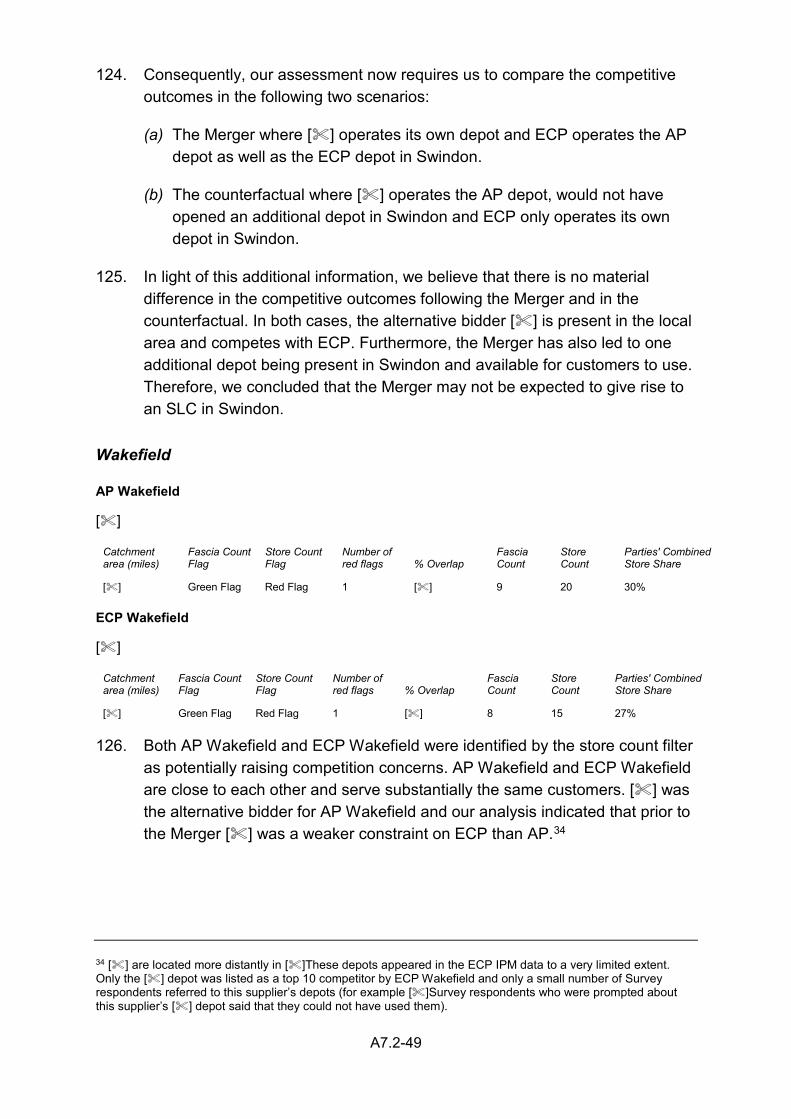
A7.2-49
124. Consequently, our assessment now requires us to compare the competitive outcomes in the following two scenarios:
(a) The Merger where [] operates its own depot and ECP operates the AP depot as well as the ECP depot in Swindon.
(b) The counterfactual where [] operates the AP depot, would not have opened an additional depot in Swindon and ECP only operates its own depot in Swindon.
125. In light of this additional information, we believe that there is no material difference in the competitive outcomes following the Merger and in the counterfactual. In both cases, the alternative bidder [] is present in the local area and competes with ECP. Furthermore, the Merger has also led to one additional depot being present in Swindon and available for customers to use. Therefore, we concluded that the Merger may not be expected to give rise to an SLC in Swindon.
Wakefield
AP Wakefield
[]
Catchment area (miles)
Fascia Count Flag
Store Count Flag
Number of red flags % Overlap
Fascia Count
Store Count
Parties' Combined Store Share
[] Green Flag Red Flag 1 [] 9 20 30% ECP Wakefield
[]
Catchment area (miles)
Fascia Count Flag
Store Count Flag
Number of red flags % Overlap
Fascia Count
Store Count
Parties' Combined Store Share
[] Green Flag Red Flag 1 [] 8 15 27% 126. Both AP Wakefield and ECP Wakefield were identified by the store count filter
as potentially raising competition concerns. AP Wakefield and ECP Wakefield are close to each other and serve substantially the same customers. [] was the alternative bidder for AP Wakefield and our analysis indicated that prior to the Merger [] was a weaker constraint on ECP than AP.34
34 [] are located more distantly in []These depots appeared in the ECP IPM data to a very limited extent. Only the [] depot was listed as a top 10 competitor by ECP Wakefield and only a small number of Survey respondents referred to this supplier’s depots (for example []Survey respondents who were prompted about this supplier’s [] depot said that they could not have used them).
A7.2-50
127. Our analysis indicated that the Parties were the closest competitors to each other and will face limited competition from other suppliers post-Merger:
(a) The Parties appear to compete closely: 10 of 11 ECP Wakefield survey respondents and 7 of 10 AP Wakefield survey respondents mentioned the other Party unprompted as the alternative they would have used had the focal AP/ECP depot been closed, AP accounts for over [] of ECP Wakefield’s price matching,35 and [].
(b) A-Z Motor Spares has a site in Wakefield and additional sites in the area, but very few Survey respondents said they had used it and it only received [] of ECP Wakefield’s price matches.36
(c) Wood Auto Factors in Wakefield was included in both the AP and the ECP survey but, while 7 of 21 respondents said they could have used it as an alternative when prompted, only 1 respondent mentioned it unprompted and 8 said they could not have used it as an alternative, with some respondents stating they had never heard of Wood Auto Factors and others that it did not stock the parts they needed or that its prices were not competitive. In addition, this supplier had only been used by 2 of 21 Survey respondents in the last 3 months. We also noted that Wood Auto Factors does not appear in the ECP IPM or the ECP 2015 promotion data for this area.
(d) Trust Ford Wakefield, which a number of ECP customers said they could have used as an alternative when prompted, is an OEM parts supplier whose focus is on the supply of parts for Ford vehicles and so only competes with the Parties in respect of a limited part of their range.
(e) Few Survey respondents had used any of the other suppliers listed by the Parties as competitors in the area and, in each case, when prompted more respondents had said they would not be able to use them as an alternative to the AP/ECP focal depot than said they would be able to use them.
128. In their response to our Provisional Findings, the Parties submitted that we should have considered GSF’s branches in Leeds, M1 Motorparts and Wood Auto Factors as ‘effective competitors’ to the Parties in Wakefield. In our view,
35 This figure is based on ECP’s IPM data covering the period from September 2016 to December 2016. If we used data covering the period from October 2016 to December 2016 as the Parties have suggested (as discussed in footnote 3 of Appendix 7.1), AP would still have accounted for over [] of ECP Wakefield’s price matching. 36 This figure is based on ECP’s IPM data covering the period from September 2016 to December 2016. If we used data covering the period from October 2016 to December 2016 as the Parties have suggested (as discussed in footnote 3 of Appendix 7.1), A-Z Motor Spares would still have accounted for only [] of ECP Wakefield’s price matching.
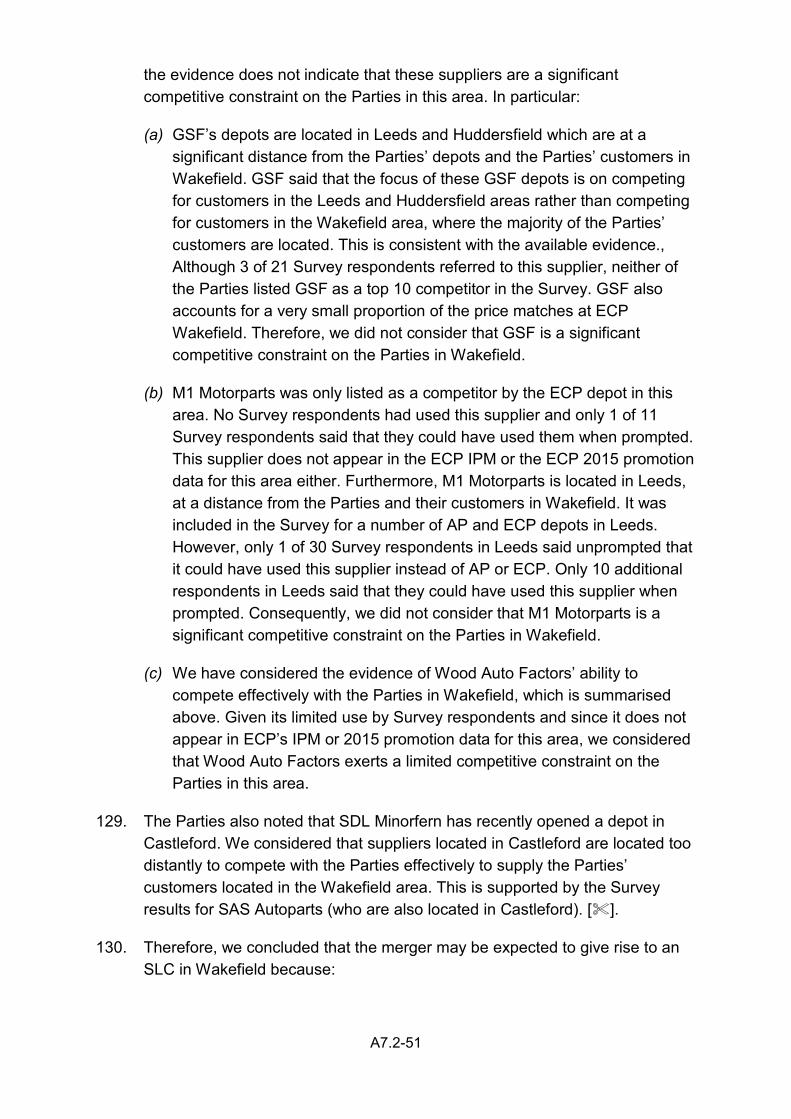
A7.2-51
the evidence does not indicate that these suppliers are a significant competitive constraint on the Parties in this area. In particular:
(a) GSF’s depots are located in Leeds and Huddersfield which are at a significant distance from the Parties’ depots and the Parties’ customers in Wakefield. GSF said that the focus of these GSF depots is on competing for customers in the Leeds and Huddersfield areas rather than competing for customers in the Wakefield area, where the majority of the Parties’ customers are located. This is consistent with the available evidence., Although 3 of 21 Survey respondents referred to this supplier, neither of the Parties listed GSF as a top 10 competitor in the Survey. GSF also accounts for a very small proportion of the price matches at ECP Wakefield. Therefore, we did not consider that GSF is a significant competitive constraint on the Parties in Wakefield.
(b) M1 Motorparts was only listed as a competitor by the ECP depot in this area. No Survey respondents had used this supplier and only 1 of 11 Survey respondents said that they could have used them when prompted. This supplier does not appear in the ECP IPM or the ECP 2015 promotion data for this area either. Furthermore, M1 Motorparts is located in Leeds, at a distance from the Parties and their customers in Wakefield. It was included in the Survey for a number of AP and ECP depots in Leeds. However, only 1 of 30 Survey respondents in Leeds said unprompted that it could have used this supplier instead of AP or ECP. Only 10 additional respondents in Leeds said that they could have used this supplier when prompted. Consequently, we did not consider that M1 Motorparts is a significant competitive constraint on the Parties in Wakefield.
(c) We have considered the evidence of Wood Auto Factors’ ability to compete effectively with the Parties in Wakefield, which is summarised above. Given its limited use by Survey respondents and since it does not appear in ECP’s IPM or 2015 promotion data for this area, we considered that Wood Auto Factors exerts a limited competitive constraint on the Parties in this area.
129. The Parties also noted that SDL Minorfern has recently opened a depot in Castleford. We considered that suppliers located in Castleford are located too distantly to compete with the Parties effectively to supply the Parties’ customers located in the Wakefield area. This is supported by the Survey results for SAS Autoparts (who are also located in Castleford). [].
130. Therefore, we concluded that the merger may be expected to give rise to an SLC in Wakefield because:
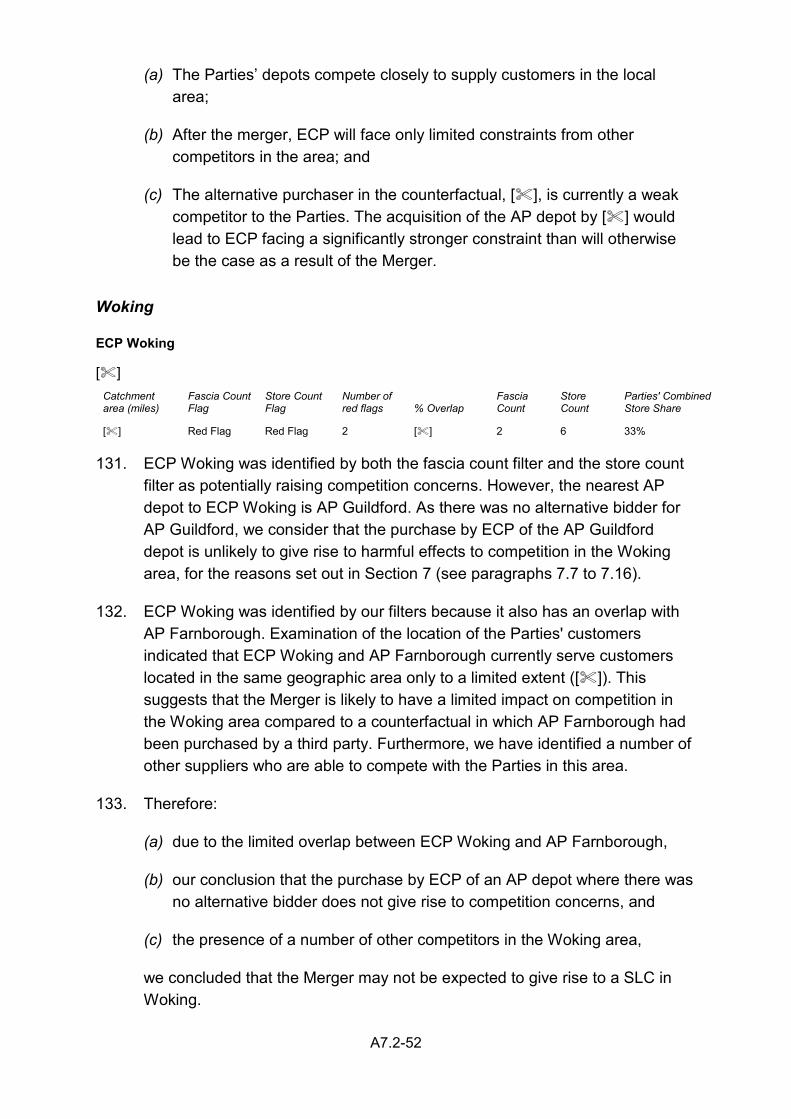
A7.2-52
(a) The Parties’ depots compete closely to supply customers in the local area;
(b) After the merger, ECP will face only limited constraints from other competitors in the area; and
(c) The alternative purchaser in the counterfactual, [], is currently a weak competitor to the Parties. The acquisition of the AP depot by [] would lead to ECP facing a significantly stronger constraint than will otherwise be the case as a result of the Merger.
Woking
ECP Woking
[]
Catchment area (miles)
Fascia Count Flag
Store Count Flag
Number of red flags % Overlap
Fascia Count
Store Count
Parties' Combined Store Share
[] Red Flag Red Flag 2 [] 2 6 33% 131. ECP Woking was identified by both the fascia count filter and the store count
filter as potentially raising competition concerns. However, the nearest AP depot to ECP Woking is AP Guildford. As there was no alternative bidder for AP Guildford, we consider that the purchase by ECP of the AP Guildford depot is unlikely to give rise to harmful effects to competition in the Woking area, for the reasons set out in Section 7 (see paragraphs 7.7 to 7.16).
132. ECP Woking was identified by our filters because it also has an overlap with AP Farnborough. Examination of the location of the Parties' customers indicated that ECP Woking and AP Farnborough currently serve customers located in the same geographic area only to a limited extent ([]). This suggests that the Merger is likely to have a limited impact on competition in the Woking area compared to a counterfactual in which AP Farnborough had been purchased by a third party. Furthermore, we have identified a number of other suppliers who are able to compete with the Parties in this area.
133. Therefore:
(a) due to the limited overlap between ECP Woking and AP Farnborough,
(b) our conclusion that the purchase by ECP of an AP depot where there was no alternative bidder does not give rise to competition concerns, and
(c) the presence of a number of other competitors in the Woking area,
we concluded that the Merger may not be expected to give rise to a SLC in Woking.
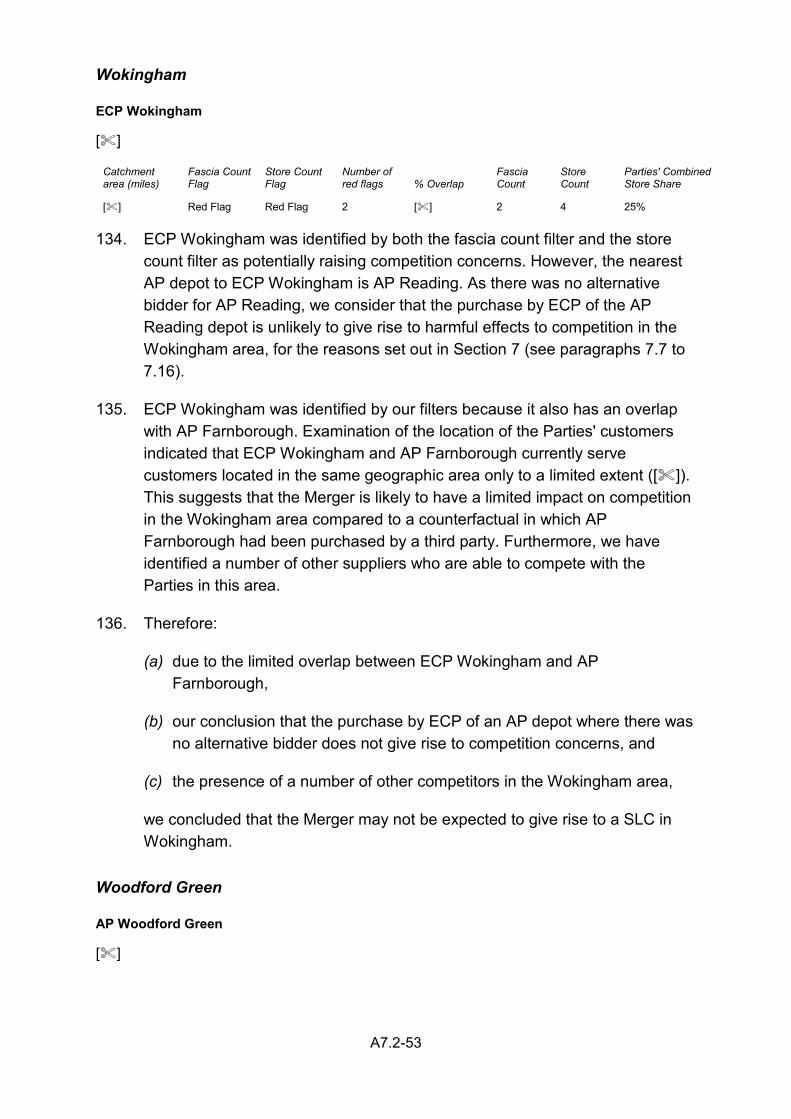
A7.2-53
Wokingham
ECP Wokingham
[]
Catchment area (miles)
Fascia Count Flag
Store Count Flag
Number of red flags % Overlap
Fascia Count
Store Count
Parties' Combined Store Share
[] Red Flag Red Flag 2 [] 2 4 25% 134. ECP Wokingham was identified by both the fascia count filter and the store
count filter as potentially raising competition concerns. However, the nearest AP depot to ECP Wokingham is AP Reading. As there was no alternative bidder for AP Reading, we consider that the purchase by ECP of the AP Reading depot is unlikely to give rise to harmful effects to competition in the Wokingham area, for the reasons set out in Section 7 (see paragraphs 7.7 to 7.16).
135. ECP Wokingham was identified by our filters because it also has an overlap with AP Farnborough. Examination of the location of the Parties' customers indicated that ECP Wokingham and AP Farnborough currently serve customers located in the same geographic area only to a limited extent ([]). This suggests that the Merger is likely to have a limited impact on competition in the Wokingham area compared to a counterfactual in which AP Farnborough had been purchased by a third party. Furthermore, we have identified a number of other suppliers who are able to compete with the Parties in this area.
136. Therefore:
(a) due to the limited overlap between ECP Wokingham and AP Farnborough,
(b) our conclusion that the purchase by ECP of an AP depot where there was no alternative bidder does not give rise to competition concerns, and
(c) the presence of a number of other competitors in the Wokingham area,
we concluded that the Merger may not be expected to give rise to a SLC in Wokingham.
Woodford Green
AP Woodford Green
[]
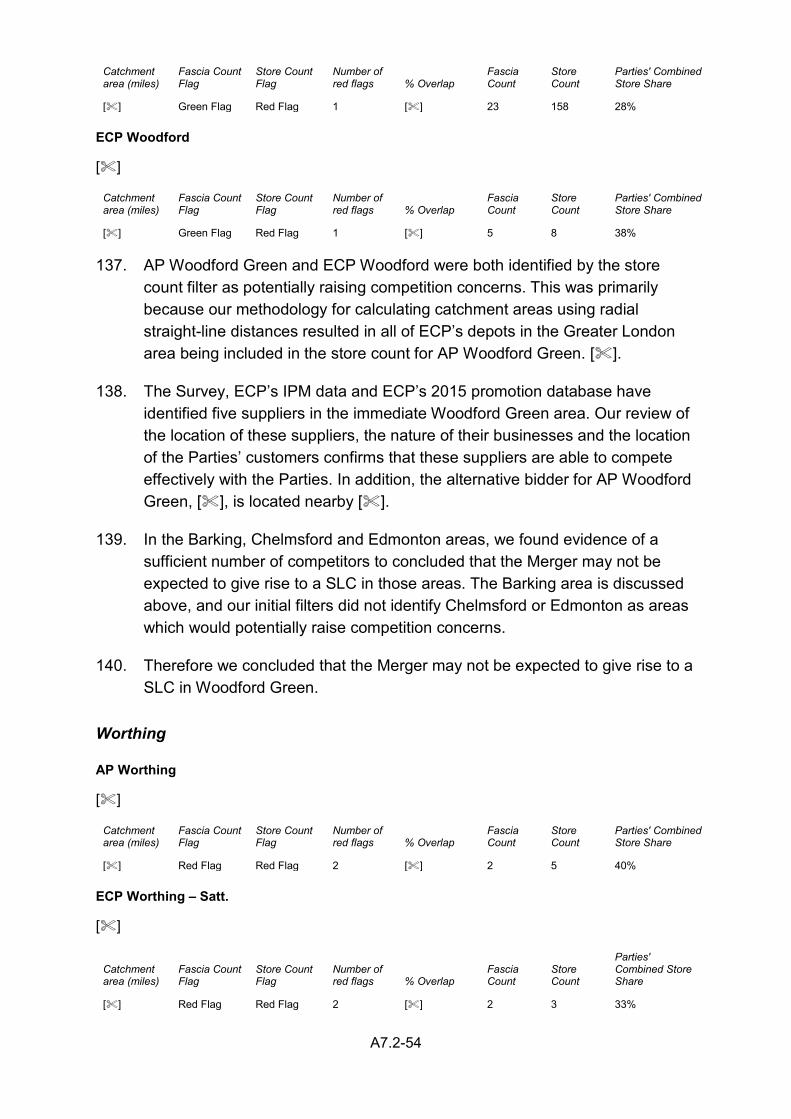
A7.2-54
Catchment area (miles)
Fascia Count Flag
Store Count Flag
Number of red flags % Overlap
Fascia Count
Store Count
Parties' Combined Store Share
[] Green Flag Red Flag 1 [] 23 158 28% ECP Woodford
[]
Catchment area (miles)
Fascia Count Flag
Store Count Flag
Number of red flags % Overlap
Fascia Count
Store Count
Parties' Combined Store Share
[] Green Flag Red Flag 1 [] 5 8 38% 137. AP Woodford Green and ECP Woodford were both identified by the store
count filter as potentially raising competition concerns. This was primarily because our methodology for calculating catchment areas using radial straight-line distances resulted in all of ECP’s depots in the Greater London area being included in the store count for AP Woodford Green. [].
138. The Survey, ECP’s IPM data and ECP’s 2015 promotion database have identified five suppliers in the immediate Woodford Green area. Our review of the location of these suppliers, the nature of their businesses and the location of the Parties’ customers confirms that these suppliers are able to compete effectively with the Parties. In addition, the alternative bidder for AP Woodford Green, [], is located nearby [].
139. In the Barking, Chelmsford and Edmonton areas, we found evidence of a sufficient number of competitors to concluded that the Merger may not be expected to give rise to a SLC in those areas. The Barking area is discussed above, and our initial filters did not identify Chelmsford or Edmonton as areas which would potentially raise competition concerns.
140. Therefore we concluded that the Merger may not be expected to give rise to a SLC in Woodford Green.
Worthing
AP Worthing
[]
Catchment area (miles)
Fascia Count Flag
Store Count Flag
Number of red flags % Overlap
Fascia Count
Store Count
Parties' Combined Store Share
[] Red Flag Red Flag 2 [] 2 5 40% ECP Worthing – Satt.
[]
Catchment area (miles)
Fascia Count Flag
Store Count Flag
Number of red flags % Overlap
Fascia Count
Store Count
Parties' Combined Store Share
[] Red Flag Red Flag 2 [] 2 3 33%
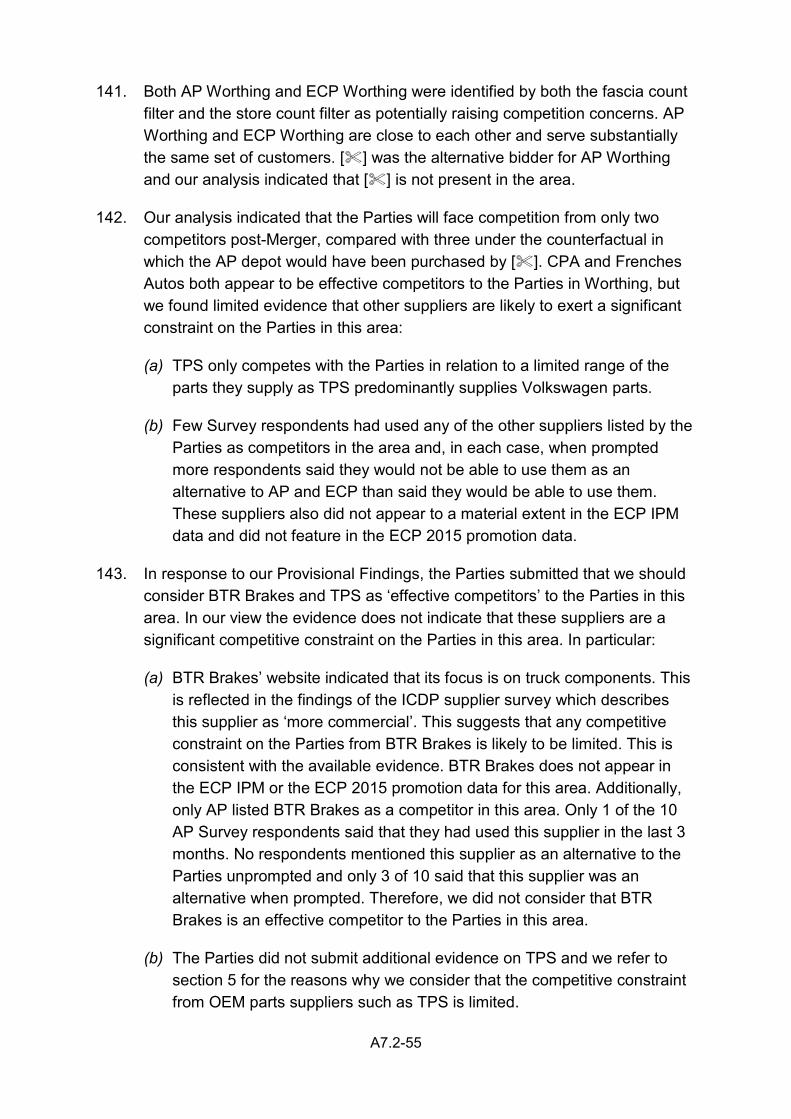
A7.2-55
141. Both AP Worthing and ECP Worthing were identified by both the fascia count
filter and the store count filter as potentially raising competition concerns. AP Worthing and ECP Worthing are close to each other and serve substantially the same set of customers. [] was the alternative bidder for AP Worthing and our analysis indicated that [] is not present in the area.
142. Our analysis indicated that the Parties will face competition from only two competitors post-Merger, compared with three under the counterfactual in which the AP depot would have been purchased by []. CPA and Frenches Autos both appear to be effective competitors to the Parties in Worthing, but we found limited evidence that other suppliers are likely to exert a significant constraint on the Parties in this area:
(a) TPS only competes with the Parties in relation to a limited range of the parts they supply as TPS predominantly supplies Volkswagen parts.
(b) Few Survey respondents had used any of the other suppliers listed by the Parties as competitors in the area and, in each case, when prompted more respondents said they would not be able to use them as an alternative to AP and ECP than said they would be able to use them. These suppliers also did not appear to a material extent in the ECP IPM data and did not feature in the ECP 2015 promotion data.
143. In response to our Provisional Findings, the Parties submitted that we should consider BTR Brakes and TPS as ‘effective competitors’ to the Parties in this area. In our view the evidence does not indicate that these suppliers are a significant competitive constraint on the Parties in this area. In particular:
(a) BTR Brakes’ website indicated that its focus is on truck components. This is reflected in the findings of the ICDP supplier survey which describes this supplier as ‘more commercial’. This suggests that any competitive constraint on the Parties from BTR Brakes is likely to be limited. This is consistent with the available evidence. BTR Brakes does not appear in the ECP IPM or the ECP 2015 promotion data for this area. Additionally, only AP listed BTR Brakes as a competitor in this area. Only 1 of the 10 AP Survey respondents said that they had used this supplier in the last 3 months. No respondents mentioned this supplier as an alternative to the Parties unprompted and only 3 of 10 said that this supplier was an alternative when prompted. Therefore, we did not consider that BTR Brakes is an effective competitor to the Parties in this area.
(b) The Parties did not submit additional evidence on TPS and we refer to section 5 for the reasons why we consider that the competitive constraint from OEM parts suppliers such as TPS is limited.
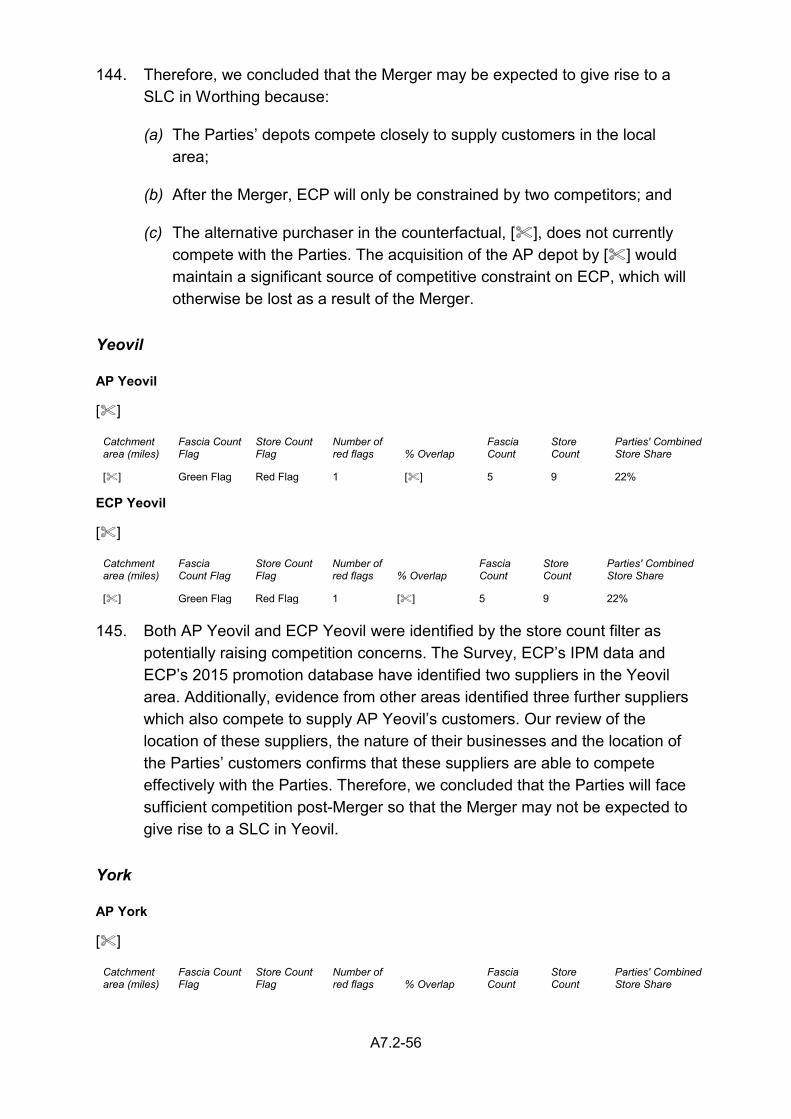
A7.2-56
144. Therefore, we concluded that the Merger may be expected to give rise to a SLC in Worthing because:
(a) The Parties’ depots compete closely to supply customers in the local area;
(b) After the Merger, ECP will only be constrained by two competitors; and
(c) The alternative purchaser in the counterfactual, [], does not currently compete with the Parties. The acquisition of the AP depot by [] would maintain a significant source of competitive constraint on ECP, which will otherwise be lost as a result of the Merger.
Yeovil
AP Yeovil
[]
Catchment area (miles)
Fascia Count Flag
Store Count Flag
Number of red flags % Overlap
Fascia Count
Store Count
Parties' Combined Store Share
[] Green Flag Red Flag 1 [] 5 9 22% ECP Yeovil
[]
Catchment area (miles)
Fascia Count Flag
Store Count Flag
Number of red flags % Overlap
Fascia Count
Store Count
Parties' Combined Store Share
[] Green Flag Red Flag 1 [] 5 9 22% 145. Both AP Yeovil and ECP Yeovil were identified by the store count filter as
potentially raising competition concerns. The Survey, ECP’s IPM data and ECP’s 2015 promotion database have identified two suppliers in the Yeovil area. Additionally, evidence from other areas identified three further suppliers which also compete to supply AP Yeovil’s customers. Our review of the location of these suppliers, the nature of their businesses and the location of the Parties’ customers confirms that these suppliers are able to compete effectively with the Parties. Therefore, we concluded that the Parties will face sufficient competition post-Merger so that the Merger may not be expected to give rise to a SLC in Yeovil.
York
AP York
[]
Catchment area (miles)
Fascia Count Flag
Store Count Flag
Number of red flags % Overlap
Fascia Count
Store Count
Parties' Combined Store Share
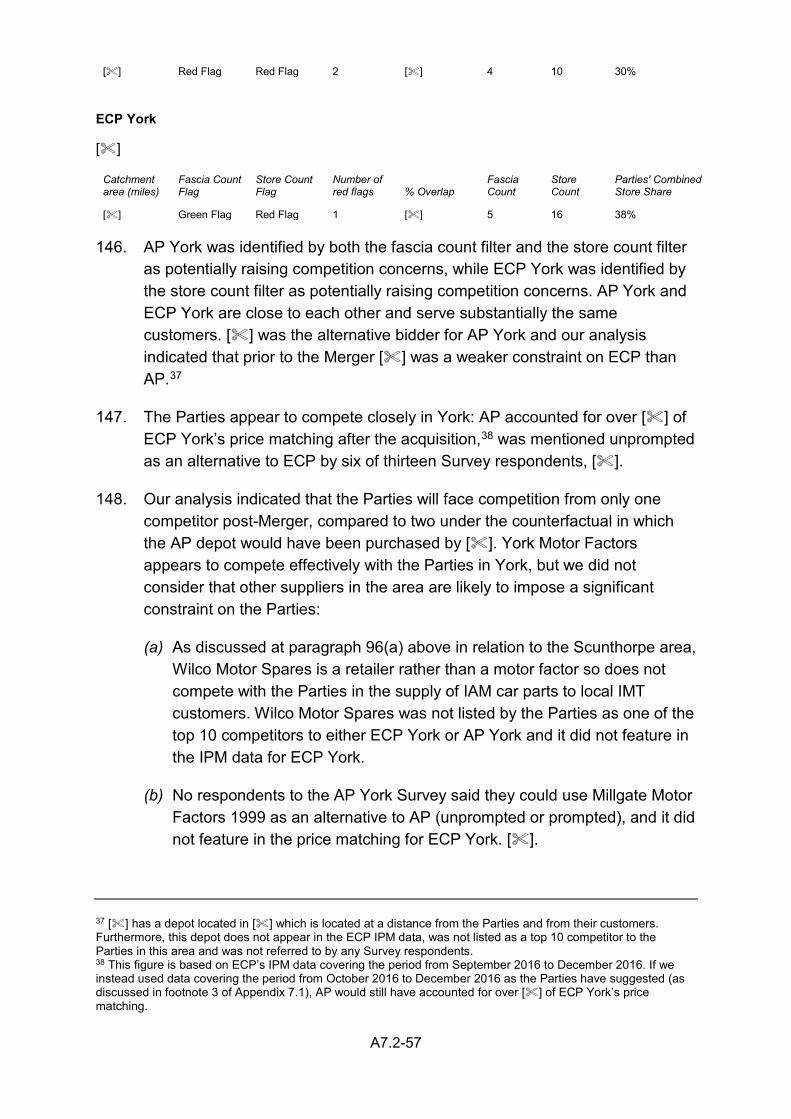
A7.2-57
[] Red Flag Red Flag 2 [] 4 10 30% ECP York
[]
Catchment area (miles)
Fascia Count Flag
Store Count Flag
Number of red flags % Overlap
Fascia Count
Store Count
Parties' Combined Store Share
[] Green Flag Red Flag 1 [] 5 16 38% 146. AP York was identified by both the fascia count filter and the store count filter
as potentially raising competition concerns, while ECP York was identified by the store count filter as potentially raising competition concerns. AP York and ECP York are close to each other and serve substantially the same customers. [] was the alternative bidder for AP York and our analysis indicated that prior to the Merger [] was a weaker constraint on ECP than AP.37
147. The Parties appear to compete closely in York: AP accounted for over [] of ECP York’s price matching after the acquisition,38 was mentioned unprompted as an alternative to ECP by six of thirteen Survey respondents, [].
148. Our analysis indicated that the Parties will face competition from only one competitor post-Merger, compared to two under the counterfactual in which the AP depot would have been purchased by []. York Motor Factors appears to compete effectively with the Parties in York, but we did not consider that other suppliers in the area are likely to impose a significant constraint on the Parties:
(a) As discussed at paragraph 96(a) above in relation to the Scunthorpe area, Wilco Motor Spares is a retailer rather than a motor factor so does not compete with the Parties in the supply of IAM car parts to local IMT customers. Wilco Motor Spares was not listed by the Parties as one of the top 10 competitors to either ECP York or AP York and it did not feature in the IPM data for ECP York.
(b) No respondents to the AP York Survey said they could use Millgate Motor Factors 1999 as an alternative to AP (unprompted or prompted), and it did not feature in the price matching for ECP York. [].
37 [] has a depot located in [] which is located at a distance from the Parties and from their customers. Furthermore, this depot does not appear in the ECP IPM data, was not listed as a top 10 competitor to the Parties in this area and was not referred to by any Survey respondents. 38 This figure is based on ECP’s IPM data covering the period from September 2016 to December 2016. If we instead used data covering the period from October 2016 to December 2016 as the Parties have suggested (as discussed in footnote 3 of Appendix 7.1), AP would still have accounted for over [] of ECP York’s price matching.
A7.2-58
(c) In York, neither Party listed Fleet Factors as one of its top 10 competitors and so Survey respondents were not asked about it. However, although Fleet Factors is included in the set of Effective Competitors in our filtering process because it reaches the Survey score threshold for AP Newcastle, it does not appear to be a strong competitor in other areas. The Parties listed Fleet Factors as one of their top 10 competitors at 13 depots, and so across the entire Survey 126 customers were asked about Fleet Factors. However only 5 Survey respondents (4%) said they had used it in the past three months, only 3 (2%) mentioned it unprompted as an alternative supplier they could have used had the focal AP/ECP depot been closed and, when prompted about whether they could have used Fleet Factors, only 21 customers (17%) said yes while 63 (50%) said no.
(d) Other suppliers listed by the Parties as competitors in York are either OEM parts suppliers and so only able to exert a limited constraint on the Parties because of their limited range, or were not viewed by Survey respondents as viable alternative to the Parties.
149. The Parties did not provide any submissions which were specific to York in their response to our Provisional Findings.
150. Therefore, we concluded that the Merger may be expected to give rise to a SLC in York because:
(a) The Parties’ depots compete closely to supply customers in the local area;
(b) After the Merger, ECP will only be constrained by one competitor; and
(c) The alternative purchaser in the counterfactual, [], is currently a weak competitor to the Parties. The acquisition of the AP depot by [] would lead to ECP facing a significantly stronger constraint than will otherwise be the case as a result of the Merger.
A7.3-1
APPENDIX 7.3
Evidence on other suppliers for Local Assessments
Introduction
1. This appendix contains tables summarising the evidence concerning othersuppliers which is used in our local assessments for each of the 94 focaldepots identified by our filters as depots in relation to which competitionconcerns may arise. For each focal depot, we provide a) a summary tableproviding details on the focal depot and b) a table comprising a list ofsuppliers considered in our local assessment in relation to the focal depot andthe main evidence on these suppliers.
2. The summary table for each focal depot details the depot's catchment area,the outcome of the fascia count and store count filters, and the inputs intothese filters, the extent of the overlap between the Parties (measured as thepercentage of the focal depot’s sales that were made to customers within the80% catchment area of any of the other party’s depots), the fascia count thestore count and the Parties’ combined share of stores.
3. The main table for each focal depot is a list of all of the suppliers in the vicinityof the focal depot which either:
(a) Are Actual Competitors to the focal depot (based on evidence from theSurvey, IPM data or ECP’s 2015 promotion data); or
(b) Are suppliers for which we have some evidence from the focal depot (either because they were included in the Survey or because they appeared in the price matching data but received less than 10% of the price matches).
4. Suppliers are listed in order of proximity. Suppliers who were not included inthe store/fascia counts for the purpose of filtering (because they are notActual Competitors, they are not generalist motor factors, or they are outsidethe 1.5x catchment area) are shown in grey. The following information oneach supplier is included:
(a) The type of supplier: motor factor, specialist supplier or VM Dealer (OEMsupplier);
(b) The distance of the supplier from the focal depot, in miles;
(c) Whether the supplier was included in the filters;
A7.3-2
(d) Whether the supplier was in the Parties' list of top 5/top 10 competitors to the focal depot;
(e) The supplier’s share of ECP's price matching, pre- and post-acquisition (for ECP focal depots only);
(f) Whether the supplier appeared in ECP's 2015 promotion data (for ECP focal depots only);
(g) The number of Survey responses about the supplier from customers of the focal depot;1
(h) The Survey score (based on weighted responses to particular questions, calculated as described in Appendix 7.1);
(i) The pseudo Survey score (the maximum Survey score the supplier would have attained had all respondents been asked about the correct list of suppliers at Q29); and
(j) The number of Survey respondents who had used the supplier in the past 3 months (S01), for whom the supplier was their primary, secondary or tertiary supplier (Q16-Q18 respectively), who listed the supplier unprompted when asked which other suppliers could have met their requirements if the focal depot had been closed (Q27), and who responded "Yes", "No", or "Don't Know" when asked specifically about whether the supplier could have met their requirements (Q29 Y/N/DK).
1 In the Survey, respondents were not asked about individual branches of supplier, and so in areas in which a supplier has multiple branches we are not able to allocate Survey responses between different branches. Instead, Survey responses for a particular supplier are included for each one of the branches of that supplier that was listed among the top 10 competitors to the focal depot by the Parties (as these top 10 lists were used to determine which suppliers Survey respondents were asked about).
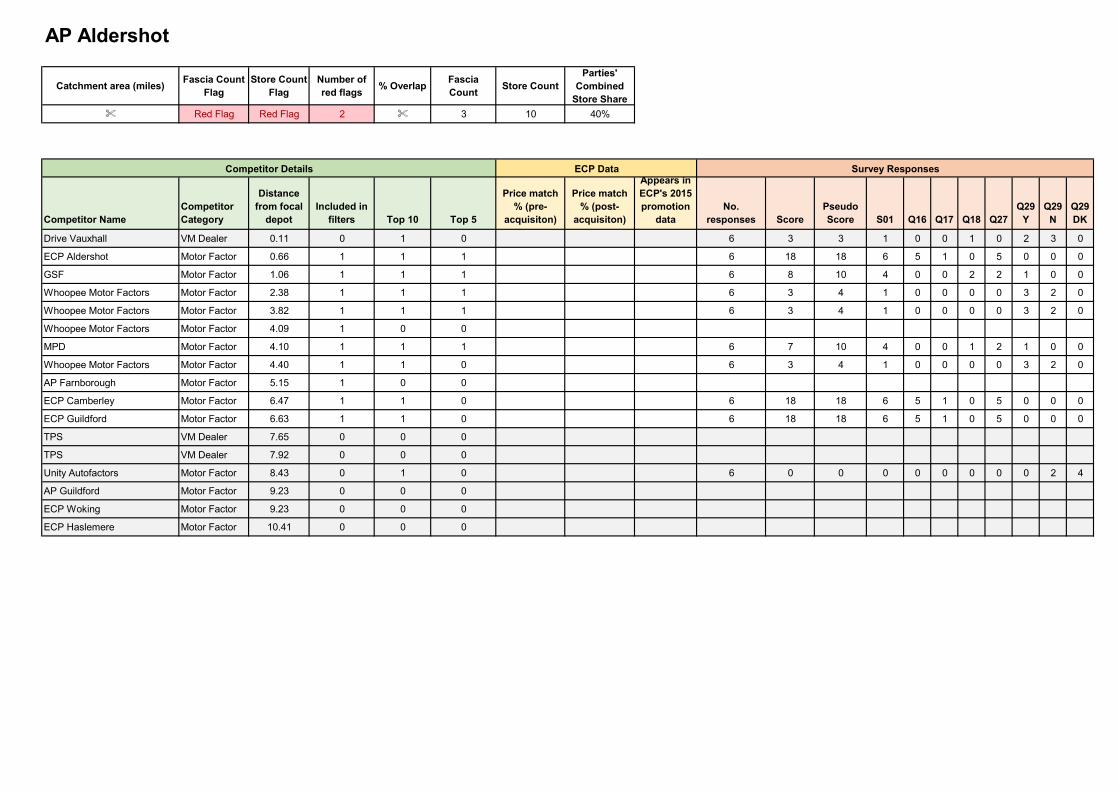
Catchment area (miles)Fascia Count
FlagStore Count
FlagNumber of red flags
% OverlapFascia Count
Store CountParties'
Combined Store Share
% Red Flag Red Flag 2 % 3 10 40%
Competitor NameCompetitor Category
Distance from focal
depotIncluded in
filters Top 10 Top 5
Price match % (pre-
acquisiton)
Price match % (post-
acquisiton)
Appears in ECP's 2015 promotion
dataNo.
responses ScorePseudo Score S01 Q16 Q17 Q18 Q27
Q29 Y
Q29 N
Q29 DK
Drive Vauxhall VM Dealer 0.11 0 1 0 6 3 3 1 0 0 1 0 2 3 0
ECP Aldershot Motor Factor 0.66 1 1 1 6 18 18 6 5 1 0 5 0 0 0
GSF Motor Factor 1.06 1 1 1 6 8 10 4 0 0 2 2 1 0 0
Whoopee Motor Factors Motor Factor 2.38 1 1 1 6 3 4 1 0 0 0 0 3 2 0
Whoopee Motor Factors Motor Factor 3.82 1 1 1 6 3 4 1 0 0 0 0 3 2 0
Whoopee Motor Factors Motor Factor 4.09 1 0 0
MPD Motor Factor 4.10 1 1 1 6 7 10 4 0 0 1 2 1 0 0
Whoopee Motor Factors Motor Factor 4.40 1 1 0 6 3 4 1 0 0 0 0 3 2 0
AP Farnborough Motor Factor 5.15 1 0 0
ECP Camberley Motor Factor 6.47 1 1 0 6 18 18 6 5 1 0 5 0 0 0
ECP Guildford Motor Factor 6.63 1 1 0 6 18 18 6 5 1 0 5 0 0 0
TPS VM Dealer 7.65 0 0 0
TPS VM Dealer 7.92 0 0 0
Unity Autofactors Motor Factor 8.43 0 1 0 6 0 0 0 0 0 0 0 0 2 4
AP Guildford Motor Factor 9.23 0 0 0
ECP Woking Motor Factor 9.23 0 0 0
ECP Haslemere Motor Factor 10.41 0 0 0
AP Aldershot
Competitor Details ECP Data Survey Responses
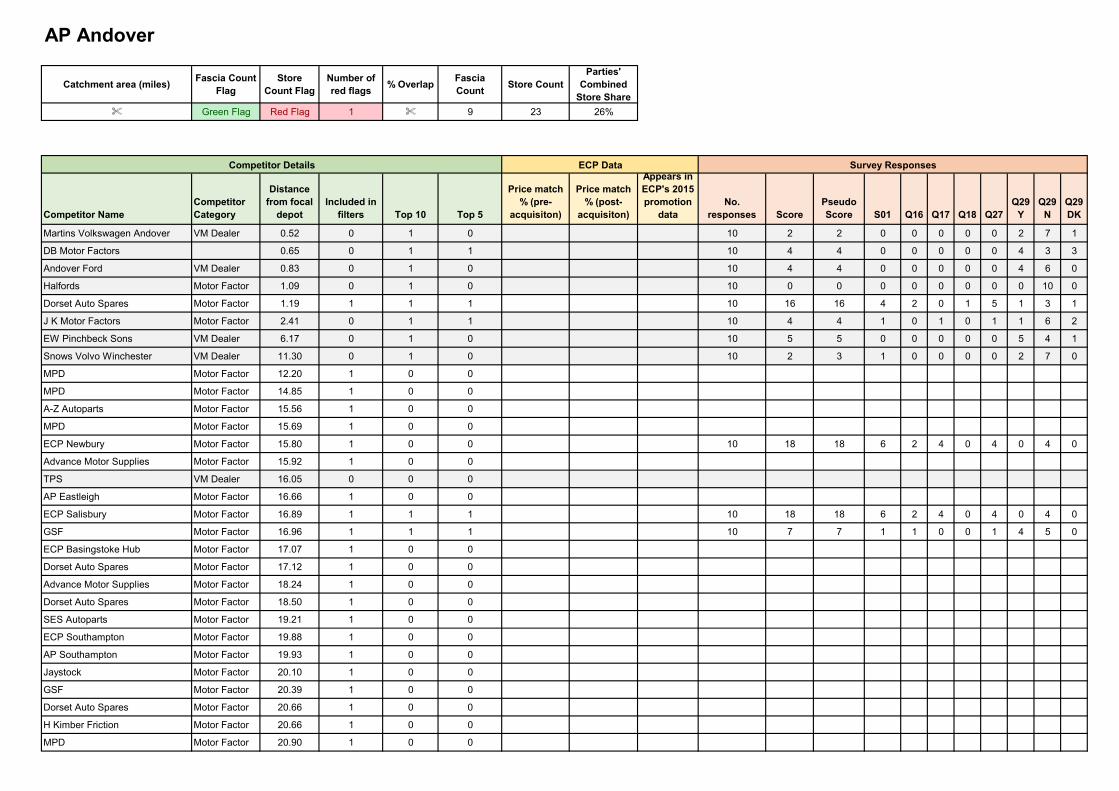
Catchment area (miles)Fascia Count
FlagStore
Count FlagNumber of red flags
% OverlapFascia Count
Store CountParties'
Combined Store Share
% Green Flag Red Flag 1 % 9 23 26%
Competitor NameCompetitor Category
Distance from focal
depotIncluded in
filters Top 10 Top 5
Price match % (pre-
acquisiton)
Price match % (post-
acquisiton)
Appears in ECP's 2015 promotion
dataNo.
responses ScorePseudo Score S01 Q16 Q17 Q18 Q27
Q29 Y
Q29 N
Q29 DK
Martins Volkswagen Andover VM Dealer 0.52 0 1 0 10 2 2 0 0 0 0 0 2 7 1
DB Motor Factors 0.65 0 1 1 10 4 4 0 0 0 0 0 4 3 3
Andover Ford VM Dealer 0.83 0 1 0 10 4 4 0 0 0 0 0 4 6 0
Halfords Motor Factor 1.09 0 1 0 10 0 0 0 0 0 0 0 0 10 0
Dorset Auto Spares Motor Factor 1.19 1 1 1 10 16 16 4 2 0 1 5 1 3 1
J K Motor Factors Motor Factor 2.41 0 1 1 10 4 4 1 0 1 0 1 1 6 2
EW Pinchbeck Sons VM Dealer 6.17 0 1 0 10 5 5 0 0 0 0 0 5 4 1
Snows Volvo Winchester VM Dealer 11.30 0 1 0 10 2 3 1 0 0 0 0 2 7 0
MPD Motor Factor 12.20 1 0 0
MPD Motor Factor 14.85 1 0 0
A-Z Autoparts Motor Factor 15.56 1 0 0
MPD Motor Factor 15.69 1 0 0
ECP Newbury Motor Factor 15.80 1 0 0 10 18 18 6 2 4 0 4 0 4 0
Advance Motor Supplies Motor Factor 15.92 1 0 0
TPS VM Dealer 16.05 0 0 0
AP Eastleigh Motor Factor 16.66 1 0 0
ECP Salisbury Motor Factor 16.89 1 1 1 10 18 18 6 2 4 0 4 0 4 0
GSF Motor Factor 16.96 1 1 1 10 7 7 1 1 0 0 1 4 5 0
ECP Basingstoke Hub Motor Factor 17.07 1 0 0
Dorset Auto Spares Motor Factor 17.12 1 0 0
Advance Motor Supplies Motor Factor 18.24 1 0 0
Dorset Auto Spares Motor Factor 18.50 1 0 0
SES Autoparts Motor Factor 19.21 1 0 0
ECP Southampton Motor Factor 19.88 1 0 0
AP Southampton Motor Factor 19.93 1 0 0
Jaystock Motor Factor 20.10 1 0 0
GSF Motor Factor 20.39 1 0 0
Dorset Auto Spares Motor Factor 20.66 1 0 0
H Kimber Friction Motor Factor 20.66 1 0 0
MPD Motor Factor 20.90 1 0 0
AP Andover
Competitor Details ECP Data Survey Responses
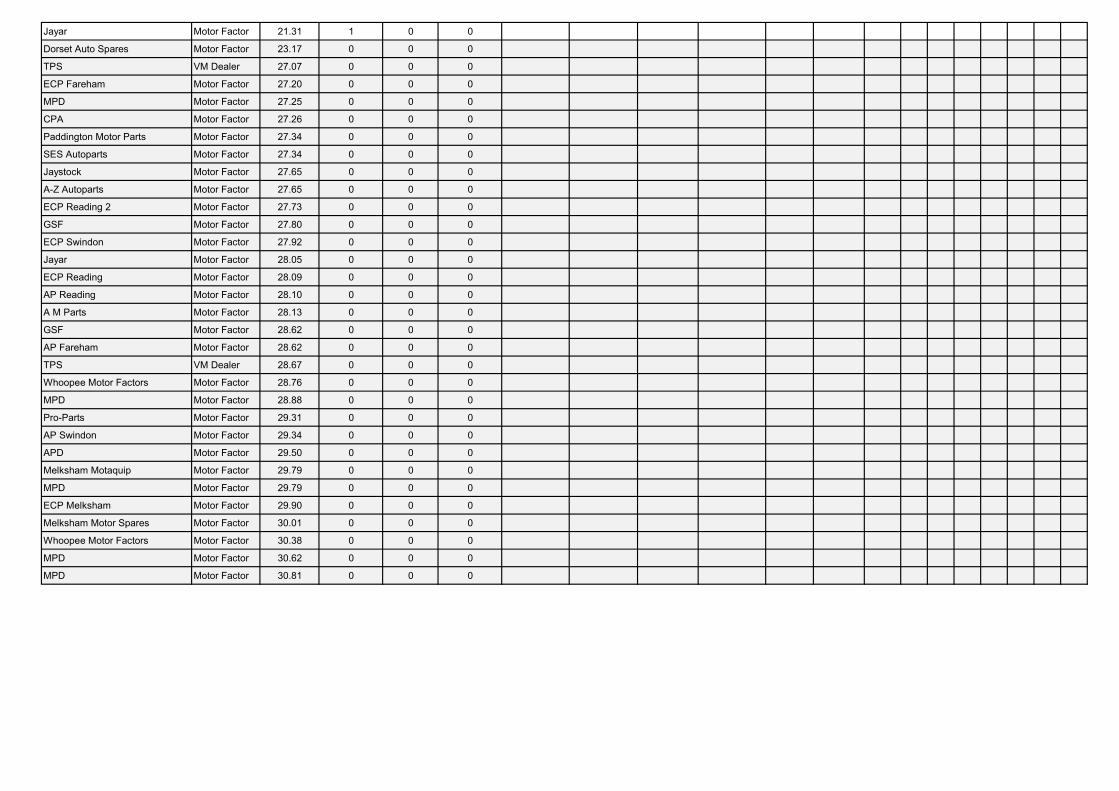
Jayar Motor Factor 21.31 1 0 0
Dorset Auto Spares Motor Factor 23.17 0 0 0
TPS VM Dealer 27.07 0 0 0
ECP Fareham Motor Factor 27.20 0 0 0
MPD Motor Factor 27.25 0 0 0
CPA Motor Factor 27.26 0 0 0
Paddington Motor Parts Motor Factor 27.34 0 0 0
SES Autoparts Motor Factor 27.34 0 0 0
Jaystock Motor Factor 27.65 0 0 0
A-Z Autoparts Motor Factor 27.65 0 0 0
ECP Reading 2 Motor Factor 27.73 0 0 0
GSF Motor Factor 27.80 0 0 0
ECP Swindon Motor Factor 27.92 0 0 0
Jayar Motor Factor 28.05 0 0 0
ECP Reading Motor Factor 28.09 0 0 0
AP Reading Motor Factor 28.10 0 0 0
A M Parts Motor Factor 28.13 0 0 0
GSF Motor Factor 28.62 0 0 0
AP Fareham Motor Factor 28.62 0 0 0
TPS VM Dealer 28.67 0 0 0
Whoopee Motor Factors Motor Factor 28.76 0 0 0
MPD Motor Factor 28.88 0 0 0
Pro-Parts Motor Factor 29.31 0 0 0
AP Swindon Motor Factor 29.34 0 0 0
APD Motor Factor 29.50 0 0 0
Melksham Motaquip Motor Factor 29.79 0 0 0
MPD Motor Factor 29.79 0 0 0
ECP Melksham Motor Factor 29.90 0 0 0
Melksham Motor Spares Motor Factor 30.01 0 0 0
Whoopee Motor Factors Motor Factor 30.38 0 0 0
MPD Motor Factor 30.62 0 0 0
MPD Motor Factor 30.81 0 0 0
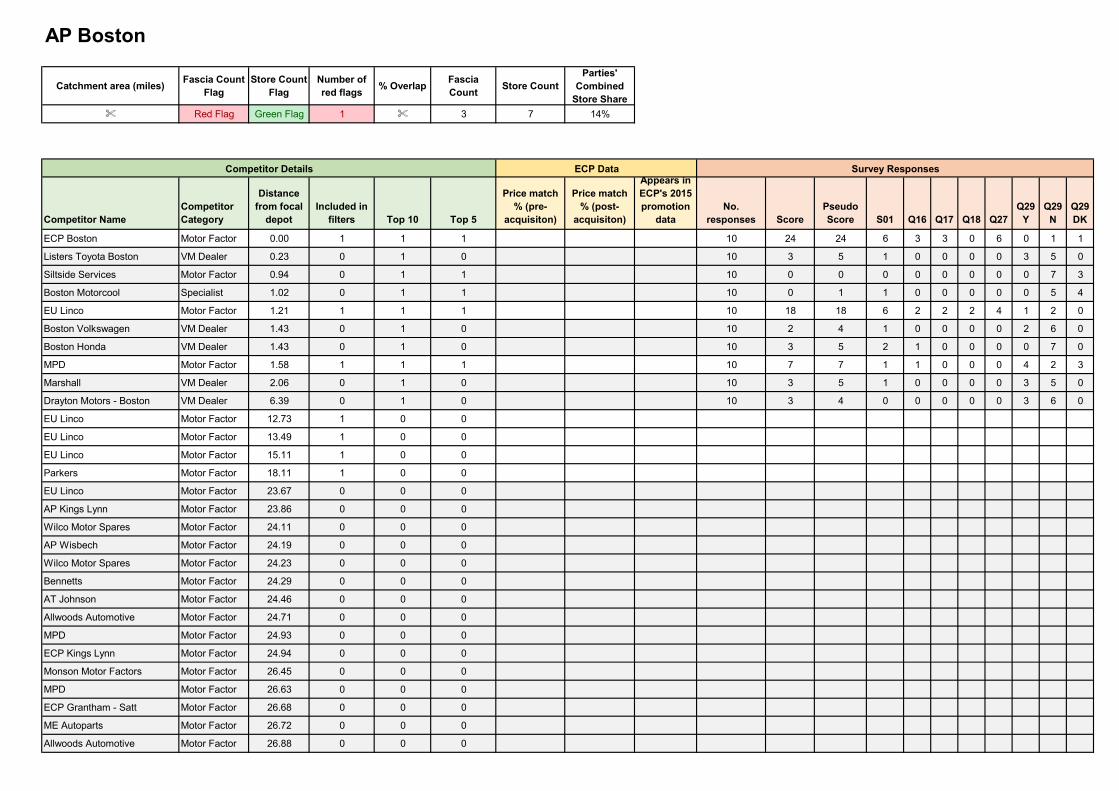
Catchment area (miles)Fascia Count
FlagStore Count
FlagNumber of red flags
% OverlapFascia Count
Store CountParties'
Combined Store Share
% Red Flag Green Flag 1 % 3 7 14%
Competitor NameCompetitor Category
Distance from focal
depotIncluded in
filters Top 10 Top 5
Price match % (pre-
acquisiton)
Price match % (post-
acquisiton)
Appears in ECP's 2015 promotion
dataNo.
responses ScorePseudo Score S01 Q16 Q17 Q18 Q27
Q29 Y
Q29 N
Q29 DK
ECP Boston Motor Factor 0.00 1 1 1 10 24 24 6 3 3 0 6 0 1 1
Listers Toyota Boston VM Dealer 0.23 0 1 0 10 3 5 1 0 0 0 0 3 5 0
Siltside Services Motor Factor 0.94 0 1 1 10 0 0 0 0 0 0 0 0 7 3
Boston Motorcool Specialist 1.02 0 1 1 10 0 1 1 0 0 0 0 0 5 4
EU Linco Motor Factor 1.21 1 1 1 10 18 18 6 2 2 2 4 1 2 0
Boston Volkswagen VM Dealer 1.43 0 1 0 10 2 4 1 0 0 0 0 2 6 0
Boston Honda VM Dealer 1.43 0 1 0 10 3 5 2 1 0 0 0 0 7 0
MPD Motor Factor 1.58 1 1 1 10 7 7 1 1 0 0 0 4 2 3
Marshall VM Dealer 2.06 0 1 0 10 3 5 1 0 0 0 0 3 5 0
Drayton Motors - Boston VM Dealer 6.39 0 1 0 10 3 4 0 0 0 0 0 3 6 0
EU Linco Motor Factor 12.73 1 0 0
EU Linco Motor Factor 13.49 1 0 0
EU Linco Motor Factor 15.11 1 0 0
Parkers Motor Factor 18.11 1 0 0
EU Linco Motor Factor 23.67 0 0 0
AP Kings Lynn Motor Factor 23.86 0 0 0
Wilco Motor Spares Motor Factor 24.11 0 0 0
AP Wisbech Motor Factor 24.19 0 0 0
Wilco Motor Spares Motor Factor 24.23 0 0 0
Bennetts Motor Factor 24.29 0 0 0
AT Johnson Motor Factor 24.46 0 0 0
Allwoods Automotive Motor Factor 24.71 0 0 0
MPD Motor Factor 24.93 0 0 0
ECP Kings Lynn Motor Factor 24.94 0 0 0
Monson Motor Factors Motor Factor 26.45 0 0 0
MPD Motor Factor 26.63 0 0 0
ECP Grantham - Satt Motor Factor 26.68 0 0 0
ME Autoparts Motor Factor 26.72 0 0 0
Allwoods Automotive Motor Factor 26.88 0 0 0
AP Boston
Competitor Details ECP Data Survey Responses
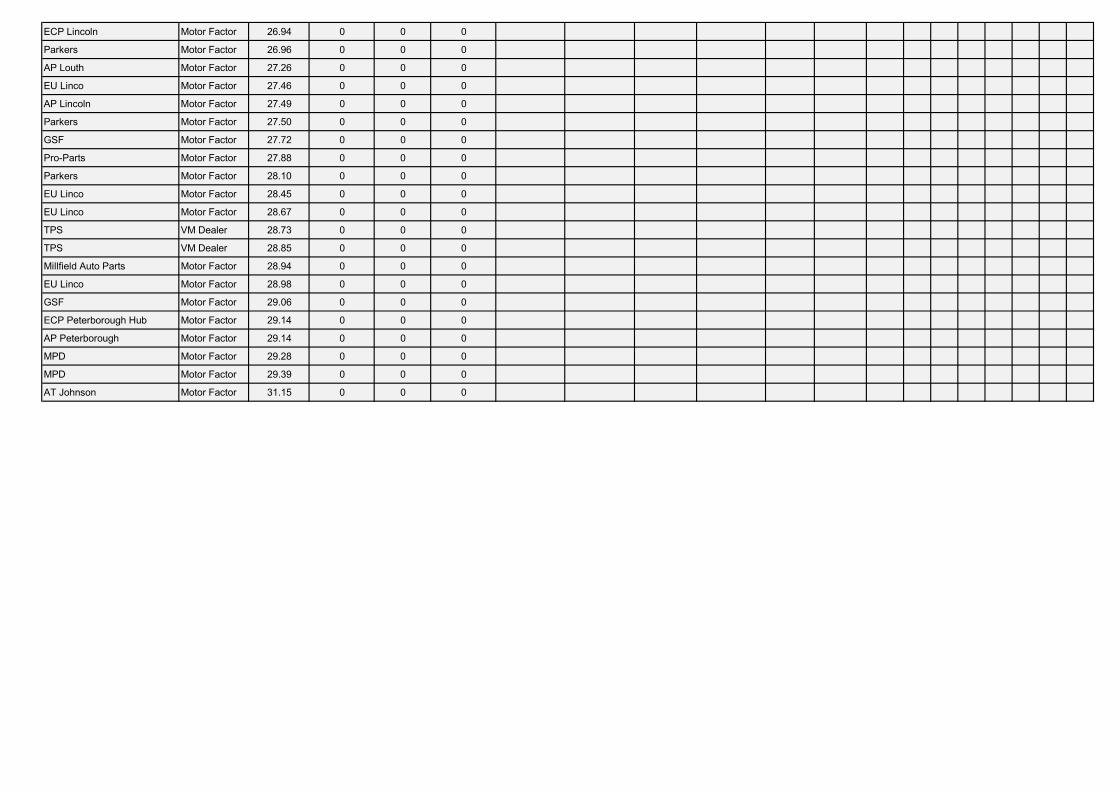
ECP Lincoln Motor Factor 26.94 0 0 0
Parkers Motor Factor 26.96 0 0 0
AP Louth Motor Factor 27.26 0 0 0
EU Linco Motor Factor 27.46 0 0 0
AP Lincoln Motor Factor 27.49 0 0 0
Parkers Motor Factor 27.50 0 0 0
GSF Motor Factor 27.72 0 0 0
Pro-Parts Motor Factor 27.88 0 0 0
Parkers Motor Factor 28.10 0 0 0
EU Linco Motor Factor 28.45 0 0 0
EU Linco Motor Factor 28.67 0 0 0
TPS VM Dealer 28.73 0 0 0
TPS VM Dealer 28.85 0 0 0
Millfield Auto Parts Motor Factor 28.94 0 0 0
EU Linco Motor Factor 28.98 0 0 0
GSF Motor Factor 29.06 0 0 0
ECP Peterborough Hub Motor Factor 29.14 0 0 0
AP Peterborough Motor Factor 29.14 0 0 0
MPD Motor Factor 29.28 0 0 0
MPD Motor Factor 29.39 0 0 0
AT Johnson Motor Factor 31.15 0 0 0
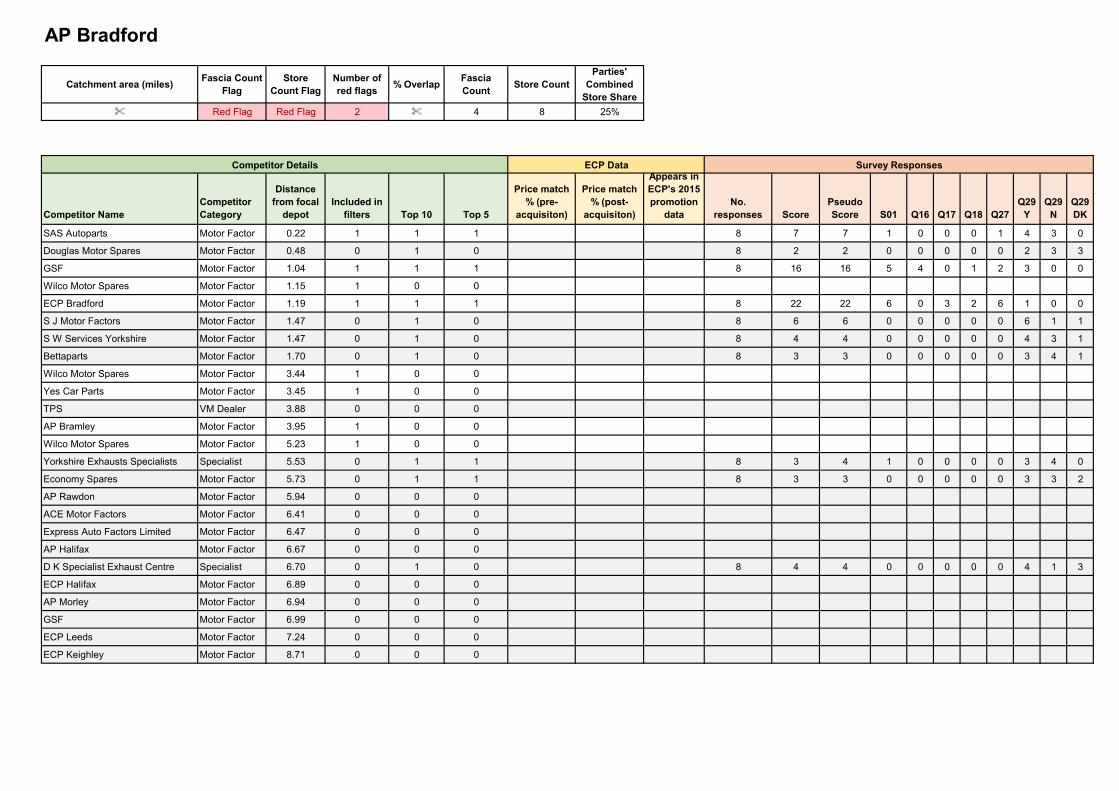
Catchment area (miles)Fascia Count
FlagStore
Count FlagNumber of red flags
% OverlapFascia Count
Store CountParties'
Combined Store Share
% Red Flag Red Flag 2 % 4 8 25%
Competitor NameCompetitor Category
Distance from focal
depotIncluded in
filters Top 10 Top 5
Price match % (pre-
acquisiton)
Price match % (post-
acquisiton)
Appears in ECP's 2015 promotion
dataNo.
responses ScorePseudo Score S01 Q16 Q17 Q18 Q27
Q29 Y
Q29 N
Q29 DK
SAS Autoparts Motor Factor 0.22 1 1 1 8 7 7 1 0 0 0 1 4 3 0
Douglas Motor Spares Motor Factor 0.48 0 1 0 8 2 2 0 0 0 0 0 2 3 3
GSF Motor Factor 1.04 1 1 1 8 16 16 5 4 0 1 2 3 0 0
Wilco Motor Spares Motor Factor 1.15 1 0 0
ECP Bradford Motor Factor 1.19 1 1 1 8 22 22 6 0 3 2 6 1 0 0
S J Motor Factors Motor Factor 1.47 0 1 0 8 6 6 0 0 0 0 0 6 1 1
S W Services Yorkshire Motor Factor 1.47 0 1 0 8 4 4 0 0 0 0 0 4 3 1
Bettaparts Motor Factor 1.70 0 1 0 8 3 3 0 0 0 0 0 3 4 1
Wilco Motor Spares Motor Factor 3.44 1 0 0
Yes Car Parts Motor Factor 3.45 1 0 0
TPS VM Dealer 3.88 0 0 0
AP Bramley Motor Factor 3.95 1 0 0
Wilco Motor Spares Motor Factor 5.23 1 0 0
Yorkshire Exhausts Specialists Specialist 5.53 0 1 1 8 3 4 1 0 0 0 0 3 4 0
Economy Spares Motor Factor 5.73 0 1 1 8 3 3 0 0 0 0 0 3 3 2
AP Rawdon Motor Factor 5.94 0 0 0
ACE Motor Factors Motor Factor 6.41 0 0 0
Express Auto Factors Limited Motor Factor 6.47 0 0 0
AP Halifax Motor Factor 6.67 0 0 0
D K Specialist Exhaust Centre Specialist 6.70 0 1 0 8 4 4 0 0 0 0 0 4 1 3
ECP Halifax Motor Factor 6.89 0 0 0
AP Morley Motor Factor 6.94 0 0 0
GSF Motor Factor 6.99 0 0 0
ECP Leeds Motor Factor 7.24 0 0 0
ECP Keighley Motor Factor 8.71 0 0 0
AP Bradford
Competitor Details ECP Data Survey Responses
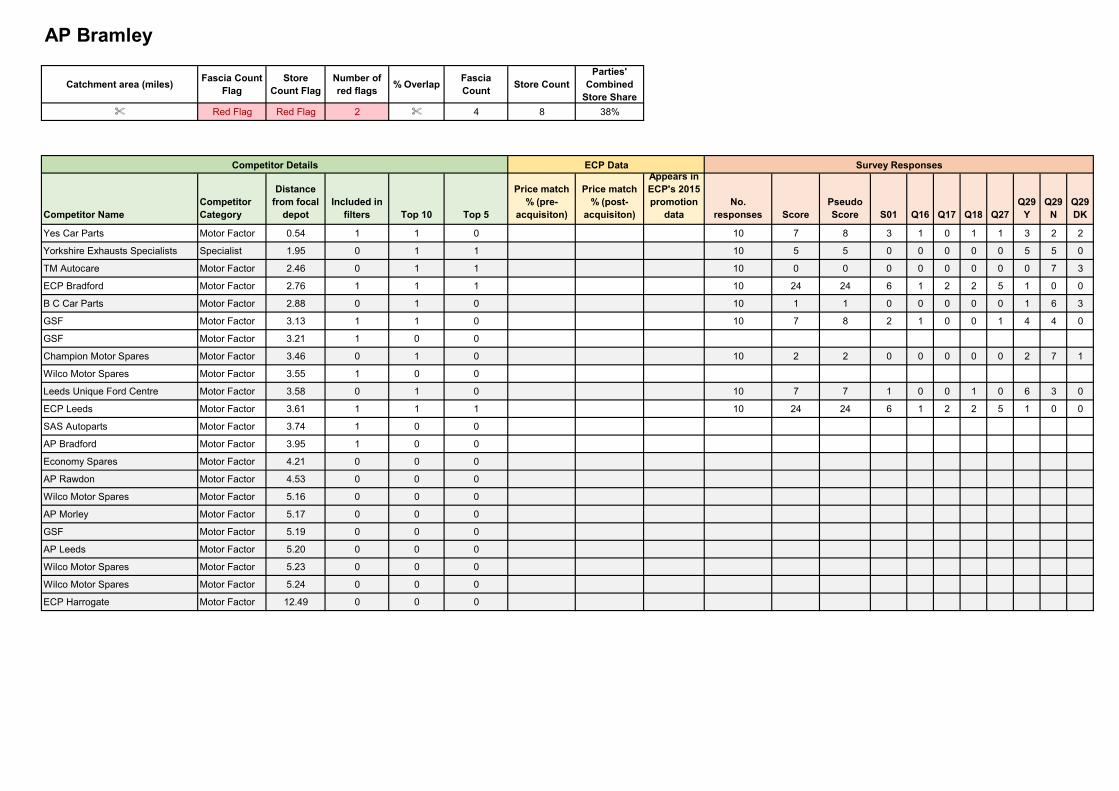
Catchment area (miles)Fascia Count
FlagStore
Count FlagNumber of red flags
% OverlapFascia Count
Store CountParties'
Combined Store Share
% Red Flag Red Flag 2 % 4 8 38%
Competitor NameCompetitor Category
Distance from focal
depotIncluded in
filters Top 10 Top 5
Price match % (pre-
acquisiton)
Price match % (post-
acquisiton)
Appears in ECP's 2015 promotion
dataNo.
responses ScorePseudo Score S01 Q16 Q17 Q18 Q27
Q29 Y
Q29 N
Q29 DK
Yes Car Parts Motor Factor 0.54 1 1 0 10 7 8 3 1 0 1 1 3 2 2
Yorkshire Exhausts Specialists Specialist 1.95 0 1 1 10 5 5 0 0 0 0 0 5 5 0
TM Autocare Motor Factor 2.46 0 1 1 10 0 0 0 0 0 0 0 0 7 3
ECP Bradford Motor Factor 2.76 1 1 1 10 24 24 6 1 2 2 5 1 0 0
B C Car Parts Motor Factor 2.88 0 1 0 10 1 1 0 0 0 0 0 1 6 3
GSF Motor Factor 3.13 1 1 0 10 7 8 2 1 0 0 1 4 4 0
GSF Motor Factor 3.21 1 0 0
Champion Motor Spares Motor Factor 3.46 0 1 0 10 2 2 0 0 0 0 0 2 7 1
Wilco Motor Spares Motor Factor 3.55 1 0 0
Leeds Unique Ford Centre Motor Factor 3.58 0 1 0 10 7 7 1 0 0 1 0 6 3 0
ECP Leeds Motor Factor 3.61 1 1 1 10 24 24 6 1 2 2 5 1 0 0
SAS Autoparts Motor Factor 3.74 1 0 0
AP Bradford Motor Factor 3.95 1 0 0
Economy Spares Motor Factor 4.21 0 0 0
AP Rawdon Motor Factor 4.53 0 0 0
Wilco Motor Spares Motor Factor 5.16 0 0 0
AP Morley Motor Factor 5.17 0 0 0
GSF Motor Factor 5.19 0 0 0
AP Leeds Motor Factor 5.20 0 0 0
Wilco Motor Spares Motor Factor 5.23 0 0 0
Wilco Motor Spares Motor Factor 5.24 0 0 0
ECP Harrogate Motor Factor 12.49 0 0 0
AP Bramley
Competitor Details ECP Data Survey Responses
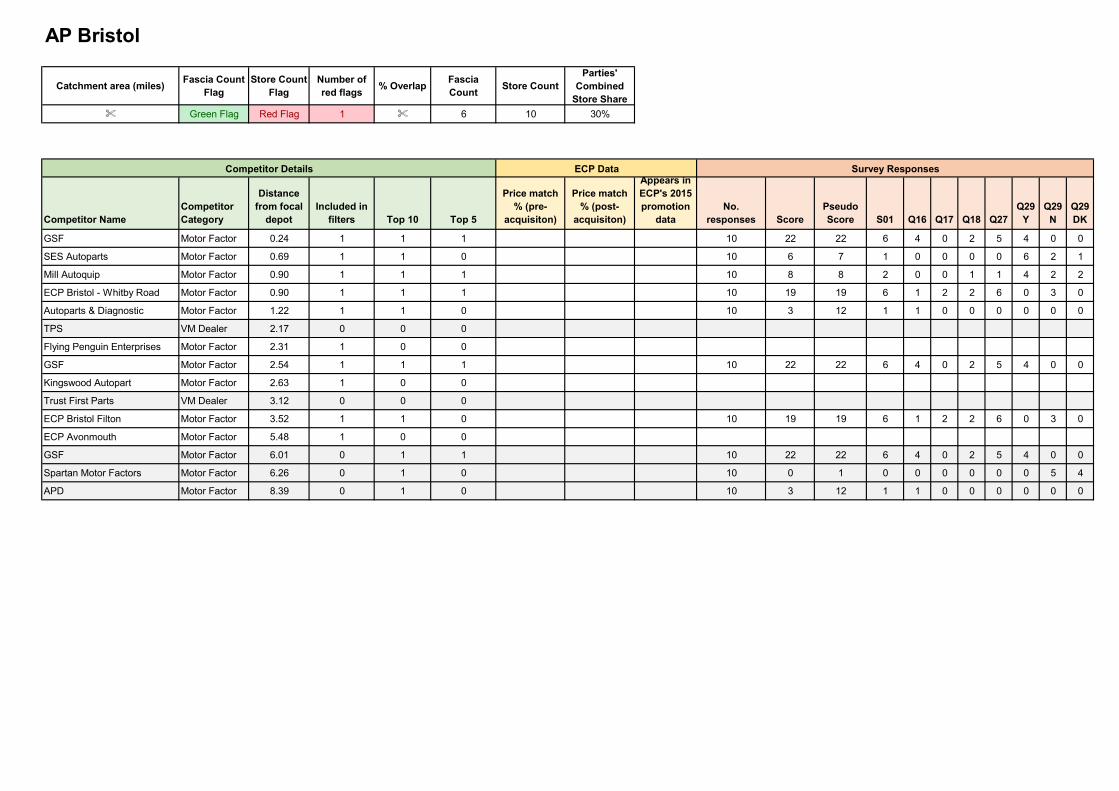
Catchment area (miles)Fascia Count
FlagStore Count
FlagNumber of red flags
% OverlapFascia Count
Store CountParties'
Combined Store Share
% Green Flag Red Flag 1 % 6 10 30%
Competitor NameCompetitor Category
Distance from focal
depotIncluded in
filters Top 10 Top 5
Price match % (pre-
acquisiton)
Price match % (post-
acquisiton)
Appears in ECP's 2015 promotion
dataNo.
responses ScorePseudo Score S01 Q16 Q17 Q18 Q27
Q29 Y
Q29 N
Q29 DK
GSF Motor Factor 0.24 1 1 1 10 22 22 6 4 0 2 5 4 0 0
SES Autoparts Motor Factor 0.69 1 1 0 10 6 7 1 0 0 0 0 6 2 1
Mill Autoquip Motor Factor 0.90 1 1 1 10 8 8 2 0 0 1 1 4 2 2
ECP Bristol - Whitby Road Motor Factor 0.90 1 1 1 10 19 19 6 1 2 2 6 0 3 0
Autoparts & Diagnostic Motor Factor 1.22 1 1 0 10 3 12 1 1 0 0 0 0 0 0
TPS VM Dealer 2.17 0 0 0
Flying Penguin Enterprises Motor Factor 2.31 1 0 0
GSF Motor Factor 2.54 1 1 1 10 22 22 6 4 0 2 5 4 0 0
Kingswood Autopart Motor Factor 2.63 1 0 0
Trust First Parts VM Dealer 3.12 0 0 0
ECP Bristol Filton Motor Factor 3.52 1 1 0 10 19 19 6 1 2 2 6 0 3 0
ECP Avonmouth Motor Factor 5.48 1 0 0
GSF Motor Factor 6.01 0 1 1 10 22 22 6 4 0 2 5 4 0 0
Spartan Motor Factors Motor Factor 6.26 0 1 0 10 0 1 0 0 0 0 0 0 5 4
APD Motor Factor 8.39 0 1 0 10 3 12 1 1 0 0 0 0 0 0
AP Bristol
Competitor Details ECP Data Survey Responses
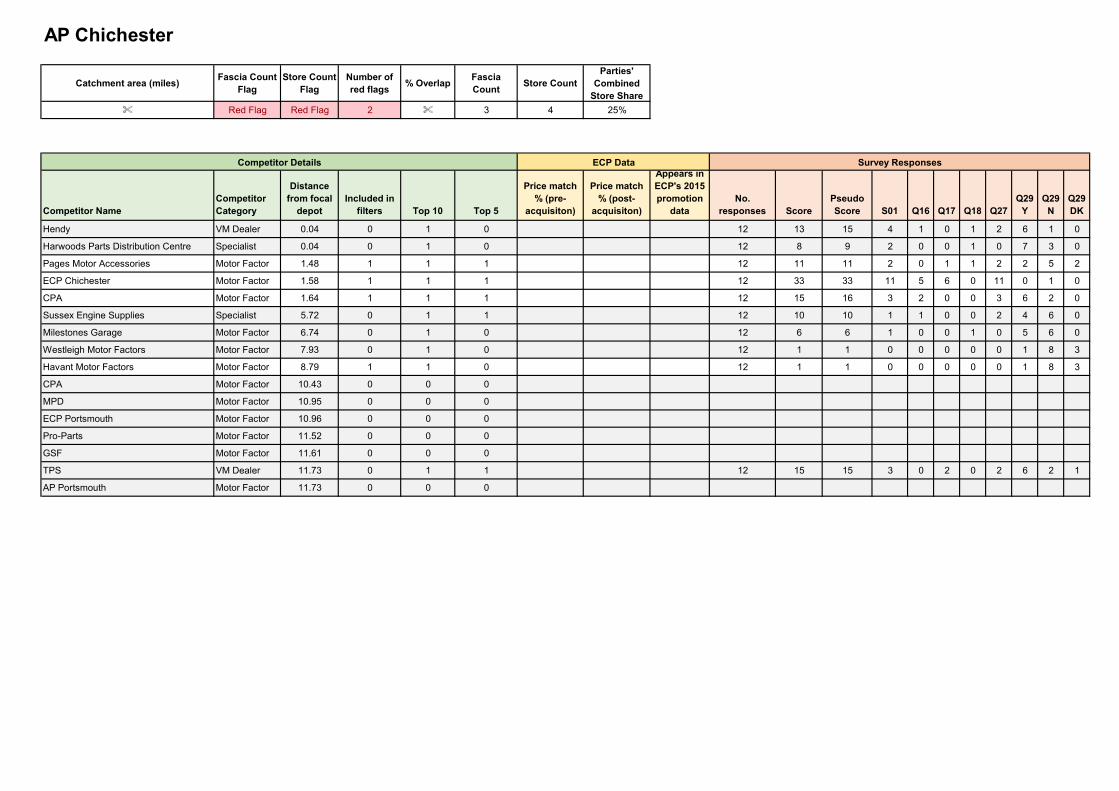
Catchment area (miles)Fascia Count
FlagStore Count
FlagNumber of red flags
% OverlapFascia Count
Store CountParties'
Combined Store Share
% Red Flag Red Flag 2 % 3 4 25%
Competitor NameCompetitor Category
Distance from focal
depotIncluded in
filters Top 10 Top 5
Price match % (pre-
acquisiton)
Price match % (post-
acquisiton)
Appears in ECP's 2015 promotion
dataNo.
responses ScorePseudo Score S01 Q16 Q17 Q18 Q27
Q29 Y
Q29 N
Q29 DK
Hendy VM Dealer 0.04 0 1 0 12 13 15 4 1 0 1 2 6 1 0
Harwoods Parts Distribution Centre Specialist 0.04 0 1 0 12 8 9 2 0 0 1 0 7 3 0
Pages Motor Accessories Motor Factor 1.48 1 1 1 12 11 11 2 0 1 1 2 2 5 2
ECP Chichester Motor Factor 1.58 1 1 1 12 33 33 11 5 6 0 11 0 1 0
CPA Motor Factor 1.64 1 1 1 12 15 16 3 2 0 0 3 6 2 0
Sussex Engine Supplies Specialist 5.72 0 1 1 12 10 10 1 1 0 0 2 4 6 0
Milestones Garage Motor Factor 6.74 0 1 0 12 6 6 1 0 0 1 0 5 6 0
Westleigh Motor Factors Motor Factor 7.93 0 1 0 12 1 1 0 0 0 0 0 1 8 3
Havant Motor Factors Motor Factor 8.79 1 1 0 12 1 1 0 0 0 0 0 1 8 3
CPA Motor Factor 10.43 0 0 0
MPD Motor Factor 10.95 0 0 0
ECP Portsmouth Motor Factor 10.96 0 0 0
Pro-Parts Motor Factor 11.52 0 0 0
GSF Motor Factor 11.61 0 0 0
TPS VM Dealer 11.73 0 1 1 12 15 15 3 0 2 0 2 6 2 1
AP Portsmouth Motor Factor 11.73 0 0 0
AP Chichester
Competitor Details ECP Data Survey Responses
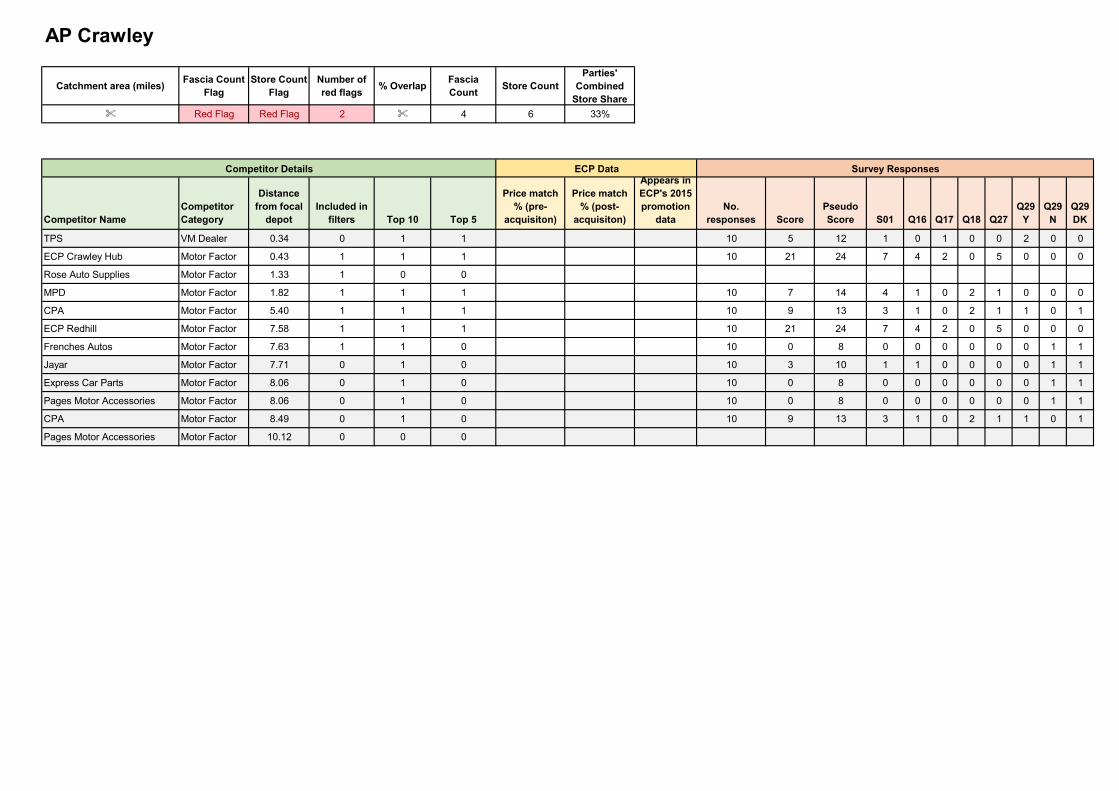
Catchment area (miles)Fascia Count
FlagStore Count
FlagNumber of red flags
% OverlapFascia Count
Store CountParties'
Combined Store Share
% Red Flag Red Flag 2 % 4 6 33%
Competitor NameCompetitor Category
Distance from focal
depotIncluded in
filters Top 10 Top 5
Price match % (pre-
acquisiton)
Price match % (post-
acquisiton)
Appears in ECP's 2015 promotion
dataNo.
responses ScorePseudo Score S01 Q16 Q17 Q18 Q27
Q29 Y
Q29 N
Q29 DK
TPS VM Dealer 0.34 0 1 1 10 5 12 1 0 1 0 0 2 0 0
ECP Crawley Hub Motor Factor 0.43 1 1 1 10 21 24 7 4 2 0 5 0 0 0
Rose Auto Supplies Motor Factor 1.33 1 0 0
MPD Motor Factor 1.82 1 1 1 10 7 14 4 1 0 2 1 0 0 0
CPA Motor Factor 5.40 1 1 1 10 9 13 3 1 0 2 1 1 0 1
ECP Redhill Motor Factor 7.58 1 1 1 10 21 24 7 4 2 0 5 0 0 0
Frenches Autos Motor Factor 7.63 1 1 0 10 0 8 0 0 0 0 0 0 1 1
Jayar Motor Factor 7.71 0 1 0 10 3 10 1 1 0 0 0 0 1 1
Express Car Parts Motor Factor 8.06 0 1 0 10 0 8 0 0 0 0 0 0 1 1
Pages Motor Accessories Motor Factor 8.06 0 1 0 10 0 8 0 0 0 0 0 0 1 1
CPA Motor Factor 8.49 0 1 0 10 9 13 3 1 0 2 1 1 0 1
Pages Motor Accessories Motor Factor 10.12 0 0 0
AP Crawley
Competitor Details ECP Data Survey Responses
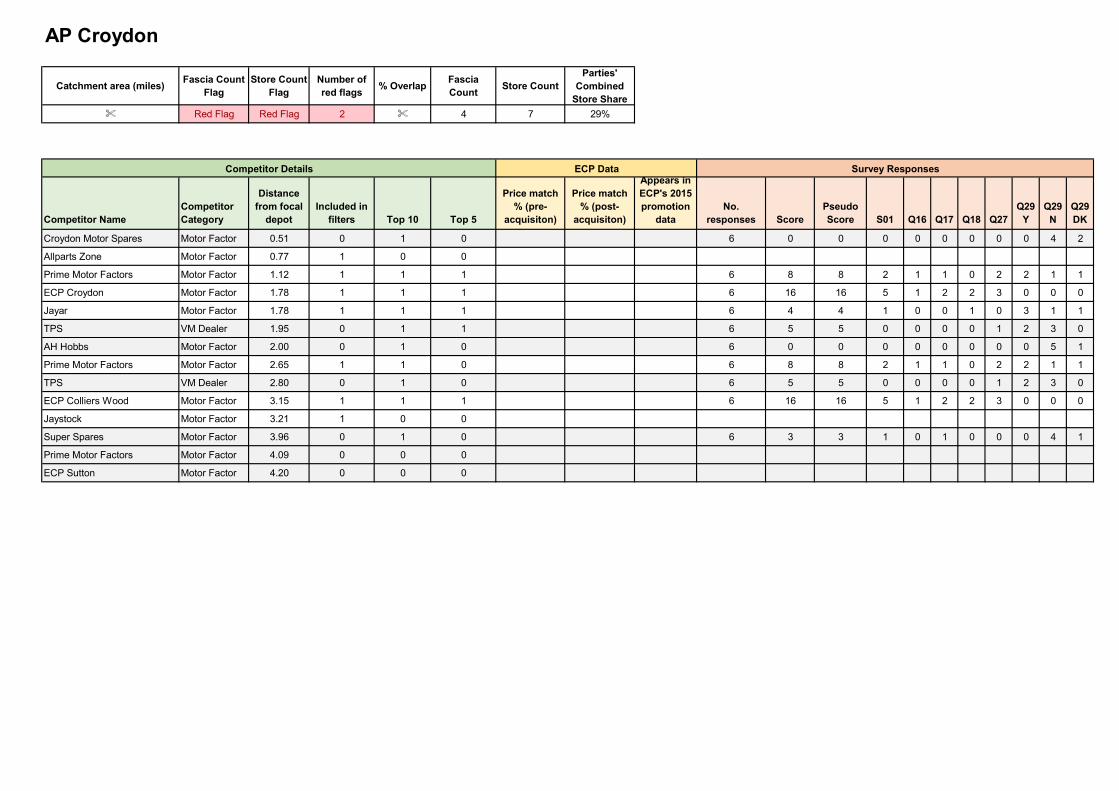
Catchment area (miles)Fascia Count
FlagStore Count
FlagNumber of red flags
% OverlapFascia Count
Store CountParties'
Combined Store Share
% Red Flag Red Flag 2 % 4 7 29%
Competitor NameCompetitor Category
Distance from focal
depotIncluded in
filters Top 10 Top 5
Price match % (pre-
acquisiton)
Price match % (post-
acquisiton)
Appears in ECP's 2015 promotion
dataNo.
responses ScorePseudo Score S01 Q16 Q17 Q18 Q27
Q29 Y
Q29 N
Q29 DK
Croydon Motor Spares Motor Factor 0.51 0 1 0 6 0 0 0 0 0 0 0 0 4 2
Allparts Zone Motor Factor 0.77 1 0 0
Prime Motor Factors Motor Factor 1.12 1 1 1 6 8 8 2 1 1 0 2 2 1 1
ECP Croydon Motor Factor 1.78 1 1 1 6 16 16 5 1 2 2 3 0 0 0
Jayar Motor Factor 1.78 1 1 1 6 4 4 1 0 0 1 0 3 1 1
TPS VM Dealer 1.95 0 1 1 6 5 5 0 0 0 0 1 2 3 0
AH Hobbs Motor Factor 2.00 0 1 0 6 0 0 0 0 0 0 0 0 5 1
Prime Motor Factors Motor Factor 2.65 1 1 0 6 8 8 2 1 1 0 2 2 1 1
TPS VM Dealer 2.80 0 1 0 6 5 5 0 0 0 0 1 2 3 0
ECP Colliers Wood Motor Factor 3.15 1 1 1 6 16 16 5 1 2 2 3 0 0 0
Jaystock Motor Factor 3.21 1 0 0
Super Spares Motor Factor 3.96 0 1 0 6 3 3 1 0 1 0 0 0 4 1
Prime Motor Factors Motor Factor 4.09 0 0 0
ECP Sutton Motor Factor 4.20 0 0 0
AP Croydon
Competitor Details ECP Data Survey Responses
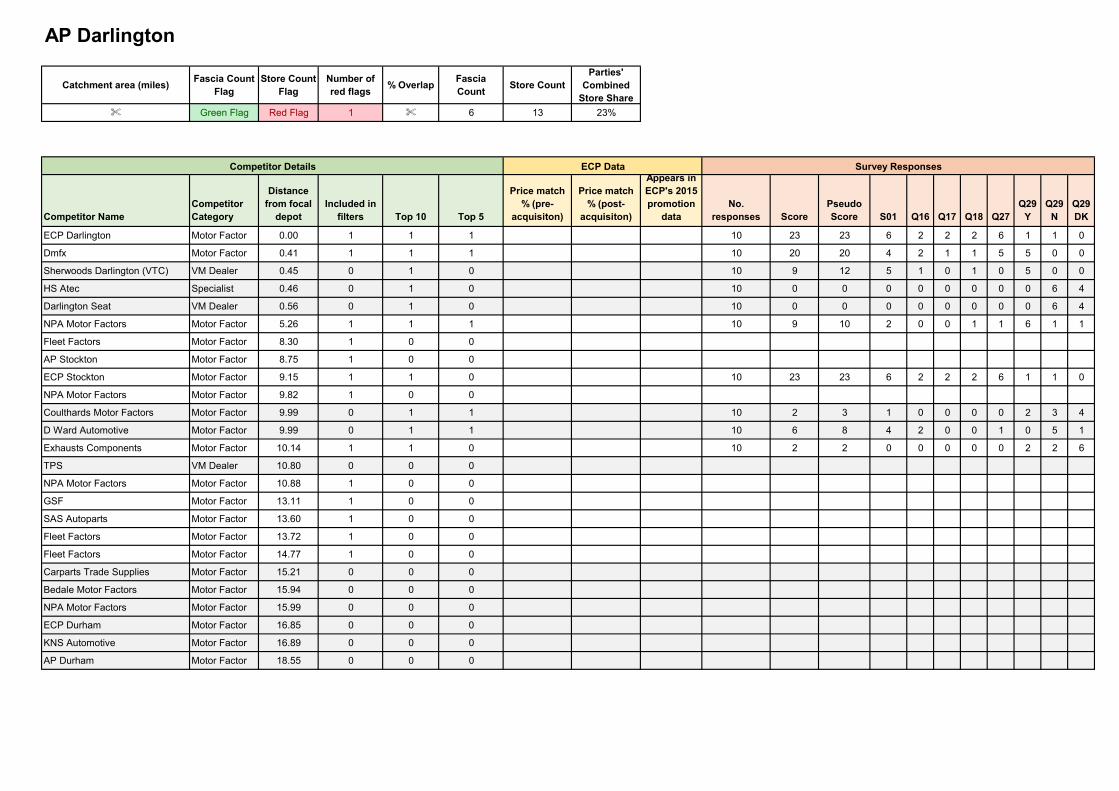
Catchment area (miles)Fascia Count
FlagStore Count
FlagNumber of red flags
% OverlapFascia Count
Store CountParties'
Combined Store Share
% Green Flag Red Flag 1 % 6 13 23%
Competitor NameCompetitor Category
Distance from focal
depotIncluded in
filters Top 10 Top 5
Price match % (pre-
acquisiton)
Price match % (post-
acquisiton)
Appears in ECP's 2015 promotion
dataNo.
responses ScorePseudo Score S01 Q16 Q17 Q18 Q27
Q29 Y
Q29 N
Q29 DK
ECP Darlington Motor Factor 0.00 1 1 1 10 23 23 6 2 2 2 6 1 1 0
Dmfx Motor Factor 0.41 1 1 1 10 20 20 4 2 1 1 5 5 0 0
Sherwoods Darlington (VTC) VM Dealer 0.45 0 1 0 10 9 12 5 1 0 1 0 5 0 0
HS Atec Specialist 0.46 0 1 0 10 0 0 0 0 0 0 0 0 6 4
Darlington Seat VM Dealer 0.56 0 1 0 10 0 0 0 0 0 0 0 0 6 4
NPA Motor Factors Motor Factor 5.26 1 1 1 10 9 10 2 0 0 1 1 6 1 1
Fleet Factors Motor Factor 8.30 1 0 0
AP Stockton Motor Factor 8.75 1 0 0
ECP Stockton Motor Factor 9.15 1 1 0 10 23 23 6 2 2 2 6 1 1 0
NPA Motor Factors Motor Factor 9.82 1 0 0
Coulthards Motor Factors Motor Factor 9.99 0 1 1 10 2 3 1 0 0 0 0 2 3 4
D Ward Automotive Motor Factor 9.99 0 1 1 10 6 8 4 2 0 0 1 0 5 1
Exhausts Components Motor Factor 10.14 1 1 0 10 2 2 0 0 0 0 0 2 2 6
TPS VM Dealer 10.80 0 0 0
NPA Motor Factors Motor Factor 10.88 1 0 0
GSF Motor Factor 13.11 1 0 0
SAS Autoparts Motor Factor 13.60 1 0 0
Fleet Factors Motor Factor 13.72 1 0 0
Fleet Factors Motor Factor 14.77 1 0 0
Carparts Trade Supplies Motor Factor 15.21 0 0 0
Bedale Motor Factors Motor Factor 15.94 0 0 0
NPA Motor Factors Motor Factor 15.99 0 0 0
ECP Durham Motor Factor 16.85 0 0 0
KNS Automotive Motor Factor 16.89 0 0 0
AP Durham Motor Factor 18.55 0 0 0
AP Darlington
Competitor Details ECP Data Survey Responses
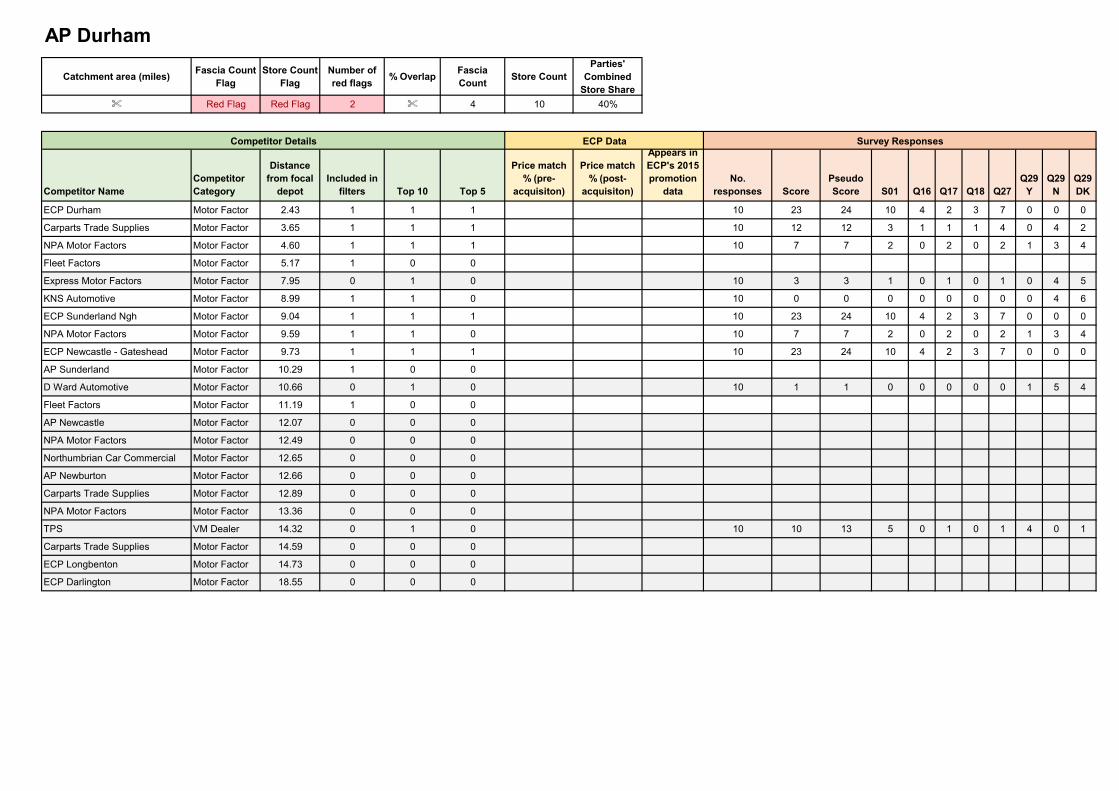
Catchment area (miles)Fascia Count
FlagStore Count
FlagNumber of red flags
% OverlapFascia Count
Store CountParties'
Combined Store Share
% Red Flag Red Flag 2 % 4 10 40%
Competitor NameCompetitor Category
Distance from focal
depotIncluded in
filters Top 10 Top 5
Price match % (pre-
acquisiton)
Price match % (post-
acquisiton)
Appears in ECP's 2015 promotion
dataNo.
responses ScorePseudo Score S01 Q16 Q17 Q18 Q27
Q29 Y
Q29 N
Q29 DK
ECP Durham Motor Factor 2.43 1 1 1 10 23 24 10 4 2 3 7 0 0 0
Carparts Trade Supplies Motor Factor 3.65 1 1 1 10 12 12 3 1 1 1 4 0 4 2
NPA Motor Factors Motor Factor 4.60 1 1 1 10 7 7 2 0 2 0 2 1 3 4
Fleet Factors Motor Factor 5.17 1 0 0
Express Motor Factors Motor Factor 7.95 0 1 0 10 3 3 1 0 1 0 1 0 4 5
KNS Automotive Motor Factor 8.99 1 1 0 10 0 0 0 0 0 0 0 0 4 6
ECP Sunderland Ngh Motor Factor 9.04 1 1 1 10 23 24 10 4 2 3 7 0 0 0
NPA Motor Factors Motor Factor 9.59 1 1 0 10 7 7 2 0 2 0 2 1 3 4
ECP Newcastle - Gateshead Motor Factor 9.73 1 1 1 10 23 24 10 4 2 3 7 0 0 0
AP Sunderland Motor Factor 10.29 1 0 0
D Ward Automotive Motor Factor 10.66 0 1 0 10 1 1 0 0 0 0 0 1 5 4
Fleet Factors Motor Factor 11.19 1 0 0
AP Newcastle Motor Factor 12.07 0 0 0
NPA Motor Factors Motor Factor 12.49 0 0 0
Northumbrian Car Commercial Motor Factor 12.65 0 0 0
AP Newburton Motor Factor 12.66 0 0 0
Carparts Trade Supplies Motor Factor 12.89 0 0 0
NPA Motor Factors Motor Factor 13.36 0 0 0
TPS VM Dealer 14.32 0 1 0 10 10 13 5 0 1 0 1 4 0 1
Carparts Trade Supplies Motor Factor 14.59 0 0 0
ECP Longbenton Motor Factor 14.73 0 0 0
ECP Darlington Motor Factor 18.55 0 0 0
AP Durham
Competitor Details ECP Data Survey Responses
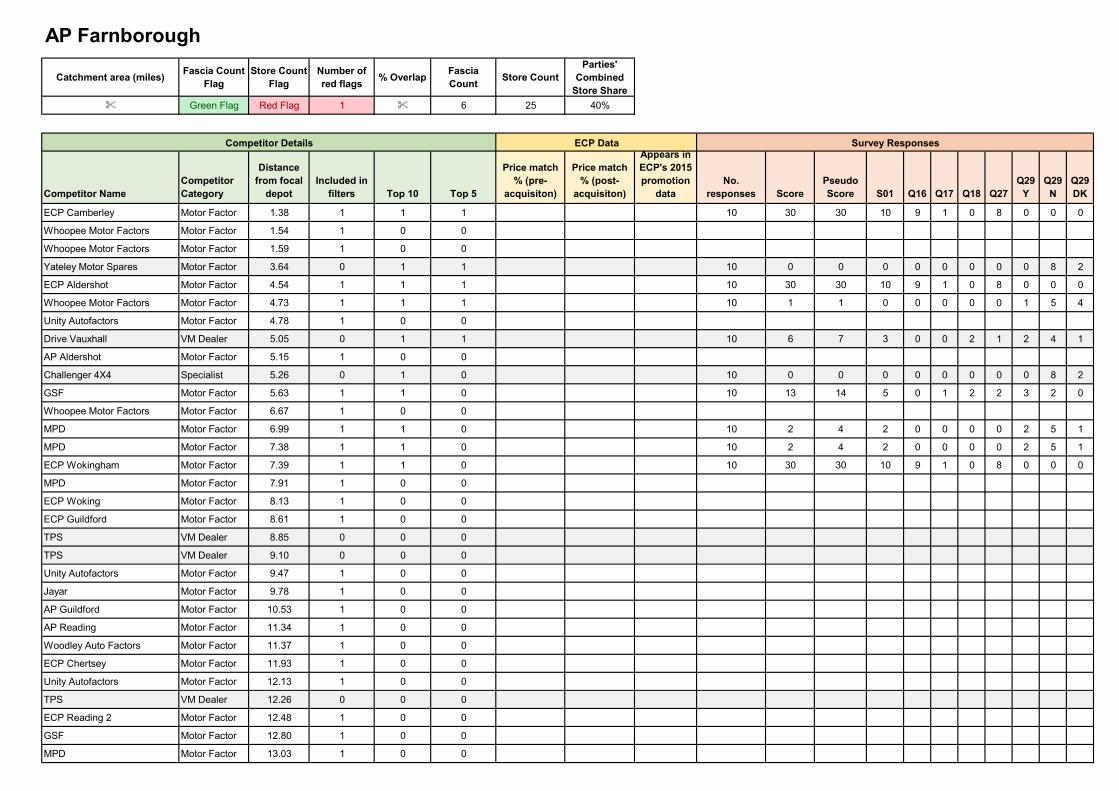
Catchment area (miles)Fascia Count
FlagStore Count
FlagNumber of red flags
% OverlapFascia Count
Store CountParties'
Combined Store Share
% Green Flag Red Flag 1 % 6 25 40%
Competitor NameCompetitor Category
Distance from focal
depotIncluded in
filters Top 10 Top 5
Price match % (pre-
acquisiton)
Price match % (post-
acquisiton)
Appears in ECP's 2015 promotion
dataNo.
responses ScorePseudo Score S01 Q16 Q17 Q18 Q27
Q29 Y
Q29 N
Q29 DK
ECP Camberley Motor Factor 1.38 1 1 1 10 30 30 10 9 1 0 8 0 0 0
Whoopee Motor Factors Motor Factor 1.54 1 0 0
Whoopee Motor Factors Motor Factor 1.59 1 0 0
Yateley Motor Spares Motor Factor 3.64 0 1 1 10 0 0 0 0 0 0 0 0 8 2
ECP Aldershot Motor Factor 4.54 1 1 1 10 30 30 10 9 1 0 8 0 0 0
Whoopee Motor Factors Motor Factor 4.73 1 1 1 10 1 1 0 0 0 0 0 1 5 4
Unity Autofactors Motor Factor 4.78 1 0 0
Drive Vauxhall VM Dealer 5.05 0 1 1 10 6 7 3 0 0 2 1 2 4 1
AP Aldershot Motor Factor 5.15 1 0 0
Challenger 4X4 Specialist 5.26 0 1 0 10 0 0 0 0 0 0 0 0 8 2
GSF Motor Factor 5.63 1 1 0 10 13 14 5 0 1 2 2 3 2 0
Whoopee Motor Factors Motor Factor 6.67 1 0 0
MPD Motor Factor 6.99 1 1 0 10 2 4 2 0 0 0 0 2 5 1
MPD Motor Factor 7.38 1 1 0 10 2 4 2 0 0 0 0 2 5 1
ECP Wokingham Motor Factor 7.39 1 1 0 10 30 30 10 9 1 0 8 0 0 0
MPD Motor Factor 7.91 1 0 0
ECP Woking Motor Factor 8.13 1 0 0
ECP Guildford Motor Factor 8.61 1 0 0
TPS VM Dealer 8.85 0 0 0
TPS VM Dealer 9.10 0 0 0
Unity Autofactors Motor Factor 9.47 1 0 0
Jayar Motor Factor 9.78 1 0 0
AP Guildford Motor Factor 10.53 1 0 0
AP Reading Motor Factor 11.34 1 0 0
Woodley Auto Factors Motor Factor 11.37 1 0 0
ECP Chertsey Motor Factor 11.93 1 0 0
Unity Autofactors Motor Factor 12.13 1 0 0
TPS VM Dealer 12.26 0 0 0
ECP Reading 2 Motor Factor 12.48 1 0 0
GSF Motor Factor 12.80 1 0 0
MPD Motor Factor 13.03 1 0 0
AP Farnborough
Competitor Details ECP Data Survey Responses
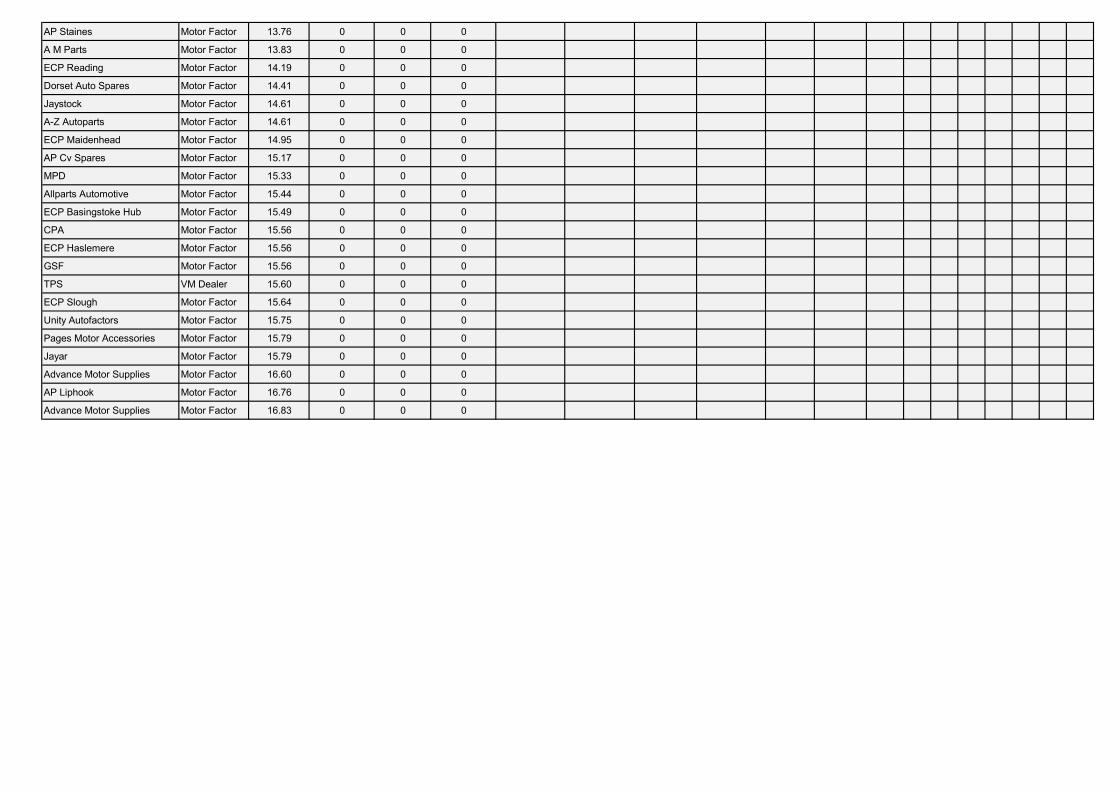
AP Staines Motor Factor 13.76 0 0 0
A M Parts Motor Factor 13.83 0 0 0
ECP Reading Motor Factor 14.19 0 0 0
Dorset Auto Spares Motor Factor 14.41 0 0 0
Jaystock Motor Factor 14.61 0 0 0
A-Z Autoparts Motor Factor 14.61 0 0 0
ECP Maidenhead Motor Factor 14.95 0 0 0
AP Cv Spares Motor Factor 15.17 0 0 0
MPD Motor Factor 15.33 0 0 0
Allparts Automotive Motor Factor 15.44 0 0 0
ECP Basingstoke Hub Motor Factor 15.49 0 0 0
CPA Motor Factor 15.56 0 0 0
ECP Haslemere Motor Factor 15.56 0 0 0
GSF Motor Factor 15.56 0 0 0
TPS VM Dealer 15.60 0 0 0
ECP Slough Motor Factor 15.64 0 0 0
Unity Autofactors Motor Factor 15.75 0 0 0
Pages Motor Accessories Motor Factor 15.79 0 0 0
Jayar Motor Factor 15.79 0 0 0
Advance Motor Supplies Motor Factor 16.60 0 0 0
AP Liphook Motor Factor 16.76 0 0 0
Advance Motor Supplies Motor Factor 16.83 0 0 0

Catchment area (miles)Fascia Count
FlagStore Count
FlagNumber of red flags
% OverlapFascia Count
Store CountParties'
Combined Store Share
% Red Flag Red Flag 2 % 4 10 20%
Competitor NameCompetitor Category
Distance from focal
depotIncluded in
filters Top 10 Top 5
Price match % (pre-
acquisiton)
Price match % (post-
acquisiton)
Appears in ECP's 2015 promotion
dataNo.
responses ScorePseudo Score S01 Q16 Q17 Q18 Q27
Q29 Y
Q29 N
Q29 DK
GMF Motor Factors Motor Factor 0.87 1 1 1 12 21 23 9 3 2 1 6 0 2 1
Jaystock Motor Factor 2.66 1 0 0
TPS VM Dealer 2.69 0 1 0 12 12 14 5 0 1 2 0 7 0 0
GSF Motor Factor 3.03 1 1 1 12 23 25 10 1 0 5 7 0 1 0
Autoparts & Diagnostic Motor Factor 3.37 1 1 1 12 8 10 4 0 2 0 2 2 2 4
ECP Gloucester Motor Factor 3.44 1 1 1 12 21 22 8 4 3 0 5 0 3 1
GSF Motor Factor 5.15 1 1 0 12 23 25 10 1 0 5 7 0 1 0
Baylis Cheltenham VM Dealer 5.44 0 1 0 12 4 6 2 0 0 0 0 4 5 1
Autoparts & Diagnostic Motor Factor 5.69 1 1 0 12 8 10 4 0 2 0 2 2 2 4
ECP Cheltenham Motor Factor 5.76 1 1 1 12 21 22 8 4 3 0 5 0 3 1
GMF Motor Factors Motor Factor 5.88 1 1 0 12 21 23 9 3 2 1 6 0 2 1
Autoparts & Diagnostic Motor Factor 10.04 1 0 0
Autoparts & Diagnostic Motor Factor 15.46 0 0 0
Cotswold Motaquip Motor Factor 15.49 0 0 0
GMF Motor Factors Motor Factor 16.02 0 0 0
Autoparts & Diagnostic Motor Factor 18.01 0 0 0
GMF Motor Factors Motor Factor 18.16 0 0 0
HM Motor Factors Motor Factor 18.43 0 0 0
Leamoco Motor Factor 18.46 0 0 0
Bromsgrove Motor Factors Motor Factor 18.61 0 0 0
AP Gloucester
Competitor Details ECP Data Survey Responses
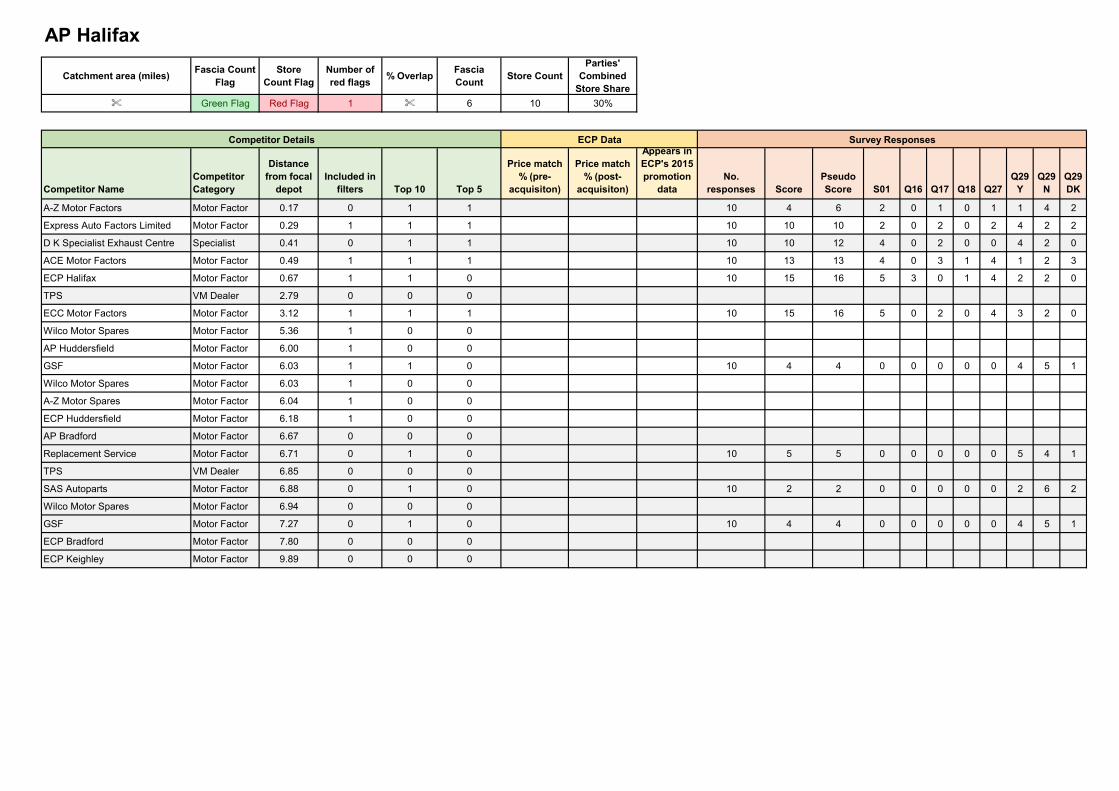
Catchment area (miles)Fascia Count
FlagStore
Count FlagNumber of red flags
% OverlapFascia Count
Store CountParties'
Combined Store Share
% Green Flag Red Flag 1 % 6 10 30%
Competitor NameCompetitor Category
Distance from focal
depotIncluded in
filters Top 10 Top 5
Price match % (pre-
acquisiton)
Price match % (post-
acquisiton)
Appears in ECP's 2015 promotion
dataNo.
responses ScorePseudo Score S01 Q16 Q17 Q18 Q27
Q29 Y
Q29 N
Q29 DK
A-Z Motor Factors Motor Factor 0.17 0 1 1 10 4 6 2 0 1 0 1 1 4 2
Express Auto Factors Limited Motor Factor 0.29 1 1 1 10 10 10 2 0 2 0 2 4 2 2
D K Specialist Exhaust Centre Specialist 0.41 0 1 1 10 10 12 4 0 2 0 0 4 2 0
ACE Motor Factors Motor Factor 0.49 1 1 1 10 13 13 4 0 3 1 4 1 2 3
ECP Halifax Motor Factor 0.67 1 1 0 10 15 16 5 3 0 1 4 2 2 0
TPS VM Dealer 2.79 0 0 0
ECC Motor Factors Motor Factor 3.12 1 1 1 10 15 16 5 0 2 0 4 3 2 0
Wilco Motor Spares Motor Factor 5.36 1 0 0
AP Huddersfield Motor Factor 6.00 1 0 0
GSF Motor Factor 6.03 1 1 0 10 4 4 0 0 0 0 0 4 5 1
Wilco Motor Spares Motor Factor 6.03 1 0 0
A-Z Motor Spares Motor Factor 6.04 1 0 0
ECP Huddersfield Motor Factor 6.18 1 0 0
AP Bradford Motor Factor 6.67 0 0 0
Replacement Service Motor Factor 6.71 0 1 0 10 5 5 0 0 0 0 0 5 4 1
TPS VM Dealer 6.85 0 0 0
SAS Autoparts Motor Factor 6.88 0 1 0 10 2 2 0 0 0 0 0 2 6 2
Wilco Motor Spares Motor Factor 6.94 0 0 0
GSF Motor Factor 7.27 0 1 0 10 4 4 0 0 0 0 0 4 5 1
ECP Bradford Motor Factor 7.80 0 0 0
ECP Keighley Motor Factor 9.89 0 0 0
AP Halifax
Competitor Details ECP Data Survey Responses
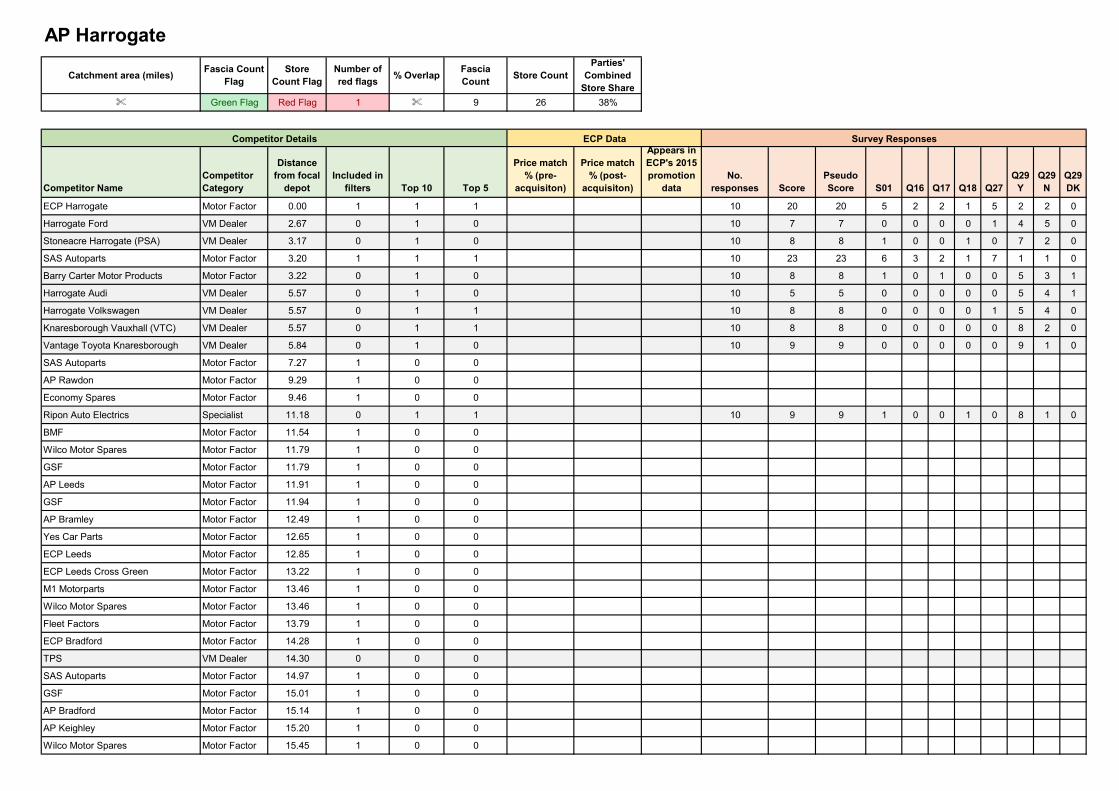
Catchment area (miles)Fascia Count
FlagStore
Count FlagNumber of red flags
% OverlapFascia Count
Store CountParties'
Combined Store Share
% Green Flag Red Flag 1 % 9 26 38%
Competitor NameCompetitor Category
Distance from focal
depotIncluded in
filters Top 10 Top 5
Price match % (pre-
acquisiton)
Price match % (post-
acquisiton)
Appears in ECP's 2015 promotion
dataNo.
responses ScorePseudo Score S01 Q16 Q17 Q18 Q27
Q29 Y
Q29 N
Q29 DK
ECP Harrogate Motor Factor 0.00 1 1 1 10 20 20 5 2 2 1 5 2 2 0
Harrogate Ford VM Dealer 2.67 0 1 0 10 7 7 0 0 0 0 1 4 5 0
Stoneacre Harrogate (PSA) VM Dealer 3.17 0 1 0 10 8 8 1 0 0 1 0 7 2 0
SAS Autoparts Motor Factor 3.20 1 1 1 10 23 23 6 3 2 1 7 1 1 0
Barry Carter Motor Products Motor Factor 3.22 0 1 0 10 8 8 1 0 1 0 0 5 3 1
Harrogate Audi VM Dealer 5.57 0 1 0 10 5 5 0 0 0 0 0 5 4 1
Harrogate Volkswagen VM Dealer 5.57 0 1 1 10 8 8 0 0 0 0 1 5 4 0
Knaresborough Vauxhall (VTC) VM Dealer 5.57 0 1 1 10 8 8 0 0 0 0 0 8 2 0
Vantage Toyota Knaresborough VM Dealer 5.84 0 1 0 10 9 9 0 0 0 0 0 9 1 0
SAS Autoparts Motor Factor 7.27 1 0 0
AP Rawdon Motor Factor 9.29 1 0 0
Economy Spares Motor Factor 9.46 1 0 0
Ripon Auto Electrics Specialist 11.18 0 1 1 10 9 9 1 0 0 1 0 8 1 0
BMF Motor Factor 11.54 1 0 0
Wilco Motor Spares Motor Factor 11.79 1 0 0
GSF Motor Factor 11.79 1 0 0
AP Leeds Motor Factor 11.91 1 0 0
GSF Motor Factor 11.94 1 0 0
AP Bramley Motor Factor 12.49 1 0 0
Yes Car Parts Motor Factor 12.65 1 0 0
ECP Leeds Motor Factor 12.85 1 0 0
ECP Leeds Cross Green Motor Factor 13.22 1 0 0
M1 Motorparts Motor Factor 13.46 1 0 0
Wilco Motor Spares Motor Factor 13.46 1 0 0
Fleet Factors Motor Factor 13.79 1 0 0
ECP Bradford Motor Factor 14.28 1 0 0
TPS VM Dealer 14.30 0 0 0
SAS Autoparts Motor Factor 14.97 1 0 0
GSF Motor Factor 15.01 1 0 0
AP Bradford Motor Factor 15.14 1 0 0
AP Keighley Motor Factor 15.20 1 0 0
Wilco Motor Spares Motor Factor 15.45 1 0 0
AP Harrogate
Competitor Details ECP Data Survey Responses
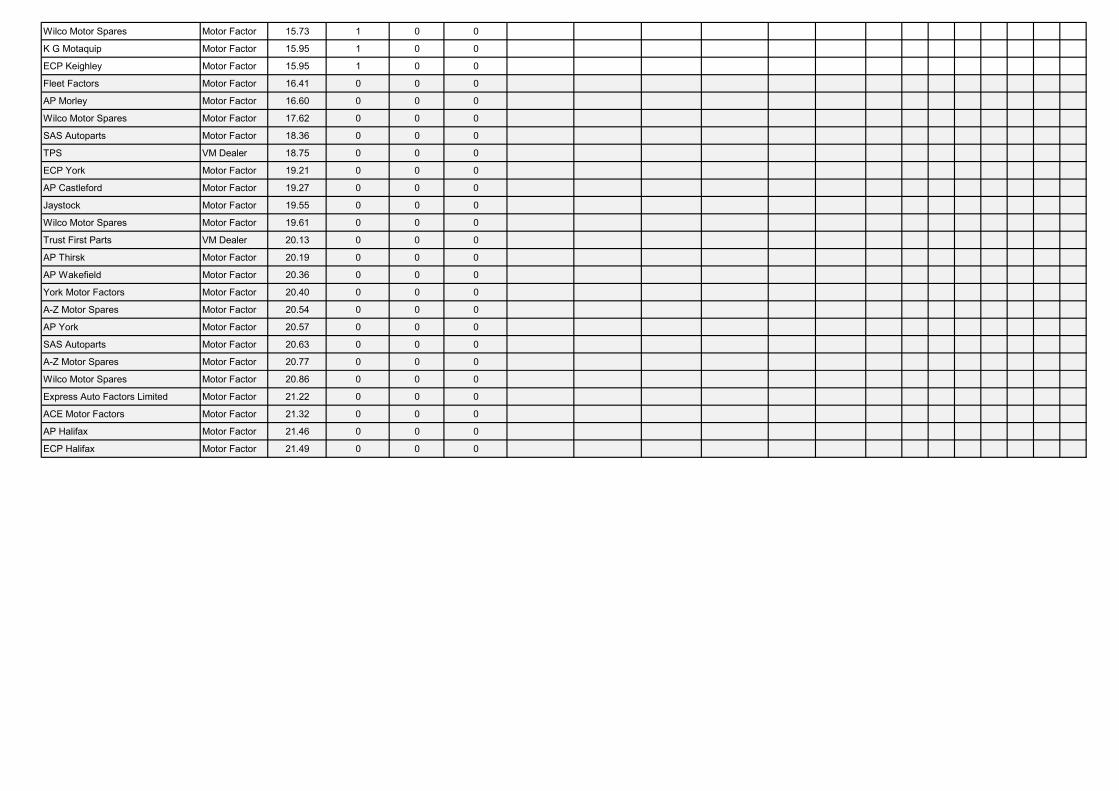
Wilco Motor Spares Motor Factor 15.73 1 0 0
K G Motaquip Motor Factor 15.95 1 0 0
ECP Keighley Motor Factor 15.95 1 0 0
Fleet Factors Motor Factor 16.41 0 0 0
AP Morley Motor Factor 16.60 0 0 0
Wilco Motor Spares Motor Factor 17.62 0 0 0
SAS Autoparts Motor Factor 18.36 0 0 0
TPS VM Dealer 18.75 0 0 0
ECP York Motor Factor 19.21 0 0 0
AP Castleford Motor Factor 19.27 0 0 0
Jaystock Motor Factor 19.55 0 0 0
Wilco Motor Spares Motor Factor 19.61 0 0 0
Trust First Parts VM Dealer 20.13 0 0 0
AP Thirsk Motor Factor 20.19 0 0 0
AP Wakefield Motor Factor 20.36 0 0 0
York Motor Factors Motor Factor 20.40 0 0 0
A-Z Motor Spares Motor Factor 20.54 0 0 0
AP York Motor Factor 20.57 0 0 0
SAS Autoparts Motor Factor 20.63 0 0 0
A-Z Motor Spares Motor Factor 20.77 0 0 0
Wilco Motor Spares Motor Factor 20.86 0 0 0
Express Auto Factors Limited Motor Factor 21.22 0 0 0
ACE Motor Factors Motor Factor 21.32 0 0 0
AP Halifax Motor Factor 21.46 0 0 0
ECP Halifax Motor Factor 21.49 0 0 0
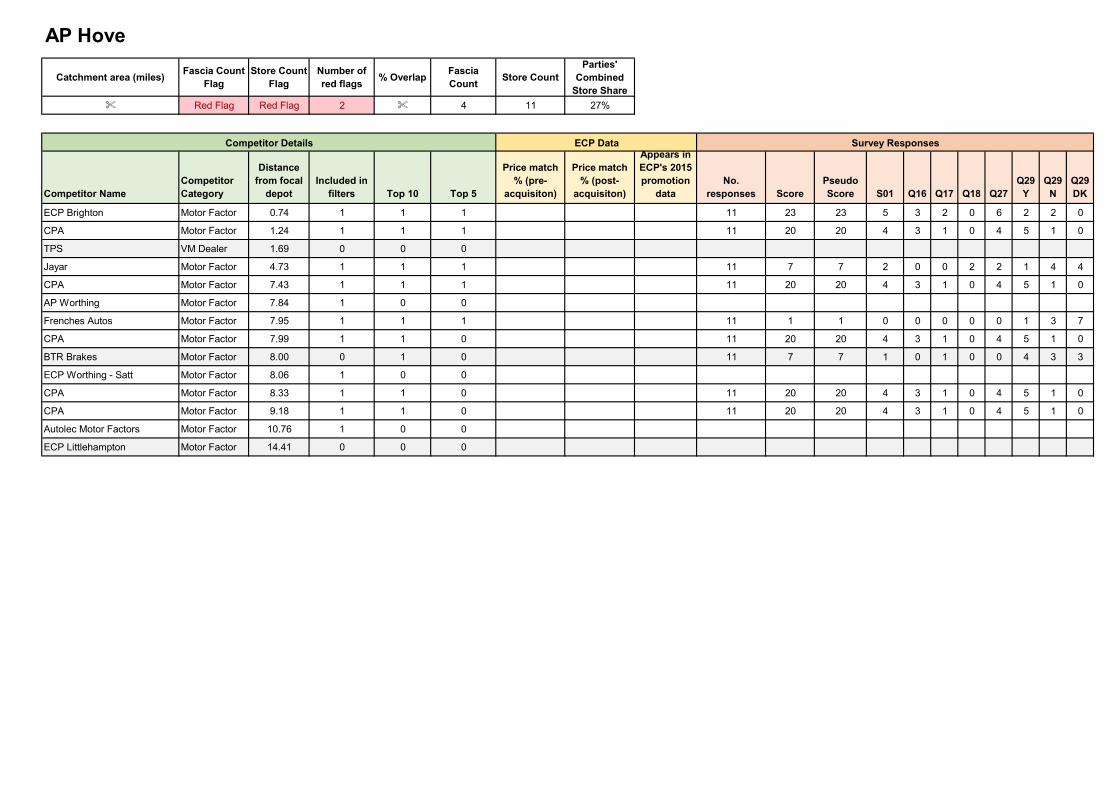
Catchment area (miles)Fascia Count
FlagStore Count
FlagNumber of red flags
% OverlapFascia Count
Store CountParties'
Combined Store Share
% Red Flag Red Flag 2 % 4 11 27%
Competitor NameCompetitor Category
Distance from focal
depotIncluded in
filters Top 10 Top 5
Price match % (pre-
acquisiton)
Price match % (post-
acquisiton)
Appears in ECP's 2015 promotion
dataNo.
responses ScorePseudo Score S01 Q16 Q17 Q18 Q27
Q29 Y
Q29 N
Q29 DK
ECP Brighton Motor Factor 0.74 1 1 1 11 23 23 5 3 2 0 6 2 2 0
CPA Motor Factor 1.24 1 1 1 11 20 20 4 3 1 0 4 5 1 0
TPS VM Dealer 1.69 0 0 0
Jayar Motor Factor 4.73 1 1 1 11 7 7 2 0 0 2 2 1 4 4
CPA Motor Factor 7.43 1 1 1 11 20 20 4 3 1 0 4 5 1 0
AP Worthing Motor Factor 7.84 1 0 0
Frenches Autos Motor Factor 7.95 1 1 1 11 1 1 0 0 0 0 0 1 3 7
CPA Motor Factor 7.99 1 1 0 11 20 20 4 3 1 0 4 5 1 0
BTR Brakes Motor Factor 8.00 0 1 0 11 7 7 1 0 1 0 0 4 3 3
ECP Worthing - Satt Motor Factor 8.06 1 0 0
CPA Motor Factor 8.33 1 1 0 11 20 20 4 3 1 0 4 5 1 0
CPA Motor Factor 9.18 1 1 0 11 20 20 4 3 1 0 4 5 1 0
Autolec Motor Factors Motor Factor 10.76 1 0 0
ECP Littlehampton Motor Factor 14.41 0 0 0
AP Hove
Competitor Details ECP Data Survey Responses
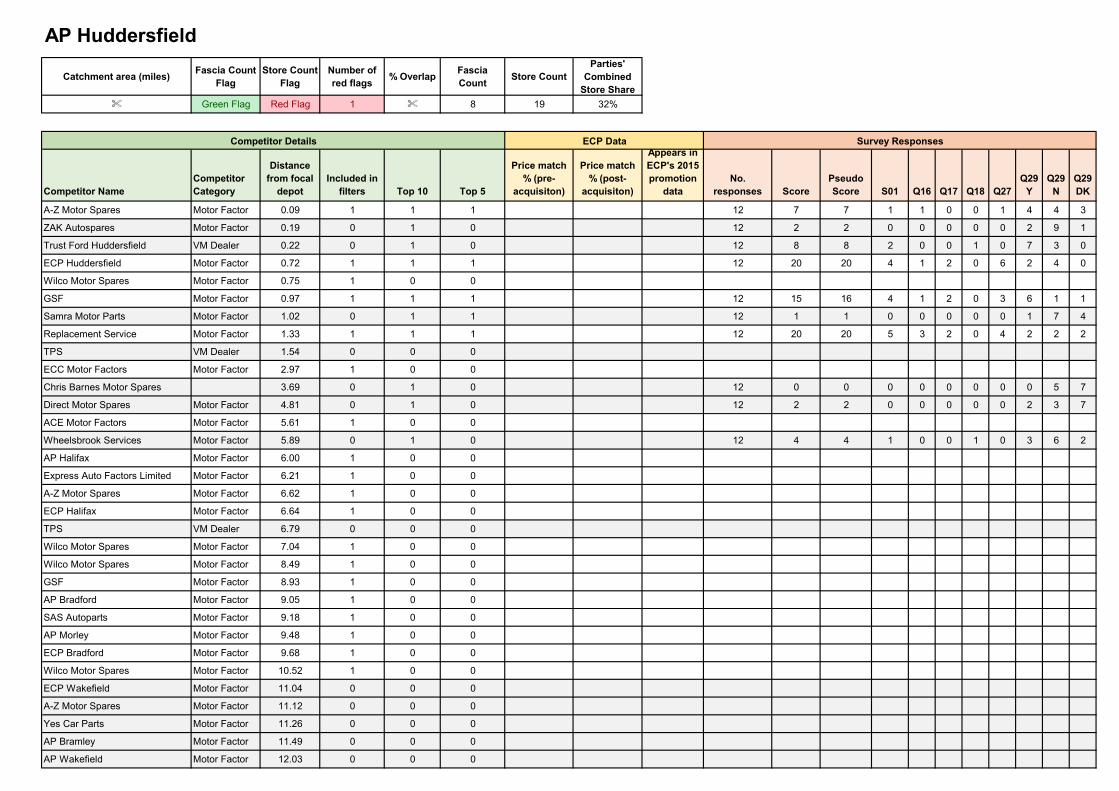
Catchment area (miles)Fascia Count
FlagStore Count
FlagNumber of red flags
% OverlapFascia Count
Store CountParties'
Combined Store Share
% Green Flag Red Flag 1 % 8 19 32%
Competitor NameCompetitor Category
Distance from focal
depotIncluded in
filters Top 10 Top 5
Price match % (pre-
acquisiton)
Price match % (post-
acquisiton)
Appears in ECP's 2015 promotion
dataNo.
responses ScorePseudo Score S01 Q16 Q17 Q18 Q27
Q29 Y
Q29 N
Q29 DK
A-Z Motor Spares Motor Factor 0.09 1 1 1 12 7 7 1 1 0 0 1 4 4 3
ZAK Autospares Motor Factor 0.19 0 1 0 12 2 2 0 0 0 0 0 2 9 1
Trust Ford Huddersfield VM Dealer 0.22 0 1 0 12 8 8 2 0 0 1 0 7 3 0
ECP Huddersfield Motor Factor 0.72 1 1 1 12 20 20 4 1 2 0 6 2 4 0
Wilco Motor Spares Motor Factor 0.75 1 0 0
GSF Motor Factor 0.97 1 1 1 12 15 16 4 1 2 0 3 6 1 1
Samra Motor Parts Motor Factor 1.02 0 1 1 12 1 1 0 0 0 0 0 1 7 4
Replacement Service Motor Factor 1.33 1 1 1 12 20 20 5 3 2 0 4 2 2 2
TPS VM Dealer 1.54 0 0 0
ECC Motor Factors Motor Factor 2.97 1 0 0
Chris Barnes Motor Spares 3.69 0 1 0 12 0 0 0 0 0 0 0 0 5 7
Direct Motor Spares Motor Factor 4.81 0 1 0 12 2 2 0 0 0 0 0 2 3 7
ACE Motor Factors Motor Factor 5.61 1 0 0
Wheelsbrook Services Motor Factor 5.89 0 1 0 12 4 4 1 0 0 1 0 3 6 2
AP Halifax Motor Factor 6.00 1 0 0
Express Auto Factors Limited Motor Factor 6.21 1 0 0
A-Z Motor Spares Motor Factor 6.62 1 0 0
ECP Halifax Motor Factor 6.64 1 0 0
TPS VM Dealer 6.79 0 0 0
Wilco Motor Spares Motor Factor 7.04 1 0 0
Wilco Motor Spares Motor Factor 8.49 1 0 0
GSF Motor Factor 8.93 1 0 0
AP Bradford Motor Factor 9.05 1 0 0
SAS Autoparts Motor Factor 9.18 1 0 0
AP Morley Motor Factor 9.48 1 0 0
ECP Bradford Motor Factor 9.68 1 0 0
Wilco Motor Spares Motor Factor 10.52 1 0 0
ECP Wakefield Motor Factor 11.04 0 0 0
A-Z Motor Spares Motor Factor 11.12 0 0 0
Yes Car Parts Motor Factor 11.26 0 0 0
AP Bramley Motor Factor 11.49 0 0 0
AP Wakefield Motor Factor 12.03 0 0 0
AP Huddersfield
Competitor Details ECP Data Survey Responses
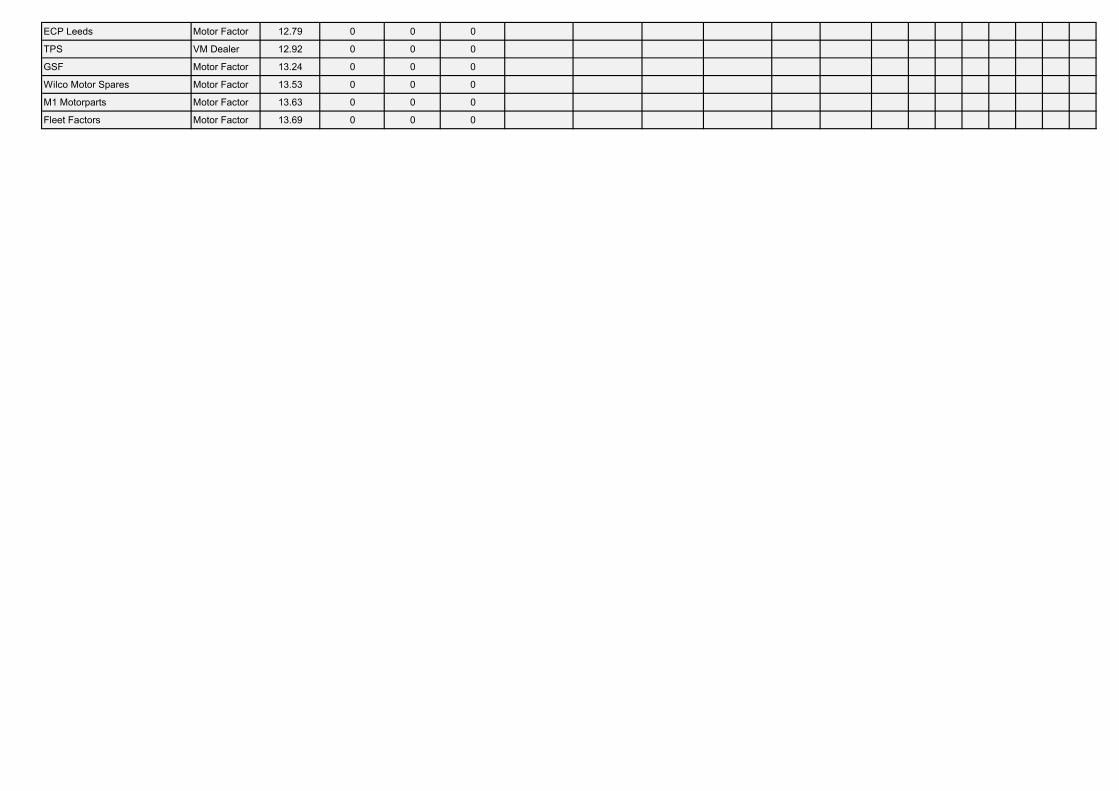
ECP Leeds Motor Factor 12.79 0 0 0
TPS VM Dealer 12.92 0 0 0
GSF Motor Factor 13.24 0 0 0
Wilco Motor Spares Motor Factor 13.53 0 0 0
M1 Motorparts Motor Factor 13.63 0 0 0
Fleet Factors Motor Factor 13.69 0 0 0
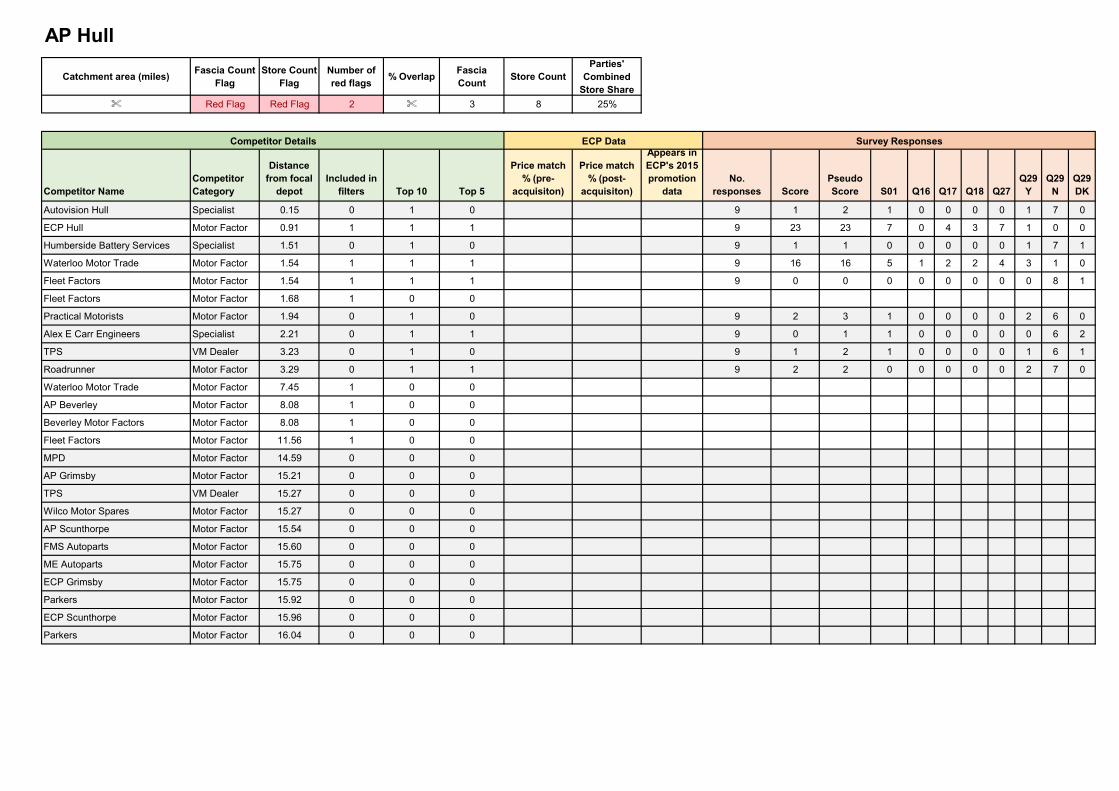
Catchment area (miles)Fascia Count
FlagStore Count
FlagNumber of red flags
% OverlapFascia Count
Store CountParties'
Combined Store Share
% Red Flag Red Flag 2 % 3 8 25%
Competitor NameCompetitor Category
Distance from focal
depotIncluded in
filters Top 10 Top 5
Price match % (pre-
acquisiton)
Price match % (post-
acquisiton)
Appears in ECP's 2015 promotion
dataNo.
responses ScorePseudo Score S01 Q16 Q17 Q18 Q27
Q29 Y
Q29 N
Q29 DK
Autovision Hull Specialist 0.15 0 1 0 9 1 2 1 0 0 0 0 1 7 0
ECP Hull Motor Factor 0.91 1 1 1 9 23 23 7 0 4 3 7 1 0 0
Humberside Battery Services Specialist 1.51 0 1 0 9 1 1 0 0 0 0 0 1 7 1
Waterloo Motor Trade Motor Factor 1.54 1 1 1 9 16 16 5 1 2 2 4 3 1 0
Fleet Factors Motor Factor 1.54 1 1 1 9 0 0 0 0 0 0 0 0 8 1
Fleet Factors Motor Factor 1.68 1 0 0
Practical Motorists Motor Factor 1.94 0 1 0 9 2 3 1 0 0 0 0 2 6 0
Alex E Carr Engineers Specialist 2.21 0 1 1 9 0 1 1 0 0 0 0 0 6 2
TPS VM Dealer 3.23 0 1 0 9 1 2 1 0 0 0 0 1 6 1
Roadrunner Motor Factor 3.29 0 1 1 9 2 2 0 0 0 0 0 2 7 0
Waterloo Motor Trade Motor Factor 7.45 1 0 0
AP Beverley Motor Factor 8.08 1 0 0
Beverley Motor Factors Motor Factor 8.08 1 0 0
Fleet Factors Motor Factor 11.56 1 0 0
MPD Motor Factor 14.59 0 0 0
AP Grimsby Motor Factor 15.21 0 0 0
TPS VM Dealer 15.27 0 0 0
Wilco Motor Spares Motor Factor 15.27 0 0 0
AP Scunthorpe Motor Factor 15.54 0 0 0
FMS Autoparts Motor Factor 15.60 0 0 0
ME Autoparts Motor Factor 15.75 0 0 0
ECP Grimsby Motor Factor 15.75 0 0 0
Parkers Motor Factor 15.92 0 0 0
ECP Scunthorpe Motor Factor 15.96 0 0 0
Parkers Motor Factor 16.04 0 0 0
AP Hull
Competitor Details ECP Data Survey Responses
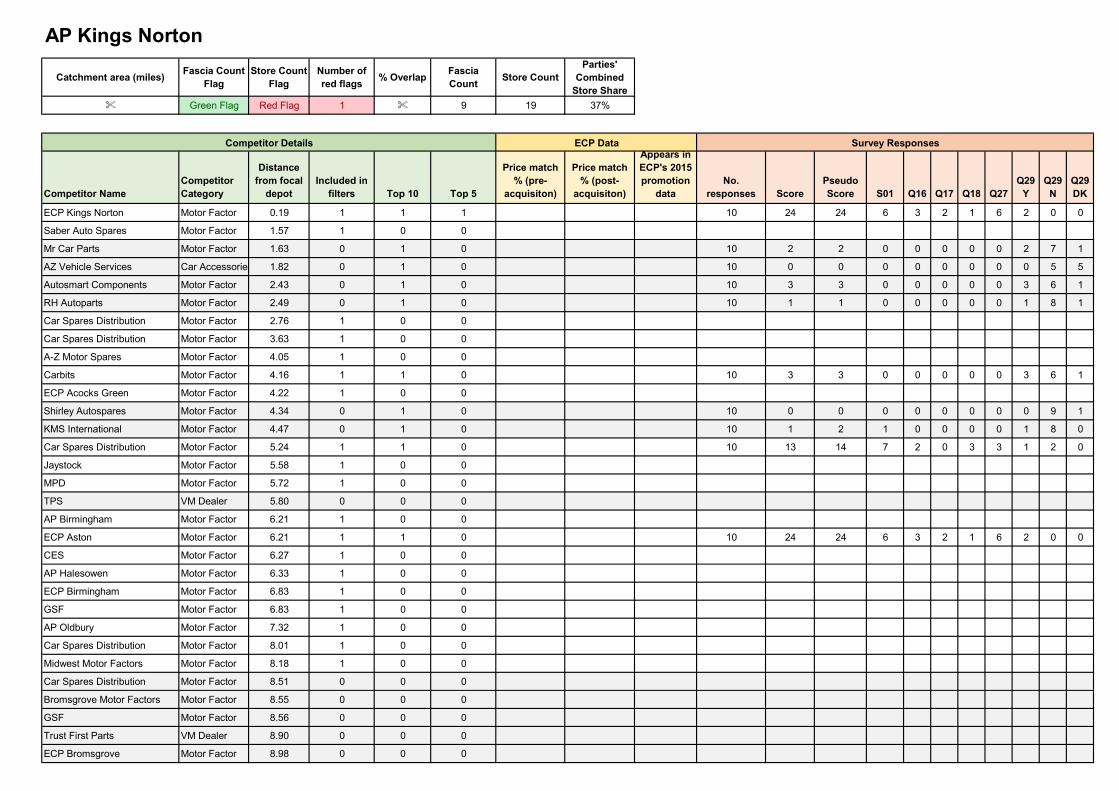
Catchment area (miles)Fascia Count
FlagStore Count
FlagNumber of red flags
% OverlapFascia Count
Store CountParties'
Combined Store Share
% Green Flag Red Flag 1 % 9 19 37%
Competitor NameCompetitor Category
Distance from focal
depotIncluded in
filters Top 10 Top 5
Price match % (pre-
acquisiton)
Price match % (post-
acquisiton)
Appears in ECP's 2015 promotion
dataNo.
responses ScorePseudo Score S01 Q16 Q17 Q18 Q27
Q29 Y
Q29 N
Q29 DK
ECP Kings Norton Motor Factor 0.19 1 1 1 10 24 24 6 3 2 1 6 2 0 0
Saber Auto Spares Motor Factor 1.57 1 0 0
Mr Car Parts Motor Factor 1.63 0 1 0 10 2 2 0 0 0 0 0 2 7 1
AZ Vehicle Services Car Accessories 1.82 0 1 0 10 0 0 0 0 0 0 0 0 5 5
Autosmart Components Motor Factor 2.43 0 1 0 10 3 3 0 0 0 0 0 3 6 1
RH Autoparts Motor Factor 2.49 0 1 0 10 1 1 0 0 0 0 0 1 8 1
Car Spares Distribution Motor Factor 2.76 1 0 0
Car Spares Distribution Motor Factor 3.63 1 0 0
A-Z Motor Spares Motor Factor 4.05 1 0 0
Carbits Motor Factor 4.16 1 1 0 10 3 3 0 0 0 0 0 3 6 1
ECP Acocks Green Motor Factor 4.22 1 0 0
Shirley Autospares Motor Factor 4.34 0 1 0 10 0 0 0 0 0 0 0 0 9 1
KMS International Motor Factor 4.47 0 1 0 10 1 2 1 0 0 0 0 1 8 0
Car Spares Distribution Motor Factor 5.24 1 1 0 10 13 14 7 2 0 3 3 1 2 0
Jaystock Motor Factor 5.58 1 0 0
MPD Motor Factor 5.72 1 0 0
TPS VM Dealer 5.80 0 0 0
AP Birmingham Motor Factor 6.21 1 0 0
ECP Aston Motor Factor 6.21 1 1 0 10 24 24 6 3 2 1 6 2 0 0
CES Motor Factor 6.27 1 0 0
AP Halesowen Motor Factor 6.33 1 0 0
ECP Birmingham Motor Factor 6.83 1 0 0
GSF Motor Factor 6.83 1 0 0
AP Oldbury Motor Factor 7.32 1 0 0
Car Spares Distribution Motor Factor 8.01 1 0 0
Midwest Motor Factors Motor Factor 8.18 1 0 0
Car Spares Distribution Motor Factor 8.51 0 0 0
Bromsgrove Motor Factors Motor Factor 8.55 0 0 0
GSF Motor Factor 8.56 0 0 0
Trust First Parts VM Dealer 8.90 0 0 0
ECP Bromsgrove Motor Factor 8.98 0 0 0
AP Kings Norton
Competitor Details ECP Data Survey Responses

Bromsgrove Motor Factors Motor Factor 8.98 0 0 0
ECP Brierley Hill Motor Factor 9.06 0 0 0
Loverock Motor Parts Motor Factor 9.84 0 0 0
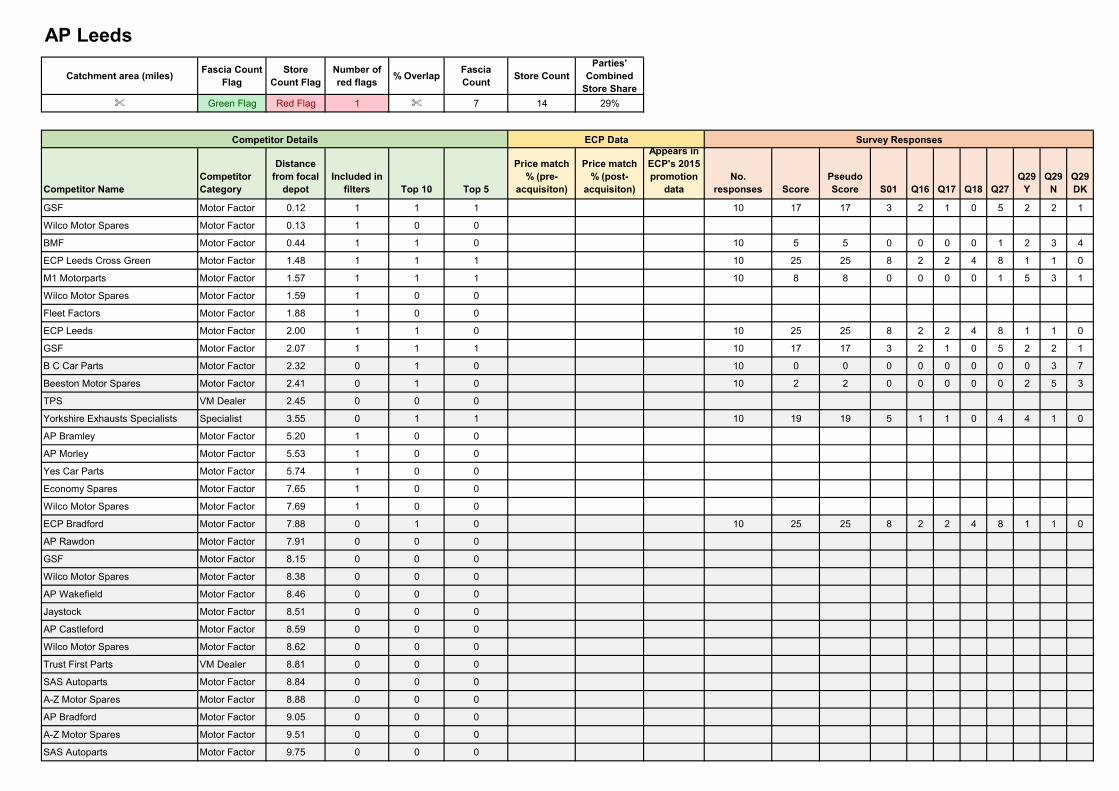
Catchment area (miles)Fascia Count
FlagStore
Count FlagNumber of red flags
% OverlapFascia Count
Store CountParties'
Combined Store Share
% Green Flag Red Flag 1 % 7 14 29%
Competitor NameCompetitor Category
Distance from focal
depotIncluded in
filters Top 10 Top 5
Price match % (pre-
acquisiton)
Price match % (post-
acquisiton)
Appears in ECP's 2015 promotion
dataNo.
responses ScorePseudo Score S01 Q16 Q17 Q18 Q27
Q29 Y
Q29 N
Q29 DK
GSF Motor Factor 0.12 1 1 1 10 17 17 3 2 1 0 5 2 2 1
Wilco Motor Spares Motor Factor 0.13 1 0 0
BMF Motor Factor 0.44 1 1 0 10 5 5 0 0 0 0 1 2 3 4
ECP Leeds Cross Green Motor Factor 1.48 1 1 1 10 25 25 8 2 2 4 8 1 1 0
M1 Motorparts Motor Factor 1.57 1 1 1 10 8 8 0 0 0 0 1 5 3 1
Wilco Motor Spares Motor Factor 1.59 1 0 0
Fleet Factors Motor Factor 1.88 1 0 0
ECP Leeds Motor Factor 2.00 1 1 0 10 25 25 8 2 2 4 8 1 1 0
GSF Motor Factor 2.07 1 1 1 10 17 17 3 2 1 0 5 2 2 1
B C Car Parts Motor Factor 2.32 0 1 0 10 0 0 0 0 0 0 0 0 3 7
Beeston Motor Spares Motor Factor 2.41 0 1 0 10 2 2 0 0 0 0 0 2 5 3
TPS VM Dealer 2.45 0 0 0
Yorkshire Exhausts Specialists Specialist 3.55 0 1 1 10 19 19 5 1 1 0 4 4 1 0
AP Bramley Motor Factor 5.20 1 0 0
AP Morley Motor Factor 5.53 1 0 0
Yes Car Parts Motor Factor 5.74 1 0 0
Economy Spares Motor Factor 7.65 1 0 0
Wilco Motor Spares Motor Factor 7.69 1 0 0
ECP Bradford Motor Factor 7.88 0 1 0 10 25 25 8 2 2 4 8 1 1 0
AP Rawdon Motor Factor 7.91 0 0 0
GSF Motor Factor 8.15 0 0 0
Wilco Motor Spares Motor Factor 8.38 0 0 0
AP Wakefield Motor Factor 8.46 0 0 0
Jaystock Motor Factor 8.51 0 0 0
AP Castleford Motor Factor 8.59 0 0 0
Wilco Motor Spares Motor Factor 8.62 0 0 0
Trust First Parts VM Dealer 8.81 0 0 0
SAS Autoparts Motor Factor 8.84 0 0 0
A-Z Motor Spares Motor Factor 8.88 0 0 0
AP Bradford Motor Factor 9.05 0 0 0
A-Z Motor Spares Motor Factor 9.51 0 0 0
SAS Autoparts Motor Factor 9.75 0 0 0
AP Leeds
Competitor Details ECP Data Survey Responses

ECP Wakefield Motor Factor 9.80 0 0 0
SAS Autoparts Motor Factor 10.16 0 0 0
ECP Harrogate Motor Factor 11.91 0 0 0
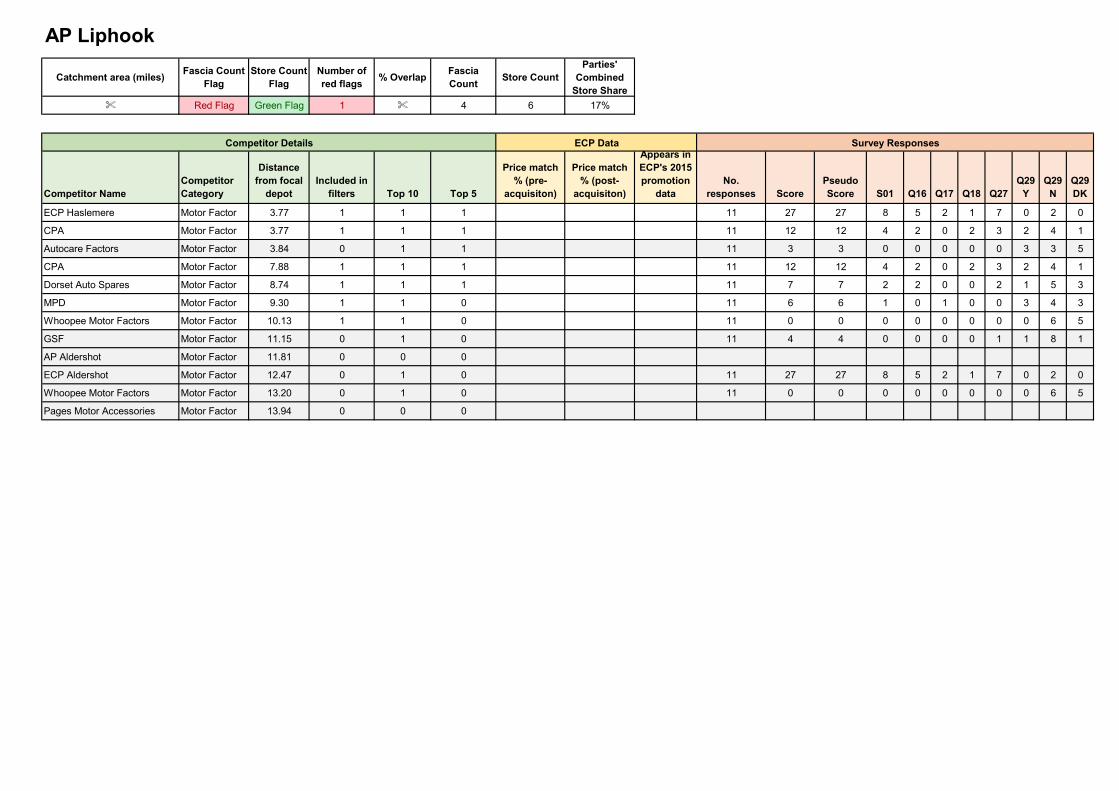
Catchment area (miles)Fascia Count
FlagStore Count
FlagNumber of red flags
% OverlapFascia Count
Store CountParties'
Combined Store Share
% Red Flag Green Flag 1 % 4 6 17%
Competitor NameCompetitor Category
Distance from focal
depotIncluded in
filters Top 10 Top 5
Price match % (pre-
acquisiton)
Price match % (post-
acquisiton)
Appears in ECP's 2015 promotion
dataNo.
responses ScorePseudo Score S01 Q16 Q17 Q18 Q27
Q29 Y
Q29 N
Q29 DK
ECP Haslemere Motor Factor 3.77 1 1 1 11 27 27 8 5 2 1 7 0 2 0
CPA Motor Factor 3.77 1 1 1 11 12 12 4 2 0 2 3 2 4 1
Autocare Factors Motor Factor 3.84 0 1 1 11 3 3 0 0 0 0 0 3 3 5
CPA Motor Factor 7.88 1 1 1 11 12 12 4 2 0 2 3 2 4 1
Dorset Auto Spares Motor Factor 8.74 1 1 1 11 7 7 2 2 0 0 2 1 5 3
MPD Motor Factor 9.30 1 1 0 11 6 6 1 0 1 0 0 3 4 3
Whoopee Motor Factors Motor Factor 10.13 1 1 0 11 0 0 0 0 0 0 0 0 6 5
GSF Motor Factor 11.15 0 1 0 11 4 4 0 0 0 0 1 1 8 1
AP Aldershot Motor Factor 11.81 0 0 0
ECP Aldershot Motor Factor 12.47 0 1 0 11 27 27 8 5 2 1 7 0 2 0
Whoopee Motor Factors Motor Factor 13.20 0 1 0 11 0 0 0 0 0 0 0 0 6 5
Pages Motor Accessories Motor Factor 13.94 0 0 0
AP Liphook
Competitor Details ECP Data Survey Responses
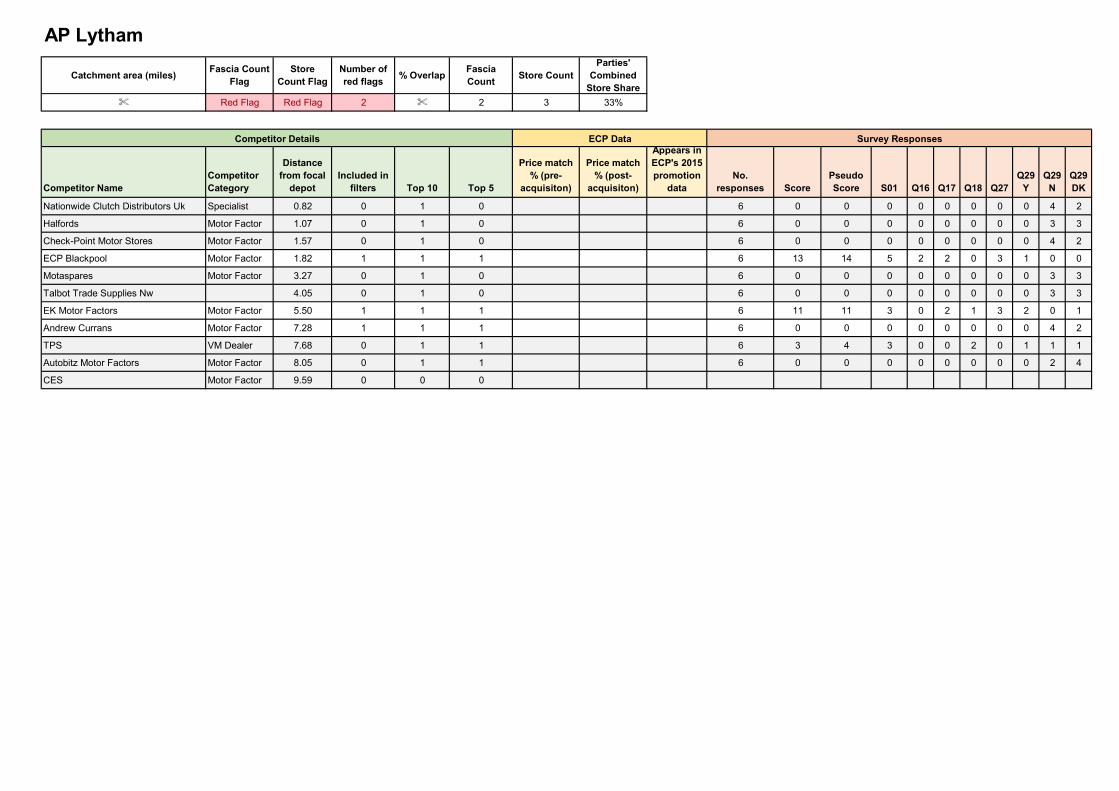
Catchment area (miles)Fascia Count
FlagStore
Count FlagNumber of red flags
% OverlapFascia Count
Store CountParties'
Combined Store Share
% Red Flag Red Flag 2 % 2 3 33%
Competitor NameCompetitor Category
Distance from focal
depotIncluded in
filters Top 10 Top 5
Price match % (pre-
acquisiton)
Price match % (post-
acquisiton)
Appears in ECP's 2015 promotion
dataNo.
responses ScorePseudo Score S01 Q16 Q17 Q18 Q27
Q29 Y
Q29 N
Q29 DK
Nationwide Clutch Distributors Uk Specialist 0.82 0 1 0 6 0 0 0 0 0 0 0 0 4 2
Halfords Motor Factor 1.07 0 1 0 6 0 0 0 0 0 0 0 0 3 3
Check-Point Motor Stores Motor Factor 1.57 0 1 0 6 0 0 0 0 0 0 0 0 4 2
ECP Blackpool Motor Factor 1.82 1 1 1 6 13 14 5 2 2 0 3 1 0 0
Motaspares Motor Factor 3.27 0 1 0 6 0 0 0 0 0 0 0 0 3 3
Talbot Trade Supplies Nw 4.05 0 1 0 6 0 0 0 0 0 0 0 0 3 3
EK Motor Factors Motor Factor 5.50 1 1 1 6 11 11 3 0 2 1 3 2 0 1
Andrew Currans Motor Factor 7.28 1 1 1 6 0 0 0 0 0 0 0 0 4 2
TPS VM Dealer 7.68 0 1 1 6 3 4 3 0 0 2 0 1 1 1
Autobitz Motor Factors Motor Factor 8.05 0 1 1 6 0 0 0 0 0 0 0 0 2 4
CES Motor Factor 9.59 0 0 0
AP Lytham
Competitor Details ECP Data Survey Responses
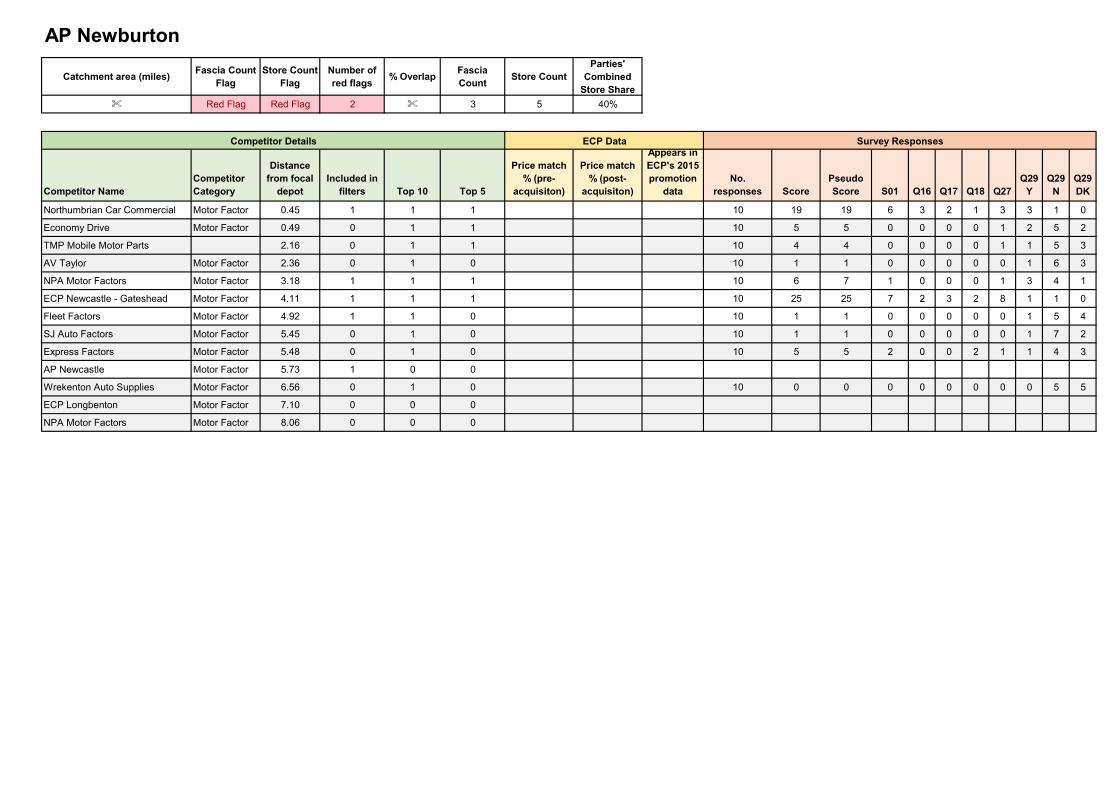
Catchment area (miles)Fascia Count
FlagStore Count
FlagNumber of red flags
% OverlapFascia Count
Store CountParties'
Combined Store Share
% Red Flag Red Flag 2 % 3 5 40%
Competitor NameCompetitor Category
Distance from focal
depotIncluded in
filters Top 10 Top 5
Price match % (pre-
acquisiton)
Price match % (post-
acquisiton)
Appears in ECP's 2015 promotion
dataNo.
responses ScorePseudo Score S01 Q16 Q17 Q18 Q27
Q29 Y
Q29 N
Q29 DK
Northumbrian Car Commercial Motor Factor 0.45 1 1 1 10 19 19 6 3 2 1 3 3 1 0
Economy Drive Motor Factor 0.49 0 1 1 10 5 5 0 0 0 0 1 2 5 2
TMP Mobile Motor Parts 2.16 0 1 1 10 4 4 0 0 0 0 1 1 5 3
AV Taylor Motor Factor 2.36 0 1 0 10 1 1 0 0 0 0 0 1 6 3
NPA Motor Factors Motor Factor 3.18 1 1 1 10 6 7 1 0 0 0 1 3 4 1
ECP Newcastle - Gateshead Motor Factor 4.11 1 1 1 10 25 25 7 2 3 2 8 1 1 0
Fleet Factors Motor Factor 4.92 1 1 0 10 1 1 0 0 0 0 0 1 5 4
SJ Auto Factors Motor Factor 5.45 0 1 0 10 1 1 0 0 0 0 0 1 7 2
Express Factors Motor Factor 5.48 0 1 0 10 5 5 2 0 0 2 1 1 4 3
AP Newcastle Motor Factor 5.73 1 0 0
Wrekenton Auto Supplies Motor Factor 6.56 0 1 0 10 0 0 0 0 0 0 0 0 5 5
ECP Longbenton Motor Factor 7.10 0 0 0
NPA Motor Factors Motor Factor 8.06 0 0 0
AP Newburton
Competitor Details ECP Data Survey Responses
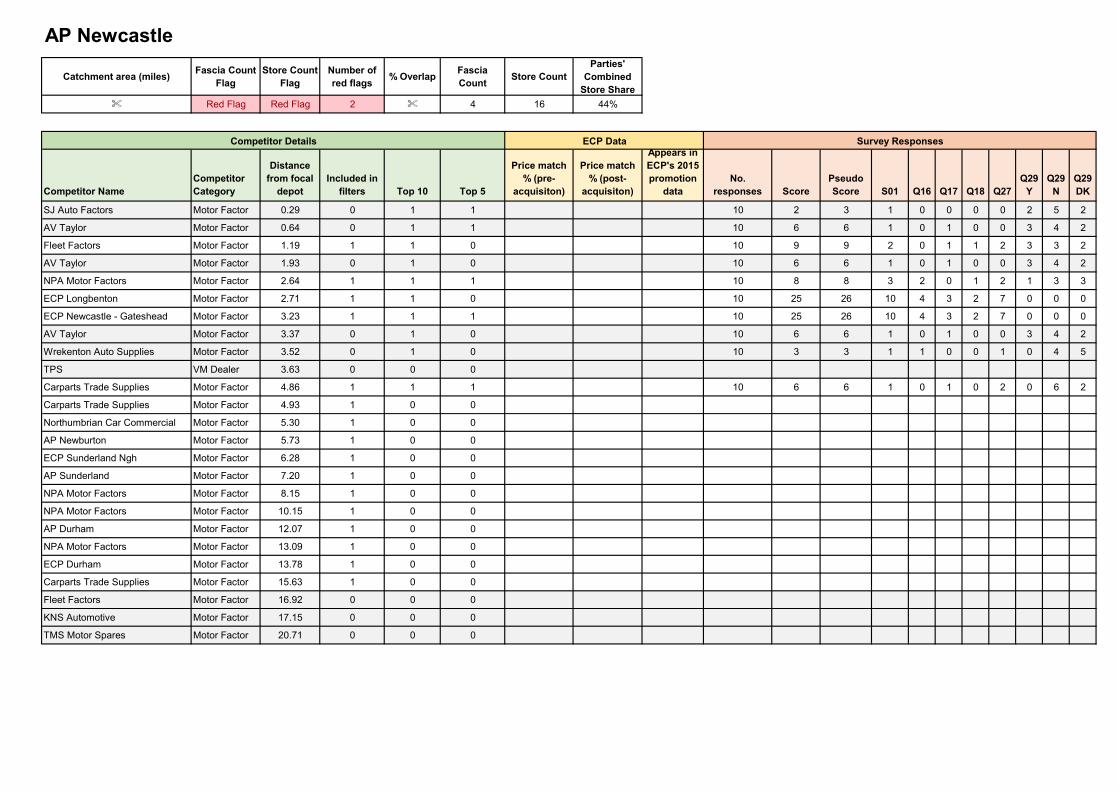
Catchment area (miles)Fascia Count
FlagStore Count
FlagNumber of red flags
% OverlapFascia Count
Store CountParties'
Combined Store Share
% Red Flag Red Flag 2 % 4 16 44%
Competitor NameCompetitor Category
Distance from focal
depotIncluded in
filters Top 10 Top 5
Price match % (pre-
acquisiton)
Price match % (post-
acquisiton)
Appears in ECP's 2015 promotion
dataNo.
responses ScorePseudo Score S01 Q16 Q17 Q18 Q27
Q29 Y
Q29 N
Q29 DK
SJ Auto Factors Motor Factor 0.29 0 1 1 10 2 3 1 0 0 0 0 2 5 2
AV Taylor Motor Factor 0.64 0 1 1 10 6 6 1 0 1 0 0 3 4 2
Fleet Factors Motor Factor 1.19 1 1 0 10 9 9 2 0 1 1 2 3 3 2
AV Taylor Motor Factor 1.93 0 1 0 10 6 6 1 0 1 0 0 3 4 2
NPA Motor Factors Motor Factor 2.64 1 1 1 10 8 8 3 2 0 1 2 1 3 3
ECP Longbenton Motor Factor 2.71 1 1 0 10 25 26 10 4 3 2 7 0 0 0
ECP Newcastle - Gateshead Motor Factor 3.23 1 1 1 10 25 26 10 4 3 2 7 0 0 0
AV Taylor Motor Factor 3.37 0 1 0 10 6 6 1 0 1 0 0 3 4 2
Wrekenton Auto Supplies Motor Factor 3.52 0 1 0 10 3 3 1 1 0 0 1 0 4 5
TPS VM Dealer 3.63 0 0 0
Carparts Trade Supplies Motor Factor 4.86 1 1 1 10 6 6 1 0 1 0 2 0 6 2
Carparts Trade Supplies Motor Factor 4.93 1 0 0
Northumbrian Car Commercial Motor Factor 5.30 1 0 0
AP Newburton Motor Factor 5.73 1 0 0
ECP Sunderland Ngh Motor Factor 6.28 1 0 0
AP Sunderland Motor Factor 7.20 1 0 0
NPA Motor Factors Motor Factor 8.15 1 0 0
NPA Motor Factors Motor Factor 10.15 1 0 0
AP Durham Motor Factor 12.07 1 0 0
NPA Motor Factors Motor Factor 13.09 1 0 0
ECP Durham Motor Factor 13.78 1 0 0
Carparts Trade Supplies Motor Factor 15.63 1 0 0
Fleet Factors Motor Factor 16.92 0 0 0
KNS Automotive Motor Factor 17.15 0 0 0
TMS Motor Spares Motor Factor 20.71 0 0 0
AP Newcastle
Competitor Details ECP Data Survey Responses

Catchment area (miles)Fascia Count
FlagStore Count
FlagNumber of red flags
% OverlapFascia Count
Store CountParties'
Combined Store Share
% Red Flag Green Flag 1 % 3 4 0%
Competitor NameCompetitor Category
Distance from focal
depotIncluded in
filters Top 10 Top 5
Price match % (pre-
acquisiton)
Price match % (post-
acquisiton)
Appears in ECP's 2015 promotion
dataNo.
responses ScorePseudo Score S01 Q16 Q17 Q18 Q27
Q29 Y
Q29 N
Q29 DK
GSF Motor Factor 0.80 1 1 1 10 12 13 4 0 1 0 2 3 2 1
CRM Express Motor Factor 0.84 0 1 1 10 8 8 2 1 1 0 2 2 4 2
CR Marks Motor Factor 0.84 1 0 0
Frenco Motor Factor 0.98 1 1 1 10 5 5 0 0 0 0 0 5 3 2
United Car Parts 3.78 0 1 0 10 0 0 0 0 0 0 0 0 7 3
CR Marks Motor Factor 4.69 1 1 0 10 9 9 1 1 0 0 1 6 2 1
ECP Oxford Motor Factor 6.13 0 1 1 10 26 26 7 3 2 1 7 2 0 0
Allparts Automotive Motor Factor 6.18 0 1 1 10 12 12 2 0 1 1 2 5 1 1
TPS VM Dealer 8.28 0 1 0 10 4 4 1 0 0 1 0 3 4 2
MPD Motor Factor 8.53 0 1 0 10 7 7 0 0 0 0 1 4 2 3
Jayar Motor Factor 9.55 0 1 0 10 7 7 2 0 2 0 2 1 3 4
AP Oxford
Competitor Details ECP Data Survey Responses
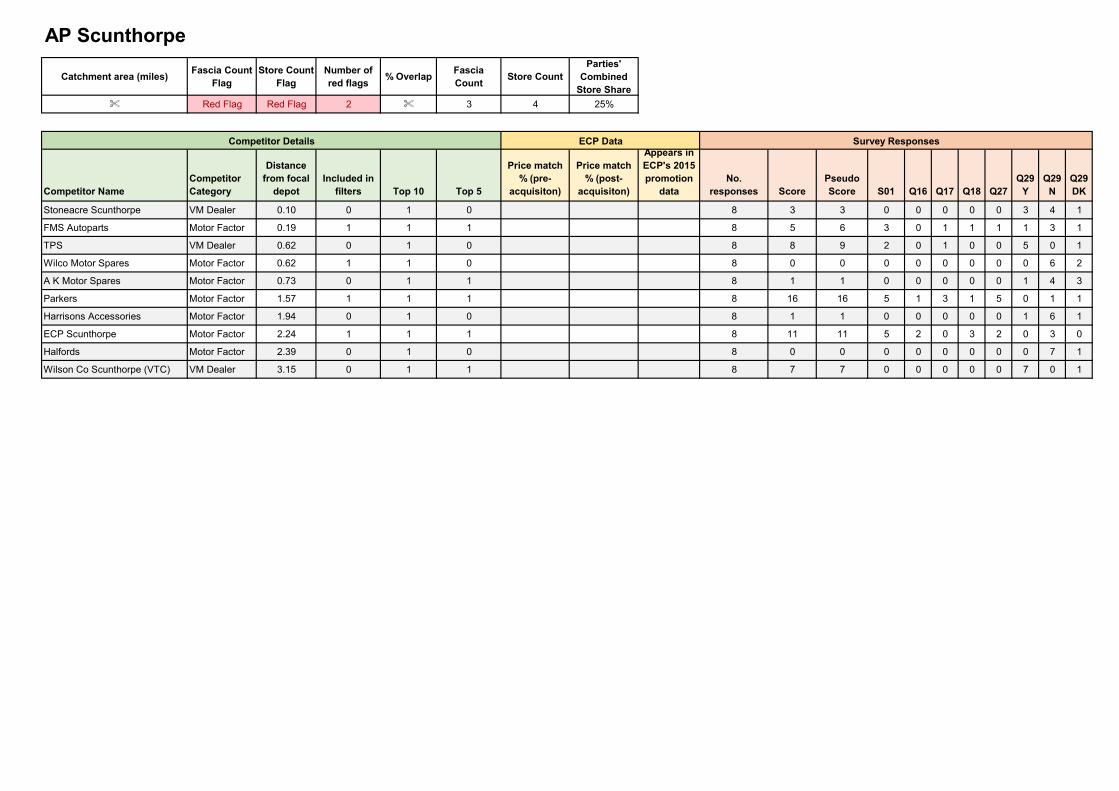
Catchment area (miles)Fascia Count
FlagStore Count
FlagNumber of red flags
% OverlapFascia Count
Store CountParties'
Combined Store Share
% Red Flag Red Flag 2 % 3 4 25%
Competitor NameCompetitor Category
Distance from focal
depotIncluded in
filters Top 10 Top 5
Price match % (pre-
acquisiton)
Price match % (post-
acquisiton)
Appears in ECP's 2015 promotion
dataNo.
responses ScorePseudo Score S01 Q16 Q17 Q18 Q27
Q29 Y
Q29 N
Q29 DK
Stoneacre Scunthorpe VM Dealer 0.10 0 1 0 8 3 3 0 0 0 0 0 3 4 1
FMS Autoparts Motor Factor 0.19 1 1 1 8 5 6 3 0 1 1 1 1 3 1
TPS VM Dealer 0.62 0 1 0 8 8 9 2 0 1 0 0 5 0 1
Wilco Motor Spares Motor Factor 0.62 1 1 0 8 0 0 0 0 0 0 0 0 6 2
A K Motor Spares Motor Factor 0.73 0 1 1 8 1 1 0 0 0 0 0 1 4 3
Parkers Motor Factor 1.57 1 1 1 8 16 16 5 1 3 1 5 0 1 1
Harrisons Accessories Motor Factor 1.94 0 1 0 8 1 1 0 0 0 0 0 1 6 1
ECP Scunthorpe Motor Factor 2.24 1 1 1 8 11 11 5 2 0 3 2 0 3 0
Halfords Motor Factor 2.39 0 1 0 8 0 0 0 0 0 0 0 0 7 1
Wilson Co Scunthorpe (VTC) VM Dealer 3.15 0 1 1 8 7 7 0 0 0 0 0 7 0 1
AP Scunthorpe
Competitor Details ECP Data Survey Responses
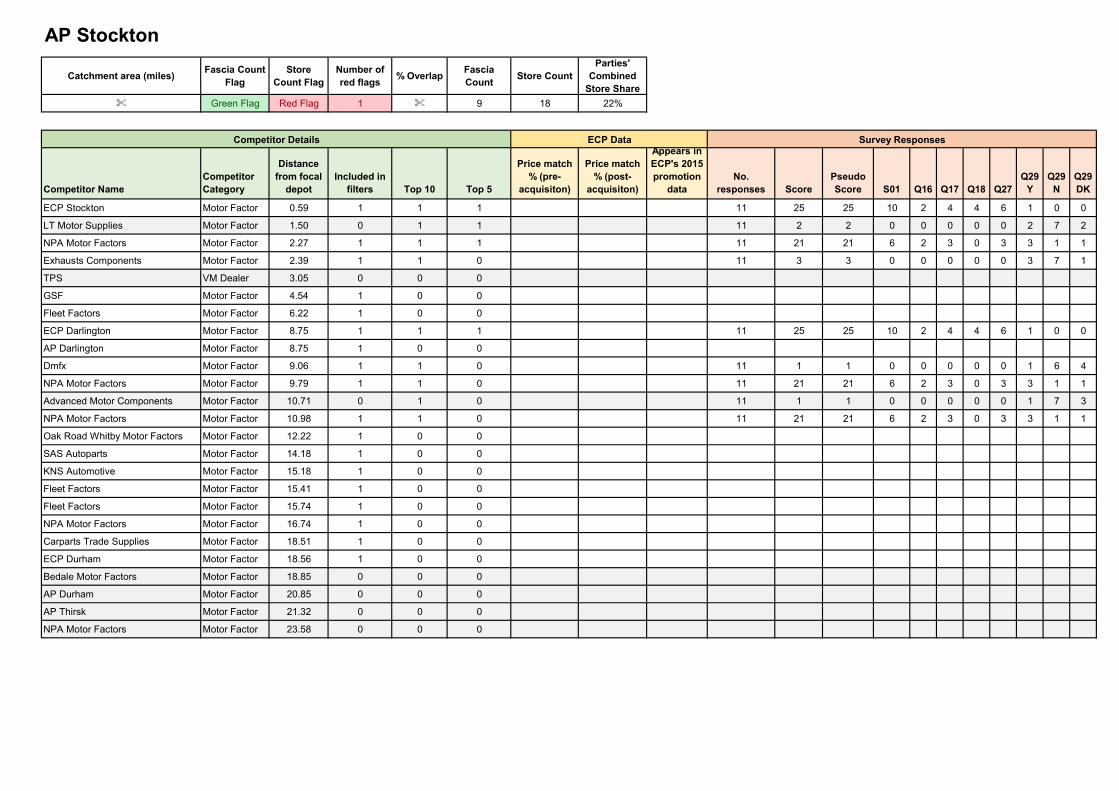
Catchment area (miles)Fascia Count
FlagStore
Count FlagNumber of red flags
% OverlapFascia Count
Store CountParties'
Combined Store Share
% Green Flag Red Flag 1 % 9 18 22%
Competitor NameCompetitor Category
Distance from focal
depotIncluded in
filters Top 10 Top 5
Price match % (pre-
acquisiton)
Price match % (post-
acquisiton)
Appears in ECP's 2015 promotion
dataNo.
responses ScorePseudo Score S01 Q16 Q17 Q18 Q27
Q29 Y
Q29 N
Q29 DK
ECP Stockton Motor Factor 0.59 1 1 1 11 25 25 10 2 4 4 6 1 0 0
LT Motor Supplies Motor Factor 1.50 0 1 1 11 2 2 0 0 0 0 0 2 7 2
NPA Motor Factors Motor Factor 2.27 1 1 1 11 21 21 6 2 3 0 3 3 1 1
Exhausts Components Motor Factor 2.39 1 1 0 11 3 3 0 0 0 0 0 3 7 1
TPS VM Dealer 3.05 0 0 0
GSF Motor Factor 4.54 1 0 0
Fleet Factors Motor Factor 6.22 1 0 0
ECP Darlington Motor Factor 8.75 1 1 1 11 25 25 10 2 4 4 6 1 0 0
AP Darlington Motor Factor 8.75 1 0 0
Dmfx Motor Factor 9.06 1 1 0 11 1 1 0 0 0 0 0 1 6 4
NPA Motor Factors Motor Factor 9.79 1 1 0 11 21 21 6 2 3 0 3 3 1 1
Advanced Motor Components Motor Factor 10.71 0 1 0 11 1 1 0 0 0 0 0 1 7 3
NPA Motor Factors Motor Factor 10.98 1 1 0 11 21 21 6 2 3 0 3 3 1 1
Oak Road Whitby Motor Factors Motor Factor 12.22 1 0 0
SAS Autoparts Motor Factor 14.18 1 0 0
KNS Automotive Motor Factor 15.18 1 0 0
Fleet Factors Motor Factor 15.41 1 0 0
Fleet Factors Motor Factor 15.74 1 0 0
NPA Motor Factors Motor Factor 16.74 1 0 0
Carparts Trade Supplies Motor Factor 18.51 1 0 0
ECP Durham Motor Factor 18.56 1 0 0
Bedale Motor Factors Motor Factor 18.85 0 0 0
AP Durham Motor Factor 20.85 0 0 0
AP Thirsk Motor Factor 21.32 0 0 0
NPA Motor Factors Motor Factor 23.58 0 0 0
AP Stockton
Competitor Details ECP Data Survey Responses
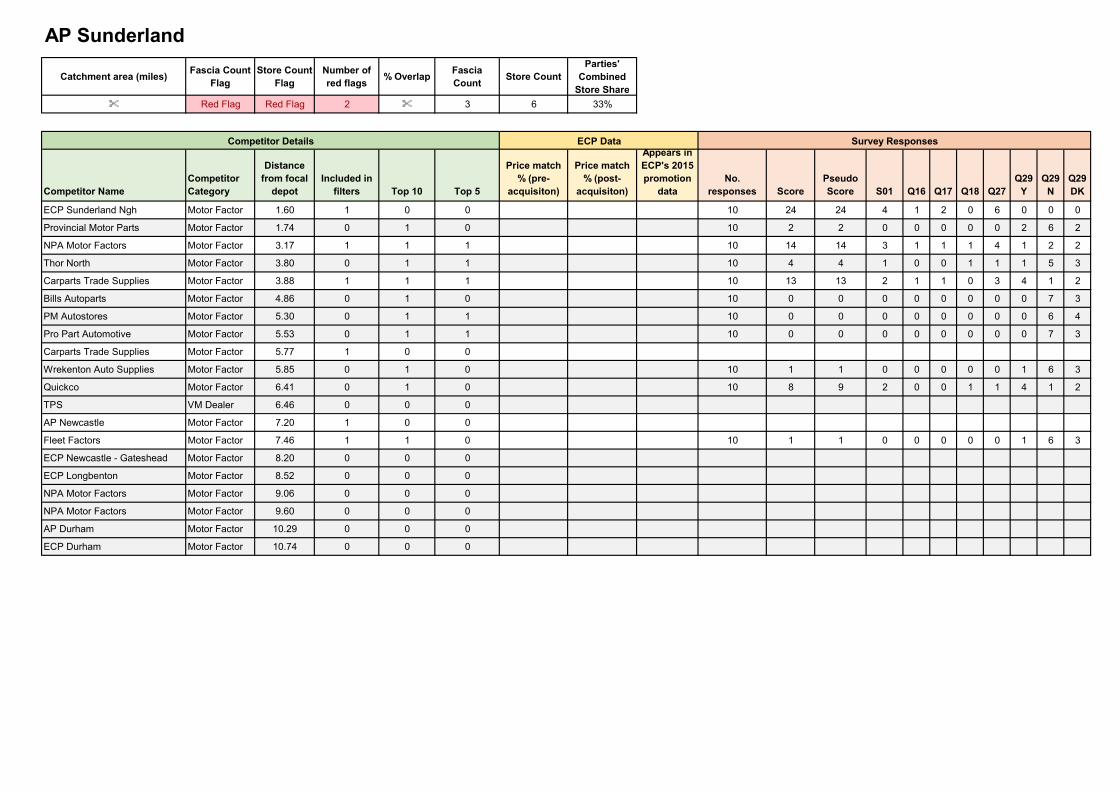
Catchment area (miles)Fascia Count
FlagStore Count
FlagNumber of red flags
% OverlapFascia Count
Store CountParties'
Combined Store Share
% Red Flag Red Flag 2 % 3 6 33%
Competitor NameCompetitor Category
Distance from focal
depotIncluded in
filters Top 10 Top 5
Price match % (pre-
acquisiton)
Price match % (post-
acquisiton)
Appears in ECP's 2015 promotion
dataNo.
responses ScorePseudo Score S01 Q16 Q17 Q18 Q27
Q29 Y
Q29 N
Q29 DK
ECP Sunderland Ngh Motor Factor 1.60 1 0 0 10 24 24 4 1 2 0 6 0 0 0
Provincial Motor Parts Motor Factor 1.74 0 1 0 10 2 2 0 0 0 0 0 2 6 2
NPA Motor Factors Motor Factor 3.17 1 1 1 10 14 14 3 1 1 1 4 1 2 2
Thor North Motor Factor 3.80 0 1 1 10 4 4 1 0 0 1 1 1 5 3
Carparts Trade Supplies Motor Factor 3.88 1 1 1 10 13 13 2 1 1 0 3 4 1 2
Bills Autoparts Motor Factor 4.86 0 1 0 10 0 0 0 0 0 0 0 0 7 3
PM Autostores Motor Factor 5.30 0 1 1 10 0 0 0 0 0 0 0 0 6 4
Pro Part Automotive Motor Factor 5.53 0 1 1 10 0 0 0 0 0 0 0 0 7 3
Carparts Trade Supplies Motor Factor 5.77 1 0 0
Wrekenton Auto Supplies Motor Factor 5.85 0 1 0 10 1 1 0 0 0 0 0 1 6 3
Quickco Motor Factor 6.41 0 1 0 10 8 9 2 0 0 1 1 4 1 2
TPS VM Dealer 6.46 0 0 0
AP Newcastle Motor Factor 7.20 1 0 0
Fleet Factors Motor Factor 7.46 1 1 0 10 1 1 0 0 0 0 0 1 6 3
ECP Newcastle - Gateshead Motor Factor 8.20 0 0 0
ECP Longbenton Motor Factor 8.52 0 0 0
NPA Motor Factors Motor Factor 9.06 0 0 0
NPA Motor Factors Motor Factor 9.60 0 0 0
AP Durham Motor Factor 10.29 0 0 0
ECP Durham Motor Factor 10.74 0 0 0
AP Sunderland
Competitor Details ECP Data Survey Responses
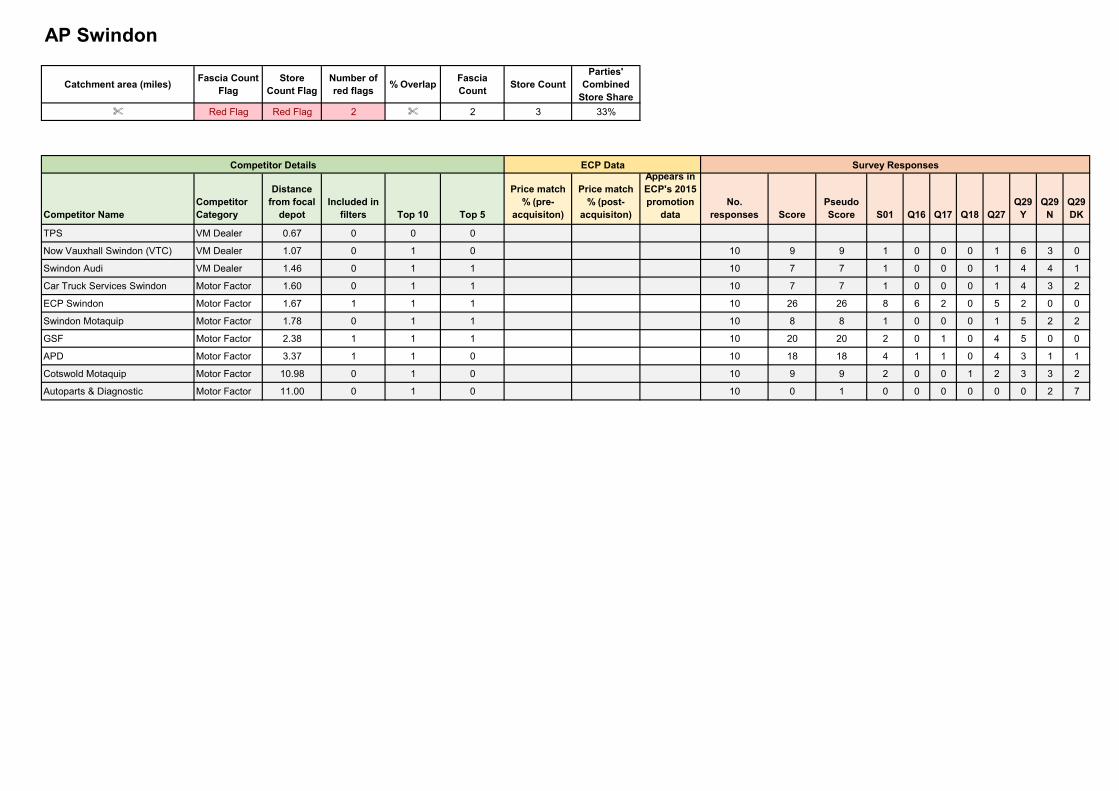
Catchment area (miles)Fascia Count
FlagStore
Count FlagNumber of red flags
% OverlapFascia Count
Store CountParties'
Combined Store Share
% Red Flag Red Flag 2 % 2 3 33%
Competitor NameCompetitor Category
Distance from focal
depotIncluded in
filters Top 10 Top 5
Price match % (pre-
acquisiton)
Price match % (post-
acquisiton)
Appears in ECP's 2015 promotion
dataNo.
responses ScorePseudo Score S01 Q16 Q17 Q18 Q27
Q29 Y
Q29 N
Q29 DK
TPS VM Dealer 0.67 0 0 0
Now Vauxhall Swindon (VTC) VM Dealer 1.07 0 1 0 10 9 9 1 0 0 0 1 6 3 0
Swindon Audi VM Dealer 1.46 0 1 1 10 7 7 1 0 0 0 1 4 4 1
Car Truck Services Swindon Motor Factor 1.60 0 1 1 10 7 7 1 0 0 0 1 4 3 2
ECP Swindon Motor Factor 1.67 1 1 1 10 26 26 8 6 2 0 5 2 0 0
Swindon Motaquip Motor Factor 1.78 0 1 1 10 8 8 1 0 0 0 1 5 2 2
GSF Motor Factor 2.38 1 1 1 10 20 20 2 0 1 0 4 5 0 0
APD Motor Factor 3.37 1 1 0 10 18 18 4 1 1 0 4 3 1 1
Cotswold Motaquip Motor Factor 10.98 0 1 0 10 9 9 2 0 0 1 2 3 3 2
Autoparts & Diagnostic Motor Factor 11.00 0 1 0 10 0 1 0 0 0 0 0 0 2 7
AP Swindon
Competitor Details ECP Data Survey Responses
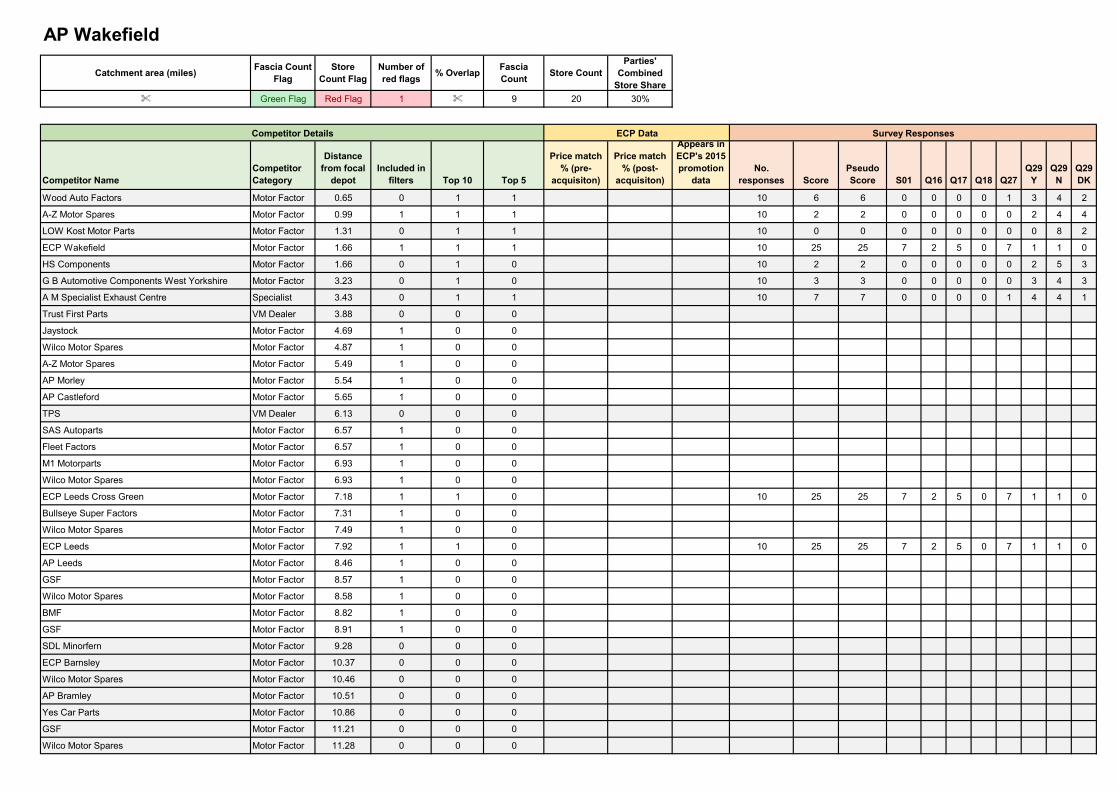
Catchment area (miles)Fascia Count
FlagStore
Count FlagNumber of red flags
% OverlapFascia Count
Store CountParties'
Combined Store Share
% Green Flag Red Flag 1 % 9 20 30%
Competitor NameCompetitor Category
Distance from focal
depotIncluded in
filters Top 10 Top 5
Price match % (pre-
acquisiton)
Price match % (post-
acquisiton)
Appears in ECP's 2015 promotion
dataNo.
responses ScorePseudo Score S01 Q16 Q17 Q18 Q27
Q29 Y
Q29 N
Q29 DK
Wood Auto Factors Motor Factor 0.65 0 1 1 10 6 6 0 0 0 0 1 3 4 2
A-Z Motor Spares Motor Factor 0.99 1 1 1 10 2 2 0 0 0 0 0 2 4 4
LOW Kost Motor Parts Motor Factor 1.31 0 1 1 10 0 0 0 0 0 0 0 0 8 2
ECP Wakefield Motor Factor 1.66 1 1 1 10 25 25 7 2 5 0 7 1 1 0
HS Components Motor Factor 1.66 0 1 0 10 2 2 0 0 0 0 0 2 5 3
G B Automotive Components West Yorkshire Motor Factor 3.23 0 1 0 10 3 3 0 0 0 0 0 3 4 3
A M Specialist Exhaust Centre Specialist 3.43 0 1 1 10 7 7 0 0 0 0 1 4 4 1
Trust First Parts VM Dealer 3.88 0 0 0
Jaystock Motor Factor 4.69 1 0 0
Wilco Motor Spares Motor Factor 4.87 1 0 0
A-Z Motor Spares Motor Factor 5.49 1 0 0
AP Morley Motor Factor 5.54 1 0 0
AP Castleford Motor Factor 5.65 1 0 0
TPS VM Dealer 6.13 0 0 0
SAS Autoparts Motor Factor 6.57 1 0 0
Fleet Factors Motor Factor 6.57 1 0 0
M1 Motorparts Motor Factor 6.93 1 0 0
Wilco Motor Spares Motor Factor 6.93 1 0 0
ECP Leeds Cross Green Motor Factor 7.18 1 1 0 10 25 25 7 2 5 0 7 1 1 0
Bullseye Super Factors Motor Factor 7.31 1 0 0
Wilco Motor Spares Motor Factor 7.49 1 0 0
ECP Leeds Motor Factor 7.92 1 1 0 10 25 25 7 2 5 0 7 1 1 0
AP Leeds Motor Factor 8.46 1 0 0
GSF Motor Factor 8.57 1 0 0
Wilco Motor Spares Motor Factor 8.58 1 0 0
BMF Motor Factor 8.82 1 0 0
GSF Motor Factor 8.91 1 0 0
SDL Minorfern Motor Factor 9.28 0 0 0
ECP Barnsley Motor Factor 10.37 0 0 0
Wilco Motor Spares Motor Factor 10.46 0 0 0
AP Bramley Motor Factor 10.51 0 0 0
Yes Car Parts Motor Factor 10.86 0 0 0
GSF Motor Factor 11.21 0 0 0
Wilco Motor Spares Motor Factor 11.28 0 0 0
AP Wakefield
Competitor Details ECP Data Survey Responses
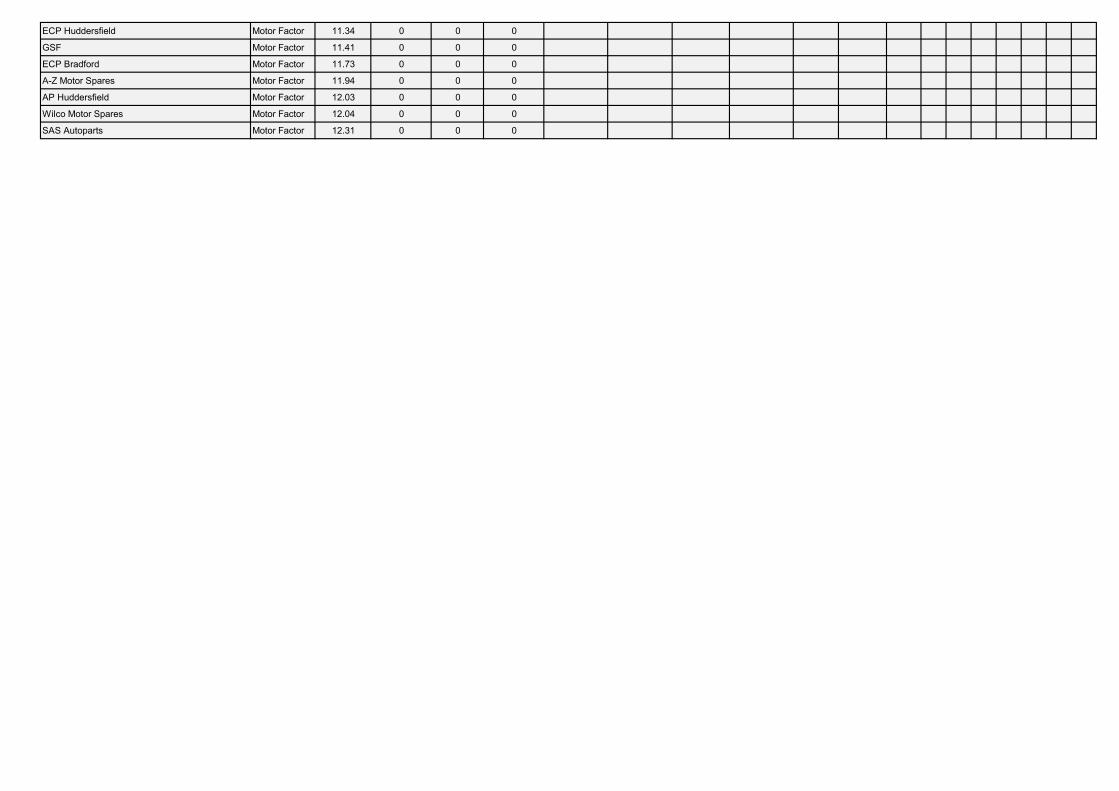
ECP Huddersfield Motor Factor 11.34 0 0 0
GSF Motor Factor 11.41 0 0 0
ECP Bradford Motor Factor 11.73 0 0 0
A-Z Motor Spares Motor Factor 11.94 0 0 0
AP Huddersfield Motor Factor 12.03 0 0 0
Wilco Motor Spares Motor Factor 12.04 0 0 0
SAS Autoparts Motor Factor 12.31 0 0 0
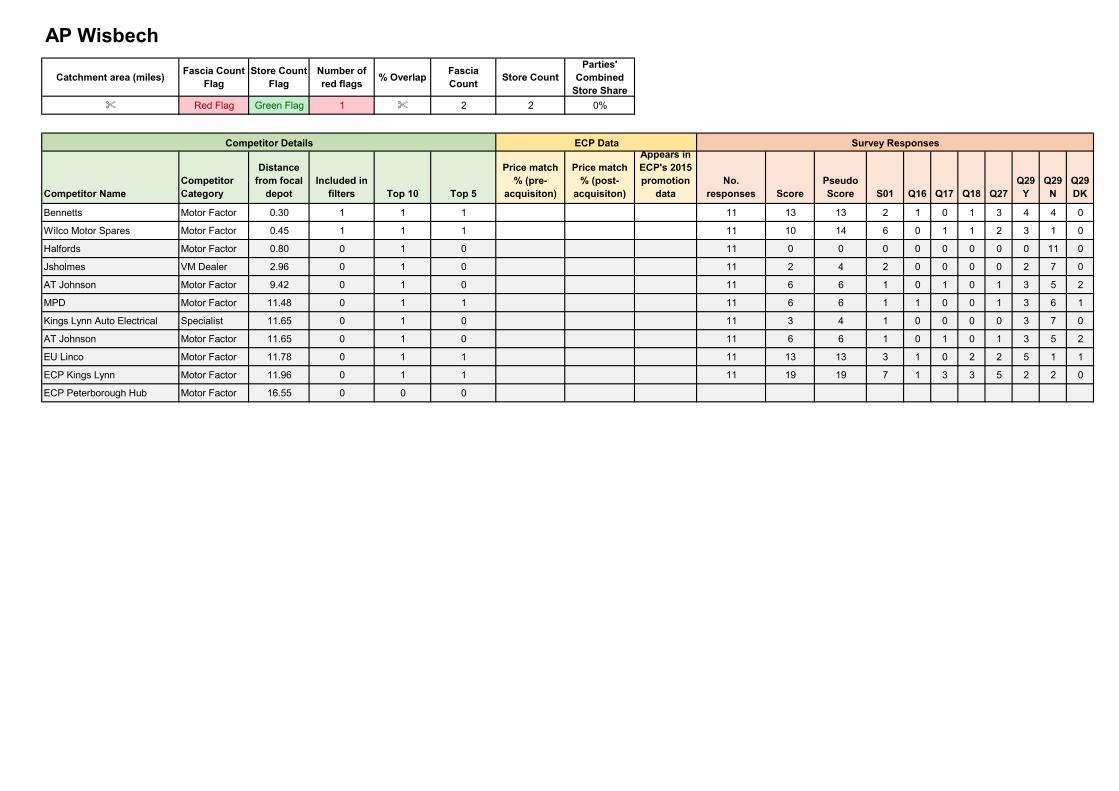
Catchment area (miles)Fascia Count
FlagStore Count
FlagNumber of red flags
% OverlapFascia Count
Store CountParties'
Combined Store Share
% Red Flag Green Flag 1 % 2 2 0%
Competitor NameCompetitor Category
Distance from focal
depotIncluded in
filters Top 10 Top 5
Price match % (pre-
acquisiton)
Price match % (post-
acquisiton)
Appears in ECP's 2015 promotion
dataNo.
responses ScorePseudo Score S01 Q16 Q17 Q18 Q27
Q29 Y
Q29 N
Q29 DK
Bennetts Motor Factor 0.30 1 1 1 11 13 13 2 1 0 1 3 4 4 0
Wilco Motor Spares Motor Factor 0.45 1 1 1 11 10 14 6 0 1 1 2 3 1 0
Halfords Motor Factor 0.80 0 1 0 11 0 0 0 0 0 0 0 0 11 0
Jsholmes VM Dealer 2.96 0 1 0 11 2 4 2 0 0 0 0 2 7 0
AT Johnson Motor Factor 9.42 0 1 0 11 6 6 1 0 1 0 1 3 5 2
MPD Motor Factor 11.48 0 1 1 11 6 6 1 1 0 0 1 3 6 1
Kings Lynn Auto Electrical Specialist 11.65 0 1 0 11 3 4 1 0 0 0 0 3 7 0
AT Johnson Motor Factor 11.65 0 1 0 11 6 6 1 0 1 0 1 3 5 2
EU Linco Motor Factor 11.78 0 1 1 11 13 13 3 1 0 2 2 5 1 1
ECP Kings Lynn Motor Factor 11.96 0 1 1 11 19 19 7 1 3 3 5 2 2 0
ECP Peterborough Hub Motor Factor 16.55 0 0 0
AP Wisbech
Competitor Details ECP Data Survey Responses
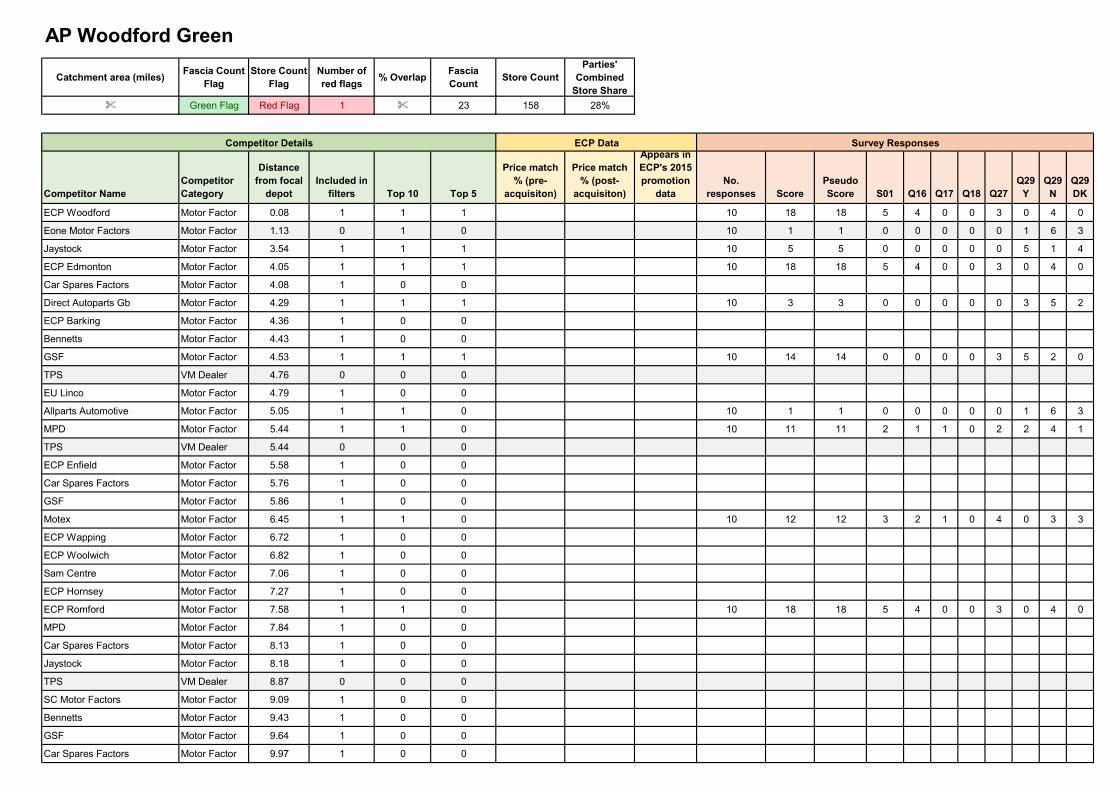
Catchment area (miles)Fascia Count
FlagStore Count
FlagNumber of red flags
% OverlapFascia Count
Store CountParties'
Combined Store Share
% Green Flag Red Flag 1 % 23 158 28%
Competitor NameCompetitor Category
Distance from focal
depotIncluded in
filters Top 10 Top 5
Price match % (pre-
acquisiton)
Price match % (post-
acquisiton)
Appears in ECP's 2015 promotion
dataNo.
responses ScorePseudo Score S01 Q16 Q17 Q18 Q27
Q29 Y
Q29 N
Q29 DK
ECP Woodford Motor Factor 0.08 1 1 1 10 18 18 5 4 0 0 3 0 4 0
Eone Motor Factors Motor Factor 1.13 0 1 0 10 1 1 0 0 0 0 0 1 6 3
Jaystock Motor Factor 3.54 1 1 1 10 5 5 0 0 0 0 0 5 1 4
ECP Edmonton Motor Factor 4.05 1 1 1 10 18 18 5 4 0 0 3 0 4 0
Car Spares Factors Motor Factor 4.08 1 0 0
Direct Autoparts Gb Motor Factor 4.29 1 1 1 10 3 3 0 0 0 0 0 3 5 2
ECP Barking Motor Factor 4.36 1 0 0
Bennetts Motor Factor 4.43 1 0 0
GSF Motor Factor 4.53 1 1 1 10 14 14 0 0 0 0 3 5 2 0
TPS VM Dealer 4.76 0 0 0
EU Linco Motor Factor 4.79 1 0 0
Allparts Automotive Motor Factor 5.05 1 1 0 10 1 1 0 0 0 0 0 1 6 3
MPD Motor Factor 5.44 1 1 0 10 11 11 2 1 1 0 2 2 4 1
TPS VM Dealer 5.44 0 0 0
ECP Enfield Motor Factor 5.58 1 0 0
Car Spares Factors Motor Factor 5.76 1 0 0
GSF Motor Factor 5.86 1 0 0
Motex Motor Factor 6.45 1 1 0 10 12 12 3 2 1 0 4 0 3 3
ECP Wapping Motor Factor 6.72 1 0 0
ECP Woolwich Motor Factor 6.82 1 0 0
Sam Centre Motor Factor 7.06 1 0 0
ECP Hornsey Motor Factor 7.27 1 0 0
ECP Romford Motor Factor 7.58 1 1 0 10 18 18 5 4 0 0 3 0 4 0
MPD Motor Factor 7.84 1 0 0
Car Spares Factors Motor Factor 8.13 1 0 0
Jaystock Motor Factor 8.18 1 0 0
TPS VM Dealer 8.87 0 0 0
SC Motor Factors Motor Factor 9.09 1 0 0
Bennetts Motor Factor 9.43 1 0 0
GSF Motor Factor 9.64 1 0 0
Car Spares Factors Motor Factor 9.97 1 0 0
AP Woodford Green
Competitor Details ECP Data Survey Responses
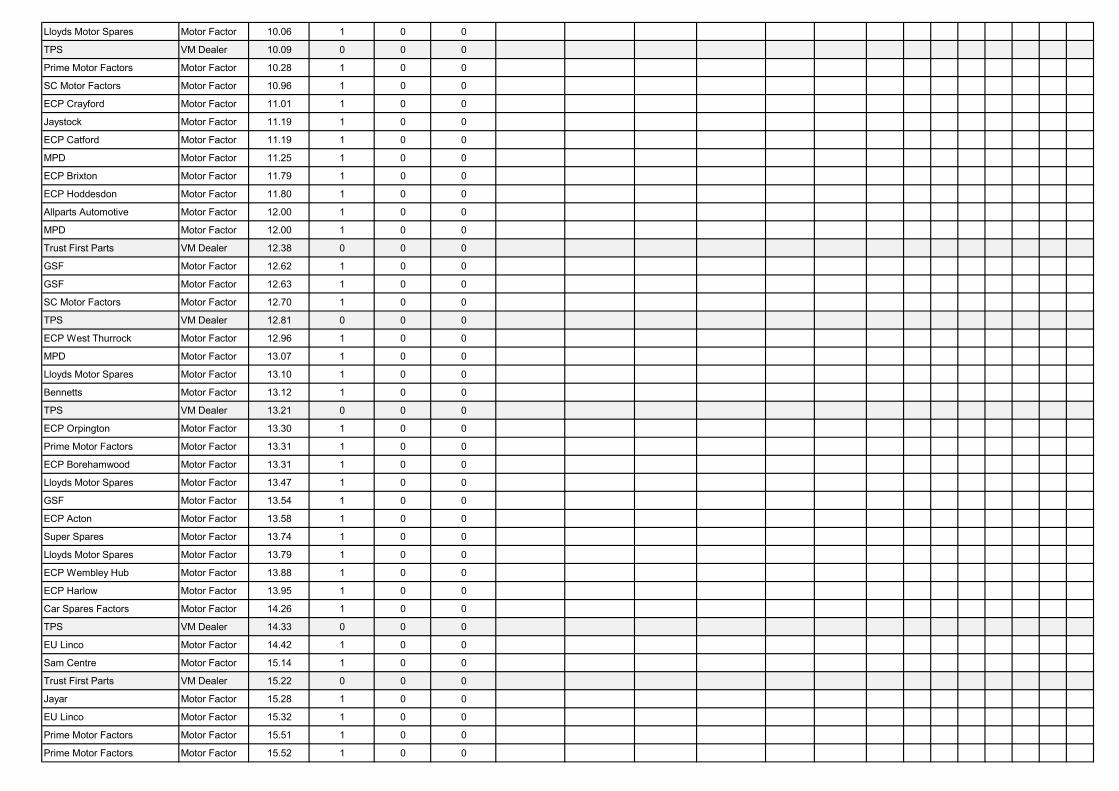
Lloyds Motor Spares Motor Factor 10.06 1 0 0
TPS VM Dealer 10.09 0 0 0
Prime Motor Factors Motor Factor 10.28 1 0 0
SC Motor Factors Motor Factor 10.96 1 0 0
ECP Crayford Motor Factor 11.01 1 0 0
Jaystock Motor Factor 11.19 1 0 0
ECP Catford Motor Factor 11.19 1 0 0
MPD Motor Factor 11.25 1 0 0
ECP Brixton Motor Factor 11.79 1 0 0
ECP Hoddesdon Motor Factor 11.80 1 0 0
Allparts Automotive Motor Factor 12.00 1 0 0
MPD Motor Factor 12.00 1 0 0
Trust First Parts VM Dealer 12.38 0 0 0
GSF Motor Factor 12.62 1 0 0
GSF Motor Factor 12.63 1 0 0
SC Motor Factors Motor Factor 12.70 1 0 0
TPS VM Dealer 12.81 0 0 0
ECP West Thurrock Motor Factor 12.96 1 0 0
MPD Motor Factor 13.07 1 0 0
Lloyds Motor Spares Motor Factor 13.10 1 0 0
Bennetts Motor Factor 13.12 1 0 0
TPS VM Dealer 13.21 0 0 0
ECP Orpington Motor Factor 13.30 1 0 0
Prime Motor Factors Motor Factor 13.31 1 0 0
ECP Borehamwood Motor Factor 13.31 1 0 0
Lloyds Motor Spares Motor Factor 13.47 1 0 0
GSF Motor Factor 13.54 1 0 0
ECP Acton Motor Factor 13.58 1 0 0
Super Spares Motor Factor 13.74 1 0 0
Lloyds Motor Spares Motor Factor 13.79 1 0 0
ECP Wembley Hub Motor Factor 13.88 1 0 0
ECP Harlow Motor Factor 13.95 1 0 0
Car Spares Factors Motor Factor 14.26 1 0 0
TPS VM Dealer 14.33 0 0 0
EU Linco Motor Factor 14.42 1 0 0
Sam Centre Motor Factor 15.14 1 0 0
Trust First Parts VM Dealer 15.22 0 0 0
Jayar Motor Factor 15.28 1 0 0
EU Linco Motor Factor 15.32 1 0 0
Prime Motor Factors Motor Factor 15.51 1 0 0
Prime Motor Factors Motor Factor 15.52 1 0 0
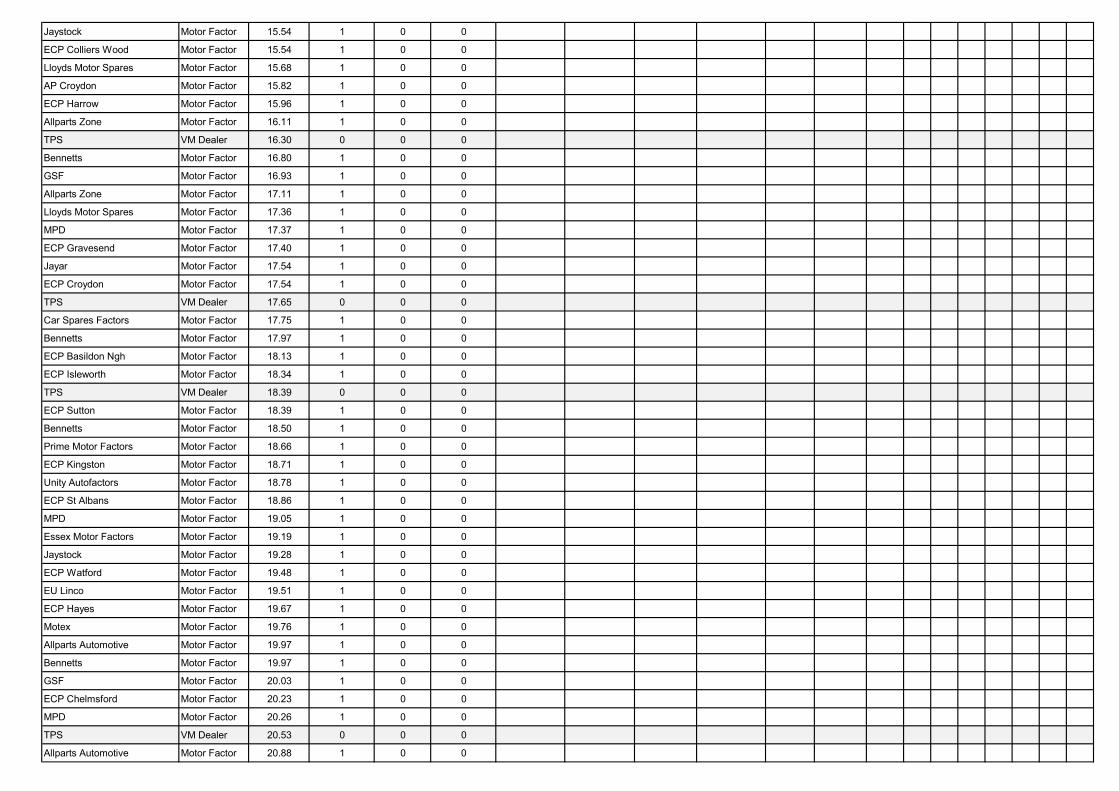
Jaystock Motor Factor 15.54 1 0 0
ECP Colliers Wood Motor Factor 15.54 1 0 0
Lloyds Motor Spares Motor Factor 15.68 1 0 0
AP Croydon Motor Factor 15.82 1 0 0
ECP Harrow Motor Factor 15.96 1 0 0
Allparts Zone Motor Factor 16.11 1 0 0
TPS VM Dealer 16.30 0 0 0
Bennetts Motor Factor 16.80 1 0 0
GSF Motor Factor 16.93 1 0 0
Allparts Zone Motor Factor 17.11 1 0 0
Lloyds Motor Spares Motor Factor 17.36 1 0 0
MPD Motor Factor 17.37 1 0 0
ECP Gravesend Motor Factor 17.40 1 0 0
Jayar Motor Factor 17.54 1 0 0
ECP Croydon Motor Factor 17.54 1 0 0
TPS VM Dealer 17.65 0 0 0
Car Spares Factors Motor Factor 17.75 1 0 0
Bennetts Motor Factor 17.97 1 0 0
ECP Basildon Ngh Motor Factor 18.13 1 0 0
ECP Isleworth Motor Factor 18.34 1 0 0
TPS VM Dealer 18.39 0 0 0
ECP Sutton Motor Factor 18.39 1 0 0
Bennetts Motor Factor 18.50 1 0 0
Prime Motor Factors Motor Factor 18.66 1 0 0
ECP Kingston Motor Factor 18.71 1 0 0
Unity Autofactors Motor Factor 18.78 1 0 0
ECP St Albans Motor Factor 18.86 1 0 0
MPD Motor Factor 19.05 1 0 0
Essex Motor Factors Motor Factor 19.19 1 0 0
Jaystock Motor Factor 19.28 1 0 0
ECP Watford Motor Factor 19.48 1 0 0
EU Linco Motor Factor 19.51 1 0 0
ECP Hayes Motor Factor 19.67 1 0 0
Motex Motor Factor 19.76 1 0 0
Allparts Automotive Motor Factor 19.97 1 0 0
Bennetts Motor Factor 19.97 1 0 0
GSF Motor Factor 20.03 1 0 0
ECP Chelmsford Motor Factor 20.23 1 0 0
MPD Motor Factor 20.26 1 0 0
TPS VM Dealer 20.53 0 0 0
Allparts Automotive Motor Factor 20.88 1 0 0
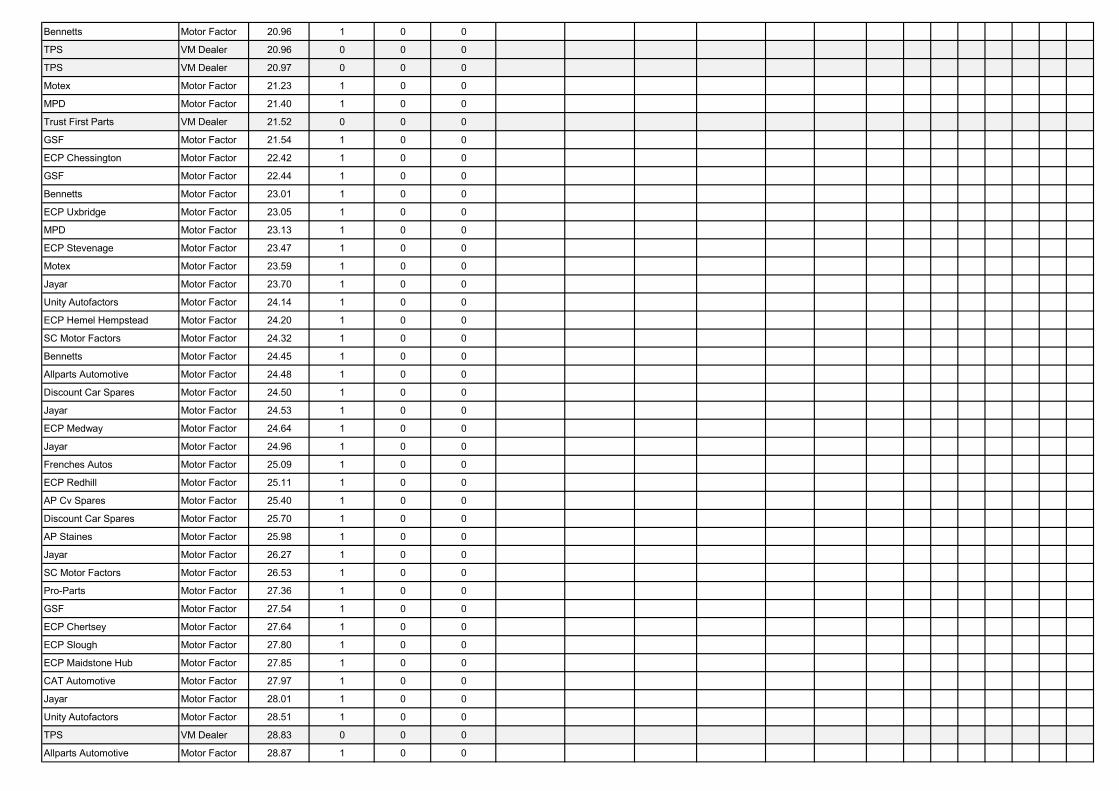
Bennetts Motor Factor 20.96 1 0 0
TPS VM Dealer 20.96 0 0 0
TPS VM Dealer 20.97 0 0 0
Motex Motor Factor 21.23 1 0 0
MPD Motor Factor 21.40 1 0 0
Trust First Parts VM Dealer 21.52 0 0 0
GSF Motor Factor 21.54 1 0 0
ECP Chessington Motor Factor 22.42 1 0 0
GSF Motor Factor 22.44 1 0 0
Bennetts Motor Factor 23.01 1 0 0
ECP Uxbridge Motor Factor 23.05 1 0 0
MPD Motor Factor 23.13 1 0 0
ECP Stevenage Motor Factor 23.47 1 0 0
Motex Motor Factor 23.59 1 0 0
Jayar Motor Factor 23.70 1 0 0
Unity Autofactors Motor Factor 24.14 1 0 0
ECP Hemel Hempstead Motor Factor 24.20 1 0 0
SC Motor Factors Motor Factor 24.32 1 0 0
Bennetts Motor Factor 24.45 1 0 0
Allparts Automotive Motor Factor 24.48 1 0 0
Discount Car Spares Motor Factor 24.50 1 0 0
Jayar Motor Factor 24.53 1 0 0
ECP Medway Motor Factor 24.64 1 0 0
Jayar Motor Factor 24.96 1 0 0
Frenches Autos Motor Factor 25.09 1 0 0
ECP Redhill Motor Factor 25.11 1 0 0
AP Cv Spares Motor Factor 25.40 1 0 0
Discount Car Spares Motor Factor 25.70 1 0 0
AP Staines Motor Factor 25.98 1 0 0
Jayar Motor Factor 26.27 1 0 0
SC Motor Factors Motor Factor 26.53 1 0 0
Pro-Parts Motor Factor 27.36 1 0 0
GSF Motor Factor 27.54 1 0 0
ECP Chertsey Motor Factor 27.64 1 0 0
ECP Slough Motor Factor 27.80 1 0 0
ECP Maidstone Hub Motor Factor 27.85 1 0 0
CAT Automotive Motor Factor 27.97 1 0 0
Jayar Motor Factor 28.01 1 0 0
Unity Autofactors Motor Factor 28.51 1 0 0
TPS VM Dealer 28.83 0 0 0
Allparts Automotive Motor Factor 28.87 1 0 0
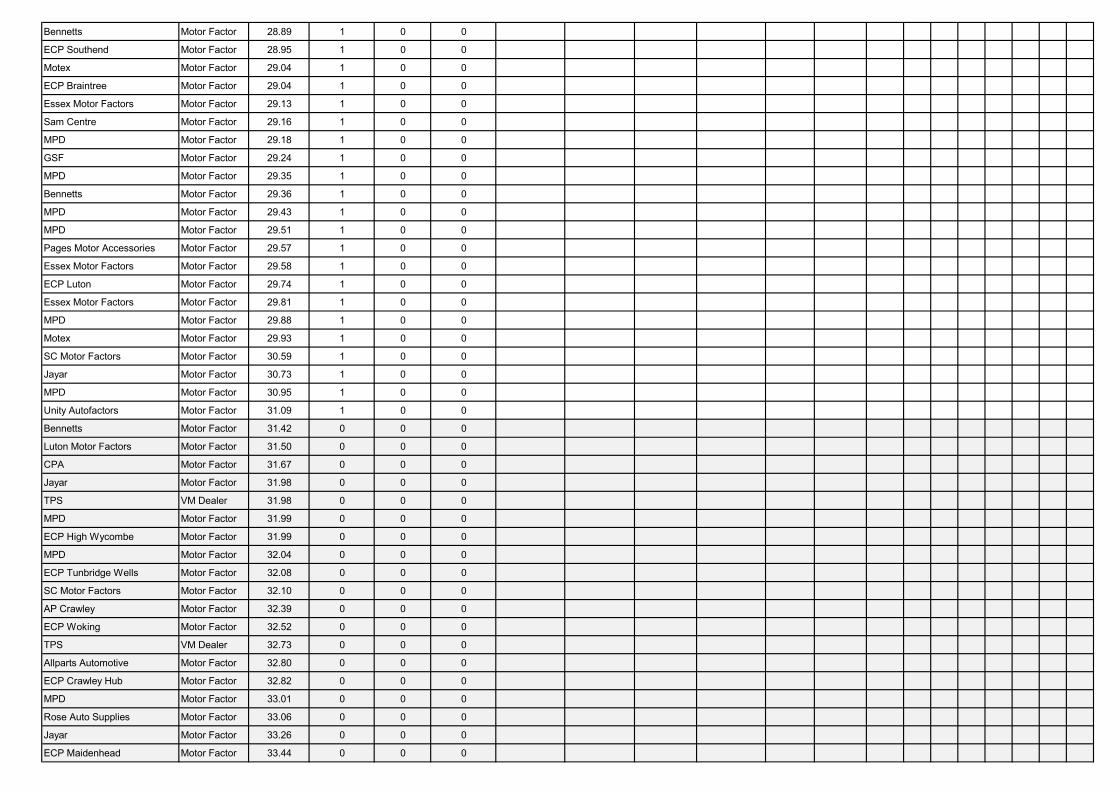
Bennetts Motor Factor 28.89 1 0 0
ECP Southend Motor Factor 28.95 1 0 0
Motex Motor Factor 29.04 1 0 0
ECP Braintree Motor Factor 29.04 1 0 0
Essex Motor Factors Motor Factor 29.13 1 0 0
Sam Centre Motor Factor 29.16 1 0 0
MPD Motor Factor 29.18 1 0 0
GSF Motor Factor 29.24 1 0 0
MPD Motor Factor 29.35 1 0 0
Bennetts Motor Factor 29.36 1 0 0
MPD Motor Factor 29.43 1 0 0
MPD Motor Factor 29.51 1 0 0
Pages Motor Accessories Motor Factor 29.57 1 0 0
Essex Motor Factors Motor Factor 29.58 1 0 0
ECP Luton Motor Factor 29.74 1 0 0
Essex Motor Factors Motor Factor 29.81 1 0 0
MPD Motor Factor 29.88 1 0 0
Motex Motor Factor 29.93 1 0 0
SC Motor Factors Motor Factor 30.59 1 0 0
Jayar Motor Factor 30.73 1 0 0
MPD Motor Factor 30.95 1 0 0
Unity Autofactors Motor Factor 31.09 1 0 0
Bennetts Motor Factor 31.42 0 0 0
Luton Motor Factors Motor Factor 31.50 0 0 0
CPA Motor Factor 31.67 0 0 0
Jayar Motor Factor 31.98 0 0 0
TPS VM Dealer 31.98 0 0 0
MPD Motor Factor 31.99 0 0 0
ECP High Wycombe Motor Factor 31.99 0 0 0
MPD Motor Factor 32.04 0 0 0
ECP Tunbridge Wells Motor Factor 32.08 0 0 0
SC Motor Factors Motor Factor 32.10 0 0 0
AP Crawley Motor Factor 32.39 0 0 0
ECP Woking Motor Factor 32.52 0 0 0
TPS VM Dealer 32.73 0 0 0
Allparts Automotive Motor Factor 32.80 0 0 0
ECP Crawley Hub Motor Factor 32.82 0 0 0
MPD Motor Factor 33.01 0 0 0
Rose Auto Supplies Motor Factor 33.06 0 0 0
Jayar Motor Factor 33.26 0 0 0
ECP Maidenhead Motor Factor 33.44 0 0 0
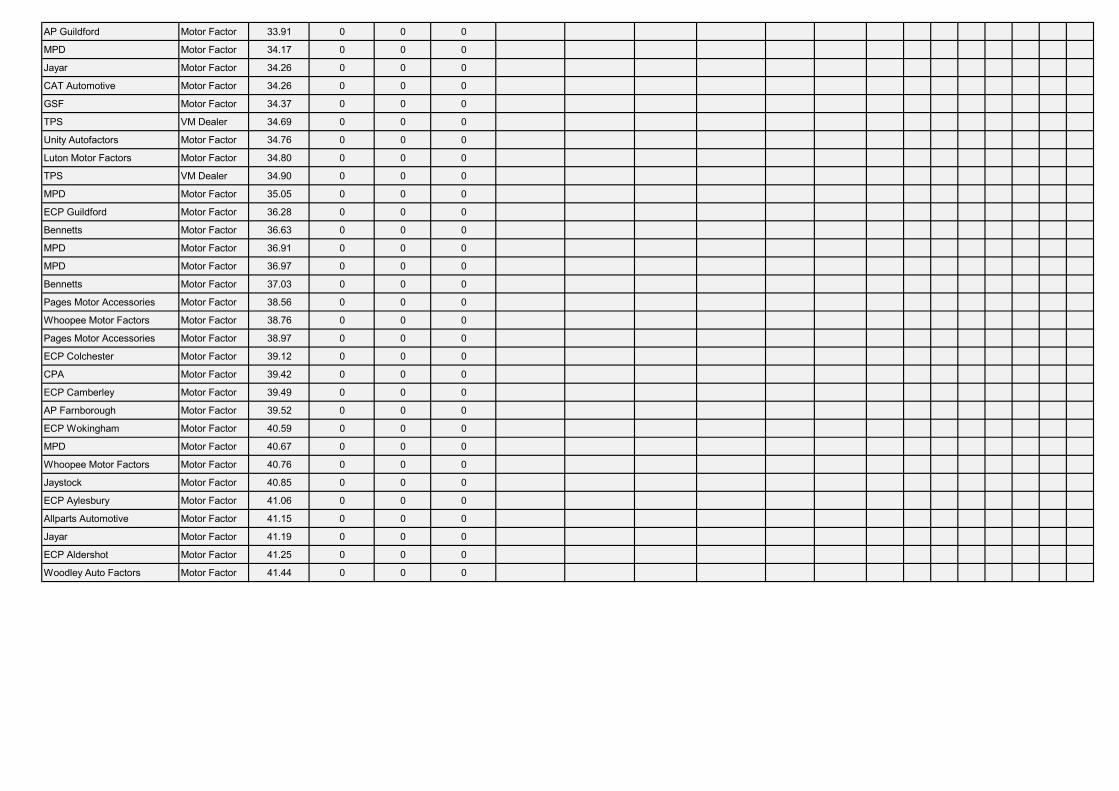
AP Guildford Motor Factor 33.91 0 0 0
MPD Motor Factor 34.17 0 0 0
Jayar Motor Factor 34.26 0 0 0
CAT Automotive Motor Factor 34.26 0 0 0
GSF Motor Factor 34.37 0 0 0
TPS VM Dealer 34.69 0 0 0
Unity Autofactors Motor Factor 34.76 0 0 0
Luton Motor Factors Motor Factor 34.80 0 0 0
TPS VM Dealer 34.90 0 0 0
MPD Motor Factor 35.05 0 0 0
ECP Guildford Motor Factor 36.28 0 0 0
Bennetts Motor Factor 36.63 0 0 0
MPD Motor Factor 36.91 0 0 0
MPD Motor Factor 36.97 0 0 0
Bennetts Motor Factor 37.03 0 0 0
Pages Motor Accessories Motor Factor 38.56 0 0 0
Whoopee Motor Factors Motor Factor 38.76 0 0 0
Pages Motor Accessories Motor Factor 38.97 0 0 0
ECP Colchester Motor Factor 39.12 0 0 0
CPA Motor Factor 39.42 0 0 0
ECP Camberley Motor Factor 39.49 0 0 0
AP Farnborough Motor Factor 39.52 0 0 0
ECP Wokingham Motor Factor 40.59 0 0 0
MPD Motor Factor 40.67 0 0 0
Whoopee Motor Factors Motor Factor 40.76 0 0 0
Jaystock Motor Factor 40.85 0 0 0
ECP Aylesbury Motor Factor 41.06 0 0 0
Allparts Automotive Motor Factor 41.15 0 0 0
Jayar Motor Factor 41.19 0 0 0
ECP Aldershot Motor Factor 41.25 0 0 0
Woodley Auto Factors Motor Factor 41.44 0 0 0
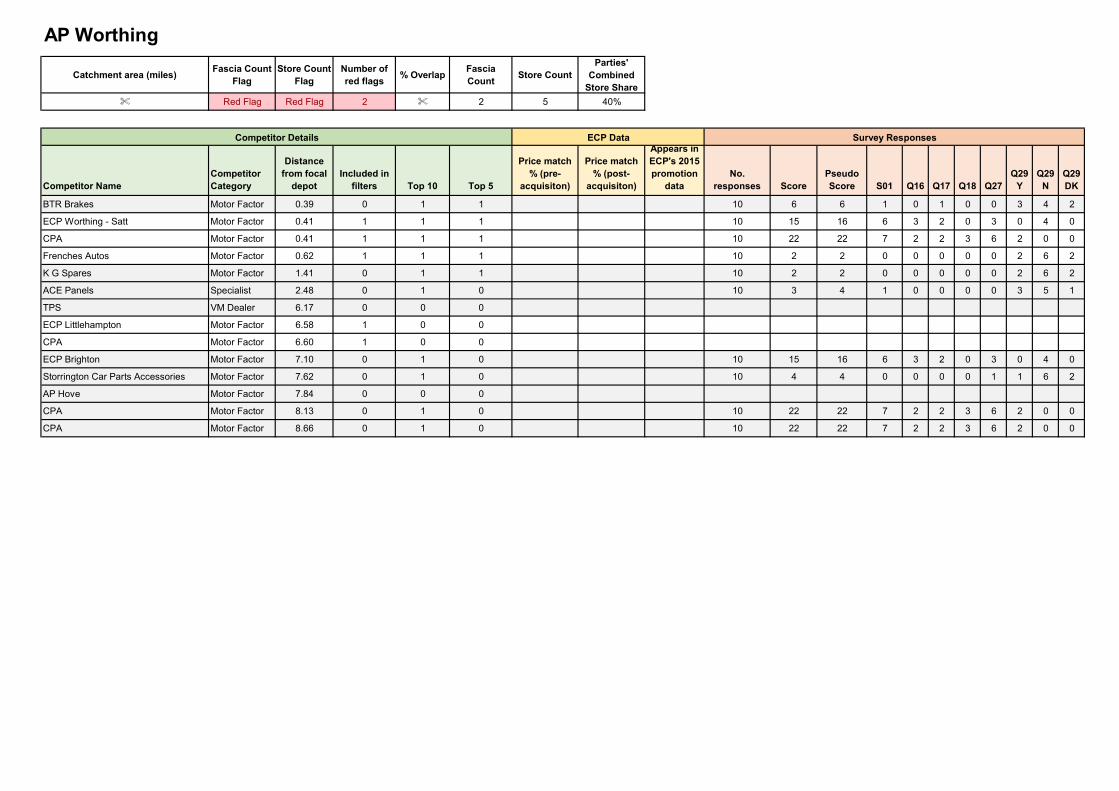
Catchment area (miles)Fascia Count
FlagStore Count
FlagNumber of red flags
% OverlapFascia Count
Store CountParties'
Combined Store Share
% Red Flag Red Flag 2 % 2 5 40%
Competitor NameCompetitor Category
Distance from focal
depotIncluded in
filters Top 10 Top 5
Price match % (pre-
acquisiton)
Price match % (post-
acquisiton)
Appears in ECP's 2015 promotion
dataNo.
responses ScorePseudo Score S01 Q16 Q17 Q18 Q27
Q29 Y
Q29 N
Q29 DK
BTR Brakes Motor Factor 0.39 0 1 1 10 6 6 1 0 1 0 0 3 4 2
ECP Worthing - Satt Motor Factor 0.41 1 1 1 10 15 16 6 3 2 0 3 0 4 0
CPA Motor Factor 0.41 1 1 1 10 22 22 7 2 2 3 6 2 0 0
Frenches Autos Motor Factor 0.62 1 1 1 10 2 2 0 0 0 0 0 2 6 2
K G Spares Motor Factor 1.41 0 1 1 10 2 2 0 0 0 0 0 2 6 2
ACE Panels Specialist 2.48 0 1 0 10 3 4 1 0 0 0 0 3 5 1
TPS VM Dealer 6.17 0 0 0
ECP Littlehampton Motor Factor 6.58 1 0 0
CPA Motor Factor 6.60 1 0 0
ECP Brighton Motor Factor 7.10 0 1 0 10 15 16 6 3 2 0 3 0 4 0
Storrington Car Parts Accessories Motor Factor 7.62 0 1 0 10 4 4 0 0 0 0 1 1 6 2
AP Hove Motor Factor 7.84 0 0 0
CPA Motor Factor 8.13 0 1 0 10 22 22 7 2 2 3 6 2 0 0
CPA Motor Factor 8.66 0 1 0 10 22 22 7 2 2 3 6 2 0 0
AP Worthing
Competitor Details ECP Data Survey Responses
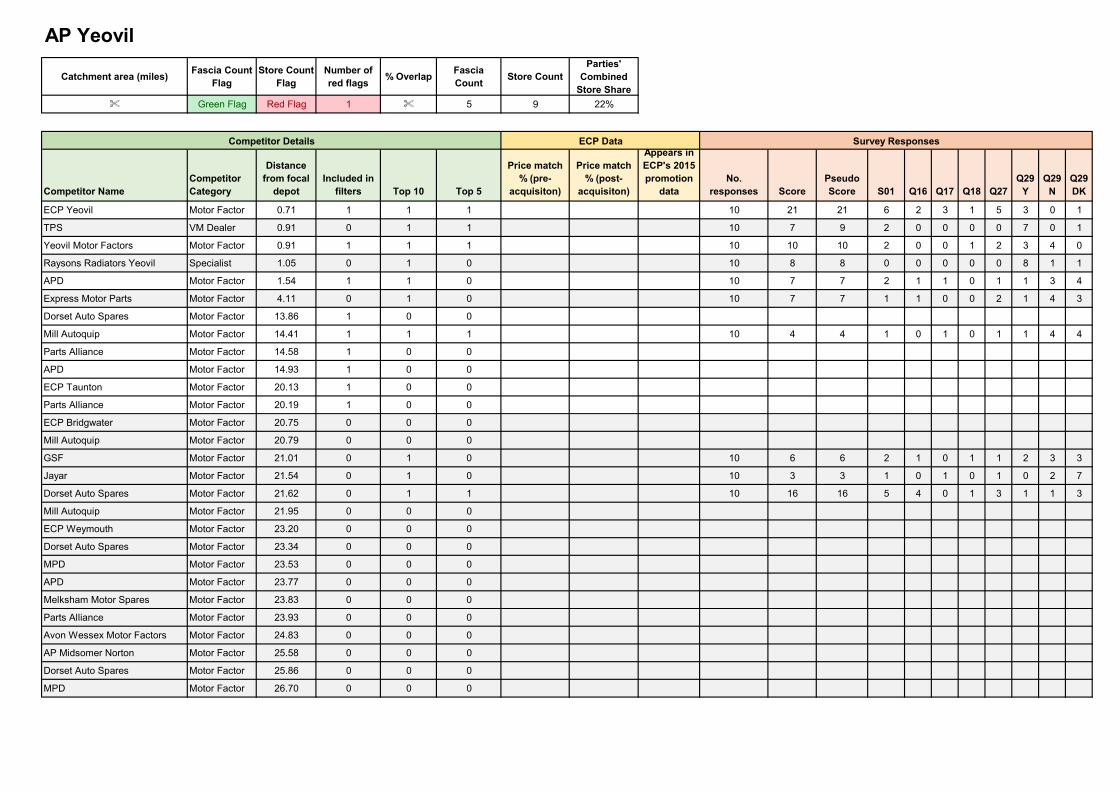
Catchment area (miles)Fascia Count
FlagStore Count
FlagNumber of red flags
% OverlapFascia Count
Store CountParties'
Combined Store Share
% Green Flag Red Flag 1 % 5 9 22%
Competitor NameCompetitor Category
Distance from focal
depotIncluded in
filters Top 10 Top 5
Price match % (pre-
acquisiton)
Price match % (post-
acquisiton)
Appears in ECP's 2015 promotion
dataNo.
responses ScorePseudo Score S01 Q16 Q17 Q18 Q27
Q29 Y
Q29 N
Q29 DK
ECP Yeovil Motor Factor 0.71 1 1 1 10 21 21 6 2 3 1 5 3 0 1
TPS VM Dealer 0.91 0 1 1 10 7 9 2 0 0 0 0 7 0 1
Yeovil Motor Factors Motor Factor 0.91 1 1 1 10 10 10 2 0 0 1 2 3 4 0
Raysons Radiators Yeovil Specialist 1.05 0 1 0 10 8 8 0 0 0 0 0 8 1 1
APD Motor Factor 1.54 1 1 0 10 7 7 2 1 1 0 1 1 3 4
Express Motor Parts Motor Factor 4.11 0 1 0 10 7 7 1 1 0 0 2 1 4 3
Dorset Auto Spares Motor Factor 13.86 1 0 0
Mill Autoquip Motor Factor 14.41 1 1 1 10 4 4 1 0 1 0 1 1 4 4
Parts Alliance Motor Factor 14.58 1 0 0
APD Motor Factor 14.93 1 0 0
ECP Taunton Motor Factor 20.13 1 0 0
Parts Alliance Motor Factor 20.19 1 0 0
ECP Bridgwater Motor Factor 20.75 0 0 0
Mill Autoquip Motor Factor 20.79 0 0 0
GSF Motor Factor 21.01 0 1 0 10 6 6 2 1 0 1 1 2 3 3
Jayar Motor Factor 21.54 0 1 0 10 3 3 1 0 1 0 1 0 2 7
Dorset Auto Spares Motor Factor 21.62 0 1 1 10 16 16 5 4 0 1 3 1 1 3
Mill Autoquip Motor Factor 21.95 0 0 0
ECP Weymouth Motor Factor 23.20 0 0 0
Dorset Auto Spares Motor Factor 23.34 0 0 0
MPD Motor Factor 23.53 0 0 0
APD Motor Factor 23.77 0 0 0
Melksham Motor Spares Motor Factor 23.83 0 0 0
Parts Alliance Motor Factor 23.93 0 0 0
Avon Wessex Motor Factors Motor Factor 24.83 0 0 0
AP Midsomer Norton Motor Factor 25.58 0 0 0
Dorset Auto Spares Motor Factor 25.86 0 0 0
MPD Motor Factor 26.70 0 0 0
AP Yeovil
Competitor Details ECP Data Survey Responses
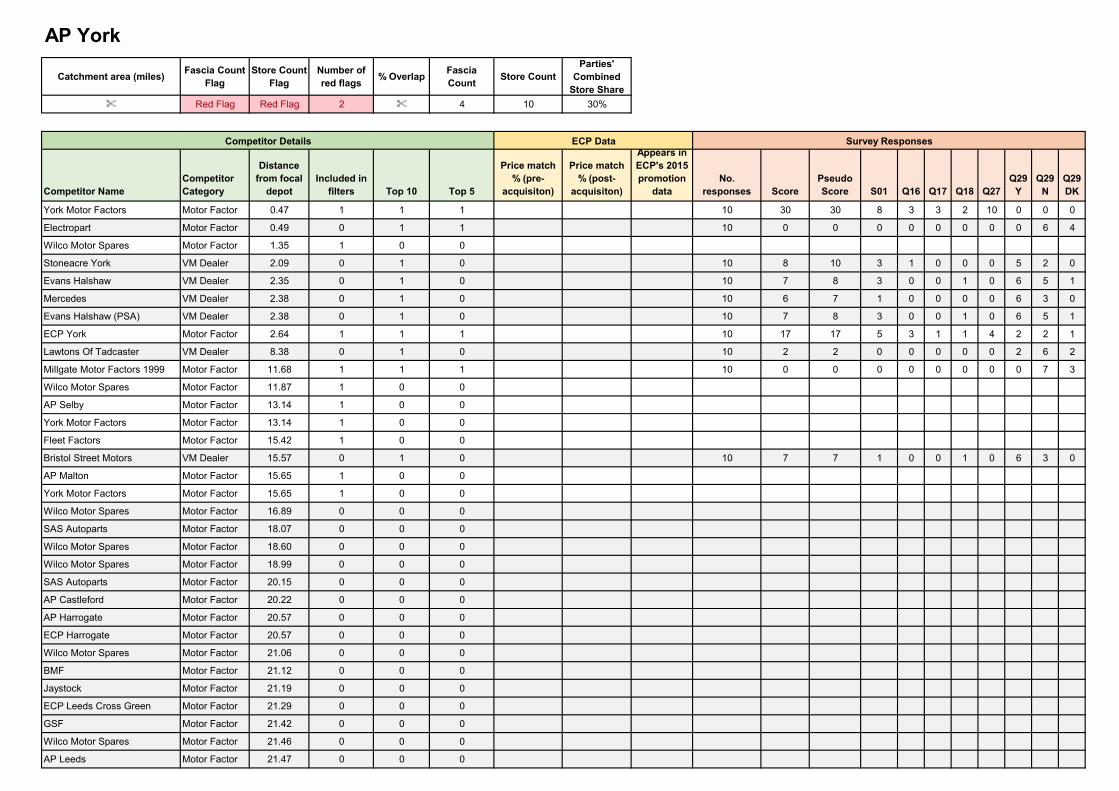
Catchment area (miles)Fascia Count
FlagStore Count
FlagNumber of red flags
% OverlapFascia Count
Store CountParties'
Combined Store Share
% Red Flag Red Flag 2 % 4 10 30%
Competitor NameCompetitor Category
Distance from focal
depotIncluded in
filters Top 10 Top 5
Price match % (pre-
acquisiton)
Price match % (post-
acquisiton)
Appears in ECP's 2015 promotion
dataNo.
responses ScorePseudo Score S01 Q16 Q17 Q18 Q27
Q29 Y
Q29 N
Q29 DK
York Motor Factors Motor Factor 0.47 1 1 1 10 30 30 8 3 3 2 10 0 0 0
Electropart Motor Factor 0.49 0 1 1 10 0 0 0 0 0 0 0 0 6 4
Wilco Motor Spares Motor Factor 1.35 1 0 0
Stoneacre York VM Dealer 2.09 0 1 0 10 8 10 3 1 0 0 0 5 2 0
Evans Halshaw VM Dealer 2.35 0 1 0 10 7 8 3 0 0 1 0 6 5 1
Mercedes VM Dealer 2.38 0 1 0 10 6 7 1 0 0 0 0 6 3 0
Evans Halshaw (PSA) VM Dealer 2.38 0 1 0 10 7 8 3 0 0 1 0 6 5 1
ECP York Motor Factor 2.64 1 1 1 10 17 17 5 3 1 1 4 2 2 1
Lawtons Of Tadcaster VM Dealer 8.38 0 1 0 10 2 2 0 0 0 0 0 2 6 2
Millgate Motor Factors 1999 Motor Factor 11.68 1 1 1 10 0 0 0 0 0 0 0 0 7 3
Wilco Motor Spares Motor Factor 11.87 1 0 0
AP Selby Motor Factor 13.14 1 0 0
York Motor Factors Motor Factor 13.14 1 0 0
Fleet Factors Motor Factor 15.42 1 0 0
Bristol Street Motors VM Dealer 15.57 0 1 0 10 7 7 1 0 0 1 0 6 3 0
AP Malton Motor Factor 15.65 1 0 0
York Motor Factors Motor Factor 15.65 1 0 0
Wilco Motor Spares Motor Factor 16.89 0 0 0
SAS Autoparts Motor Factor 18.07 0 0 0
Wilco Motor Spares Motor Factor 18.60 0 0 0
Wilco Motor Spares Motor Factor 18.99 0 0 0
SAS Autoparts Motor Factor 20.15 0 0 0
AP Castleford Motor Factor 20.22 0 0 0
AP Harrogate Motor Factor 20.57 0 0 0
ECP Harrogate Motor Factor 20.57 0 0 0
Wilco Motor Spares Motor Factor 21.06 0 0 0
BMF Motor Factor 21.12 0 0 0
Jaystock Motor Factor 21.19 0 0 0
ECP Leeds Cross Green Motor Factor 21.29 0 0 0
GSF Motor Factor 21.42 0 0 0
Wilco Motor Spares Motor Factor 21.46 0 0 0
AP Leeds Motor Factor 21.47 0 0 0
AP York
Competitor Details ECP Data Survey Responses

AP Thirsk Motor Factor 21.78 0 0 0
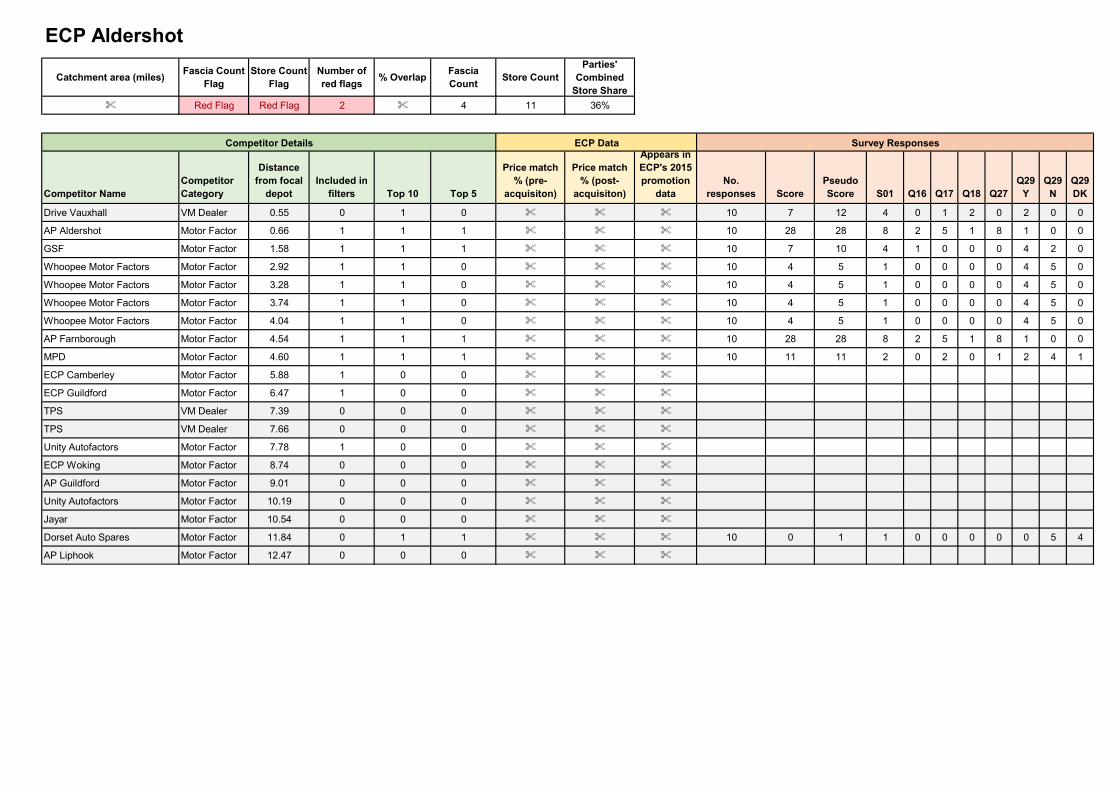
Catchment area (miles)Fascia Count
FlagStore Count
FlagNumber of red flags
% OverlapFascia Count
Store CountParties'
Combined Store Share
% Red Flag Red Flag 2 % 4 11 36%
Competitor NameCompetitor Category
Distance from focal
depotIncluded in
filters Top 10 Top 5
Price match % (pre-
acquisiton)
Price match % (post-
acquisiton)
Appears in ECP's 2015 promotion
dataNo.
responses ScorePseudo Score S01 Q16 Q17 Q18 Q27
Q29 Y
Q29 N
Q29 DK
Drive Vauxhall VM Dealer 0.55 0 1 0 % % % 10 7 12 4 0 1 2 0 2 0 0
AP Aldershot Motor Factor 0.66 1 1 1 % % % 10 28 28 8 2 5 1 8 1 0 0
GSF Motor Factor 1.58 1 1 1 % % % 10 7 10 4 1 0 0 0 4 2 0
Whoopee Motor Factors Motor Factor 2.92 1 1 0 % % % 10 4 5 1 0 0 0 0 4 5 0
Whoopee Motor Factors Motor Factor 3.28 1 1 0 % % % 10 4 5 1 0 0 0 0 4 5 0
Whoopee Motor Factors Motor Factor 3.74 1 1 0 % % % 10 4 5 1 0 0 0 0 4 5 0
Whoopee Motor Factors Motor Factor 4.04 1 1 0 % % % 10 4 5 1 0 0 0 0 4 5 0
AP Farnborough Motor Factor 4.54 1 1 1 % % % 10 28 28 8 2 5 1 8 1 0 0
MPD Motor Factor 4.60 1 1 1 % % % 10 11 11 2 0 2 0 1 2 4 1
ECP Camberley Motor Factor 5.88 1 0 0 % % %
ECP Guildford Motor Factor 6.47 1 0 0 % % %
TPS VM Dealer 7.39 0 0 0 % % %
TPS VM Dealer 7.66 0 0 0 % % %
Unity Autofactors Motor Factor 7.78 1 0 0 % % %
ECP Woking Motor Factor 8.74 0 0 0 % % %
AP Guildford Motor Factor 9.01 0 0 0 % % %
Unity Autofactors Motor Factor 10.19 0 0 0 % % %
Jayar Motor Factor 10.54 0 0 0 % % %
Dorset Auto Spares Motor Factor 11.84 0 1 1 % % % 10 0 1 1 0 0 0 0 0 5 4
AP Liphook Motor Factor 12.47 0 0 0 % % %
ECP Aldershot
Competitor Details ECP Data Survey Responses
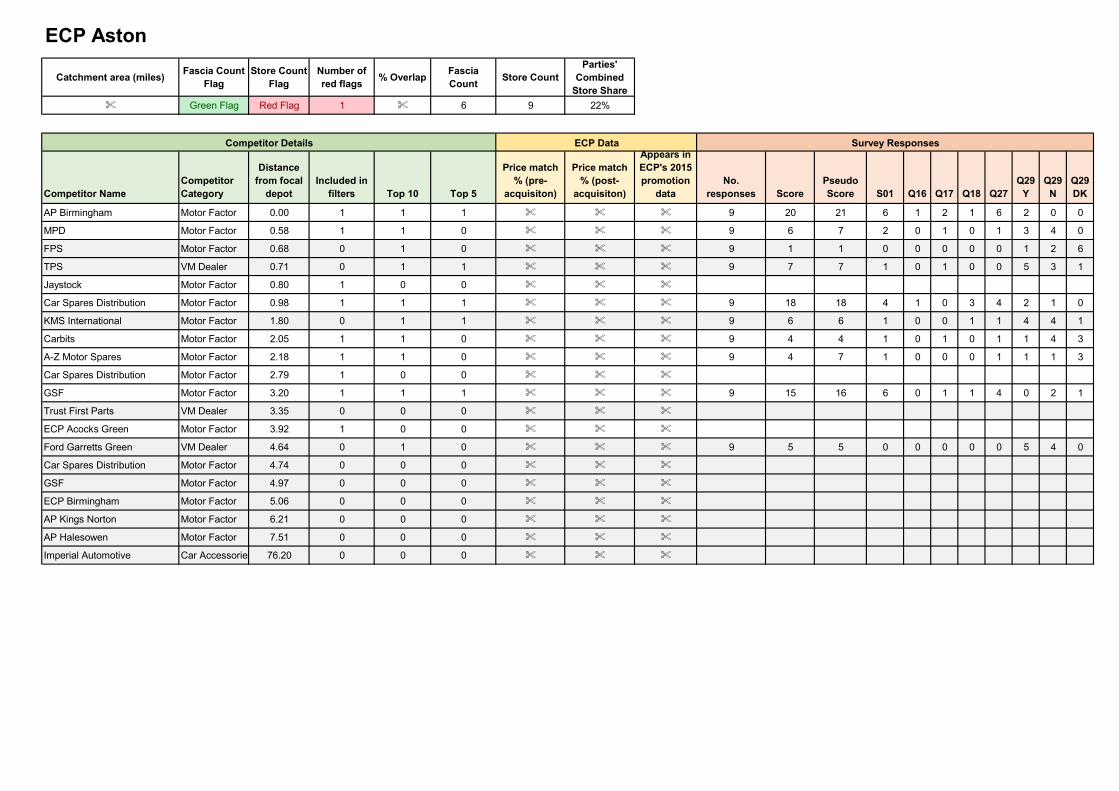
Catchment area (miles)Fascia Count
FlagStore Count
FlagNumber of red flags
% OverlapFascia Count
Store CountParties'
Combined Store Share
% Green Flag Red Flag 1 % 6 9 22%
Competitor NameCompetitor Category
Distance from focal
depotIncluded in
filters Top 10 Top 5
Price match % (pre-
acquisiton)
Price match % (post-
acquisiton)
Appears in ECP's 2015 promotion
dataNo.
responses ScorePseudo Score S01 Q16 Q17 Q18 Q27
Q29 Y
Q29 N
Q29 DK
AP Birmingham Motor Factor 0.00 1 1 1 % % % 9 20 21 6 1 2 1 6 2 0 0
MPD Motor Factor 0.58 1 1 0 % % % 9 6 7 2 0 1 0 1 3 4 0
FPS Motor Factor 0.68 0 1 0 % % % 9 1 1 0 0 0 0 0 1 2 6
TPS VM Dealer 0.71 0 1 1 % % % 9 7 7 1 0 1 0 0 5 3 1
Jaystock Motor Factor 0.80 1 0 0 % % %
Car Spares Distribution Motor Factor 0.98 1 1 1 % % % 9 18 18 4 1 0 3 4 2 1 0
KMS International Motor Factor 1.80 0 1 1 % % % 9 6 6 1 0 0 1 1 4 4 1
Carbits Motor Factor 2.05 1 1 0 % % % 9 4 4 1 0 1 0 1 1 4 3
A-Z Motor Spares Motor Factor 2.18 1 1 0 % % % 9 4 7 1 0 0 0 1 1 1 3
Car Spares Distribution Motor Factor 2.79 1 0 0 % % %
GSF Motor Factor 3.20 1 1 1 % % % 9 15 16 6 0 1 1 4 0 2 1
Trust First Parts VM Dealer 3.35 0 0 0 % % %
ECP Acocks Green Motor Factor 3.92 1 0 0 % % %
Ford Garretts Green VM Dealer 4.64 0 1 0 % % % 9 5 5 0 0 0 0 0 5 4 0
Car Spares Distribution Motor Factor 4.74 0 0 0 % % %
GSF Motor Factor 4.97 0 0 0 % % %
ECP Birmingham Motor Factor 5.06 0 0 0 % % %
AP Kings Norton Motor Factor 6.21 0 0 0 % % %
AP Halesowen Motor Factor 7.51 0 0 0 % % %
Imperial Automotive Car Accessories 76.20 0 0 0 % % %
ECP Aston
Competitor Details ECP Data Survey Responses
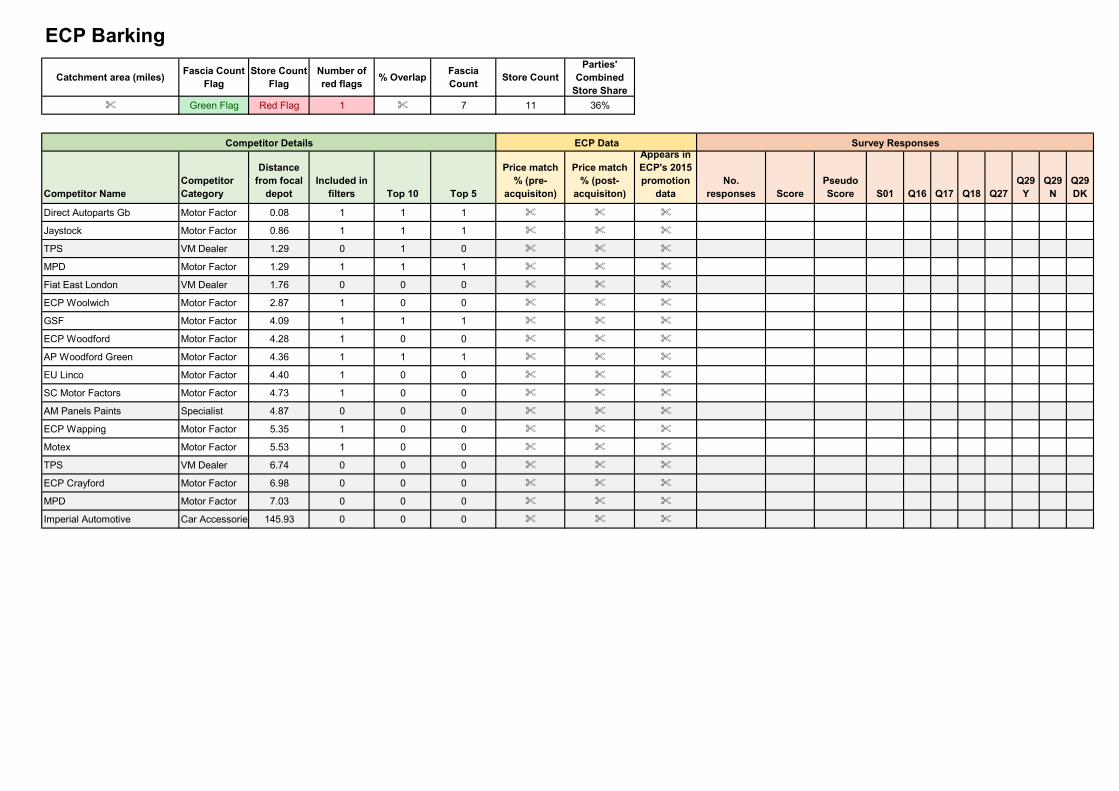
Catchment area (miles)Fascia Count
FlagStore Count
FlagNumber of red flags
% OverlapFascia Count
Store CountParties'
Combined Store Share
% Green Flag Red Flag 1 % 7 11 36%
Competitor NameCompetitor Category
Distance from focal
depotIncluded in
filters Top 10 Top 5
Price match % (pre-
acquisiton)
Price match % (post-
acquisiton)
Appears in ECP's 2015 promotion
dataNo.
responses ScorePseudo Score S01 Q16 Q17 Q18 Q27
Q29 Y
Q29 N
Q29 DK
Direct Autoparts Gb Motor Factor 0.08 1 1 1 % % %
Jaystock Motor Factor 0.86 1 1 1 % % %
TPS VM Dealer 1.29 0 1 0 % % %
MPD Motor Factor 1.29 1 1 1 % % %
Fiat East London VM Dealer 1.76 0 0 0 % % %
ECP Woolwich Motor Factor 2.87 1 0 0 % % %
GSF Motor Factor 4.09 1 1 1 % % %
ECP Woodford Motor Factor 4.28 1 0 0 % % %
AP Woodford Green Motor Factor 4.36 1 1 1 % % %
EU Linco Motor Factor 4.40 1 0 0 % % %
SC Motor Factors Motor Factor 4.73 1 0 0 % % %
AM Panels Paints Specialist 4.87 0 0 0 % % %
ECP Wapping Motor Factor 5.35 1 0 0 % % %
Motex Motor Factor 5.53 1 0 0 % % %
TPS VM Dealer 6.74 0 0 0 % % %
ECP Crayford Motor Factor 6.98 0 0 0 % % %
MPD Motor Factor 7.03 0 0 0 % % %
Imperial Automotive Car Accessories 145.93 0 0 0 % % %
ECP Barking
Competitor Details ECP Data Survey Responses
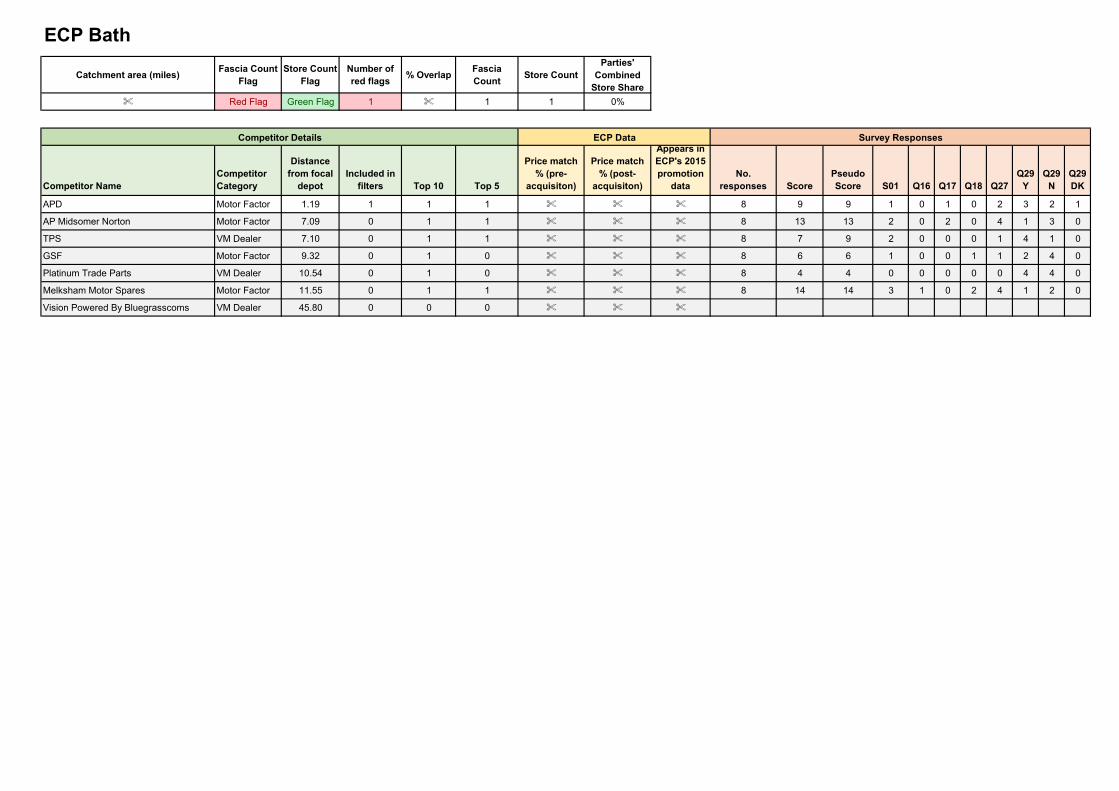
Catchment area (miles)Fascia Count
FlagStore Count
FlagNumber of red flags
% OverlapFascia Count
Store CountParties'
Combined Store Share
% Red Flag Green Flag 1 % 1 1 0%
Competitor NameCompetitor Category
Distance from focal
depotIncluded in
filters Top 10 Top 5
Price match % (pre-
acquisiton)
Price match % (post-
acquisiton)
Appears in ECP's 2015 promotion
dataNo.
responses ScorePseudo Score S01 Q16 Q17 Q18 Q27
Q29 Y
Q29 N
Q29 DK
APD Motor Factor 1.19 1 1 1 % % % 8 9 9 1 0 1 0 2 3 2 1
AP Midsomer Norton Motor Factor 7.09 0 1 1 % % % 8 13 13 2 0 2 0 4 1 3 0
TPS VM Dealer 7.10 0 1 1 % % % 8 7 9 2 0 0 0 1 4 1 0
GSF Motor Factor 9.32 0 1 0 % % % 8 6 6 1 0 0 1 1 2 4 0
Platinum Trade Parts VM Dealer 10.54 0 1 0 % % % 8 4 4 0 0 0 0 0 4 4 0
Melksham Motor Spares Motor Factor 11.55 0 1 1 % % % 8 14 14 3 1 0 2 4 1 2 0
Vision Powered By Bluegrasscoms VM Dealer 45.80 0 0 0 % % %
ECP Bath
Competitor Details ECP Data Survey Responses
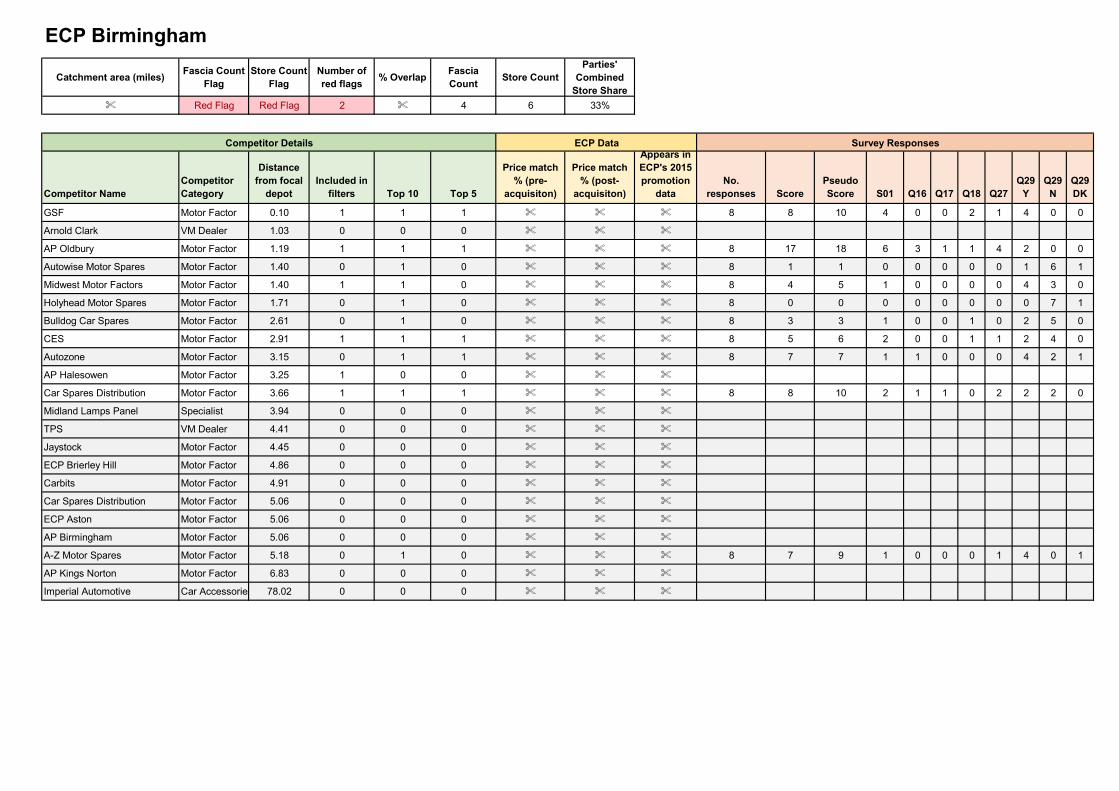
Catchment area (miles)Fascia Count
FlagStore Count
FlagNumber of red flags
% OverlapFascia Count
Store CountParties'
Combined Store Share
% Red Flag Red Flag 2 % 4 6 33%
Competitor NameCompetitor Category
Distance from focal
depotIncluded in
filters Top 10 Top 5
Price match % (pre-
acquisiton)
Price match % (post-
acquisiton)
Appears in ECP's 2015 promotion
dataNo.
responses ScorePseudo Score S01 Q16 Q17 Q18 Q27
Q29 Y
Q29 N
Q29 DK
GSF Motor Factor 0.10 1 1 1 % % % 8 8 10 4 0 0 2 1 4 0 0
Arnold Clark VM Dealer 1.03 0 0 0 % % %
AP Oldbury Motor Factor 1.19 1 1 1 % % % 8 17 18 6 3 1 1 4 2 0 0
Autowise Motor Spares Motor Factor 1.40 0 1 0 % % % 8 1 1 0 0 0 0 0 1 6 1
Midwest Motor Factors Motor Factor 1.40 1 1 0 % % % 8 4 5 1 0 0 0 0 4 3 0
Holyhead Motor Spares Motor Factor 1.71 0 1 0 % % % 8 0 0 0 0 0 0 0 0 7 1
Bulldog Car Spares Motor Factor 2.61 0 1 0 % % % 8 3 3 1 0 0 1 0 2 5 0
CES Motor Factor 2.91 1 1 1 % % % 8 5 6 2 0 0 1 1 2 4 0
Autozone Motor Factor 3.15 0 1 1 % % % 8 7 7 1 1 0 0 0 4 2 1
AP Halesowen Motor Factor 3.25 1 0 0 % % %
Car Spares Distribution Motor Factor 3.66 1 1 1 % % % 8 8 10 2 1 1 0 2 2 2 0
Midland Lamps Panel Specialist 3.94 0 0 0 % % %
TPS VM Dealer 4.41 0 0 0 % % %
Jaystock Motor Factor 4.45 0 0 0 % % %
ECP Brierley Hill Motor Factor 4.86 0 0 0 % % %
Carbits Motor Factor 4.91 0 0 0 % % %
Car Spares Distribution Motor Factor 5.06 0 0 0 % % %
ECP Aston Motor Factor 5.06 0 0 0 % % %
AP Birmingham Motor Factor 5.06 0 0 0 % % %
A-Z Motor Spares Motor Factor 5.18 0 1 0 % % % 8 7 9 1 0 0 0 1 4 0 1
AP Kings Norton Motor Factor 6.83 0 0 0 % % %
Imperial Automotive Car Accessories 78.02 0 0 0 % % %
ECP Birmingham
Competitor Details ECP Data Survey Responses

Catchment area (miles)Fascia Count
FlagStore Count
FlagNumber of red flags
% OverlapFascia Count
Store CountParties'
Combined Store Share
% Red Flag Red Flag 2 % 2 3 33%
Competitor NameCompetitor Category
Distance from focal
depotIncluded in
filters Top 10 Top 5
Price match % (pre-
acquisiton)
Price match % (post-
acquisiton)
Appears in ECP's 2015 promotion
dataNo.
responses ScorePseudo Score S01 Q16 Q17 Q18 Q27
Q29 Y
Q29 N
Q29 DK
Check-Point Motor Stores Motor Factor 0.73 0 1 0 % % % 14 1 1 0 0 0 0 0 1 9 4
Nationwide Clutch Distributors Uk Specialist 1.27 0 1 0 % % % 14 1 1 0 0 0 0 0 1 10 3
Motaspares Motor Factor 1.50 0 1 0 % % % 14 2 3 1 0 0 0 0 2 9 2
Arnold Clark VM Dealer 1.51 0 1 0 % % % 14 4 7 4 0 0 1 0 3 7 0
AP Lytham Motor Factor 1.82 1 1 1 % % % 14 17 18 5 2 2 0 5 2 5 1
EK Motor Factors Motor Factor 3.94 1 1 1 % % % 14 32 33 8 3 1 3 10 2 1 0
Motocare Manchester Motor Factor 4.05 0 1 1 % % % 14 0 0 0 0 0 0 0 0 10 4
Andrew Currans Motor Factor 5.47 1 1 1 % % % 14 17 18 5 0 2 1 5 2 6 0
Autobitz Motor Factors Motor Factor 6.27 0 1 1 % % % 14 2 2 0 0 0 0 0 2 9 3
TPS VM Dealer 8.31 0 1 0 % % % 14 10 10 4 0 0 3 1 4 4 2
Pacific Retail Limited Ta Motormania Motor Factor 8.67 0 0 0 % % %
Imperial Automotive Car Accessories 79.53 0 0 0 % % %
ECP Blackpool
Competitor Details ECP Data Survey Responses
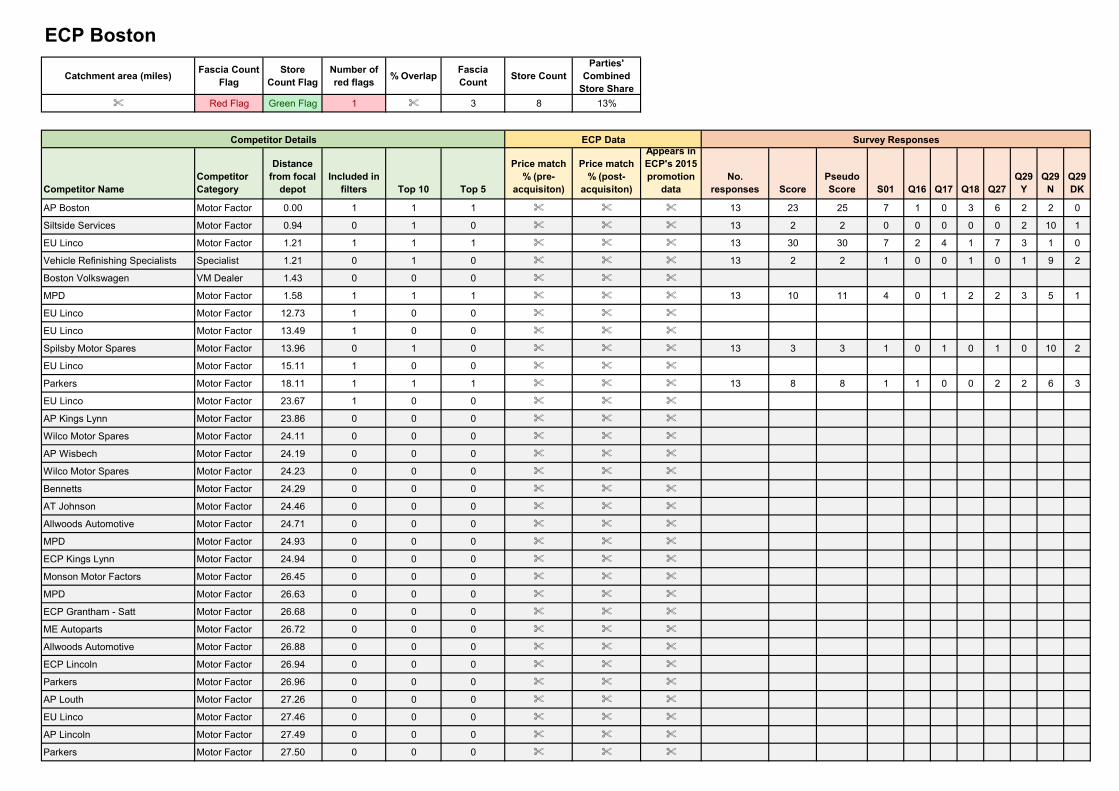
Catchment area (miles)Fascia Count
FlagStore
Count FlagNumber of red flags
% OverlapFascia Count
Store CountParties'
Combined Store Share
% Red Flag Green Flag 1 % 3 8 13%
Competitor NameCompetitor Category
Distance from focal
depotIncluded in
filters Top 10 Top 5
Price match % (pre-
acquisiton)
Price match % (post-
acquisiton)
Appears in ECP's 2015 promotion
dataNo.
responses ScorePseudo Score S01 Q16 Q17 Q18 Q27
Q29 Y
Q29 N
Q29 DK
AP Boston Motor Factor 0.00 1 1 1 % % % 13 23 25 7 1 0 3 6 2 2 0
Siltside Services Motor Factor 0.94 0 1 0 % % % 13 2 2 0 0 0 0 0 2 10 1
EU Linco Motor Factor 1.21 1 1 1 % % % 13 30 30 7 2 4 1 7 3 1 0
Vehicle Refinishing Specialists Specialist 1.21 0 1 0 % % % 13 2 2 1 0 0 1 0 1 9 2
Boston Volkswagen VM Dealer 1.43 0 0 0 % % %
MPD Motor Factor 1.58 1 1 1 % % % 13 10 11 4 0 1 2 2 3 5 1
EU Linco Motor Factor 12.73 1 0 0 % % %
EU Linco Motor Factor 13.49 1 0 0 % % %
Spilsby Motor Spares Motor Factor 13.96 0 1 0 % % % 13 3 3 1 0 1 0 1 0 10 2
EU Linco Motor Factor 15.11 1 0 0 % % %
Parkers Motor Factor 18.11 1 1 1 % % % 13 8 8 1 1 0 0 2 2 6 3
EU Linco Motor Factor 23.67 1 0 0 % % %
AP Kings Lynn Motor Factor 23.86 0 0 0 % % %
Wilco Motor Spares Motor Factor 24.11 0 0 0 % % %
AP Wisbech Motor Factor 24.19 0 0 0 % % %
Wilco Motor Spares Motor Factor 24.23 0 0 0 % % %
Bennetts Motor Factor 24.29 0 0 0 % % %
AT Johnson Motor Factor 24.46 0 0 0 % % %
Allwoods Automotive Motor Factor 24.71 0 0 0 % % %
MPD Motor Factor 24.93 0 0 0 % % %
ECP Kings Lynn Motor Factor 24.94 0 0 0 % % %
Monson Motor Factors Motor Factor 26.45 0 0 0 % % %
MPD Motor Factor 26.63 0 0 0 % % %
ECP Grantham - Satt Motor Factor 26.68 0 0 0 % % %
ME Autoparts Motor Factor 26.72 0 0 0 % % %
Allwoods Automotive Motor Factor 26.88 0 0 0 % % %
ECP Lincoln Motor Factor 26.94 0 0 0 % % %
Parkers Motor Factor 26.96 0 0 0 % % %
AP Louth Motor Factor 27.26 0 0 0 % % %
EU Linco Motor Factor 27.46 0 0 0 % % %
AP Lincoln Motor Factor 27.49 0 0 0 % % %
Parkers Motor Factor 27.50 0 0 0 % % %
ECP Boston
Competitor Details ECP Data Survey Responses
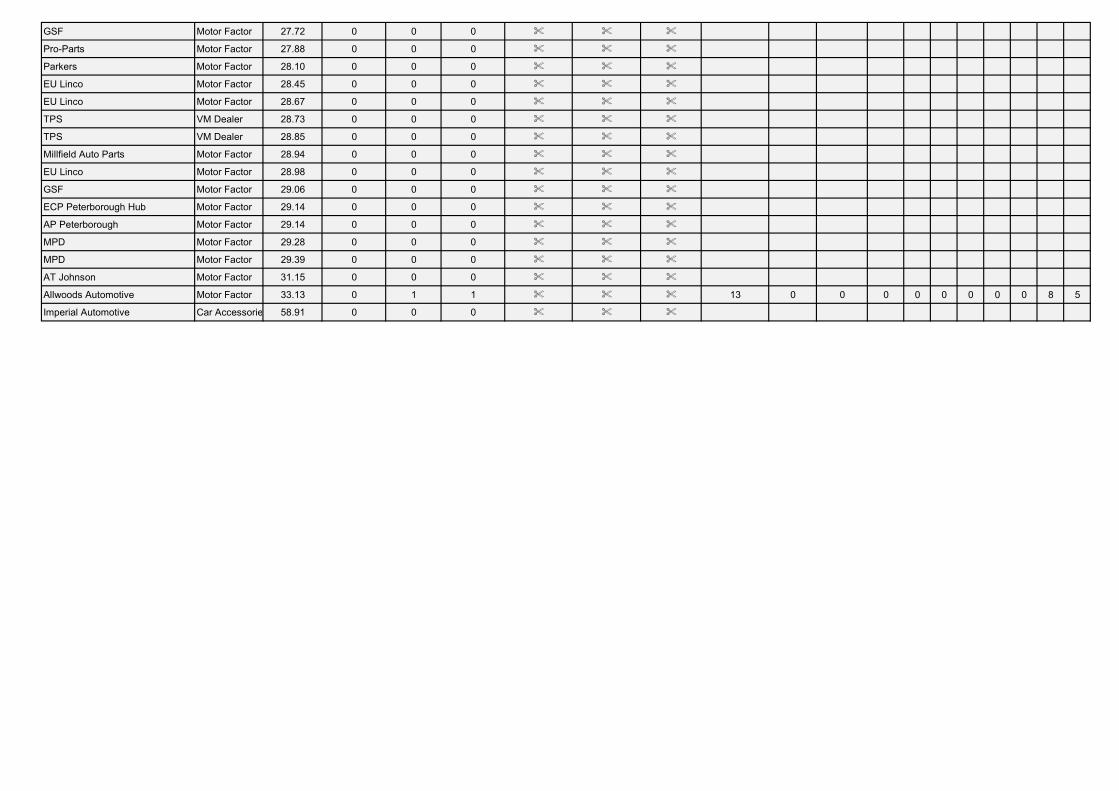
GSF Motor Factor 27.72 0 0 0 % % %
Pro-Parts Motor Factor 27.88 0 0 0 % % %
Parkers Motor Factor 28.10 0 0 0 % % %
EU Linco Motor Factor 28.45 0 0 0 % % %
EU Linco Motor Factor 28.67 0 0 0 % % %
TPS VM Dealer 28.73 0 0 0 % % %
TPS VM Dealer 28.85 0 0 0 % % %
Millfield Auto Parts Motor Factor 28.94 0 0 0 % % %
EU Linco Motor Factor 28.98 0 0 0 % % %
GSF Motor Factor 29.06 0 0 0 % % %
ECP Peterborough Hub Motor Factor 29.14 0 0 0 % % %
AP Peterborough Motor Factor 29.14 0 0 0 % % %
MPD Motor Factor 29.28 0 0 0 % % %
MPD Motor Factor 29.39 0 0 0 % % %
AT Johnson Motor Factor 31.15 0 0 0 % % %
Allwoods Automotive Motor Factor 33.13 0 1 1 % % % 13 0 0 0 0 0 0 0 0 8 5
Imperial Automotive Car Accessories 58.91 0 0 0 % % %
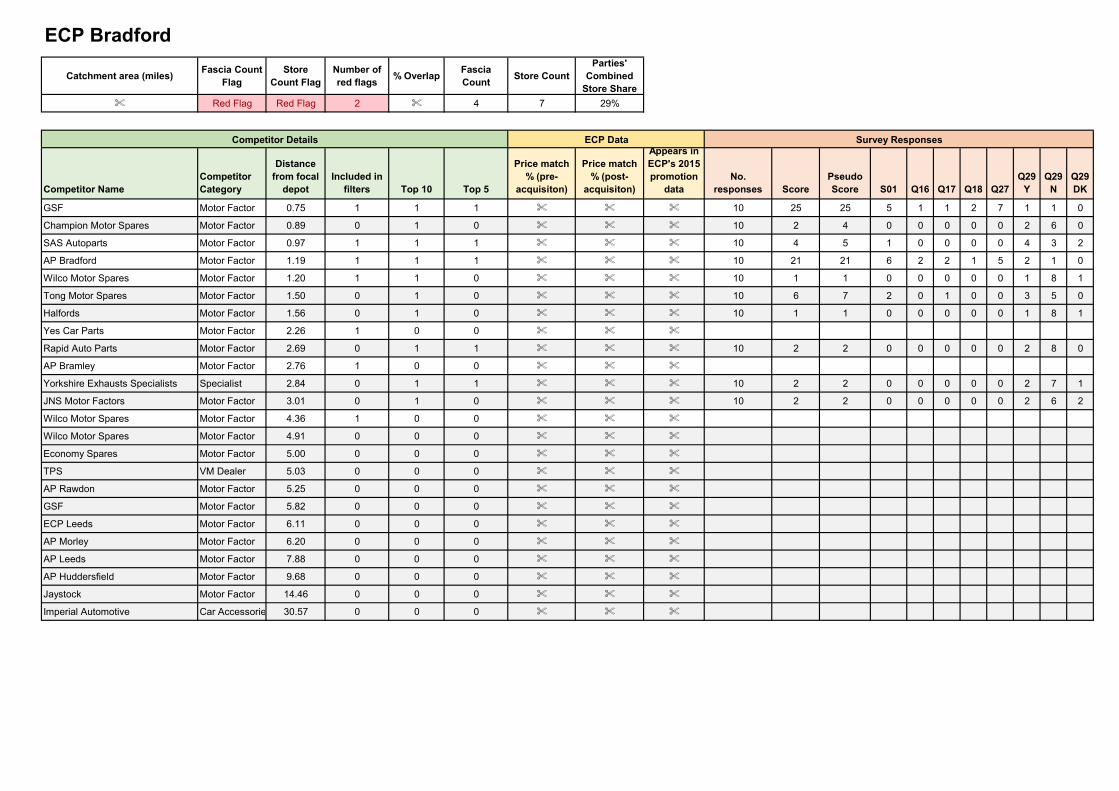
Catchment area (miles)Fascia Count
FlagStore
Count FlagNumber of red flags
% OverlapFascia Count
Store CountParties'
Combined Store Share
% Red Flag Red Flag 2 % 4 7 29%
Competitor NameCompetitor Category
Distance from focal
depotIncluded in
filters Top 10 Top 5
Price match % (pre-
acquisiton)
Price match % (post-
acquisiton)
Appears in ECP's 2015 promotion
dataNo.
responses ScorePseudo Score S01 Q16 Q17 Q18 Q27
Q29 Y
Q29 N
Q29 DK
GSF Motor Factor 0.75 1 1 1 % % % 10 25 25 5 1 1 2 7 1 1 0
Champion Motor Spares Motor Factor 0.89 0 1 0 % % % 10 2 4 0 0 0 0 0 2 6 0
SAS Autoparts Motor Factor 0.97 1 1 1 % % % 10 4 5 1 0 0 0 0 4 3 2
AP Bradford Motor Factor 1.19 1 1 1 % % % 10 21 21 6 2 2 1 5 2 1 0
Wilco Motor Spares Motor Factor 1.20 1 1 0 % % % 10 1 1 0 0 0 0 0 1 8 1
Tong Motor Spares Motor Factor 1.50 0 1 0 % % % 10 6 7 2 0 1 0 0 3 5 0
Halfords Motor Factor 1.56 0 1 0 % % % 10 1 1 0 0 0 0 0 1 8 1
Yes Car Parts Motor Factor 2.26 1 0 0 % % %
Rapid Auto Parts Motor Factor 2.69 0 1 1 % % % 10 2 2 0 0 0 0 0 2 8 0
AP Bramley Motor Factor 2.76 1 0 0 % % %
Yorkshire Exhausts Specialists Specialist 2.84 0 1 1 % % % 10 2 2 0 0 0 0 0 2 7 1
JNS Motor Factors Motor Factor 3.01 0 1 0 % % % 10 2 2 0 0 0 0 0 2 6 2
Wilco Motor Spares Motor Factor 4.36 1 0 0 % % %
Wilco Motor Spares Motor Factor 4.91 0 0 0 % % %
Economy Spares Motor Factor 5.00 0 0 0 % % %
TPS VM Dealer 5.03 0 0 0 % % %
AP Rawdon Motor Factor 5.25 0 0 0 % % %
GSF Motor Factor 5.82 0 0 0 % % %
ECP Leeds Motor Factor 6.11 0 0 0 % % %
AP Morley Motor Factor 6.20 0 0 0 % % %
AP Leeds Motor Factor 7.88 0 0 0 % % %
AP Huddersfield Motor Factor 9.68 0 0 0 % % %
Jaystock Motor Factor 14.46 0 0 0 % % %
Imperial Automotive Car Accessories 30.57 0 0 0 % % %
ECP Bradford
Competitor Details ECP Data Survey Responses
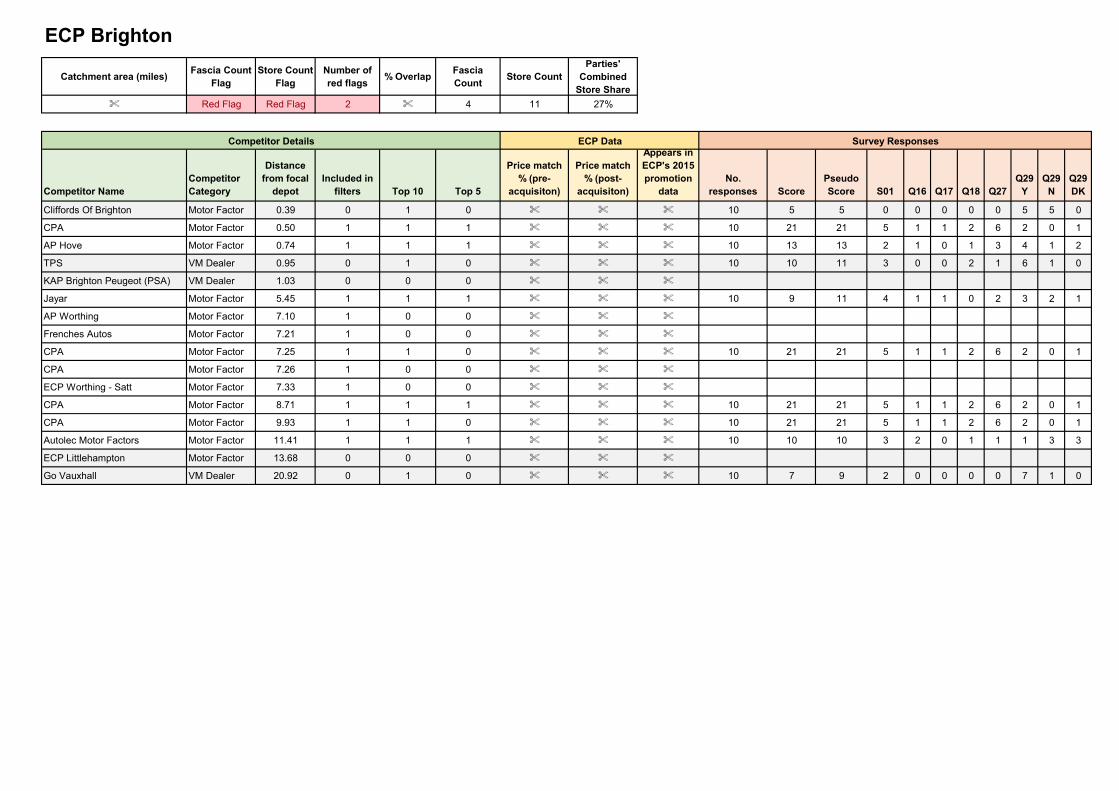
Catchment area (miles)Fascia Count
FlagStore Count
FlagNumber of red flags
% OverlapFascia Count
Store CountParties'
Combined Store Share
% Red Flag Red Flag 2 % 4 11 27%
Competitor NameCompetitor Category
Distance from focal
depotIncluded in
filters Top 10 Top 5
Price match % (pre-
acquisiton)
Price match % (post-
acquisiton)
Appears in ECP's 2015 promotion
dataNo.
responses ScorePseudo Score S01 Q16 Q17 Q18 Q27
Q29 Y
Q29 N
Q29 DK
Cliffords Of Brighton Motor Factor 0.39 0 1 0 % % % 10 5 5 0 0 0 0 0 5 5 0
CPA Motor Factor 0.50 1 1 1 % % % 10 21 21 5 1 1 2 6 2 0 1
AP Hove Motor Factor 0.74 1 1 1 % % % 10 13 13 2 1 0 1 3 4 1 2
TPS VM Dealer 0.95 0 1 0 % % % 10 10 11 3 0 0 2 1 6 1 0
KAP Brighton Peugeot (PSA) VM Dealer 1.03 0 0 0 % % %
Jayar Motor Factor 5.45 1 1 1 % % % 10 9 11 4 1 1 0 2 3 2 1
AP Worthing Motor Factor 7.10 1 0 0 % % %
Frenches Autos Motor Factor 7.21 1 0 0 % % %
CPA Motor Factor 7.25 1 1 0 % % % 10 21 21 5 1 1 2 6 2 0 1
CPA Motor Factor 7.26 1 0 0 % % %
ECP Worthing - Satt Motor Factor 7.33 1 0 0 % % %
CPA Motor Factor 8.71 1 1 1 % % % 10 21 21 5 1 1 2 6 2 0 1
CPA Motor Factor 9.93 1 1 0 % % % 10 21 21 5 1 1 2 6 2 0 1
Autolec Motor Factors Motor Factor 11.41 1 1 1 % % % 10 10 10 3 2 0 1 1 1 3 3
ECP Littlehampton Motor Factor 13.68 0 0 0 % % %
Go Vauxhall VM Dealer 20.92 0 1 0 % % % 10 7 9 2 0 0 0 0 7 1 0
ECP Brighton
Competitor Details ECP Data Survey Responses
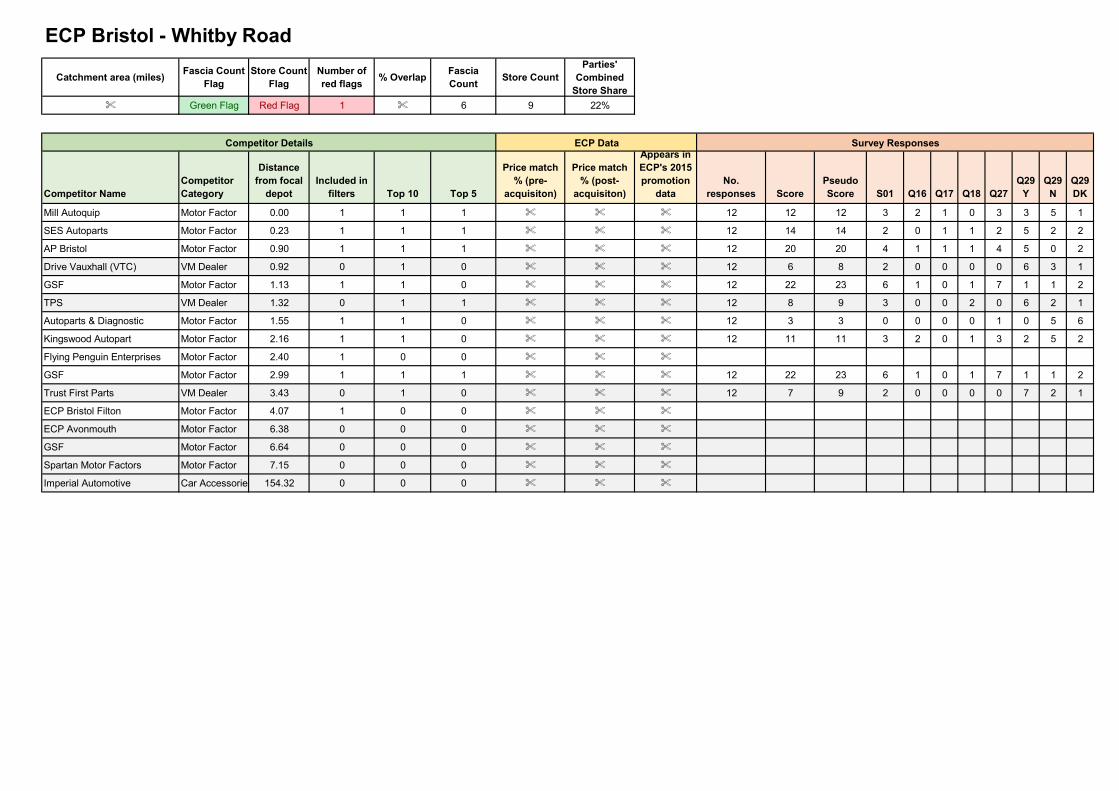
Catchment area (miles)Fascia Count
FlagStore Count
FlagNumber of red flags
% OverlapFascia Count
Store CountParties'
Combined Store Share
% Green Flag Red Flag 1 % 6 9 22%
Competitor NameCompetitor Category
Distance from focal
depotIncluded in
filters Top 10 Top 5
Price match % (pre-
acquisiton)
Price match % (post-
acquisiton)
Appears in ECP's 2015 promotion
dataNo.
responses ScorePseudo Score S01 Q16 Q17 Q18 Q27
Q29 Y
Q29 N
Q29 DK
Mill Autoquip Motor Factor 0.00 1 1 1 % % % 12 12 12 3 2 1 0 3 3 5 1
SES Autoparts Motor Factor 0.23 1 1 1 % % % 12 14 14 2 0 1 1 2 5 2 2
AP Bristol Motor Factor 0.90 1 1 1 % % % 12 20 20 4 1 1 1 4 5 0 2
Drive Vauxhall (VTC) VM Dealer 0.92 0 1 0 % % % 12 6 8 2 0 0 0 0 6 3 1
GSF Motor Factor 1.13 1 1 0 % % % 12 22 23 6 1 0 1 7 1 1 2
TPS VM Dealer 1.32 0 1 1 % % % 12 8 9 3 0 0 2 0 6 2 1
Autoparts & Diagnostic Motor Factor 1.55 1 1 0 % % % 12 3 3 0 0 0 0 1 0 5 6
Kingswood Autopart Motor Factor 2.16 1 1 0 % % % 12 11 11 3 2 0 1 3 2 5 2
Flying Penguin Enterprises Motor Factor 2.40 1 0 0 % % %
GSF Motor Factor 2.99 1 1 1 % % % 12 22 23 6 1 0 1 7 1 1 2
Trust First Parts VM Dealer 3.43 0 1 0 % % % 12 7 9 2 0 0 0 0 7 2 1
ECP Bristol Filton Motor Factor 4.07 1 0 0 % % %
ECP Avonmouth Motor Factor 6.38 0 0 0 % % %
GSF Motor Factor 6.64 0 0 0 % % %
Spartan Motor Factors Motor Factor 7.15 0 0 0 % % %
Imperial Automotive Car Accessories 154.32 0 0 0 % % %
ECP Bristol - Whitby Road
Competitor Details ECP Data Survey Responses
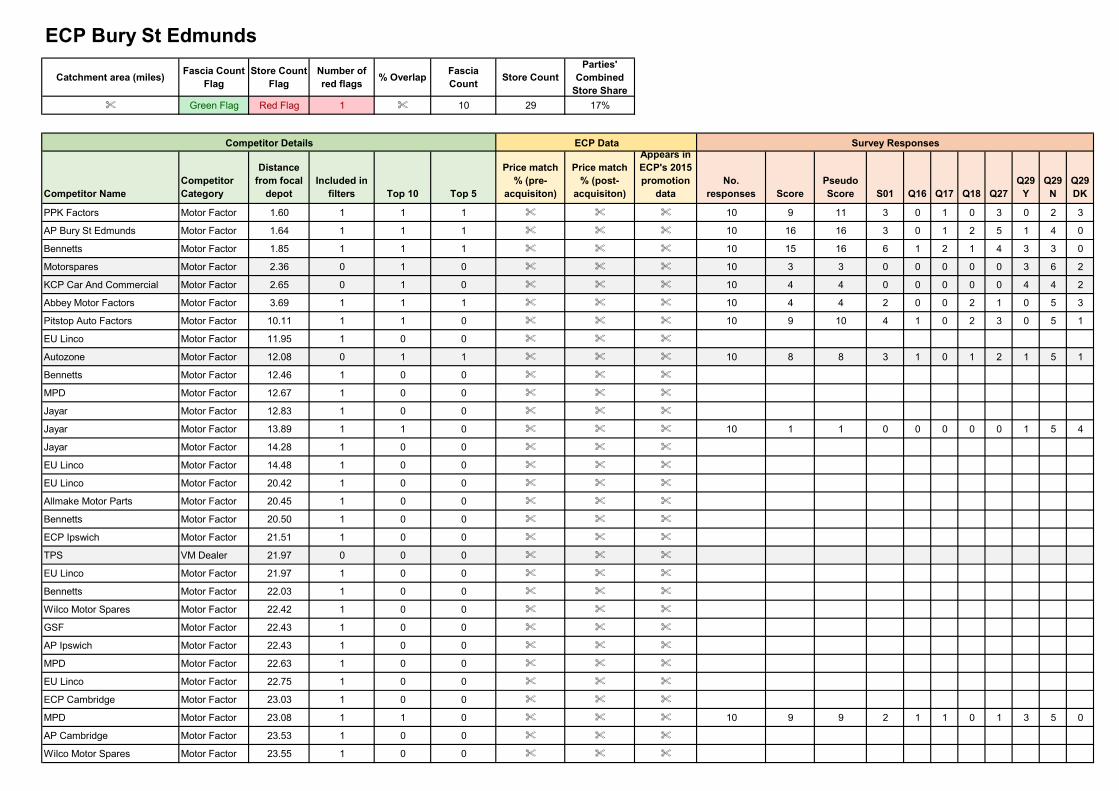
Catchment area (miles)Fascia Count
FlagStore Count
FlagNumber of red flags
% OverlapFascia Count
Store CountParties'
Combined Store Share
% Green Flag Red Flag 1 % 10 29 17%
Competitor NameCompetitor Category
Distance from focal
depotIncluded in
filters Top 10 Top 5
Price match % (pre-
acquisiton)
Price match % (post-
acquisiton)
Appears in ECP's 2015 promotion
dataNo.
responses ScorePseudo Score S01 Q16 Q17 Q18 Q27
Q29 Y
Q29 N
Q29 DK
PPK Factors Motor Factor 1.60 1 1 1 % % % 10 9 11 3 0 1 0 3 0 2 3
AP Bury St Edmunds Motor Factor 1.64 1 1 1 % % % 10 16 16 3 0 1 2 5 1 4 0
Bennetts Motor Factor 1.85 1 1 1 % % % 10 15 16 6 1 2 1 4 3 3 0
Motorspares Motor Factor 2.36 0 1 0 % % % 10 3 3 0 0 0 0 0 3 6 2
KCP Car And Commercial Motor Factor 2.65 0 1 0 % % % 10 4 4 0 0 0 0 0 4 4 2
Abbey Motor Factors Motor Factor 3.69 1 1 1 % % % 10 4 4 2 0 0 2 1 0 5 3
Pitstop Auto Factors Motor Factor 10.11 1 1 0 % % % 10 9 10 4 1 0 2 3 0 5 1
EU Linco Motor Factor 11.95 1 0 0 % % %
Autozone Motor Factor 12.08 0 1 1 % % % 10 8 8 3 1 0 1 2 1 5 1
Bennetts Motor Factor 12.46 1 0 0 % % %
MPD Motor Factor 12.67 1 0 0 % % %
Jayar Motor Factor 12.83 1 0 0 % % %
Jayar Motor Factor 13.89 1 1 0 % % % 10 1 1 0 0 0 0 0 1 5 4
Jayar Motor Factor 14.28 1 0 0 % % %
EU Linco Motor Factor 14.48 1 0 0 % % %
EU Linco Motor Factor 20.42 1 0 0 % % %
Allmake Motor Parts Motor Factor 20.45 1 0 0 % % %
Bennetts Motor Factor 20.50 1 0 0 % % %
ECP Ipswich Motor Factor 21.51 1 0 0 % % %
TPS VM Dealer 21.97 0 0 0 % % %
EU Linco Motor Factor 21.97 1 0 0 % % %
Bennetts Motor Factor 22.03 1 0 0 % % %
Wilco Motor Spares Motor Factor 22.42 1 0 0 % % %
GSF Motor Factor 22.43 1 0 0 % % %
AP Ipswich Motor Factor 22.43 1 0 0 % % %
MPD Motor Factor 22.63 1 0 0 % % %
EU Linco Motor Factor 22.75 1 0 0 % % %
ECP Cambridge Motor Factor 23.03 1 0 0 % % %
MPD Motor Factor 23.08 1 1 0 % % % 10 9 9 2 1 1 0 1 3 5 0
AP Cambridge Motor Factor 23.53 1 0 0 % % %
Wilco Motor Spares Motor Factor 23.55 1 0 0 % % %
ECP Bury St Edmunds
Competitor Details ECP Data Survey Responses
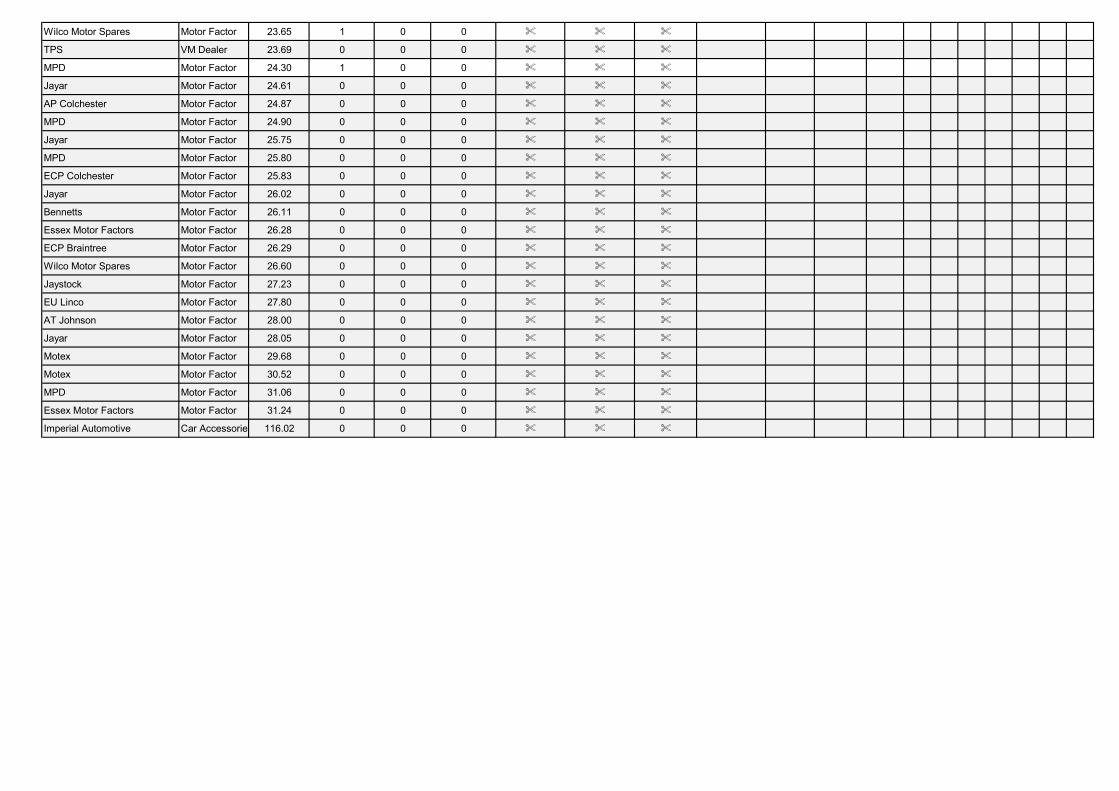
Wilco Motor Spares Motor Factor 23.65 1 0 0 % % %
TPS VM Dealer 23.69 0 0 0 % % %
MPD Motor Factor 24.30 1 0 0 % % %
Jayar Motor Factor 24.61 0 0 0 % % %
AP Colchester Motor Factor 24.87 0 0 0 % % %
MPD Motor Factor 24.90 0 0 0 % % %
Jayar Motor Factor 25.75 0 0 0 % % %
MPD Motor Factor 25.80 0 0 0 % % %
ECP Colchester Motor Factor 25.83 0 0 0 % % %
Jayar Motor Factor 26.02 0 0 0 % % %
Bennetts Motor Factor 26.11 0 0 0 % % %
Essex Motor Factors Motor Factor 26.28 0 0 0 % % %
ECP Braintree Motor Factor 26.29 0 0 0 % % %
Wilco Motor Spares Motor Factor 26.60 0 0 0 % % %
Jaystock Motor Factor 27.23 0 0 0 % % %
EU Linco Motor Factor 27.80 0 0 0 % % %
AT Johnson Motor Factor 28.00 0 0 0 % % %
Jayar Motor Factor 28.05 0 0 0 % % %
Motex Motor Factor 29.68 0 0 0 % % %
Motex Motor Factor 30.52 0 0 0 % % %
MPD Motor Factor 31.06 0 0 0 % % %
Essex Motor Factors Motor Factor 31.24 0 0 0 % % %
Imperial Automotive Car Accessories 116.02 0 0 0 % % %
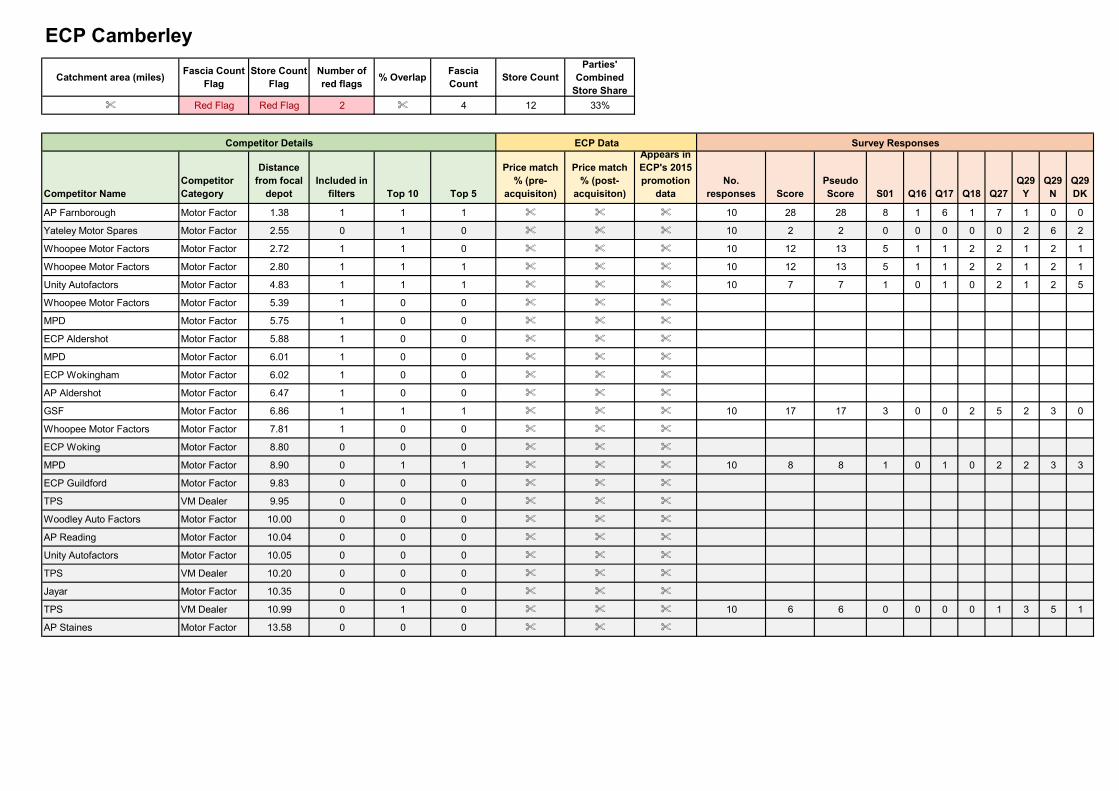
Catchment area (miles)Fascia Count
FlagStore Count
FlagNumber of red flags
% OverlapFascia Count
Store CountParties'
Combined Store Share
% Red Flag Red Flag 2 % 4 12 33%
Competitor NameCompetitor Category
Distance from focal
depotIncluded in
filters Top 10 Top 5
Price match % (pre-
acquisiton)
Price match % (post-
acquisiton)
Appears in ECP's 2015 promotion
dataNo.
responses ScorePseudo Score S01 Q16 Q17 Q18 Q27
Q29 Y
Q29 N
Q29 DK
AP Farnborough Motor Factor 1.38 1 1 1 % % % 10 28 28 8 1 6 1 7 1 0 0
Yateley Motor Spares Motor Factor 2.55 0 1 0 % % % 10 2 2 0 0 0 0 0 2 6 2
Whoopee Motor Factors Motor Factor 2.72 1 1 0 % % % 10 12 13 5 1 1 2 2 1 2 1
Whoopee Motor Factors Motor Factor 2.80 1 1 1 % % % 10 12 13 5 1 1 2 2 1 2 1
Unity Autofactors Motor Factor 4.83 1 1 1 % % % 10 7 7 1 0 1 0 2 1 2 5
Whoopee Motor Factors Motor Factor 5.39 1 0 0 % % %
MPD Motor Factor 5.75 1 0 0 % % %
ECP Aldershot Motor Factor 5.88 1 0 0 % % %
MPD Motor Factor 6.01 1 0 0 % % %
ECP Wokingham Motor Factor 6.02 1 0 0 % % %
AP Aldershot Motor Factor 6.47 1 0 0 % % %
GSF Motor Factor 6.86 1 1 1 % % % 10 17 17 3 0 0 2 5 2 3 0
Whoopee Motor Factors Motor Factor 7.81 1 0 0 % % %
ECP Woking Motor Factor 8.80 0 0 0 % % %
MPD Motor Factor 8.90 0 1 1 % % % 10 8 8 1 0 1 0 2 2 3 3
ECP Guildford Motor Factor 9.83 0 0 0 % % %
TPS VM Dealer 9.95 0 0 0 % % %
Woodley Auto Factors Motor Factor 10.00 0 0 0 % % %
AP Reading Motor Factor 10.04 0 0 0 % % %
Unity Autofactors Motor Factor 10.05 0 0 0 % % %
TPS VM Dealer 10.20 0 0 0 % % %
Jayar Motor Factor 10.35 0 0 0 % % %
TPS VM Dealer 10.99 0 1 0 % % % 10 6 6 0 0 0 0 1 3 5 1
AP Staines Motor Factor 13.58 0 0 0 % % %
ECP Camberley
Competitor Details ECP Data Survey Responses
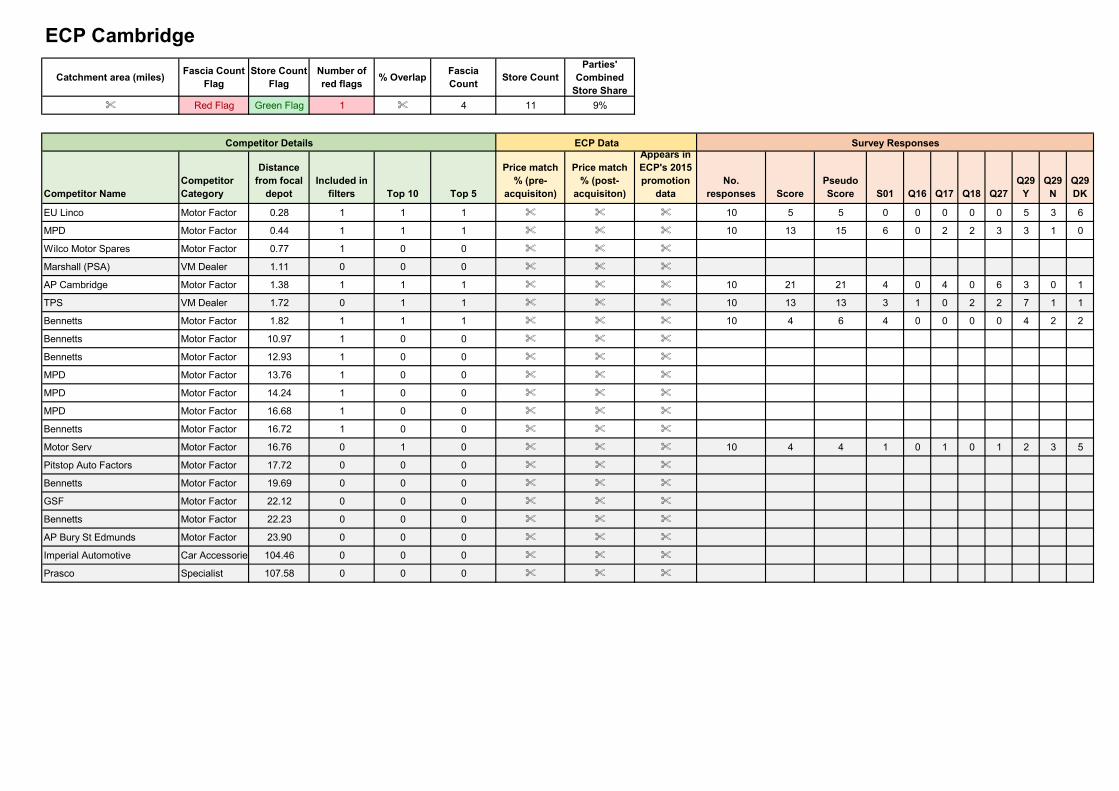
Catchment area (miles)Fascia Count
FlagStore Count
FlagNumber of red flags
% OverlapFascia Count
Store CountParties'
Combined Store Share
% Red Flag Green Flag 1 % 4 11 9%
Competitor NameCompetitor Category
Distance from focal
depotIncluded in
filters Top 10 Top 5
Price match % (pre-
acquisiton)
Price match % (post-
acquisiton)
Appears in ECP's 2015 promotion
dataNo.
responses ScorePseudo Score S01 Q16 Q17 Q18 Q27
Q29 Y
Q29 N
Q29 DK
EU Linco Motor Factor 0.28 1 1 1 % % % 10 5 5 0 0 0 0 0 5 3 6
MPD Motor Factor 0.44 1 1 1 % % % 10 13 15 6 0 2 2 3 3 1 0
Wilco Motor Spares Motor Factor 0.77 1 0 0 % % %
Marshall (PSA) VM Dealer 1.11 0 0 0 % % %
AP Cambridge Motor Factor 1.38 1 1 1 % % % 10 21 21 4 0 4 0 6 3 0 1
TPS VM Dealer 1.72 0 1 1 % % % 10 13 13 3 1 0 2 2 7 1 1
Bennetts Motor Factor 1.82 1 1 1 % % % 10 4 6 4 0 0 0 0 4 2 2
Bennetts Motor Factor 10.97 1 0 0 % % %
Bennetts Motor Factor 12.93 1 0 0 % % %
MPD Motor Factor 13.76 1 0 0 % % %
MPD Motor Factor 14.24 1 0 0 % % %
MPD Motor Factor 16.68 1 0 0 % % %
Bennetts Motor Factor 16.72 1 0 0 % % %
Motor Serv Motor Factor 16.76 0 1 0 % % % 10 4 4 1 0 1 0 1 2 3 5
Pitstop Auto Factors Motor Factor 17.72 0 0 0 % % %
Bennetts Motor Factor 19.69 0 0 0 % % %
GSF Motor Factor 22.12 0 0 0 % % %
Bennetts Motor Factor 22.23 0 0 0 % % %
AP Bury St Edmunds Motor Factor 23.90 0 0 0 % % %
Imperial Automotive Car Accessories 104.46 0 0 0 % % %
Prasco Specialist 107.58 0 0 0 % % %
ECP Cambridge
Competitor Details ECP Data Survey Responses
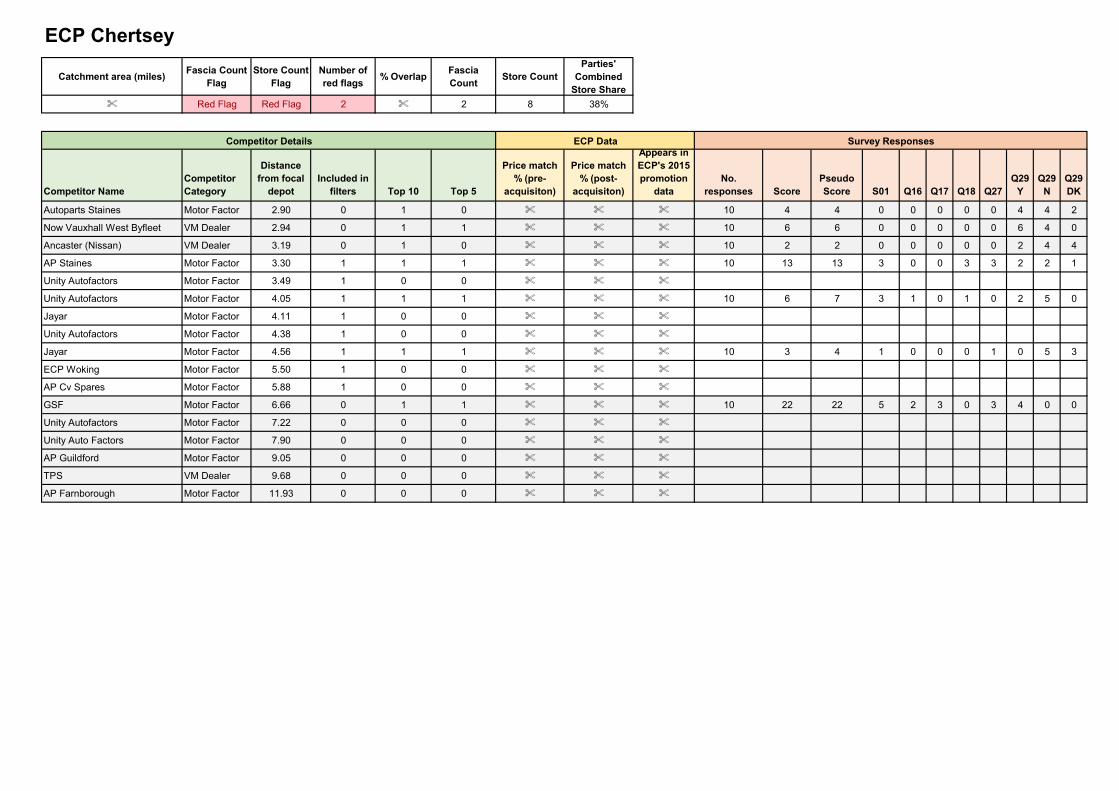
Catchment area (miles)Fascia Count
FlagStore Count
FlagNumber of red flags
% OverlapFascia Count
Store CountParties'
Combined Store Share
% Red Flag Red Flag 2 % 2 8 38%
Competitor NameCompetitor Category
Distance from focal
depotIncluded in
filters Top 10 Top 5
Price match % (pre-
acquisiton)
Price match % (post-
acquisiton)
Appears in ECP's 2015 promotion
dataNo.
responses ScorePseudo Score S01 Q16 Q17 Q18 Q27
Q29 Y
Q29 N
Q29 DK
Autoparts Staines Motor Factor 2.90 0 1 0 % % % 10 4 4 0 0 0 0 0 4 4 2
Now Vauxhall West Byfleet VM Dealer 2.94 0 1 1 % % % 10 6 6 0 0 0 0 0 6 4 0
Ancaster (Nissan) VM Dealer 3.19 0 1 0 % % % 10 2 2 0 0 0 0 0 2 4 4
AP Staines Motor Factor 3.30 1 1 1 % % % 10 13 13 3 0 0 3 3 2 2 1
Unity Autofactors Motor Factor 3.49 1 0 0 % % %
Unity Autofactors Motor Factor 4.05 1 1 1 % % % 10 6 7 3 1 0 1 0 2 5 0
Jayar Motor Factor 4.11 1 0 0 % % %
Unity Autofactors Motor Factor 4.38 1 0 0 % % %
Jayar Motor Factor 4.56 1 1 1 % % % 10 3 4 1 0 0 0 1 0 5 3
ECP Woking Motor Factor 5.50 1 0 0 % % %
AP Cv Spares Motor Factor 5.88 1 0 0 % % %
GSF Motor Factor 6.66 0 1 1 % % % 10 22 22 5 2 3 0 3 4 0 0
Unity Autofactors Motor Factor 7.22 0 0 0 % % %
Unity Auto Factors Motor Factor 7.90 0 0 0 % % %
AP Guildford Motor Factor 9.05 0 0 0 % % %
TPS VM Dealer 9.68 0 0 0 % % %
AP Farnborough Motor Factor 11.93 0 0 0 % % %
ECP Chertsey
Competitor Details ECP Data Survey Responses
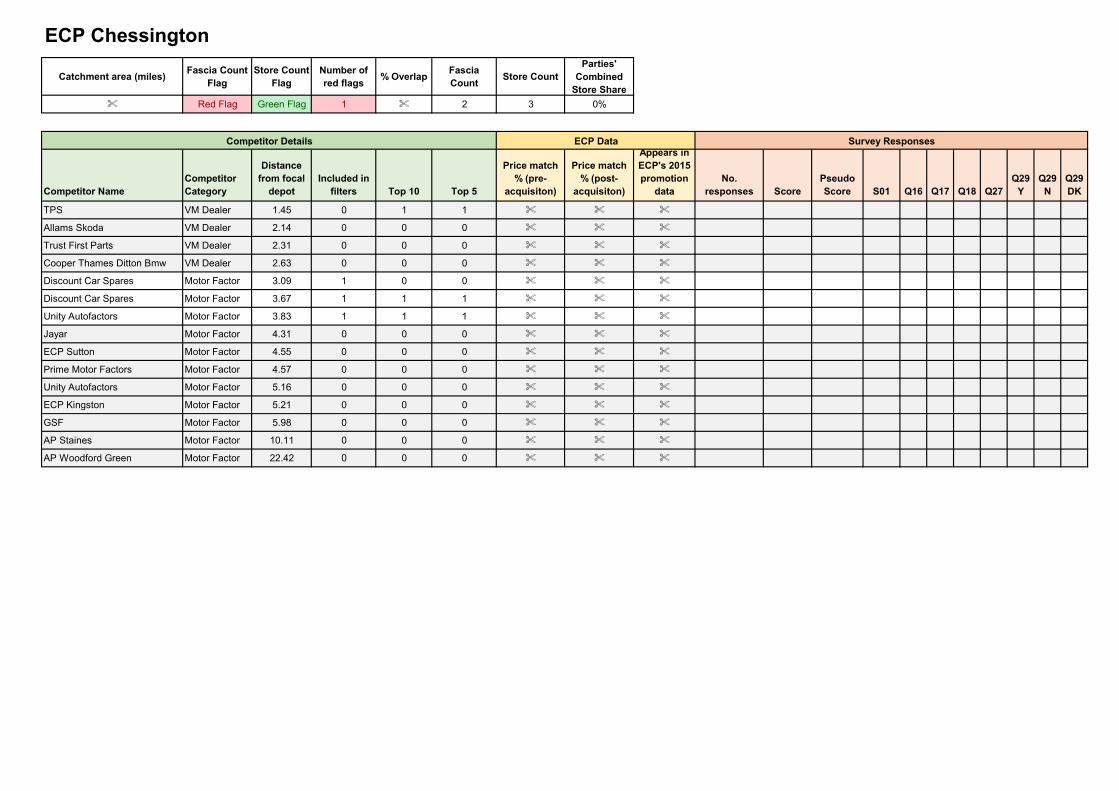
Catchment area (miles)Fascia Count
FlagStore Count
FlagNumber of red flags
% OverlapFascia Count
Store CountParties'
Combined Store Share
% Red Flag Green Flag 1 % 2 3 0%
Competitor NameCompetitor Category
Distance from focal
depotIncluded in
filters Top 10 Top 5
Price match % (pre-
acquisiton)
Price match % (post-
acquisiton)
Appears in ECP's 2015 promotion
dataNo.
responses ScorePseudo Score S01 Q16 Q17 Q18 Q27
Q29 Y
Q29 N
Q29 DK
TPS VM Dealer 1.45 0 1 1 % % %
Allams Skoda VM Dealer 2.14 0 0 0 % % %
Trust First Parts VM Dealer 2.31 0 0 0 % % %
Cooper Thames Ditton Bmw VM Dealer 2.63 0 0 0 % % %
Discount Car Spares Motor Factor 3.09 1 0 0 % % %
Discount Car Spares Motor Factor 3.67 1 1 1 % % %
Unity Autofactors Motor Factor 3.83 1 1 1 % % %
Jayar Motor Factor 4.31 0 0 0 % % %
ECP Sutton Motor Factor 4.55 0 0 0 % % %
Prime Motor Factors Motor Factor 4.57 0 0 0 % % %
Unity Autofactors Motor Factor 5.16 0 0 0 % % %
ECP Kingston Motor Factor 5.21 0 0 0 % % %
GSF Motor Factor 5.98 0 0 0 % % %
AP Staines Motor Factor 10.11 0 0 0 % % %
AP Woodford Green Motor Factor 22.42 0 0 0 % % %
ECP Chessington
Competitor Details ECP Data Survey Responses
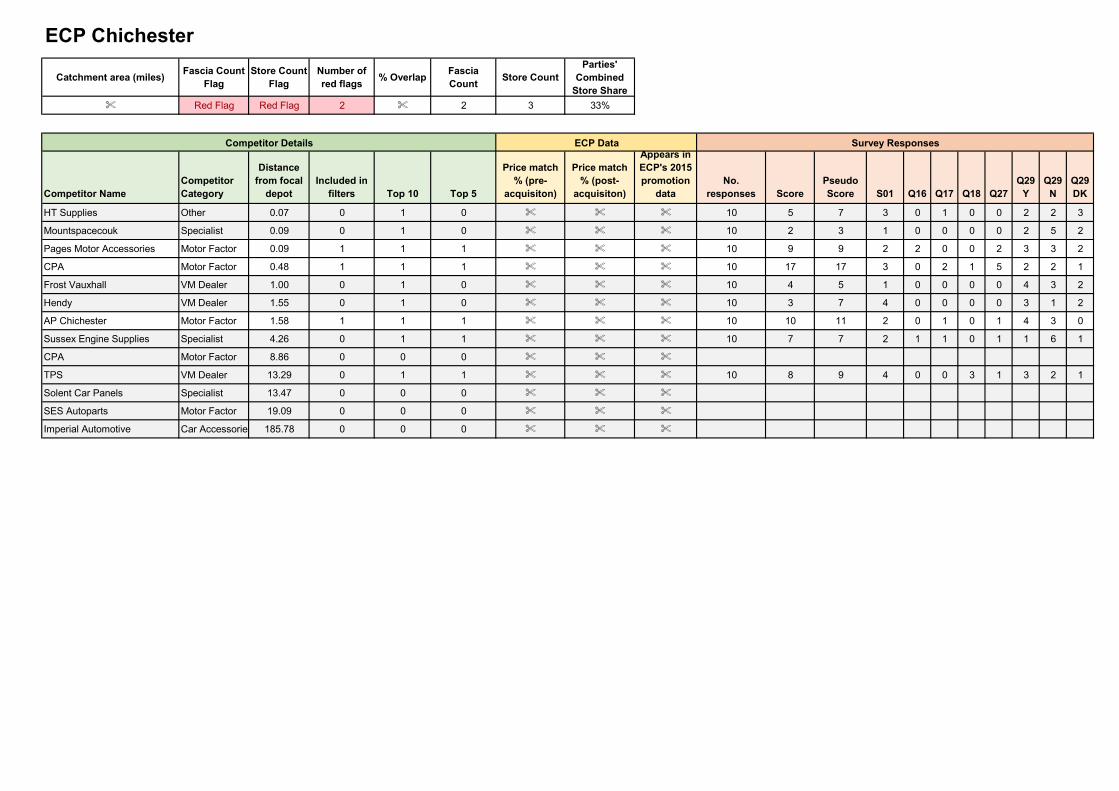
Catchment area (miles)Fascia Count
FlagStore Count
FlagNumber of red flags
% OverlapFascia Count
Store CountParties'
Combined Store Share
% Red Flag Red Flag 2 % 2 3 33%
Competitor NameCompetitor Category
Distance from focal
depotIncluded in
filters Top 10 Top 5
Price match % (pre-
acquisiton)
Price match % (post-
acquisiton)
Appears in ECP's 2015 promotion
dataNo.
responses ScorePseudo Score S01 Q16 Q17 Q18 Q27
Q29 Y
Q29 N
Q29 DK
HT Supplies Other 0.07 0 1 0 % % % 10 5 7 3 0 1 0 0 2 2 3
Mountspacecouk Specialist 0.09 0 1 0 % % % 10 2 3 1 0 0 0 0 2 5 2
Pages Motor Accessories Motor Factor 0.09 1 1 1 % % % 10 9 9 2 2 0 0 2 3 3 2
CPA Motor Factor 0.48 1 1 1 % % % 10 17 17 3 0 2 1 5 2 2 1
Frost Vauxhall VM Dealer 1.00 0 1 0 % % % 10 4 5 1 0 0 0 0 4 3 2
Hendy VM Dealer 1.55 0 1 0 % % % 10 3 7 4 0 0 0 0 3 1 2
AP Chichester Motor Factor 1.58 1 1 1 % % % 10 10 11 2 0 1 0 1 4 3 0
Sussex Engine Supplies Specialist 4.26 0 1 1 % % % 10 7 7 2 1 1 0 1 1 6 1
CPA Motor Factor 8.86 0 0 0 % % %
TPS VM Dealer 13.29 0 1 1 % % % 10 8 9 4 0 0 3 1 3 2 1
Solent Car Panels Specialist 13.47 0 0 0 % % %
SES Autoparts Motor Factor 19.09 0 0 0 % % %
Imperial Automotive Car Accessories 185.78 0 0 0 % % %
ECP Chichester
Competitor Details ECP Data Survey Responses
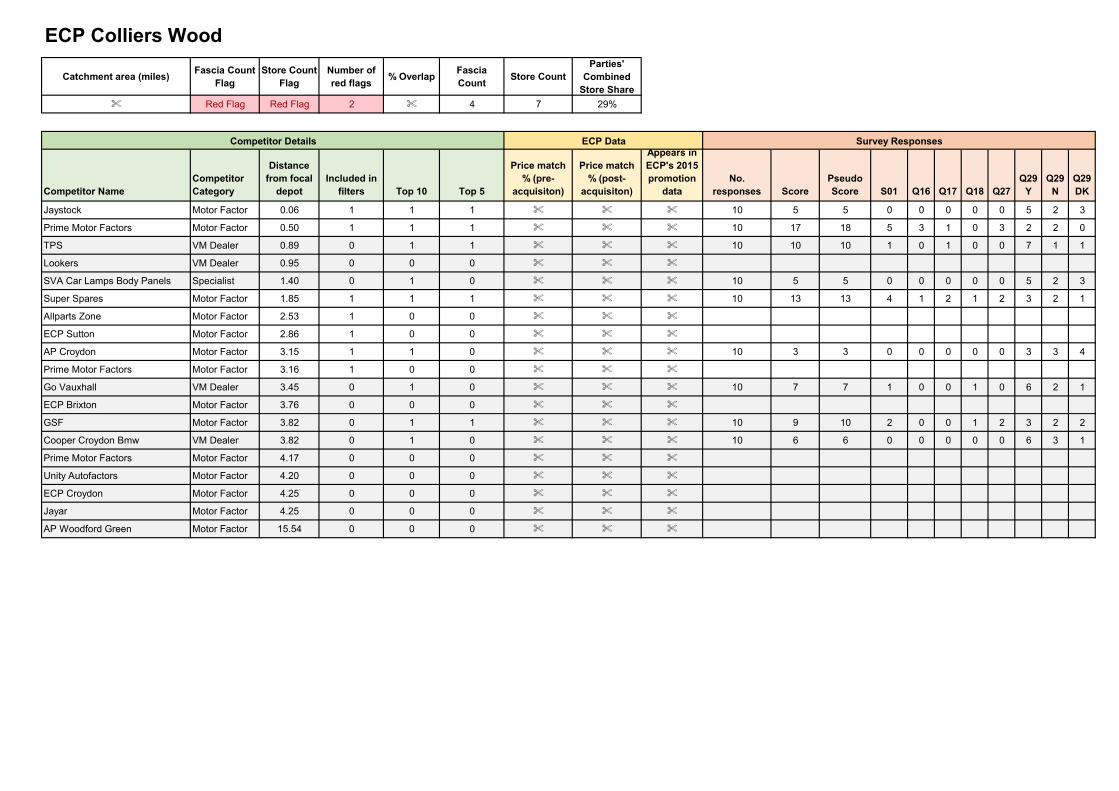
Catchment area (miles)Fascia Count
FlagStore Count
FlagNumber of red flags
% OverlapFascia Count
Store CountParties'
Combined Store Share
% Red Flag Red Flag 2 % 4 7 29%
Competitor NameCompetitor Category
Distance from focal
depotIncluded in
filters Top 10 Top 5
Price match % (pre-
acquisiton)
Price match % (post-
acquisiton)
Appears in ECP's 2015 promotion
dataNo.
responses ScorePseudo Score S01 Q16 Q17 Q18 Q27
Q29 Y
Q29 N
Q29 DK
Jaystock Motor Factor 0.06 1 1 1 % % % 10 5 5 0 0 0 0 0 5 2 3
Prime Motor Factors Motor Factor 0.50 1 1 1 % % % 10 17 18 5 3 1 0 3 2 2 0
TPS VM Dealer 0.89 0 1 1 % % % 10 10 10 1 0 1 0 0 7 1 1
Lookers VM Dealer 0.95 0 0 0 % % %
SVA Car Lamps Body Panels Specialist 1.40 0 1 0 % % % 10 5 5 0 0 0 0 0 5 2 3
Super Spares Motor Factor 1.85 1 1 1 % % % 10 13 13 4 1 2 1 2 3 2 1
Allparts Zone Motor Factor 2.53 1 0 0 % % %
ECP Sutton Motor Factor 2.86 1 0 0 % % %
AP Croydon Motor Factor 3.15 1 1 0 % % % 10 3 3 0 0 0 0 0 3 3 4
Prime Motor Factors Motor Factor 3.16 1 0 0 % % %
Go Vauxhall VM Dealer 3.45 0 1 0 % % % 10 7 7 1 0 0 1 0 6 2 1
ECP Brixton Motor Factor 3.76 0 0 0 % % %
GSF Motor Factor 3.82 0 1 1 % % % 10 9 10 2 0 0 1 2 3 2 2
Cooper Croydon Bmw VM Dealer 3.82 0 1 0 % % % 10 6 6 0 0 0 0 0 6 3 1
Prime Motor Factors Motor Factor 4.17 0 0 0 % % %
Unity Autofactors Motor Factor 4.20 0 0 0 % % %
ECP Croydon Motor Factor 4.25 0 0 0 % % %
Jayar Motor Factor 4.25 0 0 0 % % %
AP Woodford Green Motor Factor 15.54 0 0 0 % % %
ECP Colliers Wood
Competitor Details ECP Data Survey Responses
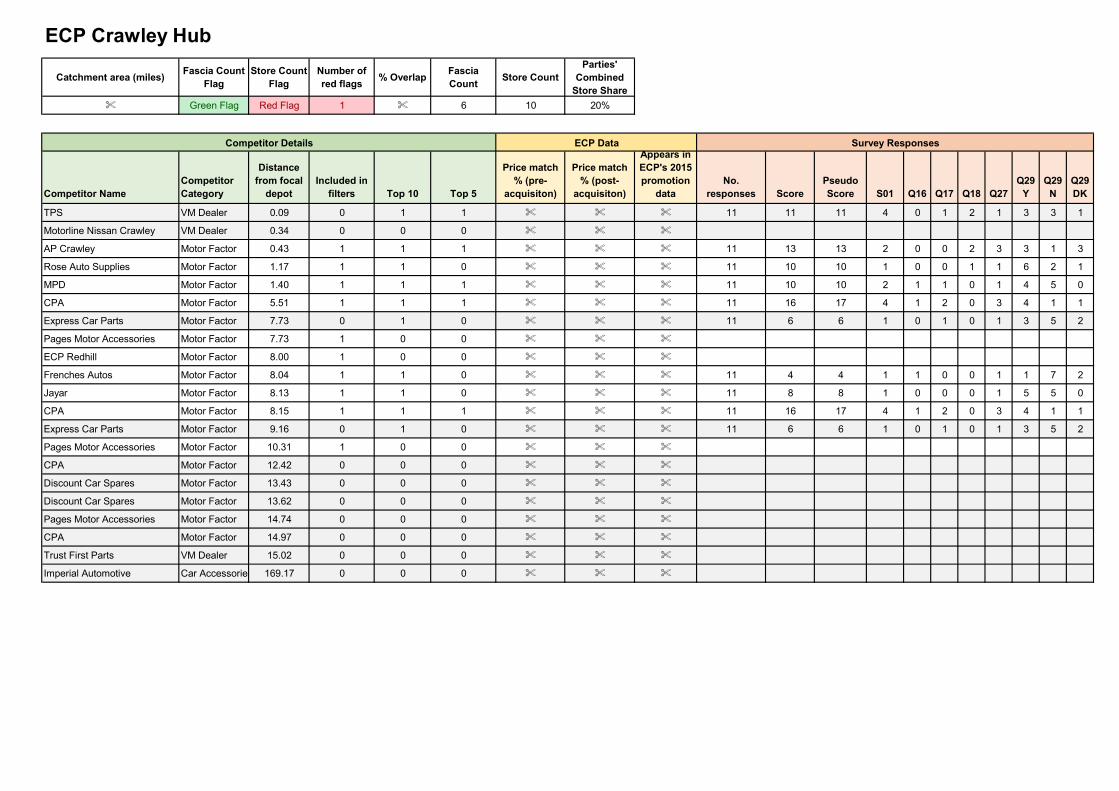
Catchment area (miles)Fascia Count
FlagStore Count
FlagNumber of red flags
% OverlapFascia Count
Store CountParties'
Combined Store Share
% Green Flag Red Flag 1 % 6 10 20%
Competitor NameCompetitor Category
Distance from focal
depotIncluded in
filters Top 10 Top 5
Price match % (pre-
acquisiton)
Price match % (post-
acquisiton)
Appears in ECP's 2015 promotion
dataNo.
responses ScorePseudo Score S01 Q16 Q17 Q18 Q27
Q29 Y
Q29 N
Q29 DK
TPS VM Dealer 0.09 0 1 1 % % % 11 11 11 4 0 1 2 1 3 3 1
Motorline Nissan Crawley VM Dealer 0.34 0 0 0 % % %
AP Crawley Motor Factor 0.43 1 1 1 % % % 11 13 13 2 0 0 2 3 3 1 3
Rose Auto Supplies Motor Factor 1.17 1 1 0 % % % 11 10 10 1 0 0 1 1 6 2 1
MPD Motor Factor 1.40 1 1 1 % % % 11 10 10 2 1 1 0 1 4 5 0
CPA Motor Factor 5.51 1 1 1 % % % 11 16 17 4 1 2 0 3 4 1 1
Express Car Parts Motor Factor 7.73 0 1 0 % % % 11 6 6 1 0 1 0 1 3 5 2
Pages Motor Accessories Motor Factor 7.73 1 0 0 % % %
ECP Redhill Motor Factor 8.00 1 0 0 % % %
Frenches Autos Motor Factor 8.04 1 1 0 % % % 11 4 4 1 1 0 0 1 1 7 2
Jayar Motor Factor 8.13 1 1 0 % % % 11 8 8 1 0 0 0 1 5 5 0
CPA Motor Factor 8.15 1 1 1 % % % 11 16 17 4 1 2 0 3 4 1 1
Express Car Parts Motor Factor 9.16 0 1 0 % % % 11 6 6 1 0 1 0 1 3 5 2
Pages Motor Accessories Motor Factor 10.31 1 0 0 % % %
CPA Motor Factor 12.42 0 0 0 % % %
Discount Car Spares Motor Factor 13.43 0 0 0 % % %
Discount Car Spares Motor Factor 13.62 0 0 0 % % %
Pages Motor Accessories Motor Factor 14.74 0 0 0 % % %
CPA Motor Factor 14.97 0 0 0 % % %
Trust First Parts VM Dealer 15.02 0 0 0 % % %
Imperial Automotive Car Accessories 169.17 0 0 0 % % %
ECP Crawley Hub
Competitor Details ECP Data Survey Responses
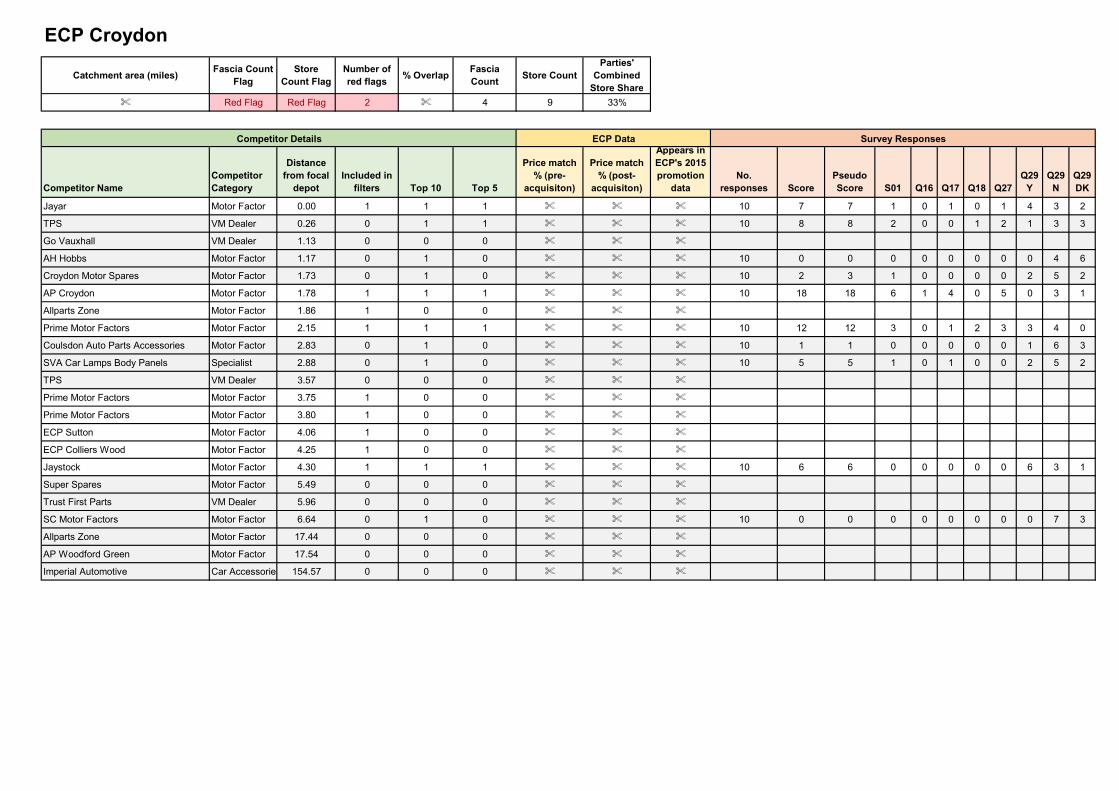
Catchment area (miles)Fascia Count
FlagStore
Count FlagNumber of red flags
% OverlapFascia Count
Store CountParties'
Combined Store Share
% Red Flag Red Flag 2 % 4 9 33%
Competitor NameCompetitor Category
Distance from focal
depotIncluded in
filters Top 10 Top 5
Price match % (pre-
acquisiton)
Price match % (post-
acquisiton)
Appears in ECP's 2015 promotion
dataNo.
responses ScorePseudo Score S01 Q16 Q17 Q18 Q27
Q29 Y
Q29 N
Q29 DK
Jayar Motor Factor 0.00 1 1 1 % % % 10 7 7 1 0 1 0 1 4 3 2
TPS VM Dealer 0.26 0 1 1 % % % 10 8 8 2 0 0 1 2 1 3 3
Go Vauxhall VM Dealer 1.13 0 0 0 % % %
AH Hobbs Motor Factor 1.17 0 1 0 % % % 10 0 0 0 0 0 0 0 0 4 6
Croydon Motor Spares Motor Factor 1.73 0 1 0 % % % 10 2 3 1 0 0 0 0 2 5 2
AP Croydon Motor Factor 1.78 1 1 1 % % % 10 18 18 6 1 4 0 5 0 3 1
Allparts Zone Motor Factor 1.86 1 0 0 % % %
Prime Motor Factors Motor Factor 2.15 1 1 1 % % % 10 12 12 3 0 1 2 3 3 4 0
Coulsdon Auto Parts Accessories Motor Factor 2.83 0 1 0 % % % 10 1 1 0 0 0 0 0 1 6 3
SVA Car Lamps Body Panels Specialist 2.88 0 1 0 % % % 10 5 5 1 0 1 0 0 2 5 2
TPS VM Dealer 3.57 0 0 0 % % %
Prime Motor Factors Motor Factor 3.75 1 0 0 % % %
Prime Motor Factors Motor Factor 3.80 1 0 0 % % %
ECP Sutton Motor Factor 4.06 1 0 0 % % %
ECP Colliers Wood Motor Factor 4.25 1 0 0 % % %
Jaystock Motor Factor 4.30 1 1 1 % % % 10 6 6 0 0 0 0 0 6 3 1
Super Spares Motor Factor 5.49 0 0 0 % % %
Trust First Parts VM Dealer 5.96 0 0 0 % % %
SC Motor Factors Motor Factor 6.64 0 1 0 % % % 10 0 0 0 0 0 0 0 0 7 3
Allparts Zone Motor Factor 17.44 0 0 0 % % %
AP Woodford Green Motor Factor 17.54 0 0 0 % % %
Imperial Automotive Car Accessories 154.57 0 0 0 % % %
ECP Croydon
Competitor Details ECP Data Survey Responses
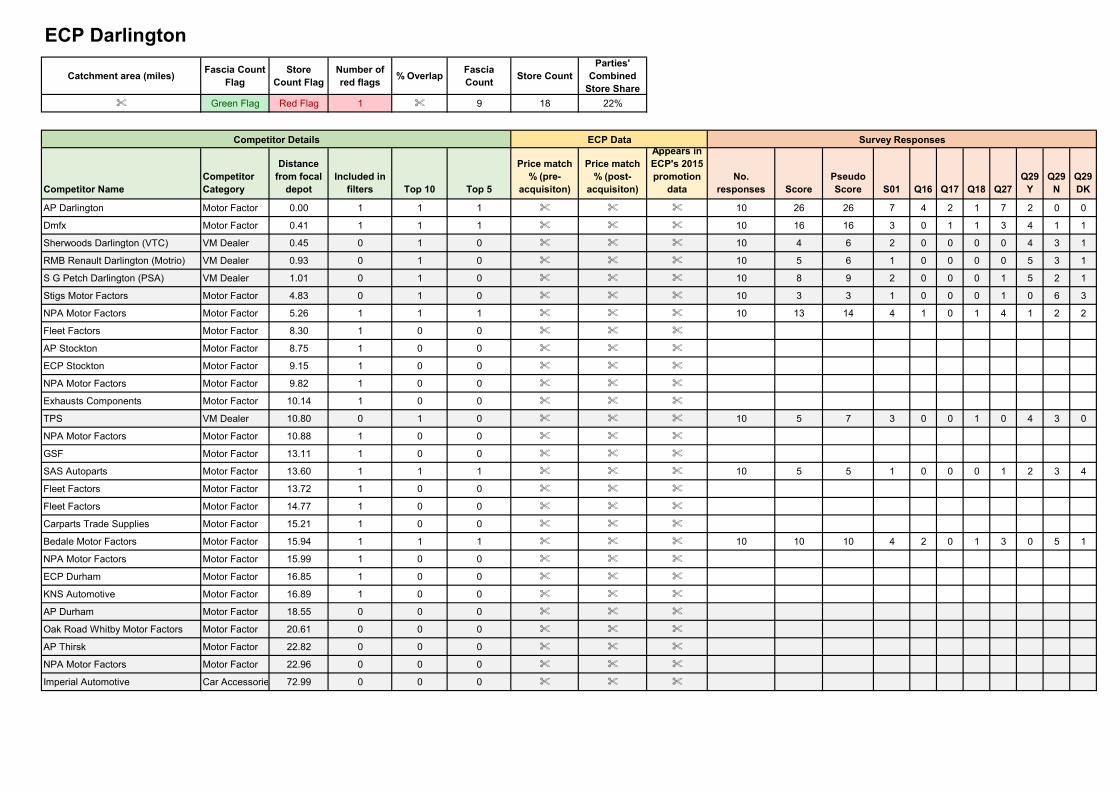
Catchment area (miles)Fascia Count
FlagStore
Count FlagNumber of red flags
% OverlapFascia Count
Store CountParties'
Combined Store Share
% Green Flag Red Flag 1 % 9 18 22%
Competitor NameCompetitor Category
Distance from focal
depotIncluded in
filters Top 10 Top 5
Price match % (pre-
acquisiton)
Price match % (post-
acquisiton)
Appears in ECP's 2015 promotion
dataNo.
responses ScorePseudo Score S01 Q16 Q17 Q18 Q27
Q29 Y
Q29 N
Q29 DK
AP Darlington Motor Factor 0.00 1 1 1 % % % 10 26 26 7 4 2 1 7 2 0 0
Dmfx Motor Factor 0.41 1 1 1 % % % 10 16 16 3 0 1 1 3 4 1 1
Sherwoods Darlington (VTC) VM Dealer 0.45 0 1 0 % % % 10 4 6 2 0 0 0 0 4 3 1
RMB Renault Darlington (Motrio) VM Dealer 0.93 0 1 0 % % % 10 5 6 1 0 0 0 0 5 3 1
S G Petch Darlington (PSA) VM Dealer 1.01 0 1 0 % % % 10 8 9 2 0 0 0 1 5 2 1
Stigs Motor Factors Motor Factor 4.83 0 1 0 % % % 10 3 3 1 0 0 0 1 0 6 3
NPA Motor Factors Motor Factor 5.26 1 1 1 % % % 10 13 14 4 1 0 1 4 1 2 2
Fleet Factors Motor Factor 8.30 1 0 0 % % %
AP Stockton Motor Factor 8.75 1 0 0 % % %
ECP Stockton Motor Factor 9.15 1 0 0 % % %
NPA Motor Factors Motor Factor 9.82 1 0 0 % % %
Exhausts Components Motor Factor 10.14 1 0 0 % % %
TPS VM Dealer 10.80 0 1 0 % % % 10 5 7 3 0 0 1 0 4 3 0
NPA Motor Factors Motor Factor 10.88 1 0 0 % % %
GSF Motor Factor 13.11 1 0 0 % % %
SAS Autoparts Motor Factor 13.60 1 1 1 % % % 10 5 5 1 0 0 0 1 2 3 4
Fleet Factors Motor Factor 13.72 1 0 0 % % %
Fleet Factors Motor Factor 14.77 1 0 0 % % %
Carparts Trade Supplies Motor Factor 15.21 1 0 0 % % %
Bedale Motor Factors Motor Factor 15.94 1 1 1 % % % 10 10 10 4 2 0 1 3 0 5 1
NPA Motor Factors Motor Factor 15.99 1 0 0 % % %
ECP Durham Motor Factor 16.85 1 0 0 % % %
KNS Automotive Motor Factor 16.89 1 0 0 % % %
AP Durham Motor Factor 18.55 0 0 0 % % %
Oak Road Whitby Motor Factors Motor Factor 20.61 0 0 0 % % %
AP Thirsk Motor Factor 22.82 0 0 0 % % %
NPA Motor Factors Motor Factor 22.96 0 0 0 % % %
Imperial Automotive Car Accessories 72.99 0 0 0 % % %
ECP Darlington
Competitor Details ECP Data Survey Responses

Catchment area (miles)Fascia Count
FlagStore Count
FlagNumber of red flags
% OverlapFascia Count
Store CountParties'
Combined Store Share
% Red Flag Red Flag 2 % 4 11 36%
Competitor NameCompetitor Category
Distance from focal
depotIncluded in
filters Top 10 Top 5
Price match % (pre-
acquisiton)
Price match % (post-
acquisiton)
Appears in ECP's 2015 promotion
dataNo.
responses ScorePseudo Score S01 Q16 Q17 Q18 Q27
Q29 Y
Q29 N
Q29 DK
AP Durham Motor Factor 2.43 1 1 1 % % % 12 13 13 5 0 2 3 2 4 3 0
Fleet Factors Motor Factor 3.14 1 0 0 % % %
Carparts Trade Supplies Motor Factor 3.38 1 1 1 % % % 12 11 11 3 0 3 0 2 2 3 4
Express Motor Factors Motor Factor 6.27 0 1 0 % % % 12 0 0 0 0 0 0 0 0 8 4
KNS Automotive Motor Factor 6.81 1 1 1 % % % 12 9 9 2 1 1 0 1 3 5 2
NPA Motor Factors Motor Factor 6.90 1 1 0 % % % 12 19 19 3 2 1 0 5 1 4 1
NPA Motor Factors Motor Factor 9.31 1 1 1 % % % 12 19 19 3 2 1 0 5 1 4 1
Speedo Motor Accessories Motor Factor 9.57 0 1 0 % % % 12 4 4 1 1 0 0 1 1 6 4
ECP Sunderland Ngh Motor Factor 9.76 1 0 0 % % %
D Ward Automotive Motor Factor 10.01 0 1 0 % % % 12 6 6 2 1 0 1 1 2 4 4
Coulthards Motor Factors Motor Factor 10.01 0 1 0 % % % 12 2 2 1 0 0 1 0 1 6 4
AP Sunderland Motor Factor 10.74 1 0 0 % % %
ECP Newcastle - Gateshead Motor Factor 11.75 1 0 0 % % %
NPA Motor Factors Motor Factor 11.79 1 1 1 % % % 12 19 19 3 2 1 0 5 1 4 1
Fleet Factors Motor Factor 13.01 1 0 0 % % %
AP Newcastle Motor Factor 13.78 0 0 0 % % %
Carparts Trade Supplies Motor Factor 13.86 0 0 0 % % %
NPA Motor Factors Motor Factor 14.50 0 0 0 % % %
Northumbrian Car Commercial Motor Factor 14.89 0 0 0 % % %
AP Newburton Motor Factor 14.94 0 0 0 % % %
NPA Motor Factors Motor Factor 15.07 0 0 0 % % %
TPS VM Dealer 15.61 0 0 0 % % %
Carparts Trade Supplies Motor Factor 15.67 0 0 0 % % %
ECP Longbenton Motor Factor 16.36 0 0 0 % % %
Dmfx Motor Factor 16.59 0 0 0 % % %
AP Darlington Motor Factor 16.85 0 0 0 % % %
ECP Darlington Motor Factor 16.85 0 0 0 % % %
NPA Motor Factors Motor Factor 17.08 0 0 0 % % %
TPS VM Dealer 17.25 0 0 0 % % %
Exhausts Components Motor Factor 17.28 0 0 0 % % %
AP Stockton Motor Factor 18.56 0 0 0 % % %
Imperial Automotive Car Accessories 89.40 0 0 0 % % %
ECP Durham
Competitor Details ECP Data Survey Responses

Catchment area (miles)Fascia Count
FlagStore
Count FlagNumber of red flags
% OverlapFascia Count
Store CountParties'
Combined Store Share
% Green Flag Red Flag 1 % 7 12 25%
Competitor NameCompetitor Category
Distance from focal
depotIncluded in
filters Top 10 Top 5
Price match % (pre-
acquisiton)
Price match % (post-
acquisiton)
Appears in ECP's 2015 promotion
dataNo.
responses ScorePseudo Score S01 Q16 Q17 Q18 Q27
Q29 Y
Q29 N
Q29 DK
Paddington Motor Parts Motor Factor 0.15 1 1 1 % % % 10 9 9 2 1 0 1 2 2 4 1
Solent Truck Parts Specialist 0.15 0 0 0 % % %
SES Autoparts Motor Factor 0.98 1 1 1 % % % 10 14 15 4 3 0 0 2 2 3 0
AP Fareham Motor Factor 1.87 1 1 1 % % % 10 16 17 5 0 3 1 4 4 1 0
MPD Motor Factor 3.78 1 1 1 % % % 10 17 17 4 1 0 3 5 1 3 0
AP Portsmouth Motor Factor 5.68 1 0 0 % % %
TPS VM Dealer 5.68 0 1 0 % % % 10 10 10 3 0 1 2 0 5 2 0
Pro-Parts Motor Factor 5.89 1 1 0 % % % 10 4 4 1 1 0 0 1 1 6 2
MPD Motor Factor 5.93 1 0 0 % % %
ECP Portsmouth Motor Factor 5.93 1 0 0 % % %
Express Paints Specialist 6.01 0 0 0 % % %
Pro-Parts Motor Factor 6.41 1 0 0 % % %
GSF Motor Factor 6.64 1 1 0 % % % 10 8 9 1 0 0 0 1 5 3 0
Total Motor Factors Motor Factor 6.69 1 0 0 % % %
Havant Motor Factors Motor Factor 8.01 1 0 0 % % %
Westleigh Motor Factors Motor Factor 9.01 0 0 0 % % %
Rainbow Paints Specialist 9.56 0 0 0 % % %
H Kimber Friction Motor Factor 9.74 0 1 1 % % % 10 1 2 1 0 0 0 0 1 8 0
Jayar Motor Factor 10.01 0 0 0 % % %
Dorset Auto Spares Motor Factor 10.07 0 1 0 % % % 10 1 1 0 0 0 0 0 1 7 2
Jaystock Motor Factor 10.32 0 0 0 % % %
SES Autoparts Motor Factor 10.35 0 0 0 % % %
AP Eastleigh Motor Factor 11.33 0 0 0 % % %
TPS VM Dealer 12.36 0 0 0 % % %
Smart Express By Morelli Group Specialist 72.98 0 0 0 % % %
Imperial Automotive Car Accessories 182.86 0 0 0 % % %
ECP Fareham
Competitor Details ECP Data Survey Responses
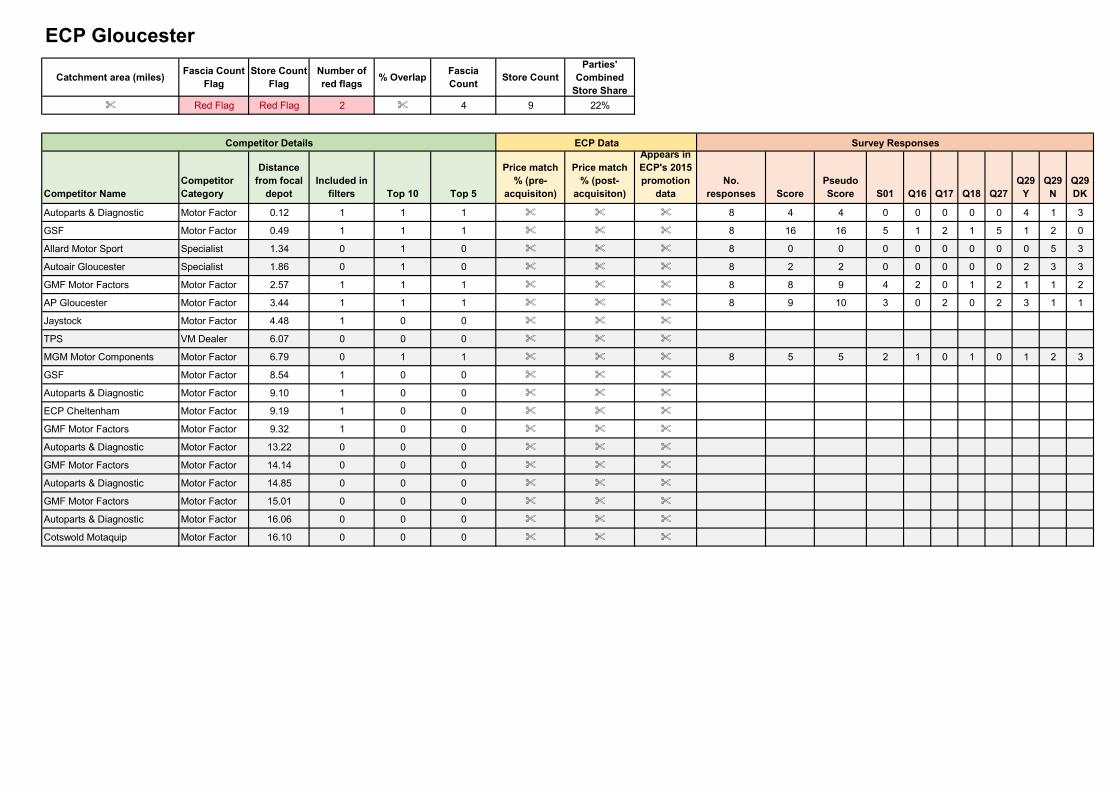
Catchment area (miles)Fascia Count
FlagStore Count
FlagNumber of red flags
% OverlapFascia Count
Store CountParties'
Combined Store Share
% Red Flag Red Flag 2 % 4 9 22%
Competitor NameCompetitor Category
Distance from focal
depotIncluded in
filters Top 10 Top 5
Price match % (pre-
acquisiton)
Price match % (post-
acquisiton)
Appears in ECP's 2015 promotion
dataNo.
responses ScorePseudo Score S01 Q16 Q17 Q18 Q27
Q29 Y
Q29 N
Q29 DK
Autoparts & Diagnostic Motor Factor 0.12 1 1 1 % % % 8 4 4 0 0 0 0 0 4 1 3
GSF Motor Factor 0.49 1 1 1 % % % 8 16 16 5 1 2 1 5 1 2 0
Allard Motor Sport Specialist 1.34 0 1 0 % % % 8 0 0 0 0 0 0 0 0 5 3
Autoair Gloucester Specialist 1.86 0 1 0 % % % 8 2 2 0 0 0 0 0 2 3 3
GMF Motor Factors Motor Factor 2.57 1 1 1 % % % 8 8 9 4 2 0 1 2 1 1 2
AP Gloucester Motor Factor 3.44 1 1 1 % % % 8 9 10 3 0 2 0 2 3 1 1
Jaystock Motor Factor 4.48 1 0 0 % % %
TPS VM Dealer 6.07 0 0 0 % % %
MGM Motor Components Motor Factor 6.79 0 1 1 % % % 8 5 5 2 1 0 1 0 1 2 3
GSF Motor Factor 8.54 1 0 0 % % %
Autoparts & Diagnostic Motor Factor 9.10 1 0 0 % % %
ECP Cheltenham Motor Factor 9.19 1 0 0 % % %
GMF Motor Factors Motor Factor 9.32 1 0 0 % % %
Autoparts & Diagnostic Motor Factor 13.22 0 0 0 % % %
GMF Motor Factors Motor Factor 14.14 0 0 0 % % %
Autoparts & Diagnostic Motor Factor 14.85 0 0 0 % % %
GMF Motor Factors Motor Factor 15.01 0 0 0 % % %
Autoparts & Diagnostic Motor Factor 16.06 0 0 0 % % %
Cotswold Motaquip Motor Factor 16.10 0 0 0 % % %
ECP Gloucester
Competitor Details ECP Data Survey Responses
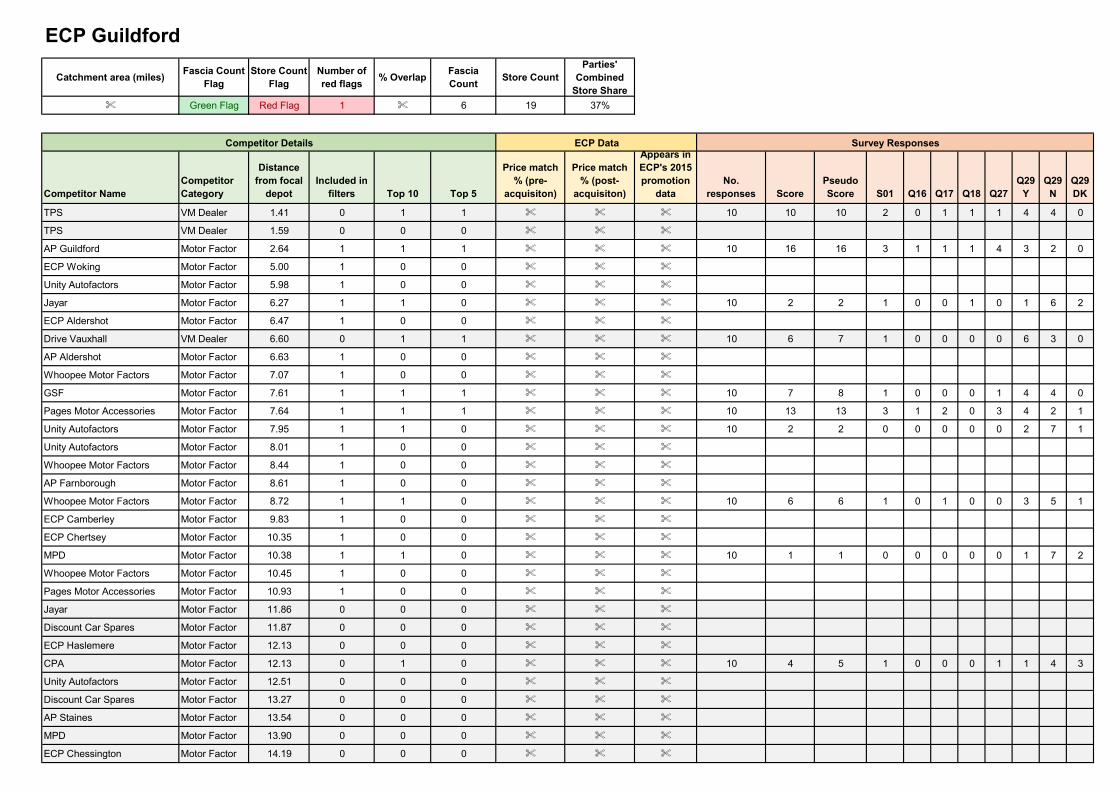
Catchment area (miles)Fascia Count
FlagStore Count
FlagNumber of red flags
% OverlapFascia Count
Store CountParties'
Combined Store Share
% Green Flag Red Flag 1 % 6 19 37%
Competitor NameCompetitor Category
Distance from focal
depotIncluded in
filters Top 10 Top 5
Price match % (pre-
acquisiton)
Price match % (post-
acquisiton)
Appears in ECP's 2015 promotion
dataNo.
responses ScorePseudo Score S01 Q16 Q17 Q18 Q27
Q29 Y
Q29 N
Q29 DK
TPS VM Dealer 1.41 0 1 1 % % % 10 10 10 2 0 1 1 1 4 4 0
TPS VM Dealer 1.59 0 0 0 % % %
AP Guildford Motor Factor 2.64 1 1 1 % % % 10 16 16 3 1 1 1 4 3 2 0
ECP Woking Motor Factor 5.00 1 0 0 % % %
Unity Autofactors Motor Factor 5.98 1 0 0 % % %
Jayar Motor Factor 6.27 1 1 0 % % % 10 2 2 1 0 0 1 0 1 6 2
ECP Aldershot Motor Factor 6.47 1 0 0 % % %
Drive Vauxhall VM Dealer 6.60 0 1 1 % % % 10 6 7 1 0 0 0 0 6 3 0
AP Aldershot Motor Factor 6.63 1 0 0 % % %
Whoopee Motor Factors Motor Factor 7.07 1 0 0 % % %
GSF Motor Factor 7.61 1 1 1 % % % 10 7 8 1 0 0 0 1 4 4 0
Pages Motor Accessories Motor Factor 7.64 1 1 1 % % % 10 13 13 3 1 2 0 3 4 2 1
Unity Autofactors Motor Factor 7.95 1 1 0 % % % 10 2 2 0 0 0 0 0 2 7 1
Unity Autofactors Motor Factor 8.01 1 0 0 % % %
Whoopee Motor Factors Motor Factor 8.44 1 0 0 % % %
AP Farnborough Motor Factor 8.61 1 0 0 % % %
Whoopee Motor Factors Motor Factor 8.72 1 1 0 % % % 10 6 6 1 0 1 0 0 3 5 1
ECP Camberley Motor Factor 9.83 1 0 0 % % %
ECP Chertsey Motor Factor 10.35 1 0 0 % % %
MPD Motor Factor 10.38 1 1 0 % % % 10 1 1 0 0 0 0 0 1 7 2
Whoopee Motor Factors Motor Factor 10.45 1 0 0 % % %
Pages Motor Accessories Motor Factor 10.93 1 0 0 % % %
Jayar Motor Factor 11.86 0 0 0 % % %
Discount Car Spares Motor Factor 11.87 0 0 0 % % %
ECP Haslemere Motor Factor 12.13 0 0 0 % % %
CPA Motor Factor 12.13 0 1 0 % % % 10 4 5 1 0 0 0 1 1 4 3
Unity Autofactors Motor Factor 12.51 0 0 0 % % %
Discount Car Spares Motor Factor 13.27 0 0 0 % % %
AP Staines Motor Factor 13.54 0 0 0 % % %
MPD Motor Factor 13.90 0 0 0 % % %
ECP Chessington Motor Factor 14.19 0 0 0 % % %
ECP Guildford
Competitor Details ECP Data Survey Responses
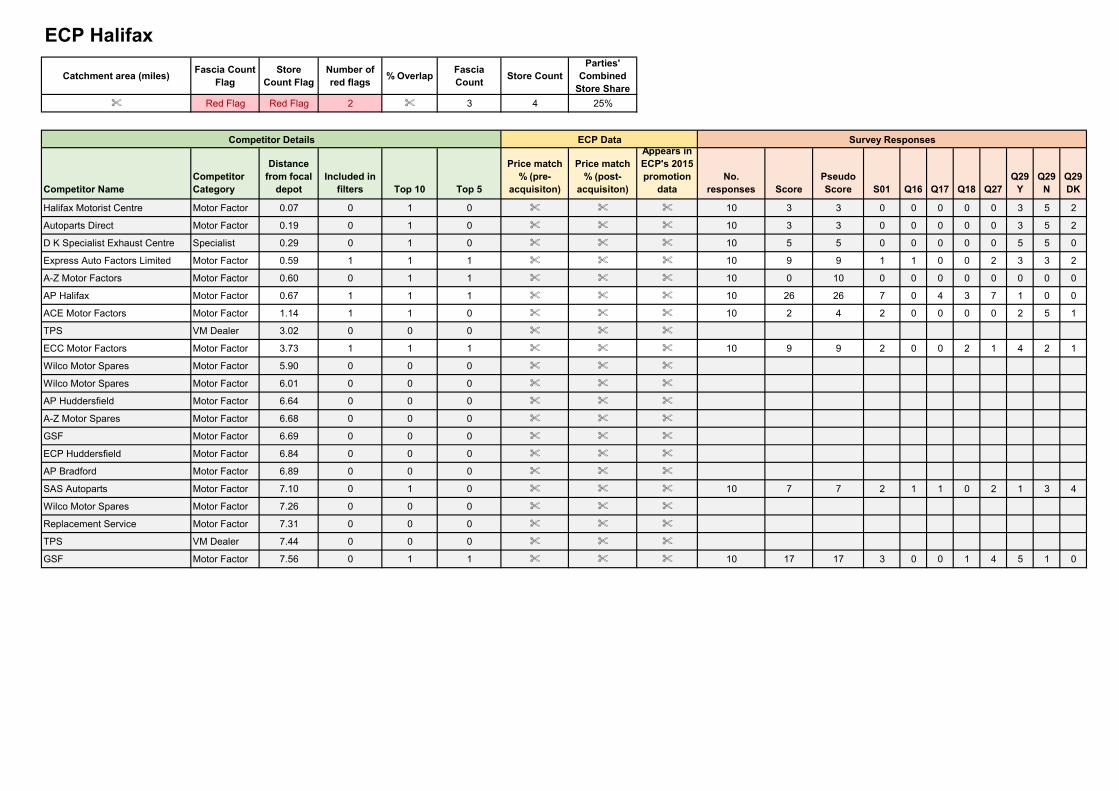
Catchment area (miles)Fascia Count
FlagStore
Count FlagNumber of red flags
% OverlapFascia Count
Store CountParties'
Combined Store Share
% Red Flag Red Flag 2 % 3 4 25%
Competitor NameCompetitor Category
Distance from focal
depotIncluded in
filters Top 10 Top 5
Price match % (pre-
acquisiton)
Price match % (post-
acquisiton)
Appears in ECP's 2015 promotion
dataNo.
responses ScorePseudo Score S01 Q16 Q17 Q18 Q27
Q29 Y
Q29 N
Q29 DK
Halifax Motorist Centre Motor Factor 0.07 0 1 0 % % % 10 3 3 0 0 0 0 0 3 5 2
Autoparts Direct Motor Factor 0.19 0 1 0 % % % 10 3 3 0 0 0 0 0 3 5 2
D K Specialist Exhaust Centre Specialist 0.29 0 1 0 % % % 10 5 5 0 0 0 0 0 5 5 0
Express Auto Factors Limited Motor Factor 0.59 1 1 1 % % % 10 9 9 1 1 0 0 2 3 3 2
A-Z Motor Factors Motor Factor 0.60 0 1 1 % % % 10 0 10 0 0 0 0 0 0 0 0
AP Halifax Motor Factor 0.67 1 1 1 % % % 10 26 26 7 0 4 3 7 1 0 0
ACE Motor Factors Motor Factor 1.14 1 1 0 % % % 10 2 4 2 0 0 0 0 2 5 1
TPS VM Dealer 3.02 0 0 0 % % %
ECC Motor Factors Motor Factor 3.73 1 1 1 % % % 10 9 9 2 0 0 2 1 4 2 1
Wilco Motor Spares Motor Factor 5.90 0 0 0 % % %
Wilco Motor Spares Motor Factor 6.01 0 0 0 % % %
AP Huddersfield Motor Factor 6.64 0 0 0 % % %
A-Z Motor Spares Motor Factor 6.68 0 0 0 % % %
GSF Motor Factor 6.69 0 0 0 % % %
ECP Huddersfield Motor Factor 6.84 0 0 0 % % %
AP Bradford Motor Factor 6.89 0 0 0 % % %
SAS Autoparts Motor Factor 7.10 0 1 0 % % % 10 7 7 2 1 1 0 2 1 3 4
Wilco Motor Spares Motor Factor 7.26 0 0 0 % % %
Replacement Service Motor Factor 7.31 0 0 0 % % %
TPS VM Dealer 7.44 0 0 0 % % %
GSF Motor Factor 7.56 0 1 1 % % % 10 17 17 3 0 0 1 4 5 1 0
ECP Halifax
Competitor Details ECP Data Survey Responses
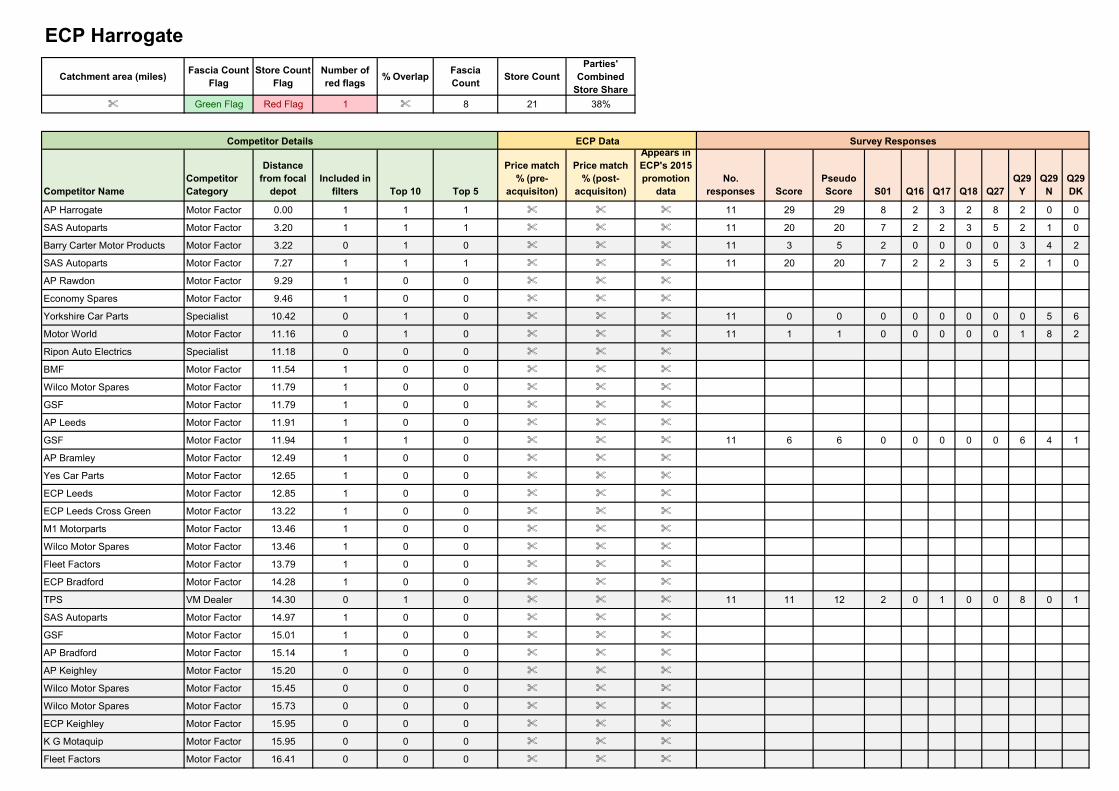
Catchment area (miles)Fascia Count
FlagStore Count
FlagNumber of red flags
% OverlapFascia Count
Store CountParties'
Combined Store Share
% Green Flag Red Flag 1 % 8 21 38%
Competitor NameCompetitor Category
Distance from focal
depotIncluded in
filters Top 10 Top 5
Price match % (pre-
acquisiton)
Price match % (post-
acquisiton)
Appears in ECP's 2015 promotion
dataNo.
responses ScorePseudo Score S01 Q16 Q17 Q18 Q27
Q29 Y
Q29 N
Q29 DK
AP Harrogate Motor Factor 0.00 1 1 1 % % % 11 29 29 8 2 3 2 8 2 0 0
SAS Autoparts Motor Factor 3.20 1 1 1 % % % 11 20 20 7 2 2 3 5 2 1 0
Barry Carter Motor Products Motor Factor 3.22 0 1 0 % % % 11 3 5 2 0 0 0 0 3 4 2
SAS Autoparts Motor Factor 7.27 1 1 1 % % % 11 20 20 7 2 2 3 5 2 1 0
AP Rawdon Motor Factor 9.29 1 0 0 % % %
Economy Spares Motor Factor 9.46 1 0 0 % % %
Yorkshire Car Parts Specialist 10.42 0 1 0 % % % 11 0 0 0 0 0 0 0 0 5 6
Motor World Motor Factor 11.16 0 1 0 % % % 11 1 1 0 0 0 0 0 1 8 2
Ripon Auto Electrics Specialist 11.18 0 0 0 % % %
BMF Motor Factor 11.54 1 0 0 % % %
Wilco Motor Spares Motor Factor 11.79 1 0 0 % % %
GSF Motor Factor 11.79 1 0 0 % % %
AP Leeds Motor Factor 11.91 1 0 0 % % %
GSF Motor Factor 11.94 1 1 0 % % % 11 6 6 0 0 0 0 0 6 4 1
AP Bramley Motor Factor 12.49 1 0 0 % % %
Yes Car Parts Motor Factor 12.65 1 0 0 % % %
ECP Leeds Motor Factor 12.85 1 0 0 % % %
ECP Leeds Cross Green Motor Factor 13.22 1 0 0 % % %
M1 Motorparts Motor Factor 13.46 1 0 0 % % %
Wilco Motor Spares Motor Factor 13.46 1 0 0 % % %
Fleet Factors Motor Factor 13.79 1 0 0 % % %
ECP Bradford Motor Factor 14.28 1 0 0 % % %
TPS VM Dealer 14.30 0 1 0 % % % 11 11 12 2 0 1 0 0 8 0 1
SAS Autoparts Motor Factor 14.97 1 0 0 % % %
GSF Motor Factor 15.01 1 0 0 % % %
AP Bradford Motor Factor 15.14 1 0 0 % % %
AP Keighley Motor Factor 15.20 0 0 0 % % %
Wilco Motor Spares Motor Factor 15.45 0 0 0 % % %
Wilco Motor Spares Motor Factor 15.73 0 0 0 % % %
ECP Keighley Motor Factor 15.95 0 0 0 % % %
K G Motaquip Motor Factor 15.95 0 0 0 % % %
Fleet Factors Motor Factor 16.41 0 0 0 % % %
ECP Harrogate
Competitor Details ECP Data Survey Responses
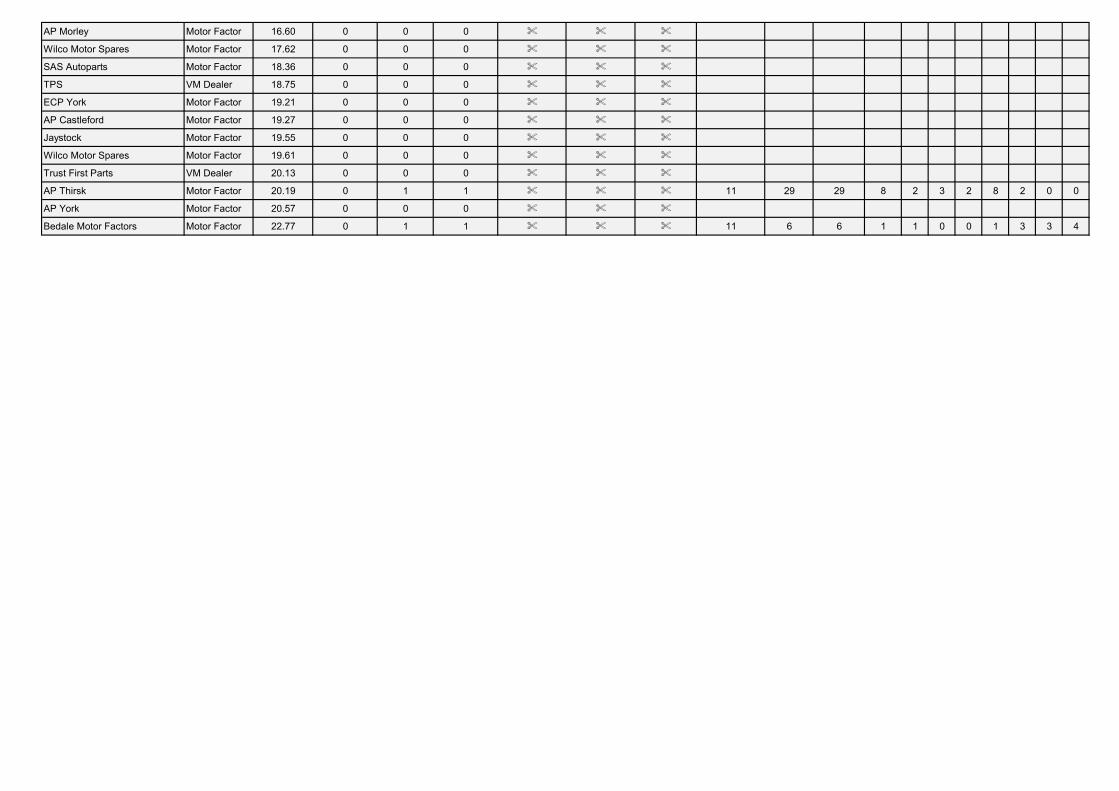
AP Morley Motor Factor 16.60 0 0 0 % % %
Wilco Motor Spares Motor Factor 17.62 0 0 0 % % %
SAS Autoparts Motor Factor 18.36 0 0 0 % % %
TPS VM Dealer 18.75 0 0 0 % % %
ECP York Motor Factor 19.21 0 0 0 % % %
AP Castleford Motor Factor 19.27 0 0 0 % % %
Jaystock Motor Factor 19.55 0 0 0 % % %
Wilco Motor Spares Motor Factor 19.61 0 0 0 % % %
Trust First Parts VM Dealer 20.13 0 0 0 % % %
AP Thirsk Motor Factor 20.19 0 1 1 % % % 11 29 29 8 2 3 2 8 2 0 0
AP York Motor Factor 20.57 0 0 0 % % %
Bedale Motor Factors Motor Factor 22.77 0 1 1 % % % 11 6 6 1 1 0 0 1 3 3 4
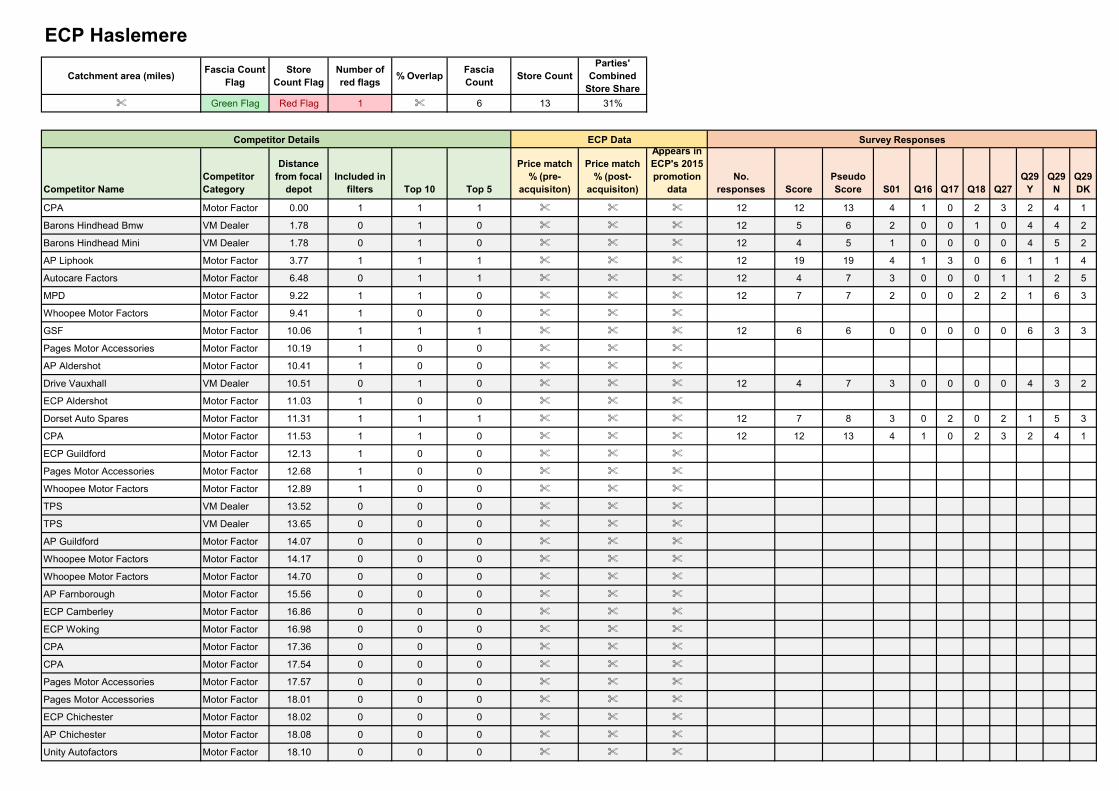
Catchment area (miles)Fascia Count
FlagStore
Count FlagNumber of red flags
% OverlapFascia Count
Store CountParties'
Combined Store Share
% Green Flag Red Flag 1 % 6 13 31%
Competitor NameCompetitor Category
Distance from focal
depotIncluded in
filters Top 10 Top 5
Price match % (pre-
acquisiton)
Price match % (post-
acquisiton)
Appears in ECP's 2015 promotion
dataNo.
responses ScorePseudo Score S01 Q16 Q17 Q18 Q27
Q29 Y
Q29 N
Q29 DK
CPA Motor Factor 0.00 1 1 1 % % % 12 12 13 4 1 0 2 3 2 4 1
Barons Hindhead Bmw VM Dealer 1.78 0 1 0 % % % 12 5 6 2 0 0 1 0 4 4 2
Barons Hindhead Mini VM Dealer 1.78 0 1 0 % % % 12 4 5 1 0 0 0 0 4 5 2
AP Liphook Motor Factor 3.77 1 1 1 % % % 12 19 19 4 1 3 0 6 1 1 4
Autocare Factors Motor Factor 6.48 0 1 1 % % % 12 4 7 3 0 0 0 1 1 2 5
MPD Motor Factor 9.22 1 1 0 % % % 12 7 7 2 0 0 2 2 1 6 3
Whoopee Motor Factors Motor Factor 9.41 1 0 0 % % %
GSF Motor Factor 10.06 1 1 1 % % % 12 6 6 0 0 0 0 0 6 3 3
Pages Motor Accessories Motor Factor 10.19 1 0 0 % % %
AP Aldershot Motor Factor 10.41 1 0 0 % % %
Drive Vauxhall VM Dealer 10.51 0 1 0 % % % 12 4 7 3 0 0 0 0 4 3 2
ECP Aldershot Motor Factor 11.03 1 0 0 % % %
Dorset Auto Spares Motor Factor 11.31 1 1 1 % % % 12 7 8 3 0 2 0 2 1 5 3
CPA Motor Factor 11.53 1 1 0 % % % 12 12 13 4 1 0 2 3 2 4 1
ECP Guildford Motor Factor 12.13 1 0 0 % % %
Pages Motor Accessories Motor Factor 12.68 1 0 0 % % %
Whoopee Motor Factors Motor Factor 12.89 1 0 0 % % %
TPS VM Dealer 13.52 0 0 0 % % %
TPS VM Dealer 13.65 0 0 0 % % %
AP Guildford Motor Factor 14.07 0 0 0 % % %
Whoopee Motor Factors Motor Factor 14.17 0 0 0 % % %
Whoopee Motor Factors Motor Factor 14.70 0 0 0 % % %
AP Farnborough Motor Factor 15.56 0 0 0 % % %
ECP Camberley Motor Factor 16.86 0 0 0 % % %
ECP Woking Motor Factor 16.98 0 0 0 % % %
CPA Motor Factor 17.36 0 0 0 % % %
CPA Motor Factor 17.54 0 0 0 % % %
Pages Motor Accessories Motor Factor 17.57 0 0 0 % % %
Pages Motor Accessories Motor Factor 18.01 0 0 0 % % %
ECP Chichester Motor Factor 18.02 0 0 0 % % %
AP Chichester Motor Factor 18.08 0 0 0 % % %
Unity Autofactors Motor Factor 18.10 0 0 0 % % %
ECP Haslemere
Competitor Details ECP Data Survey Responses
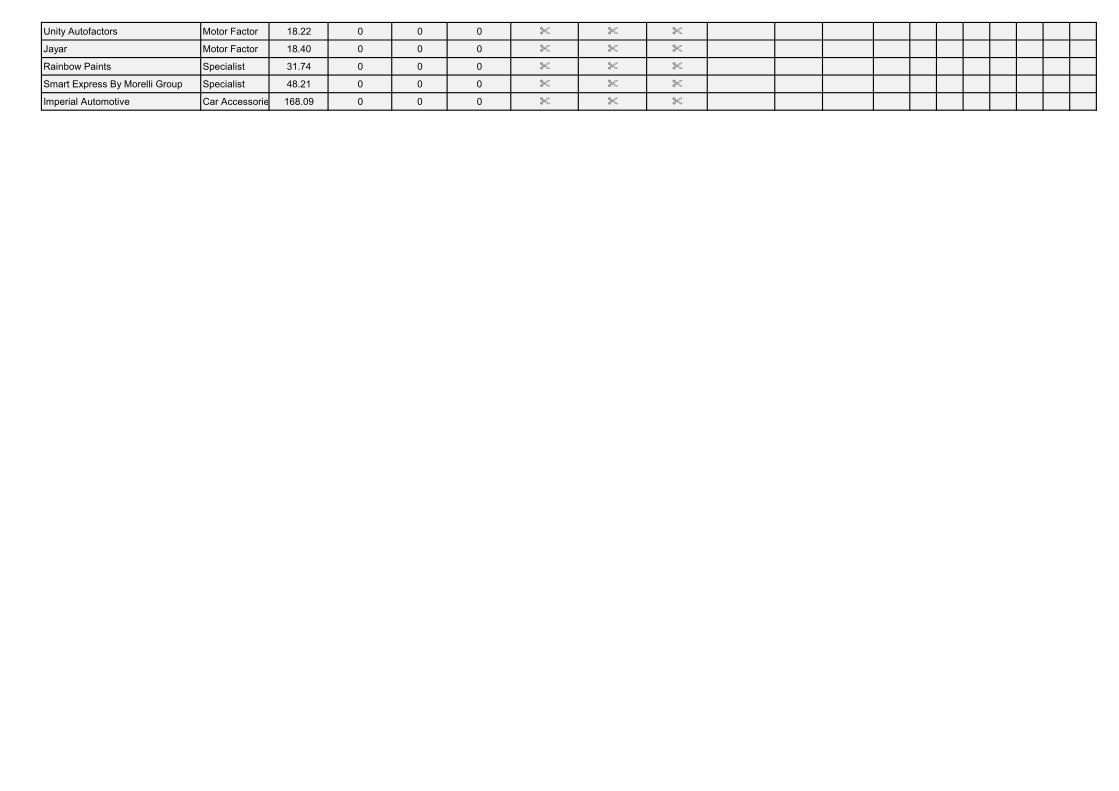
Unity Autofactors Motor Factor 18.22 0 0 0 % % %
Jayar Motor Factor 18.40 0 0 0 % % %
Rainbow Paints Specialist 31.74 0 0 0 % % %
Smart Express By Morelli Group Specialist 48.21 0 0 0 % % %
Imperial Automotive Car Accessories 168.09 0 0 0 % % %
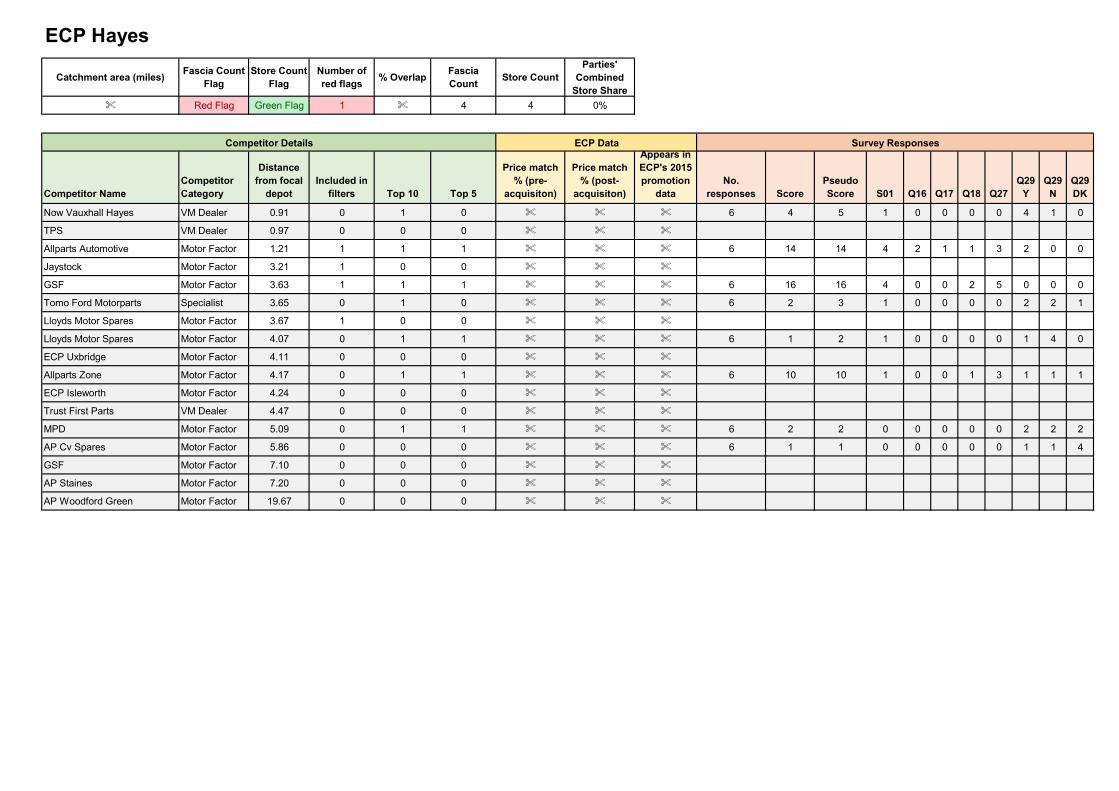
Catchment area (miles)Fascia Count
FlagStore Count
FlagNumber of red flags
% OverlapFascia Count
Store CountParties'
Combined Store Share
% Red Flag Green Flag 1 % 4 4 0%
Competitor NameCompetitor Category
Distance from focal
depotIncluded in
filters Top 10 Top 5
Price match % (pre-
acquisiton)
Price match % (post-
acquisiton)
Appears in ECP's 2015 promotion
dataNo.
responses ScorePseudo Score S01 Q16 Q17 Q18 Q27
Q29 Y
Q29 N
Q29 DK
Now Vauxhall Hayes VM Dealer 0.91 0 1 0 % % % 6 4 5 1 0 0 0 0 4 1 0
TPS VM Dealer 0.97 0 0 0 % % %
Allparts Automotive Motor Factor 1.21 1 1 1 % % % 6 14 14 4 2 1 1 3 2 0 0
Jaystock Motor Factor 3.21 1 0 0 % % %
GSF Motor Factor 3.63 1 1 1 % % % 6 16 16 4 0 0 2 5 0 0 0
Tomo Ford Motorparts Specialist 3.65 0 1 0 % % % 6 2 3 1 0 0 0 0 2 2 1
Lloyds Motor Spares Motor Factor 3.67 1 0 0 % % %
Lloyds Motor Spares Motor Factor 4.07 0 1 1 % % % 6 1 2 1 0 0 0 0 1 4 0
ECP Uxbridge Motor Factor 4.11 0 0 0 % % %
Allparts Zone Motor Factor 4.17 0 1 1 % % % 6 10 10 1 0 0 1 3 1 1 1
ECP Isleworth Motor Factor 4.24 0 0 0 % % %
Trust First Parts VM Dealer 4.47 0 0 0 % % %
MPD Motor Factor 5.09 0 1 1 % % % 6 2 2 0 0 0 0 0 2 2 2
AP Cv Spares Motor Factor 5.86 0 0 0 % % % 6 1 1 0 0 0 0 0 1 1 4
GSF Motor Factor 7.10 0 0 0 % % %
AP Staines Motor Factor 7.20 0 0 0 % % %
AP Woodford Green Motor Factor 19.67 0 0 0 % % %
ECP Hayes
Competitor Details ECP Data Survey Responses
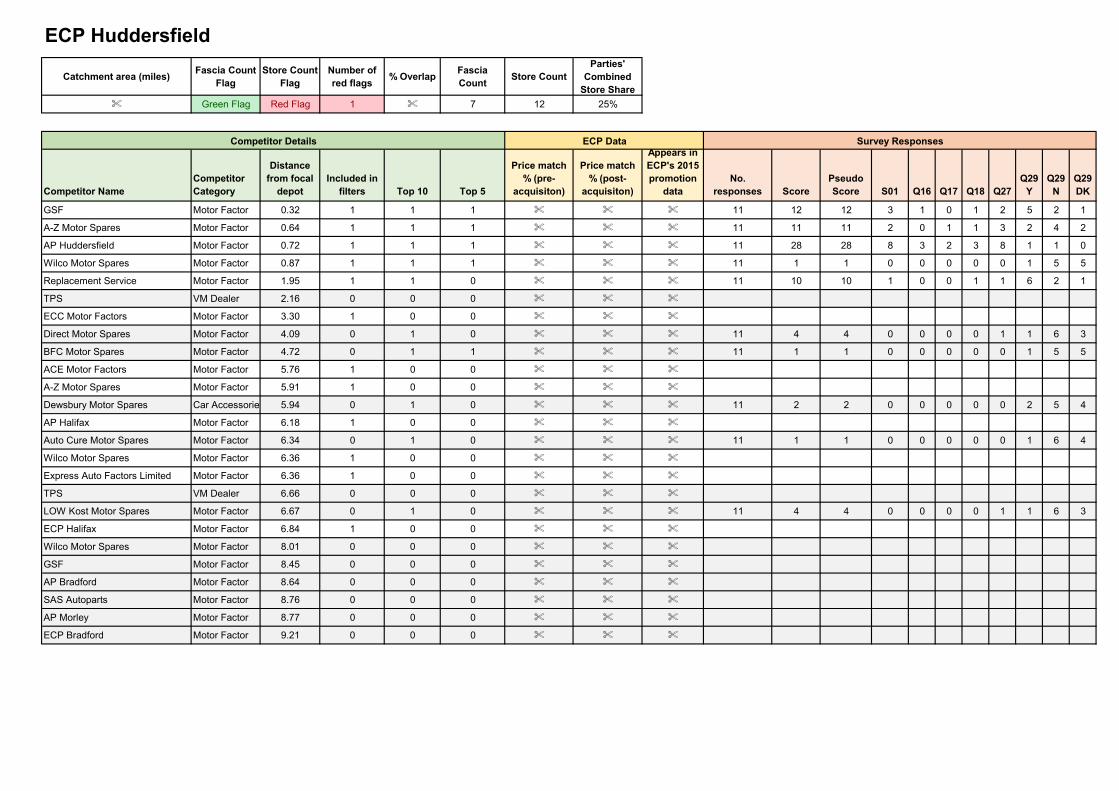
Catchment area (miles)Fascia Count
FlagStore Count
FlagNumber of red flags
% OverlapFascia Count
Store CountParties'
Combined Store Share
% Green Flag Red Flag 1 % 7 12 25%
Competitor NameCompetitor Category
Distance from focal
depotIncluded in
filters Top 10 Top 5
Price match % (pre-
acquisiton)
Price match % (post-
acquisiton)
Appears in ECP's 2015 promotion
dataNo.
responses ScorePseudo Score S01 Q16 Q17 Q18 Q27
Q29 Y
Q29 N
Q29 DK
GSF Motor Factor 0.32 1 1 1 % % % 11 12 12 3 1 0 1 2 5 2 1
A-Z Motor Spares Motor Factor 0.64 1 1 1 % % % 11 11 11 2 0 1 1 3 2 4 2
AP Huddersfield Motor Factor 0.72 1 1 1 % % % 11 28 28 8 3 2 3 8 1 1 0
Wilco Motor Spares Motor Factor 0.87 1 1 1 % % % 11 1 1 0 0 0 0 0 1 5 5
Replacement Service Motor Factor 1.95 1 1 0 % % % 11 10 10 1 0 0 1 1 6 2 1
TPS VM Dealer 2.16 0 0 0 % % %
ECC Motor Factors Motor Factor 3.30 1 0 0 % % %
Direct Motor Spares Motor Factor 4.09 0 1 0 % % % 11 4 4 0 0 0 0 1 1 6 3
BFC Motor Spares Motor Factor 4.72 0 1 1 % % % 11 1 1 0 0 0 0 0 1 5 5
ACE Motor Factors Motor Factor 5.76 1 0 0 % % %
A-Z Motor Spares Motor Factor 5.91 1 0 0 % % %
Dewsbury Motor Spares Car Accessories 5.94 0 1 0 % % % 11 2 2 0 0 0 0 0 2 5 4
AP Halifax Motor Factor 6.18 1 0 0 % % %
Auto Cure Motor Spares Motor Factor 6.34 0 1 0 % % % 11 1 1 0 0 0 0 0 1 6 4
Wilco Motor Spares Motor Factor 6.36 1 0 0 % % %
Express Auto Factors Limited Motor Factor 6.36 1 0 0 % % %
TPS VM Dealer 6.66 0 0 0 % % %
LOW Kost Motor Spares Motor Factor 6.67 0 1 0 % % % 11 4 4 0 0 0 0 1 1 6 3
ECP Halifax Motor Factor 6.84 1 0 0 % % %
Wilco Motor Spares Motor Factor 8.01 0 0 0 % % %
GSF Motor Factor 8.45 0 0 0 % % %
AP Bradford Motor Factor 8.64 0 0 0 % % %
SAS Autoparts Motor Factor 8.76 0 0 0 % % %
AP Morley Motor Factor 8.77 0 0 0 % % %
ECP Bradford Motor Factor 9.21 0 0 0 % % %
ECP Huddersfield
Competitor Details ECP Data Survey Responses
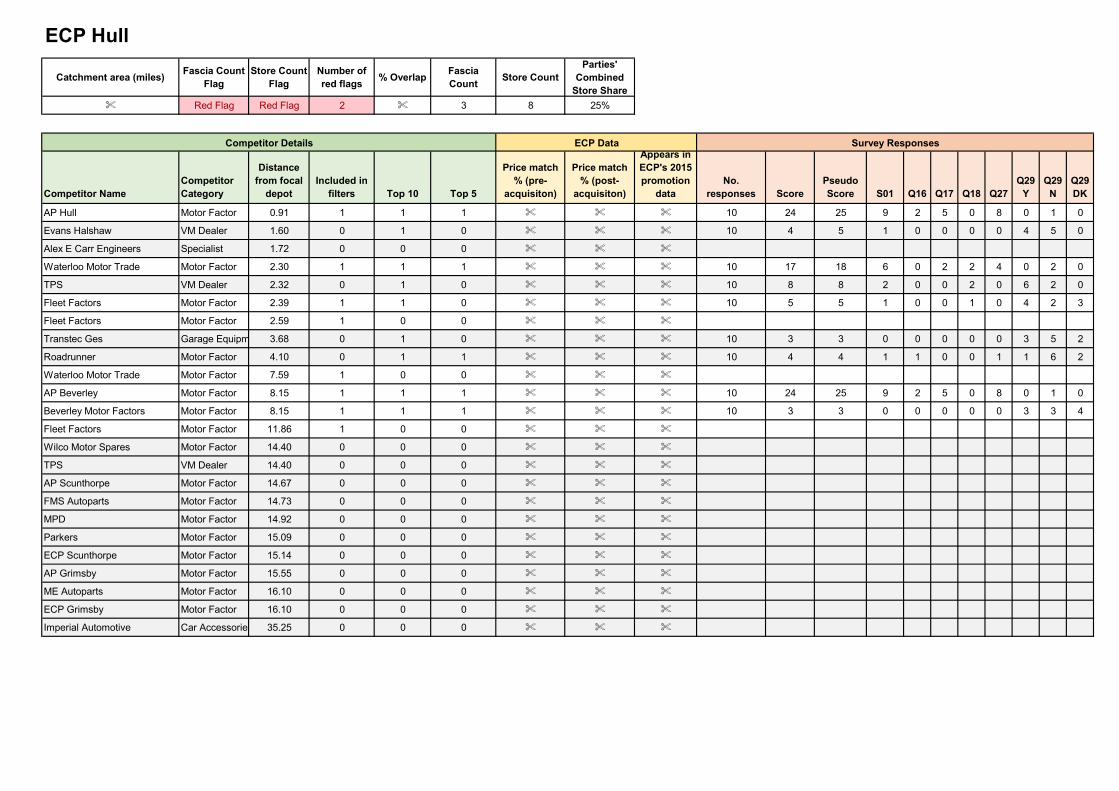
Catchment area (miles)Fascia Count
FlagStore Count
FlagNumber of red flags
% OverlapFascia Count
Store CountParties'
Combined Store Share
% Red Flag Red Flag 2 % 3 8 25%
Competitor NameCompetitor Category
Distance from focal
depotIncluded in
filters Top 10 Top 5
Price match % (pre-
acquisiton)
Price match % (post-
acquisiton)
Appears in ECP's 2015 promotion
dataNo.
responses ScorePseudo Score S01 Q16 Q17 Q18 Q27
Q29 Y
Q29 N
Q29 DK
AP Hull Motor Factor 0.91 1 1 1 % % % 10 24 25 9 2 5 0 8 0 1 0
Evans Halshaw VM Dealer 1.60 0 1 0 % % % 10 4 5 1 0 0 0 0 4 5 0
Alex E Carr Engineers Specialist 1.72 0 0 0 % % %
Waterloo Motor Trade Motor Factor 2.30 1 1 1 % % % 10 17 18 6 0 2 2 4 0 2 0
TPS VM Dealer 2.32 0 1 0 % % % 10 8 8 2 0 0 2 0 6 2 0
Fleet Factors Motor Factor 2.39 1 1 0 % % % 10 5 5 1 0 0 1 0 4 2 3
Fleet Factors Motor Factor 2.59 1 0 0 % % %
Transtec Ges Garage Equipment Specialist3.68 0 1 0 % % % 10 3 3 0 0 0 0 0 3 5 2
Roadrunner Motor Factor 4.10 0 1 1 % % % 10 4 4 1 1 0 0 1 1 6 2
Waterloo Motor Trade Motor Factor 7.59 1 0 0 % % %
AP Beverley Motor Factor 8.15 1 1 1 % % % 10 24 25 9 2 5 0 8 0 1 0
Beverley Motor Factors Motor Factor 8.15 1 1 1 % % % 10 3 3 0 0 0 0 0 3 3 4
Fleet Factors Motor Factor 11.86 1 0 0 % % %
Wilco Motor Spares Motor Factor 14.40 0 0 0 % % %
TPS VM Dealer 14.40 0 0 0 % % %
AP Scunthorpe Motor Factor 14.67 0 0 0 % % %
FMS Autoparts Motor Factor 14.73 0 0 0 % % %
MPD Motor Factor 14.92 0 0 0 % % %
Parkers Motor Factor 15.09 0 0 0 % % %
ECP Scunthorpe Motor Factor 15.14 0 0 0 % % %
AP Grimsby Motor Factor 15.55 0 0 0 % % %
ME Autoparts Motor Factor 16.10 0 0 0 % % %
ECP Grimsby Motor Factor 16.10 0 0 0 % % %
Imperial Automotive Car Accessories 35.25 0 0 0 % % %
ECP Hull
Competitor Details ECP Data Survey Responses
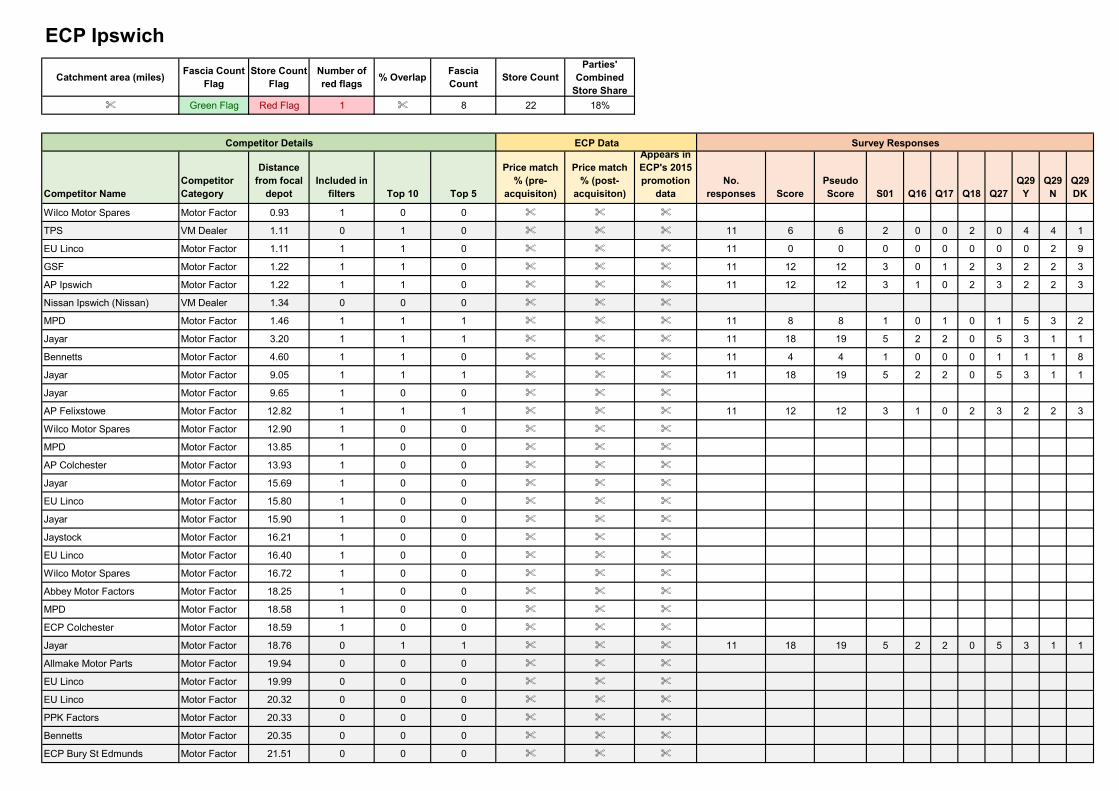
Catchment area (miles)Fascia Count
FlagStore Count
FlagNumber of red flags
% OverlapFascia Count
Store CountParties'
Combined Store Share
% Green Flag Red Flag 1 % 8 22 18%
Competitor NameCompetitor Category
Distance from focal
depotIncluded in
filters Top 10 Top 5
Price match % (pre-
acquisiton)
Price match % (post-
acquisiton)
Appears in ECP's 2015 promotion
dataNo.
responses ScorePseudo Score S01 Q16 Q17 Q18 Q27
Q29 Y
Q29 N
Q29 DK
Wilco Motor Spares Motor Factor 0.93 1 0 0 % % %
TPS VM Dealer 1.11 0 1 0 % % % 11 6 6 2 0 0 2 0 4 4 1
EU Linco Motor Factor 1.11 1 1 0 % % % 11 0 0 0 0 0 0 0 0 2 9
GSF Motor Factor 1.22 1 1 0 % % % 11 12 12 3 0 1 2 3 2 2 3
AP Ipswich Motor Factor 1.22 1 1 0 % % % 11 12 12 3 1 0 2 3 2 2 3
Nissan Ipswich (Nissan) VM Dealer 1.34 0 0 0 % % %
MPD Motor Factor 1.46 1 1 1 % % % 11 8 8 1 0 1 0 1 5 3 2
Jayar Motor Factor 3.20 1 1 1 % % % 11 18 19 5 2 2 0 5 3 1 1
Bennetts Motor Factor 4.60 1 1 0 % % % 11 4 4 1 0 0 0 1 1 1 8
Jayar Motor Factor 9.05 1 1 1 % % % 11 18 19 5 2 2 0 5 3 1 1
Jayar Motor Factor 9.65 1 0 0 % % %
AP Felixstowe Motor Factor 12.82 1 1 1 % % % 11 12 12 3 1 0 2 3 2 2 3
Wilco Motor Spares Motor Factor 12.90 1 0 0 % % %
MPD Motor Factor 13.85 1 0 0 % % %
AP Colchester Motor Factor 13.93 1 0 0 % % %
Jayar Motor Factor 15.69 1 0 0 % % %
EU Linco Motor Factor 15.80 1 0 0 % % %
Jayar Motor Factor 15.90 1 0 0 % % %
Jaystock Motor Factor 16.21 1 0 0 % % %
EU Linco Motor Factor 16.40 1 0 0 % % %
Wilco Motor Spares Motor Factor 16.72 1 0 0 % % %
Abbey Motor Factors Motor Factor 18.25 1 0 0 % % %
MPD Motor Factor 18.58 1 0 0 % % %
ECP Colchester Motor Factor 18.59 1 0 0 % % %
Jayar Motor Factor 18.76 0 1 1 % % % 11 18 19 5 2 2 0 5 3 1 1
Allmake Motor Parts Motor Factor 19.94 0 0 0 % % %
EU Linco Motor Factor 19.99 0 0 0 % % %
EU Linco Motor Factor 20.32 0 0 0 % % %
PPK Factors Motor Factor 20.33 0 0 0 % % %
Bennetts Motor Factor 20.35 0 0 0 % % %
ECP Bury St Edmunds Motor Factor 21.51 0 0 0 % % %
ECP Ipswich
Competitor Details ECP Data Survey Responses
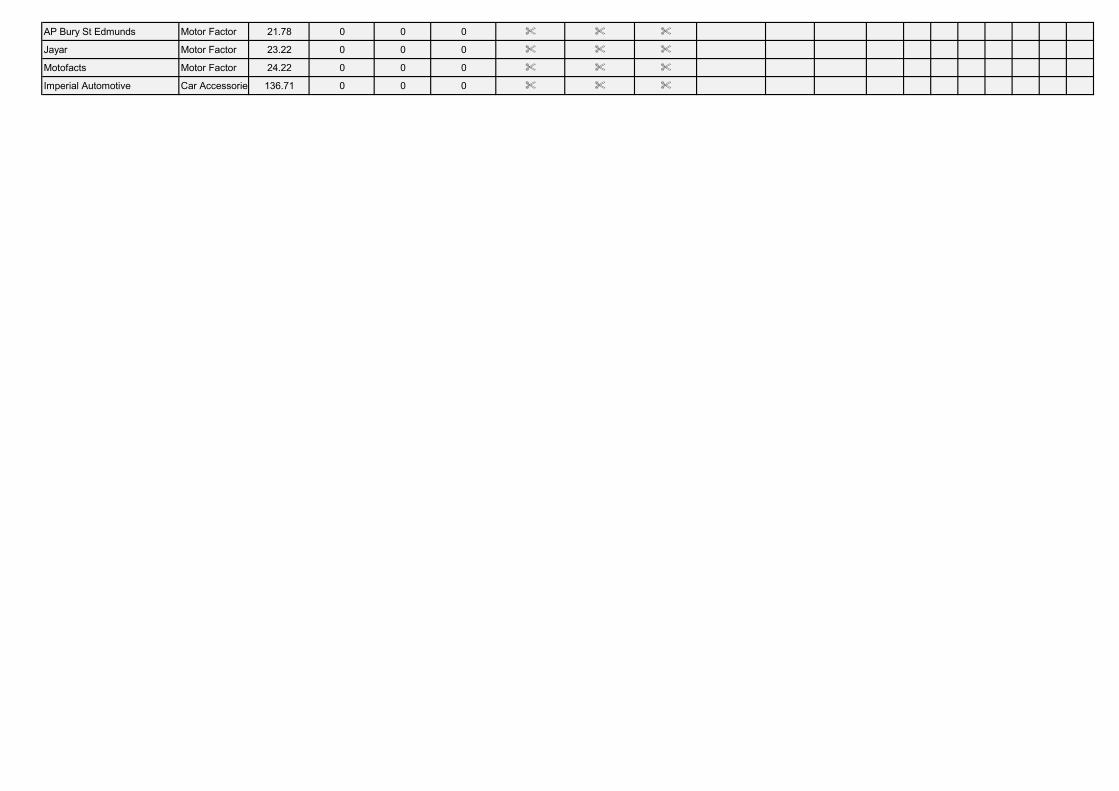
AP Bury St Edmunds Motor Factor 21.78 0 0 0 % % %
Jayar Motor Factor 23.22 0 0 0 % % %
Motofacts Motor Factor 24.22 0 0 0 % % %
Imperial Automotive Car Accessories 136.71 0 0 0 % % %
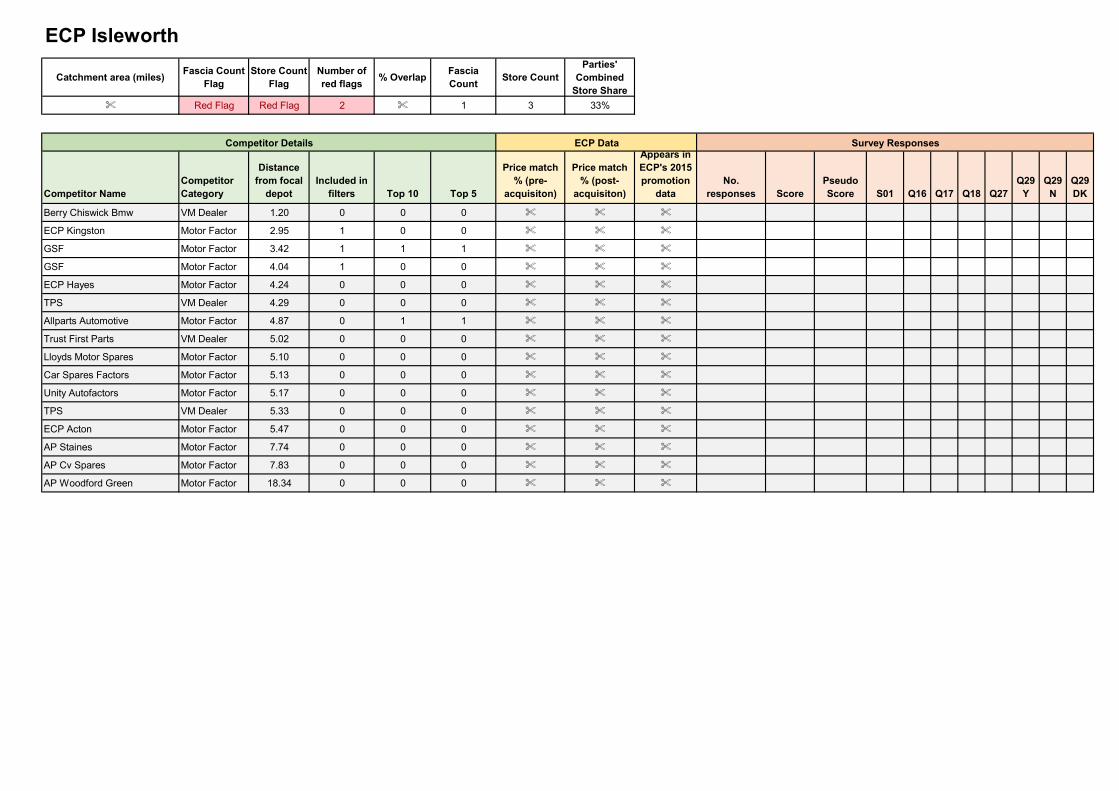
Catchment area (miles)Fascia Count
FlagStore Count
FlagNumber of red flags
% OverlapFascia Count
Store CountParties'
Combined Store Share
% Red Flag Red Flag 2 % 1 3 33%
Competitor NameCompetitor Category
Distance from focal
depotIncluded in
filters Top 10 Top 5
Price match % (pre-
acquisiton)
Price match % (post-
acquisiton)
Appears in ECP's 2015 promotion
dataNo.
responses ScorePseudo Score S01 Q16 Q17 Q18 Q27
Q29 Y
Q29 N
Q29 DK
Berry Chiswick Bmw VM Dealer 1.20 0 0 0 % % %
ECP Kingston Motor Factor 2.95 1 0 0 % % %
GSF Motor Factor 3.42 1 1 1 % % %
GSF Motor Factor 4.04 1 0 0 % % %
ECP Hayes Motor Factor 4.24 0 0 0 % % %
TPS VM Dealer 4.29 0 0 0 % % %
Allparts Automotive Motor Factor 4.87 0 1 1 % % %
Trust First Parts VM Dealer 5.02 0 0 0 % % %
Lloyds Motor Spares Motor Factor 5.10 0 0 0 % % %
Car Spares Factors Motor Factor 5.13 0 0 0 % % %
Unity Autofactors Motor Factor 5.17 0 0 0 % % %
TPS VM Dealer 5.33 0 0 0 % % %
ECP Acton Motor Factor 5.47 0 0 0 % % %
AP Staines Motor Factor 7.74 0 0 0 % % %
AP Cv Spares Motor Factor 7.83 0 0 0 % % %
AP Woodford Green Motor Factor 18.34 0 0 0 % % %
ECP Isleworth
Competitor Details ECP Data Survey Responses
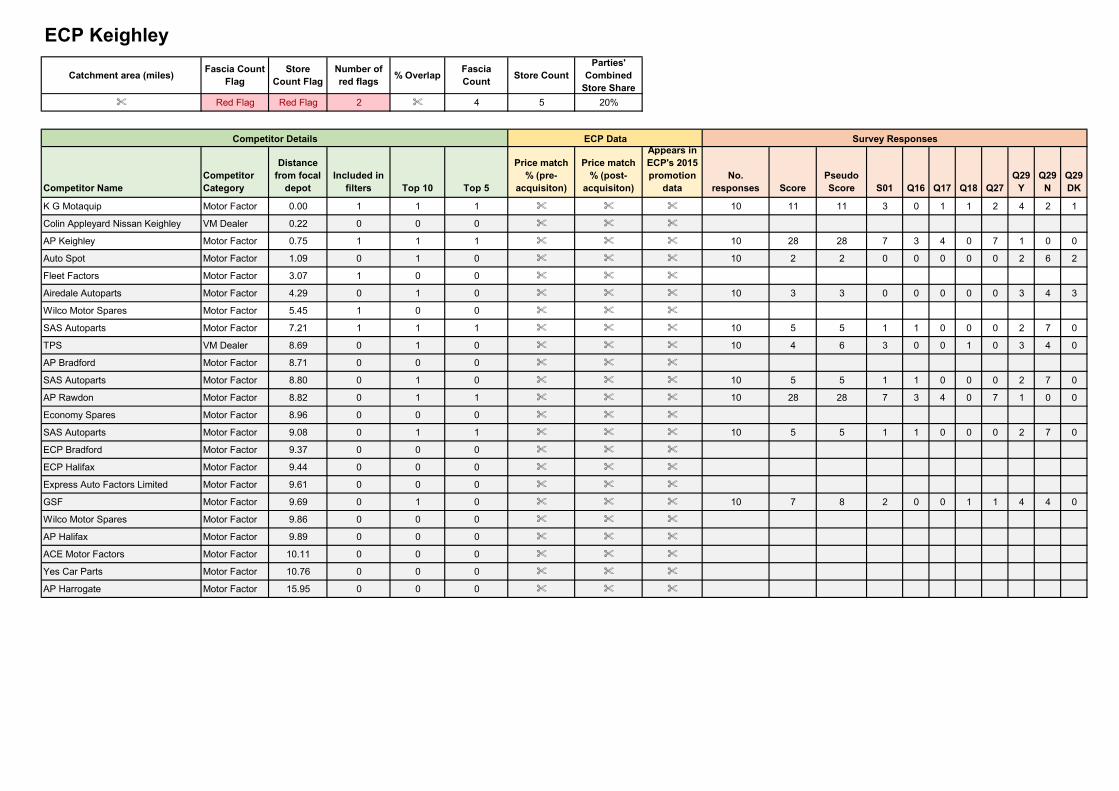
Catchment area (miles)Fascia Count
FlagStore
Count FlagNumber of red flags
% OverlapFascia Count
Store CountParties'
Combined Store Share
% Red Flag Red Flag 2 % 4 5 20%
Competitor NameCompetitor Category
Distance from focal
depotIncluded in
filters Top 10 Top 5
Price match % (pre-
acquisiton)
Price match % (post-
acquisiton)
Appears in ECP's 2015 promotion
dataNo.
responses ScorePseudo Score S01 Q16 Q17 Q18 Q27
Q29 Y
Q29 N
Q29 DK
K G Motaquip Motor Factor 0.00 1 1 1 % % % 10 11 11 3 0 1 1 2 4 2 1
Colin Appleyard Nissan Keighley VM Dealer 0.22 0 0 0 % % %
AP Keighley Motor Factor 0.75 1 1 1 % % % 10 28 28 7 3 4 0 7 1 0 0
Auto Spot Motor Factor 1.09 0 1 0 % % % 10 2 2 0 0 0 0 0 2 6 2
Fleet Factors Motor Factor 3.07 1 0 0 % % %
Airedale Autoparts Motor Factor 4.29 0 1 0 % % % 10 3 3 0 0 0 0 0 3 4 3
Wilco Motor Spares Motor Factor 5.45 1 0 0 % % %
SAS Autoparts Motor Factor 7.21 1 1 1 % % % 10 5 5 1 1 0 0 0 2 7 0
TPS VM Dealer 8.69 0 1 0 % % % 10 4 6 3 0 0 1 0 3 4 0
AP Bradford Motor Factor 8.71 0 0 0 % % %
SAS Autoparts Motor Factor 8.80 0 1 0 % % % 10 5 5 1 1 0 0 0 2 7 0
AP Rawdon Motor Factor 8.82 0 1 1 % % % 10 28 28 7 3 4 0 7 1 0 0
Economy Spares Motor Factor 8.96 0 0 0 % % %
SAS Autoparts Motor Factor 9.08 0 1 1 % % % 10 5 5 1 1 0 0 0 2 7 0
ECP Bradford Motor Factor 9.37 0 0 0 % % %
ECP Halifax Motor Factor 9.44 0 0 0 % % %
Express Auto Factors Limited Motor Factor 9.61 0 0 0 % % %
GSF Motor Factor 9.69 0 1 0 % % % 10 7 8 2 0 0 1 1 4 4 0
Wilco Motor Spares Motor Factor 9.86 0 0 0 % % %
AP Halifax Motor Factor 9.89 0 0 0 % % %
ACE Motor Factors Motor Factor 10.11 0 0 0 % % %
Yes Car Parts Motor Factor 10.76 0 0 0 % % %
AP Harrogate Motor Factor 15.95 0 0 0 % % %
ECP Keighley
Competitor Details ECP Data Survey Responses
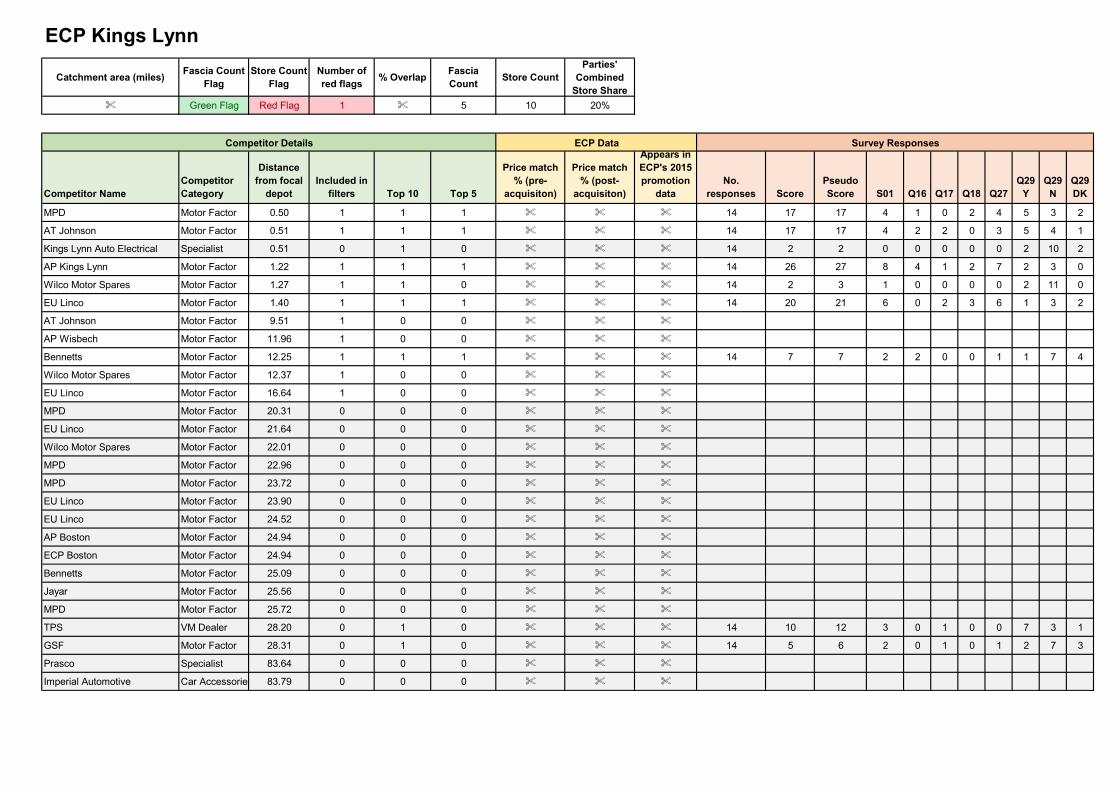
Catchment area (miles)Fascia Count
FlagStore Count
FlagNumber of red flags
% OverlapFascia Count
Store CountParties'
Combined Store Share
% Green Flag Red Flag 1 % 5 10 20%
Competitor NameCompetitor Category
Distance from focal
depotIncluded in
filters Top 10 Top 5
Price match % (pre-
acquisiton)
Price match % (post-
acquisiton)
Appears in ECP's 2015 promotion
dataNo.
responses ScorePseudo Score S01 Q16 Q17 Q18 Q27
Q29 Y
Q29 N
Q29 DK
MPD Motor Factor 0.50 1 1 1 % % % 14 17 17 4 1 0 2 4 5 3 2
AT Johnson Motor Factor 0.51 1 1 1 % % % 14 17 17 4 2 2 0 3 5 4 1
Kings Lynn Auto Electrical Specialist 0.51 0 1 0 % % % 14 2 2 0 0 0 0 0 2 10 2
AP Kings Lynn Motor Factor 1.22 1 1 1 % % % 14 26 27 8 4 1 2 7 2 3 0
Wilco Motor Spares Motor Factor 1.27 1 1 0 % % % 14 2 3 1 0 0 0 0 2 11 0
EU Linco Motor Factor 1.40 1 1 1 % % % 14 20 21 6 0 2 3 6 1 3 2
AT Johnson Motor Factor 9.51 1 0 0 % % %
AP Wisbech Motor Factor 11.96 1 0 0 % % %
Bennetts Motor Factor 12.25 1 1 1 % % % 14 7 7 2 2 0 0 1 1 7 4
Wilco Motor Spares Motor Factor 12.37 1 0 0 % % %
EU Linco Motor Factor 16.64 1 0 0 % % %
MPD Motor Factor 20.31 0 0 0 % % %
EU Linco Motor Factor 21.64 0 0 0 % % %
Wilco Motor Spares Motor Factor 22.01 0 0 0 % % %
MPD Motor Factor 22.96 0 0 0 % % %
MPD Motor Factor 23.72 0 0 0 % % %
EU Linco Motor Factor 23.90 0 0 0 % % %
EU Linco Motor Factor 24.52 0 0 0 % % %
AP Boston Motor Factor 24.94 0 0 0 % % %
ECP Boston Motor Factor 24.94 0 0 0 % % %
Bennetts Motor Factor 25.09 0 0 0 % % %
Jayar Motor Factor 25.56 0 0 0 % % %
MPD Motor Factor 25.72 0 0 0 % % %
TPS VM Dealer 28.20 0 1 0 % % % 14 10 12 3 0 1 0 0 7 3 1
GSF Motor Factor 28.31 0 1 0 % % % 14 5 6 2 0 1 0 1 2 7 3
Prasco Specialist 83.64 0 0 0 % % %
Imperial Automotive Car Accessories 83.79 0 0 0 % % %
ECP Kings Lynn
Competitor Details ECP Data Survey Responses

Catchment area (miles)Fascia Count
FlagStore
Count FlagNumber of red flags
% OverlapFascia Count
Store CountParties'
Combined Store Share
% Red Flag Red Flag 2 % 4 8 25%
Competitor NameCompetitor Category
Distance from focal
depotIncluded in
filters Top 10 Top 5
Price match % (pre-
acquisiton)
Price match % (post-
acquisiton)
Appears in ECP's 2015 promotion
dataNo.
responses ScorePseudo Score S01 Q16 Q17 Q18 Q27
Q29 Y
Q29 N
Q29 DK
AP Kings Norton Motor Factor 0.19 1 1 1 % % % 10 18 18 5 0 3 2 5 2 2 0
Kings Norton Ford VM Dealer 0.34 0 0 0 % % %
Saber Auto Spares Motor Factor 1.51 1 1 1 % % % 10 4 6 2 0 0 0 1 1 6 0
Car Spares Distribution Motor Factor 2.92 1 1 1 % % % 10 15 15 4 2 1 1 4 2 3 0
Car Spares Distribution Motor Factor 3.48 1 0 0 % % %
A-Z Motor Spares Motor Factor 3.87 1 0 0 % % %
Discount Body Panels Midlands Specialist 3.97 0 1 0 % % % 10 1 1 0 0 0 0 0 1 9 0
Carbits Motor Factor 3.98 1 1 1 % % % 10 3 4 2 1 0 0 0 0 7 1
ECP Acocks Green Motor Factor 4.05 1 0 0 % % %
KMS International Motor Factor 4.29 0 1 0 % % % 10 3 3 0 0 0 0 0 3 7 0
Car Spares Distribution Motor Factor 5.06 1 0 0 % % %
Jaystock Motor Factor 5.40 0 0 0 % % %
MPD Motor Factor 5.54 0 0 0 % % %
TPS VM Dealer 5.63 0 1 0 % % % 10 5 6 2 0 0 1 0 4 4 0
ECP Aston Motor Factor 6.03 0 0 0 % % %
AP Birmingham Motor Factor 6.03 0 0 0 % % %
CES Motor Factor 6.27 0 0 0 % % %
AP Halesowen Motor Factor 6.33 0 0 0 % % %
GSF Motor Factor 6.74 0 0 0 % % %
ECP Birmingham Motor Factor 6.74 0 0 0 % % %
Motaparts Xpress Limited Motor Factor 7.26 0 1 0 % % % 10 2 2 0 0 0 0 0 2 8 0
GSF Motor Factor 8.38 0 1 0 % % % 10 9 9 2 0 1 1 2 3 4 1
Bromsgrove Motor Factors Motor Factor 8.70 0 0 0 % % %
Sureparts Redditch Motor Factor 8.70 0 0 0 % % %
Bromsgrove Motor Factors Motor Factor 9.17 0 1 1 % % % 10 2 2 0 0 0 0 0 2 8 0
Midland Lamps Panel Specialist 10.26 0 0 0 % % %
ECP Kings Norton
Competitor Details ECP Data Survey Responses
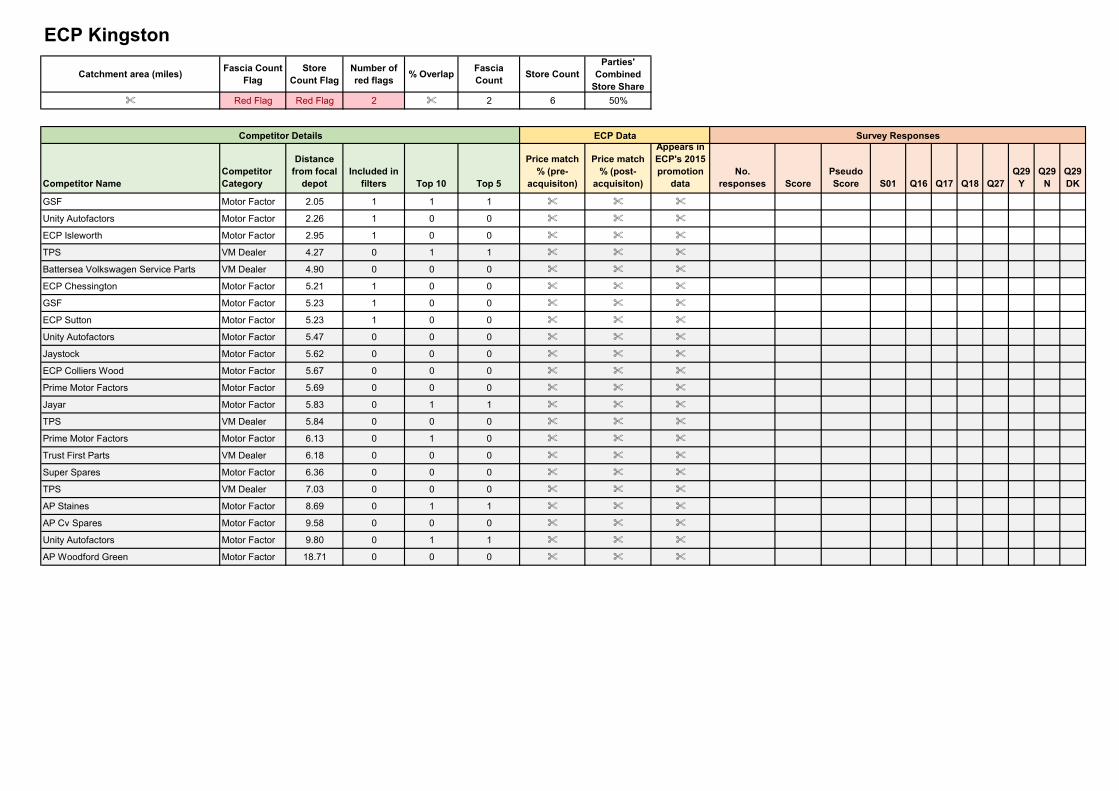
Catchment area (miles)Fascia Count
FlagStore
Count FlagNumber of red flags
% OverlapFascia Count
Store CountParties'
Combined Store Share
% Red Flag Red Flag 2 % 2 6 50%
Competitor NameCompetitor Category
Distance from focal
depotIncluded in
filters Top 10 Top 5
Price match % (pre-
acquisiton)
Price match % (post-
acquisiton)
Appears in ECP's 2015 promotion
dataNo.
responses ScorePseudo Score S01 Q16 Q17 Q18 Q27
Q29 Y
Q29 N
Q29 DK
GSF Motor Factor 2.05 1 1 1 % % %
Unity Autofactors Motor Factor 2.26 1 0 0 % % %
ECP Isleworth Motor Factor 2.95 1 0 0 % % %
TPS VM Dealer 4.27 0 1 1 % % %
Battersea Volkswagen Service Parts VM Dealer 4.90 0 0 0 % % %
ECP Chessington Motor Factor 5.21 1 0 0 % % %
GSF Motor Factor 5.23 1 0 0 % % %
ECP Sutton Motor Factor 5.23 1 0 0 % % %
Unity Autofactors Motor Factor 5.47 0 0 0 % % %
Jaystock Motor Factor 5.62 0 0 0 % % %
ECP Colliers Wood Motor Factor 5.67 0 0 0 % % %
Prime Motor Factors Motor Factor 5.69 0 0 0 % % %
Jayar Motor Factor 5.83 0 1 1 % % %
TPS VM Dealer 5.84 0 0 0 % % %
Prime Motor Factors Motor Factor 6.13 0 1 0 % % %
Trust First Parts VM Dealer 6.18 0 0 0 % % %
Super Spares Motor Factor 6.36 0 0 0 % % %
TPS VM Dealer 7.03 0 0 0 % % %
AP Staines Motor Factor 8.69 0 1 1 % % %
AP Cv Spares Motor Factor 9.58 0 0 0 % % %
Unity Autofactors Motor Factor 9.80 0 1 1 % % %
AP Woodford Green Motor Factor 18.71 0 0 0 % % %
ECP Kingston
Competitor Details ECP Data Survey Responses
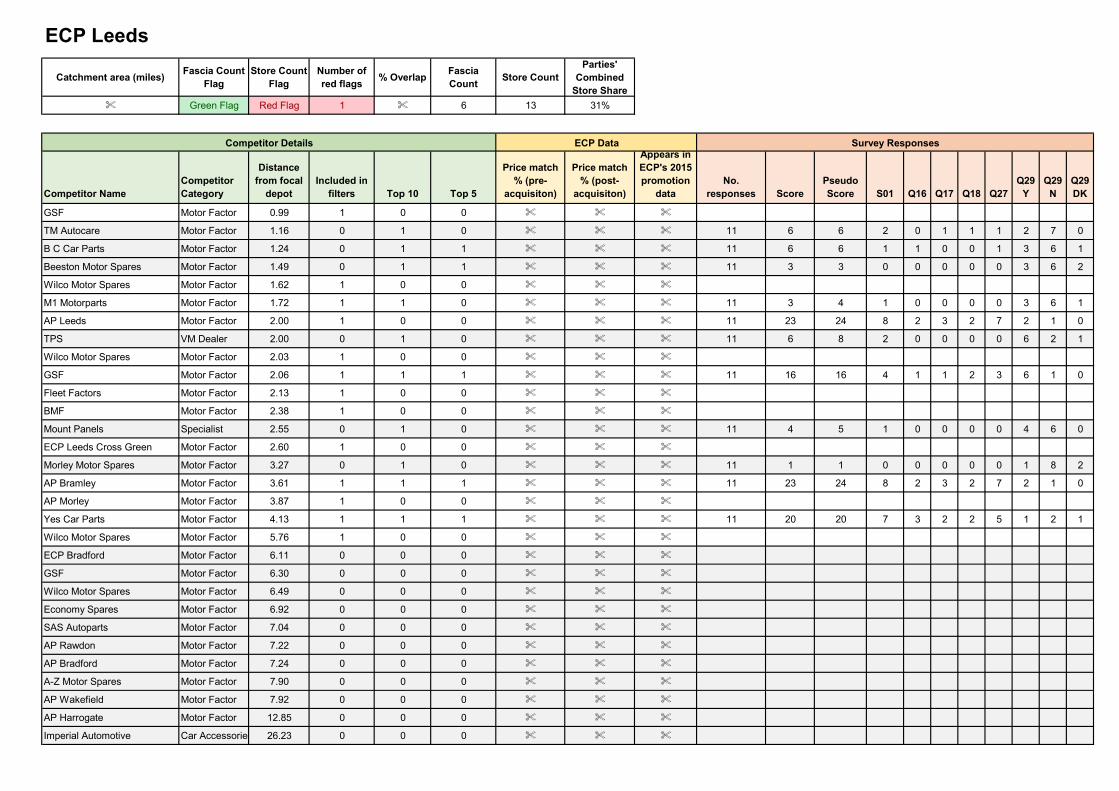
Catchment area (miles)Fascia Count
FlagStore Count
FlagNumber of red flags
% OverlapFascia Count
Store CountParties'
Combined Store Share
% Green Flag Red Flag 1 % 6 13 31%
Competitor NameCompetitor Category
Distance from focal
depotIncluded in
filters Top 10 Top 5
Price match % (pre-
acquisiton)
Price match % (post-
acquisiton)
Appears in ECP's 2015 promotion
dataNo.
responses ScorePseudo Score S01 Q16 Q17 Q18 Q27
Q29 Y
Q29 N
Q29 DK
GSF Motor Factor 0.99 1 0 0 % % %
TM Autocare Motor Factor 1.16 0 1 0 % % % 11 6 6 2 0 1 1 1 2 7 0
B C Car Parts Motor Factor 1.24 0 1 1 % % % 11 6 6 1 1 0 0 1 3 6 1
Beeston Motor Spares Motor Factor 1.49 0 1 1 % % % 11 3 3 0 0 0 0 0 3 6 2
Wilco Motor Spares Motor Factor 1.62 1 0 0 % % %
M1 Motorparts Motor Factor 1.72 1 1 0 % % % 11 3 4 1 0 0 0 0 3 6 1
AP Leeds Motor Factor 2.00 1 0 0 % % % 11 23 24 8 2 3 2 7 2 1 0
TPS VM Dealer 2.00 0 1 0 % % % 11 6 8 2 0 0 0 0 6 2 1
Wilco Motor Spares Motor Factor 2.03 1 0 0 % % %
GSF Motor Factor 2.06 1 1 1 % % % 11 16 16 4 1 1 2 3 6 1 0
Fleet Factors Motor Factor 2.13 1 0 0 % % %
BMF Motor Factor 2.38 1 0 0 % % %
Mount Panels Specialist 2.55 0 1 0 % % % 11 4 5 1 0 0 0 0 4 6 0
ECP Leeds Cross Green Motor Factor 2.60 1 0 0 % % %
Morley Motor Spares Motor Factor 3.27 0 1 0 % % % 11 1 1 0 0 0 0 0 1 8 2
AP Bramley Motor Factor 3.61 1 1 1 % % % 11 23 24 8 2 3 2 7 2 1 0
AP Morley Motor Factor 3.87 1 0 0 % % %
Yes Car Parts Motor Factor 4.13 1 1 1 % % % 11 20 20 7 3 2 2 5 1 2 1
Wilco Motor Spares Motor Factor 5.76 1 0 0 % % %
ECP Bradford Motor Factor 6.11 0 0 0 % % %
GSF Motor Factor 6.30 0 0 0 % % %
Wilco Motor Spares Motor Factor 6.49 0 0 0 % % %
Economy Spares Motor Factor 6.92 0 0 0 % % %
SAS Autoparts Motor Factor 7.04 0 0 0 % % %
AP Rawdon Motor Factor 7.22 0 0 0 % % %
AP Bradford Motor Factor 7.24 0 0 0 % % %
A-Z Motor Spares Motor Factor 7.90 0 0 0 % % %
AP Wakefield Motor Factor 7.92 0 0 0 % % %
AP Harrogate Motor Factor 12.85 0 0 0 % % %
Imperial Automotive Car Accessories 26.23 0 0 0 % % %
ECP Leeds
Competitor Details ECP Data Survey Responses
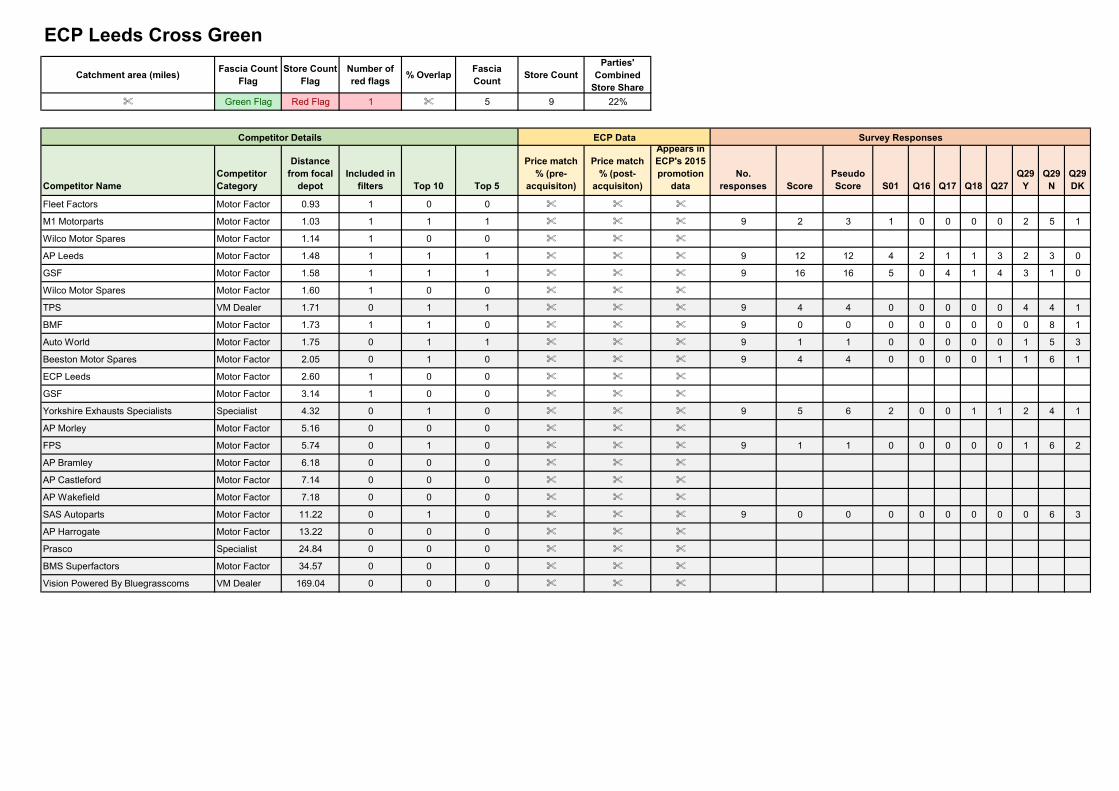
Catchment area (miles)Fascia Count
FlagStore Count
FlagNumber of red flags
% OverlapFascia Count
Store CountParties'
Combined Store Share
% Green Flag Red Flag 1 % 5 9 22%
Competitor NameCompetitor Category
Distance from focal
depotIncluded in
filters Top 10 Top 5
Price match % (pre-
acquisiton)
Price match % (post-
acquisiton)
Appears in ECP's 2015 promotion
dataNo.
responses ScorePseudo Score S01 Q16 Q17 Q18 Q27
Q29 Y
Q29 N
Q29 DK
Fleet Factors Motor Factor 0.93 1 0 0 % % %
M1 Motorparts Motor Factor 1.03 1 1 1 % % % 9 2 3 1 0 0 0 0 2 5 1
Wilco Motor Spares Motor Factor 1.14 1 0 0 % % %
AP Leeds Motor Factor 1.48 1 1 1 % % % 9 12 12 4 2 1 1 3 2 3 0
GSF Motor Factor 1.58 1 1 1 % % % 9 16 16 5 0 4 1 4 3 1 0
Wilco Motor Spares Motor Factor 1.60 1 0 0 % % %
TPS VM Dealer 1.71 0 1 1 % % % 9 4 4 0 0 0 0 0 4 4 1
BMF Motor Factor 1.73 1 1 0 % % % 9 0 0 0 0 0 0 0 0 8 1
Auto World Motor Factor 1.75 0 1 1 % % % 9 1 1 0 0 0 0 0 1 5 3
Beeston Motor Spares Motor Factor 2.05 0 1 0 % % % 9 4 4 0 0 0 0 1 1 6 1
ECP Leeds Motor Factor 2.60 1 0 0 % % %
GSF Motor Factor 3.14 1 0 0 % % %
Yorkshire Exhausts Specialists Specialist 4.32 0 1 0 % % % 9 5 6 2 0 0 1 1 2 4 1
AP Morley Motor Factor 5.16 0 0 0 % % %
FPS Motor Factor 5.74 0 1 0 % % % 9 1 1 0 0 0 0 0 1 6 2
AP Bramley Motor Factor 6.18 0 0 0 % % %
AP Castleford Motor Factor 7.14 0 0 0 % % %
AP Wakefield Motor Factor 7.18 0 0 0 % % %
SAS Autoparts Motor Factor 11.22 0 1 0 % % % 9 0 0 0 0 0 0 0 0 6 3
AP Harrogate Motor Factor 13.22 0 0 0 % % %
Prasco Specialist 24.84 0 0 0 % % %
BMS Superfactors Motor Factor 34.57 0 0 0 % % %
Vision Powered By Bluegrasscoms VM Dealer 169.04 0 0 0 % % %
ECP Leeds Cross Green
Competitor Details ECP Data Survey Responses
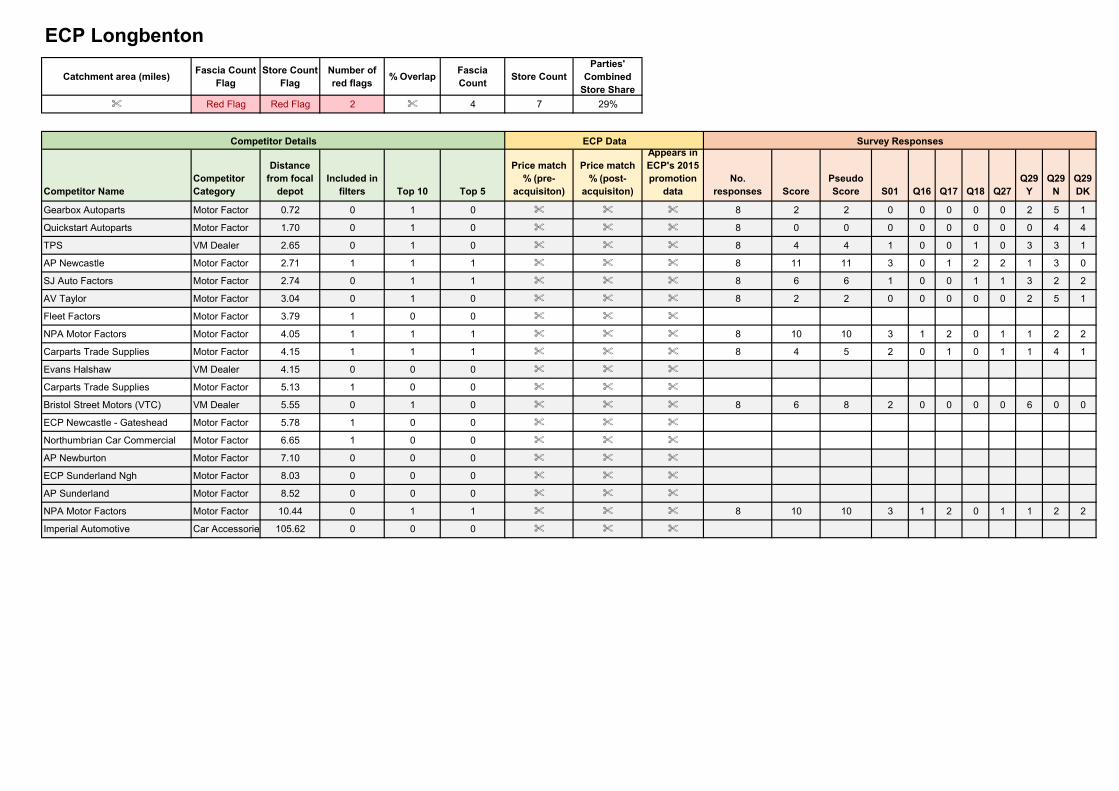
Catchment area (miles)Fascia Count
FlagStore Count
FlagNumber of red flags
% OverlapFascia Count
Store CountParties'
Combined Store Share
% Red Flag Red Flag 2 % 4 7 29%
Competitor NameCompetitor Category
Distance from focal
depotIncluded in
filters Top 10 Top 5
Price match % (pre-
acquisiton)
Price match % (post-
acquisiton)
Appears in ECP's 2015 promotion
dataNo.
responses ScorePseudo Score S01 Q16 Q17 Q18 Q27
Q29 Y
Q29 N
Q29 DK
Gearbox Autoparts Motor Factor 0.72 0 1 0 % % % 8 2 2 0 0 0 0 0 2 5 1
Quickstart Autoparts Motor Factor 1.70 0 1 0 % % % 8 0 0 0 0 0 0 0 0 4 4
TPS VM Dealer 2.65 0 1 0 % % % 8 4 4 1 0 0 1 0 3 3 1
AP Newcastle Motor Factor 2.71 1 1 1 % % % 8 11 11 3 0 1 2 2 1 3 0
SJ Auto Factors Motor Factor 2.74 0 1 1 % % % 8 6 6 1 0 0 1 1 3 2 2
AV Taylor Motor Factor 3.04 0 1 0 % % % 8 2 2 0 0 0 0 0 2 5 1
Fleet Factors Motor Factor 3.79 1 0 0 % % %
NPA Motor Factors Motor Factor 4.05 1 1 1 % % % 8 10 10 3 1 2 0 1 1 2 2
Carparts Trade Supplies Motor Factor 4.15 1 1 1 % % % 8 4 5 2 0 1 0 1 1 4 1
Evans Halshaw VM Dealer 4.15 0 0 0 % % %
Carparts Trade Supplies Motor Factor 5.13 1 0 0 % % %
Bristol Street Motors (VTC) VM Dealer 5.55 0 1 0 % % % 8 6 8 2 0 0 0 0 6 0 0
ECP Newcastle - Gateshead Motor Factor 5.78 1 0 0 % % %
Northumbrian Car Commercial Motor Factor 6.65 1 0 0 % % %
AP Newburton Motor Factor 7.10 0 0 0 % % %
ECP Sunderland Ngh Motor Factor 8.03 0 0 0 % % %
AP Sunderland Motor Factor 8.52 0 0 0 % % %
NPA Motor Factors Motor Factor 10.44 0 1 1 % % % 8 10 10 3 1 2 0 1 1 2 2
Imperial Automotive Car Accessories 105.62 0 0 0 % % %
ECP Longbenton
Competitor Details ECP Data Survey Responses
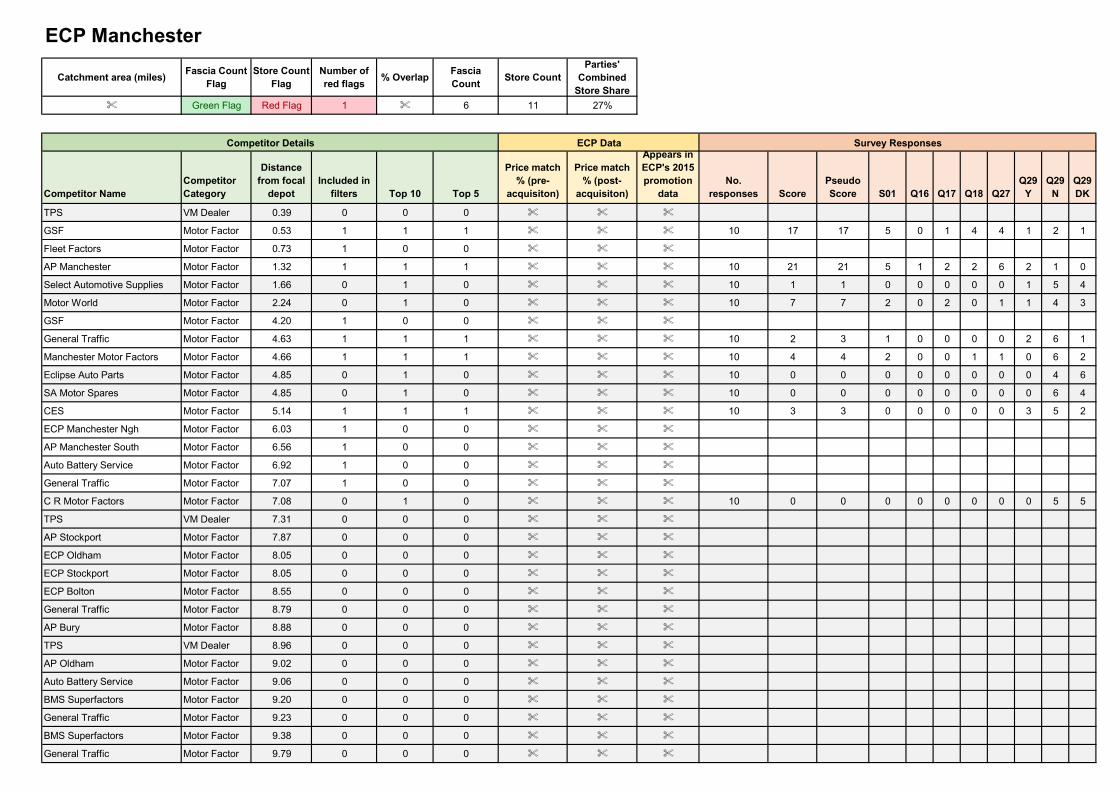
Catchment area (miles)Fascia Count
FlagStore Count
FlagNumber of red flags
% OverlapFascia Count
Store CountParties'
Combined Store Share
% Green Flag Red Flag 1 % 6 11 27%
Competitor NameCompetitor Category
Distance from focal
depotIncluded in
filters Top 10 Top 5
Price match % (pre-
acquisiton)
Price match % (post-
acquisiton)
Appears in ECP's 2015 promotion
dataNo.
responses ScorePseudo Score S01 Q16 Q17 Q18 Q27
Q29 Y
Q29 N
Q29 DK
TPS VM Dealer 0.39 0 0 0 % % %
GSF Motor Factor 0.53 1 1 1 % % % 10 17 17 5 0 1 4 4 1 2 1
Fleet Factors Motor Factor 0.73 1 0 0 % % %
AP Manchester Motor Factor 1.32 1 1 1 % % % 10 21 21 5 1 2 2 6 2 1 0
Select Automotive Supplies Motor Factor 1.66 0 1 0 % % % 10 1 1 0 0 0 0 0 1 5 4
Motor World Motor Factor 2.24 0 1 0 % % % 10 7 7 2 0 2 0 1 1 4 3
GSF Motor Factor 4.20 1 0 0 % % %
General Traffic Motor Factor 4.63 1 1 1 % % % 10 2 3 1 0 0 0 0 2 6 1
Manchester Motor Factors Motor Factor 4.66 1 1 1 % % % 10 4 4 2 0 0 1 1 0 6 2
Eclipse Auto Parts Motor Factor 4.85 0 1 0 % % % 10 0 0 0 0 0 0 0 0 4 6
SA Motor Spares Motor Factor 4.85 0 1 0 % % % 10 0 0 0 0 0 0 0 0 6 4
CES Motor Factor 5.14 1 1 1 % % % 10 3 3 0 0 0 0 0 3 5 2
ECP Manchester Ngh Motor Factor 6.03 1 0 0 % % %
AP Manchester South Motor Factor 6.56 1 0 0 % % %
Auto Battery Service Motor Factor 6.92 1 0 0 % % %
General Traffic Motor Factor 7.07 1 0 0 % % %
C R Motor Factors Motor Factor 7.08 0 1 0 % % % 10 0 0 0 0 0 0 0 0 5 5
TPS VM Dealer 7.31 0 0 0 % % %
AP Stockport Motor Factor 7.87 0 0 0 % % %
ECP Oldham Motor Factor 8.05 0 0 0 % % %
ECP Stockport Motor Factor 8.05 0 0 0 % % %
ECP Bolton Motor Factor 8.55 0 0 0 % % %
General Traffic Motor Factor 8.79 0 0 0 % % %
AP Bury Motor Factor 8.88 0 0 0 % % %
TPS VM Dealer 8.96 0 0 0 % % %
AP Oldham Motor Factor 9.02 0 0 0 % % %
Auto Battery Service Motor Factor 9.06 0 0 0 % % %
BMS Superfactors Motor Factor 9.20 0 0 0 % % %
General Traffic Motor Factor 9.23 0 0 0 % % %
BMS Superfactors Motor Factor 9.38 0 0 0 % % %
General Traffic Motor Factor 9.79 0 0 0 % % %
ECP Manchester
Competitor Details ECP Data Survey Responses

Imperial Automotive Car Accessories 48.27 0 0 0 % % %
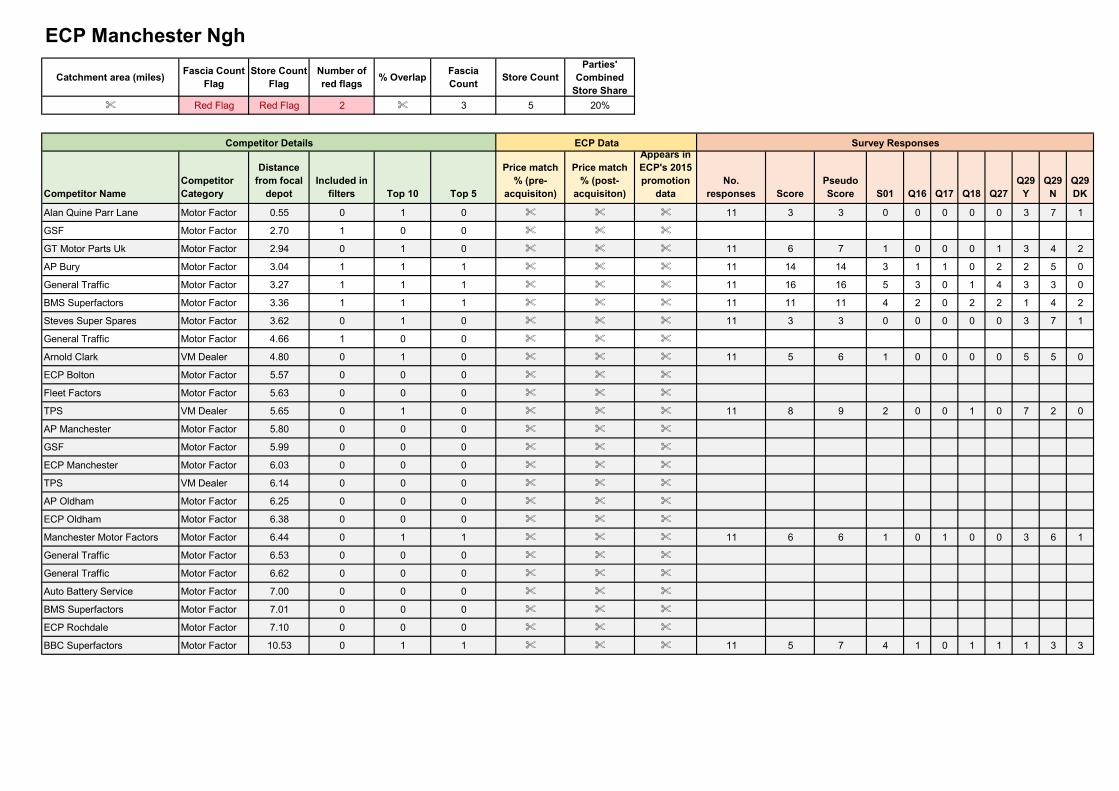
Catchment area (miles)Fascia Count
FlagStore Count
FlagNumber of red flags
% OverlapFascia Count
Store CountParties'
Combined Store Share
% Red Flag Red Flag 2 % 3 5 20%
Competitor NameCompetitor Category
Distance from focal
depotIncluded in
filters Top 10 Top 5
Price match % (pre-
acquisiton)
Price match % (post-
acquisiton)
Appears in ECP's 2015 promotion
dataNo.
responses ScorePseudo Score S01 Q16 Q17 Q18 Q27
Q29 Y
Q29 N
Q29 DK
Alan Quine Parr Lane Motor Factor 0.55 0 1 0 % % % 11 3 3 0 0 0 0 0 3 7 1
GSF Motor Factor 2.70 1 0 0 % % %
GT Motor Parts Uk Motor Factor 2.94 0 1 0 % % % 11 6 7 1 0 0 0 1 3 4 2
AP Bury Motor Factor 3.04 1 1 1 % % % 11 14 14 3 1 1 0 2 2 5 0
General Traffic Motor Factor 3.27 1 1 1 % % % 11 16 16 5 3 0 1 4 3 3 0
BMS Superfactors Motor Factor 3.36 1 1 1 % % % 11 11 11 4 2 0 2 2 1 4 2
Steves Super Spares Motor Factor 3.62 0 1 0 % % % 11 3 3 0 0 0 0 0 3 7 1
General Traffic Motor Factor 4.66 1 0 0 % % %
Arnold Clark VM Dealer 4.80 0 1 0 % % % 11 5 6 1 0 0 0 0 5 5 0
ECP Bolton Motor Factor 5.57 0 0 0 % % %
Fleet Factors Motor Factor 5.63 0 0 0 % % %
TPS VM Dealer 5.65 0 1 0 % % % 11 8 9 2 0 0 1 0 7 2 0
AP Manchester Motor Factor 5.80 0 0 0 % % %
GSF Motor Factor 5.99 0 0 0 % % %
ECP Manchester Motor Factor 6.03 0 0 0 % % %
TPS VM Dealer 6.14 0 0 0 % % %
AP Oldham Motor Factor 6.25 0 0 0 % % %
ECP Oldham Motor Factor 6.38 0 0 0 % % %
Manchester Motor Factors Motor Factor 6.44 0 1 1 % % % 11 6 6 1 0 1 0 0 3 6 1
General Traffic Motor Factor 6.53 0 0 0 % % %
General Traffic Motor Factor 6.62 0 0 0 % % %
Auto Battery Service Motor Factor 7.00 0 0 0 % % %
BMS Superfactors Motor Factor 7.01 0 0 0 % % %
ECP Rochdale Motor Factor 7.10 0 0 0 % % %
BBC Superfactors Motor Factor 10.53 0 1 1 % % % 11 5 7 4 1 0 1 1 1 3 3
ECP Manchester Ngh
Competitor Details ECP Data Survey Responses
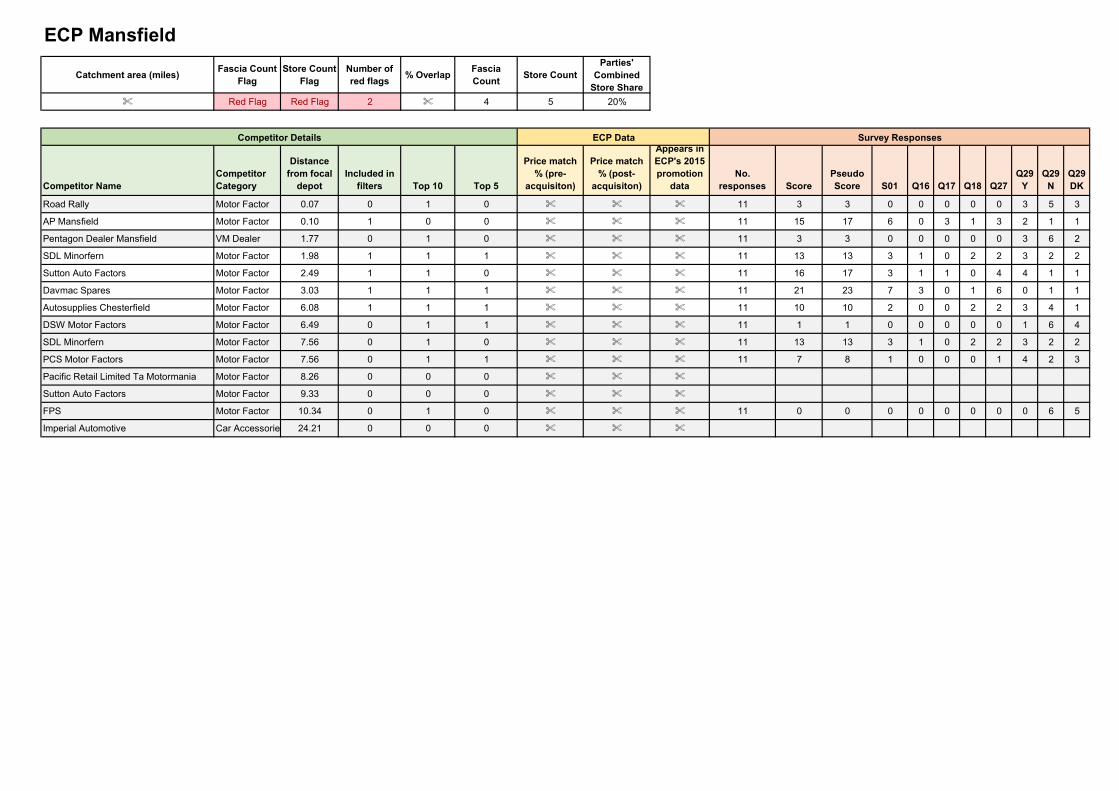
Catchment area (miles)Fascia Count
FlagStore Count
FlagNumber of red flags
% OverlapFascia Count
Store CountParties'
Combined Store Share
% Red Flag Red Flag 2 % 4 5 20%
Competitor NameCompetitor Category
Distance from focal
depotIncluded in
filters Top 10 Top 5
Price match % (pre-
acquisiton)
Price match % (post-
acquisiton)
Appears in ECP's 2015 promotion
dataNo.
responses ScorePseudo Score S01 Q16 Q17 Q18 Q27
Q29 Y
Q29 N
Q29 DK
Road Rally Motor Factor 0.07 0 1 0 % % % 11 3 3 0 0 0 0 0 3 5 3
AP Mansfield Motor Factor 0.10 1 0 0 % % % 11 15 17 6 0 3 1 3 2 1 1
Pentagon Dealer Mansfield VM Dealer 1.77 0 1 0 % % % 11 3 3 0 0 0 0 0 3 6 2
SDL Minorfern Motor Factor 1.98 1 1 1 % % % 11 13 13 3 1 0 2 2 3 2 2
Sutton Auto Factors Motor Factor 2.49 1 1 0 % % % 11 16 17 3 1 1 0 4 4 1 1
Davmac Spares Motor Factor 3.03 1 1 1 % % % 11 21 23 7 3 0 1 6 0 1 1
Autosupplies Chesterfield Motor Factor 6.08 1 1 1 % % % 11 10 10 2 0 0 2 2 3 4 1
DSW Motor Factors Motor Factor 6.49 0 1 1 % % % 11 1 1 0 0 0 0 0 1 6 4
SDL Minorfern Motor Factor 7.56 0 1 0 % % % 11 13 13 3 1 0 2 2 3 2 2
PCS Motor Factors Motor Factor 7.56 0 1 1 % % % 11 7 8 1 0 0 0 1 4 2 3
Pacific Retail Limited Ta Motormania Motor Factor 8.26 0 0 0 % % %
Sutton Auto Factors Motor Factor 9.33 0 0 0 % % %
FPS Motor Factor 10.34 0 1 0 % % % 11 0 0 0 0 0 0 0 0 6 5
Imperial Automotive Car Accessories 24.21 0 0 0 % % %
ECP Mansfield
Competitor Details ECP Data Survey Responses
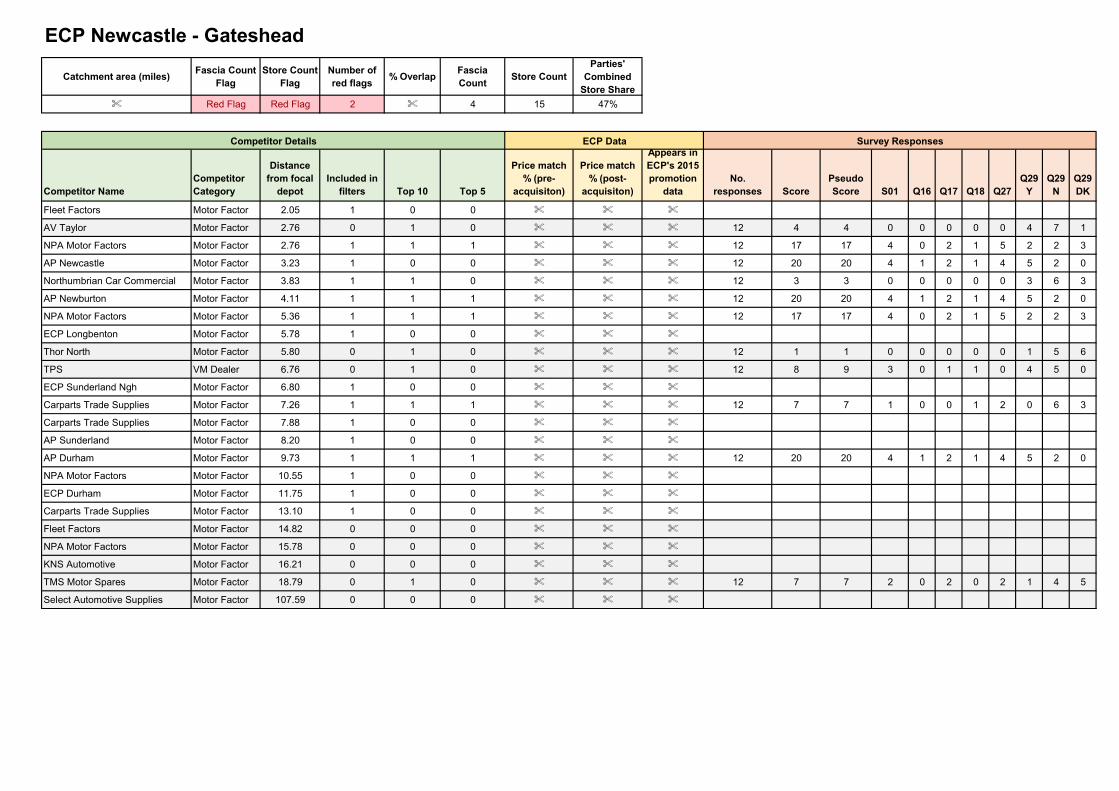
Catchment area (miles)Fascia Count
FlagStore Count
FlagNumber of red flags
% OverlapFascia Count
Store CountParties'
Combined Store Share
% Red Flag Red Flag 2 % 4 15 47%
Competitor NameCompetitor Category
Distance from focal
depotIncluded in
filters Top 10 Top 5
Price match % (pre-
acquisiton)
Price match % (post-
acquisiton)
Appears in ECP's 2015 promotion
dataNo.
responses ScorePseudo Score S01 Q16 Q17 Q18 Q27
Q29 Y
Q29 N
Q29 DK
Fleet Factors Motor Factor 2.05 1 0 0 % % %
AV Taylor Motor Factor 2.76 0 1 0 % % % 12 4 4 0 0 0 0 0 4 7 1
NPA Motor Factors Motor Factor 2.76 1 1 1 % % % 12 17 17 4 0 2 1 5 2 2 3
AP Newcastle Motor Factor 3.23 1 0 0 % % % 12 20 20 4 1 2 1 4 5 2 0
Northumbrian Car Commercial Motor Factor 3.83 1 1 0 % % % 12 3 3 0 0 0 0 0 3 6 3
AP Newburton Motor Factor 4.11 1 1 1 % % % 12 20 20 4 1 2 1 4 5 2 0
NPA Motor Factors Motor Factor 5.36 1 1 1 % % % 12 17 17 4 0 2 1 5 2 2 3
ECP Longbenton Motor Factor 5.78 1 0 0 % % %
Thor North Motor Factor 5.80 0 1 0 % % % 12 1 1 0 0 0 0 0 1 5 6
TPS VM Dealer 6.76 0 1 0 % % % 12 8 9 3 0 1 1 0 4 5 0
ECP Sunderland Ngh Motor Factor 6.80 1 0 0 % % %
Carparts Trade Supplies Motor Factor 7.26 1 1 1 % % % 12 7 7 1 0 0 1 2 0 6 3
Carparts Trade Supplies Motor Factor 7.88 1 0 0 % % %
AP Sunderland Motor Factor 8.20 1 0 0 % % %
AP Durham Motor Factor 9.73 1 1 1 % % % 12 20 20 4 1 2 1 4 5 2 0
NPA Motor Factors Motor Factor 10.55 1 0 0 % % %
ECP Durham Motor Factor 11.75 1 0 0 % % %
Carparts Trade Supplies Motor Factor 13.10 1 0 0 % % %
Fleet Factors Motor Factor 14.82 0 0 0 % % %
NPA Motor Factors Motor Factor 15.78 0 0 0 % % %
KNS Automotive Motor Factor 16.21 0 0 0 % % %
TMS Motor Spares Motor Factor 18.79 0 1 0 % % % 12 7 7 2 0 2 0 2 1 4 5
Select Automotive Supplies Motor Factor 107.59 0 0 0 % % %
ECP Newcastle - Gateshead
Competitor Details ECP Data Survey Responses
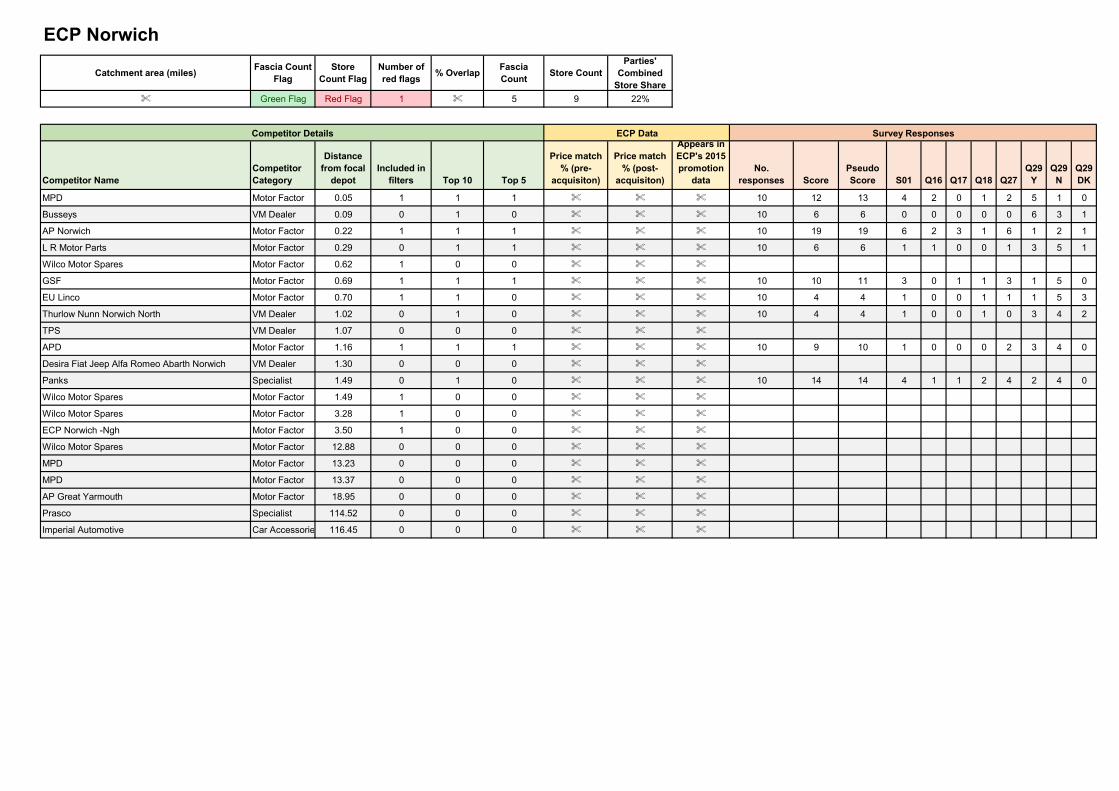
Catchment area (miles)Fascia Count
FlagStore
Count FlagNumber of red flags
% OverlapFascia Count
Store CountParties'
Combined Store Share
% Green Flag Red Flag 1 % 5 9 22%
Competitor NameCompetitor Category
Distance from focal
depotIncluded in
filters Top 10 Top 5
Price match % (pre-
acquisiton)
Price match % (post-
acquisiton)
Appears in ECP's 2015 promotion
dataNo.
responses ScorePseudo Score S01 Q16 Q17 Q18 Q27
Q29 Y
Q29 N
Q29 DK
MPD Motor Factor 0.05 1 1 1 % % % 10 12 13 4 2 0 1 2 5 1 0
Busseys VM Dealer 0.09 0 1 0 % % % 10 6 6 0 0 0 0 0 6 3 1
AP Norwich Motor Factor 0.22 1 1 1 % % % 10 19 19 6 2 3 1 6 1 2 1
L R Motor Parts Motor Factor 0.29 0 1 1 % % % 10 6 6 1 1 0 0 1 3 5 1
Wilco Motor Spares Motor Factor 0.62 1 0 0 % % %
GSF Motor Factor 0.69 1 1 1 % % % 10 10 11 3 0 1 1 3 1 5 0
EU Linco Motor Factor 0.70 1 1 0 % % % 10 4 4 1 0 0 1 1 1 5 3
Thurlow Nunn Norwich North VM Dealer 1.02 0 1 0 % % % 10 4 4 1 0 0 1 0 3 4 2
TPS VM Dealer 1.07 0 0 0 % % %
APD Motor Factor 1.16 1 1 1 % % % 10 9 10 1 0 0 0 2 3 4 0
Desira Fiat Jeep Alfa Romeo Abarth Norwich VM Dealer 1.30 0 0 0 % % %
Panks Specialist 1.49 0 1 0 % % % 10 14 14 4 1 1 2 4 2 4 0
Wilco Motor Spares Motor Factor 1.49 1 0 0 % % %
Wilco Motor Spares Motor Factor 3.28 1 0 0 % % %
ECP Norwich -Ngh Motor Factor 3.50 1 0 0 % % %
Wilco Motor Spares Motor Factor 12.88 0 0 0 % % %
MPD Motor Factor 13.23 0 0 0 % % %
MPD Motor Factor 13.37 0 0 0 % % %
AP Great Yarmouth Motor Factor 18.95 0 0 0 % % %
Prasco Specialist 114.52 0 0 0 % % %
Imperial Automotive Car Accessories 116.45 0 0 0 % % %
ECP Norwich
Competitor Details ECP Data Survey Responses
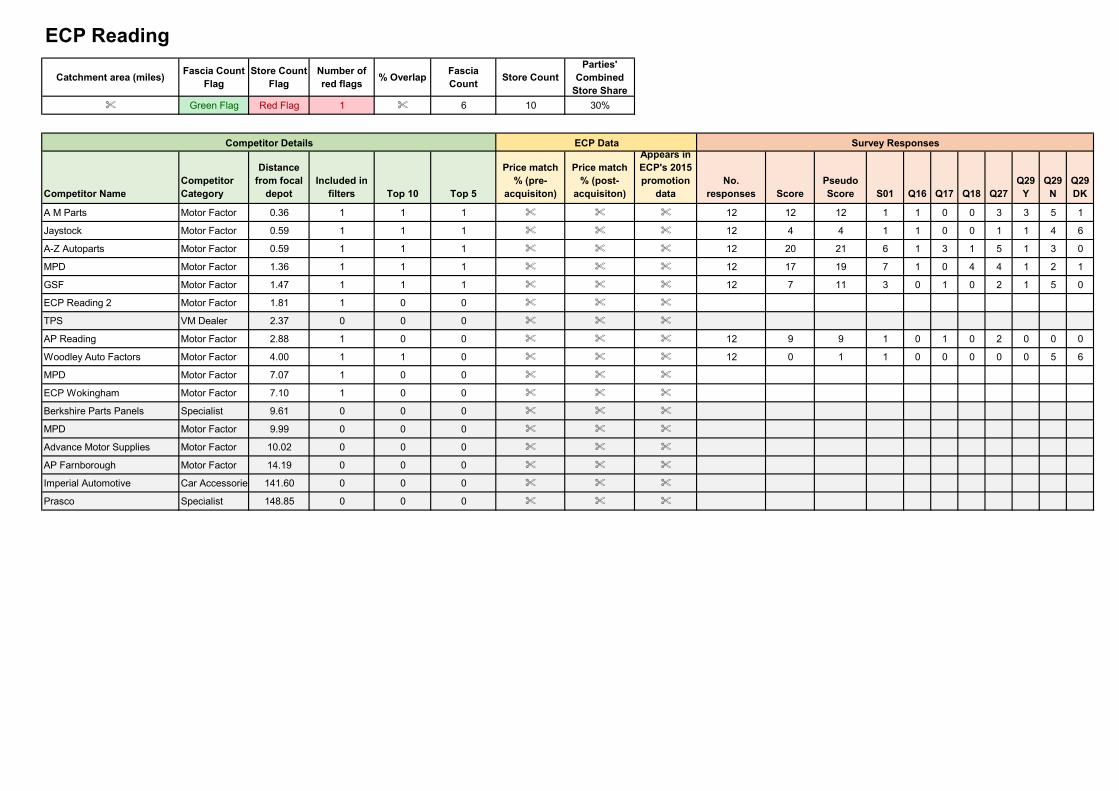
Catchment area (miles)Fascia Count
FlagStore Count
FlagNumber of red flags
% OverlapFascia Count
Store CountParties'
Combined Store Share
% Green Flag Red Flag 1 % 6 10 30%
Competitor NameCompetitor Category
Distance from focal
depotIncluded in
filters Top 10 Top 5
Price match % (pre-
acquisiton)
Price match % (post-
acquisiton)
Appears in ECP's 2015 promotion
dataNo.
responses ScorePseudo Score S01 Q16 Q17 Q18 Q27
Q29 Y
Q29 N
Q29 DK
A M Parts Motor Factor 0.36 1 1 1 % % % 12 12 12 1 1 0 0 3 3 5 1
Jaystock Motor Factor 0.59 1 1 1 % % % 12 4 4 1 1 0 0 1 1 4 6
A-Z Autoparts Motor Factor 0.59 1 1 1 % % % 12 20 21 6 1 3 1 5 1 3 0
MPD Motor Factor 1.36 1 1 1 % % % 12 17 19 7 1 0 4 4 1 2 1
GSF Motor Factor 1.47 1 1 1 % % % 12 7 11 3 0 1 0 2 1 5 0
ECP Reading 2 Motor Factor 1.81 1 0 0 % % %
TPS VM Dealer 2.37 0 0 0 % % %
AP Reading Motor Factor 2.88 1 0 0 % % % 12 9 9 1 0 1 0 2 0 0 0
Woodley Auto Factors Motor Factor 4.00 1 1 0 % % % 12 0 1 1 0 0 0 0 0 5 6
MPD Motor Factor 7.07 1 0 0 % % %
ECP Wokingham Motor Factor 7.10 1 0 0 % % %
Berkshire Parts Panels Specialist 9.61 0 0 0 % % %
MPD Motor Factor 9.99 0 0 0 % % %
Advance Motor Supplies Motor Factor 10.02 0 0 0 % % %
AP Farnborough Motor Factor 14.19 0 0 0 % % %
Imperial Automotive Car Accessories 141.60 0 0 0 % % %
Prasco Specialist 148.85 0 0 0 % % %
ECP Reading
Competitor Details ECP Data Survey Responses
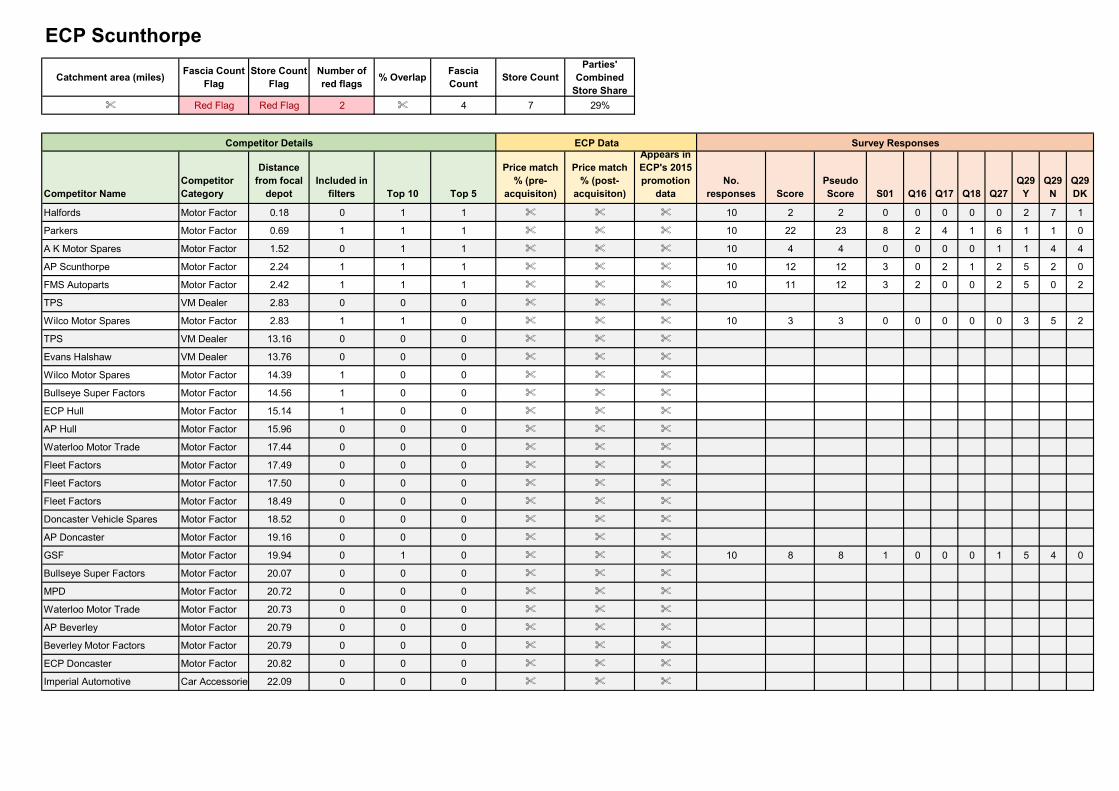
Catchment area (miles)Fascia Count
FlagStore Count
FlagNumber of red flags
% OverlapFascia Count
Store CountParties'
Combined Store Share
% Red Flag Red Flag 2 % 4 7 29%
Competitor NameCompetitor Category
Distance from focal
depotIncluded in
filters Top 10 Top 5
Price match % (pre-
acquisiton)
Price match % (post-
acquisiton)
Appears in ECP's 2015 promotion
dataNo.
responses ScorePseudo Score S01 Q16 Q17 Q18 Q27
Q29 Y
Q29 N
Q29 DK
Halfords Motor Factor 0.18 0 1 1 % % % 10 2 2 0 0 0 0 0 2 7 1
Parkers Motor Factor 0.69 1 1 1 % % % 10 22 23 8 2 4 1 6 1 1 0
A K Motor Spares Motor Factor 1.52 0 1 1 % % % 10 4 4 0 0 0 0 1 1 4 4
AP Scunthorpe Motor Factor 2.24 1 1 1 % % % 10 12 12 3 0 2 1 2 5 2 0
FMS Autoparts Motor Factor 2.42 1 1 1 % % % 10 11 12 3 2 0 0 2 5 0 2
TPS VM Dealer 2.83 0 0 0 % % %
Wilco Motor Spares Motor Factor 2.83 1 1 0 % % % 10 3 3 0 0 0 0 0 3 5 2
TPS VM Dealer 13.16 0 0 0 % % %
Evans Halshaw VM Dealer 13.76 0 0 0 % % %
Wilco Motor Spares Motor Factor 14.39 1 0 0 % % %
Bullseye Super Factors Motor Factor 14.56 1 0 0 % % %
ECP Hull Motor Factor 15.14 1 0 0 % % %
AP Hull Motor Factor 15.96 0 0 0 % % %
Waterloo Motor Trade Motor Factor 17.44 0 0 0 % % %
Fleet Factors Motor Factor 17.49 0 0 0 % % %
Fleet Factors Motor Factor 17.50 0 0 0 % % %
Fleet Factors Motor Factor 18.49 0 0 0 % % %
Doncaster Vehicle Spares Motor Factor 18.52 0 0 0 % % %
AP Doncaster Motor Factor 19.16 0 0 0 % % %
GSF Motor Factor 19.94 0 1 0 % % % 10 8 8 1 0 0 0 1 5 4 0
Bullseye Super Factors Motor Factor 20.07 0 0 0 % % %
MPD Motor Factor 20.72 0 0 0 % % %
Waterloo Motor Trade Motor Factor 20.73 0 0 0 % % %
AP Beverley Motor Factor 20.79 0 0 0 % % %
Beverley Motor Factors Motor Factor 20.79 0 0 0 % % %
ECP Doncaster Motor Factor 20.82 0 0 0 % % %
Imperial Automotive Car Accessories 22.09 0 0 0 % % %
ECP Scunthorpe
Competitor Details ECP Data Survey Responses
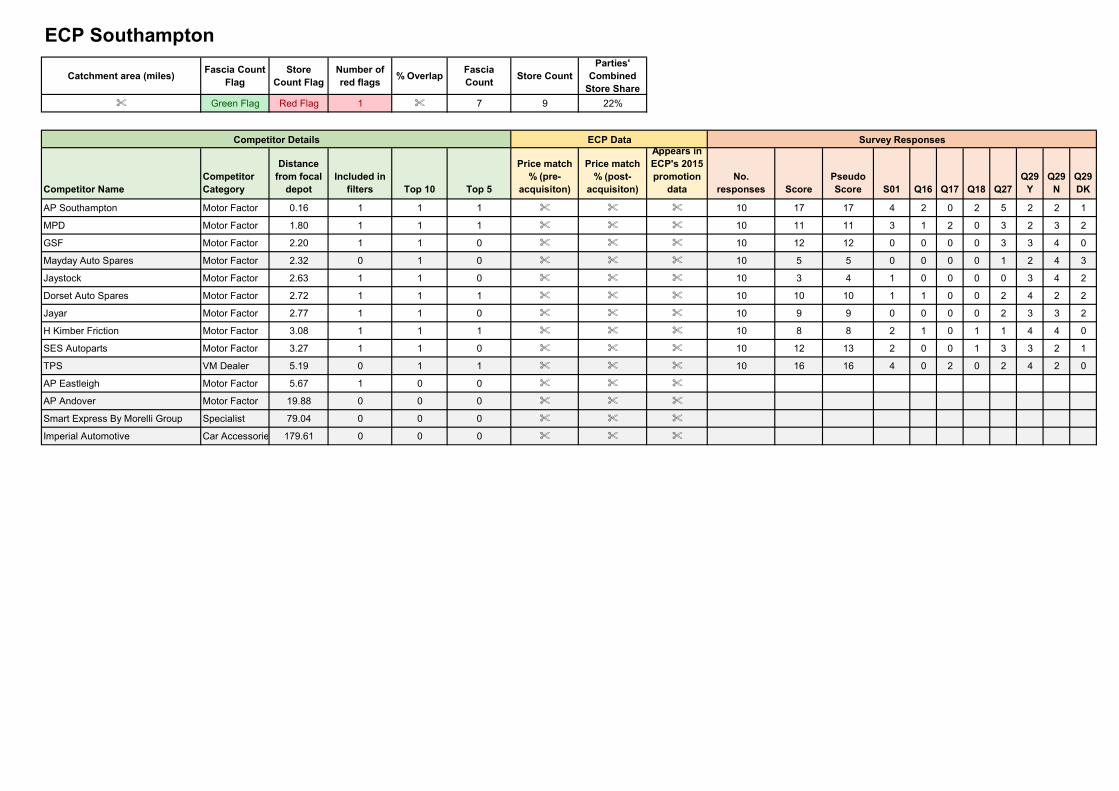
Catchment area (miles)Fascia Count
FlagStore
Count FlagNumber of red flags
% OverlapFascia Count
Store CountParties'
Combined Store Share
% Green Flag Red Flag 1 % 7 9 22%
Competitor NameCompetitor Category
Distance from focal
depotIncluded in
filters Top 10 Top 5
Price match % (pre-
acquisiton)
Price match % (post-
acquisiton)
Appears in ECP's 2015 promotion
dataNo.
responses ScorePseudo Score S01 Q16 Q17 Q18 Q27
Q29 Y
Q29 N
Q29 DK
AP Southampton Motor Factor 0.16 1 1 1 % % % 10 17 17 4 2 0 2 5 2 2 1
MPD Motor Factor 1.80 1 1 1 % % % 10 11 11 3 1 2 0 3 2 3 2
GSF Motor Factor 2.20 1 1 0 % % % 10 12 12 0 0 0 0 3 3 4 0
Mayday Auto Spares Motor Factor 2.32 0 1 0 % % % 10 5 5 0 0 0 0 1 2 4 3
Jaystock Motor Factor 2.63 1 1 0 % % % 10 3 4 1 0 0 0 0 3 4 2
Dorset Auto Spares Motor Factor 2.72 1 1 1 % % % 10 10 10 1 1 0 0 2 4 2 2
Jayar Motor Factor 2.77 1 1 0 % % % 10 9 9 0 0 0 0 2 3 3 2
H Kimber Friction Motor Factor 3.08 1 1 1 % % % 10 8 8 2 1 0 1 1 4 4 0
SES Autoparts Motor Factor 3.27 1 1 0 % % % 10 12 13 2 0 0 1 3 3 2 1
TPS VM Dealer 5.19 0 1 1 % % % 10 16 16 4 0 2 0 2 4 2 0
AP Eastleigh Motor Factor 5.67 1 0 0 % % %
AP Andover Motor Factor 19.88 0 0 0 % % %
Smart Express By Morelli Group Specialist 79.04 0 0 0 % % %
Imperial Automotive Car Accessories 179.61 0 0 0 % % %
ECP Southampton
Competitor Details ECP Data Survey Responses
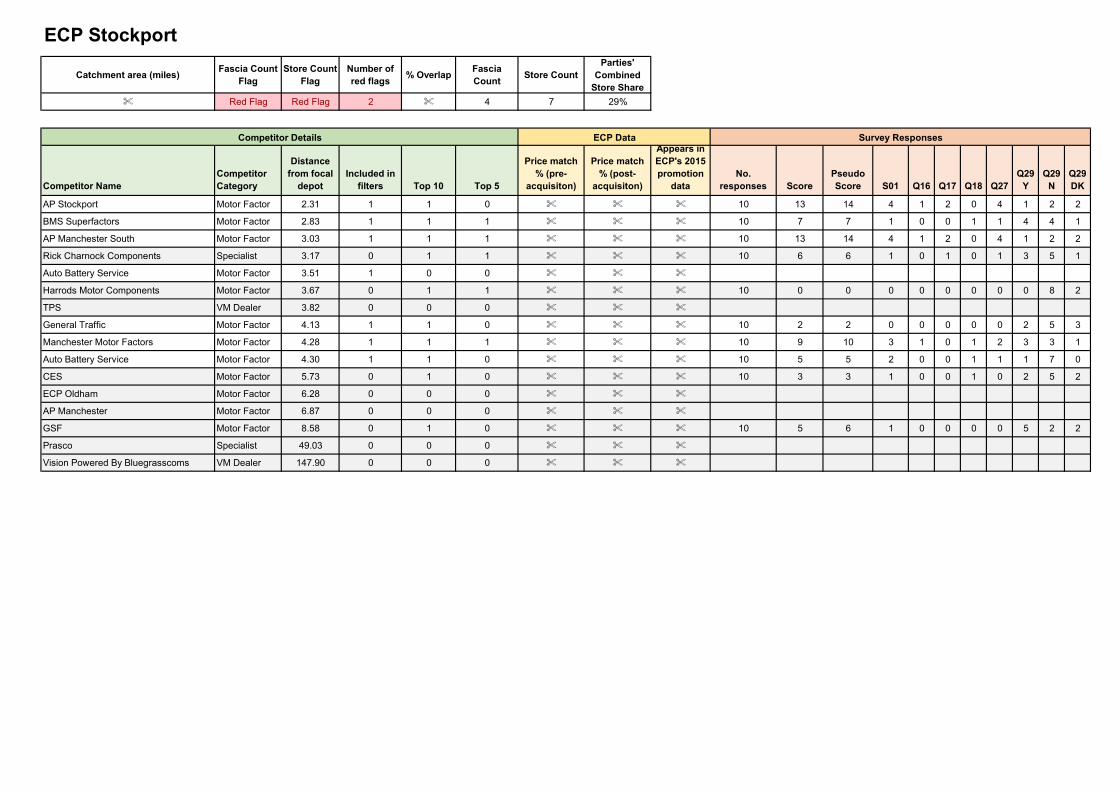
Catchment area (miles)Fascia Count
FlagStore Count
FlagNumber of red flags
% OverlapFascia Count
Store CountParties'
Combined Store Share
% Red Flag Red Flag 2 % 4 7 29%
Competitor NameCompetitor Category
Distance from focal
depotIncluded in
filters Top 10 Top 5
Price match % (pre-
acquisiton)
Price match % (post-
acquisiton)
Appears in ECP's 2015 promotion
dataNo.
responses ScorePseudo Score S01 Q16 Q17 Q18 Q27
Q29 Y
Q29 N
Q29 DK
AP Stockport Motor Factor 2.31 1 1 0 % % % 10 13 14 4 1 2 0 4 1 2 2
BMS Superfactors Motor Factor 2.83 1 1 1 % % % 10 7 7 1 0 0 1 1 4 4 1
AP Manchester South Motor Factor 3.03 1 1 1 % % % 10 13 14 4 1 2 0 4 1 2 2
Rick Charnock Components Specialist 3.17 0 1 1 % % % 10 6 6 1 0 1 0 1 3 5 1
Auto Battery Service Motor Factor 3.51 1 0 0 % % %
Harrods Motor Components Motor Factor 3.67 0 1 1 % % % 10 0 0 0 0 0 0 0 0 8 2
TPS VM Dealer 3.82 0 0 0 % % %
General Traffic Motor Factor 4.13 1 1 0 % % % 10 2 2 0 0 0 0 0 2 5 3
Manchester Motor Factors Motor Factor 4.28 1 1 1 % % % 10 9 10 3 1 0 1 2 3 3 1
Auto Battery Service Motor Factor 4.30 1 1 0 % % % 10 5 5 2 0 0 1 1 1 7 0
CES Motor Factor 5.73 0 1 0 % % % 10 3 3 1 0 0 1 0 2 5 2
ECP Oldham Motor Factor 6.28 0 0 0 % % %
AP Manchester Motor Factor 6.87 0 0 0 % % %
GSF Motor Factor 8.58 0 1 0 % % % 10 5 6 1 0 0 0 0 5 2 2
Prasco Specialist 49.03 0 0 0 % % %
Vision Powered By Bluegrasscoms VM Dealer 147.90 0 0 0 % % %
ECP Stockport
Competitor Details ECP Data Survey Responses

Catchment area (miles)Fascia Count
FlagStore
Count FlagNumber of red flags
% OverlapFascia Count
Store CountParties'
Combined Store Share
% Green Flag Red Flag 1 % 5 10 30%
Competitor NameCompetitor Category
Distance from focal
depotIncluded in
filters Top 10 Top 5
Price match % (pre-
acquisiton)
Price match % (post-
acquisiton)
Appears in ECP's 2015 promotion
dataNo.
responses ScorePseudo Score S01 Q16 Q17 Q18 Q27
Q29 Y
Q29 N
Q29 DK
AP Stockton Motor Factor 0.59 1 1 1 % % % 10 16 17 4 0 2 1 4 4 1 0
LT Motor Supplies Motor Factor 1.10 0 1 1 % % % 10 5 5 1 1 0 0 1 2 4 3
NPA Motor Factors Motor Factor 1.72 1 1 1 % % % 10 11 12 5 1 0 3 2 3 2 0
Exhausts Components Motor Factor 1.81 1 1 0 % % % 10 10 11 4 0 2 1 2 1 3 2
TPS VM Dealer 2.46 0 0 0 % % %
Sewells Car Accessories Motor Factor 3.36 0 1 0 % % % 10 6 7 2 0 0 1 1 2 4 1
GSF Motor Factor 4.03 1 1 1 % % % 10 6 6 1 0 1 0 1 3 4 2
Fleet Factors Motor Factor 5.71 1 1 0 % % % 10 2 2 0 0 0 0 0 2 6 2
AP Darlington Motor Factor 9.15 1 0 0 % % %
ECP Darlington Motor Factor 9.15 1 0 0 % % %
NPA Motor Factors Motor Factor 9.21 1 0 0 % % %
Dmfx Motor Factor 9.45 1 1 0 % % % 10 2 2 0 0 0 0 0 2 6 2
Advanced Motor Components Motor Factor 10.14 0 1 0 % % % 10 0 0 0 0 0 0 0 0 4 6
NPA Motor Factors Motor Factor 11.14 1 0 0 % % %
Oak Road Whitby Motor Factors Motor Factor 11.69 0 1 1 % % % 10 10 10 2 2 0 0 1 1 4 2
SAS Autoparts Motor Factor 14.73 0 0 0 % % %
KNS Automotive Motor Factor 14.78 0 0 0 % % %
Imperial Automotive Car Accessories 72.20 0 0 0 % % %
ECP Stockton
Competitor Details ECP Data Survey Responses
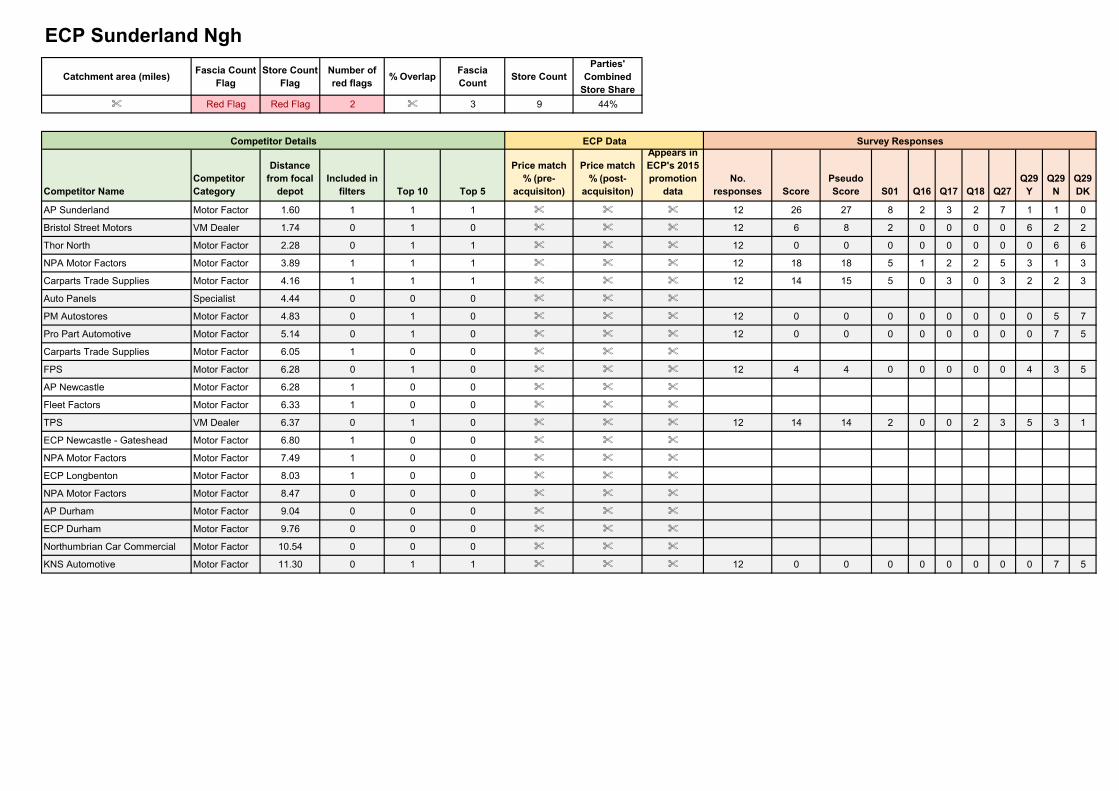
Catchment area (miles)Fascia Count
FlagStore Count
FlagNumber of red flags
% OverlapFascia Count
Store CountParties'
Combined Store Share
% Red Flag Red Flag 2 % 3 9 44%
Competitor NameCompetitor Category
Distance from focal
depotIncluded in
filters Top 10 Top 5
Price match % (pre-
acquisiton)
Price match % (post-
acquisiton)
Appears in ECP's 2015 promotion
dataNo.
responses ScorePseudo Score S01 Q16 Q17 Q18 Q27
Q29 Y
Q29 N
Q29 DK
AP Sunderland Motor Factor 1.60 1 1 1 % % % 12 26 27 8 2 3 2 7 1 1 0
Bristol Street Motors VM Dealer 1.74 0 1 0 % % % 12 6 8 2 0 0 0 0 6 2 2
Thor North Motor Factor 2.28 0 1 1 % % % 12 0 0 0 0 0 0 0 0 6 6
NPA Motor Factors Motor Factor 3.89 1 1 1 % % % 12 18 18 5 1 2 2 5 3 1 3
Carparts Trade Supplies Motor Factor 4.16 1 1 1 % % % 12 14 15 5 0 3 0 3 2 2 3
Auto Panels Specialist 4.44 0 0 0 % % %
PM Autostores Motor Factor 4.83 0 1 0 % % % 12 0 0 0 0 0 0 0 0 5 7
Pro Part Automotive Motor Factor 5.14 0 1 0 % % % 12 0 0 0 0 0 0 0 0 7 5
Carparts Trade Supplies Motor Factor 6.05 1 0 0 % % %
FPS Motor Factor 6.28 0 1 0 % % % 12 4 4 0 0 0 0 0 4 3 5
AP Newcastle Motor Factor 6.28 1 0 0 % % %
Fleet Factors Motor Factor 6.33 1 0 0 % % %
TPS VM Dealer 6.37 0 1 0 % % % 12 14 14 2 0 0 2 3 5 3 1
ECP Newcastle - Gateshead Motor Factor 6.80 1 0 0 % % %
NPA Motor Factors Motor Factor 7.49 1 0 0 % % %
ECP Longbenton Motor Factor 8.03 1 0 0 % % %
NPA Motor Factors Motor Factor 8.47 0 0 0 % % %
AP Durham Motor Factor 9.04 0 0 0 % % %
ECP Durham Motor Factor 9.76 0 0 0 % % %
Northumbrian Car Commercial Motor Factor 10.54 0 0 0 % % %
KNS Automotive Motor Factor 11.30 0 1 1 % % % 12 0 0 0 0 0 0 0 0 7 5
ECP Sunderland Ngh
Competitor Details ECP Data Survey Responses
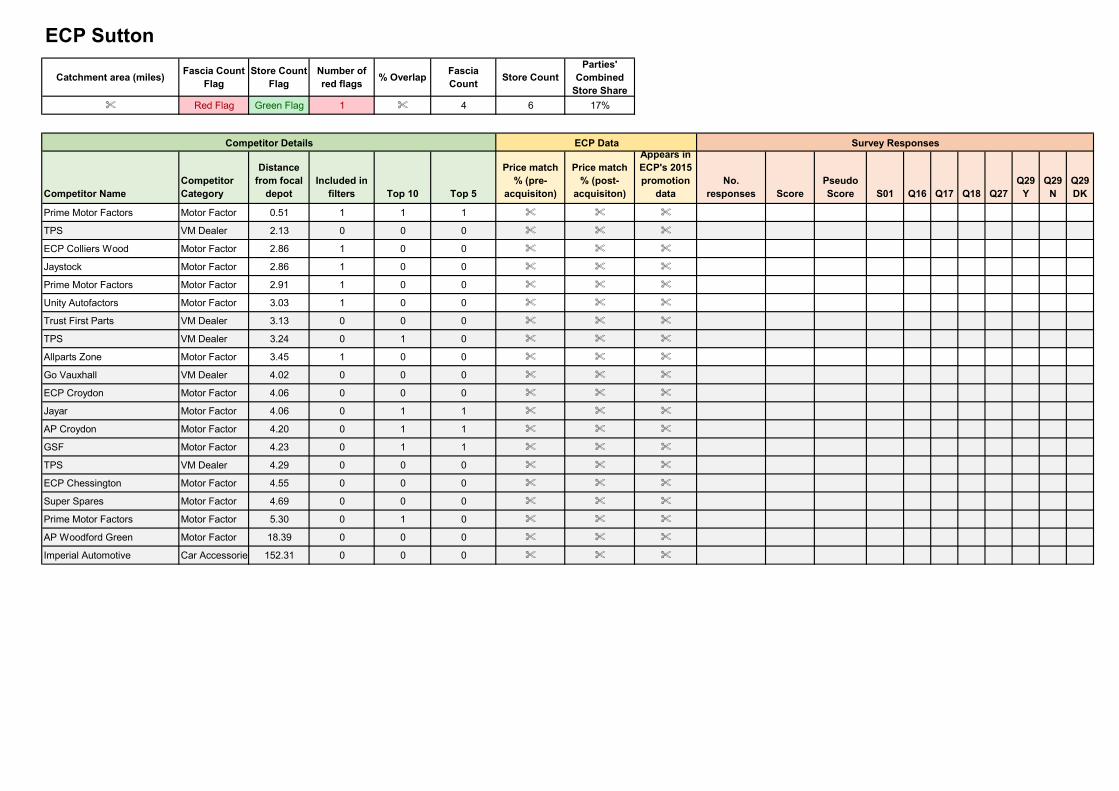
Catchment area (miles)Fascia Count
FlagStore Count
FlagNumber of red flags
% OverlapFascia Count
Store CountParties'
Combined Store Share
% Red Flag Green Flag 1 % 4 6 17%
Competitor NameCompetitor Category
Distance from focal
depotIncluded in
filters Top 10 Top 5
Price match % (pre-
acquisiton)
Price match % (post-
acquisiton)
Appears in ECP's 2015 promotion
dataNo.
responses ScorePseudo Score S01 Q16 Q17 Q18 Q27
Q29 Y
Q29 N
Q29 DK
Prime Motor Factors Motor Factor 0.51 1 1 1 % % %
TPS VM Dealer 2.13 0 0 0 % % %
ECP Colliers Wood Motor Factor 2.86 1 0 0 % % %
Jaystock Motor Factor 2.86 1 0 0 % % %
Prime Motor Factors Motor Factor 2.91 1 0 0 % % %
Unity Autofactors Motor Factor 3.03 1 0 0 % % %
Trust First Parts VM Dealer 3.13 0 0 0 % % %
TPS VM Dealer 3.24 0 1 0 % % %
Allparts Zone Motor Factor 3.45 1 0 0 % % %
Go Vauxhall VM Dealer 4.02 0 0 0 % % %
ECP Croydon Motor Factor 4.06 0 0 0 % % %
Jayar Motor Factor 4.06 0 1 1 % % %
AP Croydon Motor Factor 4.20 0 1 1 % % %
GSF Motor Factor 4.23 0 1 1 % % %
TPS VM Dealer 4.29 0 0 0 % % %
ECP Chessington Motor Factor 4.55 0 0 0 % % %
Super Spares Motor Factor 4.69 0 0 0 % % %
Prime Motor Factors Motor Factor 5.30 0 1 0 % % %
AP Woodford Green Motor Factor 18.39 0 0 0 % % %
Imperial Automotive Car Accessories 152.31 0 0 0 % % %
ECP Sutton
Competitor Details ECP Data Survey Responses
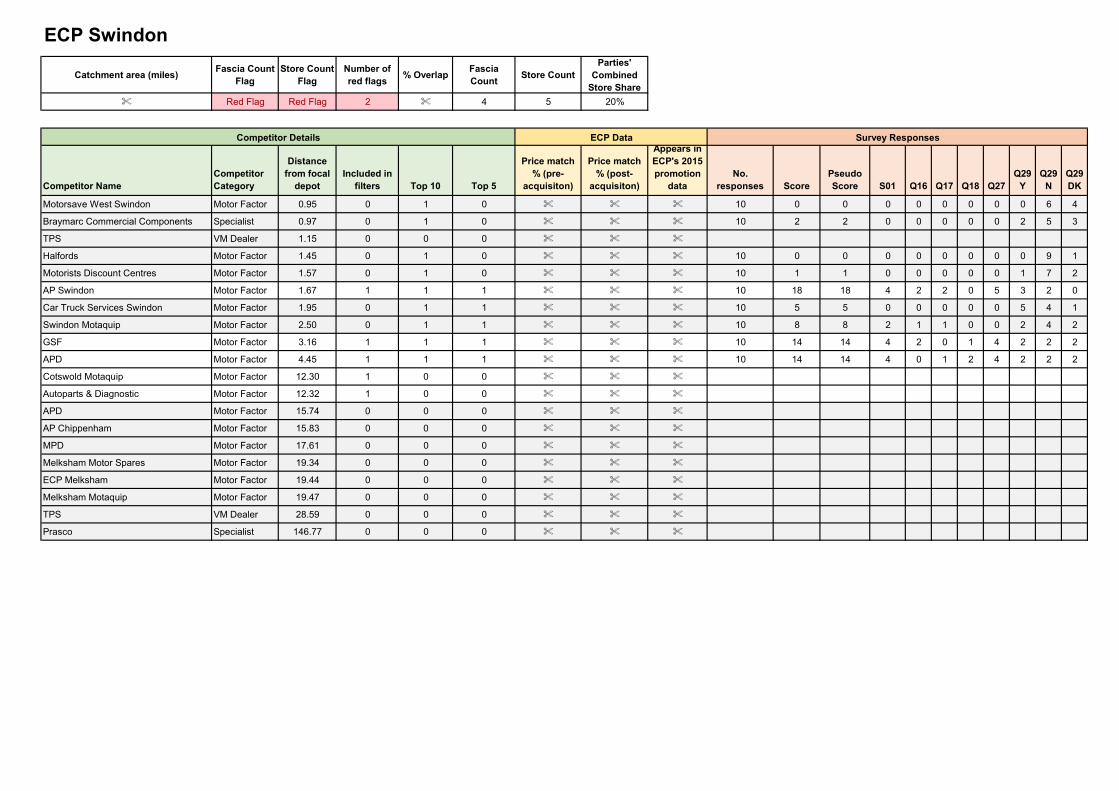
Catchment area (miles)Fascia Count
FlagStore Count
FlagNumber of red flags
% OverlapFascia Count
Store CountParties'
Combined Store Share
% Red Flag Red Flag 2 % 4 5 20%
Competitor NameCompetitor Category
Distance from focal
depotIncluded in
filters Top 10 Top 5
Price match % (pre-
acquisiton)
Price match % (post-
acquisiton)
Appears in ECP's 2015 promotion
dataNo.
responses ScorePseudo Score S01 Q16 Q17 Q18 Q27
Q29 Y
Q29 N
Q29 DK
Motorsave West Swindon Motor Factor 0.95 0 1 0 % % % 10 0 0 0 0 0 0 0 0 6 4
Braymarc Commercial Components Specialist 0.97 0 1 0 % % % 10 2 2 0 0 0 0 0 2 5 3
TPS VM Dealer 1.15 0 0 0 % % %
Halfords Motor Factor 1.45 0 1 0 % % % 10 0 0 0 0 0 0 0 0 9 1
Motorists Discount Centres Motor Factor 1.57 0 1 0 % % % 10 1 1 0 0 0 0 0 1 7 2
AP Swindon Motor Factor 1.67 1 1 1 % % % 10 18 18 4 2 2 0 5 3 2 0
Car Truck Services Swindon Motor Factor 1.95 0 1 1 % % % 10 5 5 0 0 0 0 0 5 4 1
Swindon Motaquip Motor Factor 2.50 0 1 1 % % % 10 8 8 2 1 1 0 0 2 4 2
GSF Motor Factor 3.16 1 1 1 % % % 10 14 14 4 2 0 1 4 2 2 2
APD Motor Factor 4.45 1 1 1 % % % 10 14 14 4 0 1 2 4 2 2 2
Cotswold Motaquip Motor Factor 12.30 1 0 0 % % %
Autoparts & Diagnostic Motor Factor 12.32 1 0 0 % % %
APD Motor Factor 15.74 0 0 0 % % %
AP Chippenham Motor Factor 15.83 0 0 0 % % %
MPD Motor Factor 17.61 0 0 0 % % %
Melksham Motor Spares Motor Factor 19.34 0 0 0 % % %
ECP Melksham Motor Factor 19.44 0 0 0 % % %
Melksham Motaquip Motor Factor 19.47 0 0 0 % % %
TPS VM Dealer 28.59 0 0 0 % % %
Prasco Specialist 146.77 0 0 0 % % %
ECP Swindon
Competitor Details ECP Data Survey Responses
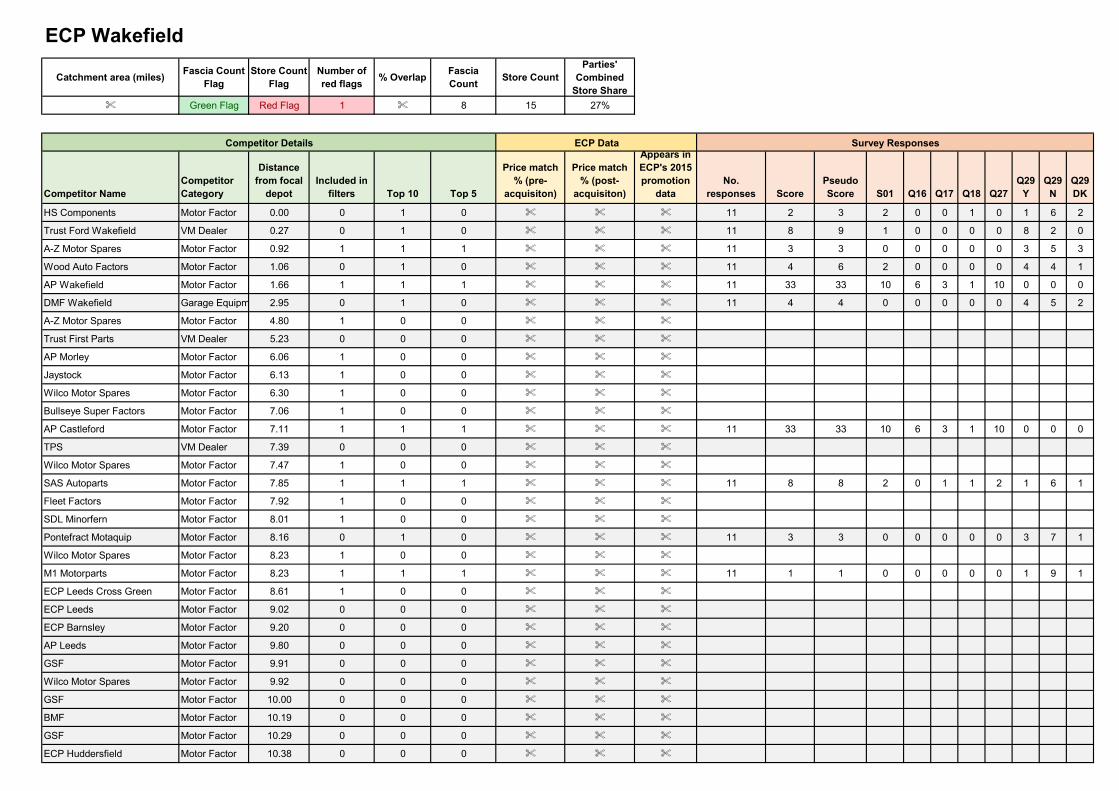
Catchment area (miles)Fascia Count
FlagStore Count
FlagNumber of red flags
% OverlapFascia Count
Store CountParties'
Combined Store Share
% Green Flag Red Flag 1 % 8 15 27%
Competitor NameCompetitor Category
Distance from focal
depotIncluded in
filters Top 10 Top 5
Price match % (pre-
acquisiton)
Price match % (post-
acquisiton)
Appears in ECP's 2015 promotion
dataNo.
responses ScorePseudo Score S01 Q16 Q17 Q18 Q27
Q29 Y
Q29 N
Q29 DK
HS Components Motor Factor 0.00 0 1 0 % % % 11 2 3 2 0 0 1 0 1 6 2
Trust Ford Wakefield VM Dealer 0.27 0 1 0 % % % 11 8 9 1 0 0 0 0 8 2 0
A-Z Motor Spares Motor Factor 0.92 1 1 1 % % % 11 3 3 0 0 0 0 0 3 5 3
Wood Auto Factors Motor Factor 1.06 0 1 0 % % % 11 4 6 2 0 0 0 0 4 4 1
AP Wakefield Motor Factor 1.66 1 1 1 % % % 11 33 33 10 6 3 1 10 0 0 0
DMF Wakefield Garage Equipment Specialist2.95 0 1 0 % % % 11 4 4 0 0 0 0 0 4 5 2
A-Z Motor Spares Motor Factor 4.80 1 0 0 % % %
Trust First Parts VM Dealer 5.23 0 0 0 % % %
AP Morley Motor Factor 6.06 1 0 0 % % %
Jaystock Motor Factor 6.13 1 0 0 % % %
Wilco Motor Spares Motor Factor 6.30 1 0 0 % % %
Bullseye Super Factors Motor Factor 7.06 1 0 0 % % %
AP Castleford Motor Factor 7.11 1 1 1 % % % 11 33 33 10 6 3 1 10 0 0 0
TPS VM Dealer 7.39 0 0 0 % % %
Wilco Motor Spares Motor Factor 7.47 1 0 0 % % %
SAS Autoparts Motor Factor 7.85 1 1 1 % % % 11 8 8 2 0 1 1 2 1 6 1
Fleet Factors Motor Factor 7.92 1 0 0 % % %
SDL Minorfern Motor Factor 8.01 1 0 0 % % %
Pontefract Motaquip Motor Factor 8.16 0 1 0 % % % 11 3 3 0 0 0 0 0 3 7 1
Wilco Motor Spares Motor Factor 8.23 1 0 0 % % %
M1 Motorparts Motor Factor 8.23 1 1 1 % % % 11 1 1 0 0 0 0 0 1 9 1
ECP Leeds Cross Green Motor Factor 8.61 1 0 0 % % %
ECP Leeds Motor Factor 9.02 0 0 0 % % %
ECP Barnsley Motor Factor 9.20 0 0 0 % % %
AP Leeds Motor Factor 9.80 0 0 0 % % %
GSF Motor Factor 9.91 0 0 0 % % %
Wilco Motor Spares Motor Factor 9.92 0 0 0 % % %
GSF Motor Factor 10.00 0 0 0 % % %
BMF Motor Factor 10.19 0 0 0 % % %
GSF Motor Factor 10.29 0 0 0 % % %
ECP Huddersfield Motor Factor 10.38 0 0 0 % % %
ECP Wakefield
Competitor Details ECP Data Survey Responses
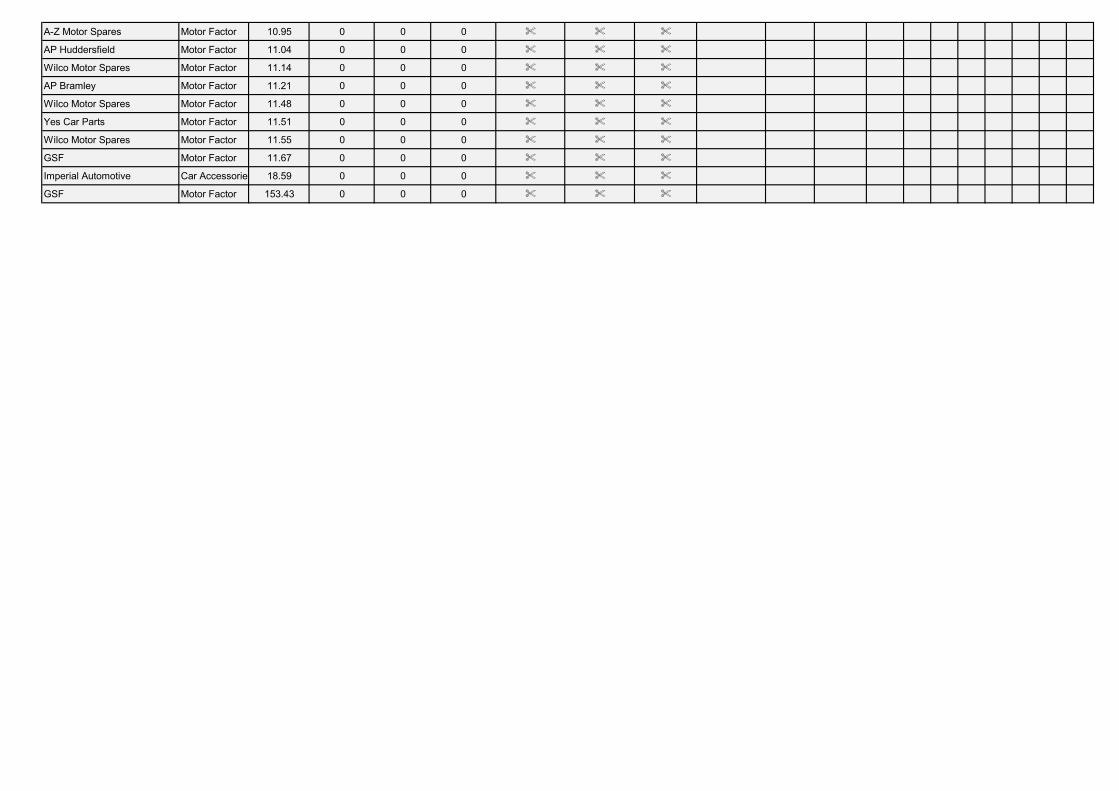
A-Z Motor Spares Motor Factor 10.95 0 0 0 % % %
AP Huddersfield Motor Factor 11.04 0 0 0 % % %
Wilco Motor Spares Motor Factor 11.14 0 0 0 % % %
AP Bramley Motor Factor 11.21 0 0 0 % % %
Wilco Motor Spares Motor Factor 11.48 0 0 0 % % %
Yes Car Parts Motor Factor 11.51 0 0 0 % % %
Wilco Motor Spares Motor Factor 11.55 0 0 0 % % %
GSF Motor Factor 11.67 0 0 0 % % %
Imperial Automotive Car Accessories 18.59 0 0 0 % % %
GSF Motor Factor 153.43 0 0 0 % % %
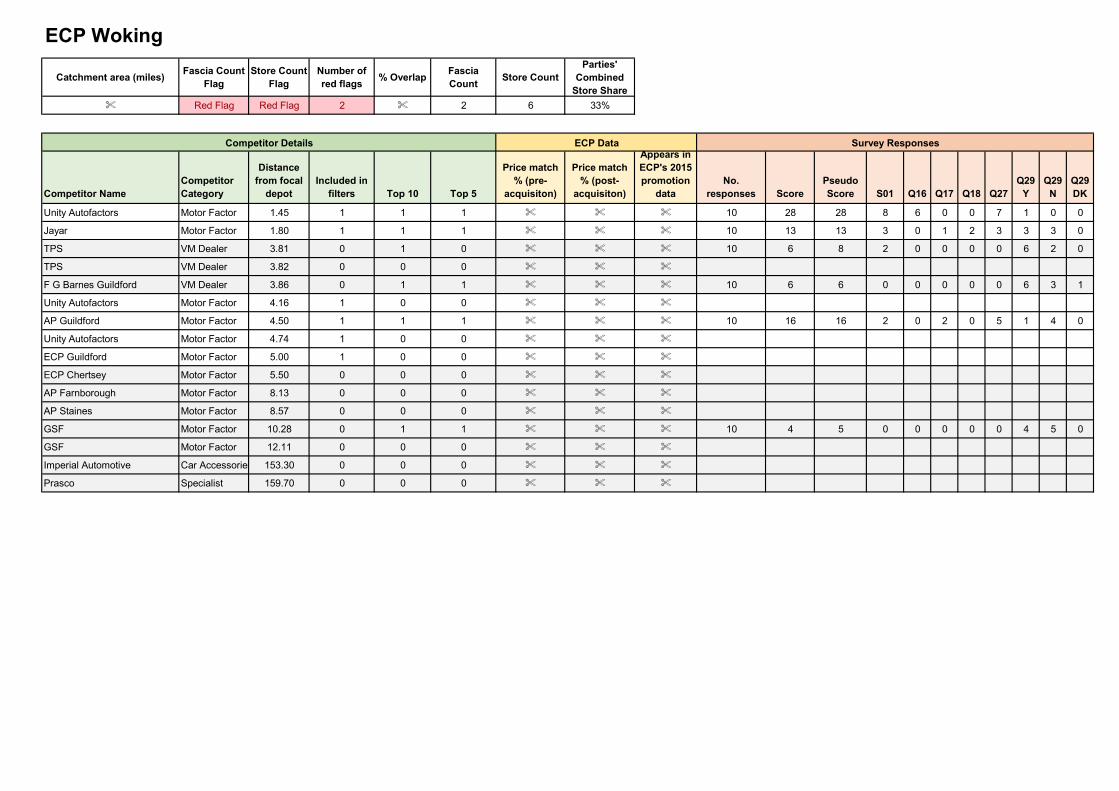
Catchment area (miles)Fascia Count
FlagStore Count
FlagNumber of red flags
% OverlapFascia Count
Store CountParties'
Combined Store Share
% Red Flag Red Flag 2 % 2 6 33%
Competitor NameCompetitor Category
Distance from focal
depotIncluded in
filters Top 10 Top 5
Price match % (pre-
acquisiton)
Price match % (post-
acquisiton)
Appears in ECP's 2015 promotion
dataNo.
responses ScorePseudo Score S01 Q16 Q17 Q18 Q27
Q29 Y
Q29 N
Q29 DK
Unity Autofactors Motor Factor 1.45 1 1 1 % % % 10 28 28 8 6 0 0 7 1 0 0
Jayar Motor Factor 1.80 1 1 1 % % % 10 13 13 3 0 1 2 3 3 3 0
TPS VM Dealer 3.81 0 1 0 % % % 10 6 8 2 0 0 0 0 6 2 0
TPS VM Dealer 3.82 0 0 0 % % %
F G Barnes Guildford VM Dealer 3.86 0 1 1 % % % 10 6 6 0 0 0 0 0 6 3 1
Unity Autofactors Motor Factor 4.16 1 0 0 % % %
AP Guildford Motor Factor 4.50 1 1 1 % % % 10 16 16 2 0 2 0 5 1 4 0
Unity Autofactors Motor Factor 4.74 1 0 0 % % %
ECP Guildford Motor Factor 5.00 1 0 0 % % %
ECP Chertsey Motor Factor 5.50 0 0 0 % % %
AP Farnborough Motor Factor 8.13 0 0 0 % % %
AP Staines Motor Factor 8.57 0 0 0 % % %
GSF Motor Factor 10.28 0 1 1 % % % 10 4 5 0 0 0 0 0 4 5 0
GSF Motor Factor 12.11 0 0 0 % % %
Imperial Automotive Car Accessories 153.30 0 0 0 % % %
Prasco Specialist 159.70 0 0 0 % % %
ECP Woking
Competitor Details ECP Data Survey Responses
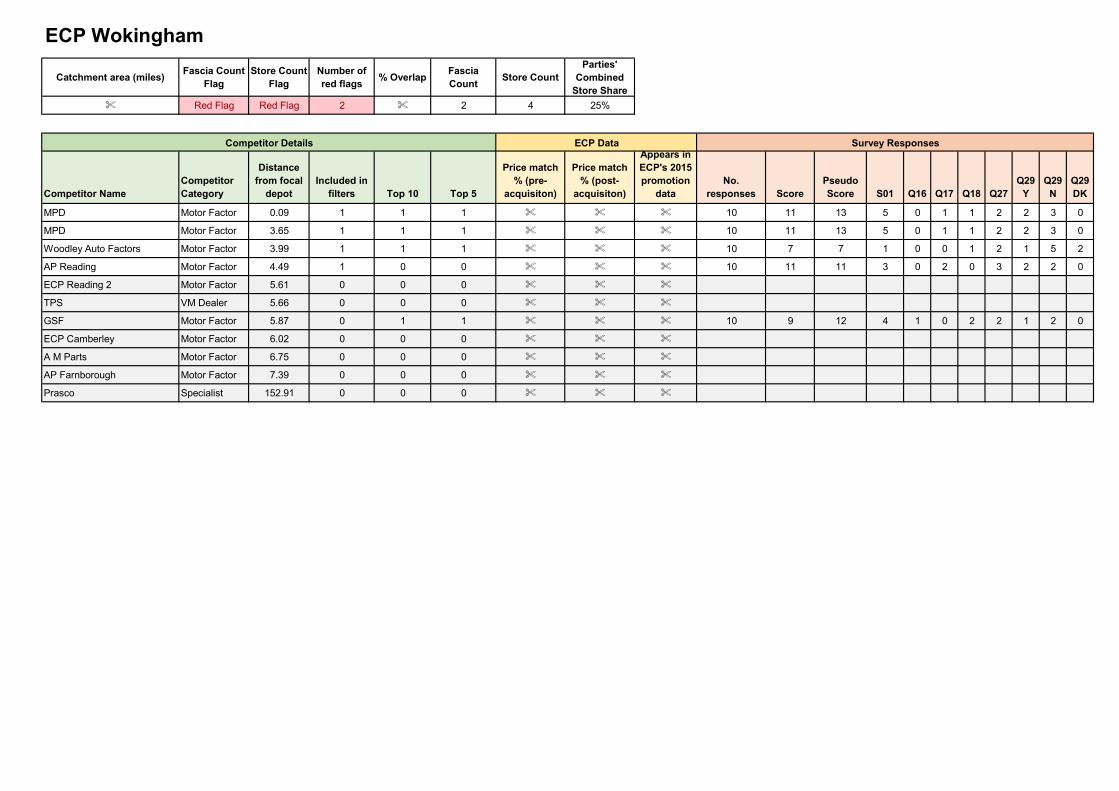
Catchment area (miles)Fascia Count
FlagStore Count
FlagNumber of red flags
% OverlapFascia Count
Store CountParties'
Combined Store Share
% Red Flag Red Flag 2 % 2 4 25%
Competitor NameCompetitor Category
Distance from focal
depotIncluded in
filters Top 10 Top 5
Price match % (pre-
acquisiton)
Price match % (post-
acquisiton)
Appears in ECP's 2015 promotion
dataNo.
responses ScorePseudo Score S01 Q16 Q17 Q18 Q27
Q29 Y
Q29 N
Q29 DK
MPD Motor Factor 0.09 1 1 1 % % % 10 11 13 5 0 1 1 2 2 3 0
MPD Motor Factor 3.65 1 1 1 % % % 10 11 13 5 0 1 1 2 2 3 0
Woodley Auto Factors Motor Factor 3.99 1 1 1 % % % 10 7 7 1 0 0 1 2 1 5 2
AP Reading Motor Factor 4.49 1 0 0 % % % 10 11 11 3 0 2 0 3 2 2 0
ECP Reading 2 Motor Factor 5.61 0 0 0 % % %
TPS VM Dealer 5.66 0 0 0 % % %
GSF Motor Factor 5.87 0 1 1 % % % 10 9 12 4 1 0 2 2 1 2 0
ECP Camberley Motor Factor 6.02 0 0 0 % % %
A M Parts Motor Factor 6.75 0 0 0 % % %
AP Farnborough Motor Factor 7.39 0 0 0 % % %
Prasco Specialist 152.91 0 0 0 % % %
ECP Wokingham
Competitor Details ECP Data Survey Responses
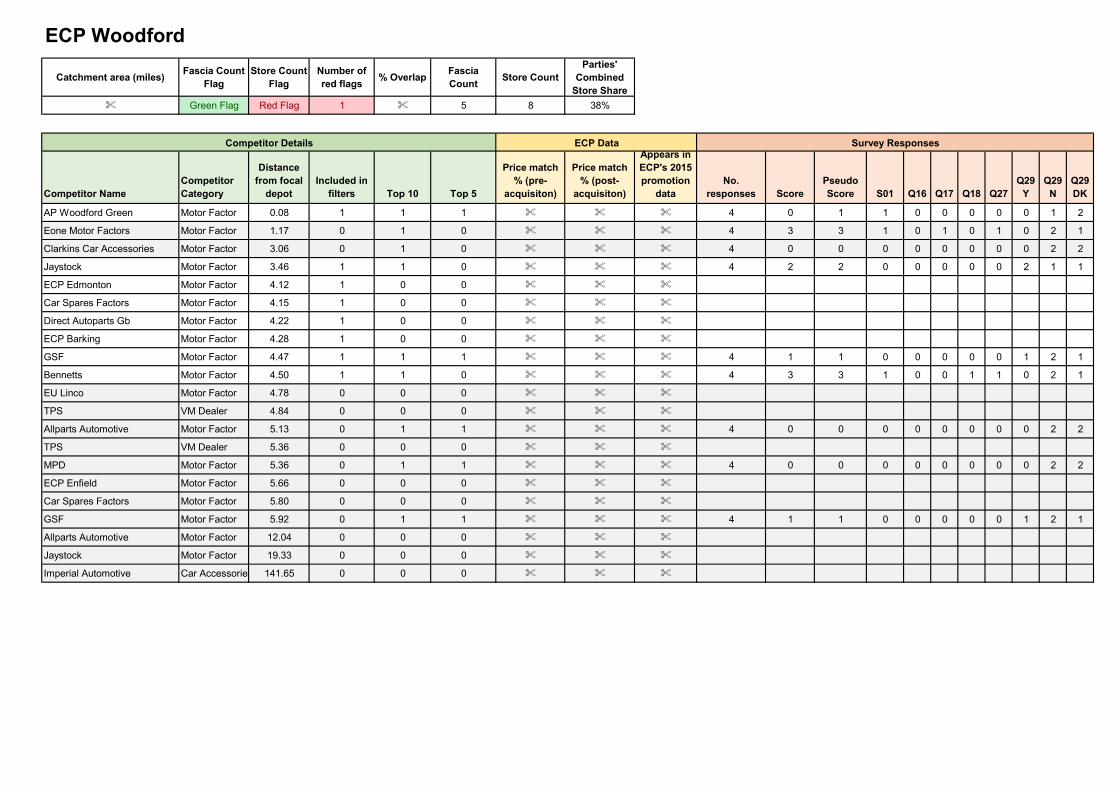
Catchment area (miles)Fascia Count
FlagStore Count
FlagNumber of red flags
% OverlapFascia Count
Store CountParties'
Combined Store Share
% Green Flag Red Flag 1 % 5 8 38%
Competitor NameCompetitor Category
Distance from focal
depotIncluded in
filters Top 10 Top 5
Price match % (pre-
acquisiton)
Price match % (post-
acquisiton)
Appears in ECP's 2015 promotion
dataNo.
responses ScorePseudo Score S01 Q16 Q17 Q18 Q27
Q29 Y
Q29 N
Q29 DK
AP Woodford Green Motor Factor 0.08 1 1 1 % % % 4 0 1 1 0 0 0 0 0 1 2
Eone Motor Factors Motor Factor 1.17 0 1 0 % % % 4 3 3 1 0 1 0 1 0 2 1
Clarkins Car Accessories Motor Factor 3.06 0 1 0 % % % 4 0 0 0 0 0 0 0 0 2 2
Jaystock Motor Factor 3.46 1 1 0 % % % 4 2 2 0 0 0 0 0 2 1 1
ECP Edmonton Motor Factor 4.12 1 0 0 % % %
Car Spares Factors Motor Factor 4.15 1 0 0 % % %
Direct Autoparts Gb Motor Factor 4.22 1 0 0 % % %
ECP Barking Motor Factor 4.28 1 0 0 % % %
GSF Motor Factor 4.47 1 1 1 % % % 4 1 1 0 0 0 0 0 1 2 1
Bennetts Motor Factor 4.50 1 1 0 % % % 4 3 3 1 0 0 1 1 0 2 1
EU Linco Motor Factor 4.78 0 0 0 % % %
TPS VM Dealer 4.84 0 0 0 % % %
Allparts Automotive Motor Factor 5.13 0 1 1 % % % 4 0 0 0 0 0 0 0 0 2 2
TPS VM Dealer 5.36 0 0 0 % % %
MPD Motor Factor 5.36 0 1 1 % % % 4 0 0 0 0 0 0 0 0 2 2
ECP Enfield Motor Factor 5.66 0 0 0 % % %
Car Spares Factors Motor Factor 5.80 0 0 0 % % %
GSF Motor Factor 5.92 0 1 1 % % % 4 1 1 0 0 0 0 0 1 2 1
Allparts Automotive Motor Factor 12.04 0 0 0 % % %
Jaystock Motor Factor 19.33 0 0 0 % % %
Imperial Automotive Car Accessories 141.65 0 0 0 % % %
ECP Woodford
Competitor Details ECP Data Survey Responses
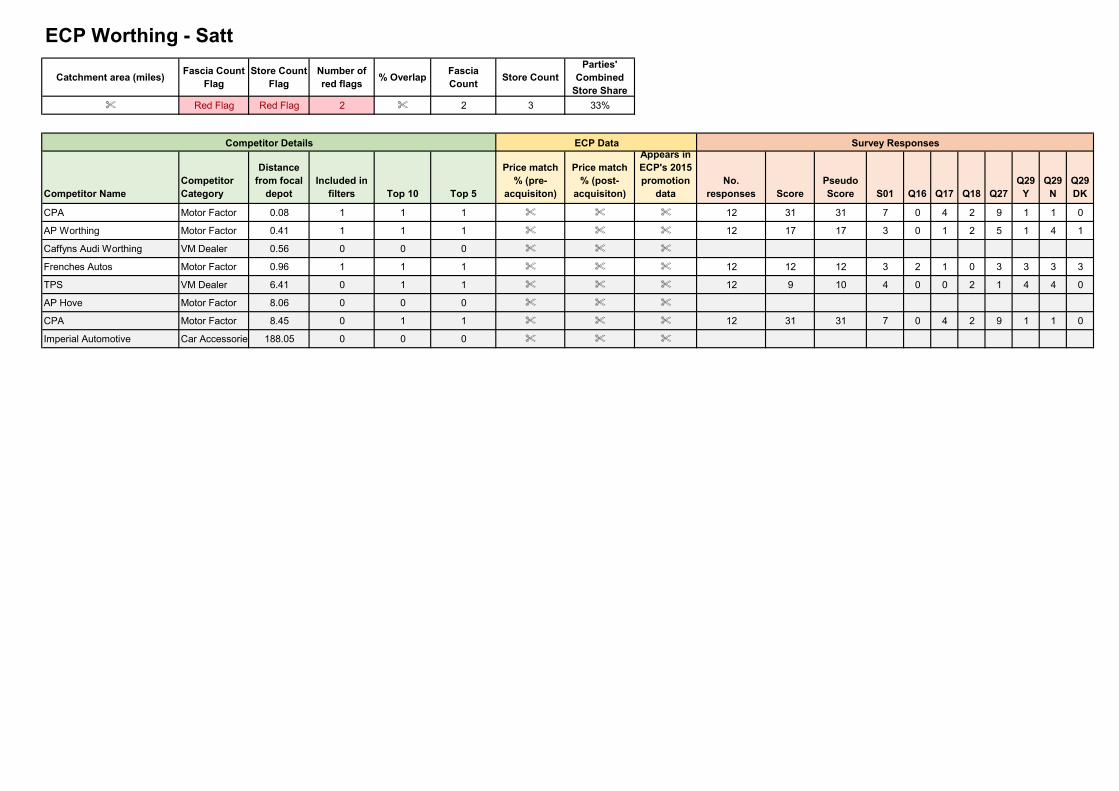
Catchment area (miles)Fascia Count
FlagStore Count
FlagNumber of red flags
% OverlapFascia Count
Store CountParties'
Combined Store Share
% Red Flag Red Flag 2 % 2 3 33%
Competitor NameCompetitor Category
Distance from focal
depotIncluded in
filters Top 10 Top 5
Price match % (pre-
acquisiton)
Price match % (post-
acquisiton)
Appears in ECP's 2015 promotion
dataNo.
responses ScorePseudo Score S01 Q16 Q17 Q18 Q27
Q29 Y
Q29 N
Q29 DK
CPA Motor Factor 0.08 1 1 1 % % % 12 31 31 7 0 4 2 9 1 1 0
AP Worthing Motor Factor 0.41 1 1 1 % % % 12 17 17 3 0 1 2 5 1 4 1
Caffyns Audi Worthing VM Dealer 0.56 0 0 0 % % %
Frenches Autos Motor Factor 0.96 1 1 1 % % % 12 12 12 3 2 1 0 3 3 3 3
TPS VM Dealer 6.41 0 1 1 % % % 12 9 10 4 0 0 2 1 4 4 0
AP Hove Motor Factor 8.06 0 0 0 % % %
CPA Motor Factor 8.45 0 1 1 % % % 12 31 31 7 0 4 2 9 1 1 0
Imperial Automotive Car Accessories 188.05 0 0 0 % % %
ECP Worthing - Satt
Competitor Details ECP Data Survey Responses
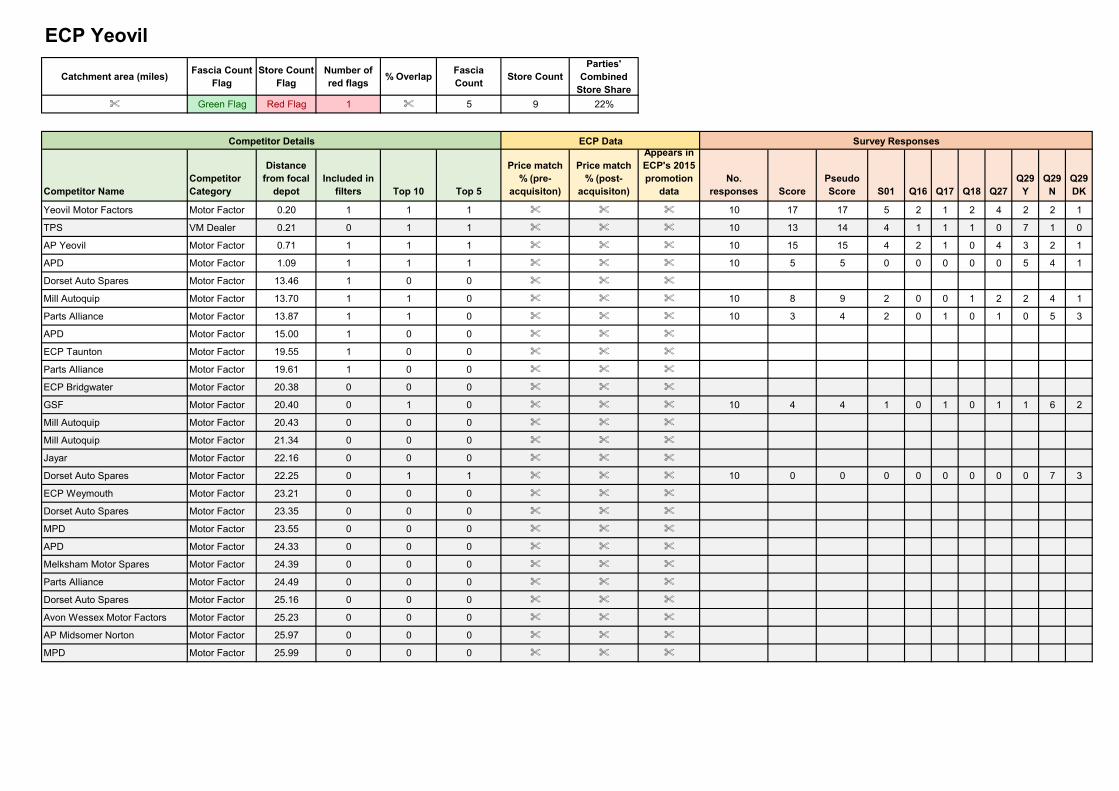
Catchment area (miles)Fascia Count
FlagStore Count
FlagNumber of red flags
% OverlapFascia Count
Store CountParties'
Combined Store Share
% Green Flag Red Flag 1 % 5 9 22%
Competitor NameCompetitor Category
Distance from focal
depotIncluded in
filters Top 10 Top 5
Price match % (pre-
acquisiton)
Price match % (post-
acquisiton)
Appears in ECP's 2015 promotion
dataNo.
responses ScorePseudo Score S01 Q16 Q17 Q18 Q27
Q29 Y
Q29 N
Q29 DK
Yeovil Motor Factors Motor Factor 0.20 1 1 1 % % % 10 17 17 5 2 1 2 4 2 2 1
TPS VM Dealer 0.21 0 1 1 % % % 10 13 14 4 1 1 1 0 7 1 0
AP Yeovil Motor Factor 0.71 1 1 1 % % % 10 15 15 4 2 1 0 4 3 2 1
APD Motor Factor 1.09 1 1 1 % % % 10 5 5 0 0 0 0 0 5 4 1
Dorset Auto Spares Motor Factor 13.46 1 0 0 % % %
Mill Autoquip Motor Factor 13.70 1 1 0 % % % 10 8 9 2 0 0 1 2 2 4 1
Parts Alliance Motor Factor 13.87 1 1 0 % % % 10 3 4 2 0 1 0 1 0 5 3
APD Motor Factor 15.00 1 0 0 % % %
ECP Taunton Motor Factor 19.55 1 0 0 % % %
Parts Alliance Motor Factor 19.61 1 0 0 % % %
ECP Bridgwater Motor Factor 20.38 0 0 0 % % %
GSF Motor Factor 20.40 0 1 0 % % % 10 4 4 1 0 1 0 1 1 6 2
Mill Autoquip Motor Factor 20.43 0 0 0 % % %
Mill Autoquip Motor Factor 21.34 0 0 0 % % %
Jayar Motor Factor 22.16 0 0 0 % % %
Dorset Auto Spares Motor Factor 22.25 0 1 1 % % % 10 0 0 0 0 0 0 0 0 7 3
ECP Weymouth Motor Factor 23.21 0 0 0 % % %
Dorset Auto Spares Motor Factor 23.35 0 0 0 % % %
MPD Motor Factor 23.55 0 0 0 % % %
APD Motor Factor 24.33 0 0 0 % % %
Melksham Motor Spares Motor Factor 24.39 0 0 0 % % %
Parts Alliance Motor Factor 24.49 0 0 0 % % %
Dorset Auto Spares Motor Factor 25.16 0 0 0 % % %
Avon Wessex Motor Factors Motor Factor 25.23 0 0 0 % % %
AP Midsomer Norton Motor Factor 25.97 0 0 0 % % %
MPD Motor Factor 25.99 0 0 0 % % %
ECP Yeovil
Competitor Details ECP Data Survey Responses
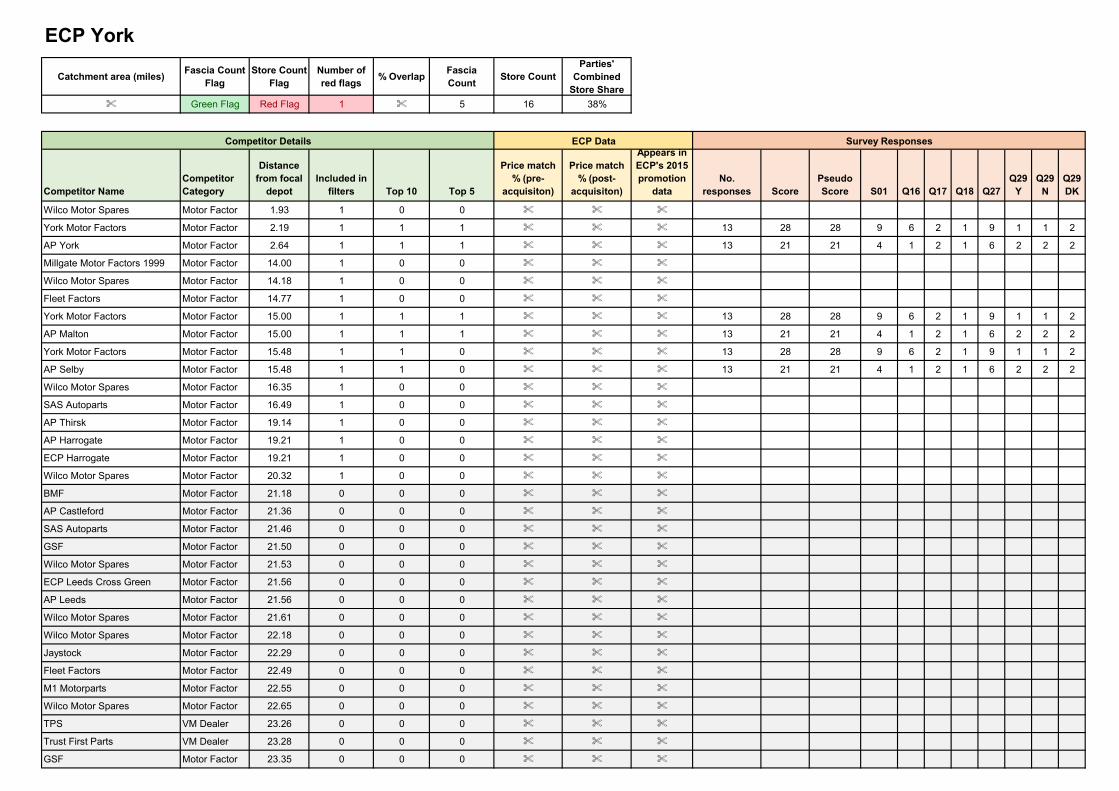
Catchment area (miles)Fascia Count
FlagStore Count
FlagNumber of red flags
% OverlapFascia Count
Store CountParties'
Combined Store Share
% Green Flag Red Flag 1 % 5 16 38%
Competitor NameCompetitor Category
Distance from focal
depotIncluded in
filters Top 10 Top 5
Price match % (pre-
acquisiton)
Price match % (post-
acquisiton)
Appears in ECP's 2015 promotion
dataNo.
responses ScorePseudo Score S01 Q16 Q17 Q18 Q27
Q29 Y
Q29 N
Q29 DK
Wilco Motor Spares Motor Factor 1.93 1 0 0 % % %
York Motor Factors Motor Factor 2.19 1 1 1 % % % 13 28 28 9 6 2 1 9 1 1 2
AP York Motor Factor 2.64 1 1 1 % % % 13 21 21 4 1 2 1 6 2 2 2
Millgate Motor Factors 1999 Motor Factor 14.00 1 0 0 % % %
Wilco Motor Spares Motor Factor 14.18 1 0 0 % % %
Fleet Factors Motor Factor 14.77 1 0 0 % % %
York Motor Factors Motor Factor 15.00 1 1 1 % % % 13 28 28 9 6 2 1 9 1 1 2
AP Malton Motor Factor 15.00 1 1 1 % % % 13 21 21 4 1 2 1 6 2 2 2
York Motor Factors Motor Factor 15.48 1 1 0 % % % 13 28 28 9 6 2 1 9 1 1 2
AP Selby Motor Factor 15.48 1 1 0 % % % 13 21 21 4 1 2 1 6 2 2 2
Wilco Motor Spares Motor Factor 16.35 1 0 0 % % %
SAS Autoparts Motor Factor 16.49 1 0 0 % % %
AP Thirsk Motor Factor 19.14 1 0 0 % % %
AP Harrogate Motor Factor 19.21 1 0 0 % % %
ECP Harrogate Motor Factor 19.21 1 0 0 % % %
Wilco Motor Spares Motor Factor 20.32 1 0 0 % % %
BMF Motor Factor 21.18 0 0 0 % % %
AP Castleford Motor Factor 21.36 0 0 0 % % %
SAS Autoparts Motor Factor 21.46 0 0 0 % % %
GSF Motor Factor 21.50 0 0 0 % % %
Wilco Motor Spares Motor Factor 21.53 0 0 0 % % %
ECP Leeds Cross Green Motor Factor 21.56 0 0 0 % % %
AP Leeds Motor Factor 21.56 0 0 0 % % %
Wilco Motor Spares Motor Factor 21.61 0 0 0 % % %
Wilco Motor Spares Motor Factor 22.18 0 0 0 % % %
Jaystock Motor Factor 22.29 0 0 0 % % %
Fleet Factors Motor Factor 22.49 0 0 0 % % %
M1 Motorparts Motor Factor 22.55 0 0 0 % % %
Wilco Motor Spares Motor Factor 22.65 0 0 0 % % %
TPS VM Dealer 23.26 0 0 0 % % %
Trust First Parts VM Dealer 23.28 0 0 0 % % %
GSF Motor Factor 23.35 0 0 0 % % %
ECP York
Competitor Details ECP Data Survey Responses
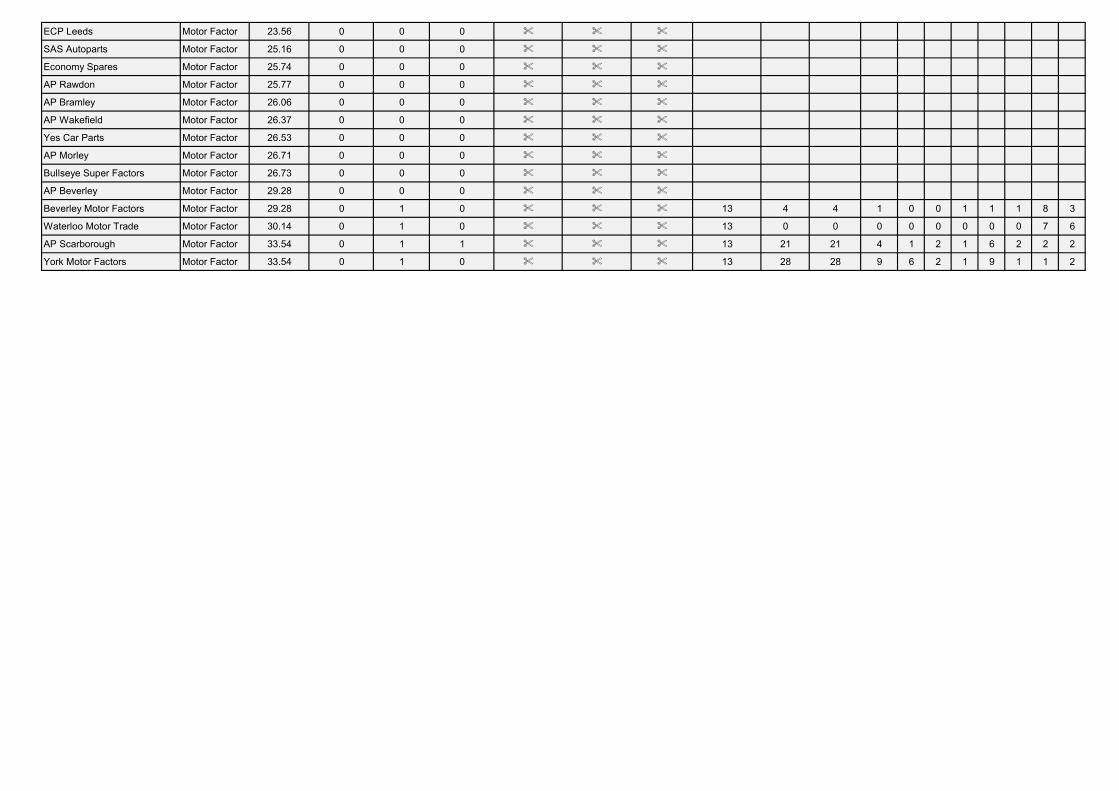
ECP Leeds Motor Factor 23.56 0 0 0 % % %
SAS Autoparts Motor Factor 25.16 0 0 0 % % %
Economy Spares Motor Factor 25.74 0 0 0 % % %
AP Rawdon Motor Factor 25.77 0 0 0 % % %
AP Bramley Motor Factor 26.06 0 0 0 % % %
AP Wakefield Motor Factor 26.37 0 0 0 % % %
Yes Car Parts Motor Factor 26.53 0 0 0 % % %
AP Morley Motor Factor 26.71 0 0 0 % % %
Bullseye Super Factors Motor Factor 26.73 0 0 0 % % %
AP Beverley Motor Factor 29.28 0 0 0 % % %
Beverley Motor Factors Motor Factor 29.28 0 1 0 % % % 13 4 4 1 0 0 1 1 1 8 3
Waterloo Motor Trade Motor Factor 30.14 0 1 0 % % % 13 0 0 0 0 0 0 0 0 7 6
AP Scarborough Motor Factor 33.54 0 1 1 % % % 13 21 21 4 1 2 1 6 2 2 2
York Motor Factors Motor Factor 33.54 0 1 0 % % % 13 28 28 9 6 2 1 9 1 1 2
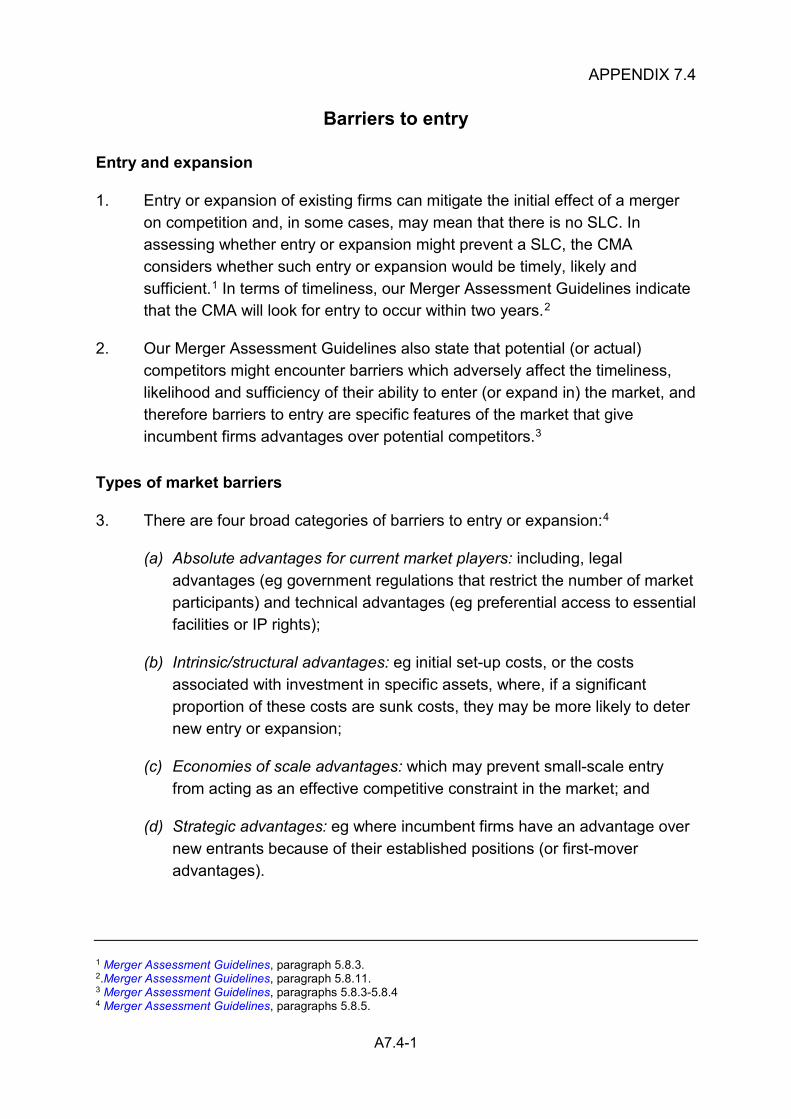
A7.4-1
APPENDIX 7.4
Barriers to entry
Entry and expansion
1. Entry or expansion of existing firms can mitigate the initial effect of a merger on competition and, in some cases, may mean that there is no SLC. In assessing whether entry or expansion might prevent a SLC, the CMA considers whether such entry or expansion would be timely, likely and sufficient.1 In terms of timeliness, our Merger Assessment Guidelines indicate that the CMA will look for entry to occur within two years.2
2. Our Merger Assessment Guidelines also state that potential (or actual) competitors might encounter barriers which adversely affect the timeliness, likelihood and sufficiency of their ability to enter (or expand in) the market, and therefore barriers to entry are specific features of the market that give incumbent firms advantages over potential competitors.3
Types of market barriers
3. There are four broad categories of barriers to entry or expansion:4
(a) Absolute advantages for current market players: including, legal advantages (eg government regulations that restrict the number of market participants) and technical advantages (eg preferential access to essential facilities or IP rights);
(b) Intrinsic/structural advantages: eg initial set-up costs, or the costs associated with investment in specific assets, where, if a significant proportion of these costs are sunk costs, they may be more likely to deter new entry or expansion;
(c) Economies of scale advantages: which may prevent small-scale entry from acting as an effective competitive constraint in the market; and
(d) Strategic advantages: eg where incumbent firms have an advantage over new entrants because of their established positions (or first-mover advantages).
1 Merger Assessment Guidelines, paragraph 5.8.3. 2.Merger Assessment Guidelines, paragraph 5.8.11. 3 Merger Assessment Guidelines, paragraphs 5.8.3-5.8.4 4 Merger Assessment Guidelines, paragraphs 5.8.5.
A7.4-2
Evidence on barriers to entry and expansion
4. We assessed the evidence we received from the Parties and third parties on the extent to which there are barriers to entry and/or expansion in the supply of IAM car parts.
IAM car parts supply
5. The Parties told us that there were no significant barriers for independent motor factors to enter, or expand in, the market to supply IAM car parts, in particular at a local level, and that there were no barriers to access customers or to source supplies. The Parties told us that, given these low barriers to entry, there were ‘thousands of independent car part distributors active in the UK’. The Parties also told us that the market for the distribution of car parts to the IMT was not a ‘technically complex one’: there were no IP requirements, no need for the products to be adapted or altered in any way, and no need for highly qualified engineering or other staff.
6. The Parties told us that they did not consider that there was a ‘minimum efficient scale’ necessary to achieve a ‘reasonably competitive level of cost’ given that there was no set ‘minimum’ scale below which suppliers would not deal with distributors. The Parties added that ‘smaller independent distributors can achieve the benefits of scale by joining one of the many alliances operating in this market’.
7. In relation to barriers to expansion, the Parties told us that market participants could expand by either ‘expanding their networks through acquisitions or organically (simply opening new locations)’ and expanding on stock and delivery capability. For example AAG, PA and PSA had all expanded through a combination of these methods. The Parties added that acquisitions could be an ‘easy way to acquire a customer base, employees and the building, but can be costlier that simply opening branches organically’. The Parties also told us that ECP had historically relied on opening new branches organically, eg in 2012 ECP grew, entirely via new branch openings, from 90 to 132 depots, and ECP’s growth to around 200 depots in 2015 was almost entirely driven by ‘organic growth’.
8. In response to provisional Findings, the Parties reiterated their view that the market was dynamic with minimal barriers to entry and expansion. It cited UniSelect’s recent acquisition of PA and Genuine Parts Company’s acquisition of AAG in support. This supported the Parties’ view that even if there is an immediate reduction in competition in a particular area, it is highly
A7.4-3
likely that this will be countered by entry and expansion in the short to medium term.5
9. The main market barriers cited by third parties, particularly in relation to IAM car parts supply, included:6
(a) existing competition;
(b) availability of management talent;
(c) building/site availability; and
(d) distribution viability.
10. In relation to competition as a potential barrier to entry, some third parties ([]) told us that, depending on the local area, the presence of many competitors could be a market barrier, and one third party ([]) told us that it considered the extent to which ECP was ‘established’ in a local area was an entry barrier into that local market.
Cost of entry and timeframes involved
11. The Parties estimated that ‘start-up costs could range from around £160,000 to just over £400,000’ (around half of which related to inventory purchases), and that there was a ‘limited number of elements necessary for setting up business as an independent car part distributor, namely, a supply of car parts, premises, staff, delivery vehicles, and basic software to run the business’, as well as some advertising spend to make customers aware of the new business. The Parties added that, once a distributor entered a market, ongoing annual running costs were not high, ranging from around £145,000 to around £380,000 (depending on the scale of entry).
12. Third parties indicated a considerable range of costs (from as low as £50,000 to up to £750,000) for establishing a new depot in a local area, and that it would take around six months to set up and open a new site in a local area where they were currently not present, and added that it could take two years and more to establish good trading and profitability.7
13. AAG told us that it would usually look to acquire businesses instead of opening new depots, and that start-up costs were high and that it could take between six and 12 months to establish a depot in a new local area. It added
5 Parties’ response to Provisional Findings (5 October), paragraph 5.2(b). 6 [] 7 []
A7.4-4
that once opened, a new depot was likely to run at a loss for a number of months, and therefore a new entrant would need to have the necessary funding available.8
Likelihood and scale of entry
14. The Parties considered that further entry and expansion in the UK market was likely in the next year or so. For example, the Parties pointed to Uni-Select’s recent acquisition of PA, and told us that it was clear that this acquisition was considered by Uni-Select/PA as a ‘means to further expand in the UK’, as highlighted in the press release announcing the deal.9
15. The Parties also told us that entry/expansion could come from other sources, including sponsored entry or direct by ‘key customers’, such as Halfords or Kwik-Fit. The Parties told us that should these ‘large customers consider that an additional constraint on ECP would be beneficial, they would be equally capable of supporting expansion by other players’, and that ‘it would be relatively easy for them to continue to add additional suppliers to replace the small role AP played’.10
8 CMA call with AAG (10 April 2017). 9 [] 10 [].
A8.1-1
APPENDIX 8.1
Tender data analysis
Introduction
1. This appendix sets out our analysis of the Parties’ data on tenders for Key Accounts. This analysis has been used as part of our assessment of the effects of the Merger on Key Accounts and in particular the extent of pre-Merger competition for Key Accounts between ECP and AP and the extent of competition from other suppliers.
Data
2. The Parties have provided bidding data detailing the tenders or negotiations in which ECP and AP have taken part over the period 2014-2016.1
3. The data includes the customer name, product range, estimated value of the tender (missing for a high number of tenders), and whether ECP/AP won or lost the tender.
4. The data also includes information on other competitors participating in or winning the tenders. However, when asked about the source of this information, the Parties clarified that this information was populated using ‘common knowledge from the marketplace’ and information provided orally by customers. This information does not appear to be reliable – in CRA’s analysis of the tender data submitted in Phase I, the Parties’ datasets were cross-checked against one another to confirm whether ECP participated in the tenders in which AP listed it as a participant and vice versa, and in most cases this exercise indicated that the information one party provided on the other was incorrect.2 As a result, we do not place any weight on information about competitors other than AP or ECP in the tender data.
5. We can place more weight on the data on whether AP or ECP participated in or won tenders because this is based on each Party’s own information on its tender participation, and the Parties’ advisors cross-checked and reconciled the two datasets. However, Phoenix told us that on some occasions AP may have formally held the contract but PA would supply areas where AP lacked
1 Some Key Accounts issue formal tenders when selecting a supplier, while others negotiate supply more informally. For simplicity, we refer to both types of negotiation as ‘tenders’. []% of ECP’s tenders were formal agreements, while []% was informal. Of the [] AP tenders for which extent of formality is known, []% were formal agreements, whereas []% were informal. 2 Of the [] tenders in which AP listed ECP as a participant, ECP actually only participated in [], while of the [] tenders from 2014-2016 in which ECP listed AP as a participant, AP only participated in [].
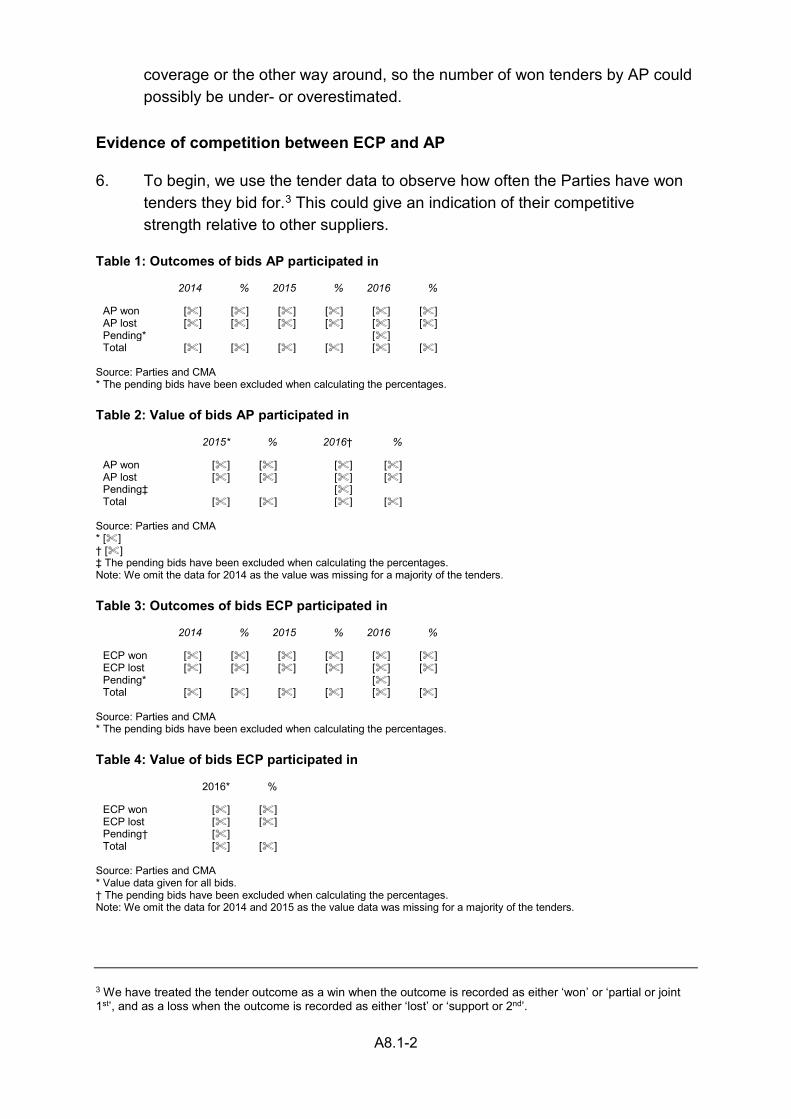
A8.1-2
coverage or the other way around, so the number of won tenders by AP could possibly be under- or overestimated.
Evidence of competition between ECP and AP
6. To begin, we use the tender data to observe how often the Parties have won tenders they bid for.3 This could give an indication of their competitive strength relative to other suppliers.
Table 1: Outcomes of bids AP participated in
2014 % 2015 % 2016 %
AP won [] [] [] [] [] [] AP lost [] [] [] [] [] [] Pending* [] Total [] [] [] [] [] []
Source: Parties and CMA * The pending bids have been excluded when calculating the percentages. Table 2: Value of bids AP participated in
2015* % 2016† %
AP won [] [] [] [] AP lost [] [] [] [] Pending‡ [] Total [] [] [] []
Source: Parties and CMA * [] † [] ‡ The pending bids have been excluded when calculating the percentages. Note: We omit the data for 2014 as the value was missing for a majority of the tenders. Table 3: Outcomes of bids ECP participated in
2014 % 2015 % 2016 %
ECP won [] [] [] [] [] [] ECP lost [] [] [] [] [] [] Pending* [] Total [] [] [] [] [] []
Source: Parties and CMA * The pending bids have been excluded when calculating the percentages. Table 4: Value of bids ECP participated in
2016* %
ECP won [] [] ECP lost [] [] Pending† [] Total [] []
Source: Parties and CMA * Value data given for all bids. † The pending bids have been excluded when calculating the percentages. Note: We omit the data for 2014 and 2015 as the value data was missing for a majority of the tenders.
3 We have treated the tender outcome as a win when the outcome is recorded as either ‘won’ or ‘partial or joint 1st’, and as a loss when the outcome is recorded as either ‘lost’ or ‘support or 2nd’.
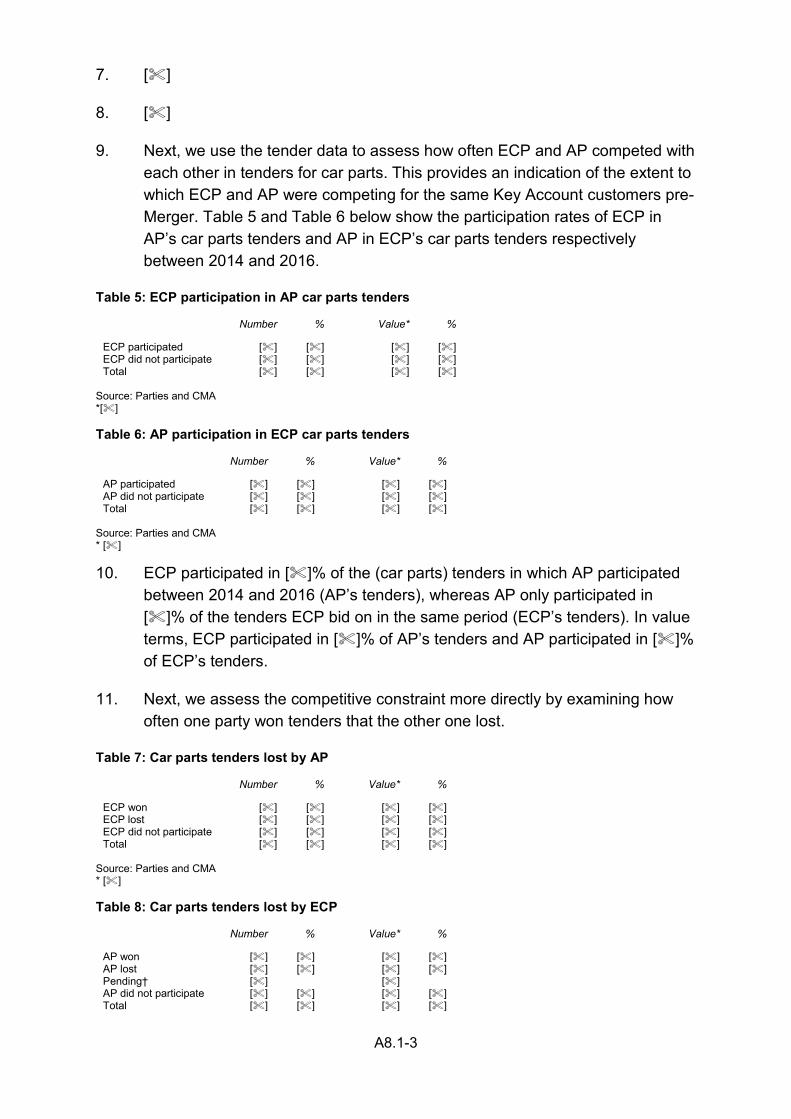
A8.1-3
7. []
8. []
9. Next, we use the tender data to assess how often ECP and AP competed with each other in tenders for car parts. This provides an indication of the extent to which ECP and AP were competing for the same Key Account customers pre-Merger. Table 5 and Table 6 below show the participation rates of ECP in AP’s car parts tenders and AP in ECP’s car parts tenders respectively between 2014 and 2016.
Table 5: ECP participation in AP car parts tenders
Number % Value* %
ECP participated [] [] [] [] ECP did not participate [] [] [] [] Total [] [] [] []
Source: Parties and CMA *[] Table 6: AP participation in ECP car parts tenders
Number % Value* %
AP participated [] [] [] [] AP did not participate [] [] [] [] Total [] [] [] []
Source: Parties and CMA * [] 10. ECP participated in []% of the (car parts) tenders in which AP participated
between 2014 and 2016 (AP’s tenders), whereas AP only participated in []% of the tenders ECP bid on in the same period (ECP’s tenders). In value terms, ECP participated in []% of AP’s tenders and AP participated in []% of ECP’s tenders.
11. Next, we assess the competitive constraint more directly by examining how often one party won tenders that the other one lost.
Table 7: Car parts tenders lost by AP
Number % Value* %
ECP won [] [] [] [] ECP lost [] [] [] [] ECP did not participate [] [] [] [] Total [] [] [] []
Source: Parties and CMA * [] Table 8: Car parts tenders lost by ECP
Number % Value* %
AP won [] [] [] [] AP lost [] [] [] [] Pending† [] [] AP did not participate [] [] [] [] Total [] [] [] []
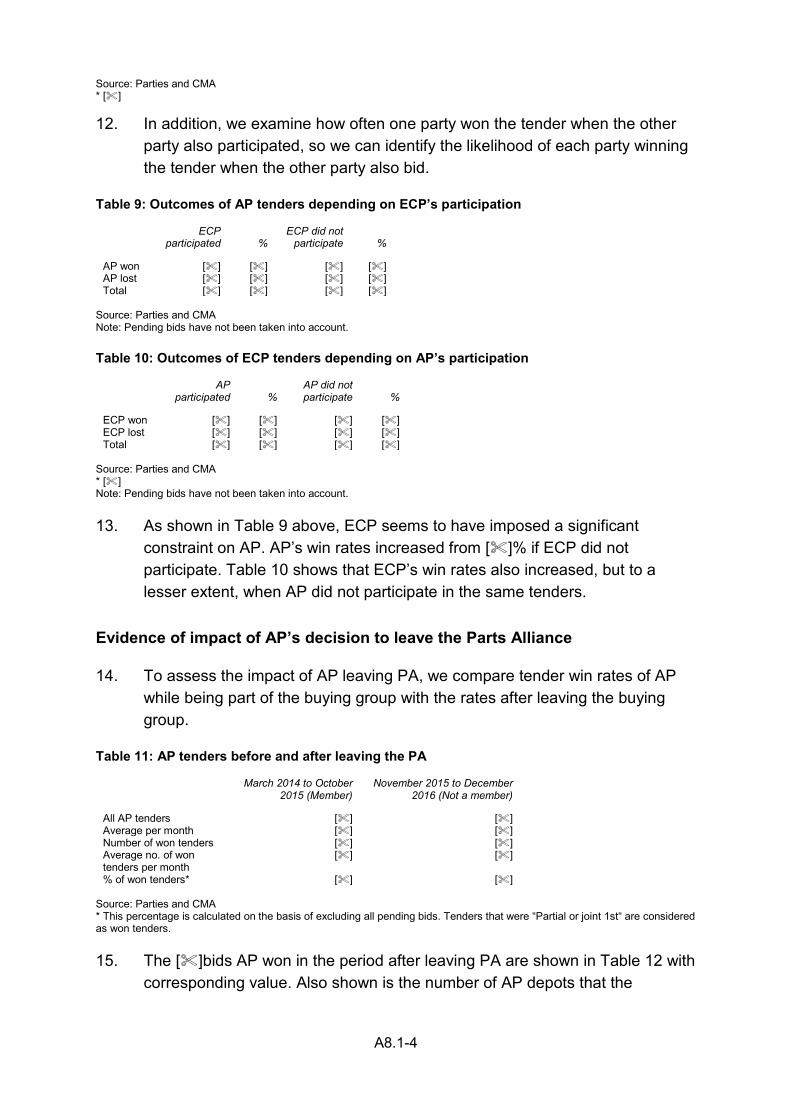
A8.1-4
Source: Parties and CMA * [] 12. In addition, we examine how often one party won the tender when the other
party also participated, so we can identify the likelihood of each party winning the tender when the other party also bid.
Table 9: Outcomes of AP tenders depending on ECP’s participation
ECP
participated % ECP did not
participate %
AP won [] [] [] [] AP lost [] [] [] [] Total [] [] [] []
Source: Parties and CMA Note: Pending bids have not been taken into account. Table 10: Outcomes of ECP tenders depending on AP’s participation
AP participated %
AP did not participate %
ECP won [] [] [] [] ECP lost [] [] [] [] Total [] [] [] []
Source: Parties and CMA * [] Note: Pending bids have not been taken into account. 13. As shown in Table 9 above, ECP seems to have imposed a significant
constraint on AP. AP’s win rates increased from []% if ECP did not participate. Table 10 shows that ECP’s win rates also increased, but to a lesser extent, when AP did not participate in the same tenders.
Evidence of impact of AP’s decision to leave the Parts Alliance
14. To assess the impact of AP leaving PA, we compare tender win rates of AP while being part of the buying group with the rates after leaving the buying group.
Table 11: AP tenders before and after leaving the PA
March 2014 to October
2015 (Member) November 2015 to December
2016 (Not a member)
All AP tenders [] [] Average per month [] [] Number of won tenders [] [] Average no. of won tenders per month
[] []
% of won tenders* [] [] Source: Parties and CMA * This percentage is calculated on the basis of excluding all pending bids. Tenders that were “Partial or joint 1st“ are considered as won tenders. 15. The []bids AP won in the period after leaving PA are shown in Table 12 with
corresponding value. Also shown is the number of AP depots that the
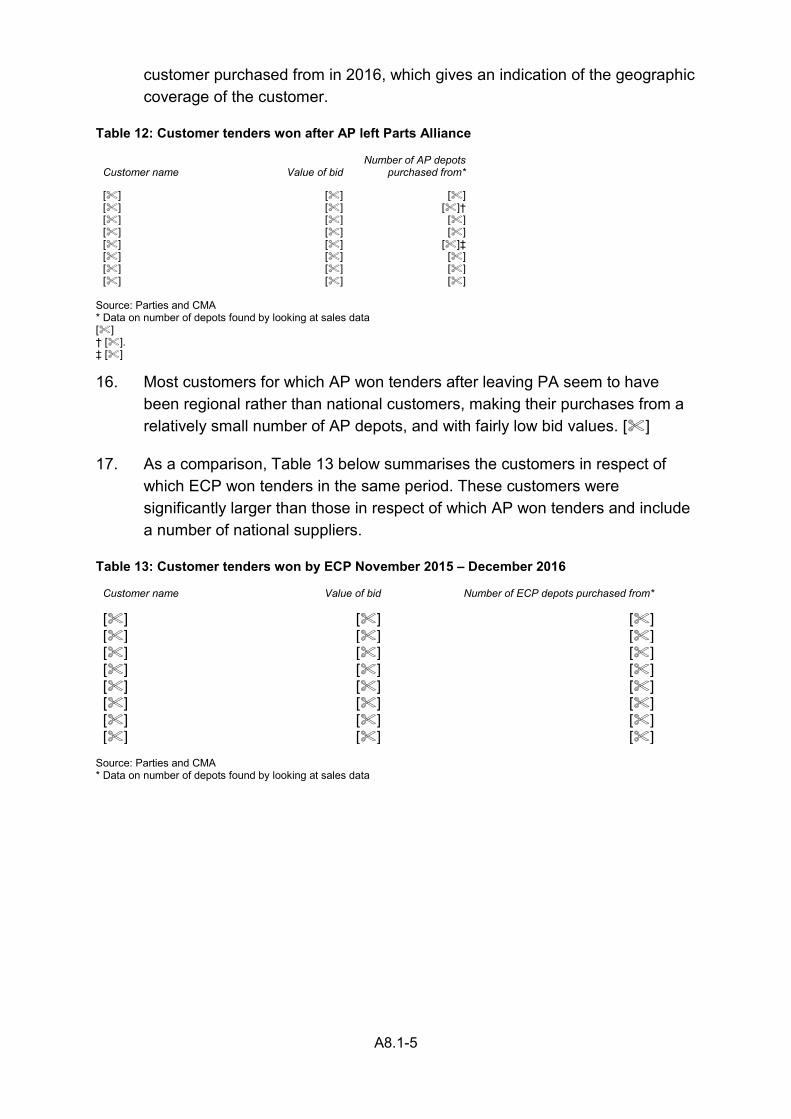
A8.1-5
customer purchased from in 2016, which gives an indication of the geographic coverage of the customer.
Table 12: Customer tenders won after AP left Parts Alliance
Customer name Value of bid Number of AP depots
purchased from*
[] [] [] [] [] []† [] [] [] [] [] [] [] [] []‡ [] [] [] [] [] [] [] [] []
Source: Parties and CMA * Data on number of depots found by looking at sales data [] † []. ‡ [] 16. Most customers for which AP won tenders after leaving PA seem to have
been regional rather than national customers, making their purchases from a relatively small number of AP depots, and with fairly low bid values. []
17. As a comparison, Table 13 below summarises the customers in respect of which ECP won tenders in the same period. These customers were significantly larger than those in respect of which AP won tenders and include a number of national suppliers.
Table 13: Customer tenders won by ECP November 2015 – December 2016
Customer name Value of bid Number of ECP depots purchased from*
[] [] [] [] [] [] [] [] [] [] [] [] [] [] [] [] [] [] [] [] [] [] [] []
Source: Parties and CMA * Data on number of depots found by looking at sales data
A8.2-1
APPENDIX 8.2
Evidence on other suppliers to Key Accounts
Introduction
1. This appendix sets out the evidence we received from other suppliers and from Key Accounts on the effectiveness of other suppliers in supplying Key Accounts.
Parts Alliance
2. The Parties submitted that the primary constraint on ECP pre-Merger with respect to Key Accounts was PA, and that this remains true post-Merger. The Parties said that PA participated in almost [] of the tenders in which ECP participated between 2012 and 2016, far more than any other supplier.1
3. PA told us that it supplies national, regional and multi-regional Key Accounts. It does this through its members (PA itself, BBC, BMS, Dingbro and Qualvecom) and through a strategic alliance with IFA and other partners to cover areas where PA itself does not have coverage. Its sales to Key Accounts in 2016 were approximately £[]2, which is significantly more than those of AP (c. £[]) but significantly less than those of ECP (c. £[]).
4. The majority of the Key Accounts we spoke to told us that they currently used PA, with those who did not use PA stating that they have used it in the past and would use it in the future. Additionally, these customers rated PA highly – when asked to rate suppliers with a score of 1 to 5, all customers gave PA a score of at least 3, with most giving it a score of 4 or 5.3
5. One further customer told us that PA was the only supplier it considered capable of serving its needs.
Motor Parts Direct
6. MPD told us that its sales to Key Accounts are minimal, with national, regional and multi-regional customers combined accounting for less than [] of its total turnover. According to MPD, it is unable to compete on a profitable basis
1 Although, as we have noted, we do not consider this information to be reliable. 2 Revenue figures for PA might be underestimated as smaller Key Accounts which PA supplies are excluded from the data provided by PA. 3 []
A8.2-2
for these customers because it cannot match the pricing and service levels offered by ECP and AP because of their size and geographical coverage.
7. Only four of eleven Key Accounts told us that they currently use MPD, with all of these ranking it lower than ECP and lower or in one case the same as PA and AP. For each of these customers, MPD accounted for less than [] of their purchases in 2016. Two more customers said they would or would potentially use it in the future, with the remainder saying they would not use MPD in future, apart from one which could not answer because it had limited knowledge of MPD.
Alliance Automotive
8. The Parties said that AAG is already a competitor, as shown by its participation in tenders, and is making significant efforts to increase its ability to supply Key Accounts, including creating a centralised invoicing system and approaching Key Accounts.
9. AAG told us []
10. Only two Key Accounts indicated that they currently use AAG for some purchases, although both scored it lower than ECP and PA. However, five further customers indicated that they might consider using AAG in future.
IFA
11. The Parties also listed IFA as an effective competitor for mid-sized Key Accounts, on the basis of its appearance in ECP’s tender data.
12. We did not receive any response from IFA to our questionnaire. However, IFA is a supply partner of PA, and services some Key Account contracts held by PA.4
13. While two Key Accounts told us they had used IFA as part of contracts with PA, only one customer used IFA in its own right. One customer told us it had invited IFA to tender but IFA had declined.
4 http://www.thepartsalliance.com/strategic-partnership-with-the-ifa-announced/
A8.2-3
Volkswagen Trade Parts Specialists and Vauxhall Trade Group
14. The Parties list TPS and Vauxhall Trade Group as effective competitors, again based on their participation in tenders. Both of these suppliers are OEM parts suppliers.
15. TPS told us that it competes for national, regional and multi-regional Key Accounts, and that its sales to these customers totalled [] in 2016. However, TPS also told us that it competes to a limited extent with the Parties in relation to a subset of the products they supply – namely, parts for Volkswagen Group cars (Audi, Seat, Skoda, Volkswagen Commercial Vehicles and Volkswagen).
16. The questionnaire sent to Vauxhall Trade Club was responded to by Bluegrasscoms, a consultancy which deals with garages and body shops on behalf of vehicle manufacturers including Vauxhall. Bluegrasscoms told us that it supplies national, regional and multi-regional Key Accounts, and that it competes strongly with the Parties across all the products the Parties supply.
17. We did not ask Key Accounts about these specific suppliers, but we did ask whether they would consider using an OEM parts supplier or multiple OEM parts suppliers as an alternative to a motor factor.
18. Most customers told us that they did use OEM parts suppliers, but that this was largely when their own customers specifically required or requested OEM parts. Some customers said they would not use OEM parts suppliers, mainly for reasons of price.
19. Where customers’ purchase data did include Vauxhall Trade Group or TPS, this always represented less than 5% of total purchases.
A10.1-1
APPENDIX 10.1
Parties’ and third parties’ views on the scope of the divestiture package
Introduction
1. This Appendix sets out the views of the Parties and third parties in relation to each of the elements, which might form part of any divestiture package, listed in the Remedies Notice. These elements are set out below:
(a) rights to enter into, or assign, the property lease;
(b) depot staff;
(c) customer contracts;
(d) customer data;
(e) supplier contracts;
(f) the delivery van fleet;
(g) plant, machinery, computers, fixtures and fittings;
(h) provision of services and utilities currently being provided at the depot;
(i) stock/inventory;
(j) provisional of transitional services; and
(k) distribution centre and/or head office.
Rights to enter into, or assign, the property lease
2. In relation to the Parties’ views on the purchaser having the right to occupy and operate from the depot premises:
(a) ECP told us at its response hearing that it was considering a number of options to enable a purchaser of an AP Overlap depot to enter into a lease with the relevant landlord,1 for example:
1 At the time of the Merger, ECP Newco Limited (now Andrew Page 1917 Limited), the vehicle used to acquire the assets of AP, entered into licences with PwC in relation to the AP properties, granting ECP Newco Limited right of tenure for a period of nine months, during which ECP Newco would either enter into lease agreement with the relevant landlord, or surrender the lease back to PwC. These licences expired on 3 July 2017 and were subsequently extended by PwC [].
A10.1-2
(i) the licence to occupy an AP Overlap depot can be assigned from the Parties to the purchaser (and its expiry extended), until the purchaser negotiates a final lease agreement with the relevant landlord – in this regard, ECP told us that, for the AP Overlap depots, it would be ‘administratively simple’ to transfer the licences to occupy from the Parties to the purchaser;2
(ii) alternatively, the Parties could request the relevant landlord to grant the Parties a licence to occupy (replacing the licences granted by PwC due to expire in April 2018), which could extend the period by which a purchaser can enter into a lease agreement with the relevant landlord; or
(iii) the Parties could enter into a lease agreement with each landlord in relation to the AP overlap depots before April 2018, and then reassign the lease to the purchaser as part of the divestment.
(b) ECP told us that, based on its experience and knowledge of the market, it was likely to be more attractive for a purchaser if the AP overlap depots to be divested remained occupied by the purchaser under temporary licence (ie the first option above), which would enable the purchaser to be free to negotiate a lease on terms that it considered most favourable, rather than acquiring (and being bound by) terms that ECP had agreed with the landlord.3 ECP told us that it foresaw no difficulties in getting the terms of the licences extended as necessary to allow the purchaser(s) time to negotiate a lease and that it was commencing discussions with PwC to that effect.4
3. Third parties told us that it would be relatively straight-forward for a purchaser to enter into a lease with the relevant landlord:
(a) PA told us that the only complexity in entering into a lease with the relevant landlord was in relation to the willingness of the landlord to enter into a lease, and estimated that it could take between four to six weeks from heads of terms to a final signed lease agreement.5
2 ECP told us that it would be more ‘complex’ to assign the lease of an ECP overlap depot to a purchaser if the Parties were required to divest an ECP overlap depot. Source: Response hearing with ECP (5 October 2017). 3 ECP’s response to the Remedies Notice and ECP’s response to the RWP. 4 ECP’s response to the RWP. 5 Response hearing with PA (20 September 2017).
A10.1-3
(b) MPD told us that one option available to a purchaser was for it to request an extension of three months to the licence period to enable it to occupy the property and negotiate a lease.6
(c) [] told us that the transfer of the depot’s lease to the purchaser was important, and that purchasers should enter into discussions with the relevant landlords to facilitate this and achieve competitive terms. It estimated that it would take around three to four weeks from heads of terms to a final lease agreement with the relevant landlord, but that this would depend on the landlord’s demands, eg in relation to dilapidations.7
(d) [] told us that assigning the lease to a purchaser would be standard practice in any transaction.8
Transfer of depot staff
4. In relation to the transfer of depot staff:
(a) ECP told us that it expected the staff at the depot being divested to transfer to the purchaser, and that there would be ‘non-solicitation clauses’ in relation to the staff at the divested depots, which ECP considered to be part of the ‘normal commercial terms’ for this type of sale.9
(b) All of the third parties to which we spoke, told us that the staff employed at the acquired depot were an essential element of any divestiture package:
(i) PA identified the depot’s employees as a key element of any divestiture package and told us that a purchaser would need to ensure that the staff would transfer with the acquired depot, and that non-solicit type clauses would be normal, eg to ensure that the Parties would not be able to ‘poach’ staff from the divested depot.10
(ii) MPD told us that transferring the acquired depot’s staff was important, but told us that the purchaser should be given the choice of which staff to take on, in particular the ‘car parts people and counter staff’.11
6 Response hearing with MPD (27 September 2017). 7 [] 8 [] 9 Response hearing with ECP (5 October 2017). 10 Response hearing with PA (20 September 2017). 11 Response hearing with MPD (27 September 2017).
A10.1-4
(iii) [] considered the transfer of staff to the purchaser to be the most ‘important’ element of any divestiture package as it would ensure consistency of knowledge of, and relationships with, the acquired depot’s customers, as well as ensuring that the acquired depot continued to ‘function effectively’.12
(iv) [] told us that having ‘good’ staff was important to ensure good service when dealing with customers, and business continuity for the divested depot.13
Transfer of customer contracts
5. In relation to the transfer of customer contracts to the purchaser:
(a) ECP told us that the SLCs identified were ‘discrete, local SLCs in relation to IAM car parts’, and therefore any ‘customer contracts transferred to the purchaser’ would need to relate only to local IAM car parts supply.14
(b) Some third parties (PA and []) cited the lack of formal contracts with local customers (save for the national accounts) as a reason why the transfer of any customer contracts might not be necessary or important.15
(c) MPD told us that the transfer of customer contracts to a purchaser was no longer important given that ECP would by now (notwithstanding any hold separate measures currently imposed by the CMA) have gained detailed knowledge of all of the AP depots.16
(d) Another third party ([]) told us that it was not in a position to comment on whether customer contracts should be transferred to a purchaser without first seeing the details of those contracts.17
Transfer of customer data
6. In relation to the Parties’ views on the transfer of customer data to the purchaser:
(a) ECP told us that the customer data associated with the divested depot (eg the sales ledger) would normally be transferred to the purchaser, eg by
12 [] 13 [] 14 ECP’s response to the Remedies Notice. 15 Response hearing with PA (20 September 2017) and [] 16 Response hearing with MPD (27 September 2017). 17 []
A10.1-5
way of a data file. However, ECP told us that it would not want the Parties’ ‘pricing algorithms’ or the customer data relating to their national account customers18 being transferred to the purchaser.19 In its response to our RWP, ECP added that information regarding pricing methodologies should not be disclosed (directly or indirectly), as these were confidential and competitively sensitive.20
(b) ECP also told us, in its response to our RWP, that the scope of any customer data being transferred to a purchaser should be ‘proportionate’, in particular with respect to pricing data. It told us that, whilst it accepted that the purchaser would require details of that depot’s customer base, including data regarding historic monthly spend and relevant contact information, it considered that the likely purchaser(s) would be established companies with their own pricing methods. Accordingly, ECP told us that purchasers would not require historic pricing information, and that to the extent that there were any returns and warranty claims relating to transactions prior to the divestment, the Parties would take responsibility for these, should the purchaser indicate during the divestment process that it would want the Parties to do so.21
7. All of the third parties to which we spoke, told us that a purchaser of an overlap depot should be given access to all of the relevant data and records concerning the customers served from that depot, for example:
(a) PA told us that it would want to be sure it was not just acquiring the depot’s premises, and that the credibility of any depot disposal depended on both the customer base trading from that depot and the staff employed there:22
(i) PA told us that a purchaser would want to have not only customer contact details but also details of what each customer had purchased in the past, and how long each had been a customer of that depot. It told us that delivery van route data was also important to enable the purchaser to continue to serve customers without unnecessary disruption.
(ii) PA also told us that, if it was to acquire any of the overlap depots, it would seek to ensure that any outstanding debtors of the divested
18 National accounts are a subset of Key Account customers, and are customers which have national or near national geographic coverage. 19 Response hearing with ECP (5 October 2017). 20 ECP’s response to the RWP. 21 ECP’s response to the RWP. 22 Response hearing with PA (20 September 2017).
A10.1-6
depot were collected by the purchaser,23 rather than the Parties, as, otherwise, the Parties would continue to have interactions with these customers, which could undermine the purchaser’s relationships with such customers.
(b) [] told us that it was important that ‘sufficient information’ on the divested depot’s customers was transferred to the purchaser to enable the purchaser to continue to serve the acquired depot’s customers.24
Transfer of supplier contracts
8. In relation to the transfer of supplier contracts:
(a) ECP told us that, other than contracts for the supply of utilities and other minor, locally-supplied products (eg cleaning services), there were no other supply contracts that were transferrable. It also told us that, from a practical point of view, a suitable purchaser would be likely to have its own supplier relationships for car parts.25
(b) All of the third parties to which we spoke, told us that a purchaser that was already operating in this market would already have contracts with its own supplier base and, therefore, the transfer of the divested depot’s existing supplier contracts to a purchaser would not be necessary.
Transfer of the delivery van fleet
9. In relation to the transfer of the delivery van fleet:
(a) ECP told us, in its response to our RWP, that, if a purchaser was given the option to acquire the vehicle fleet, the CMA should ensure that the Parties were able to generate a reasonable return on its sale (see also ECP’s views in relation to the transfer of inventory/stock).26
(b) [] told us that it would either buy out the leases on the acquired depot’s vehicle fleet or assign the leases to itself.27 Other third parties told us that it would be relatively straight-forward to put in place their own
23 PA told us that there were a number of ways by which this could be done, eg the debt could be discounted appropriately and purchased upfront or a relationship could be established whereby the purchaser of the depot would collect debt on the Parties’ behalf and after two or three months they would agree a deal on the remaining cash. Source: Response hearing with PA (20 September 2017). 24 [] 25 ECP’s response to the Remedies Notice and response hearing with ECP (5 October 2017). 26 ECP’s response to the RWP. 27 []
A10.1-7
arrangements if the vehicle fleet did not form part of the divestiture package.
(c) PA told us that if one purchaser were to acquire all nine overlap depots, purchasing the vehicles would make the process easier for the purchaser. However, it told us that, for individual depot acquisitions, not transferring the vehicle fleet would not be a ‘deal breaker’.28
Transfer of plant, machinery, computers, fixtures and fittings
10. In relation to the transfer of plant, machinery, computers, fixtures and fittings, third parties told us that some of these, such as racking, would be required but others, such as computers, were less important given that purchasers were likely to operate different computer systems.
Provision of services and utilities currently being provided at the depot
11. In relation to services and utilities, third parties considered the continued provision of utilities, in particular telecoms, to be important in ensuring business continuity.
Transfer of stock/inventory
12. In relation to the transfer of inventory:
(a) ECP told us that:
(i) since the Merger completed, ECP had significantly increased the inventory of the AP depots in line with its business model and approach to depot stock management, and therefore, to the extent that the Parties may be required to provide an option to the purchaser to acquire inventory, the obligation should apply to the ‘original stock’ level only (ie at the time of ECP’s acquisition), and any further option to acquire the additional inventory should be offered at the Parties’ discretion;29
(ii) at its response hearing, ECP told us that, if it were under an obligation to sell all of the inventory at an overlap depot to the purchaser, it would lose its negotiating leverage with potential purchasers to secure a better price for the inventory;30
28 Response hearing with PA (20 September 2017). 29 ECP’s response to the Remedies Notice. 30 Response hearing with ECP (5 October 2017).
A10.1-8
(iii) in this regard, ECP told us, in its response to our RWP, that it would be appropriate for it to make a ‘reasonable return’ on the sale of any inventory or vehicle fleet (which had been added by ECP to the ‘local businesses’ after its acquisition of AP) to a purchaser, and requested that the CMA make a provision to allow the Parties to make a reasonable rate of return on the inventory and vehicle fleet – it told us that, if potential purchasers were aware that the ‘parameter for any decision would be the reasonableness of the return’, this would avoid the need for the CMA to be ‘unduly dragged into commercial negotiations’;31 and
(iv) finally, ECP also told us that, if a purchaser required inventory for the acquired depot, it could get its own inventory from its own suppliers within a couple of days.32
(b) The evidence from third parties on inventory and stock was mixed:
(i) Some (MPD, [] and []) told us that it was not necessary (or even preferable) to transfer inventory to the purchaser. For example, MPD told us that the Parties could leave the purchaser with ‘poor quality’ stock or stock that did not match the purchaser’s own stock profile;33 and [] told us that the transfer of inventory to a purchaser should be optional, as it would prefer to invest in its stock rather than take on all of the existing stock at the acquired depot.34 [] told us that acquiring the inventory was ‘not vital for business continuity’, and it would need first to carry out due diligence to understand the age of the stock, and whether it would wish to acquire the existing stock.35
(ii) One third party (PA) told us that transferring the inventory to a purchaser ensured continuity of supply of the ‘right’ products to existing local customers. PA told us that, for example, acquisition of a depot’s existing inventory was important to ensure the availability of the ‘right’ stock to ensure continuity of supply to existing local customer.36
31 ECP’s response to the RWP. 32 Response hearing with ECP (5 October 2017). 33 Response hearing with MPD (27 September 2017). 34 [] 35 [] 36 Response hearing with PA (20 September 2017).
A10.1-9
Provision of transitional services
13. In relation to whether the Parties should make available certain support services to a purchaser as part of any transition arrangement:
(a) ECP told us that the running of an individual depot was not particularly complicated, and that it did not require access to IT or central services that could not easily be obtained by any suitable purchaser through third party providers at little cost. ECP therefore considered that access to transitional services would not be required for an effective divestiture of the overlap depots.37 In its response to our RWP, ECP noted that third parties also did not appear to suggest that they would require transitional services in order to take over a depot immediately.38
(b) PA told us that smaller purchasers might need some back-office support. It told us that larger purchasers would be likely to have their own systems and not require support from the Parties. It told us that, as soon as the telecoms system was in place at any acquired depot, it could take on the depot immediately.39
(c) MPD told us that the extent to which transitional arrangements would be required by a purchaser would depend on each purchaser, eg it told us that, in MPD’s case, no transitional support services would be required, as all it would need would be the premises, and it would then make its own arrangements to provide support services to the depot.40
Distribution centre and/or head office
14. Finally, in relation to whether a purchaser should be allowed to acquire a regional or national distribution centre, or AP’s head office:
(a) ECP told us that AP’s national distribution centre and/or head office should not be made available to potential purchasers, given that only a limited number of SLCs had been identified in discrete local areas, and therefore remedying these discrete SLCs would not require the inclusion of AP’s national distribution centre or head office in the remedy package.41
37 ECP’s response to the Remedies Notice and ECP’s response to the RWP. 38 ECP’s response to the RWP. 39 Response hearing with PA (20 September 2017). 40 Response hearing with MPD (27 September 2017). 41 Parties’ response to the Remedies Notice.
A10.1-10
(b) PA told us that, if it were to acquire any of the overlap depots, it would not require a national distribution centre, as it already had its own infrastructure. It told us that whether or not a purchaser might wish to acquire a regional hub would depend on its own infrastructure and its distribution model.42
(c) No other third party considered the distribution centre or head office to be essential or required in any divestiture package.
42 []
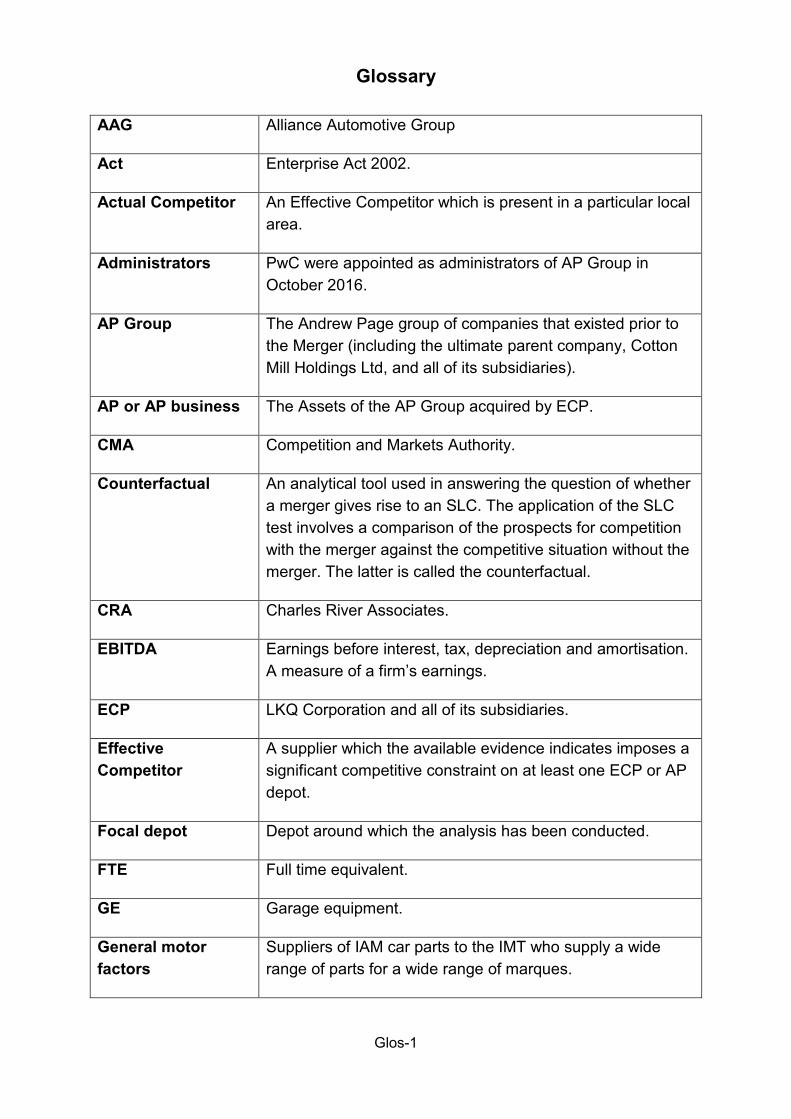
Glos-1
Glossary
AAG Alliance Automotive Group
Act Enterprise Act 2002.
Actual Competitor An Effective Competitor which is present in a particular local area.
Administrators PwC were appointed as administrators of AP Group in October 2016.
AP Group The Andrew Page group of companies that existed prior to the Merger (including the ultimate parent company, Cotton Mill Holdings Ltd, and all of its subsidiaries).
AP or AP business The Assets of the AP Group acquired by ECP.
CMA Competition and Markets Authority.
Counterfactual An analytical tool used in answering the question of whether a merger gives rise to an SLC. The application of the SLC test involves a comparison of the prospects for competition with the merger against the competitive situation without the merger. The latter is called the counterfactual.
CRA Charles River Associates.
EBITDA Earnings before interest, tax, depreciation and amortisation. A measure of a firm’s earnings.
ECP LKQ Corporation and all of its subsidiaries.
Effective Competitor
A supplier which the available evidence indicates imposes a significant competitive constraint on at least one ECP or AP depot.
Focal depot Depot around which the analysis has been conducted.
FTE Full time equivalent.
GE Garage equipment.
General motor factors
Suppliers of IAM car parts to the IMT who supply a wide range of parts for a wide range of marques.
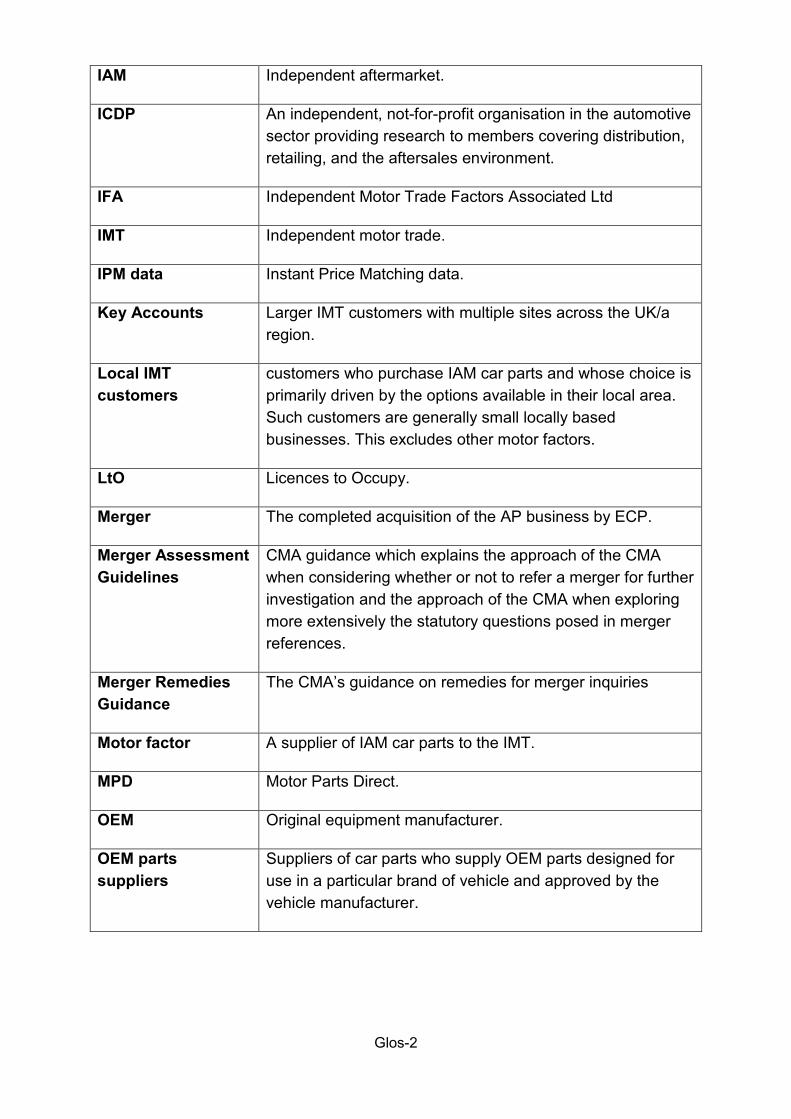
Glos-2
IAM Independent aftermarket.
ICDP An independent, not-for-profit organisation in the automotive sector providing research to members covering distribution, retailing, and the aftersales environment.
IFA Independent Motor Trade Factors Associated Ltd
IMT Independent motor trade.
IPM data Instant Price Matching data.
Key Accounts Larger IMT customers with multiple sites across the UK/a region.
Local IMT customers
customers who purchase IAM car parts and whose choice is primarily driven by the options available in their local area. Such customers are generally small locally based businesses. This excludes other motor factors.
LtO Licences to Occupy.
Merger The completed acquisition of the AP business by ECP.
Merger Assessment Guidelines
CMA guidance which explains the approach of the CMA when considering whether or not to refer a merger for further investigation and the approach of the CMA when exploring more extensively the statutory questions posed in merger references.
Merger Remedies Guidance
The CMA’s guidance on remedies for merger inquiries
Motor factor A supplier of IAM car parts to the IMT.
MPD Motor Parts Direct.
OEM Original equipment manufacturer.
OEM parts suppliers
Suppliers of car parts who supply OEM parts designed for use in a particular brand of vehicle and approved by the vehicle manufacturer.
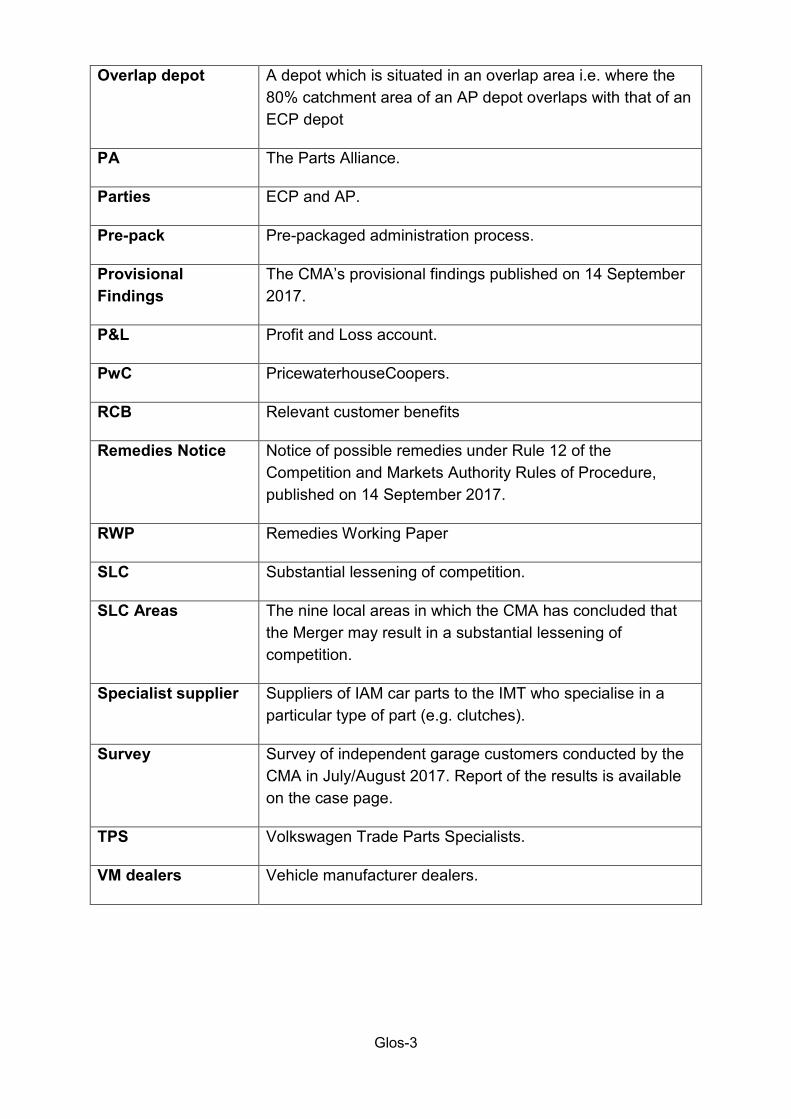
Glos-3
Overlap depot A depot which is situated in an overlap area i.e. where the 80% catchment area of an AP depot overlaps with that of an ECP depot
PA The Parts Alliance.
Parties ECP and AP.
Pre-pack Pre-packaged administration process.
Provisional Findings
The CMA’s provisional findings published on 14 September 2017.
P&L Profit and Loss account.
PwC PricewaterhouseCoopers.
RCB Relevant customer benefits
Remedies Notice Notice of possible remedies under Rule 12 of the Competition and Markets Authority Rules of Procedure, published on 14 September 2017.
RWP Remedies Working Paper
SLC Substantial lessening of competition.
SLC Areas The nine local areas in which the CMA has concluded that the Merger may result in a substantial lessening of competition.
Specialist supplier Suppliers of IAM car parts to the IMT who specialise in a particular type of part (e.g. clutches).
Survey Survey of independent garage customers conducted by the CMA in July/August 2017. Report of the results is available on the case page.
TPS Volkswagen Trade Parts Specialists.
VM dealers Vehicle manufacturer dealers.