a practical guide to evaluating your own programs · a practical guide to evaluating your own...
TRANSCRIPT

A Practical Guide toEvaluating Your Own Programs
bySally L. BondSally E. Boyd
Kathleen A. Rapp
withJacqueline B. RaphaelBeverly A. Sizemore
1997
Horizon Research, Inc.111 Cloister Court - Suite 220Chapel Hill, NC 27514-2296

Development of this manual, Taking Stock: A Practical Guide toEvaluating Your Own Programs, was made possible with the sup-port of the DeWitt Wallace-Reader’s Digest Fund which sponsorsScience Linkages in the Community (SLIC), a national programdesigned and coordinated by the American Association for the Ad-vancement of Science (AAAS).

Table of Contents
Acknowledgments
Introduction
Chapter One Why Use This Manual? 1
Program Evaluation Basics
Chapter Two Why Evaluate? 5
Chapter Three Getting Started: Framing the Evaluation 11â Documenting Context and Needs
Chapter Four What Are You Trying To Do? 15â Defining Goals and Objectives
Chapter Five Finding the Right Mix 21â Using Quantitative and Qualitative Data
Chapter Six Finding the Evidence 27â Strategies for Data Collection
Chapter Seven Making Sense of the Evidence 39â Interpreting and Reporting Your Data
Examples Featuring Fictional CBOs
Chapter Eight Applying This Manual 45â How One CBO Did It
Chapter Nine Applying This Manual in a Bigger Way 55â Expanding the Evaluation Design
Appendices—Sample Reports Using Evaluation Data
Appendix A Final Evaluation Report 71
Appendix B Proposal for Expanding a Program 75
Appendix C Annual Progress Report 81
Glossary of Terms 89
Index of Key Concepts 93
Acknowledgments
Taking Stock was prepared at the request of the American Association for the Advancement ofScience (AAAS) for its Science Linkages in the Community (SLIC) initiative. The work wascarried out with the financial support of the DeWitt Wallace-Reader’s Digest Fund. We gratefullyacknowledge the vision and support of these two organizations in the development of this manualand its companion workshop.
For many years, AAAS has worked with national and local community-based organizations todesign and deliver enrichment activities for use in out-of-school science programs. Beginning in1993, the SLIC initiative focused these efforts in three diverse U.S. cities (Chicago, IL; RapidCity, SD; and Rochester, NY). Recognizing that evaluation is essential for quality programmingand continued funding, AAAS commissioned Horizon Research, Inc. to develop materials toguide community-based organizations through the evaluation of their informal science activities.However, in the course of writing the manual, it became clear that the need for a fundamentalgrounding in program evaluation is not limited to organizations that provide out-of-school scienceactivities.
And so, this manual evolved into what we hope is a more broadly useful guide to programevaluation. To the extent that we have succeeded, we owe much to our reviewers, who includemembers of the SLIC National Planning Council and their colleagues, as well as grantmakers fromnational and local foundations: DeAnna Beane, Association of Science-Technology Centers;Janet Carter, Bruner Foundation; Stacey Daniels, Kauffman Foundation; Catherine Didion,Association for Women in Science; Hyman Field, National Science Foundation; Sandra Garcia,National Council of La Raza; Maritza Guzman, DeWitt Wallace-Reader’s Digest Fund; BarbaraKehrer, Marin Community Foundation; Roger Mitchell, National Science Foundation; NancyPeter, Academy of Natural Sciences; Annie Storer, American Association of Museums; EllenWahl, Education Development Corporation; and Faedra Weiss, Girls, Inc.
Other important “reality checks” were provided by AAAS and SLIC staff, most notably: BetsyBrauer, Rochester SLIC; Yolanda George, AAAS; Gerri Graves, AAAS; Michael Hyatt, ChicagoSLIC; and Margie Rosario, Rapid City SLIC.
Finally, we would like to thank Shirley Malcom, head of the AAAS Directorate for Education andHuman Resources Programs, who recognized the need for this resource and provided us with thetime and space to do it right.
Taking Stock - 1
Chapter One
WHY USE THIS MANUAL?
â Do you want information that will help improve your organization’s programs?
â Are your sponsors asking about the quality and impact of the programs they fund?
â Are you applying for a grant that requires an evaluation plan?
If you answered “Yes” to any of these questions, then this manual can help. It is a practical guideto program evaluation written for community-based organizations (CBOs). It providesinformation that you can put to use now to help improve your programs.
This manual focuses on internal evaluation—that is, program evaluation conducted in-house byCBO staff. We have taken this approach for one simple reason: many CBOs cannot afford tohire someone outside the organization to evaluate their programs, but they still need the kinds ofinformation that evaluation can provide.
The information in this manual should better prepare you to design and carry out a programevaluation. And because the field of evaluation is now putting greater emphasis on participatoryevaluation (a middle ground between internal and external evaluation), you will be able to applyyour knowledge either within your own organization or in working with an external evaluator. This manual will also help you recognize when you might need an external evaluator and the ad-vantages of using these services, should your CBO be able to afford them at some point.
Here are some assumptions that we made about you as we wrote this manual:
â You care about kids and communities.
â Your organization is committed to providing the best services possible.
â You have some experience running or participating in a CBO program, so you have anidea of how to get things done.
â You want to evaluate a program—not the people who run it or participate in it.
These shared qualities aside, we realize that CBOs come in all shapes and sizes. Some have full-time staff and annual program budgets exceeding $100,000; others spend less than $5,000 perprogram and rely almost entirely on volunteers. Community-based organizations also rangewidely in their goals—from teaching new information or skills, to strengthening families, toenhancing students’ educational and career options.
Taking Stock - 2
This manual is designed to help a wide variety oforganizations, whatever your goals or resources.
What’s In This Manual?
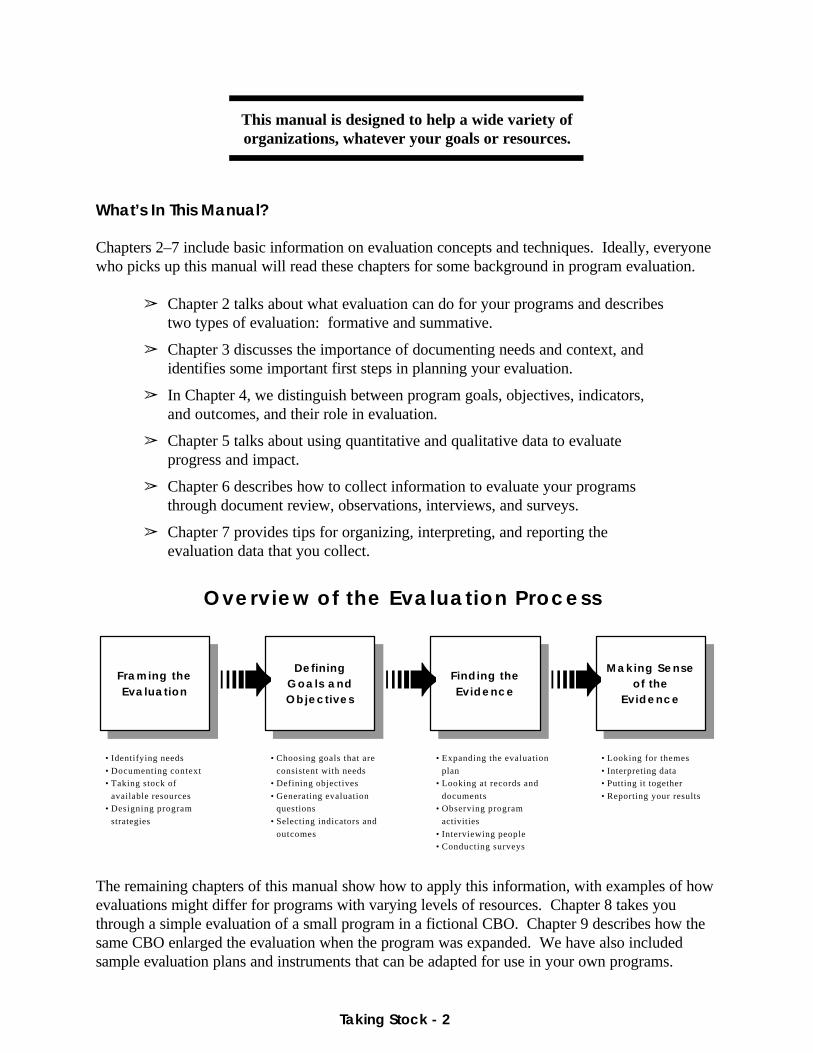
Chapters 2–7 include basic information on evaluation concepts and techniques. Ideally, everyonewho picks up this manual will read these chapters for some background in program evaluation.
â Chapter 2 talks about what evaluation can do for your programs and describestwo types of evaluation: formative and summative.
â Chapter 3 discusses the importance of documenting needs and context, andidentifies some important first steps in planning your evaluation.
â In Chapter 4, we distinguish between program goals, objectives, indicators,and outcomes, and their role in evaluation.
â Chapter 5 talks about using quantitative and qualitative data to evaluateprogress and impact.
â Chapter 6 describes how to collect information to evaluate your programsthrough document review, observations, interviews, and surveys.
â Chapter 7 provides tips for organizing, interpreting, and reporting theevaluation data that you collect.
Overview of the Evaluation Process
• Identifying needs• Documenting context• Taking stock of
available resources• Designing program
strategies
• Choosing goals that areconsistent with needs
• Defining objectives• Generating evaluation
questions• Selecting indicators and
outcomes
• Expanding the evaluationplan
• Looking at records anddocuments
• Observing programactivities
• Interviewing people• Conducting surveys
• Looking for themes• Interpreting data• Putting it together• Reporting your results
Framing theEvaluation
Framing theEvaluation
DefiningGoals andObjectives
DefiningGoals andObjectives
Finding theEvidence
Finding theEvidence
Making Senseof the
Evidence
Making Senseof the
Evidence➠➠➠
The remaining chapters of this manual show how to apply this information, with examples of howevaluations might differ for programs with varying levels of resources. Chapter 8 takes youthrough a simple evaluation of a small program in a fictional CBO. Chapter 9 describes how thesame CBO enlarged the evaluation when the program was expanded. We have also includedsample evaluation plans and instruments that can be adapted for use in your own programs.

Taking Stock - 3
The appendices include examples of three types of reports that present evaluation information:
â Appendix A is an example of a final evaluation report that describes the im-pact of the small-scale program described in Chapter 8.
â Appendix B illustrates a proposal for expanding the scope of this program asdescribed in Chapter 9.
â Appendix C models an annual progress report that describes the formativeevaluation of the multi-year program described in Chapter 9.
A Glossary of Terms is included at the end of the manual. Throughout the manual, words andterms that are shown in bold italics are defined in this glossary.
Finally, we have tried to make this manual accessible to a wide range of audiences. As an over-view, it takes a relatively traditional approach to evaluation, providing information on funda-mental concepts and activities and how these can be applied. However, in practice the field ofevaluation is far more complex than we have described it here. Using this guide as a basic intro-duction, we recommend the following resources to help you expand your knowledge and under-standing of program evaluation.
Assess for Success: Needs Assessment and Evaluation Guide, © 1991Girls Incorporated30 East 33rd StreetNew York, NY 10016
Leadership Is: Evaluation with Power, © 1995by Sandra Trice GrayIndependent Sector1828 L Street, NWWashington, DC 20036
Measuring Program Outcomes: A Practical Approach, © 1996United Way of America701 North Fairfax StreetAlexandria, VA 22314
User-Friendly Handbook for Project Evaluation: Science, Mathematics, Engineering andTechnology Educationby Floraline Stevens, Frances Lawrenz, Laure SharpNational Science Foundation4201 Wilson Blvd.Arlington, VA 22230

Taking Stock - 4
Notes

Taking Stock - 5
Chapter Two
WHY EVALUATE?
To evaluate something means literally to look at, and judge, its quality or value. A CBO mightevaluate individual employees, its programs, or the organization as a whole. When you evaluate aperson’s performance, you try to find out how well she carries out her responsibilities. When youevaluate a program, you want to know how far the program went in achieving its goals andobjectives. And when you evaluate an organization, you ask how well it operates to achieve itslarger organizational mission. Evaluation involves the collection of information that helps you tomake these judgments fairly.
This manual focuses exclusively on programevaluation. Why is program evaluation soimportant?
â First, it generates information that can helpyou to improve your programs.
â Second, it can demonstrate to funders andothers the impact of your programs.
In the past, evaluation was often used only to measure performance. Based on information gath-ered in a final, summative evaluation, further funding decisions were made. Programs werecontinued or discontinued depending on the results of the evaluation.
Luckily, program staff and funders have begun to expand their view of evaluation and appreciateits potential for program improvement. Through ongoing, formative evaluation, you and yoursponsors can gain insight into how well your program is performing and what adjustments may benecessary to keep it on track.
More about Formative Evaluation
Formative evaluation can help you determine how your program is doing while it is in progress, ortaking form. The information you collect can help you make changes in your program and correctproblems before it’s too late! Formative evaluation can also help you identify issues of interestthat you might not have thought about when planning your program. And, it can help shape andrefine your data collection activities.

Taking Stock - 6
Formative Evaluation(Provides information as a program takes form)
â Monitors progress toward objectives
â Provides information to improveprograms
â Helps identify issues of interest
â Helps refine data collection activities
â Helps clarify program strengths andlimitations
Information from a variety of sources (such as participants, instructors, and parents) can tell youhow a program is progressing. For example: Do students like the program? Are staff and par-ticipants satisfied with the activities? What changes are needed to improve the program?
The people involved with yourprograms should be consultedduring the evaluation planningstage, and as often as your re-sources permit during programimplementation. Let partici-pants know that their opinionsare important, and providethem with opportunities toshare their views. With theirinput, you can improve yourprograms and increase thelikelihood that you will achievepositive results. Evenprograms that have been suc-cessful for a long period oftime benefit from suggestionsand comments. This formativeevaluation feedback can helpgood programs become evenbetter.
Pinpointing Problem Areas:Getting Formative Feedback
Youth Action Today! was in the third year of providingthree-day summer camps for middle school students andtheir high school mentors. Interest in the camp hadsteadily increased among sixth and seventh graders, withenrollment rising each year. But pre-registration this springshowed fewer eighth graders were signing up. Thinkingfast, program staff met with several small groups of eighthgraders, who had attended the camp when they wereyounger, to see if they knew what the problem was. Students told the staff that word was out that campactivities were “babyish” and that the camp wasn’t“cool” enough for older kids. With this feedback, pro-gram staff revamped the eighth grade activities to pro-vide more opportunities for interacting with the highschool mentors. In addition, they engaged in a publicitycampaign through eighth grade teachers and parents totalk about how the camp would be different this year andmore appealing. Their efforts paid off as eighth graderegistration increased for the day camp.

Taking Stock - 7
More about Summative Evaluation
Summative evaluation differs from formative evaluation in two important ways—purpose andtiming. Ongoing, formative evaluation helps monitor progress as programs are occurring. Sum-mative evaluation occurs when you are summing up what you have achieved. This can occur atthe end of the program, or at appropriate “break points” during the implementation of an on-going or multi-year program.
Planning for Summative Evaluation
What are you trying to achieve? What do you wantyour participants to know or be able to do whenthey have finished your program (that is, what areyour goals and objectives)?
How will you know whether or not you haveachieved what you intended? What evidence willconvince you? What evidence will convince yourfunder?
Summative evaluation helps you determine if you achieved what you and your sponsor set out todo. To understand what your program achieves, however, you have to know where you began. This is why it helps to collect baseline information before, or very soon after, a program begins.Baseline questions might include:
â How serious is a particular problem or need among children who will partici-pate in your program?
â What behaviors, interests, or skills do the children have at the start of theprogram?
The amount of baseline information you collect will depend on your level of resources. For ex-ample, you may be limited to asking participants about their attitudes or behaviors. Or you mayhave the resources to gain a fuller picture by also asking parents and teachers about participants’needs, interests, and skills.
Collecting summative information allows you to find out how well the program achieved what itset out to do. Have children’s skills or interest levels increased because of the program? Whatparts of the program appear to have contributed most (or least) to the participants’ success? Ifyou did not achieve what you intended, how do you account for this? What should you do dif-ferently next time?

Taking Stock - 8
Summative Evaluation(Provides information for summing up at the end of a program)
BaselineInformation
Participant skills, behaviors, andattitudes before the program
SummativeInformation
Participant skills, behaviors, andattitudes after the program
In this chapter, we have distinguished between formative and summative evaluation in terms oftracking progress and gauging impact. Both kinds of information are important for improvingprograms, for determining whether programs are successful, and for illustrating the success ofprograms to others.
While it is important to grasp the difference between formative and summative evaluation, it isequally important to think of these activities as part of an on-going evaluation process, not asdistinct categories. Data collected while the program is in progress can be used in the summativeevaluation to gauge impact. Similarly, information collected at the end of a program can be usedin a formative way for designing an improved or expanded program or new programs with similargoals.
Why Evaluate?
To generate information thatcan help you to improve yourprograms by:
â Monitoring progress towardprogram objectives
â Identifying issues of impor-tance to program participants
â Refining data collection ac-tivities
To demonstrate the impact ofyour programs to funders andother potential supporters by:
â Assessing progress towardprogram goals
â Documenting the quality ofyour programs and describingthe effects on participants
â Quantifying the amount ofchange experienced by pro-gram participants
Now that we have discussed the main reasons for doing evaluation, we can begin to explore theprogram design and evaluation process. The first step, identifying needs and documenting con-text, is described in Chapter 3.

Taking Stock - 9
Notes

Taking Stock - 10
Notes
Taking Stock - 11
Chapter Three
GETTING STARTED: FRAMING THE EVALUATIONDocumenting Context and Needs
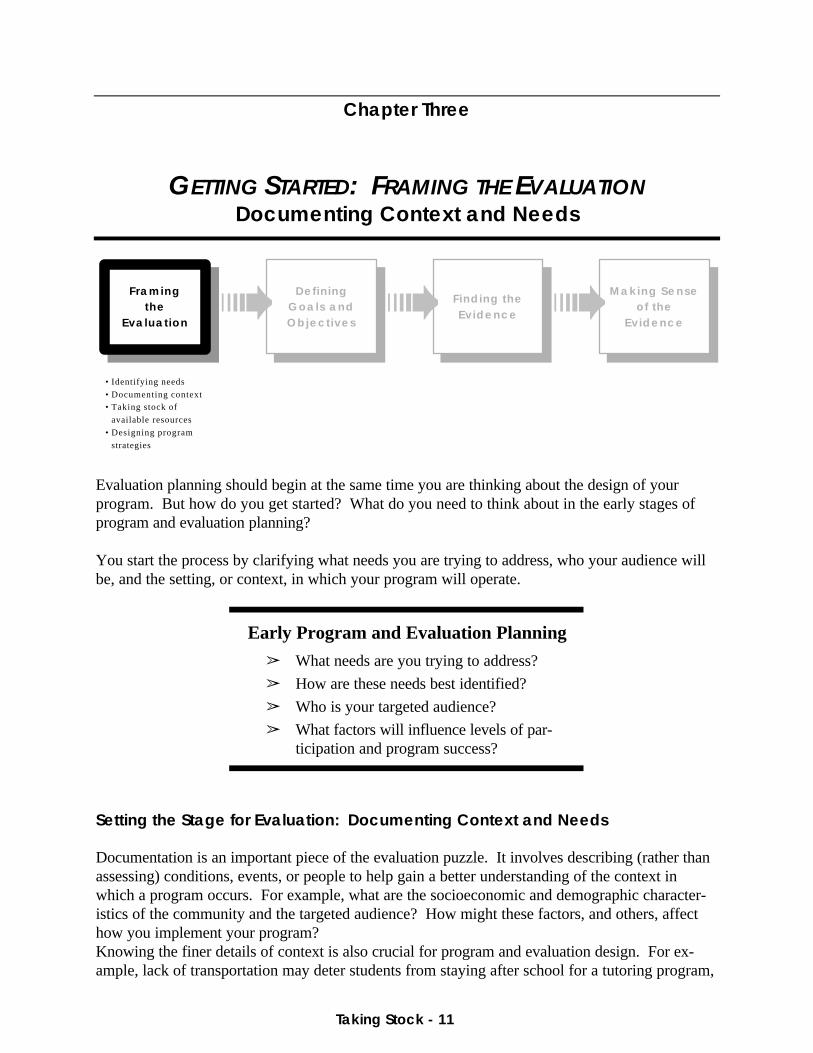
• Identifying needs• Documenting context• Taking stock of
available resources• Designing program
strategies
Framingthe
Evaluation
Framingthe
Evaluation
DefiningGoals andObjectives
DefiningGoals andObjectives
Finding theEvidence
Finding theEvidence
Making Senseof the
Evidence
Making Senseof the
Evidence➠➠➠
Evaluation planning should begin at the same time you are thinking about the design of yourprogram. But how do you get started? What do you need to think about in the early stages ofprogram and evaluation planning?
You start the process by clarifying what needs you are trying to address, who your audience willbe, and the setting, or context, in which your program will operate.
Early Program and Evaluation Planning
â What needs are you trying to address?
â How are these needs best identified?
â Who is your targeted audience?
â What factors will influence levels of par-ticipation and program success?
Setting the Stage for Evaluation: Documenting Context and Needs
Documentation is an important piece of the evaluation puzzle. It involves describing (rather thanassessing) conditions, events, or people to help gain a better understanding of the context inwhich a program occurs. For example, what are the socioeconomic and demographic character-istics of the community and the targeted audience? How might these factors, and others, affecthow you implement your program?Knowing the finer details of context is also crucial for program and evaluation design. For ex-ample, lack of transportation may deter students from staying after school for a tutoring program,

Taking Stock - 12
which in turn will influence program success. In a case like this, program planning would includeworking with school administrators to arrange for a later bus departure, or rescheduling sessionsearlier in the day.
Initial documentation activities often focus on the identification of needs, or needs assessment.Information gathered before a program is planned or implemented can help staff to identify needs,identify appropriate target populations for program services, and customize their program designto meet specific needs. Collecting this kind of information can also help you justify your programto your community and to potential funders.
There are many ways to document needs. You can attend community and church meetings tolearn about the concerns of neighborhood residents. You can informally survey human servicespersonnel to find out what needs they see in your community. And you can conduct interviews orfocus groups with parents, teachers, or students in your community. Identifying and docu-menting the needs identified by people who live and/or work in your community helps to lay thegroundwork for program and evaluation design.
Thinking Like an Evaluator
As an experienced program de-signer, you know what ques-tions to consider next:
â What strategies will enableme to address the needs I’veidentified?
â What resources do I have towork with—includingfunds, personnel (paid andvolunteer), and in-kindcontributions of facilitiesand equipment?
â Given the level of resourcesavailable to me, which ofthe possible strategies can Iimplement well?
Now, in order to design a goodevaluation plan, you need to start thinking like an evaluator. In order to do that, you musttranslate the needs you’ve identified into realistic goals and objectives. This is the subject ofChapter Four.
Needs Assessment and Baseline Data
There’s an important connection between summativeevaluation and the documentation of context and needs.When we described summative evaluation in ChapterTwo, we talked about the importance of comparingbaseline data—information gathered prior to programimplementation—with data collected at various break-points during, or in the final phase of, a program. Datacollected for needs assessment purposes may also beused as baseline data.
Once you have collected data which adequately de-scribes the context and needs of your target population atthe beginning of your program, you can plan to collectthe same kinds of descriptive information at the end ofyour program. One way to evaluate the effectiveness orimpact of your program is then to compare baseline andsummative data. What has changed as a result of yourefforts?

Taking Stock - 13
Notes

Taking Stock - 14
Notes

Taking Stock - 15
Chapter Four
WHAT ARE YOU TRYING TO DO?Defining Goals and Objectives
• Choosing goals that areconsistent with needs
• Defining objectives• Generating evaluation
questions• Selecting indicators and
outcomes
Framing theEvaluation
Framing theEvaluation
DefiningGoals andObjectives
DefiningGoals andObjectives
Finding theEvidence
Finding theEvidence
Making Senseof the
Evidence
Making Senseof the
Evidence➠➠➠
One of the most important evaluation questions you can ask is, “What do I expect to accomplishthrough this program?” Another way to phrase this is:
“What are my goals and objectives?”
The answer to this question will influence how you design your program and your evaluation.
If you were to look up the words “goal” and “objective” in the dictionary, you might find themused to define each other. But in program design and evaluation, the terms goal and objective areused for different things. A goal is what you hope to accomplish when your program is com-pleted—it is broader than an objective. An objective, on the other hand, refers to a more specificevent or action that has to occur before you can achieve your goal.
Given the complexity of the problems that CBO programs typically address, it is important to berealistic about which part(s) of a long-term goal or problem you can successfully tackle through asingle program.
What is Realistic? Breaking Down Goals
CBO program goals are sometimes as broad and ambitious as the organization’s mission, or rea-son for existing. For example, your organization’s mission may be to prepare the youth of yourcommunity for future employment. There are many ways that you might accomplish thismission—through educational programs, leadership development programs, or job skillsprograms. Community members or potential participants may have ideas about appropriatestrategies. But how do you decide on a plan for a specific program? One way to identify possible

Taking Stock - 16
objectives is to think about your goal as a problem to be solved. As you break the problem down,you can see that there are many possible objectives that must be achieved in order to trulyaccomplish your goals.
For example, given that yourmission is to prepare youth forfuture employment, you mightchoose to pursue the followinggoal:
“Prepare youth to enter science-and mathematics-related fields”
What kinds of experiences wouldhelp to prepare children for careersin these fields? Here are someideas:
â Elementary school stu-dents need exposure togood science and mathe-matics enrichment activi-ties in order to developtheir interest in thesesubjects and to enhance what they learn in school.
â Middle school students need to spend time with role models or mentors who canadvise them on appropriate ways to prepare for a specific field and provide themwith some meaningful experiences in that field.
â Middle and high school students need to experience high-quality tutoring in keyareas, such as Algebra and Chemistry, which are useful in many science- andmathematics-related fields.
â High school students need access to appropriate guidance services to help themidentify post-secondary programs that suit their needs and interests in science andmathematics.
The objectives of your career preparation program will then be to provide one or more of theseexperiences or services to the youth you serve. It is important to remember, however, that theseobjectives represent just a few of the options a CBO might use to address this particular goal, andthat other objectives might be equally valid. In other words, there is no finite number of “correct”objectives to meet a selected goal.
Being Realistic:Separating Goals from Objectives
Let’s say the goal of your program is to reduce the schooldrop-out rate. This goal could be addressed in many dif-ferent ways. Based on your experience and the resourcesavailable to you, you and your colleagues decide that arealistic objective for this program is to provide mentors formiddle and high school students who are at risk of schoolfailure.
You believe that achieving your objective (providing stu-dents with positive, one-on-one relationships with caringpeers or adults) will decrease participants’ tendency toengage in self-destructive behaviors, and will stimulatetheir interest in school—first steps toward addressing yourlong-term goal of reducing the drop-out rate. With yourobjective in mind, you design program activities that youfeel will support positive mentoring relationships.

Taking Stock - 17
Relationship between mission, goal, and objectives
Organizational M ission
ProgramObjective 2
ProgramObjective 2
ProgramObjective 1
ProgramObjective 1
ProgramGoal
ProgramGoal
Working Out An Evaluation Plan
Now that you have identified your goals and objectives, you can begin framing formative evalua-tion questions in terms of progress toward your objectives and summative evaluation questionsin terms of impact on your goals.
Using the example of the program to prepare youth for future employment in science- andmathematics-related fields, your objectives are (1) to provide elementary age students with highquality science and mathematics activities outside of school, (2) to develop their interest in scienceand mathematics, and (3) to build on the science and mathematics that these students are learningin school. What evaluation questions will help you determine if you are making progress towardthese three objectives? Using a chart like the one that follows might help you visualize how theevaluation design will take shape.

Taking Stock - 18
Developing an Evaluation Plan
Mission: To prepare the youth of our community for future employment
Goal: To prepare youth to enter science- and mathematics-related career fields
Objectives: a) To expose elementary students to good science and mathematics activitiesb) To develop students’ interest in science and mathematicsc) To enhance the science and mathematics that students learn in school
Sample Formative Questions(related to objectives)
â What do students think of the mathematicsand science activities that we provide?
â How do students demonstrate genuine in-terest in science and mathematics?
â How are students using the science andmathematics they learn in school as theyparticipate in our activities?
Sample Summative Questions(related to goals)
â How do students’ interest in science- andmathematics-related careers compare beforeand after the program?
â What steps have students taken on theirown to find out more about science- andmathematics-related careers?
You will undoubtedly come up with many evaluation questions as you try to develop a similarplan for your own programs. Some of your questions will be very specific, like “Did studentsappear to be interested in the nature hike?” Other questions will be more general, like the ones inthe preceding box. Whatever your questions are, grouping them in terms of your goals and ob-jectives will help you to organize your thoughts and to identify gaps in your evaluation plan.
How Will You Know When You Get There? Measuring Progress and Impact
Thinking through your evaluation questions in terms of the goals and objectives you have definedprovides the foundation for your evaluation plan. The next step is equally important—decidingwhat kinds of evidence will convince you and your funders that your program is a success. Whatdo you expect to see, hear, or measure if your program is successful at achieving your objectivesand ultimately your goals?
In the formative evaluation stage, while a program is in progress, we look for intermediate indi-cators—what you expect to see if you are progressing toward your objectives. In the early careerpreparation program described above, intermediate indicators might include:
â Parents reporting that the students talk enthusiastically about programactivities while at home.
â Students asking questions that indicate they are linking science andmathematics concepts with their everyday lives.

Taking Stock - 19
â Science and mathematics teachers reporting that students refer to programexperiences during classroom discussions.
In the summative stage of the evaluation, when the program is completed, we look for evidence offinal program outcomes. These are the changes you expect to see if your program has actuallyachieved its goals. Once again using the early career preparation program as the example, youmight expect outcomes such as the following:
â When asked to list jobs that interest them, more students mention a science- ormathematics-related field after the program than when asked this question atthe beginning of the program.
â Over the course of the program, at least half of the participants checkoutlibrary books related to science and mathematics professions.
Relationship between mission, goals, objectives, indicators and outcomes
Organizational M ission
Final Program OutcomesFinal Program Outcomes
IntermediateIndicators
IntermediateIndicators
IntermediateIndicators
IntermediateIndicators
IntermediateIndicators
IntermediateIndicators
Objective 3Objective 3Objective 2Objective 2Objective 1Objective 1
Goal 1Goal 1
Final Program OutcomesFinal Program Outcomes
IntermediateIndicators
IntermediateIndicators
IntermediateIndicators
IntermediateIndicators
IntermediateIndicators
IntermediateIndicators
Objective 1Objective 1 Objective 2Objective 2 Objective 3Objective 3
Goal 2Goal 2
ProgramProgram
The figure above illustrates the interrelationships between organizational mission, program goals,objectives, indicators, and outcomes. In Chapter Five, we briefly set aside our discussion of theevaluation process in order to explore in more depth the different kinds of information that can beused to define indicators and outcomes.

Taking Stock - 20
Notes

Taking Stock - 21
Chapter Five
FINDING THE RIGHT MIXUsing Quantitative and Qualitative Data
How will you know whether you are achieving your objectives and making progress toward yourgoals? What counts as evidence of progress and impact? Though simplifying a bit, it’s conven-ient to think of measuring progress and impact in terms of quantitative and qualitative data.
What are Quantitative Data?
Information that is measured and expressed with numbers can provide quantitative data. For ex-ample, attendance records can show the number of persons who participate over a period of time;surveys can show the percent of participants who respond to a question in a certain way. Thesequantitative data can be used in a variety of ways. To name just a few, they can be presented asnumbers or percents, as ranges or averages, and in tables or graphs. They can also be used tocompare different groups of participants—girls and boys, students of different socioeconomic orethnic backgrounds, or students in your program with non-participants.
To illustrate different ways to present quantitative data, let’s go back to the mentoring/dropoutprevention program that we first described in the box on page 16. In this example, the 15 middleschool students (7 girls and 8 boys) and 25 high school student participants (10 girls and 15 boys)were asked to fill out a questionnaire at the end of the school year. The following tables andgraphs illustrate several ways to present the same questionnaire results.
As numbers, combining the results forall of the program participants:
As percentages, separating middle schoolfrom high school:
End-of-Year Survey
Response on QuestionnaireNumber responding
Agree/Strongly Agree
I look forward to meetings withmy mentor.
I think my mentor cares aboutme personally.
I understand my school workbetter when my mentor helpsme.
38
38
23
Total Number of Participants 40
End-of-Year Survey
Percentage respondingAgree/Strongly Agree
Response on QuestionnaireMiddleSchool
HighSchool
I look forward to meetings with mymentor.
I think my mentor cares about mepersonally.
I understand my school work betterwhen my mentor helps me.
100
87
67
92
100
52
Total Number of Participants 15 25

Taking Stock - 22
You might also choose to present some of the information graphically to help make a point thatmight be difficult to see in a table. Here, the graph shows that the boys responded quite differ-ently from the girls to one specific question:
Students Reporting They Understood School Work
Better with the M e ntor's He lp
0%
10%
20%
30%
40%
50%
60%
70%
80%
90%
100%
M iddle School High School
Girls
Boys
Notice how each of these examples has highlighted a different aspect or detail in the questionnaireresults. We went from looking at the results for all participants, to comparing results for middleand high school participants, and finally comparing results for boys and girls at the middle andhigh school levels.
What are Qualitative Data?
Evaluators also look at progress and impact in terms of qualitative data, where changes are moreoften expressed in words rather than numbers. Qualitative data are usually collected by documentreview, observations, and interviews. Open-ended questions on surveys can also generatequalitative data.
Qualitative data can provide rich descriptions about program activities, context, and participants’behaviors. For example, we can assess the impact of the mentoring/dropout prevention programon students’ relationships with their mentors by describing how well the student-mentor pairsinteract before and after the program.

Taking Stock - 23
Example of Qualitative DataObservations of Program Activities
Student behaviors during thefirst week of a program
At a “Get Acquainted” bowling party, stu-dent/mentor pairs grouped themselves intotwo pairs per alley. In some cases, theyouths spent most of the time talking to-gether, not mingling with the adults. Intwo cases, the youths left the bowling areato play video games. Several adults ap-peared hesitant to break into the youthfulconversations; in most cases, the adults satand conversed separately.
Several of the youths bowled a game ortwo with their mentor, but appeared un-comfortable with the adult, and uneasyabout approaching other youths who wereengaged in conversations. These studentsseemed bored and distracted.
Student behaviors during the last week of a program
At a “Welcome Summer” picnic, studentsand mentors appeared quite comfortablewith each other. Most students chose to sitnear their mentors at picnic tables. All thestudents appeared at ease talking with theirmentors, and in many cases, talking to otheradults sitting nearby. No one appearedbored or hesitant to join in conversation.
After eating, mixed groups of adults andstudents played volleyball and softball, witheveryone actively participating. Interactionswere relaxed and enthusiastic. Students andmentors appeared to enjoy the opportunityto be together.
Qualitative data can also be expressed in numbers. For example, interview responses can betallied to report the number of participants who responded in a particular way. Similarly, in theexample above, the observer could report the number of students in the entire group who wereactively engaged in the activity.
Seeing Quantitative and Qualitative Data as Indicators and Outcomes
To further illustrate quantitative and qualitative data, let’s return to the mentoring program dis-cussed earlier. The goal of the program is to reduce the school drop-out rate. The objective is toprovide positive role models and mentors for at-risk middle and high school students.
Formative Evaluation: While your program is underway, how will you know thatyou are building mentoring relationships that are having a positive impact on stu-dents’ behavior?
The number of students who engage in weekly activities with their mentorsis one possible quantitative, intermediate indicator. Using this in-formation, you might reason that steady or increased participation meansthat students enjoy the activities and find the new relationships rewarding.

Taking Stock - 24
Fewer disciplinary reports with participating students mid-way through theprogram might also suggest progress.
A change in students’ behavior, as reported through teacher interviews, is apossible qualitative, intermediate indicator. Teachers might note thatparticipating students are less hostile and more motivated since the pro-gram began. These qualitative data might suggest a change in students’attitudes toward themselves and others in authority.
Summative evaluation: How will you know that building positive mentoring rela-tionships has helped produce behavior conducive to students staying in school?
As baseline data, you compiled data on the number of disciplinary reportsand suspensions among your participants before the program began. Yoursummative data—the same data for participants at the end of each year ofyour program—might show a leveling off or decline in these numbers. This would be a quantitative, final program outcome.
Your observations or parents’ and teachers’ descriptions of students’ be-havior, both before and after the program, can provide summative qualita-tive data. A description of behavior in and out of school that provides evi-dence of more interest and motivation is a possible qualitative, finalprogram outcome.
Program to Reduce the Drop-out Rate
Quantitative Outcomes Qualitative Outcomes
IntermediateIndicators
Number of students who engage inactivities with mentors stays thesame or increases over course ofprogram.
Quality of students’ interactions withothers shows improvement duringprogram.
Final Outcomes Number of suspensions/disciplinereports decreases among participantsby program’s end.
Quality of students’ interactions inand out of school consistently im-proves by program’s end.
The following figure summarizes where we are now in the evaluation design process. In the nextchapter, we resume our discussion of the evaluation process by focusing on methods for collect-ing quantitative and qualitative data.

Taking Stock - 25
Goals
Object ives
Goals
Object ives
How do youplan to
accompl ishit?
How do youplan to
accompl ishit?
Strategies
Activit ies
Strategies
Activit ies
How wi l l youknow whether
you’veaccompl ished
it?
How wi l l youknow whether
you’veaccompl ished
it?
Outcomes
Indicators
Outcomes
Indicators
Types of datato “measure”progress and
impact
Types of datato “measure”progress and
impact
Quanti tat ive
Quali tat ive
Quanti tat ive
Quali tat ive
What do youwant to
accompl ish?
What do youwant to
accompl ish?
A Final Word About Quantitative and Qualitative Data
Collecting both quantitative and qualitative data in your formative and summative evaluation isimportant, but is not always possible. For example, many positive outcomes do not have tests orscales associated with them, so a number cannot be assigned to measure progress or success. Inthese cases, qualitative data may prove more useful, since they allow you to describe outcomeswith words. Qualitative data can also be highly useful for clarifying what you think is important,and for discovering new issues that you might have overlooked in your initial evaluation design.
On the other hand, collecting and using qualitative data is often time-consuming and labor-intensive. As a general rule, you will want to use the measures (quantitative or qualitative) thatare most feasible in terms of your skills and resources, and most convincing to you and yoursponsors.

Taking Stock - 26
Notes

Taking Stock - 27
Chapter Six
FINDING THE EVIDENCEStrategies for Data Collection
• Expanding the evaluationplan
• Looking at records anddocuments
• Observing programactivities
• Interviewing people• Conducting surveys
Framing theEvaluation
Framing theEvaluation
DefiningGoals andObjectives
DefiningGoals andObjectives
Finding theEvidence
Finding theEvidence
Making Senseof the
Evidence
Making Senseof the
Evidence➠➠➠
So far, you have defined goals and objectives for your program, and you have thought about thekind of evidence you need to measure progress and impact. You would like to collect somebaseline data to compare with the summative data you collect at the end of the program. And youknow that you want to collect both quantitative and qualitative data as evidence for yourintermediate indicators and final program outcomes. But how do you actually get theinformation that you need?
Measuring progress and impact basically means collecting and interpreting information. Beforeyou decide how to collect this information, it is important to have a clear idea of what you aretrying to learn. While it may be tempting to try and capture every facet of change occurringamong youth in your program, being clear on the purpose of your evaluation can help keep datacollection more manageable. For example, if you are trying to measure problem-solving abilities,your questionnaire does not need to ask students about their attitudes towards mathematics.
Be clear about what you want to find out. Sticking to these areas of interest and avoidingunnecessary data collection will keep yourevaluation focused.

Taking Stock - 28
At this stage in designing your evaluation, think about your program activities, possible sources ofinformation (e.g., students, parents, and teachers) about how well these activities are working,and different ways to collect information from each of these sources.
There are four basic ways to collect evaluation data: document review, observations, interviews,and surveys. Using a combination of these methods will help you to check your findings. Andyour evaluation will be more convincing if you can refer to more than one information source andmethod of data collection (such as interviewing students and surveying parents) to support yourstatements or conclusions.
What Records and Documents Can Tell You
Written documents and records can reveal things about people’s behavior and about the contextin which your program occurs. Such records may already exist somewhere or you may createcustomized records to meet your evaluation needs. In either case, records and documents canprovide you with some fairly reliable information about program participants, and about theevolution of a particular issue or program over time.
Creating your own records can be a cheap and easy way to collect information and to make surethat you get the information you want about your participants and the impact of your program.
Examples of Records and Documents
Existing Records/Documents
â School attendance records
â Report cards
â Extracurricular activityrecords
â Arrest records
Created Records/Documents
â Program attendance sheets
â Participant information sheets
â Library checkout lists
â Participant journals orportfolios
How might a CBO use specially-created forms? Simple forms completed on the first day of theprogram can provide vital information about participants, including name, race or ethnicity, gen-der, and age. This demographic information is important to determine if the program served theintended target audience (for example, middle school girls).
An attendance sheet is another easily-created form that can help measure program success; in-formation from these forms may indicate steady or growing participation, suggesting programpopularity. A program aimed at improving attitudes toward science and mathematics might de-vise a form to keep track of the number of science/mathematics-related library books checked outby program participants. An increase in the number of books checked out may indicate growinginterest in and appreciation for science and mathematics.

Taking Stock - 29
Existing records can also pro-vide useful evaluation infor-mation. For example, schoolrecords of student participa-tion in extracurricular activi-ties may indicate increasedmotivation and interest. Butbe aware that you may notalways get permission to lookat the documents that interestyou. Access may require thecooperation of people outsideyour organization, and getting permission can often be tricky. This is often a problem with reportcards. Singling out and checking program participants’ records (from the hundreds on file at aschool) can also be time-consuming.
Given these obstacles, you might be able to get the same information with a more ingeniousstrategy. While access to report cards through the schools may be difficult to attain, it might berelatively simple to get parental permission for students to bring in their report cards, and to en-courage participants to do so with small incentives such as inexpensive or donated prizes. Ingeneral, however, because accessibility varies tremendously, it is a good idea to inquire about theavailability of certain records before you decide to rely on them in your evaluation.
Considering Different Types of Records
Advantages Disadvantages
Existing Records â May provide good informationabout student behaviors
â May be difficult to access
â Require permission of others
â Time-consuming to match withparticipants
Created Records â Can be customized to suit theprogram
â Simple forms require little ex-pertise to create or use
â Require accurate and regularrecord-keeping by staff
Creating records or using existing documents can be fairly straightforward. In addition, theanalysis of records may simply involve tallying the results. But records and documents provideonly a piece of the evaluation picture. They are indirect measures; that is, they only suggest pos-sible conclusions because they tend to be related to certain kinds of attitudes and behaviors. Forexample, increased attendance at CBO programs suggests that the popularity of the program isgrowing. However, higher attendance rates could also mean that children are using the program
Be Creative!
You can sometimes be quite creative in using records to suityour needs. For example, researchers studying the impact ofa new elementary school music program consulted theschool nurse’s records of “emergency” student visits before,during, and after the new program was implemented. Theyfound that visits decreased during the program, and usedthis information to support their contention that studentsenjoyed the new program better than the previous one.

Taking Stock - 30
to avoid doing something else that they like even less. It is always best to supplement the picturewith other kinds of direct evidence. This may include letting participants tell you whether or notthey like the program or observing them to see if they appear to be engaged and enjoyingthemselves.
Why Watch? What Observations Can Tell You
There is no substitute for taking a firsthand look at your program. Observing children engaged inactivities or sitting in on staff meetings can provide useful information for answering both for-mative and summative evaluation questions. By observing, you also can see what is or is notworking, how the program is developing, and the appropriateness of activities for participants. Inshort, observations can yield a wealth of information about your program.
What skills do observers need?
The most important qualities required are theability to take in what is seen, heard, and felt in anevent, and to report those impressions and detailsclearly in writing. Someone with good attentionand writing skills is more likely to assemble auseful observation report than someone whostruggles with these tasks.
As an observer, it is essential to have a clear idea of what you are looking for. Within theseguidelines, however, it is also important to just look before you begin looking for something, andthat means leaving behind any preconceived notions about what you think you might see. Yourobservation guidelines may be very general at the beginning of the program, but will narrow infocus over time as you decide what evidence is most crucial for your evaluation.
Think about your objectives and desired outcomes. What behaviors would support your claimthat the program has changed students’ motivation, attitudes, or skills? With observations,“actions speak louder than words.” For example, while students might say they like science betterbecause of a program, it is even more convincing when an observer reports that students areactually asking more or better questions about science-related topics. Similarly, it is easy forparticipants to say their self-esteem has increased. But seeing differences in the way a studentdresses or interacts with others can support statements about the program’s influence on students’self-image. Tasks that are designed to gauge changes in student’s behavior or skills, and that arecompleted by participants during an observation session, can also provide excellent evaluationdata.
Most observers write notes while they are watching, describing what participants and staff say ordo during the observed event. For example, students working in a small group might talk excit-edly while working out the solution to a problem. Recording their comments can provide valu-able testimonial to the benefits of cooperative learning. Audiotapes, videotapes, or photographs

Taking Stock - 31
may prove useful in capturing the essence of observed events, providing that you have permissionfrom participants to use these tools.
While you are observing, beattentive and open to discov-ering behaviors, both verbaland nonverbal, that suggestthe presence or lack of stu-dent motivation. Interactionsbetween children, betweeninstructors and children, andbetween children and thematerials are all available tothe observer’s eye.
Despite their strengths, ob-servations alone are not suffi-cient evidence for convincingothers that a program hascaused lasting change. Forinstance, observations of students working with each other during a twenty-minute activity do notnecessarily mean that students are more inclined to work cooperatively in general. Again, it isalways important to look for several sources of evidence that support whatever changes you thinkhave occurred in participants.
Observing With an Evaluator’s Eye
Imagine you are sitting in the back of a room where ten students are takingturns reading aloud from a book about a science-related topic. The in-structor takes frequent breaks to ask questions and stimulate discussion. Ifyou are looking for indicators of student interest in science, you will con-sider:
â How many students are participating in the discussion? Whatare they saying?
â How do students look? Are they distracted or bored, or arethey listening with interest?
â How much personal experience do the students bring into theirresponses?
â How excited do they seem about the subject? What do theysay?
Who Should Observe?
Activities can be observed by someone involved with theprogram or by someone without a role in the activity. An“outsider” gathers details during the event, while a partici-pant-observer who is part of the process (for example, anassistant instructor) writes down observations afterwards.Outsiders can be more objective, but insiders have the ad-vantage of really knowing the issues and the ability to pro-vide immediate feedback. For example, program staff maywonder how students with reading difficulties are faring inthe program’s laboratory projects. The program directorcould ask teachers and assistants to pay particular attentionto this issue and report on their observations at the next staffmeeting.

Taking Stock - 32
What’s the Word on the Street? Conducting Interviews
Interviewing participants, program staff, parents, classroom teachers, and others is a great way toget information about the impact of your program. As with observations, being clear and focusedabout the information you want is critical. There are many questions that can be asked; theevaluator’s challenge is to ask just the half dozen or so that best meet the needs of the evaluation.
It is also important to get a range of perspectives. For example, interviewing only staff membersabout program impact presents only one point of view and can result in a biased interpretation ofprogram outcomes; getting students’ and parents’ views can give you a more complete picture ofwhat your program did or did not accomplish.
Interviews offer a wide range of formats—they can be formal or informal, structured or unstruc-tured, individual or in groups, in-person or by telephone. Given the limited resources that mostCBOs have, structured interviews that follow a prepared set of questions may work best. An in-terview guide, or protocol, can be quite simple. In cases where it is important to do so, a proto-col is helpful in making sure that each person is asked to respond to the same questions.
If you are working with inexpe-rienced interviewers, short, spe-cific, and very structured interviewguidelines can help ensure that youget the information you want. Inaddition to this formal interviewformat, some informal interviewsmay occur as well. For example,you might ask a few students whatthey think about an activity whileyou are observing the group. These spontaneous comments canyield excellent insights and in-formation for formative and sum-mative evaluation purposes.
Since interviews require people toreveal their thoughts, it is impor-tant to keep in mind a good fitbetween interviewer and partici-pants. For example, having aninstructor interview students abouthow they liked the class may notyield reliable results because chil-dren may feel the need to give a positive response. In this case, someone not associated withprogram delivery would be a better choice. Assuring respondents of individual confidentiality—andrespecting that confidentiality—can also help ensure that people are candid with their answers.
Interviewing Children
Students sometimes act reserved with an adult interviewerand may require a certain amount of “probing” to get at keyissues or to get a better understanding of what they mean. For example:
Interview question:“What did you like best about the program?”
Student: “Everything was great.”Probe #1: “What one thing stood out?”Student: “The food was really good.”Probe #2: “What about with the program activities?”Student: “Well, I really liked working in groups.”Probe #3: “How come?”Student: “It just made you feel like everybody was working
together, and like you weren’t alone, and youcould feel good about what you did in thegroup.”
In this example, it took three probes to find out what thestudent really liked best and why. This is the kind of informa-tion you want, so be prepared to follow up until you get ananswer to your question.

Taking Stock - 33
Interviewers should be objective, non-threatening, knowledgeable about theprogram, and be able to communicate andlisten well.
Group interviews, or focus groups, are a good way to talk to more people in a shorter amount oftime. It takes a skilled interviewer to keep the group on track, however, and to make sure thateveryone gets involved in the discussion. Restricting a group to 8–10 people is a good idea, as islimiting the people in your group to those who have similar experiences—such as teachers only orstudents only.
To capture the important points that emerge from an interview, interviewers usually take notesand/or tape record (if the person or group is willing). In either case, it’s important to try to getthe exact words people use about key points. These direct quotes can provide powerful dataabout program impact. Summaries of what people say are also useful for illustrating programimpact in evaluation reports.
Interviewing people can betime-consuming and labor-intensive, but the rich detailthat comes from interviewscan make it all worthwhile. Interviews can provide in-depth information about be-haviors, attitudes, values,knowledge, and skills—be-fore, during, and after a pro-gram. Interviews can alsohelp clarify and expand whatyou learn through documentreview and direct observa-tions. And because interviewscan provide such rich data, itis possible to get enoughdetailed information about aprogram by interviewing a sample or subset of participants, instead of all participants.
Tips for Interviewing
â Make the interview setting as friendly and as comfort-able as possible.
â Use your own words to sound more natural and conver-sational, even as you use an interview guide with setquestions.
â Be patient. Allow people to think and answer in theirown time.
â Try not to give verbal or facial clues to people’s re-sponses. By doing so, you might lead their answer ormake them think they said something wrong.
â At the end of the interview, give people a chance toadd miscellaneous comments or ask you any questionsthey might have.

Taking Stock - 34
Making Numbers Count: Conducting Surveys
A survey is a method of collecting information—by mail, by phone, or in person. Surveying in-volves a series of steps, including selecting a sample, collecting the information, and following upwith non-respondents. A questionnaire is the instrument (written questions) used to collectinformation as part of a survey.
Responses to multiple-choice items on questionnaires can be tallied to provide numbers and per-centages that are powerful quantitative evaluation data. While people can be surveyed by mail orphone, community-based organizations might more frequently choose to have participants com-plete a written questionnaire in person during program events. With a captive audience, you willlikely get a better response rate, which can yield more accurate information about the group as awhole.
Questionnaires can be especially useful in evaluation if the same set of questions is asked at thebeginning of a program (for baseline information) and again at the end of the program (tomeasure impact).
For programs with a large number of participants, surveying a sample of the group may be morecost-effective than surveying everyone in the program. However, you need to be careful tochoose a sample that is representative of the entire group. For example, if attendance at aparticular event is low, then surveying only those participants who come to the event may lead tobiased results. Everyone who attended may have thoroughly enjoyed the activity, while the restof the people who were invited chose not to attend because the activity did not seem veryinteresting or worthwhile. Talking to non-participants will help you to more accurately evaluateyour program activities.
Surveys can include several kinds of questions. Closed-ended questions resemble items on amultiple-choice test; they provide a selection of possible answers from which to choose. Peoplewho complete the questionnaire are asked to select the answer that best matches their beliefs orfeelings. In the following questionnaire, items 1 and 4 are examples of closed-ended questions. Question 1 gives the participant five options for describing his or her reaction to the program. Question 4 provides the participant with several options each for describing their gender, gradelevel, and race/ethnicity. Notice that the answers to question 4 provide important contextual ordemographic information about the participants.
Open-ended questions, on the other hand, provide no answer categories. Rather, they allowparticipants to respond to a question in their own words. For example, question 3 asksparticipants to write out specific suggestions for future programs. Notice that question 3 iscarefully worded to discourage a simple “yes” or “no” answer.
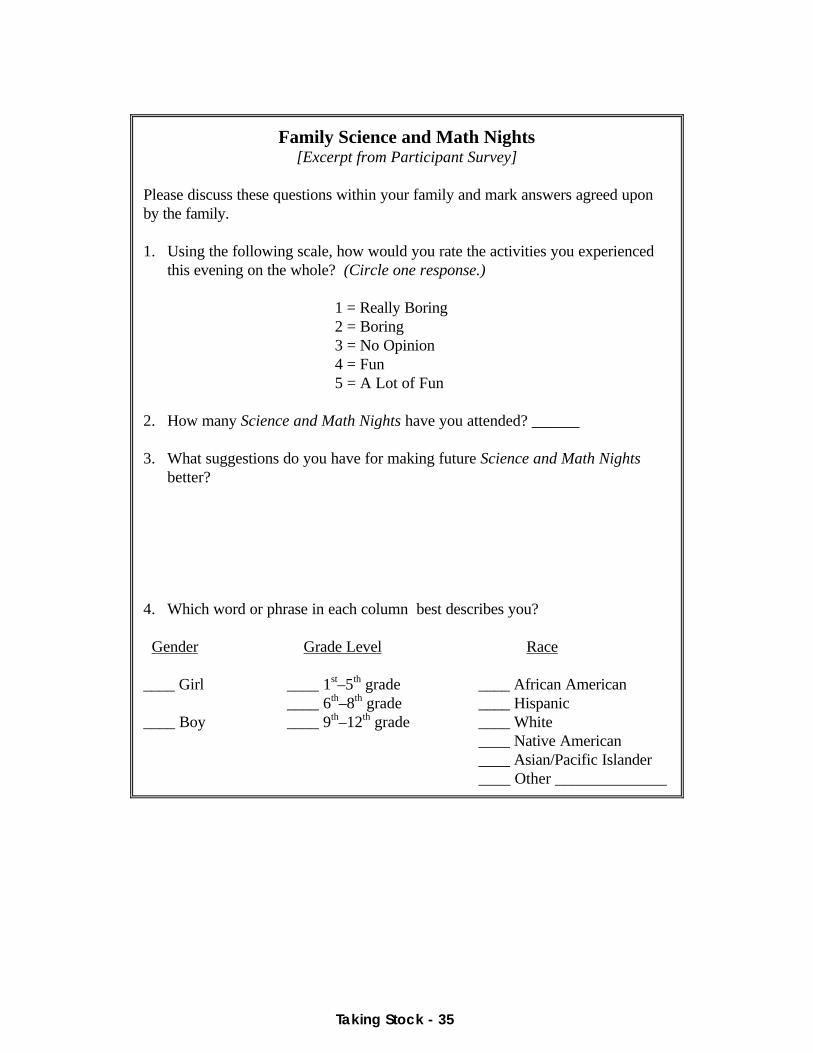
Taking Stock - 35
Family Science and Math Nights[Excerpt from Participant Survey]
Please discuss these questions within your family and mark answers agreed uponby the family.
1. Using the following scale, how would you rate the activities you experiencedthis evening on the whole? (Circle one response.)
1 = Really Boring2 = Boring3 = No Opinion4 = Fun5 = A Lot of Fun
2. How many Science and Math Nights have you attended? ______ 3. What suggestions do you have for making future Science and Math Nights
better?
4. Which word or phrase in each column best describes you?
Gender Grade Level Race
____ Girl ____ 1st–5th grade ____ African American____ 6th–8th grade ____ Hispanic
____ Boy ____ 9th–12th grade ____ White____ Native American____ Asian/Pacific Islander____ Other ______________

Taking Stock - 36
Developing good surveys re-quires a certain level of ex-pertise that some community-based organizations may lack.This does not mean that usingquestionnaires in yourevaluation is out of reach. Here are some tips you canuse to develop a questionnaireor adapt one that someoneelse has created for a similarpurpose.
â Keep your questionnaireshort, ideally no more thana page or two. Re-member, someone willhave to tally or read andanalyze all of thoseresponses.
â Keep it simple, with shortquestions and clear answercategories.
â Make it easy to use—participants will be more likely to complete it.
â Make it anonymous, and participants will probably be more honest.
â Use language appropriate for the audience. The younger the student, the simpler the ques-tions and answer categories need to be.
A Final Word about Data Collection
There are always tradeoffs to consider when selecting data collection methods for your evalua-tion. Some tradeoffs involve time and the level of effort needed to collect and analyze certainkinds of data. For example, conducting individual interviews takes longer than interviewing agroup of people all at once, but potentially sensitive questions should not be asked in a groupsetting. Interviews in general require more staff time than having participants fill out a survey. On the analysis side, counting closed-ended responses to a question generally takes less time thanreading the same number of open-ended responses and drawing out the major themes to besummarized.
Another tradeoff involves using program staff to conduct evaluation activities as opposed tohiring someone from outside of your organization. Hiring an external evaluator obviouslyinvolves some expenditure—which you are trying to avoid by using this manual! However, thereare at least two good reasons to consider using an external evaluator. First, participants are notalways comfortable saying critical things about a program to the people who are directly involved
Tips for Developing QuestionnairesWording Matters!
How you word your questions can influence the response youget. Be precise in your language to help the respondentunderstand what information you are requesting. Forexample, an open-ended question that asks participantshow many Science and Math Nights they have attendedmight yield a variety of responses such as, “a lot,” “four,”“can’t remember,” or “most of them.” In this case, to helpjog memories and get more accurate information, it mightbe better to provide the dates of the sessions and the majoractivity that occurred, and ask respondents to check whichones they attended.
With questionnaire items, it’s also important to avoid leadingthe respondent in a particular direction with your questionsor answer categories. For example, a closed-ended itemwith mostly positive answer choices (“Okay,” “Fun,” “Great”)does not give participants suitable options for expressing anegative opinion.
Taking Stock - 37
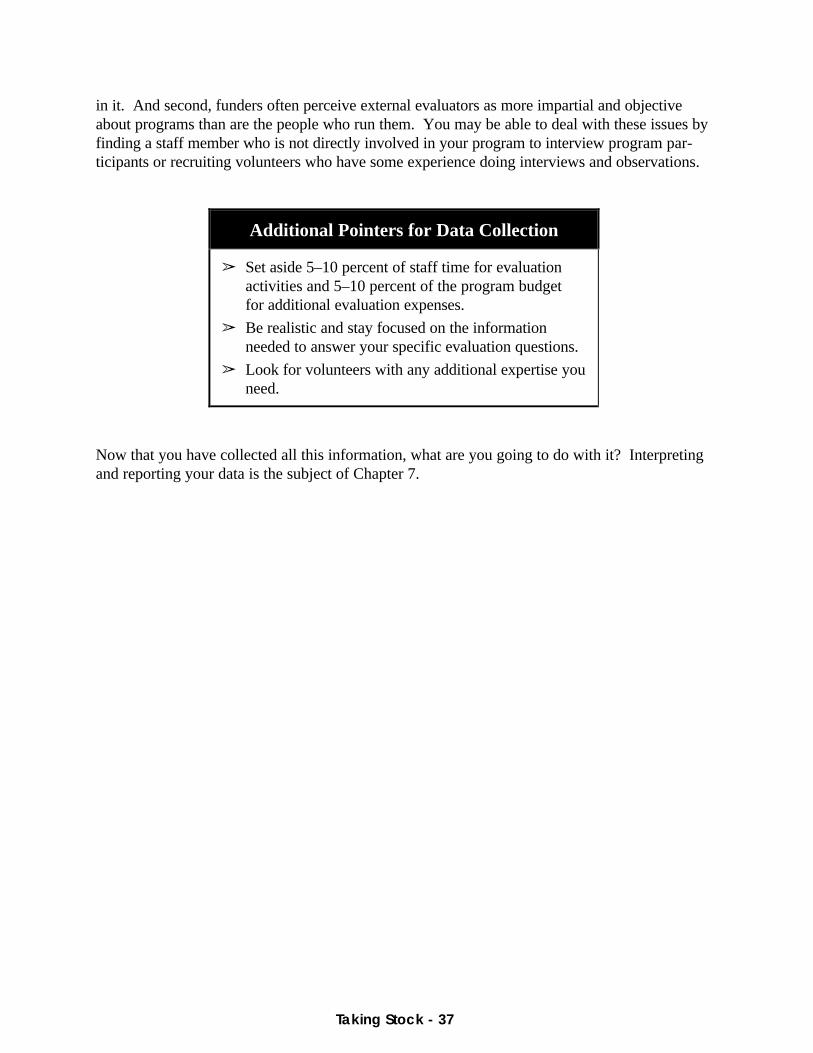
in it. And second, funders often perceive external evaluators as more impartial and objectiveabout programs than are the people who run them. You may be able to deal with these issues byfinding a staff member who is not directly involved in your program to interview program par-ticipants or recruiting volunteers who have some experience doing interviews and observations.
Additional Pointers for Data Collection
â Set aside 5–10 percent of staff time for evaluationactivities and 5–10 percent of the program budgetfor additional evaluation expenses.
â Be realistic and stay focused on the informationneeded to answer your specific evaluation questions.
â Look for volunteers with any additional expertise youneed.
Now that you have collected all this information, what are you going to do with it? Interpretingand reporting your data is the subject of Chapter 7.

Taking Stock - 38
Notes

Taking Stock - 39
Chapter Seven
MAKING SENSE OF THE EVIDENCEInterpreting and Reporting Your Data
• Looking for themes• Interpreting data• Putting it together• Reporting your results
Framing theEvaluation
Framing theEvaluation
DefiningGoals andObjectives
DefiningGoals andObjectives
Finding theEvidence
Finding theEvidence
MakingSense of
theEvidence
MakingSense of
theEvidence
➠➠➠
One thing is for certain—all of the formative and summative data that you collect can quickly addup, even for a small program. What does it all tell you? How can you use it to judge yourprograms? How can you present it to your board, your funders, the community, and others whomight have a stake in your efforts?
Looking for Themes
As part of the documentation and formative evaluation, you will have accumulated some impor-tant information that can help you make sense of things. Reviewing the data periodically as itaccumulates has several advantages: it helps you to begin to identify themes; it makes the analysisprocess less intimidating than if you wait until all of the data have been collected; and mostimportantly, it enables you to use the results to improve your program.
Your first step in data analysis will be to look for recurring themes. As you review data fromdocuments, observations, interviews, and surveys, some ideas will occur more often than others. Learning to recognize these patterns, and the relevancy of this information as it emerges in eachof these formats, is crucial to your evaluation. These key themes are what you must capture inyour evaluation report.
What is the most important thing to remember when interpreting and reporting your data? Theintermediate indicators and final program outcomes that you defined at the beginning of yourprogram! Framing your thinking and your results in terms of these can help you to understandand present your data clearly.

Taking Stock - 40
Be Flexible
In your review of formative data,you may discover key issuesother than the ones you originallythought to look at when you de-signed your evaluation. It is im-portant to be flexible enough toexplore these unexpected issues,within the limits of your re-sources. Be sure to note newideas, different patterns orthemes, and questions that needfurther investigation. Interviewor observation guides andsurveys can be adjusted over timein response to what you learn through the review and interpretation of your formative data.
Putting It Together
Once you have taken the trouble to collect data from a variety of sources (students, staff, parents,or others), it is important to look at all of these perspectives together to get a full picture of yourprogram. The various pieces of the evaluation (formative and summative) and each data collec-tion activity (document review, observations, interviews, and surveys) all add up to tell youabout the quality and success of your program. Looking at all of this evidence together and con-sidering it in terms of your objectives will enable you to say with some accuracy whether or notyour program achieved what you intended.
Looking At It All Together
Studentquestionnaires
Studentquestionnaires
Interviews withstudents, teachers,
and parents
Interviews withstudents, teachers,
and parents
Observations ofstudents in programevents, classes, andin other interactions
Observations ofstudents in programevents, classes, andin other interactions
Records of par-ticipating studentswho volunteer forleadership roles
Records of par-ticipating studentswho volunteer forleadership roles
ProgramObjective:
To increase theleadership skills ofstudent participants
Learning As You Go
During the summer camps for middle school students andtheir mentors, Youth Action Today! found that parental sup-port and involvement was particularly strong this year. Unlikeprevious years, program staff actually had the luxury ofselecting volunteers from a pool of over twenty parents whoagreed to help. The staff originally planned to survey allparents as part of their evaluation. However, when they no-ticed the increase in parental support this year, theychanged their evaluation plan to include interviews. Thestaff decided to conduct interviews with a sample of parentsto get more in-depth information on what prompted theirinvolvement in the program this year.

Taking Stock - 41
The amount of time that you can devote to this process will depend on the level of resources yourCBO has. For example, a small CBO may just do a quick review of interview notes to get themain points; a CBO with extensive resources and staff might do a more in-depth analysis—summarizing each interview in writing, developing charts that compare the responses of differentgroups of people, and writing up common themes that emerge from the interviews.
Working With What You’ve Got … Again
In some cases, interpreting the data you collect may require some additional expertise. For ex-ample, science or mathematics content may play a central role in some program activities; havingknowledge in these areas may help with the analysis of student misconceptions about certaintopics.
In a case like this, you might want to discuss your observations or share observation notes withsomeone who has this expertise and can help shed light on your descriptions of student questionsor discussions. (Better yet, have these persons do the observations.) In a larger CBO, there maybe individuals on staff who can help. If you do not have this expertise on staff, you might look toyour CBO’s board members or volunteers who may bring these skills to your organization.
Telling the Story: How to Report Your Evaluation Results
Interpreting your evaluation data for in-house use can be done informally, but making it availableand useful to others requires a more polished product. Formal evaluation reports can provide in-formation to your board members, the community, and your funders about the program’s prog-ress and success. Portions of these reports can also be a valuable public relations tool. Whendistributed to newspapers or other media, this information can increase community awareness andsupport for your organization’s programs.
Here are several things you will want to include in your evaluation report:
â The objectives of your program and your targeted audience
â What data you collected for your evaluation and how it was collected
â The evaluation results in terms of program goals and objectives
â Plan for using the evaluation to improve the program
In addition to these pieces, you will want to include a description of the context in which yourprogram occurs. This might consist of a brief summary of needs assessment data, the demo-graphic and socioeconomic characteristics of the community and your program participants, anddocumentation of the level of impact (such as the number of young people served compared tothe number of youth in the community). Your report should also highlight tactics you used toattract your targeted audience, as well as other strategies to ensure that your program was well-implemented.
Taking Stock - 42
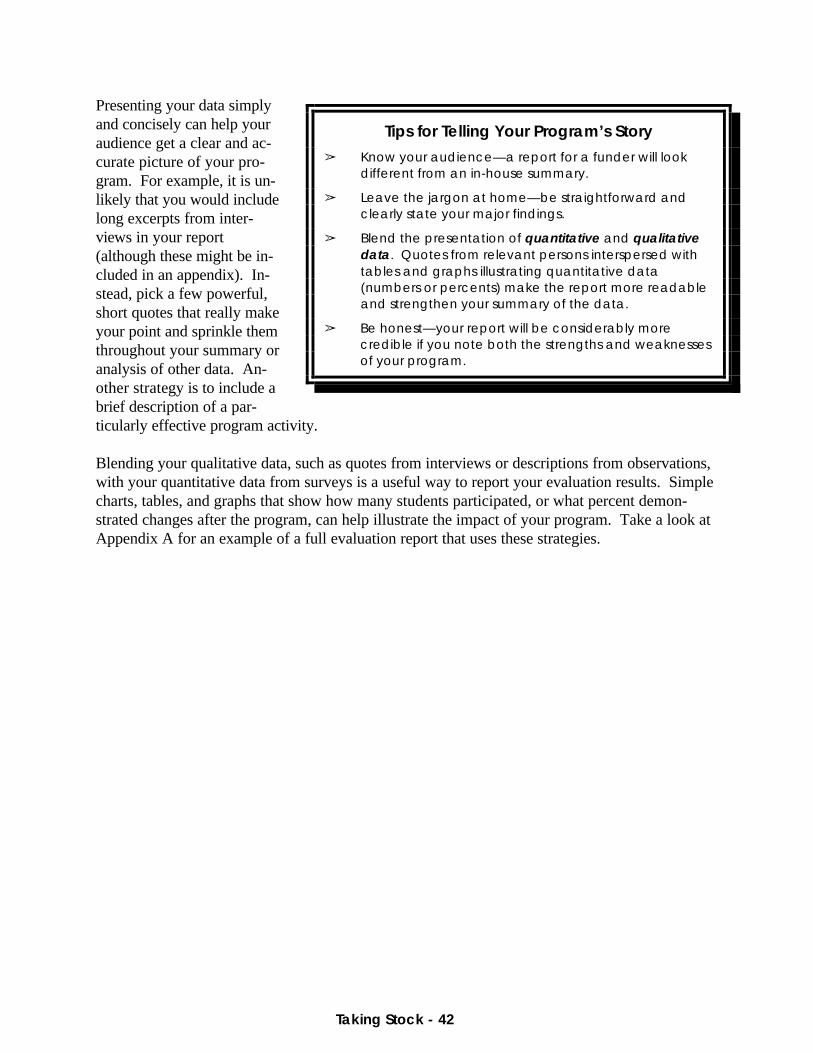
Presenting your data simplyand concisely can help youraudience get a clear and ac-curate picture of your pro-gram. For example, it is un-likely that you would includelong excerpts from inter-views in your report(although these might be in-cluded in an appendix). In-stead, pick a few powerful,short quotes that really makeyour point and sprinkle themthroughout your summary oranalysis of other data. An-other strategy is to include abrief description of a par-ticularly effective program activity.
Blending your qualitative data, such as quotes from interviews or descriptions from observations,with your quantitative data from surveys is a useful way to report your evaluation results. Simplecharts, tables, and graphs that show how many students participated, or what percent demon-strated changes after the program, can help illustrate the impact of your program. Take a look atAppendix A for an example of a full evaluation report that uses these strategies.
Tips for Telling Your Program’s Story
â Know your audience—a report for a funder will lookdifferent from an in-house summary.
â Leave the jargon at home—be straightforward andclearly state your major findings.
â Blend the presentation of quantitative and qualitativedata. Quotes from relevant persons interspersed withtables and graphs illustrating quantitative data(numbers or percents) make the report more readableand strengthen your summary of the data.
â Be honest—your report will be considerably morecredible if you note both the strengths and weaknessesof your program.

Taking Stock - 43
Notes

Taking Stock - 44
Notes

Taking Stock - 45
Chapter Eight
APPLYING THIS MANUALHow One CBO Did It
In earlier chapters, we discussed the various pieces that make up program evaluation. Now weare going to pull it all together in a way that lets you see how a CBO might choose to evaluate aprogram and what an evaluation looks like—from start to finish. The organization and programare small, and as a result, so is the evaluation. Below is a snapshot of our fictional CBO andprogram to help you compare it to your own in terms of staff, budget, and other resources.
Trash for Cash
Youth and Communities Alive! (YACA) is a small community-based organization located in aninner-city housing project. With a total operating budget of $50,000-$100,000 a year, YACA’s in-dividual program budgets range from $500 to $10,000. Programs typically target low-incomeAfrican American and Latino youth and are funded by churches and community organizations. Program activities often take place at nearby locations such as the housing project’s TV loungeand the playgrounds scattered throughout the community. Program staff at YACA include apart-time director, some paid and volunteer assistants, and volunteer program coordinators.
YACA’s director, Mrs. Alvarez, recently received funding from a local church for a program de-signed to address two concerns expressed by community members at local meetings—cleaningup the neighborhood and providing constructive activities for youth to serve as an alternative tothe street. The program was called “Trash for Cash.”
Trash for Cash (TFC) included a number of activities. Most TFC sessions began with a brief lessontaught by Mrs. Alvarez and a volunteer on the importance of recycling or other environmentaltopics. Over the course of the school year, seven guest speakers from the community madepresentations about conservation, waste management, water quality, recycling, and other re-lated issues. Subsequent sessions with program staff reviewed what students had learned in thesepresentations, and how the information applied to their own lives.
In addition to these lessons, participating youth were given a central role in all of the clean-upand recycling activities. In doing this, YACA staff hoped to develop a sense of neighborhoodpride and ownership among the youth. Students organized a weekly community collection oftrash and recyclable cans and bottles, and encouraged recycling in their homes. They also kepttrack of the pounds of recyclables collected, using mathematics skills to weigh and recordamounts and measure progress toward their 1,000-pound goal. Students also kept accountingrecords of incoming money for exchanged recyclables, and outgoing expenses for trash bags,refreshments, and other minor outlays.
Reaching the 1,000-pound goal in recyclable materials entitled participants who attended atleast half of the clean-up sessions to a free ticket to an NBA basketball game. The TFC programbudget of $2,000 covered staff time for Mrs. Alvarez, supplies, a small honorarium paid to eachguest speaker, and the cost of the NBA tickets.

Taking Stock - 46
Trash for CashTarget Audience: High school studentsMain Strategy: Weekly after-school sessionsNo. of Participants: 25Duration: One academic yearCost: $2,000
Framing the Evaluation
Creating a program to match community needs was the first step for YACA. To do that, Mrs.Alvarez first considered the priorities identified by community members, and the population mosttargeted for these needs.
Needs Assessment
Identified Needs: â Constructive youth activities
â Cleaner community environment
Target Population: â High school students
Mrs. Alvarez also consulted her board of directors—a broad spectrum of community representa-tives, including school and agency staff, parents, and two students. Board discussions aboutcommunity needs, as well as youth’s needs and prospects for the future, helped focus programgoals and objectives. As a result of this dialogue, Mrs. Alvarez added an academic enrichmentcomponent to the program which included everyday applications of science and mathematics, andan expanded view of what science is and what scientists do.
Defining Goals and Objectives
YACA pinpointed the major goal and several objectives for the Trash for Cash program.
Goal: Improve youths’ future options in the community and in school
Objectives:
1. To develop a sense of ownership and pride in the community among partici-pating youths
2. To expand students’ awareness of science and mathematics applications ineveryday life
3. To clean up the neighborhood
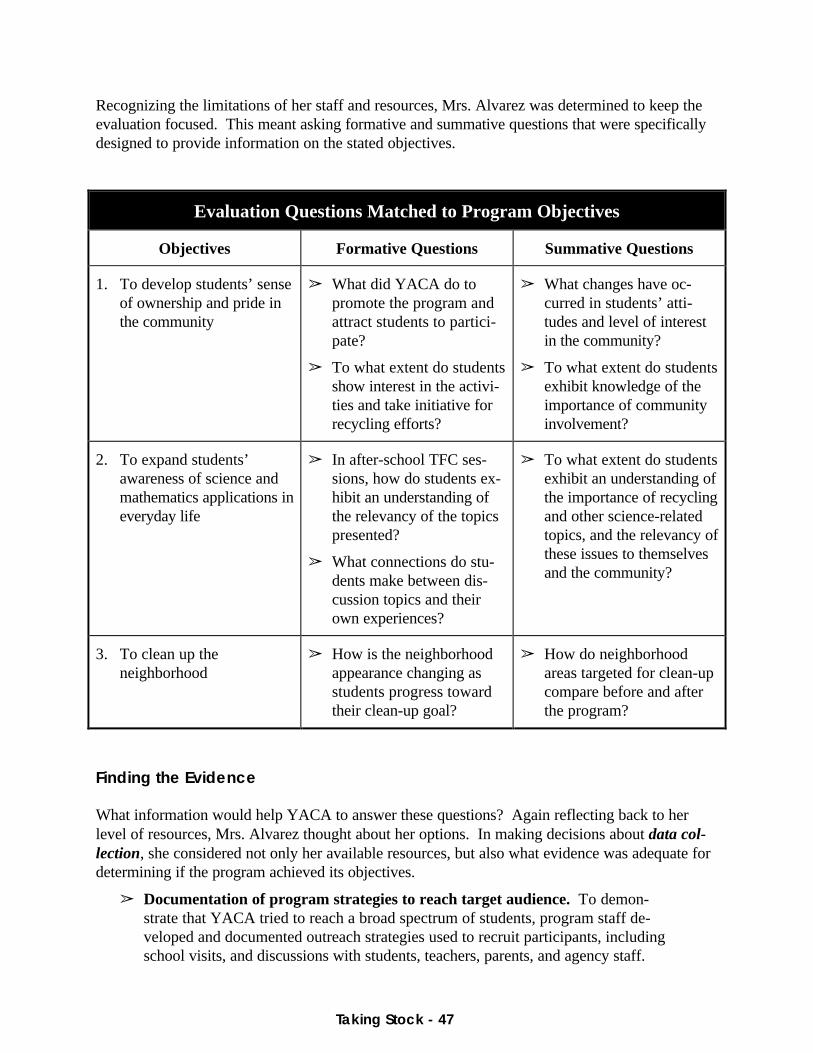
Taking Stock - 47
Recognizing the limitations of her staff and resources, Mrs. Alvarez was determined to keep theevaluation focused. This meant asking formative and summative questions that were specificallydesigned to provide information on the stated objectives.
Evaluation Questions Matched to Program Objectives
Objectives Formative Questions Summative Questions
1. To develop students’ senseof ownership and pride inthe community
â What did YACA do topromote the program andattract students to partici-pate?
â To what extent do studentsshow interest in the activi-ties and take initiative forrecycling efforts?
â What changes have oc-curred in students’ atti-tudes and level of interestin the community?
â To what extent do studentsexhibit knowledge of theimportance of communityinvolvement?
2. To expand students’awareness of science andmathematics applications ineveryday life
â In after-school TFC ses-sions, how do students ex-hibit an understanding ofthe relevancy of the topicspresented?
â What connections do stu-dents make between dis-cussion topics and theirown experiences?
â To what extent do studentsexhibit an understanding ofthe importance of recyclingand other science-relatedtopics, and the relevancy ofthese issues to themselvesand the community?
3. To clean up theneighborhood
â How is the neighborhoodappearance changing asstudents progress towardtheir clean-up goal?
â How do neighborhoodareas targeted for clean-upcompare before and afterthe program?
Finding the Evidence
What information would help YACA to answer these questions? Again reflecting back to herlevel of resources, Mrs. Alvarez thought about her options. In making decisions about data col-lection, she considered not only her available resources, but also what evidence was adequate fordetermining if the program achieved its objectives.
â Documentation of program strategies to reach target audience. To demon-strate that YACA tried to reach a broad spectrum of students, program staff de-veloped and documented outreach strategies used to recruit participants, includingschool visits, and discussions with students, teachers, parents, and agency staff.

Taking Stock - 48
Participant information sheets also gathered information about the age, gender, andrace/ethnicity of participants.
â Attendance sheets. Mrs. Alvarez considered this essential to determine if theprogram was meeting attendance goals. If attendance dropped off, this mightsignal the need for changes in the program or in program logistics. Similarly,attendance sheets could tell staff if particular groups of students (for example, girlsor boys) were attending less often so that staff could adapt program strategiesaccordingly.
â Student journals or student interviews or student questionnaires. Any one ofthese might help tell Mrs. Alvarez if students liked the program. She decidedagainst interviews because they were too labor-intensive. For the same reason, shedecided not to do student journals. She settled on a short questionnaire at theend of the program with four questions that asked students what they liked bestand least about the program, what they had learned, and how they would rate theprogram.
â Observations of after-school sessions. Mrs. Alvarez thought it was important totry to document changes in student attitudes toward science and their awareness ofthe relevancy of science. To do this, she recruited two members of her board withteaching experience to observe and report on sessions at the beginning and at theend of the program.
â Tallying the recyclables. This was essential for knowing whether or not studentswere progressing toward their 1,000 pound goal, and presumably, whether or notthe neighborhood was getting cleaned up.
â Before and after pictures of designated “ugly” spots in the community. Mrs.Alvarez liked this idea a lot, thinking that “a picture is worth a thousand words.” She could go out with the students on the first and last day of the after-school ses-sions to take the pictures. It seemed like a good way to get participants involvedfirst hand, and a quick and easy way to collect data, too.
Interpreting and Reporting the Data
In the end, Mrs. Alvarez was pleased with her simple evaluation. While it did not give her a lot ofinformation about the program directly from the students, the attendance records kept her in-formed about their level of participation. For example, when attendance slipped in the fall, sheasked some of the participants if there was a problem with the program. Discovering that TFCsessions conflicted with some students’ tutoring sessions, she adjusted the schedule. With thischange in logistics, the program was able to meet its goal for weekly attendance.
Observations by board members revealed some changes in students’ level of interest and partici-pation in discussions, with more students actively participating at the end of the program than inearlier observations. In addition, students’ comments seemed to demonstrate a greater awarenessof the relevancy of science. For example, observers noted that many of the participants volun-tarily made connections between the discussion topic and their own personal experiences.
Taking Stock - 49
Student questionnaires provided evidence that supported observations. Students reported thatthey liked working together to improve the neighborhood, had learned about the importance ofrecycling, and had gained an expanded view of what science is and how it relates to their lives.
Tallying recyclables kept students involved in the process as they watched the group move towardtheir 1,000-pound goal, and also gave them a chance to use mathematics skills. According toMrs. Alvarez, the pictures she and her students took were the best part of the evaluation, pro-viding “hard” evidence that the neighborhood was cleaner.
There is one thing that Mrs. Alvarez would have changed in her evaluation design—she wouldhave recruited volunteers to help her tally the survey results. Four questions per questionnairedidn’t seem like much, but given all of her other responsibilities, tallying the responses from 25participants was too much to do. She still thought the survey was important—it was her onlysource of data that came directly from the students and that provided information on how theprogram had affected them. In hindsight, she would have lined up several board members asvolunteers to assist.
The evaluation of Trash for Cash showed that the program had a positive impact on participatingstudents and the community. With churches emphasizing community involvement and schoolshighlighting environmental awareness, Mrs. Alvarez was reluctant to say that her program was thesole cause of these changes. However, the evidence collected in the evaluation demonstrated thatTrash for Cash had successfully met its objectives and it is likely that the program contributed tothe positive outcomes.
How can Mrs. Alvarez best present the evaluation results to showcase the program’s success toher board and her funders? Take a look at a final evaluation report for Trash for Cash inAppendix A.
Sample Data Collection Instrumentsfor Trash for Cash
â Participant Information Sheet
â Attendance Sheet
â Student Questionnaire
â Tally Sheet for Recyclables
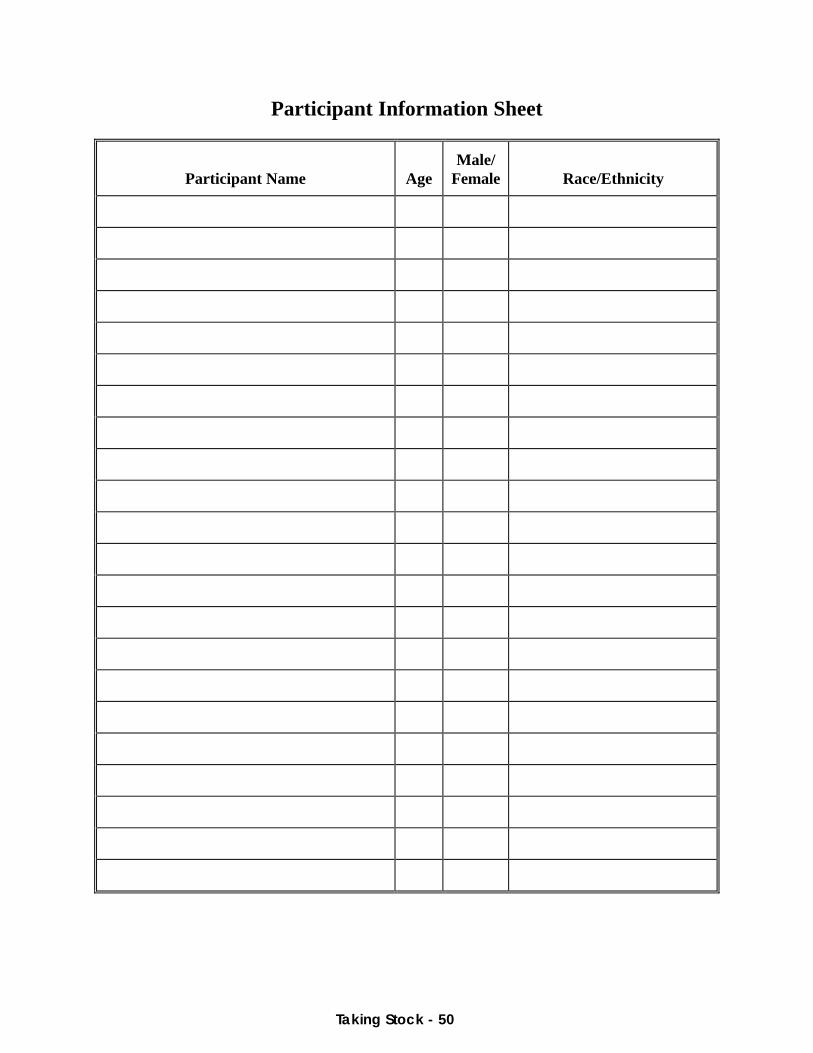
Taking Stock - 50
Participant Information Sheet
Participant Name AgeMale/
Female Race/Ethnicity
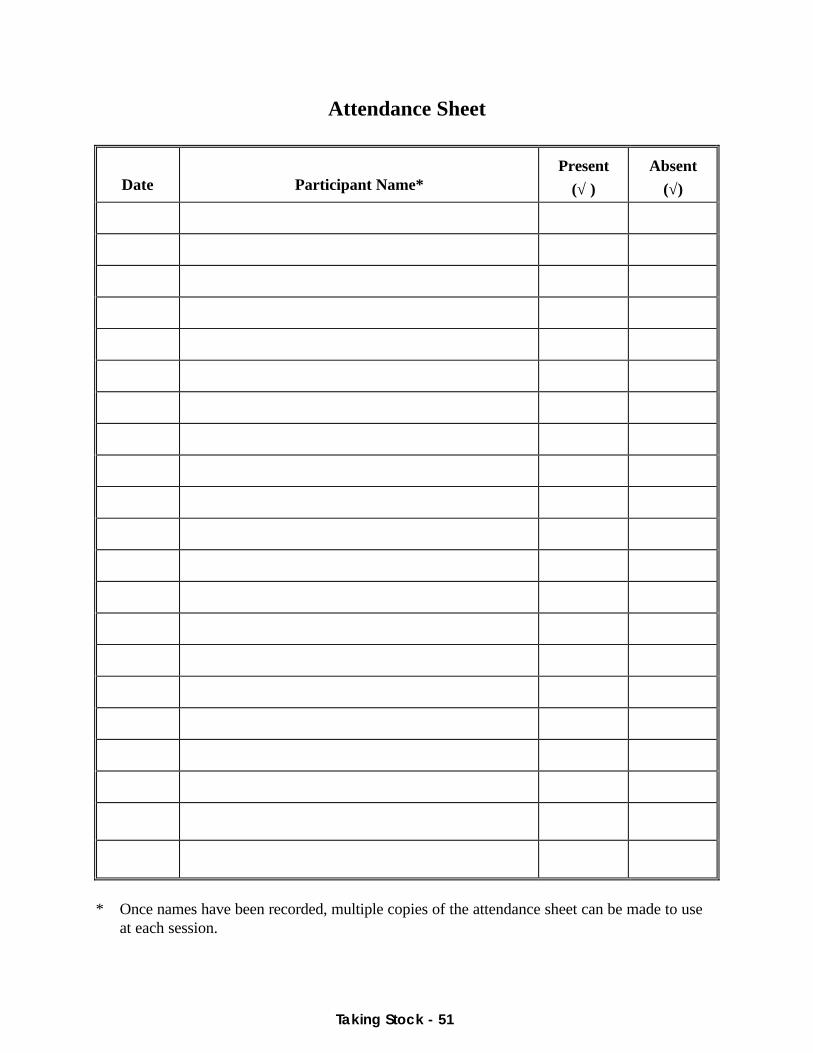
Taking Stock - 51
Attendance Sheet
Date Participant Name*Present
(√ )
Absent
(√)
* Once names have been recorded, multiple copies of the attendance sheet can be made to useat each session.
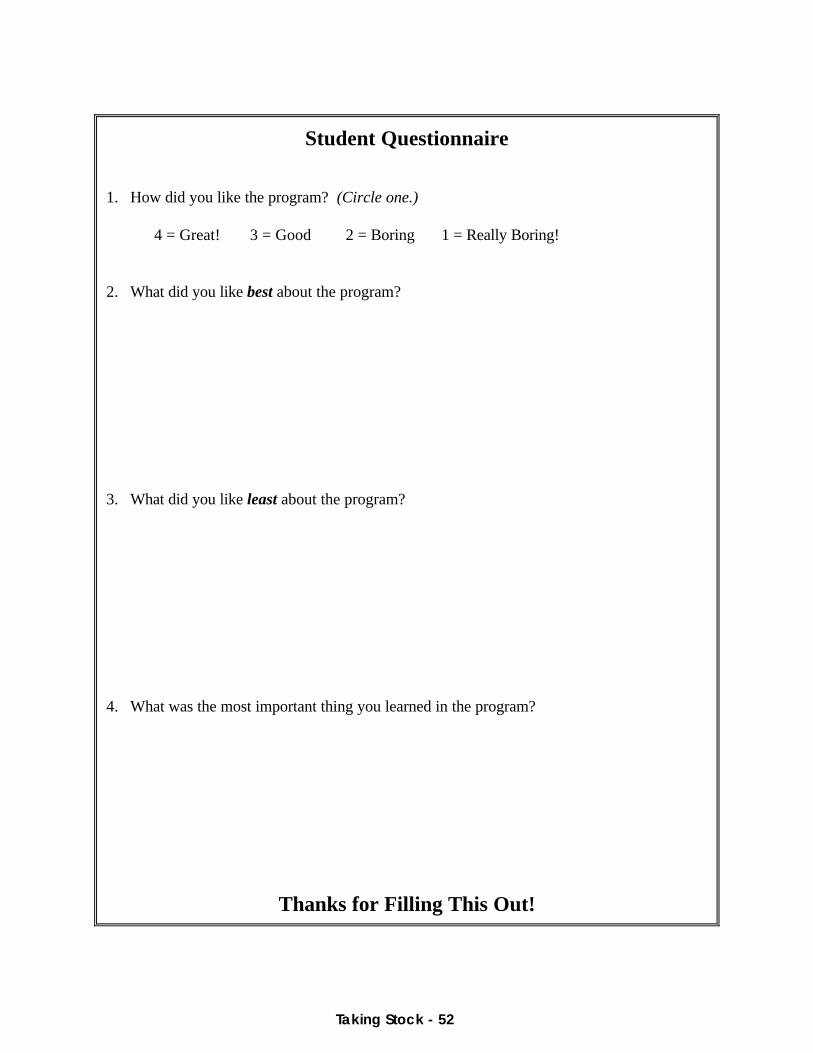
Taking Stock - 52
Student Questionnaire
1. How did you like the program? (Circle one.)
4 = Great! 3 = Good 2 = Boring 1 = Really Boring!
2. What did you like best about the program?
3. What did you like least about the program?
4. What was the most important thing you learned in the program?
Thanks for Filling This Out!

Taking Stock - 53
Tally Sheet for Recyclables
Date
Weightof
Cans
Weightof
Bottles
AmountReceived
Today
Total-to-DateReceived forRecyclables

Taking Stock - 54
Notes

Taking Stock - 55
Chapter Nine
APPLYING THIS MANUAL IN A BIGGER WAYExpanding the Evaluation Design
In Chapter Eight, we saw how one CBO designed an effective evaluation matched to the limitedresources and staff available for the program. How might Mrs. Alvarez plan an evaluation for alarger program with more resources? This chapter looks at what she might do differently in herevaluation of an expanded Trash for Cash Program. Below is a description of the new programrun by our fictional CBO, Youth and Communities Alive! (YACA). See Appendix B for YACA’sproposal to expand the program.
More Trash for Cash
After seeing the positive results in the neighborhood’s appearance and observing an increasedinterest among youth in community improvement, Mrs. Alvarez wrote a proposal to expand theprogram (see Appendix B). The More Trash for Cash (MTFC) program increased the number ofyouth served and lasted two years. Youth and Communities Alive! received a total of $20,000over two years from the United Way and a local foundation for the More Trash for Cash program.
More Trash for Cash included several new features. Mrs. Alvarez increased the amount of scienceinstruction in the after-school sessions. Each session began with hands-on activities that engagedstudents in thoughtful investigations into various environmental topics. Two high school scienceteachers were recruited to teach some sessions, as was a professor from a nearby university. Witha larger program budget, Alvarez was able to pay the instructors a stipend. In addition, she linedup more guest speakers and arranged for two field trips each year.
The expanded program included a new group of 20 middle school students and 25 high schoolstudents each year. Five high school students who had participated in the original programcame back as program assistants in the first year; during the second year, five new high schoolstudents were recruited to fill these positions. The older students took on leadership roles, includ-ing mentoring the new students and helping Mrs. Alvarez and two volunteers with program co-ordination. Each of the student assistants was paid a small stipend for their work. Mrs. Alvarez alsohired a program assistant to work 8 hours a week.
Program activities were similar to the original Trash for Cash—during year one, students selectednew “ugly” spots for clean-up. Students were given their choice of incentives for reaching a newgoal of 1,500 pounds of recyclables each year—NBA basketball game tickets, a ride on a localpaddle-wheel river boat, or tickets to a performance by an inner city youth theater group. Inaddition, during the second year of the program, greater emphasis was placed on communityawareness and involvement. Several of the high school students made presentations atcommunity meetings and talked to local businesses about recycling and MTFC’s efforts.
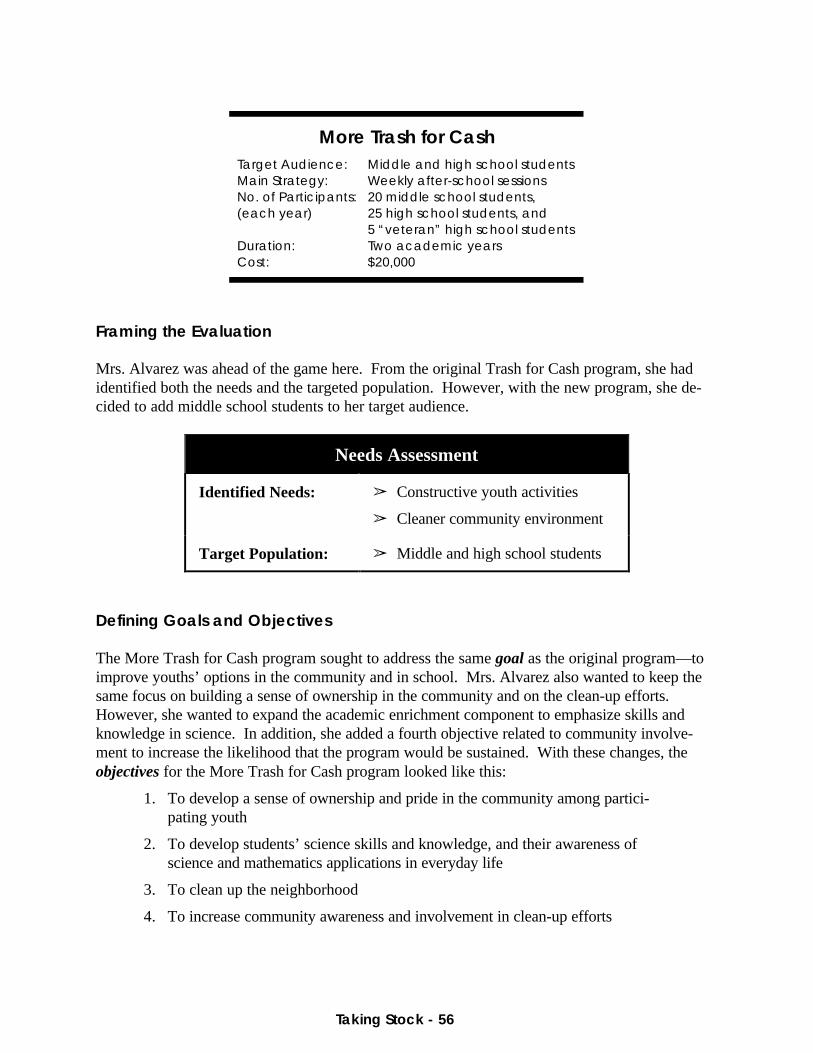
Taking Stock - 56
More Trash for CashTarget Audience: Middle and high school studentsMain Strategy: Weekly after-school sessionsNo. of Participants: 20 middle school students,(each year) 25 high school students, and
5 “veteran” high school studentsDuration: Two academic yearsCost: $20,000
Framing the Evaluation
Mrs. Alvarez was ahead of the game here. From the original Trash for Cash program, she hadidentified both the needs and the targeted population. However, with the new program, she de-cided to add middle school students to her target audience.
Needs Assessment
Identified Needs: â Constructive youth activities
â Cleaner community environment
Target Population: â Middle and high school students
Defining Goals and Objectives
The More Trash for Cash program sought to address the same goal as the original program—toimprove youths’ options in the community and in school. Mrs. Alvarez also wanted to keep thesame focus on building a sense of ownership in the community and on the clean-up efforts. However, she wanted to expand the academic enrichment component to emphasize skills andknowledge in science. In addition, she added a fourth objective related to community involve-ment to increase the likelihood that the program would be sustained. With these changes, theobjectives for the More Trash for Cash program looked like this:
1. To develop a sense of ownership and pride in the community among partici-pating youth
2. To develop students’ science skills and knowledge, and their awareness ofscience and mathematics applications in everyday life
3. To clean up the neighborhood
4. To increase community awareness and involvement in clean-up efforts
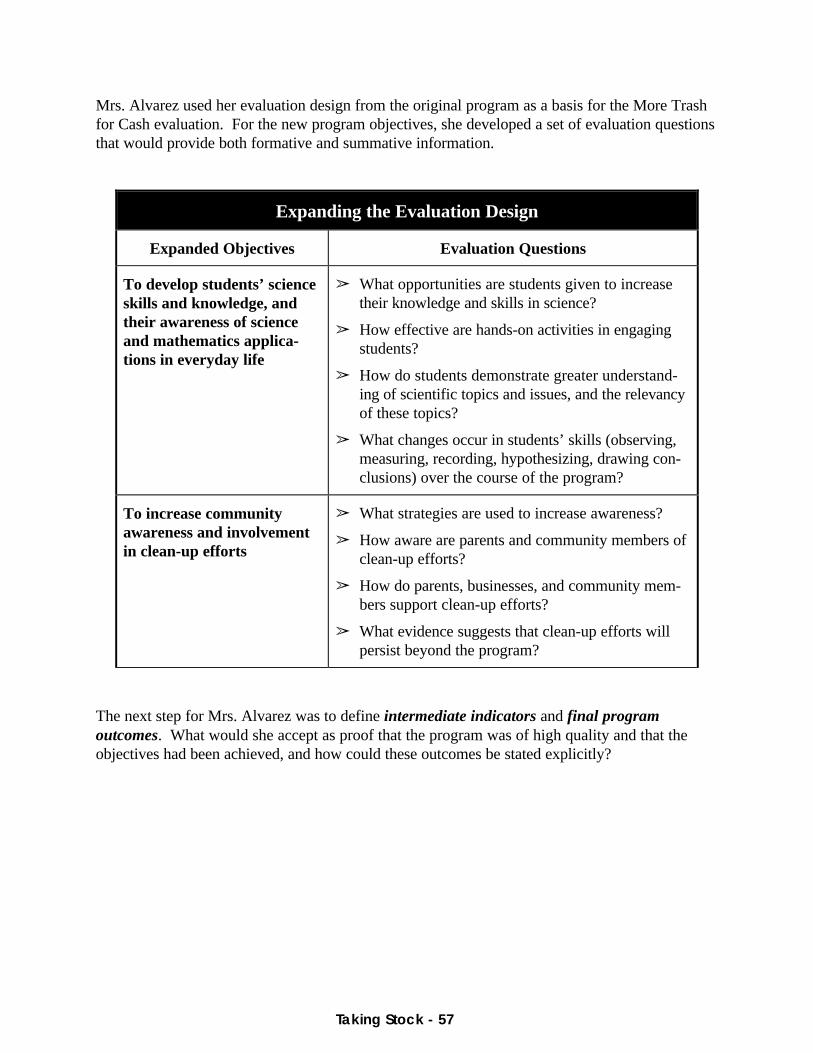
Taking Stock - 57
Mrs. Alvarez used her evaluation design from the original program as a basis for the More Trashfor Cash evaluation. For the new program objectives, she developed a set of evaluation questionsthat would provide both formative and summative information.
Expanding the Evaluation Design
Expanded Objectives Evaluation Questions
To develop students’ scienceskills and knowledge, andtheir awareness of scienceand mathematics applica-tions in everyday life
â What opportunities are students given to increasetheir knowledge and skills in science?
â How effective are hands-on activities in engagingstudents?
â How do students demonstrate greater understand-ing of scientific topics and issues, and the relevancyof these topics?
â What changes occur in students’ skills (observing,measuring, recording, hypothesizing, drawing con-clusions) over the course of the program?
To increase communityawareness and involvementin clean-up efforts
â What strategies are used to increase awareness?
â How aware are parents and community members ofclean-up efforts?
â How do parents, businesses, and community mem-bers support clean-up efforts?
â What evidence suggests that clean-up efforts willpersist beyond the program?
The next step for Mrs. Alvarez was to define intermediate indicators and final programoutcomes. What would she accept as proof that the program was of high quality and that theobjectives had been achieved, and how could these outcomes be stated explicitly?

Taking Stock - 58
Indicators and Outcomes for the More Trash for Cash Program
Objectives
1. To develop a sense of ownership and pride in the community among participatingyouth
2. To develop students’ science skills and knowledge, and their awareness of scienceand mathematics applications in everyday life
3. To clean up the neighborhood
4. To increase community awareness and involvement in clean-up efforts
IntermediateIndicators
â Number of students who attend after-school sessions and collect trashstays the same or increases over course of program. (Obj. 1)
â Students demonstrate greater leadership in activities during the year: takeinitiative in organizing/doing activities. (Obj. 1)
â Number of students who actively participate in discussions, link sciencewith personal experiences increases during the year. (Obj. 2)
â Students exhibit greater understanding of science-related topics by askingmore high level questions; demonstrate improvements in skills throughhands-on science activities. (Obj. 2)
â Pounds of recyclables collected increases during school year. (Obj. 3)
â Amount of trash in designated “ugly” spots in the community decreasesduring the year. (Obj. 3)
â Community expresses awareness of clean-up at neighborhood meetings;number of businesses that actively support recycling increases. (Obj. 4)
Final Outcomes â Seventy-five percent of the students attend at least half of the weeklysessions. (Obj. 1)
â At least three-quarters of the students express awareness of the impor-tance of community involvement. (Obj. 1)
â At least three-quarters of the students express an understanding of therelevancy of science, and demonstrate improved skills and attitudes to-ward science. (Obj. 2)
â At least 1,500 pounds of recyclables are collected by end of each schoolyear. (Obj. 3)
â Neighborhood “ugly” spots are cleaned up by end of each year. (Obj. 3)
â Community actively supports clean-up; number of businesses involved inrecycling increases by 50 percent by end of program. (Obj. 4)
Taking Stock - 59
Finding the Evidence
Mrs. Alvarez wanted to get a better feel for the data collection activities to make sure that herstrategies would yield information about the chosen indicators and outcomes and that she wasbeing realistic in her plans. It was one thing to list everything they would do to collect informa-tion; it would be more difficult to pin down when these activities would occur and how often. Mrs. Alvarez again wanted to be sure to collect both qualitative and quantitative data. She alsoknew that she would need this information each year of the program to provide data about eachgroup of student participants.
In planning the data collection activities, Mrs. Alvarez immediately fell intothe “starting big” trap. She thought about conducting student focusgroups twice each month to see how students liked the program. Shethought monthly student questionnaires could also help gauge interest inthe program, as well as impact. Survey forms could be short and simpleand provide regular feedback to staff. Even so, she realized, it would be alot to read and tally every month. And someone would have to facilitatestudent discussion groups and report the information.
Mrs. Alvarez knew she had to cut back. Instead of the frequent question-naires and focus groups, she decided to ask instructors to set aside 10–15minutes of class time every other month to let students talk about the pro-gram. The class could be separated into several smaller groups to allowbetter participation. Students would talk about the program among them-selves; one student would be designated as the recorder to report the majorthemes from each group in writing. The high school program assistantscould help facilitate the group discussions.
Mrs. Alvarez liked this strategy because it avoided the issue of studentstelling instructors what they did or didn’t like, and enabled them to talkabout their progress or where they needed help. Rotating the role of re-corder each month would provide students with an additional opportunityfor participation and leadership. To help focus their discussions, Mrs.Alvarez would develop a guide for them to write down their responses.
For each of her outcomes, Mrs. Alvarez went through this process. How can we collect the in-formation? Who will do it? What will it involve? How can it be streamlined to reduce the bur-den on both staff and participants?
In thinking about all of this, Alvarez realized that each data collection activity involved not onlycollecting the data, but also preliminary and follow-up work as well. For example:
â She would have to develop questionnaires, distribute them, make sure theywere completed and returned, and tally the results.
â Volunteers who did observations would need a simple guide to tell them whatto look for.
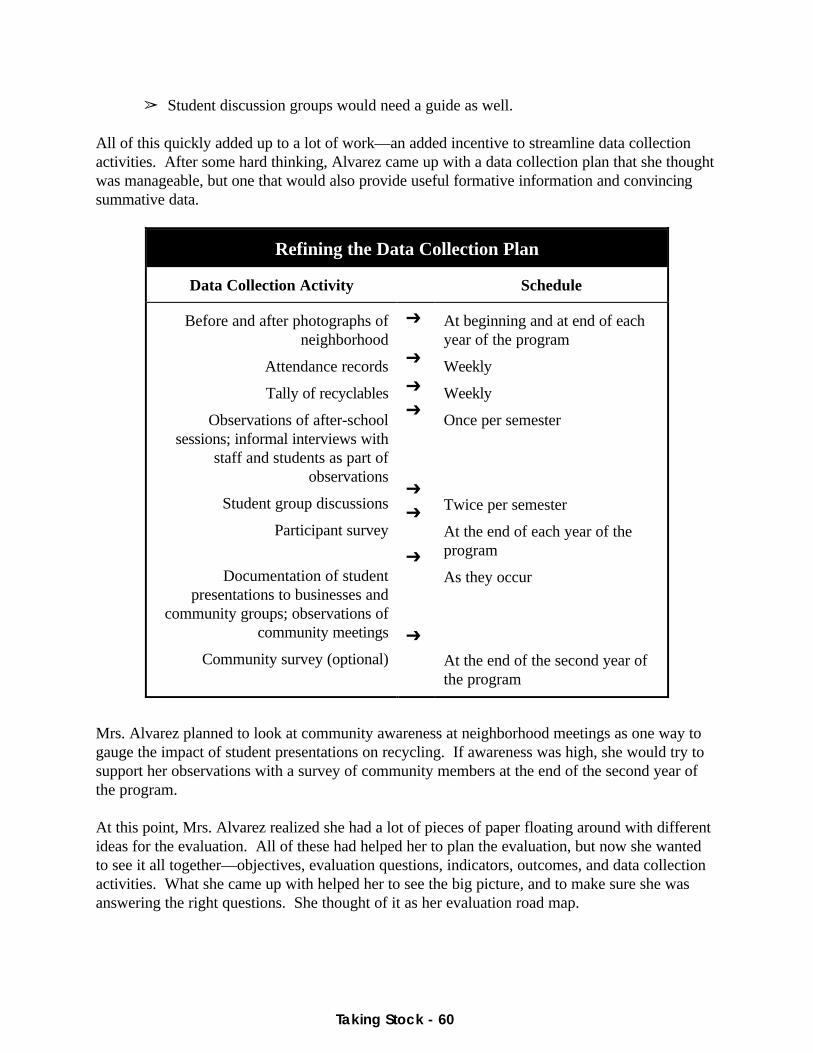
Taking Stock - 60
â Student discussion groups would need a guide as well.
All of this quickly added up to a lot of work—an added incentive to streamline data collectionactivities. After some hard thinking, Alvarez came up with a data collection plan that she thoughtwas manageable, but one that would also provide useful formative information and convincingsummative data.
Refining the Data Collection Plan
Data Collection Activity Schedule
Before and after photographs ofneighborhood
Attendance records
Tally of recyclables
Observations of after-schoolsessions; informal interviews with
staff and students as part ofobservations
Student group discussions
Participant survey
Documentation of studentpresentations to businesses and
community groups; observations ofcommunity meetings
Community survey (optional)
Ô
Ô
Ô
Ô
Ô
Ô
Ô
Ô
At beginning and at end of eachyear of the program
Weekly
Weekly
Once per semester
Twice per semester
At the end of each year of theprogram
As they occur
At the end of the second year ofthe program
Mrs. Alvarez planned to look at community awareness at neighborhood meetings as one way togauge the impact of student presentations on recycling. If awareness was high, she would try tosupport her observations with a survey of community members at the end of the second year ofthe program.
At this point, Mrs. Alvarez realized she had a lot of pieces of paper floating around with differentideas for the evaluation. All of these had helped her to plan the evaluation, but now she wantedto see it all together—objectives, evaluation questions, indicators, outcomes, and data collectionactivities. What she came up with helped her to see the big picture, and to make sure she wasanswering the right questions. She thought of it as her evaluation road map.

The Road Map: More Trash for Cash Evaluation Design
Objectives Evaluation Questions Intermediate Indicators Final Outcomes
1. To develop asense of owner-ship and pride inthe communityamong partici-pating youth
a) What did YACA do to promote the program andattract students to participate?
b) To what extent do students show interest in theactivities and take initiative for recycling efforts?
c) What changes have occurred in students’ attitudesand level of interest in the community?
d) To what extent do students exhibit knowledge ofthe importance of community involvement?
â Number of students whoattend after-school sessionsand collect trash stays thesame or increases overcourse of program.
â In observations, studentsdemonstrate greater lead-ership in activities duringthe year—take initiative inorganizing/doing activities.
â Seventy-five percent of thestudents attend at least halfof the weekly sessions.
â On surveys, at least three-quarters of the studentsexpress awareness of theimportance of communityinvolvement.
2. To develop stu-dents’ scienceskills and knowl-edge, and theirawareness of sci-ence and mathe-matics applica-tions in everydaylife
a) What opportunities are students given to increasetheir knowledge and skills in science?
b) How effective are hands-on activities in engagingstudents?
c) To what extent do students demonstrate greaterunderstanding of scientific topics and issues, andthe relevancy of these topics?
d) What changes occur in students’ skills (observing,measuring, recording, hypothesizing, drawingconclusions) over the course of the program?
e) What connections do students make between dis-cussion topics and their own experiences?
â Number of students whoactively participate in dis-cussions, link science withpersonal experiences in-creases during the year.
â In group discussions andobservations, students ex-hibit greater understandingof science-related topics byasking more high levelquestions; demonstrateimprovements in skillsthrough hands-on scienceactivities.
â On surveys, at least three-quarters of the studentsexpress an understandingof the relevancy of science.
â In observations, at leastthree quarters of studentsdemonstrate improvedskills and attitudes towardscience.
Takin
g Sto
ck - 61

The Road Map: More Trash for Cash Evaluation Design
Objectives Evaluation Questions Intermediate Indicators Final Outcomes
3. To clean up theneighborhood
a) How is the neighborhood appearance changing asstudents progress toward their clean-up goal?
b) How do neighborhood areas targeted for clean-upcompare before and after the program?
â Weekly tallies show thatpounds of recyclablescollected increases duringschool year.
â Informal interviews withstudents reveal amount oftrash in designated “ugly”spots decreases during theyear.
â Goal of 1,500 poundsreached; one hundred per-cent of the students achievegoal of free tickets.
â Before and after photo-graphs of neighborhoodshow differences.
4. To increasecommunityawareness andinvolvement inclean-up efforts
a) What strategies are used to increase awareness?
b) How aware are parents and community members ofclean-up efforts?
c) To what extent do parents, businesses, andcommunity members support clean-up efforts?
d) What evidence suggests that clean-up efforts willpersist beyond the program?
â In informal interviews andobservations at communitymeetings, parents andothers express awarenessof program.
â Number of businesses thatactively support recyclingincreases.
â On community survey, atleast 50 percent of com-munity members expressawareness of and supportfor recycling.
â Number of businesses in-volved in recycling in-creases by 50 percent byend of program.
Takin
g Sto
ck - 62
Taking Stock - 63
Interpreting and Reporting the Data
How did the evaluation turn out? Let’s take a look at the information gathered, how it was inter-preted to measure progress and impact, and what changes program staff made to improve theprogram, based on the evaluation data.
Objective 1
To develop a sense of ownership and pride in thecommunity among participating youth
Mrs. Alvarez considered the level of student participation each week as one indicator of programsuccess. During the first year, weekly attendance records revealed that participation decreasedfrom September to October. Student discussion groups held in October were a timely way to getsome information about what students liked and disliked about the program, and their suggestionsfor improvement.
Mrs. Alvarez learned from the students who were still attending that the absentees had tutoringactivities scheduled on Thursdays. Once she changed the collection day to Wednesdays, atten-dance improved. Forms filled out in student discussion groups in December, February, and Aprilindicated that participants liked the program more and more as the year progressed—they ex-pressed excitement about getting closer to their 1,500-pound goal and about the neighborhood’s“new look.”
Student surveys at the end of each program year gave participants an opportunity to talk abouthow the program had affected them. One question (“What did you like best about the program?”)elicited comments relating to the positive experiences provided by the program. Over half theparticipants said that cleaning up their neighborhood had made them “feel good.” Students alsoliked being part of a group and working together toward a common goal. Some said this was thefirst time they had ever “been a leader.” When asked about the most important thing they learned,students wrote about the value of working together to accomplish something. Finally, studentsliked the recognition they received which made them feel important, and in the words of onestudent, feeling “like I have something I can give to the community.”
Objective 2
To develop students’ science skills andknowledge, and their awareness of science and
mathematics applications in everyday life
Mrs. Alvarez learned from student discussion groups that some of the participants were havingdifficulty with hands-on activities that required mathematics skills. To remedy this, she decided to

Taking Stock - 64
have students work in teams of three, and mixed students with higher and lower mathematicsskills. Data from student discussion groups revealed that this solution helped many of the stu-dents improve their skills.
Observations by Mrs. Alvarez and a community volunteer once a semester also provided oppor-tunities for observing student interest and skills, and for talking informally with participants. Inher observation notes, Mrs. Alvarez repeatedly cited examples of students observing, measuring,recording, and drawing conclusions, and of students helping one another with these tasks. Alvarez also noted in her observations changes in students who appeared to be “mathematics-shy”at the beginning of the year, but who now participated fully in the activities. Other students’ en-thusiasm and participation had remained steady.
At least once a month, instructors took some class time to discuss with students what they werelearning about the environment, including the sources of pollution and the challenges involved inrecycling. Students noted that although they understood most of the scientific concepts discussedin after-school sessions, a few of the speakers had “talked over their head.” This was usefulinformation for lining up future speakers and making sure they were briefed on speaking at a levelthat was appropriate for an adolescent audience.
Classroom discussions became more lively during the year as students took more interest in theprogram and the topics discussed by guest speakers. Data from student discussion groups sup-ported observations of high levels of student interest in science-related topics, and an increase inthe number of students who related topics to their personal experiences. Finally, on question-naires almost two-thirds of the students said that the science activities were their favorite programactivity; slightly more than two-thirds said that the most important thing they had learned wasthat, working together, their actions could make a difference in the community.
Objective 3
To clean up the neighborhood
Each year of the program, five areas in the neighborhood were identified for clean-up. Mrs.Alvarez decided that taking photographs of these targeted sites at the beginning of the school yearwould provide good baseline data for the summative evaluation. Both years, the before and afterpictures showed that a great deal of progress had been made toward cleaning up the neighbor-hood.
Weekly tally sheets recorded by students and checked by instructors kept participants and staffaware of how the program was progressing toward its goal of 1,500 pounds of recyclables. Year-end results revealed that this goal was achieved each year, and tickets for the community eventswere awarded to all of the students.

Taking Stock - 65
Objective 4
To increase community awareness andinvolvement in clean-up efforts
YACA documented its MTFC community outreach strategies, including the number of presenta-tions made by students to community groups and businesses. Observations of neighborhoodmeetings and informal interviews with parents and community members at these meetings re-vealed that people noticed some changes in the way the community looked, even though somewere unaware of the MTFC program.
Based on the high level of awareness demonstrated by persons attending community meetingsduring the first year of the program, Mrs. Alvarez decided to go ahead with the survey of com-munity members. Students conducted a door-to-door survey in March of the second year of theprogram. Using a guide designed by Mrs. Alvarez, 25 student teams surveyed six householdseach for a total of 150 community members. Two volunteers helped tally the results. The sur-veys revealed that the majority of community members surveyed had noticed the change incommunity appearance and would be willing to participate in a recycling program.
Telling the More Trash for Cash Story: Presenting the Evaluation Results
The evaluation of More Trash for Cash showed that the program had a positive impact on theneighborhood, the participating students, and the community. A progress report for the first yearof More Trash for Cash can be found in Appendix C.
Sample Data Collection Instrumentsfor More Trash for Cash
â Student Group Discussion Guide
â Session Observation Guide
â Survey for Community Members
(See Chapter Eight for the following instruments)
â Participant Information Sheet
â Attendance Sheet
â Student Questionnaire
â Tally Sheet for Recyclables

Taking Stock - 66
Student Group Discussion Guide
Please talk about the following questions and decide as a group on the mostappropriate answer. The group “recorder” should write in your responses.
1. How do you like the More Trash for Cash Program? (Circle one.)
4 = Great! 3 = Good 2 = Boring 1 = Really Boring!
2. What do you like best about the program?
3. What is the most important thing you have learned in the program so far?
4. What suggestions do you have for making the program better?
Thanks for Filling This Out!

Taking Stock - 67
Session Observation Guide
1. Are students:interested?enthusiastic?bored?distracted?
2. What kinds of questions do students ask?
3. Do students demonstrate an understanding of the topics?
4. How do students work together?

Taking Stock - 68
Survey for Community Members
1. a) Have you noticed any changes in how the community looks? ____Yes ____No b) If yes, what has been the most noticeable difference? 2. a) Would you be willing to help save recyclables for a community recycling program? ____Yes ____No b) How would you be willing to help? Check all that apply. ___Will save bottles and cans ___Will help with clean-up efforts ___Will volunteer for program sessions ___Will make presentations ___Other (please explain): 3. Have you heard about a program called “More Trash for Cash”? If yes, what can you tell me
about it? (If they haven’t heard about the program, you can describe it to them.)
Thanks for Filling This Out!

Taking Stock - 69
Notes

Taking Stock - 70
Notes

Taking Stock - 71
Appendix A
FINAL EVALUATION REPORT

Taking Stock - 72
FINAL EVALUATION REPORT
“Trash For Cash” Final ReportWritten by Maria Alvarez
Director of Youth and Communities Alive!
Submitted to the Central United Methodist Church
“The Trash for Cash program really helped me come out of myself. Ididn’t know I could be a leader, but now I know I can.”
16-year-old female participant
Youth and Communities Alive! (YACA) is a small community-based organization dedicated toserving low-income minority youth. Last year, YACA received $2,000 from the Central UnitedMethodist Church to run the Trash for Cash (TFC) program. The program targeted high schoolstudents and lasted one academic year. TFC had three main objectives:
1. To develop a sense of ownership and pride in the community amongparticipating youths
2. To expand students’ awareness of science and mathematics applications ineveryday life
3. To clean up the neighborhood
We wanted to reach a broad spectrum of students, especially those who might not participate inan after-school program. To recruit participants, we made presentations in the schools, and metwith students, teachers, parents, and agency staff to get referrals. We wanted to try to get bothAfrican American and Latino youth from the neighborhood. In all we had 14 girls and 11 boys. Thirteen were African American, 8 were Latino, and 4 were white.
A total of 25 high school students participated in the TFC program, which included weekly col-lection of trash in the community during after-school sessions. Students collected recyclables andkept track of the number of pounds of recyclables that they turned in for cash at the local re-cycling center. Their goal was 1,000 pounds of recyclables, which would make them eligible fortickets to an NBA game.
Most TFC sessions began with a brief lesson about the importance of recycling or other envi-ronmental topics. Over the course of the school year, seven guest speakers from the communityvisited and made presentations about recycling, waste management for the city, water treatment,
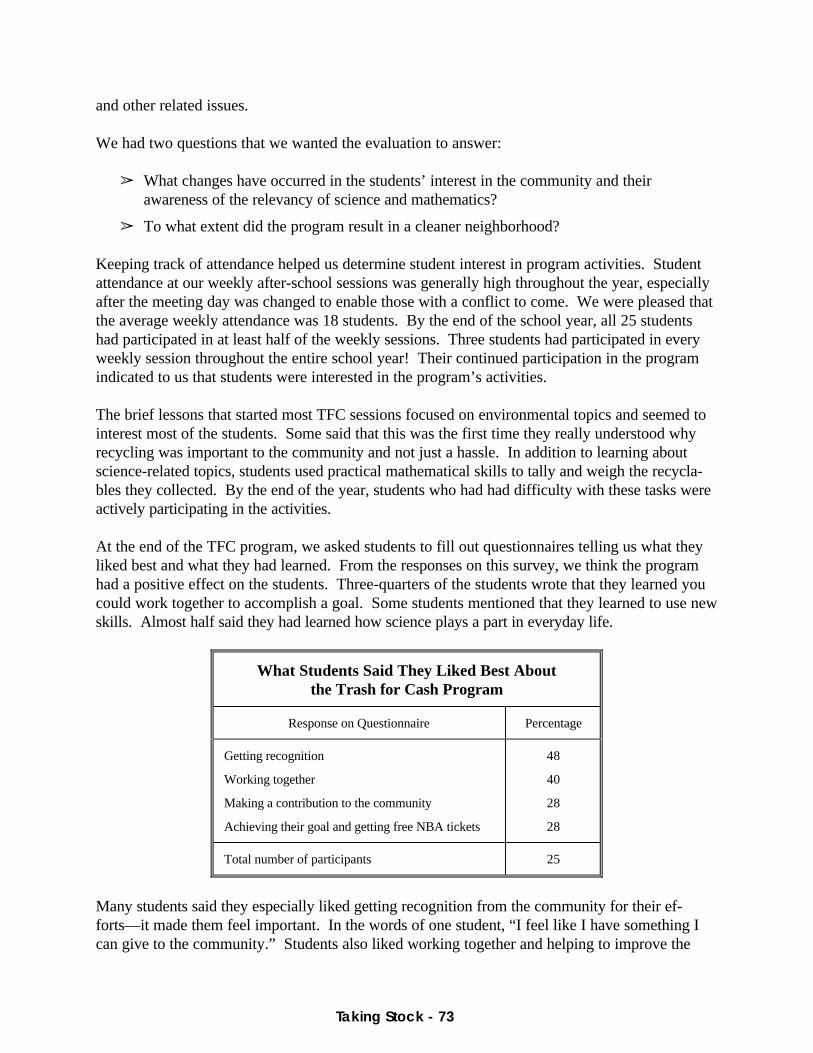
Taking Stock - 73
and other related issues.
We had two questions that we wanted the evaluation to answer:
â What changes have occurred in the students’ interest in the community and theirawareness of the relevancy of science and mathematics?
â To what extent did the program result in a cleaner neighborhood?
Keeping track of attendance helped us determine student interest in program activities. Studentattendance at our weekly after-school sessions was generally high throughout the year, especiallyafter the meeting day was changed to enable those with a conflict to come. We were pleased thatthe average weekly attendance was 18 students. By the end of the school year, all 25 studentshad participated in at least half of the weekly sessions. Three students had participated in everyweekly session throughout the entire school year! Their continued participation in the programindicated to us that students were interested in the program’s activities.
The brief lessons that started most TFC sessions focused on environmental topics and seemed tointerest most of the students. Some said that this was the first time they really understood whyrecycling was important to the community and not just a hassle. In addition to learning aboutscience-related topics, students used practical mathematical skills to tally and weigh the recycla-bles they collected. By the end of the year, students who had had difficulty with these tasks wereactively participating in the activities.
At the end of the TFC program, we asked students to fill out questionnaires telling us what theyliked best and what they had learned. From the responses on this survey, we think the programhad a positive effect on the students. Three-quarters of the students wrote that they learned youcould work together to accomplish a goal. Some students mentioned that they learned to use newskills. Almost half said they had learned how science plays a part in everyday life.
What Students Said They Liked Best Aboutthe Trash for Cash Program
Response on Questionnaire Percentage
Getting recognition
Working together
Making a contribution to the community
Achieving their goal and getting free NBA tickets
48
40
28
28
Total number of participants 25
Many students said they especially liked getting recognition from the community for their ef-forts—it made them feel important. In the words of one student, “I feel like I have something Ican give to the community.” Students also liked working together and helping to improve the

Taking Stock - 74
community. Over half the participants said that cleaning up their neighborhood made them feelgood.
To see if we had an impact on the community, we took pictures of five areas in the neighborhoodat the beginning of the school year and again in the spring. These pictures were posted on thewall of the YACA center for staff, participants, and community members to see, and to help raiseawareness about the program.
The photographs taken after the program showed that the places where our students worked weremuch cleaner than before. The students were very excited when the community paper, TheCentral City Weekly, published our before and after pictures of the Adams Street playground. This publicity brought the students a great deal of pride in what they were doing.
In May, we achieved our goal of collecting 1,000 pounds of recyclables. We were very pleasedthat all of our students were eligible for free tickets to the NBA game (because they all attendedat least half of the weekly TFC sessions). We had our basketball night on May 25 and everyonehad a lot of fun. We used money collected from recycling for a pizza party before going to thegame.
We believe that our program accomplished what it set out to do—to clean up the neighborhood,increase students’ community involvement, and expand their awareness of the relevancy of sci-ence and mathematics. As one student said, “TFC has been a great thing for me and for thisneighborhood.”
*Note that some supplies, snacks, and a pizza party were paid for with themoney earned from recycling. This enabled YACA to pay honoraria to 7guest speakers rather than the 5 originally budgeted for.
Trash for Cash ProgramFinal Budget
Budget Item Budget Spent
Salary for Maria Alvarez
Tickets to NBA Game ($30 x 25 participants)
Supplies*
Honoraria for guest speakers ($25 x 7 speakers)
TOTAL
$ 825
800
250
125
$2,000
$ 925
750
150
175
$2,000

Taking Stock - 75
Appendix B
PROPOSAL FOR EXPANDING A PROGRAM
Taking Stock - 76
PROPOSAL FOR EXPANDING A PROGRAM
“More Trash For Cash” Program ProposalWritten by Maria Alvarez
Director of Youth and Communities Alive!Submitted to the Central City United Way and the Tri-Cities Community Foundation
Youth and Communities Alive! (YACA) is a small community-based organization dedicated toserving low-income minority youth. Last year, YACA received a $2,000 grant from the CentralUnited Methodist Church for a new program called “Trash for Cash” (TFC). In its first year,TFC had a great deal of success in achieving its objectives of cleaning up the neighborhood, de-veloping students’ sense of pride in the community, and increasing their awareness of the rele-vancy of science and math. In the words of one participant:
“The Trash for Cash program really helped me come out of myself. I didn’t know Icould be a leader, but now I know I can.”
16-year-old female participant
We very much hope to build on our successes and continue TFC. However, based on our experi-ence last year, we believe the program would have a much greater impact on our community ifprogram activities were expanded to include more science instruction, more guest speakers, andfield trips. We also see the importance of including middle school students in this program andcontinuing to include high school students to serve as positive role models for the younger chil-dren. We are applying to new sponsors because the Central United Methodist Church does nothave funds available for an expanded program.
Trash for Cash: A Success Story
Trash for Cash (TFC) targeted high school students and lasted one academic year. The programhad three main objectives:
1. To develop a sense of ownership and pride in the community amongparticipating youths
2. To expand students’ awareness of science and mathematics applications ineveryday life
3. To clean up the neighborhood
We wanted to reach a broad spectrum of students, especially those who might not usually par-ticipate in an after-school program. To recruit participants, we made presentations in the schools,

Taking Stock - 77
and met with students, teachers, parents, and agency staff to get referrals. We wanted to try toget both African American and Latino youth from the neighborhood. In all we had 14 girls and11 boys. Thirteen were African American, 8 were Latino, and 4 were white.
Most TFC sessions began with a brief lesson about the reasons for recycling and conservation. Seven guest speakers made presentations about various topics related to the environment. In ad-dition, students were given primary responsibility for organizing weekly community clean-ups andkeeping track of the recyclables collected. Achieving the 1,000-pound goal set for the yearentitled students to tickets to an NBA game.
To see if TFC achieved its objectives, we looked at students’ level of interest and participation inprogram activities, and their awareness of the relevancy of science in their own lives. Attendancesheets, observations, and student surveys helped us get this information. We also looked atchanges in the community “ugly” spots chosen for our clean-up efforts, using before and afterphotographs and weekly tallies of recyclables.
We achieved our attendance goal of 75 percent of the participants attending at least one-half ofthe weekly sessions. Observations by board members revealed changes in students’ level of in-terest and participation in discussions, with more students actively participating at the end of theprogram than in earlier observations. In addition, students’ comments seemed to demonstrate agreater awareness of the relevancy of science. For example, observers noted that many of theparticipants voluntarily made connections between the discussion topic and their own personalexperiences. Student questionnaires provided evidence that supported observations. Studentsreported that they liked working together to improve the neighborhood, had learned about theimportance of recycling, and had gained an expanded view of what science is and how it relates totheir lives. Some students said this was the first time they really understood why recycling wasimportant.
Students successfully met their goal of 1,000 pounds of recyclables, and all received tickets to anNBA game. The photographs we took at the end of the year offered real proof that our programmade a difference—the areas were much cleaner, and the students could see the results of theirwork.
Building on Success: “More Trash for Cash”
We propose to build on the TFC success story by continuing and improving the program based onwhat we learned last year. The expanded two-year program is called “More Trash for Cash.” Weplan to put more emphasis on academic achievement, with higher quality science experiences to alarger number and wider range of students than the original TFC program. We will continue todevelop the students’ sense of pride and ownership in the community through weekly after-schoolcommunity clean-up efforts, and in the process, improve the appearance of the neighborhood. Inaddition, we hope to increase community awareness of environmental issues and recycling. Weplan to involve parents in clean-up efforts and drum up support for recycling amongneighborhood businesses and community members. High school students will make presentationsabout “More Trash for Cash” and recycling at various community meetings. Our success in thearea of public awareness will have a lasting impact on this community.

Taking Stock - 78
Each year of the program, we will work toward collecting at least 1,500 pounds in recyclables. When this goal is reached, participants who have attended at least half of the weekly sessions willbe eligible to receive their choice of tickets to an NBA basketball game, a ride on a paddle-wheelriver boat, or tickets to a performance by the Central Youth Theater.
The “More Trash for Cash” program will include improved science instruction by enlisting thehelp of science educators. A real understanding of environmental issues will be gained throughmeaningful hands-on science activities. Joyce Edwards, a biology teacher from Franklin HighSchool, and Park Central Middle School teacher, Ed Masterson, have each agreed to provide bi-weekly environmental science activities during the school year.
In addition, Dr. Andrea Tybola, an environmental science professor at Western State College, hasagreed to offer her expertise to “More Trash for Cash.” She will work with the two teachers tocoordinate the science lessons offered throughout the year. Dr. Tybola also has extensive con-tacts in the environmental community, and will help us to bring in high quality guest speakersincluding a colleague from Western State’s Civil Engineering Department who will speak to thestudents about waste water treatment, and a colleague with the park service who will discuss theeffects of pollution on the city’s parks. Dr. Tybola’s influence will also help us coordinatemeaningful field trips to sites including the city’s waste water treatment plant and the Orange Is-land Biological Research Park. These environmental education experiences will be invaluable toour students and will prepare them to share their knowledge with other community members.
“More Trash for Cash” will also build leadership skills among high school students. A small cadreof participants from last year’s TLC program will return to serve as program assistants for “MoreTrash for Cash.” These five students will assist instructors as necessary and will help youngerstudents with science activities. During the program’s second year, high school participants fromyear one will be selected to fill these roles. Each year, we expect to work with 30 high schoolstudents (including the five program assistants). The older students will serve as positive rolemodels for the 20 middle school students that we expect will participate each year in “More Trashfor Cash.”
Monitoring Progress and Evaluating Impact
In order to keep the program on track and to learn about the impact of “More Trash for Cash,”we have designed an evaluation that will provide both formative and summative data. The fol-lowing questions will guide the evaluation:
â What changes occur in students’ interest in community involvement, theirawareness of real life applications of science and mathematics, and theirknowledge and skills in science?
â To what extent did the program result in a cleaner neighborhood?
â To what extent is the community aware and supportive of clean-up efforts?
Like last year, we will monitor attendance at the weekly sessions of “More Trash for Cash.” Wewill also continue to tally the amount of recyclables collected, and take before and after pictures

Taking Stock - 79
of selected neighborhood areas targeted for clean-up. All participants will be asked to fill out abrief survey at the end of the program to answer questions about what they liked best and whatwas the most important thing they learned during the program.
In addition to these activities, we will set aside 15 minutes twice each semester for the students todiscuss in small groups what they think about the program. Students will record the major issuesthat come up in these discussions; we will use this information for formative evaluation purposesand make changes to the program as necessary. Observations of program activities and informalinterviews with participants once per semester will enrich our understanding of the impact of theprogram on the participants.
We plan to document the impact of “More Trash for Cash” on the community by attendingmeetings of various community organizations, keeping track of the number of businesses activelyinvolved in recycling, and possibly conducting a community survey at the end of the second yearof the program.
Conclusion
“More Trash for Cash” will offer quality weekly science experiences for our neighborhood’smiddle and high school students—exciting, constructive activities that provide an alternative tothe many negative influences in this neighborhood. The YACA staff feel confident that we will besuccessful at implementing this expanded program. We have been running enrichment programsfor the children in our community for the past ten years. More specifically, we have already hadsuccess at running the “Trash for Cash Program” and we learned from that experience. We knowwhat works and what doesn’t work, and we know what our community needs. The “More Trashfor Cash” program proposed here will expand on the ideas that we have already seen work withstudents in this community. The students will benefit immensely from this program, learningscience and mathematics skills that will help them throughout their lives, and teaching them theimportance of protecting the environment and recycling. In addition, this program will enable theparticipants to share their positive experiences and their environmental knowledge with others, tothe benefit of the entire community.

Taking Stock - 80
More Trash for Cash ProgramProposed Year One Budget
Budget ItemEstimated
Cost
Salaries Program Director: $1,500 Part-Time Program Assistant: $750 High School Students: 5 @ $200 each
Awards: Tickets to Community Events ($30 x 50 participants)
Stipends for Instructors Teachers: 2 @ $500 each College Professor @ $1,000
Field Trips (3)*
Supplies*
Honoraria for guest speakers ($50 x 15 speakers)
TOTAL
$ 3,250
1,500
2,000
1,500
1,000
750
$10,000
* Note that we expect funds received for recyclables collected by studentsduring the program will cover additional expenses related to field trips andsupplies.
Taking Stock - 81
Appendix C
ANNUAL PROGRESS REPORT
Taking Stock - 82
ANNUAL PROGRESS REPORT
“More Trash For Cash” Year One ReportWritten by Maria Alvarez
Director of Youth and Communities Alive!Submitted to the Central City United Way and the Tri-Cities Community Foundation
“I never liked science in school. The More Trash for Cash program showed mehow fun science really is. Plus we got to go to neat places that I had never seenbefore. Now I plan to study hard and be a biologist when I grow up.”
12-year-old male participant
“I’ve always been kind of shy, I guess. Who would have thought I could be aleader? But with the More Trash for Cash group I have made presentations to thePTA and the Ministers’ Alliance. It’s fun and it’s a good cause, because we aremaking the neighborhood better.”
17-year-old female participant
Youth and Communities Alive! (YACA) is a small community-based organization dedicated toserving low-income minority youth. YACA received $7,000 from the Central City United Wayand $3,000 from the Tri-Cities Community Foundation for the first year of the “More Trash forCash” (MTFC) program. The program is expected to continue at the same funding level for an-other year. This report summarizes changes made to the program based on formative evaluationdata, and describes the impact of the program evident after year one.
MTFC Program Activities
A total of 30 high school students and 20 middle school students participated in the MTFC pro-gram this past year. Participants included 28 girls and 22 boys; 32 were African American, 12were Latino, and 6 were white.
Each MTFC session began with hands-on activities that engaged students in thoughtful investi-gations into various environmental topics. High school and middle school students participated indifferent (but usually related) activities appropriate for their grade levels, although on severaloccasions, we mixed the two levels. Activities were planned and presented by our science in-struction team comprised of high school teacher Joyce Edwards and middle school teacher EdMasterson, and coordinated by Western State College faculty member, Dr. Andrea Tybola.Activities included weekly collection of trash in the community during after-school sessions. Students collected recyclables and kept track of the number of pounds of recyclables that they

Taking Stock - 83
turned in at a community recycling center. A goal of 1,500 pounds of recyclables was set for theyear.
In addition to these weekly activities, twice each month guest speakers talked to our studentsabout topics ranging from backyard bird feeders to global warming. All together, 15 communityspeakers visited during MTFC sessions. Most presentations were brief and tied in with hands-onactivities in order to keep interest levels high.
Two field trips were held this year. In September, we visited the waste water treatment plant inEast Bay. In late April, we hiked through the Orange Island Biological Research Park where Dr.Evan Felden explained various environmental studies underway and the children participated inwater sampling and testing activities.
After achieving our goal of collecting 1,500 pounds of recyclables, we allowed the children toselect the community event that they wanted to attend. This year’s MTFC culminated with theseexciting events, when each of our 50 participants attended either the NBA basketball game, theCentral Youth Theater dance performance, or took a ride on the River Queen paddle wheel boat.
The Evaluation Design
MTFC has four main objectives that are addressed in the evaluation design:
1. To develop a sense of ownership and pride in the community amongparticipating youth
2. To develop students’ science skills and knowledge, and their awareness ofscience and mathematics applications in everyday life
3. To clean up the neighborhood
4. To increase community awareness and involvement in clean-up efforts
The evaluation activities for the year were guided by three major questions.
â What changes occur in students’ interest in community involvement, theirawareness of real life applications of science and mathematics, and theirknowledge and skills in science?
â To what extent did the program result in a cleaner neighborhood?
â To what extent is the community aware and supportive of clean-up efforts?
We answered the first question by keeping track of attendance, providing participants with op-portunities to talk about the program several times during the year, and with a year-end question-naire. Observations of program activities were conducted several times during the year. Tomonitor our progress in cleaning up the neighborhood, we took before and after photographs atseveral neighborhood sites and kept a weekly tally of the amount of recyclables collected by theparticipants. To gauge community support for the MTFC clean-up, program staff attended

Taking Stock - 84
meetings of neighborhood organizations, conducted informal interviews with parents and othercommunity members, and documented the number of presentations made by our students tocommunity groups and the number of businesses actively recycling.
Changes in the Community
We took photographs of several sites in the neighborhood at the beginning of the school year. These were places that needed our children! All of these photographs showed a great deal oftrash. For example, the 2nd Street bridge overpass was piled four feet high in one corner withmiscellaneous trash including hubcaps, newspapers, and even a refrigerator door. The JacksonReservoir photo showed Styrofoam cups washed up on the shore and lots of soda cans.
Our students went out in the neighborhood and cleaned it up. Each week, we would divide upinto five clean-up crews and get out there and pick up trash! We averaged forty trash bags full ofnon-recyclable trash cleaned up from our community each week. We kept recyclables separate sothat we could tally them and take them to the recycling center. Our MTFC students picked up anaverage of 62 pounds of recyclables every week. The week after New Year’s, we collected arecord 157 pounds of recyclables!
We believe that MTFC is having a positive impact on this community. Many people see ourclean-up crews out working and congratulate the children on their efforts. Our “after” photosshow how good our neighborhood can look with just a little muscle power. We posted all the be-fore and after photos on the wall of the YACA center for staff, participants, and communitymembers to see, and to help raise awareness about the program. The Community Weekly ran astory about the MTFC students and included before and after photos. The children really got aboost from this publicity.
Our high school students made five presentations to different community groups and businesses.Our observations at community meetings show that people are starting to notice that the neigh-borhood looks better. However, at this point, adult members of the community are not them-selves participating in the clean-up efforts.
Changes in Students
Our evaluation information shows that MTFC has had a great effect on the students that partici-pate. Attendance has been high, although what weekly participation in MTFC sessions droppedbetween September and October. During a student discussion group in October, we learned thatour scheduled Thursday sessions conflicted with other extracurricular activities—particularly forthe high school students. We changed our meeting time to Wednesday afternoons and found thatattendance improved.
After we changed the meeting time, student attendance at weekly after-school sessions remainedgenerally high through the rest of the academic year. We averaged 37 attendees per weekly ses-sion, with even higher attendance (42 on average) on days with guest speakers. In fact, some par-ticipants brought siblings and friends to MTFC sessions, so there were often even more children
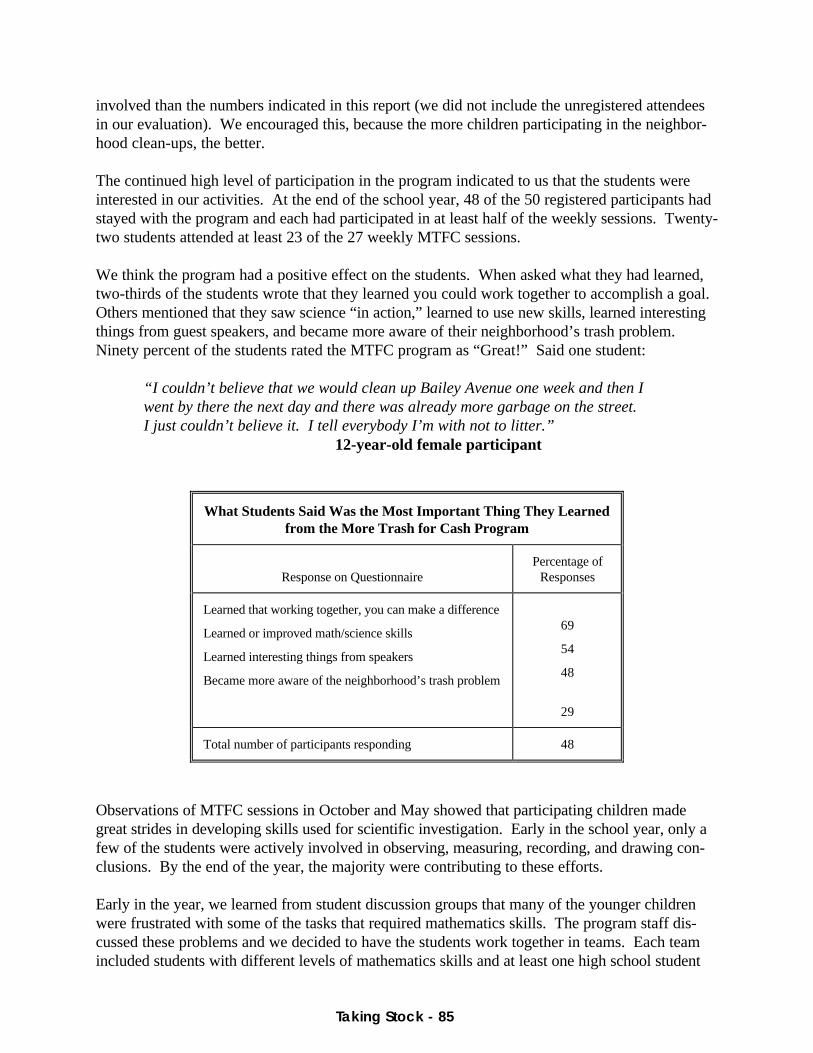
Taking Stock - 85
involved than the numbers indicated in this report (we did not include the unregistered attendeesin our evaluation). We encouraged this, because the more children participating in the neighbor-hood clean-ups, the better.
The continued high level of participation in the program indicated to us that the students wereinterested in our activities. At the end of the school year, 48 of the 50 registered participants hadstayed with the program and each had participated in at least half of the weekly sessions. Twenty-two students attended at least 23 of the 27 weekly MTFC sessions.
We think the program had a positive effect on the students. When asked what they had learned,two-thirds of the students wrote that they learned you could work together to accomplish a goal. Others mentioned that they saw science “in action,” learned to use new skills, learned interestingthings from guest speakers, and became more aware of their neighborhood’s trash problem. Ninety percent of the students rated the MTFC program as “Great!” Said one student:
“I couldn’t believe that we would clean up Bailey Avenue one week and then Iwent by there the next day and there was already more garbage on the street. I just couldn’t believe it. I tell everybody I’m with not to litter.”
12-year-old female participant
What Students Said Was the Most Important Thing They Learnedfrom the More Trash for Cash Program
Response on QuestionnairePercentage of
Responses
Learned that working together, you can make a difference
Learned or improved math/science skills
Learned interesting things from speakers
Became more aware of the neighborhood’s trash problem
69
54
48
29
Total number of participants responding 48
Observations of MTFC sessions in October and May showed that participating children madegreat strides in developing skills used for scientific investigation. Early in the school year, only afew of the students were actively involved in observing, measuring, recording, and drawing con-clusions. By the end of the year, the majority were contributing to these efforts.
Early in the year, we learned from student discussion groups that many of the younger childrenwere frustrated with some of the tasks that required mathematics skills. The program staff dis-cussed these problems and we decided to have the students work together in teams. Each teamincluded students with different levels of mathematics skills and at least one high school student

Taking Stock - 86
assistant. This solved the problem, as evidenced by student comments later in the school year. Said one participant:
“I didn’t know how to multiply big numbers before. But Janeesha helped melearn how. Now I help our team do our tally every week because I know I’mgoing to go to that basketball game!”
11-year-old male participant
By the end of the school year, most of the students seemed quite confident in their ability to dothese everyday mathematical tasks; those who had been “math-shy” at the beginning now activelyparticipated. Middle school students seemed especially intrigued by the activities focusing onweight and volume. Said one participant:
“I couldn’t understand at first how we could collect a whole bag full of plasticmilk jugs and it only weighed two pounds! A whole bag that I could hardlycarry by myself!! And then Charles showed off because his little bag of alu-minum cans weighed 2.2 pounds! It took a while to understand that!”
11-year-old female participant
On several occasions, we mixed middle and high school students in work groups. It was a goodway for the students to help each other with hands-on science activities. We found that mixingthe groups enhanced everyone’s experience. The younger children loved working with the bigkids, and the high school students enjoyed the excitement of the younger ones. According to onehigh school student:
“I didn’t really want to deal with the little kids at first. But I actually foundthat they were cool to work with and really funny.”
15-year-old female participant
The MTFC hands-on science activities that kicked off each weekly session were a great hit withall the students. For most of these children, MTFC was their first brush with “real” science—thefirst time they saw that science really mattered in their daily lives. The guest speakers and fieldtrips complemented and reinforced the concepts we investigated in the activities. On the ques-tionnaire at the end of the school year, 50 percent of the students said that they liked the field tripsbest of all the program activities.
We feel that the participants gained a real understanding of the importance of recycling and thehuman impact on the environment. During observations and informal student interviews, studentsfrequently commented on various environmental issues that they were newly aware of, anddiscussed different ways that they could personally help clean up the planet.
When asked what they liked best about the program, most high school students mentioned thesatisfaction they gained from improving their community and “making a difference.” In contrast,a majority of the younger participants enjoyed the recognition that they gained from theprogram—the NBA tickets, the newspaper story, and having their efforts displayed at the YACACenter.

Taking Stock - 87
What Participants Liked Best About
" M o re Trash for Cash"
0
2 0
4 0
6 0
8 0
100
Improving the
Communi ty
Recognition
for their
Efforts
Perc
enta
ge o
f Res
pond
ents
H ig h S c h o o l
(pa r t i c ipan t s = 28)
M id d le S c h o o l
(pa r t i c ipan t s = 20)
Where Do We Go From Here?
We believe that the MTFC program is making progress toward our objectives—to develop stu-dents’ interest in community involvement, their awareness of real life applications of science andmath, and their knowledge and skills in science; to clean up the neighborhood; and to increasecommunity awareness about clean-up efforts. We plan to continue weekly neighborhood clean-upefforts. We know from surveys and informal interviews that the students are enjoying the clean-up activities, the hands-on science activities, and the field trips and guest speakers. We plan to dosimilar MTFC activities next year.
One area that was not as successful as we had hoped was getting the community actively in-volved. We are going to work harder to make the community aware of environmental issues, re-cycling, and the efforts of the MTFC students. During a student discussion group this past May,several high school students commented that they really wanted to make others in the communitymore aware of MTFC efforts. These students have an action plan for getting the word out. Theywill work together to put on more presentations for community groups to spread the word aboutMTFC and drum up more support for the program. We think these activities will also enhanceour students’ leadership abilities as they take an active role in talking to adults in the communityabout the importance of environmental action.
Many of our students have been “spreading the word” about recycling with their families andfriends, but we want to organize more family activities to get parents truly involved. We hope toschedule some community clean-up days on weekends and post flyers so that community mem-bers know they are welcome to join in.

Taking Stock - 88
To gauge community awareness and support for MTFC efforts, we plan to conduct a door-to-door neighborhood survey during the second year of the program. We plan to ask communitymembers if they have noticed changes in the neighborhood, if they would like to participate in theclean-up, and if they have heard of MTFC.
We think expanding awareness of MTFC in our community will have a huge impact on thisneighborhood. The students will gain self-confidence from making presentations and beingleaders in these activities, community members will become more aware of environmental issues,and the neighborhood itself will be improved if more people participate in recycling and clean-upactivities. We hope that by spreading the word throughout the community, the MTFC programwill have a lasting impact on this neighborhood.
More Trash for Cash ProgramYear One Budget
Budget Item Budget Spent
Salaries Program Director: $1,500 Part-time Program Assistant: $750 High School Students: 5 @ $200
Awards: Tickets to Community Events
Stipends for Instructors Teachers: 2 @ $500 each College Professor @ $1,000
Field Trips (3)*
Supplies*
Honoraria for guest speakers ($50 x 15 speakers)
TOTAL
$ 3,250
1,500
2,000
1,500
1,000
750
$10,000
$ 3,250
1,250
2,000
1,500
1,250
750
$10,000
* Note that some supplies and additional field trip expenses were paid for withfunds received for recyclables collected by students during the program.

Taking Stock - 89
GLOSSARY OF TERMS
Evaluators do not always agree about how to use evaluation terms. This can lead to some confu-sion when you are first exploring the field. Some terms, like questionnaire and sample, are veryspecific and therefore are used consistently from one evaluator to another. Other terms, like for-mative and summative evaluation, can vary in subtle ways. We have simplified our use of theseterms in order to give you an easy introduction to the key concepts of evaluation.
You will undoubtedly come across other definitions or uses of some terms when you read othersources and talk to other evaluators. For the time being, however, here is a summary of how wehave used key evaluation terms in this manual.
baseline information Documentation ofpeople, conditions, or events before a pro-gram begins. Provides evaluator with data tocompare to information collected during andat the end of a program to gauge impact.
biased Influenced in a particular direction. Evaluation data may be biased if it presentsonly a single point of view, as opposed to avariety of perspectives (e.g., participants,staff, community members). Similarly, askingonly the most active participants to rate aprogram may bias the results and preventsyou from learning why less active participantschoose not to take part in program activities.
CBO Community-based organization. Thismanual is written primarily for CBOs thatoffer science and mathematics programs foryoung people.
closed-ended question Survey questionsthat provide respondents with a selectionof possible answers (agree/disagree/noopinion; yes/no/don’t know) and ask themto select the answer that best matchestheir beliefs or feelings. Responses can betallied to provide quantitative data.
data analysis The systematic examinationand interpretation of information gatheredthrough various data collection strategies,including document review, observations,interviews, and surveys. For most CBOprogram evaluations, data analysis is bestfocused around program objectives, inter-mediate indicators, and final outcomes.
data collection The accumulation of infor-mation for evaluation through documentreview, observations, interviews, surveys,or other strategies.
demographic information Descriptivedata that includes race/ethnicity, gender,age, grade level, socioeconomic status,

Taking Stock - 90
and similar kinds of information. Can help inthe analysis of program impact on differentgroups of participants, and in proving thatyou reached the audience your programtargeted.
direct quote Words, sentences or paragraphstaken directly from a person or group,through observations, interviews, or surveys.These excerpts use the respondent’s exactwords as opposed to paraphrasing orsummarizing.
document review The examination of recordsor documents that reveal information aboutthe context in which a program occurs, aboutpeople’s behavior, and about other conditionsor events. Evaluators can make use ofexisting records (e.g., report cards) ordevelop forms especially for the evaluation(e.g., participant journals, attendance sheets).
external evaluation Activities undertaken bya person or group outside the organization todetermine the success of a program.
final program outcome Changes you expectto see, hear, or measure which can tell you ifyour program achieves the goals for which itwas designed.
focus group An interview conducted with asmall group of people. We find that focusgroups often work best when participation islimited to 8–10 people. A focus groupenables the evaluator to get in-depth infor-mation from a group of people in a shortamount of time.
formal interview A conversation in which theevaluator obtains information from a re-spondent or group of respondents by asking aset of specific questions.
formative evaluation Data collection ac-tivities and analysis that occur over the course
of program implementation. A processused to determine whether or not aprogram is working: What progress is be-ing made toward program objectives? How do we use feedback information toimprove the program, refine data collec-tion activities, and identify problems orissues of importance that were not evidentbefore a program began?
goal The end—what CBOs hopeprograms will accomplish in the long-run.
informal interview A spontaneousconversation between evaluator andrespondent. The interviewer uses noguidelines or protocol; questions areguided by the context of the situation.
intermediate indicator The kinds ofprogress you expect to see if yourprogram is moving toward achieving itsobjectives.
internal evaluation An examination ofprogram activities conducted in-house byCBO staff.
interview A conversation in which theevaluator obtains information from a re-spondent or group of respondents. Inter-views can be formal or informal;structured, semi-structured, orunstructured; individual or in focusgroups; in person or by telephone.
needs assessment Information collectedbefore a program is planned orimplemented to help staff identify needsand target audiences, and to developappropriate strategies. Sometimesreferred to as front-end evaluation.
objective A means to achieving a goal; what CBOs hope their program willachieve.

Taking Stock - 91
observation In-person, firsthand examinationof program participants and activities.
open-ended question Survey and interviewquestions that allow people to respond in theirown words. No answer categories areprovided on the questionnaire or in theinterview protocol. Questions are worded todiscourage simple “yes” or “no” answers.
organizational mission The reason why aCBO exists. Program goals are often closelyrelated to an organization’s mission.
participatory evaluation The involvement ofprogram staff in the design and imple-mentation of an evaluation conducted by aperson or group external to the organization.
probe Follow-up questions asked during aninterview to help get at key issues and clarifywhat the respondent means. Probes may beincluded in the interview guide or protocol tohelp obtain the information needed for theevaluation.
program evaluation Data collection andanalysis which enables program staff toimprove program activities while they are inprogress and to measure the degree to whicha program ultimately achieves its goals.
protocol A set of questions used as a guidefor conducting observations or interviews tohelp ensure that the appropriate information iscollected from each respondent.
qualitative data Information typically gath-ered through document review, observations,and interviews. Often expressed in words asopposed to numbers, although somequalitative data may lend itself to tallying andnumerical presentation.
quantitative data Information measured andexpressed with numbers, typically gathered
though surveys. Can be presented in a va-riety of ways, including numbers or per-cents, ranges or averages, tables, andgraphs.
questionnaire The written instrument usedto collect information as part of a survey.Can include closed- and open-ended ques-tions, and questions that obtain demo-graphic information about the respondent.
response rate The number of people whorespond to a questionnaire, as comparedwith the number of people who receivedthe questionnaire. Evaluators often fol-low-up with non-respondents to raise theresponse rate and obtain more accurateresults.
sample A subset (of people, documents,or things) that is similar in characteristicsto the larger group from which it isselected. In evaluating large programs,CBOs might interview a sample ofparticipants or review a sample of meetingnotes instead of interviewing all partici-pants or reading all meeting minutes.
summative evaluation Data collection ac-tivities and analysis which help determinehow successful a program has been atachieving its goals. These activitiesgenerally occur toward the end of aprogram, or at appropriate breakpoints inmulti-year or ongoing programs.
survey A method of collecting informationby mail, phone, or in person. Surveys in-volve a series of steps including selectinga sample, collecting information,following up with non-respondents, thenorganizing and analyzing data.

Taking Stock - 92

Taking Stock - 93
INDEX OF KEY CONCEPTS
B
baseline information · 7–8, 12, 24, 27, 34, 64biased · 32, 34
C
CBO · 1, 5, 15, 28, 41, 45–70closed-ended question · 21–22, 34–36
D
data analysis · 21–22, 39–41, 48–49, 63–65data collection · 5, 27–37, 40, 47–48, 59–62demographic information · 28, 34–35, 41direct quote · 33document review · 22, 28–30, 33, 40, 47–48
E
external evaluation · 1, 36–37, 41
F
final program outcome · 19, 24, 27, 30, 39, 57–58, 61–62focus group · 12, 33, 59, 66formal interview · 32formative evaluation · 5–7, 17–19, 23–25, 30, 39, 47
G
goal · 1, 5, 7–8, 12, 15–19, 21, 23, 27, 41, 46, 56
I
informal interview · 32, 60, 65intermediate indicator · 18, 23, 27, 39, 57–58, 61–62internal evaluation · 1, 36, 41interview · 12, 22, 23, 28, 32–33, 36–37, 40–42, 60
N
needs assessment · 11–12, 41, 46, 56
O
objective · 5, 7–8, 12, 15–19, 21, 23, 27, 30, 40, 41, 46–47,56–58, 61–65
observation · 22, 24, 28, 30–31, 33, 37, 40, 41, 42, 48, 49,60, 64, 67
open-ended question · 22, 34–36organizational mission · 5, 15–19
P
participatory evaluation · 1probe · 32program evaluation · 1–3, 5, 45protocol · 32, 66, 67
Q
qualitative data · 21–25, 27, 42quantitative data · 21–25, 27, 42questionnaire · 21, 27, 34–36, 48, 52, 59, 64, 68
R
response rate · 34
S
sample · 33–34, 40summative evaluation · 5, 7–8, 12, 17–19, 24–25, 30, 47, 64survey · 12, 21–22, 28, 34–36, 40, 42, 60, 63–65, 68