a novel two-dimensional model for colloid transport in physically and geochemically heterogeneous...
TRANSCRIPT
Ž .Journal of Contaminant Hydrology 49 2001 173–199www.elsevier.comrlocaterjconhyd
A novel two-dimensional model for colloidtransport in physically and geochemically
heterogeneous porous media
Ning Sun a, Menachem Elimelech a,), Ne-Zheng Sun b,Joseph N. Ryan c
a EnÕironmental Engineering Program, Department of Chemical Engineering, Yale UniÕersity,P.O.Box 208286, New HaÕen, CT 06520-8286, USA
b Department of CiÕil and EnÕironmental Engineering, UniÕersity of California, Los Angeles, Los Angeles,CA 90095, USA
c Department of CiÕil, EnÕironmental, and Architectural Engineering, UniÕersity of Colorado, Boulder,CO 80203, USA
Received 11 January 2000; received in revised form 20 July 2000; accepted 10 November 2000
Abstract
A two-dimensional model for colloid transport in geochemically and physically heterogeneousporous media is presented. The model considers patchwise geochemical heterogeneity, which issuitable to describe the chemical variability of many surficial aquifers with ferric oxyhydroxide-coated porous matrix, as well as spatial variability of hydraulic conductivity, which results inheterogeneous flow field. The model is comprised of a transient fluid flow equation, a transientcolloid transport equation, and an equation for the dynamics of colloid deposition and release.Numerical simulations were carried out with the model to investigate the colloid transportbehavior in layered and randomly heterogeneous porous media. Results demonstrate that physicaland geochemical heterogeneities markedly affect the colloid transport behavior. Layered physicalor geochemical heterogeneity can result in distinct preferential flow paths of colloidal particles.Furthermore, the combined effect of layered physical and geochemical heterogeneity may result inenhanced or reduced preferential flow of colloids. Random distribution of physical heterogeneityŽ .hydraulic conductivity results in a random flow field and an irregularly distributed colloidconcentration profile in the porous medium. Contrary to random physical heterogeneity, the effectof random patchwise geochemical heterogeneity on colloid transport behavior is not significant. It
) Corresponding author. Tel.: q1-203-432-7289.Ž .E-mail address: [email protected] M. Elimelech .
0169-7722r01r$ - see front matter q2001 Elsevier Science B.V. All rights reserved.Ž .PII: S0169-7722 00 00193-5
( )N. Sun et al.rJournal of Contaminant Hydrology 49 2001 173–199174
is mostly the mean value of geochemical heterogeneity rather than its distribution that governs thecolloid transport behavior. q 2001 Elsevier Science B.V. All rights reserved.
Keywords: Colloid transport; Physical heterogeneity; Geochemical heterogeneity; Porous media; Colloid-facilitated transport; Colloid deposition; Patchwise geochemical heterogeneity; Ferric oxyhydroxide coating
1. Introduction
It is now widely accepted that mobile subsurface colloids can facilitate the transportŽof strongly-sorbing contaminants McCarthy and Zachara, 1989; Ryan and Elimelech,
.1996; Grolimund et al., 1996; Roy and Dzombak, 1998 . In many other cases, colloidalŽparticles, such as pathogenic bacteria and viruses, are contaminants themselves Yates et
.al., 1985; Harvey et al., 1989 . To accurately assess the transport and fate of suchcontaminants in groundwater, detailed yet realistic models for colloid transport insubsurface porous media are needed.
Several models for colloid transport in granular porous media have been developed.Ž .Corapcioglu and Jiang 1993 developed a one-dimensional model to describe colloid
transport in homogeneous porous media, with both colloid deposition and releaseŽ .modeled as first-order kinetics processes. Johnson and Elimelech 1995 incorporated
Ž . Ž .linear Langmuirian and nonlinear random sequential adsorption particle depositiondynamics in colloid transport modeling to account for the phenomenon of blocking.
Ž . Ž .Saiers et al. 1994 used both first- and second-order blocking kinetics approaches tomodel the transport and deposition of colloidal anatase, boehmite, and silica in packed-
Ž .sand columns. Song and Elimelech 1994 considered the effect of surface chargeŽ .geochemical heterogeneity on colloid deposition and transport, with the surface chargeheterogeneity being modeled as either random microscopic sites or as patches. In a later
Ž .study, Johnson et al. 1996 incorporated both patchwise geochemical heterogeneity andrandom sequential deposition dynamics in a one-dimensional colloid transport model.Their model predictions were in good agreement with experimental silica colloidbreakthrough curves through a column packed with geochemically heterogeneous sandgrains.
To date, most available models for colloid transport, including the models mentionedin the previous paragraph, consider only physically homogeneous porous media. Subsur-
Žface porous media, however, are known to be physically heterogeneous e.g., LeBlanc et.al. 1991; Hess et al., 1992; Dagan, 1989 . Among the few attempts to consider effects of
Ž .physical heterogeneity on colloidal transport, Abdel-Salam and Chrysikopoulos 1995Ž .and Chrysikopoulos and Abdel-Salam 1997 modeled colloid transport in a fractured-
Ž .rock matrix with spatially variable aperture. Saiers et al. 1994 carried out colloidtransport experiments in a structured-heterogeneous porous medium. In their experi-ments, the column was packed with concentric layers of homogeneous sand of differentgrain size, aligned parallel to the flow direction. The results of both studies showed thatphysical heterogeneity of porous media significantly influences colloidal transportbehavior.
The previously described models for colloid transport in geochemically heteroge-neous porous media dealt only with porous media surfaces having a constant geochemi-
( )N. Sun et al.rJournal of Contaminant Hydrology 49 2001 173–199 175
cal heterogeneity. However, a spatially distributed geochemical heterogeneity is verylikely to exist in the subsurface environment due to the inherent geochemical variabilityof subsurface geological formations. Thus, it is imperative that the recent colloidtransport modeling approaches be extended to incorporate the more realistic spatialdistribution of geochemical heterogeneity.
In this paper, we develop a two-dimensional colloid transport model for physically aswell as geochemically heterogeneous porous media. In this model, the colloid transportequation is coupled with the fluid flow equation. Patchwise geochemical heterogeneityand nonlinear dynamics of particle deposition and release are considered as the mainmechanisms governing colloid transfer between the immobile solid phase of the porousmedium and the mobile colloidal phase. Layered or random distributions of hydraulicconductivity are introduced into the flow equation to describe the physically heteroge-neous porous media. Constant or spatially distributed geochemical patches are incorpo-rated in the colloid deposition and release equation to represent the geochemicalheterogeneity of the porous matrix surfaces. A variant of a finite element method—the
Ž .multiple cell balance MCB —is used to obtain a numerical solution of the proposedmodel. The model is used to carry out a systematic numerical investigation on theinfluence of physical and geochemical heterogeneities on colloidal transport in subsur-face porous media.
2. Model development
We consider a confined aquifer where the fluid is in laminar motion and thesuspended colloidal particles travel with the fluid. The colloidal particles are assumed to
Ž .be Brownian i.e., less than about 1 mm and monodisperse. Spatial distributions of thephysical and geochemical heterogeneities of the subsurface porous medium are rigor-ously incorporated in the model.
2.1. Flow field
The transient flow equation for a fluid in a confined subsurface porous medium, suchŽ .as a confined groundwater aquifer, is usually written as Bear, 1972; de Marsily, 1986
EhS s=P K=h yQ, 2.1Ž . Ž .s
Et
where h is the hydraulic head, t is the time, S is the specific storage, K is the hydraulics
conductivity, and Q is the pumping or recharge rate. Under natural gradient flowconditions, the fluid is usually in steady state flow. Hence, the spatially distributedhydraulic heads are determined for steady-state flow field and then used to calculate thefluid velocity by applying Darcy’s law:
qsyK=h , 2.2Ž .where =h is the hydraulic head gradient and q is Darcy’s velocity. The average pore
Ž .velocity V , which usually appears in the transport equation, is the ratio of Darcy’sŽ .velocity to porosity ´ .
( )N. Sun et al.rJournal of Contaminant Hydrology 49 2001 173–199176
2.2. Physical heterogeneity of subsurface porous media
The spatial variation of hydraulic conductivity results in heterogeneous flow field thatinfluences colloid transport and the resulting particle concentration distribution in theporous medium. Two types of physical heterogeneity are investigated: layered hetero-geneity and random heterogeneity.
In a layered, physically heterogeneous subsurface porous medium, the medium isŽmade up of several homogeneous layers. Thus, while each layer is homogeneous i.e.,
.with constant hydraulic conductivity , the entire system is heterogeneous. For instance,Ž .porous media with fractures Ibaraki and Sudicky, 1995a,b or large blocks of macrop-
ores may be described as layered heterogeneous.Substantial progress has been made in the past two decades to understand the random
physical heterogeneity of groundwater aquifers. Evidence from field-scale hydraulicconductivity measurements indicates that the spatial distribution of hydraulic conductiv-
Ž .ity is lognormal e.g., Freeze, 1975; Sudicky, 1986; Hess, 1989 . It was also found thatthere exists a non-Gaussian behavior of the log-transformed hydraulic conductivity atrelatively small scales, and that this non-Gaussian behavior shifts to Gaussian behavior
Ž .as the length scale increases e.g., Painter, 1996; Liu and Molz, 1997 . Because of lackof knowledge on this transition length scale and the fact that lognormally distributed
Žhydraulic conductivity has been used by many hydrologists e.g., Gelhar et al., 1979;.Gelhar and Axness, 1983; Dagan, 1989; Rubin, 1990 , a lognormal distribution is
adopted here to describe the random spatial variation of hydraulic conductivity.Let Ys ln K , with a constant mean m and variance s 2. The covariance function ofY Y
Y is assumed to have an isotropic exponential form,
< <r Y2C r ss exp y , 2.3Ž . Ž .Y Y ž /lY
where r is the planar distance vector between two positions in the heterogeneousY
domain and l is the integral scale of Y. Using the statistical properties of spatialY
distribution, the random field of hydraulic conductivity can be generated by the turningŽ .band method Mantoglou and Wilson, 1982; Tompson et al., 1989 .
2.3. Geochemical heterogeneity of subsurface porous media
Ferric oxyhydroxide coatings are the main source of geochemical heterogeneity of theŽsolid matrix in many surficial aquifers containing iron-bearing minerals e.g., Fuhs et al.,
1985; Scholl et al., 1990; Scholl and Harvey, 1992; Coston et al., 1995; Zachara et al.,.1995; Ryan et al., 1999 . These coatings on mineral grain surfaces provide favorable
Ž .sites area for colloid deposition because they are positively charged whereas themajority of subsurface colloidal particles are negatively charged. Here, we adopt the
Ž .patch model Song et al., 1994 to describe the geochemical heterogeneity of subsurfaceporous media. The model is characterized by the heterogeneity parameter, l, which is
Ždefined as the ratio of the surface area favorable for deposition i.e., particle deposition
( )N. Sun et al.rJournal of Contaminant Hydrology 49 2001 173–199 177
.onto this area is not hindered by colloidal interactions and is transport limited to theŽ .total interstitial surface area over a representative elementary volume REV of a porous
Ž .medium. Note that colloid deposition or release can occur on both the favorable l andŽ .unfavorable 1yl fractions, albeit at much different rates.
Because the chemical composition of subsurface minerals and solution chemistryvary spatially in subsurface aquatic environments, the geochemical heterogeneity,defined over an REV, may vary significantly throughout the subsurface porous medium.The geochemical heterogeneity of a porous medium can be assumed to be constant overthe entire porous medium, or to have different values at different locations in the porousmedium. Accordingly, two spatial variations of geochemical heterogeneity are consid-ered: layered geochemical heterogeneity and random geochemical heterogeneity.
Compared to layered geochemical heterogeneity, detailed statistical information onthe chemical properties of the subsurface porous medium is needed to model randomgeochemical heterogeneity. To date, there are no reported studies on the random field ofgeochemical heterogeneity of subsurface porous media in relevance to colloid transport.Several studies on solute transport in heterogeneous porous media have described the
Žvariation of solute sorption coefficients by a normal distribution e.g., Black and.Freyberg, 1987; Chrysikopoulos et al., 1990; Bosma and van der Zee, 1993 . Although
solute transport behavior is quite different than colloidal transport behavior, we adopt asimilar approach and describe the random field of geochemical heterogeneity as
Ž . 2normally distributed with a constant mean E l and a variance s . The turning bandl
Ž .method Mantoglou and Wilson, 1982; Tompson et al., 1989 is used to generate therealization of the two-dimensional random field of normally distributed geochemicalheterogeneity, with a first-order exponential autocorrelation function:
< <rl2C r ss exp y , 2.4Ž . Ž .l l ž /ll
where l is the integral scale of l.l
The mean value of the geochemical heterogeneity l in surficial aquifers with FeŽoxyhydroxide coatings is thought to be small, on the order of a few percent Heron et
.al., 1994; Coston et al., 1995; Ryan et al., 1999 . With a mean value of only a fewpercent, a normal distribution cannot well describe the portion of the relatively largegeochemical heterogeneity values, which possibly exist in natural systems. Thus, inaddition to normal distribution, a lognormal distribution will be used when significantvariations of geochemical heterogeneity, with a small mean value of only a few percent,are desired.
2.4. Colloid transport equation
The colloid transport equation can be derived from mass balance of colloids over anREV of a porous medium. There are three main mechanisms controlling colloidtransport: hydrodynamic dispersion, advection, and colloid transfer between the station-ary solid matrix and the mobile colloidal phase through colloid deposition and release.
( )N. Sun et al.rJournal of Contaminant Hydrology 49 2001 173–199178
These mechanisms can be described by the generalized advection–dispersion equationŽ .de Marsily, 1986 :
EC r ESbs=P D=C y=P VC y , 2.5Ž . Ž . Ž .
Et ´ Et
where C is the mass concentration of colloids in the aqueous phase, S is the ratio of thecolloid mass captured by the solid matrix to the total mass of solid matrix, D is theparticle hydrodynamic dispersion tensor, V is the particle velocity vector, ´ is theporosity of the porous medium, and r is the bulk density of the porous medium.b
Because the average pore radius in sandy aquifers is quite large compared to the sizeŽ .of Brownian submicrometer size colloidal particles, size exclusion effects are not
considered. Thus, the particle velocity and interstitial fluid velocity are assumed to beequal. For the two-dimensional transport problem considered here, the components ofthe hydrodynamic dispersion coefficient are related to the particle Stokes–Einstein
Ž .diffusivity D and the components of the interstitial velocity V and V byd i j
V Vi jD sa Vd q a ya qD Td , 2.6Ž . Ž .i j T i j L T d i jV
where a and a are the longitudinal and transverse dispersivities, respectively, T isL T
the porous medium tortuosity, d is the Kronecker delta, and V is the geometrici j
average of V and V . Note that in this study a unidirectional flow along the x directioni j
is assumed with V s0.j
To appropriately describe the dynamic aspects of colloid deposition and the associ-ated blocking effects, the colloid transport equation is expressed in terms of particle
Ž .number concentration rather than mass concentration Johnson et al., 1996 ,
En f Eus=P D=n y=P Vn y , 2.7Ž . Ž . Ž .2Et Etp ap
where n is the number concentration of colloids, u is the fractional surface coverage,defined as the total cross-section area of deposited colloids per interstitial surface area of
Žthe porous medium solid matrix, f is the specific surface area i.e., interstitial surface.area per porous medium pore volume , and a is the radius of colloidal particles. It canp
Ž . Ž .be readily shown that Eq. 2.7 is equivalent to Eq. 2.5 .
2.5. Colloid deposition and release
Using the patchwise model for geochemical heterogeneity, the particle surfaceŽ .coverage rate of mineral grains is given by Johnson et al., 1996
Eu Eu Euf usl q 1yl . 2.8Ž . Ž .
Et Et Et
( )N. Sun et al.rJournal of Contaminant Hydrology 49 2001 173–199 179
When considering the dynamic aspects of particle deposition and release, the rateequations corresponding to the favorable and unfavorable surface fractions can beexpressed as
Eu f 2sp a k nB u yk u R u , 2.9aŽ . Ž . Ž .p dep ,f f det ,f f fEt
Euu 2sp a k nB u yk u R u , 2.9bŽ . Ž . Ž .p dep ,u u det ,u u uEt
Ž . Ž .where the subscripts f and u represent the favorable l and unfavorable 1yl REVsurface fractions, respectively, k is the colloid deposition rate constant, k is thedep det
Ž . Ž .colloid release rate constant, and B u and R u are the dynamic blocking and releasefunctions, respectively. The colloid deposition rate coefficient is related to the single
Žcollector efficiency h commonly used in filtration theories by Johnson and Elimelech,.1995
h´V ah ´V0k s s , 2.10Ž .dep 4 4
Ž .where V is the colloid or fluid advection velocity, ´ is the porosity of the porousŽ .medium, a is the attachment collision efficiency, and h is the favorable single0
collector removal efficiency.Ž .The dynamic blocking function B u characterizes the probability of colloid deposi-
tion by quantifying the fraction of collector surface still available for deposition ofŽ .colloids Johnson and Elimelech, 1995 . It accounts for the blocking effect of deposited
colloids on the particle deposition rate. Two types of dynamic blocking functions aregenerally recognized: the Langmuirian dynamic blocking function and the random
Ž .sequential adsorption RSA dynamic blocking function. Recent experimental investiga-tions have shown that the RSA model describes the dynamics of particle deposition in
Žporous media better than the conventional Langmuirian model Johnson and Elimelech,.1995; Johnson et al., 1996 .
The general form of the RSA dynamic blocking function is
2 3u u u
B u s1ya qa qa , 2.11Ž . Ž .1 2 3ž / ž / ž /u u umax max max
where u is the maximum attainable surface coverage, and a , a , and a aremax 1 2 3Žcoefficients that can be evaluated theoretically for ideal particles and collector surfaces
.and simple flow conditions or empirically. The coefficients used by Johnson andŽ . Ž .Elimelech 1995 for B u will be used in this colloid transport model as they were
found adequate to describe the dynamics of blocking in flow of monodisperse latexmicrospheres in columns packed with spherical uniform glass beads.
Because colloid deposition onto the favorable surface fraction is usually irreversibleŽ .particles and patch surfaces are oppositely charged , the RSA model can be used todescribe the dynamics of particle deposition onto the favorable surface fraction. Asimilar dynamic blocking function was also chosen to describe the blocking of theunfavorable fraction, although the deposition onto the unfavorable surface fraction was
( )N. Sun et al.rJournal of Contaminant Hydrology 49 2001 173–199180
assumed to be reversible. This assumption, however, has negligible effect on the colloidtransport behavior since the deposition rate on the unfavorable surface fraction is muchsmaller than that on the favorable fraction, and the maximum surface coverage for theunfavorable surface fraction is much smaller than that on the favorable surface fraction.
The dynamic release function describes the probability of colloid release from porousmedia surfaces covered by retained colloids, somewhat analogous to the dynamicblocking function. In principle, this function should depend on the colloid residence time
Ž .and the retained colloid concentration Meinders et al., 1992; Johnson et al., 1995 .Ž . Ž .When R u s1, the release terms in Eqs. 2.9a, 2.9b represent a first-order kinetics
release mechanism. Because the mechanisms of colloid release are relatively not wellunderstood at the present time, only a first-order release rate will be considered in thispaper.
2.6. Correlation between physical heterogeneity and colloid deposition rate
In modeling colloid transport, the variation of flow field will change the colloidconcentration distribution in the studied domain not only by affecting hydrodynamicdispersion and advection, but also by influencing the colloid deposition rate. ForBrownian colloids, whose deposition rate is controlled by a convective–diffusivemechanism, there exists a positive relationship between the hydraulic conductivity and
Ž . Ž .the particle deposition rate. Based on Eq. 2.10 , the colloid deposition rate k isdepŽ . y2r3proportional to h V , with h for Brownian colloids being proportional to V0 0
Ž .Levich, 1962; Elimelech and O’Melia, 1990 . Combining this relationship with Darcy’sŽ . 1r3law, one obtains that the colloid deposition rate k is proportional to K . Adep
consequence of this relationship is that a random field of hydraulic conductivity leads toa random field of colloid deposition rate as well.
² :We assume that Ps lnk is normally distributed with a mean P and variancedep
s 2, and has a similar form of the covariance function as the hydraulic conductivity field.P
To describe the correlation between the random hydraulic conductivity field and thecolloid deposition rate, it is further assumed that
² : X XPs P qvP qgY , 2.12Ž .where v and g are correlation coefficients, PX is the perturbation of the spatiallydistributed colloid deposition rate constant, and Y X is the perturbation of the hydraulic
² X : ² X :conductivity field. Note that P s0 and Y s0 . When vs0 and g)0, P and Yare perfectly positively correlated; when vs0 and g-0, P and Y are perfectlynegatively correlated; and when v/0, P and Y are not perfectly correlated. ForBrownian colloids, vs0 and g)0; the value of g is chosen as 1r3, because k isdep
proportional to K 1r3.
3. Numerical procedures
In this colloid transport model, the transient flow equation is coupled to the colloidtransport equation. Numerical solutions can be obtained with both transient and steady
Ž .state flow fields using the MCB method Sun, 1995 .
( )N. Sun et al.rJournal of Contaminant Hydrology 49 2001 173–199 181
3.1. Initial and boundary conditions
The flow region in our model is a vertical rectangular domain, with the horizontalx-axis ranging from 0 to 3 m and the vertical z-axis ranging from 0 and 1 m. The four
Žstraight lines G on which xs0, G on which zs0, G on which zs1, and G on1 2 3 4.which xs3 of the rectangular domain form the boundary G . The computational
domain V is encircled by the line boundary G . The initial and boundary conditions forthe flow equation are specified as follows:
h x sh at ts0, 3.1aŽ . Ž .0
h 0, z ,t sh for t)0, 0, z gG , 3.1bŽ . Ž . Ž .1 1
Eh x , z ,tŽ .s0 for t)0, x ,0 gG , 3.1cŽ . Ž .2
Ez zs0
Eh x , z ,tŽ .s0 for t)0, x ,1 gG , 3.1dŽ . Ž .3
Ez zs1
h 3, z ,t sh for t)0, 3, z gG , 3.1eŽ . Ž . Ž .2 4
where GsG jG jG jG , and h and h are fixed values of hydraulic heads on the1 2 3 4 1 2
boundaries. The steady state flow field is generated by using the transient flow equationfor sufficiently long time.
The initial and boundary conditions for the colloid transport equation are specified asŽfollows. Initially the porous medium has no deposited colloids i.e., zero surface
. Žcoverage, u su s0 . At the four boundaries of the rectangular domain G , G , G ,f u 1 2 3.and G , zero dispersive flux boundary conditions are specified. Furthermore, a given4
concentration of colloids is injected into the domain at t)0. The type of colloidinjection can be classified as pulse injection or continuous injection, depending on theduration of the injection. The mode of injection can be characterized as point injectionor line injection based on the number and locations of injection wells. The injection isset as the boundary condition for the colloid concentration.
3.2. Multiple cell balance algorithm
When physical and chemical heterogeneities are involved, there is no analyticalsolution for the coupled flow and colloid transport problem. In this section, we willdevelop a numerical method for solving this problem which is an extension of the MCB
Ž .method originally developed by Sun and Yeh 1983 .The following notations are used to derive the MCB solution:
gsp a2rf , 3.2aŽ .p
2K u ,u sp a k B u lqk B u lyl , 3.2bŽ . Ž . Ž . Ž . Ž .a f u p dep ,f f dep ,u u
K u ,u sk u lqk u 1yl . 3.2cŽ . Ž . Ž .r f u det ,f f det ,u u
( )N. Sun et al.rJournal of Contaminant Hydrology 49 2001 173–199182
Ž .In writing 3.2c , we assume that the dynamic release function is unity; i.e., the releaseprocess follows first-order kinetics. The governing colloid transport equation can then bewritten as
En K u ,u K u ,uŽ . Ž .a f u r f us=P D=n y=P Vn y nq . 3.3Ž . Ž . Ž .
Et g g
Ž .Integrating 3.3 for our two-dimensional problem and applying Green’s formula, weobtain
En En En EnD qD d zy D qD d x q n V d xyV d zŽ .H Hx x x z x z z z z xž / ž /Ex Ez Ex EzŽ . Ž .G G
En K u ,u K u ,uŽ . Ž .a f u r f us q ny d xd z . 3.4Ž .HH
Et g gŽ .V
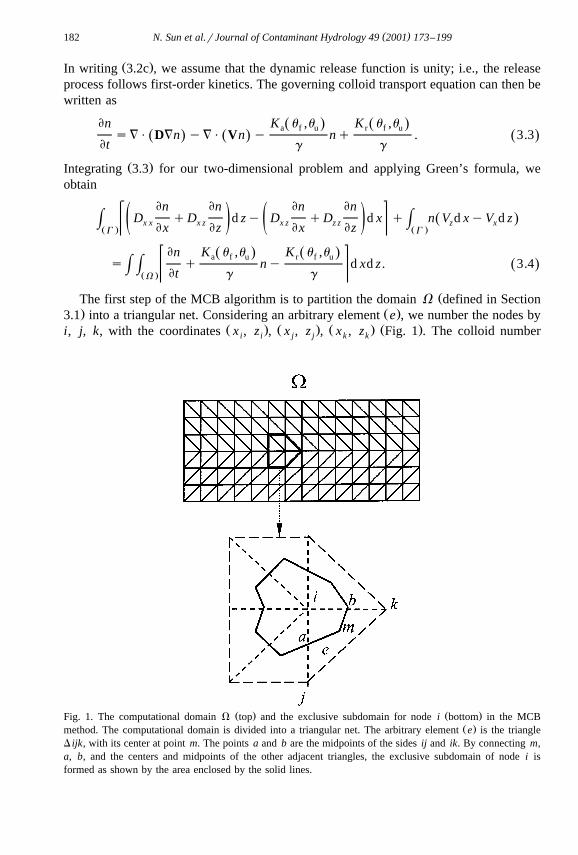
ŽThe first step of the MCB algorithm is to partition the domain V defined in Section. Ž .3.1 into a triangular net. Considering an arbitrary element e , we number the nodes by
Ž . Ž . Ž . Ž .i, j, k, with the coordinates x , z , x , z , x , z Fig. 1 . The colloid numberi i j j k k
Ž . Ž .Fig. 1. The computational domain V top and the exclusive subdomain for node i bottom in the MCBŽ .method. The computational domain is divided into a triangular net. The arbitrary element e is the triangle
D ijk, with its center at point m. The points a and b are the midpoints of the sides ij and ik. By connecting m,a, b, and the centers and midpoints of the other adjacent triangles, the exclusive subdomain of node i isformed as shown by the area enclosed by the solid lines.
( )N. Sun et al.rJournal of Contaminant Hydrology 49 2001 173–199 183
Ž .concentration in this element, denoted by n x, z,t , can be approximated by a linearinterpolation of its nodal values:
n x , z ,t sf x , z n t qf x , z n t qf x , z n t , x , z g e ,Ž . Ž . Ž . Ž . Ž . Ž . Ž . Ž . Ž .i i j j k k
3.5Ž .
where the interpolation function is
1f x , z s a qb xqc z ; ls i , j,k . 3.6Ž . Ž . Ž .l l l l2De
Ž .Here, D is the area of a triangular element e , and a , b , and c are coefficients whiche l l lŽ .can be calculated on the coordinates of nodes i, j, k Sun, 1995 . The following
Ž .expressions can then be written for the element e :
En 1s b n qb n qb n , 3.7aŽ .Ž .i i j j k k
Ex 2De
En 1s c n qc n qc n , 3.7bŽ . Ž .i i j j k k
Ez 2De
En En En Eni j ksf qf qf . 3.7cŽ .i j k
Et Et Et Et
Ž .The hydraulic head h and velocity components V and V , can also be represented byx zŽ .the same linear interpolation functions defined in Eq. 3.5 .
The second step is to form a subdomain surrounding the node i by linking up theŽ .center and midpoints of the sides of each triangle Fig. 1 . This area is called the
Ž .exclusiÕe subdomain of node i. Local mass balance requires that Eq. 3.4 be satisfied inthe exclusive subdomain as well.
In the third step, taking into account the boundary conditions and substituting theŽ . Ž .relevant Eqs. 3.5, 3.7a, 3.7b, 3.7c into Eq. 3.4 with respect to the domain V for
every unknown concentration node, we obtain a system of ordinary differential equa-Ž .tions ODEs
dnX X Xw x w xA nq B qF s0, 3.8Ž .
d tX wŽ Ž . .Ž .xwhere F s K u ,u rg 1rn S , with S being the area of the exclusive subdo-r, i f u 0 i i
main. The term in brackets accounts for the colloid release process, and AX and BX areX wŽ Ž .. xcoefficients with A containing the colloid deposition term K u ,u rg .a ,i f u
The fourth step is to solve the system of ODEs numerically by using the backwardEuler method. Because the transport equation and the surface coverage rate equation arecoupled, an iterative scheme is needed. A simple iteration approach is adopted to obtainthe colloid number concentration at each node. First, the unknown colloid numberconcentration is calculated based on the surface coverage at the old time level. Then thenew surface coverage rate is obtained according to the calculated colloid number
( )N. Sun et al.rJournal of Contaminant Hydrology 49 2001 173–199184
concentration. The surface coverage can be calculated from the surface coverage rate byapplying a first-order finite difference scheme
Eu lnew oldu su q D t , 3.9Ž .l lEt
where l represents the subscripts f or u, which denote the favorable and unfavorablesurface fractions, respectively. The surface coverage rate is determined from
Eu l 2 old cal oldsp a k B u n yk u , 3.10Ž .Ž .p dep , l l det ,l lEt
where ncal is the calculated colloid number concentration. The new surface coverage isthen compared with its old value. If the specified criterion for convergence is notsatisfied, the new surface coverage rate is recorded as the old value and substituted intothe transport equation to start another iteration between the transport equation and thesurface coverage rate equation. The iteration stops when the convergence criterion issatisfied for every node in the entire domain V .
To obtain an accurate numerical solution, both numerical dispersion and oscillationsare controlled simultaneously in the numerical code. The local Peclet number D xVrDwas set to less than 1 to control numerical dispersion. When the fluid velocity was toohigh, the upstream scheme was included in the MCB code through a weightingparameter to minimize oscillation errors. The Courant number, defined as the product ofinterstitial velocity and time step size divided by the spatial step size in the flowdirection, was also set to less than 1 so that the average displacement of fluid is less thanthe length of one grid space in one time step.
3.3. Validation of the numerical code
To validate the MCB code for colloid transport, the analytical solution derived byŽ .Lapidus and Amundson 1952 for the one-dimensional solute transport problem withŽ . Ž .finite rates of sorption k and desorption k was compared with our numerical1 2
solution for the following problem:
EC E2 C EC 1 ESsD yV y , 3.11aŽ .L 2Et Ex b EtEx
ESsk Cyk S, 3.11bŽ .1 2
Et
Ž .where bs´rr . As with Eq. 2.7 , these equations can be expressed in terms of n andb
u . The rate constants k and k , and the parameter b then become1 2
k s lk q 1yl k f , 3.12aŽ . Ž .1 dep ,f dep ,u
k s 1yl k fr p a2 n , 3.12bŽ . Ž .Ž .2 det ,u p 0
bs1.0. 3.12cŽ .
( )N. Sun et al.rJournal of Contaminant Hydrology 49 2001 173–199 185
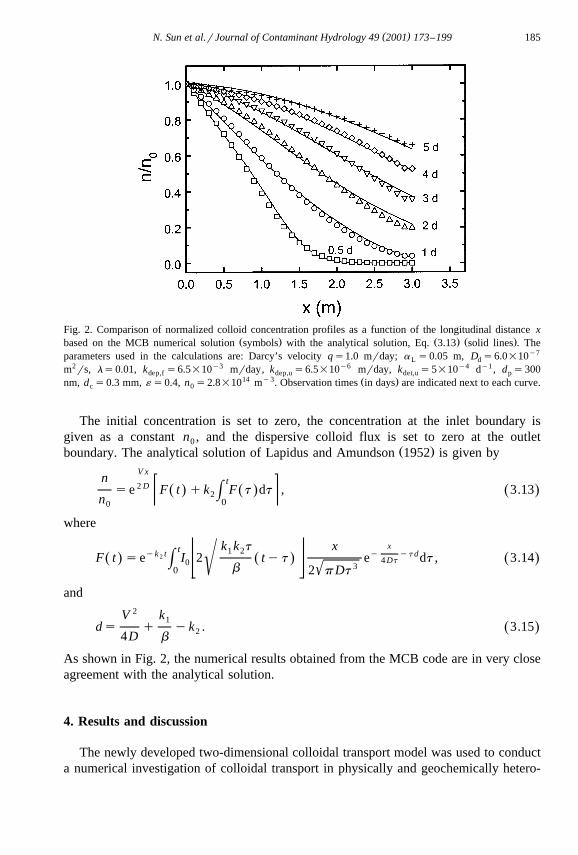
Fig. 2. Comparison of normalized colloid concentration profiles as a function of the longitudinal distance xŽ . Ž . Ž .based on the MCB numerical solution symbols with the analytical solution, Eq. 3.13 solid lines . The
parameters used in the calculations are: Darcy’s velocity qs1.0 mrday; a s0.05 m, D s6.0=10y7L d
m2rs, ls0.01, k s6.5=10y3 mrday, k s6.5=10y6 mrday, k s5=10y4 dy1 , d s300dep,f dep,u det,u p14 y3 Ž .nm, d s0.3 mm, ´s0.4, n s2.8=10 m . Observation times in days are indicated next to each curve.c 0
The initial concentration is set to zero, the concentration at the inlet boundary isgiven as a constant n , and the dispersive colloid flux is set to zero at the outlet0
Ž .boundary. The analytical solution of Lapidus and Amundson 1952 is given byV x
n t2 Dse F t qk F t dt , 3.13Ž . Ž . Ž .H2n 00
where
xk k t xt 1 2yk t y yt d2F t se I 2 tyt e dt , 3.14Ž . Ž . Ž .4 DtH 0 ( 3'b0 2 pDt
and
V 2 k1ds q yk . 3.15Ž .24D b
As shown in Fig. 2, the numerical results obtained from the MCB code are in very closeagreement with the analytical solution.
4. Results and discussion
The newly developed two-dimensional colloidal transport model was used to conducta numerical investigation of colloidal transport in physically and geochemically hetero-
( )N. Sun et al.rJournal of Contaminant Hydrology 49 2001 173–199186
geneous porous media. We first illustrate the effect of key model parameters on thegeneral colloid transport behavior. This is followed by a systematic investigation ofcolloid transport in layered as well as randomly heterogeneous subsurface porous media.
4.1. Influence of key model parameters
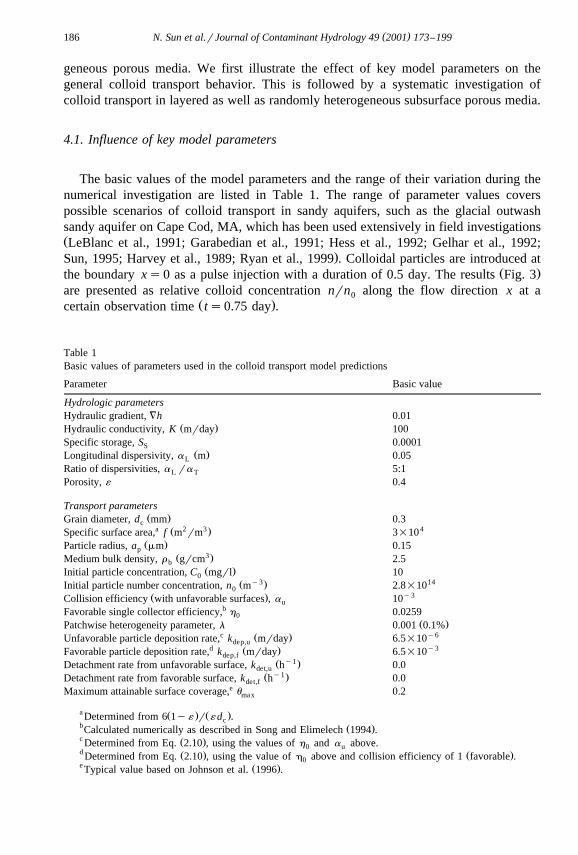
The basic values of the model parameters and the range of their variation during thenumerical investigation are listed in Table 1. The range of parameter values coverspossible scenarios of colloid transport in sandy aquifers, such as the glacial outwashsandy aquifer on Cape Cod, MA, which has been used extensively in field investigationsŽLeBlanc et al., 1991; Garabedian et al., 1991; Hess et al., 1992; Gelhar et al., 1992;
.Sun, 1995; Harvey et al., 1989; Ryan et al., 1999 . Colloidal particles are introduced atŽ .the boundary xs0 as a pulse injection with a duration of 0.5 day. The results Fig. 3
are presented as relative colloid concentration nrn along the flow direction x at a0Ž .certain observation time ts0.75 day .
Table 1Basic values of parameters used in the colloid transport model predictions
Parameter Basic value
Hydrologic parametersHydraulic gradient, =h 0.01
Ž .Hydraulic conductivity, K mrday 100Specific storage, S 0.0001S
Ž .Longitudinal dispersivity, a m 0.05L
Ratio of dispersivities, a ra 5:1L T
Porosity, ´ 0.4
Transport parametersŽ .Grain diameter, d mm 0.3c
a 2 3 4Ž .Specific surface area, f m rm 3=10Ž .Particle radius, a mm 0.15p
3Ž .Medium bulk density, r grcm 2.5bŽ .Initial particle concentration, C mgrl 100
y3 14Ž .Initial particle number concentration, n m 2.8=100y3Ž .Collision efficiency with unfavorable surfaces , a 10u
bFavorable single collector efficiency, h 0.02590Ž .Patchwise heterogeneity parameter, l 0.001 0.1%
c y6Ž .Unfavorable particle deposition rate, k mrday 6.5=10dep,ud y3Ž .Favorable particle deposition rate, k mrday 6.5=10dep,f
y1Ž .Detachment rate from unfavorable surface, k h 0.0det,uy1Ž .Detachment rate from favorable surface, k h 0.0det,f
eMaximum attainable surface coverage, u 0.2max
a Ž . Ž .Determined from 6 1y´ r ´ d .cb Ž .Calculated numerically as described in Song and Elimelech 1994 .c Ž .Determined from Eq. 2.10 , using the values of h and a above.0 ud Ž . Ž .Determined from Eq. 2.10 , using the value of h above and collision efficiency of 1 favorable .0e Ž .Typical value based on Johnson et al. 1996 .
( )N. Sun et al.rJournal of Contaminant Hydrology 49 2001 173–199 187
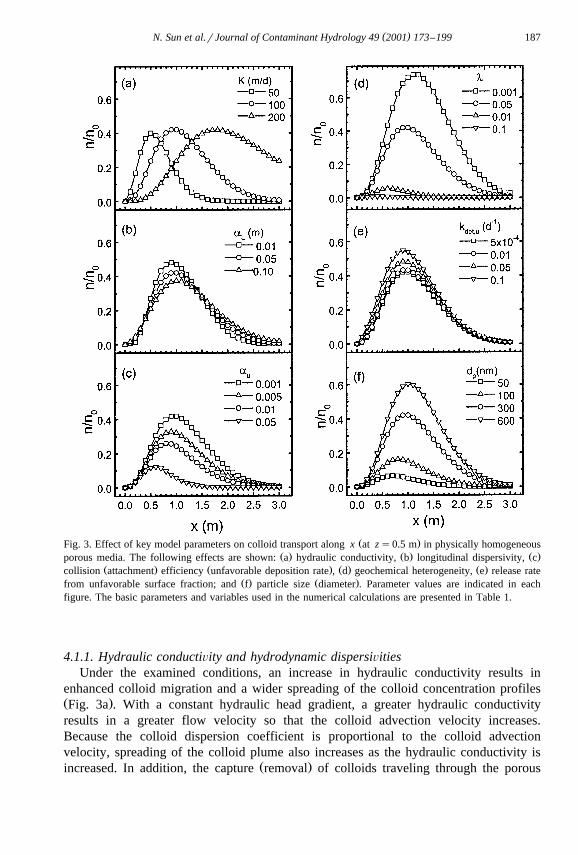
Ž .Fig. 3. Effect of key model parameters on colloid transport along x at zs0.5 m in physically homogeneousŽ . Ž . Ž .porous media. The following effects are shown: a hydraulic conductivity, b longitudinal dispersivity, c
Ž . Ž . Ž . Ž .collision attachment efficiency unfavorable deposition rate , d geochemical heterogeneity, e release rateŽ . Ž .from unfavorable surface fraction; and f particle size diameter . Parameter values are indicated in each
figure. The basic parameters and variables used in the numerical calculations are presented in Table 1.
4.1.1. Hydraulic conductiÕity and hydrodynamic dispersiÕitiesUnder the examined conditions, an increase in hydraulic conductivity results in
enhanced colloid migration and a wider spreading of the colloid concentration profilesŽ .Fig. 3a . With a constant hydraulic head gradient, a greater hydraulic conductivityresults in a greater flow velocity so that the colloid advection velocity increases.Because the colloid dispersion coefficient is proportional to the colloid advectionvelocity, spreading of the colloid plume also increases as the hydraulic conductivity is
Ž .increased. In addition, the capture removal of colloids traveling through the porous
( )N. Sun et al.rJournal of Contaminant Hydrology 49 2001 173–199188
medium decreases with increasing flow velocity, resulting in a slightly less attenuatedcolloid concentration profile.
Hydrodynamic dispersion is also controlled by the longitudinal and transverseŽ Ž ..dispersivities Eq. 2.6 . The ratio of longitudinal dispersivity to transverse dispersivity
Ž .is typically in the range of 5–20 Sun, 1995 . We assumed a ratio of 5 and investigatedthe effect of varying the longitudinal dispersivity. Because the longitudinal dispersivity
Ž .is scale-dependent, and our problem is of local scale ca. 3 m , only a narrow range ofŽ .values was selected for the longitudinal dispersivity. The results Fig. 3b show that
small changes in longitudinal dispersivity lead to relatively large changes in the colloidconcentration profiles.
( )4.1.2. Particle deposition rate and attachment collision efficiencyTo investigate the effect of particle deposition rate on colloid transport behavior, a
Ž .constant geochemical heterogeneity ls0.01 was assumed. We fixed the favorableparticle deposition rate coefficient and adjusted the unfavorable deposition rate bychoosing different values for the collision efficiency of the unfavorable surface fraction
Ž .a . The results Fig. 3c show that particle deposition rate can substantially affect theu
colloid concentration profile. As the collision efficiency a increases, the colloidu
deposition rate on the unfavorable surface fraction increases, and less colloids can bedetected in the aqueous phase. The magnitude of the collision efficiency a reflects theu
Ž .effect of changes in the solution chemical composition Elimelech and O’Melia, 1990 .
4.1.3. Geochemical heterogeneityBy fixing the particle deposition rate coefficients k and k , the overall particledep,f dep,u
deposition rate can be controlled by the geochemical heterogeneity parameter l. Themarked effect of geochemical heterogeneity on colloidal transport is illustrated in Fig.3d. An increase in geochemical heterogeneity results in an increased overall colloiddeposition rate and a reduced concentration of colloids in bulk solution. For theconditions investigated in Fig. 3d, a substantial geochemical heterogeneity of subsurface
Ž .porous media )10% may result in nearly complete immobilization of colloidalparticles as shown by the flat, attenuated colloid concentration profile.
4.1.4. Particle release rateThe colloidal transport model assumes that particle deposition onto the favorable
surface fraction is irreversible; hence, the colloid release rate from the favorable surfacefraction is zero. This assumption has been confirmed in particle deposition studies
Žinvolving oppositely charged particles and collector surfaces Ryan and Elimelech,.1996 . On the other hand, in particle deposition studies involving similarly charged
Žparticles and collector surfaces, a finite rate of colloid release can be detected Meinders.et al., 1992; Johnson et al., 1996 . Hence, we investigated the effect of colloid release
rate from the unfavorable surface fraction on the colloid concentration profile as shownin Fig. 3e. The results demonstrate that larger release rate coefficients result in increasedcolloid concentration in the aqueous phase, whereas smaller release rate coefficientshave negligible effect on the colloid concentration profile. Since the colloid release rate
Ž .depends on the concentration of deposited particles first-order kinetics , the effect of
( )N. Sun et al.rJournal of Contaminant Hydrology 49 2001 173–199 189
colloid release on the colloid concentration profile depends on the overall colloiddeposition rate onto the unfavorable surface fraction.
4.1.5. Particle sizeFig. 3f demonstrates that the model solution is very sensitive to particle size. Particle
size influences colloidal transport mainly through its effect on colloid deposition rate. Asexpected for the deposition of Brownian particles, which is controlled by a convective-diffusion mechanism, the deposition rate becomes smaller as particle size increases.Consequently, larger particles migrate faster in the porous medium and their concentra-tion in the liquid phase is greater than that of smaller particles.
4.2. Colloid transport in layered heterogeneous porous media
The porous medium was divided into three horizontal layers parallel to the flowŽ . Ž .direction. The layers are denoted as layer I 0–0.3 m , layer II 0.3–0.7 m , and layer III
Ž .0.7–1.0 m from bottom to top. Layers I and III were assigned the same heterogeneityparameter values, whereas a different parameter value was assigned to the middle layer
Ž .II. The colloid suspension was assumed to be fed continuously line injection into theŽ .porous medium at the inlet boundary xs0 , with 11 injection points set at 0.1 m
intervals along the z-direction. Observations of the normalized concentration profilesover the entire two-dimensional porous medium domain are presented for ts0.75 day.The physical and geochemical heterogeneity parameter values used in the numerical
Ž .investigation represented by K and l, respectively were comparable to those reportedŽfor the Cape Cod sandy aquifer Harvey et al., 1989; Hess et al., 1992; Ryan et al.,
.1999 .The effect of layered–distributed physical heterogeneity on colloid transport is
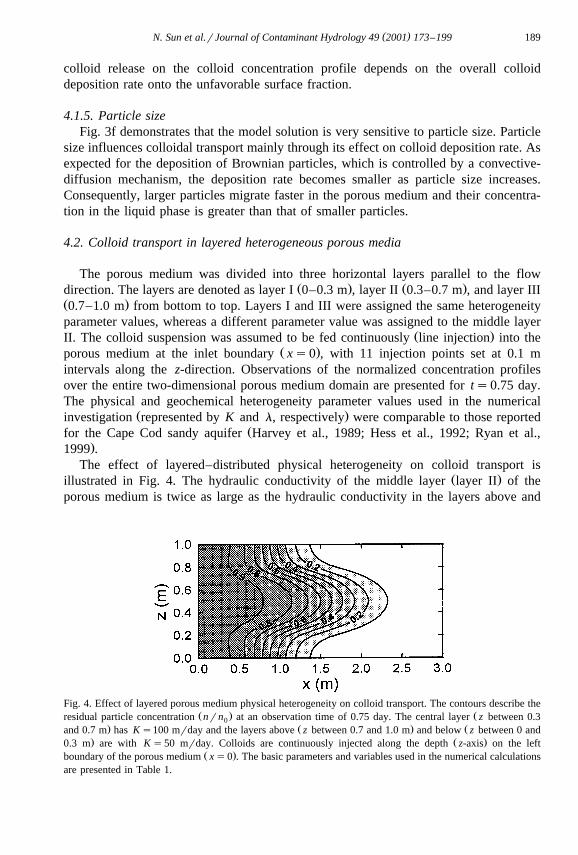
Ž .illustrated in Fig. 4. The hydraulic conductivity of the middle layer layer II of theporous medium is twice as large as the hydraulic conductivity in the layers above and
Fig. 4. Effect of layered porous medium physical heterogeneity on colloid transport. The contours describe theŽ . Žresidual particle concentration nrn at an observation time of 0.75 day. The central layer z between 0.30
. Ž . Žand 0.7 m has Ks100 mrday and the layers above z between 0.7 and 1.0 m and below z between 0 and. Ž .0.3 m are with Ks50 mrday. Colloids are continuously injected along the depth z-axis on the left
Ž .boundary of the porous medium xs0 . The basic parameters and variables used in the numerical calculationsare presented in Table 1.
( )N. Sun et al.rJournal of Contaminant Hydrology 49 2001 173–199190
below. Therefore, the fluid in the central layer flows faster than the other two layers, andmost of the colloids migrate with the flow through the more permeable layer. Thisexample points out to the paramount importance of preferential flow paths in colloidtransport, which can be significantly important in colloid-facilitated transport of contam-
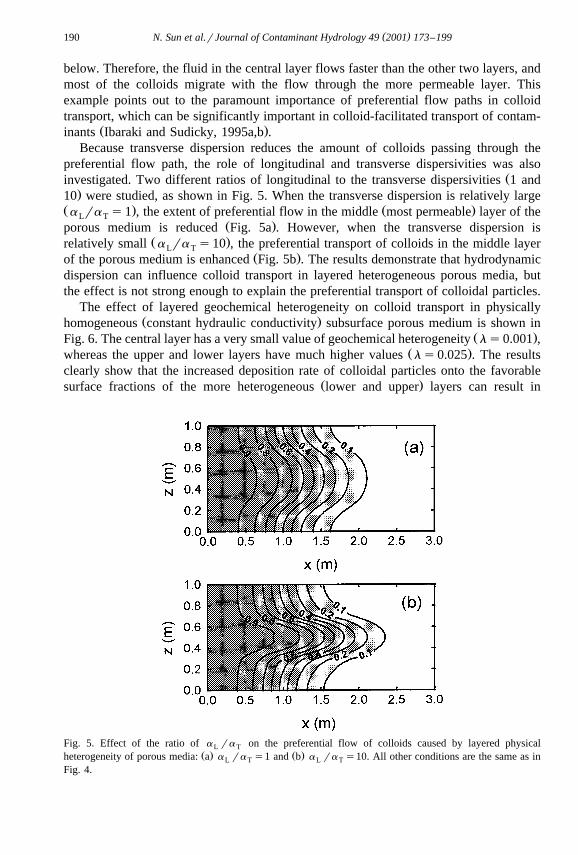
Ž .inants Ibaraki and Sudicky, 1995a,b .Because transverse dispersion reduces the amount of colloids passing through the
preferential flow path, the role of longitudinal and transverse dispersivities was alsoŽinvestigated. Two different ratios of longitudinal to the transverse dispersivities 1 and
.10 were studied, as shown in Fig. 5. When the transverse dispersion is relatively largeŽ . Ž .a ra s1 , the extent of preferential flow in the middle most permeable layer of theL T
Ž .porous medium is reduced Fig. 5a . However, when the transverse dispersion isŽ .relatively small a ra s10 , the preferential transport of colloids in the middle layerL T
Ž .of the porous medium is enhanced Fig. 5b . The results demonstrate that hydrodynamicdispersion can influence colloid transport in layered heterogeneous porous media, butthe effect is not strong enough to explain the preferential transport of colloidal particles.
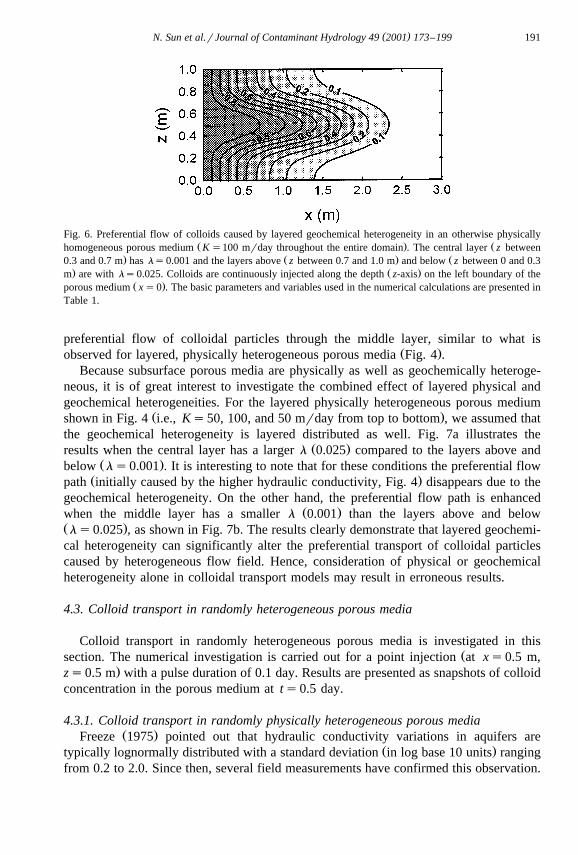
The effect of layered geochemical heterogeneity on colloid transport in physicallyŽ .homogeneous constant hydraulic conductivity subsurface porous medium is shown in
Ž .Fig. 6. The central layer has a very small value of geochemical heterogeneity ls0.001 ,Ž .whereas the upper and lower layers have much higher values ls0.025 . The results
clearly show that the increased deposition rate of colloidal particles onto the favorableŽ .surface fractions of the more heterogeneous lower and upper layers can result in
Fig. 5. Effect of the ratio of a ra on the preferential flow of colloids caused by layered physicalL TŽ . Ž .heterogeneity of porous media: a a ra s1 and b a ra s10. All other conditions are the same as inL T L T
Fig. 4.
( )N. Sun et al.rJournal of Contaminant Hydrology 49 2001 173–199 191
Fig. 6. Preferential flow of colloids caused by layered geochemical heterogeneity in an otherwise physicallyŽ . Žhomogeneous porous medium Ks100 mrday throughout the entire domain . The central layer z between
. Ž . Ž0.3 and 0.7 m has ls0.001 and the layers above z between 0.7 and 1.0 m and below z between 0 and 0.3. Ž .m are with ls0.025. Colloids are continuously injected along the depth z-axis on the left boundary of the
Ž .porous medium xs0 . The basic parameters and variables used in the numerical calculations are presented inTable 1.
preferential flow of colloidal particles through the middle layer, similar to what isŽ .observed for layered, physically heterogeneous porous media Fig. 4 .
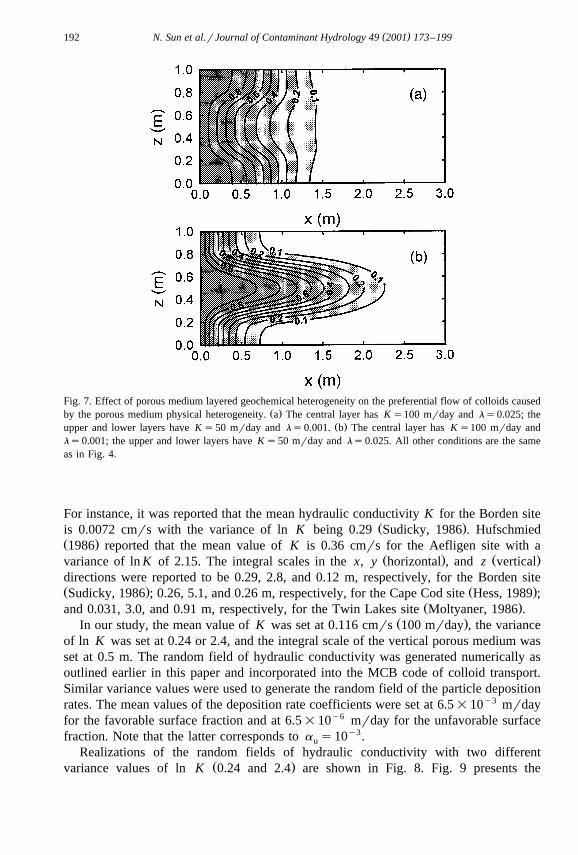
Because subsurface porous media are physically as well as geochemically heteroge-neous, it is of great interest to investigate the combined effect of layered physical andgeochemical heterogeneities. For the layered physically heterogeneous porous medium
Ž .shown in Fig. 4 i.e., Ks50, 100, and 50 mrday from top to bottom , we assumed thatthe geochemical heterogeneity is layered distributed as well. Fig. 7a illustrates the
Ž .results when the central layer has a larger l 0.025 compared to the layers above andŽ .below ls0.001 . It is interesting to note that for these conditions the preferential flow
Ž .path initially caused by the higher hydraulic conductivity, Fig. 4 disappears due to thegeochemical heterogeneity. On the other hand, the preferential flow path is enhanced
Ž .when the middle layer has a smaller l 0.001 than the layers above and belowŽ .ls0.025 , as shown in Fig. 7b. The results clearly demonstrate that layered geochemi-cal heterogeneity can significantly alter the preferential transport of colloidal particlescaused by heterogeneous flow field. Hence, consideration of physical or geochemicalheterogeneity alone in colloidal transport models may result in erroneous results.
4.3. Colloid transport in randomly heterogeneous porous media
Colloid transport in randomly heterogeneous porous media is investigated in thisŽsection. The numerical investigation is carried out for a point injection at xs0.5 m,
.zs0.5 m with a pulse duration of 0.1 day. Results are presented as snapshots of colloidconcentration in the porous medium at ts0.5 day.
4.3.1. Colloid transport in randomly physically heterogeneous porous mediaŽ .Freeze 1975 pointed out that hydraulic conductivity variations in aquifers are
Ž .typically lognormally distributed with a standard deviation in log base 10 units rangingfrom 0.2 to 2.0. Since then, several field measurements have confirmed this observation.
( )N. Sun et al.rJournal of Contaminant Hydrology 49 2001 173–199192
Fig. 7. Effect of porous medium layered geochemical heterogeneity on the preferential flow of colloids causedŽ .by the porous medium physical heterogeneity. a The central layer has Ks100 mrday and ls0.025; the
Ž .upper and lower layers have Ks50 mrday and ls0.001. b The central layer has Ks100 mrday andls0.001; the upper and lower layers have Ks50 mrday and ls0.025. All other conditions are the sameas in Fig. 4.
For instance, it was reported that the mean hydraulic conductivity K for the Borden siteŽ .is 0.0072 cmrs with the variance of ln K being 0.29 Sudicky, 1986 . Hufschmied
Ž .1986 reported that the mean value of K is 0.36 cmrs for the Aefligen site with aŽ . Ž .variance of ln K of 2.15. The integral scales in the x, y horizontal , and z vertical
directions were reported to be 0.29, 2.8, and 0.12 m, respectively, for the Borden siteŽ . Ž .Sudicky, 1986 ; 0.26, 5.1, and 0.26 m, respectively, for the Cape Cod site Hess, 1989 ;
Ž .and 0.031, 3.0, and 0.91 m, respectively, for the Twin Lakes site Moltyaner, 1986 .Ž .In our study, the mean value of K was set at 0.116 cmrs 100 mrday , the variance
of ln K was set at 0.24 or 2.4, and the integral scale of the vertical porous medium wasset at 0.5 m. The random field of hydraulic conductivity was generated numerically asoutlined earlier in this paper and incorporated into the MCB code of colloid transport.Similar variance values were used to generate the random field of the particle depositionrates. The mean values of the deposition rate coefficients were set at 6.5=10y3 mrdayfor the favorable surface fraction and at 6.5=10y6 mrday for the unfavorable surfacefraction. Note that the latter corresponds to a s10y3.u
Realizations of the random fields of hydraulic conductivity with two differentŽ .variance values of ln K 0.24 and 2.4 are shown in Fig. 8. Fig. 9 presents the
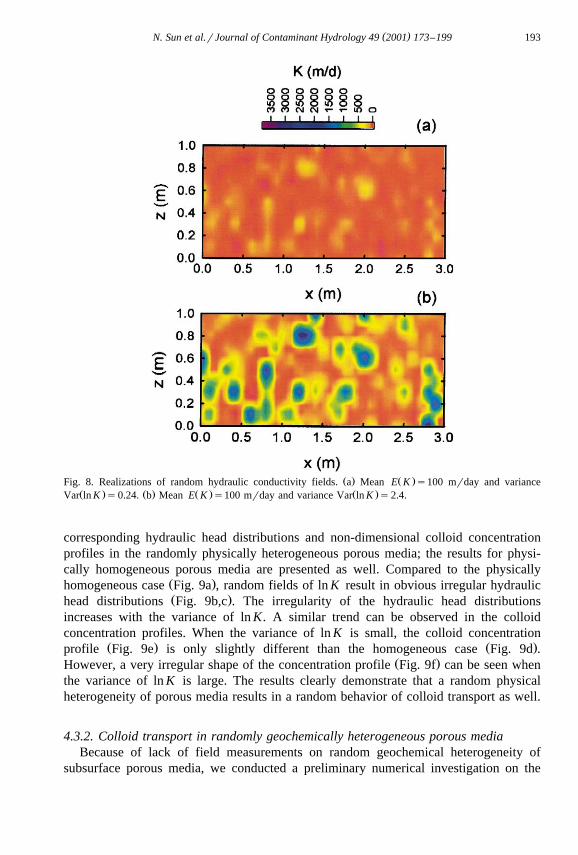
( )N. Sun et al.rJournal of Contaminant Hydrology 49 2001 173–199 193
Ž . Ž .Fig. 8. Realizations of random hydraulic conductivity fields. a Mean E K s100 mrday and varianceŽ . Ž . Ž . Ž .Var ln K s0.24. b Mean E K s100 mrday and variance Var ln K s2.4.
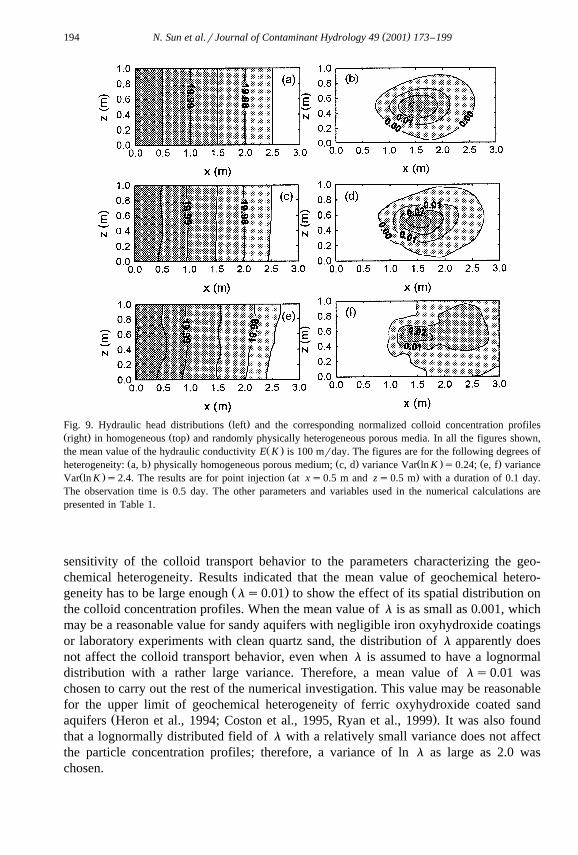
corresponding hydraulic head distributions and non-dimensional colloid concentrationprofiles in the randomly physically heterogeneous porous media; the results for physi-cally homogeneous porous media are presented as well. Compared to the physically
Ž .homogeneous case Fig. 9a , random fields of ln K result in obvious irregular hydraulicŽ .head distributions Fig. 9b,c . The irregularity of the hydraulic head distributions
increases with the variance of ln K. A similar trend can be observed in the colloidconcentration profiles. When the variance of ln K is small, the colloid concentration
Ž . Ž .profile Fig. 9e is only slightly different than the homogeneous case Fig. 9d .Ž .However, a very irregular shape of the concentration profile Fig. 9f can be seen when
the variance of ln K is large. The results clearly demonstrate that a random physicalheterogeneity of porous media results in a random behavior of colloid transport as well.
4.3.2. Colloid transport in randomly geochemically heterogeneous porous mediaBecause of lack of field measurements on random geochemical heterogeneity of
subsurface porous media, we conducted a preliminary numerical investigation on the
( )N. Sun et al.rJournal of Contaminant Hydrology 49 2001 173–199194
Ž .Fig. 9. Hydraulic head distributions left and the corresponding normalized colloid concentration profilesŽ . Ž .right in homogeneous top and randomly physically heterogeneous porous media. In all the figures shown,
Ž .the mean value of the hydraulic conductivity E K is 100 mrday. The figures are for the following degrees ofŽ . Ž . Ž . Ž .heterogeneity: a, b physically homogeneous porous medium; c, d variance Var ln K s0.24; e, f variance
Ž . Ž .Var ln K s2.4. The results are for point injection at xs0.5 m and zs0.5 m with a duration of 0.1 day.The observation time is 0.5 day. The other parameters and variables used in the numerical calculations arepresented in Table 1.
sensitivity of the colloid transport behavior to the parameters characterizing the geo-chemical heterogeneity. Results indicated that the mean value of geochemical hetero-
Ž .geneity has to be large enough ls0.01 to show the effect of its spatial distribution onthe colloid concentration profiles. When the mean value of l is as small as 0.001, whichmay be a reasonable value for sandy aquifers with negligible iron oxyhydroxide coatingsor laboratory experiments with clean quartz sand, the distribution of l apparently doesnot affect the colloid transport behavior, even when l is assumed to have a lognormaldistribution with a rather large variance. Therefore, a mean value of ls0.01 waschosen to carry out the rest of the numerical investigation. This value may be reasonablefor the upper limit of geochemical heterogeneity of ferric oxyhydroxide coated sand
Ž .aquifers Heron et al., 1994; Coston et al., 1995, Ryan et al., 1999 . It was also foundthat a lognormally distributed field of l with a relatively small variance does not affectthe particle concentration profiles; therefore, a variance of ln l as large as 2.0 waschosen.
( )N. Sun et al.rJournal of Contaminant Hydrology 49 2001 173–199 195
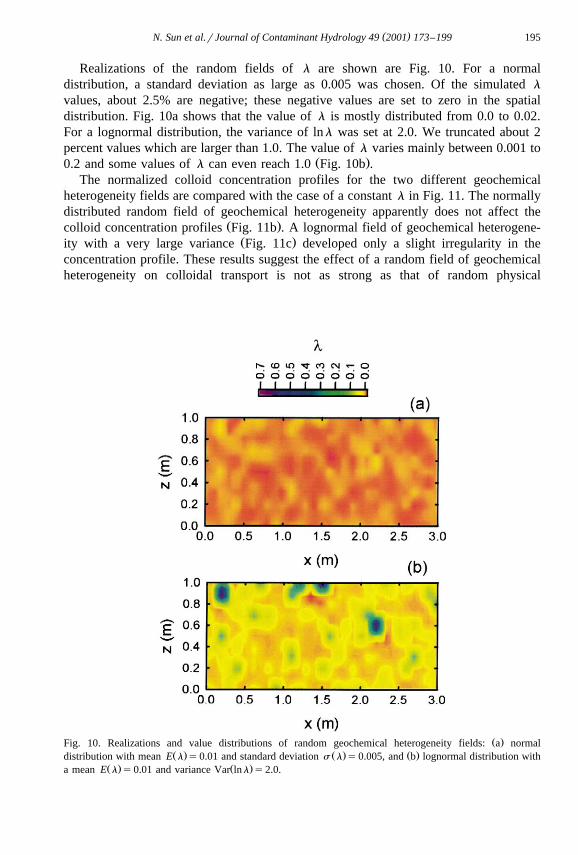
Realizations of the random fields of l are shown are Fig. 10. For a normaldistribution, a standard deviation as large as 0.005 was chosen. Of the simulated l
values, about 2.5% are negative; these negative values are set to zero in the spatialdistribution. Fig. 10a shows that the value of l is mostly distributed from 0.0 to 0.02.For a lognormal distribution, the variance of lnl was set at 2.0. We truncated about 2percent values which are larger than 1.0. The value of l varies mainly between 0.001 to
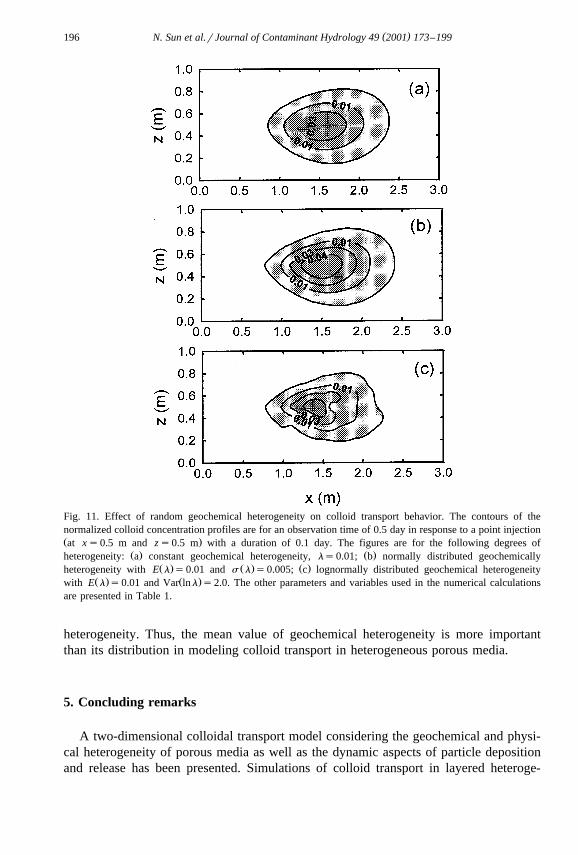
Ž .0.2 and some values of l can even reach 1.0 Fig. 10b .The normalized colloid concentration profiles for the two different geochemical
heterogeneity fields are compared with the case of a constant l in Fig. 11. The normallydistributed random field of geochemical heterogeneity apparently does not affect the
Ž .colloid concentration profiles Fig. 11b . A lognormal field of geochemical heterogene-Ž .ity with a very large variance Fig. 11c developed only a slight irregularity in the
concentration profile. These results suggest the effect of a random field of geochemicalheterogeneity on colloidal transport is not as strong as that of random physical
Ž .Fig. 10. Realizations and value distributions of random geochemical heterogeneity fields: a normalŽ . Ž . Ž .distribution with mean E l s0.01 and standard deviation s l s0.005, and b lognormal distribution with
Ž . Ž .a mean E l s0.01 and variance Var lnl s2.0.
( )N. Sun et al.rJournal of Contaminant Hydrology 49 2001 173–199196
Fig. 11. Effect of random geochemical heterogeneity on colloid transport behavior. The contours of thenormalized colloid concentration profiles are for an observation time of 0.5 day in response to a point injectionŽ .at xs0.5 m and zs0.5 m with a duration of 0.1 day. The figures are for the following degrees of
Ž . Ž .heterogeneity: a constant geochemical heterogeneity, ls0.01; b normally distributed geochemicallyŽ . Ž . Ž .heterogeneity with E l s0.01 and s l s0.005; c lognormally distributed geochemical heterogeneity
Ž . Ž .with E l s0.01 and Var lnl s2.0. The other parameters and variables used in the numerical calculationsare presented in Table 1.
heterogeneity. Thus, the mean value of geochemical heterogeneity is more importantthan its distribution in modeling colloid transport in heterogeneous porous media.
5. Concluding remarks
A two-dimensional colloidal transport model considering the geochemical and physi-cal heterogeneity of porous media as well as the dynamic aspects of particle depositionand release has been presented. Simulations of colloid transport in layered heteroge-
( )N. Sun et al.rJournal of Contaminant Hydrology 49 2001 173–199 197
neous porous media indicate that both physical and geochemical heterogeneities play animportant role in colloid transport. Both types of layered heterogeneity can result inpreferential flow of colloidal particles. The combined effect of layered physical andgeochemical heterogeneities, however, may enhance or reduce preferential flow ofcolloids.
A random distribution of hydraulic conductivity results in a random flow field and anirregularly distributed colloid concentration profile in the porous medium. Comparedwith random physical heterogeneity, the effect of random patchwise geochemicalheterogeneity on colloid transport behavior is not significant. It is mostly the mean valueof geochemical heterogeneity rather than its distribution that governs the colloidtransport behavior.
The model results have direct implications for colloid-facilitated transport of contami-nants in groundwater. We expect a limited potential for colloid-facilitated transport ofcontaminants in surficial aquifers with porous matrix having Fe oxyhydroxide coatingsbecause of extensive colloid deposition. On the other hand, subsurface environmentswith physical heterogeneities in the form of preferential flow paths may result inextensive colloid transport and hence have the potential for colloid-facilitated contami-nant transport.
Acknowledgements
ŽThe authors acknowledge the support of EPA cooperative agreement CR824593-01. Žwith R.S. Kerr Laboratory and the US National Science Foundation Grants EAR-.9418472 and BES-9705717 .
References
Abdel-Salam, A., Chrysikopoulos, C.V., 1995. Modeling of colloid and colloid-facilitated contaminanttransport in a two-dimensional fracture with spatially variable aperture. Transp. Porous Media 20,197–221.
Bear, J., 1972. Dynamics of Fluids in Porous Media. Dover Publications, New York.Black, T.C., Freyberg, D.L., 1987. Stochastic modeling of vertically averaged concentration uncertainty in a
perfectly stratified aquifer. Water Resour. Res. 23, 997–1004.Bosma, W.J., van der Zee, S.E.A.T.M., 1993. Transport of reacting solute in a one-dimensional, chemically
Ž .heterogeneous porous medium. Water Resour. Res. 29 1 , 117–131.Chrysikopoulos, C.V., Abdel-Salam, A., 1997. Modeling of colloid transport and deposition in saturated
fractures. Colloids Surf., A 121, 189–202.Chrysikopoulos, C.V., Kitanidis, P.K., Roberts, P.V., 1990. Analysis of one-dimensional solute transport
through porous media with spatially variable retardation factor. Water Resour. Res. 26, 437–446.Corapcioglu, M.Y., Jiang, S., 1993. Colloid-facilitated groundwater contaminant transport. Water Resour. Res.
Ž .29 7 , 2215–2226.Coston, J.A., Fuller, C.C., Davis, J.A., 1995. Pb2q and Zn2q adsorption by a natural aluminum- and
iron-bearing surfaces coating on an aquifer sand. Geochim. Cosmochim. Acta 59, 3535–3547.Dagan, G., 1989. Flow and Transport in Porous Formations. Springer-Verlag, New York.de Marsily, C., 1986. Quantitative Hydrology. Academic Press, San Diego.
( )N. Sun et al.rJournal of Contaminant Hydrology 49 2001 173–199198
Elimelech, M., O’Melia, C.R., 1990. Kinetics of deposition of colloidal particles in porous media. Environ.Sci. Technol. 24, 1528–1536.
Freeze, R.A., 1975. A stochastic–conceptual analysis of one-dimensional groundwater flow in nonuniformŽ .homogeneous media. Water Resour. Res. 11 5 , 725–741.
Fuhs, G.W., Chen, M., Sturman, L.S., Moore, R.S., 1985. Virus adsorption to mineral surfaces is reduced bymineral overgrowth and organic coatings. Microb. Ecol. 11, 25–39.
Garabedian, S.P., Leblanc, D.R., Gelhar, L.W., Celia, M.A., 1991. Large-scale natural gradient tracer test insand and gravel, Cape Cod, Massachusetts: 2. Analysis of spatial moments for a nonreactive tracer. WaterResour. Res. 27, 911–924.
Gelhar, L.W., Axness, C.L., 1983. Three-dimensional stochastic analysis of macrodispersion in aquifers.Ž .Water Resour. Res. 19 1 , 161–180.
Gelhar, L.W., Welty, C., Rehfeldt, K.R., 1992. A critical review of data on field-scale dispersion in aquifers.Ž .Water Resour. Res. 28 7 , 1955–1974.
Gelhar, L.W., Gutiahr, A.L., Naff, R.L., 1979. Stochastic analysis of macrodispersion in stratified aquifer.Ž .Water Resour. Res. 15 6 , 1387–1397.
Grolimund, D., Borkovec, M., Bartmettler, K., Sticher, H., 1996. Colloid-facilitated transport of stronglysorbing contaminants in natural porous media: a laboratory column study. Environ. Sci. Technol. 30,3118–3123.
Harvey, R.W., George, L.H., Smith, R.L., LeBlanc, D.R., 1989. Transport of microspheres and indigenousbacteria through a sandy aquifer: results of natural and forced-gradient tracer experiments. Environ. Sci.Technol. 23, 51–56.
Ž . Ž .Heron, G., Crouzet, C., Bourg, A.C.M., Christensen, T.H., 1994. Separation of Fe II and Fe III incontaminated aquifer sediments using chemical extraction techniques. Environ. Sci. Technol. 28, 1698–1705.
Hess, K.M., 1989. Use of borehole flowmeter to determine spatial heterogeneity of hydraulic conductivity andmacrodispersivity in a sand and gravel aquifer, Cape Cod, Massachusetts. NWWA Conference on NewField Techniques for Qualifying the Physical and Chemical properties of Heterogeneous Aquifers. Natl.Water Well Assoc., Houston, Tex.
Hess, K.M., Wolf, S.H., Celia, M.A., 1992. Large-scale natural gradient tracer test in sand and gravel, CapeCode, Massachusetts: 3. Hydraulic conductivity variability and calculated macrodispersivities. Water
Ž .Resour. Res. 28 8 , 2011–2027.Hufschmied, P., 1986. Estimation of three-dimensional statistically anisotropic hydraulic conductivity field by
means of single well pumping tests combined with flowmeter measurements. Hydrogeologie 2, 163–174.Ibaraki, M., Sudicky, E.A., 1995a. Colloid-facilitated contaminant transport in discretely fractured porous
Ž .media: 1. Numerical formulation and sensitivity analysis. Water Resour. Res. 31 12 , 2945–2960.Ibaraki, M., Sudicky, E.A., 1995b. Colloid-facilitated contaminant transport in discretely fractured porous
Ž .media: 2. Fracture network examples. Water Resour. Res. 31 12 , 2961–2969.Johnson, P.R., Elimelech, M., 1995. Dynamics of colloid deposition in porous media: blocking based on
random sequential adsorption. Langmuir 11, 801–812.Johnson, W.P., Blue, K.A., Logan, B.E., Arnold, R.G., 1995. Modeling bacterial detachment during transport
Ž .through porous media as a residence-time-dependent process. Water Resour. Res. 31 11 , 2649–2658.Johnson, P.R., Sun, N., Elimelech, M., 1996. Colloid transport in geochemically heterogeneous porous media:
Ž .modeling and measurement. Environ. Sci. Technol. 30 11 , 3284–3293.Lapidus, L., Amundson, N.R., 1952. Mathematics of adsorption in beds: VI. The effect of longitudinal
diffusion in ion exchange and chromatographic columns. J. Phys. Chem. 56, 984–988.Leblanc, D.R., Garabedian, S.P., Hess, K.M., Gelhar, L.W., Quadri, R.D., Stollenwerk, K.G., Wood, W.W.,
1991. Large-scale natural gradient tracer test in sand and gravel, Cape Cod, Massachusetts: 1. Experimen-tal design and observed tracer movement. Water Resour. Res. 27, 895–910.
Levich, V.G., 1962. Physicochemical Hydrodynamics. Prentice-Hall, New Jersey.Liu, H.H., Molz, F.J., 1997. Comment on AEvidence for non-Gaussian scaling behavior in heterogeneous
Ž .sedimentary formationsB by Scott Painter. Water Resour. Res. 33 4 , 907–908.Mantoglou, A., Wilson, J.L., 1982. The turning bands method for simulation of random fields using line
Ž .generation by a spectral method. Water Resour. Res. 18 5 , 1379–1394.
( )N. Sun et al.rJournal of Contaminant Hydrology 49 2001 173–199 199
McCarthy, J.F., Zachara, J.M., 1989. Subsurface transport of contaminants. Environ. Sci. Technol. 23,496–502.
Meinders, J.M., Noordmans, J., Busscher, H.J., 1992. Simultaneous monitoring of the adsorption anddesorption of colloidal particles during deposition in a parallel plate flow chamber. J. Colloid Interface Sci.152, 265–280.
Moltyaner, G.L., 1986. Stochastic versus deterministic: a case study. Hydrogeologie 2, 183–196.Painter, S., 1996. Evidence for non-Gaussian scaling behavior in heterogeneous sedimentary formations. Water
Ž .Resour. Res. 32 5 , 1183–1195.Roy, S.B., Dzombak, D.A., 1998. Sorption nonequilibrium effects on colloid-enhanced transport of hydropho-
bic organic compounds in porous media. J. Contam. Hydrol. 30, 179–200.Rubin, Y., 1990. Stochastic modeling of macrodispersion in heterogeneous porous media. Water Resour. Res.
Ž .26 1 , 133–141.Ryan, J.N., Elimelech, M., 1996. Colloid mobilization and transport in groundwater. Colloid Surf. A 107,
1–52.Ryan, J.N., Elimelech, M., Ard, R.A., Harvey, R.W., 1999. Bacteriophage PRD1 and silica colloid transport
Ž .and recovery in an iron oxide-coated sand aquifer. Environ. Sci. Technol. 33 1 , 63–73.Saiers, J.E., Hornberger, G.M., Harvey, C., 1994. Colloidal silica transport through structured, heterogeneous
porous media. J. Hydrol. 163, 271–288.Scholl, M.A., Harvey, R.W., 1992. Laboratory investigation on the role of sediment surface and groundwater
chemistry in transport of bacteria through a contaminated sandy aquifer. Environ. Sci Technol. 26,1410–1417.
Scholl, M.A., Mills, A.L., Herman, J.S., Hornberger, G.M., 1990. The influence of mineralogy and solutionchemistry on the attachment of bacteria to representative aquifer materials. J. Contam. Hydrol. 6, 321–336.
Song, L., Elimelech, M., 1994. Transient deposition of colloidal particles in heterogeneous porous media. J.Colloid Interface Sci. 167, 301–313.
Song, L., Johnson, P.R., Elimelech, M., 1994. Kinetic colloid deposition onto heterogeneously chargedŽ .surfaces in porous media. Environ. Sci Technol. 28 6 , 1164–1171.
Sudicky, E.A., 1986. A natural gradient experiment on solute transport in a sand aquifer: spatial variability ofŽ .hydraulic conductivity and its role in the dispersion process. Water Resour. Res. 22 13 , 2069–2082.
Sun, N.-Z., 1995. Mathematical Modeling of Groundwater Pollution. Springer-Verlag, New York.Sun, N.-Z., Yeh, W.W.-G., 1983. A proposed upstream weight numerical method for simulating pollutant
Ž .transport in groundwater. Water Resour. Res. 19 6 , 1489–1500.Tompson, A.F.B., Ababou, R., Gelhar, L.W., 1989. Implementation of the three dimensional turning bands
Ž .random field generator. Water Resour. Res. 25 10 , 2227–2243.Yates, M.V., Gerba, C.P., Kelley, L.M., 1985. Virus persistence in groundwater. Appl. Environ. Microbiol. 49,
778–781.Ž .Zachara, J.M., Gassman, P.L., Smith, S.C., Taylor, D., 1995. Oxidation and adsorption of Co II EDTA2-com-
plexes in subsurface materials with iron and manganese oxide grain coatings. Geochim. Cosmochim. Acta59, 4449–4463.