a novel synthetic smoothened antagonist transiently inhibits
TRANSCRIPT
A Novel Synthetic Smoothened Antagonist TransientlyInhibits Pancreatic Adenocarcinoma Xenografts in aMouse ModelMartin F. Strand1*, Steven R. Wilson3, Jennifer L. Dembinski1, Daniel D. Holsworth2, Alexander Khvat2,
Ilya Okun2, Dirk Petersen3, Stefan Krauss1*
1 Unit for Cell Signalling, Institute for Microbiology, Oslo University Hospital, Rikshospitalet, Oslo, Norway, 2 ChemDiv Inc., San Diego, California, United States of America,
3 Department of Chemistry, University of Oslo, Oslo, Norway
Abstract
Background: Hedgehog (Hh) signaling is over-activated in several solid tumors where it plays a central role in cell growth,stroma recruitment and tumor progression. In the Hh signaling pathway, the Smoothened (SMO) receptor comprises aprimary drug target with experimental small molecule SMO antagonists currently being evaluated in clinical trials.
Principal Findings: Using Shh-Light II (Shh-L2) and alkaline phosphatase (AP) based screening formats on a ‘‘focuseddiversity’’ library we identified a novel small molecule inhibitor of the Hh pathway, MS-0022 (2-bromo-N-(4-(8-methylimidazo[1,2-a]pyridin-2-yl)phenyl)benzamide). MS-0022 showed effective Hh signaling pathway inhibition at thelevel of SMO in the low nM range, and Hh pathway inhibition downstream of Suppressor of fused (SUFU) in the low mMrange. MS-0022 reduced growth in the tumor cell lines PANC-1, SUIT-2, PC-3 and FEMX in vitro. MS-0022 treatment led to atransient delay of tumor growth that correlated with a reduction of stromal Gli1 levels in SUIT-2 xenografts in vivo.
Significance: We document the in vitro and in vivo efficacy and bioavailability of a novel small molecule SMO antagonist,MS-0022. Although MS-0022 primarily interferes with Hh signaling at the level of SMO, it also has a downstream inhibitoryeffect and leads to a stronger reduction of growth in several tumor cell lines when compared to related SMO antagonists.
Citation: Strand MF, Wilson SR, Dembinski JL, Holsworth DD, Khvat A, et al. (2011) A Novel Synthetic Smoothened Antagonist Transiently Inhibits PancreaticAdenocarcinoma Xenografts in a Mouse Model. PLoS ONE 6(6): e19904. doi:10.1371/journal.pone.0019904
Editor: Eric J. Bernhard, National Cancer Institute, United States of America
Received March 18, 2010; Accepted April 20, 2011; Published June 15, 2011
Copyright: � 2011 Strand et al. This is an open-access article distributed under the terms of the Creative Commons Attribution License, which permitsunrestricted use, distribution, and reproduction in any medium, provided the original author and source are credited.
Funding: This study was funded by the Research Council of Norway (http://www.forskningsradet.no/), and by ChemDiv Inc. (http://www.chemdiv.com/). TheResearch Council of Norway had no role in study design, data collection and analysis, decision to publish, or preparation of the manuscript. As indicated under thecompeting interests section, Drs. Alex Khvat, Ilya Okun and Dan Holsworth are employed by ChemDiv Inc., and ChemDiv Inc. had a partial role in the study design,execution of the experiments, data analysis, and decision to publish and in reviewing the manuscript. The MS-0022 chemotype has been patented by ChemDivInc. (PCT/IB2008/055258; WO 2009/077956 A2 and WO 2009/077956 A3).
Competing Interests: The chemotype detailed in this study is part of a patent filed by Drs. Alex Khvat, Ilya Okun and others titled: HETEROCYCLIC INHIBITORSOF AN Hh-SIGNAL CASCADE, MEDICINAL COMPOSITIONS BASED THEREON AND METHODS FOR TREATING DISEASES CAUSED BY THE ABERRANT ACTIVITY OF ANHh-SIGNAL SYSTEM (PCT/IB2008/055258; WO 2009/077956 A2 and WO 2009/077956 A3). There are currently no products arising from the work underdevelopment based on the chemotype detailed in this study. None of the authors, aside from Drs. Alex Khvat, Ilya Okun and Dan Holsworth who are employed byChemDiv Inc, have any financial relationships that could be perceived as relevant. The authors declare no other competing interests. The competing interestdetailed here does not alter the authors’ adherence to all the PLoS ONE policies on sharing data and materials.
* E-mail: [email protected] (MFS); [email protected] (SK)
Introduction
The Hedgehog (Hh) signaling pathway is one of the key
regulators in vertebrate development and is highly conserved
among species from fruit flies to humans [1–4]. It is also one of the
key pathways that regulate stem cells in the adult body [5].
Aberrant Hh signaling has been associated with a number of
human tumors where the pathway has been implicated in tumor
growth, malignancy, metastasis, and cancer stem cells [6–9]. Thus,
the Hh pathway has become a focus for drug discovery and
development [10–15].
The Hh pathway is unusual by several means, and central
aspects of its functioning remain to be explored. The morphogens
IHH, DHH and SHH interact with the 12-pass transmembrane
receptor Patched (PTCH). PTCH inhibits the physically separate
7-pass transmembrane receptor Smoothened (SMO) by gating the
movement of SMO into cilia. Evidence suggests, that upon Hh
binding, PTCH leaves the shaft of the primary cilium which allows
SMO to enter from its inactive endosomal state into cilia [16–18].
Furthermore, it has been proposed that SMO exists in an inactive
and active state [19,20] that may be regulated through a
hypothesized sterol-like small molecule [4,19,21]. SMO migration
into the primary cilium is followed by the inactivation of
Suppressor of fused (SUFU) [22]. Current data suggest that
SUFU, being a part of a multiprotein complex that also includes b-
arrestin, KIF3a and IFT88, impedes the nuclear localization of
GLI proteins [16,17,22]. In addition it may act as a nuclear co-
repressor [23]. SUFU is ubiquitinated upon the activation of Hh
signaling which initiates its degradation in the proteasomes [24]
leading to the release of GLI2/3 into the nucleus where they
regulate transcription of downstream target genes including the
activating transcription factor GLI1. Although GLI1 presence in
PLoS ONE | www.plosone.org 1 June 2011 | Volume 6 | Issue 6 | e19904

the nucleus is primarily a consequence of active Hh signaling, it
can be attenuated by other signaling pathways [25].
There are several key mechanisms in tumorigenesis that may
involve Hh/GLI signaling [11,13]; first, inactivating mutations in
the negative regulators PTCH or SUFU, or activating mutations
in the positive regulator SMO cause pathway activation in a cell-
autonomous and Hh ligand independent manner [5,26–28];
secondly, ligand-dependent autocrine mechanisms in which
cancer cells both secrete and respond to Hh ligands causing cell-
autonomous pathway activation [29,30]; thirdly, paracrine
mechanisms in which stromal cells are induced by Hh producing
cancer cells [31–34]. Both autocrine and paracrine effects can lead
to heterogeneity with respect to Hh pathway activity within a
tumor [35]. Several SMO antagonists have been developed and
early data show clinical efficacy in selected tumors [36]. However,
there has been some debate whether the in vivo growth inhibition
observed for Hh antagonists is due to inhibition of autocrine or
paracrine Hh signaling. Several recent studies suggest that the
primary role of Hh inhibition in Hh secreting tumors may be due
to the inhibition of paracrine signaling involving tumor-stroma
interactions [33,37–41]. In particular, tumor derived SHH has
been shown to promote desmoplasia in pancreatic cancer [42],
where the induced stroma in combination with poor vasculariza-
tion may act as a barrier that is linked to a poor response to
chemotherapy [40,41].
Following the identification of cyclopamine as a natural SMO
inhibitor [43–45], several Hh pathway antagonists have been
reported that either act at the level of SMO [46], GLI1 [47], or
other parts of the pathway [10,13,36]. Among these inhibitors,
some have been progressed to clinical trials. One of these, GDC-
0449 [15,34,48], is currently in several phase I and phase II
clinical trials for various types of cancers, including pancreatic
cancer (trial ID: NCT01064622 and NCT00878163). Also, the
cyclopamine derivative IPI-926 [14] has been through a phase I
clinical trial in patients with non-disclosed advanced and/or
metastatic solid tumors, and is currently in a phase Ib/II clinical
trial in patients with untreated metastatic pancreatic cancer (trial
ID: NCT01130142).
Here, we describe the identification and evaluation of a novel
small molecule SMO antagonist, MS-0022. MS-0022 displays a
differential efficacy on various solid tumors in vitro and on PANC-1
and SUIT-2 xenografts in vivo. The reported findings are a further
confirmation of the potential of small molecule Hh antagonists as
anticancer agents.
Results
Identification of the novel Hh antagonist MS-0022To identify novel antagonists to Hh signaling, a focused diversity
library of 12,000 compounds (10 mM) was screened using
C3H10T1/2 cells induced by recombinant human SHH and
employing an alkaline phosphatase (AP) readout in high throughput
format [49], followed by a verification step using Shh-L2 cells. MS-
0022 (2-bromo-N-(4-(8-methylimidazo[1,2-a]pyridin-2-yl)phenyl)-
benzamide), was identified as a potent Hh pathway antagonist with
an IC50 of 100 nM in Shh-L2 cells. The structure of MS-0022 was
confirmed by 1H and 13C NMR (Table S1 and Figure S1). In order
to explore the parts of the core structure required for activity in MS-
0022, a small scale broad structural analysis was performed based
on activity inhibition in Shh-L2 cells. As shown in Table 1, a
deletion of the 2-bromophenyl or the Imidazo[1,2-a]pyridine
moiety of MS-0022 led to a substantial loss of activity (for the
structure backbone see Figure 1A). The activity was partially
retained when replacing the Imidazo[1,2-a]pyridine system with a
napthlene-2-ylcarbamoyl system (MS-0018) or a 6-morpholinopyr-
idazin-3-yl system (MS-0015). A further focused structural analysis
of a limited number of MS-0022 analogs is shown in Table 2 (for the
base structure see Figure 1B).
Changing R2 from a hydrogen to a methyl group reduced
activity 6-fold (MS-0030). Incorporation of a nitrogen atom in
position Y reduced activity 23-fold (MS-0031). Substitution of R3
with a 2-fluorophenyl group reduced activity 1.6-fold (MS-0032).
Interestingly, if R1 was replaced with a hydrogen and R3 with 4-
methoxyphenyl, the activity dropped 1.8-fold (MS-0033). If R1 of
MS-0033 was replaced with a nitrogen atom in the ring (MS-0035),
the activity dropped an additional 8-fold. In general, a nitrogen
atom in the 8-position of the imidazo[1,2-a]pyridine ring system
caused a significant reduction in activity. Furthermore, a nitrogen
atom placed in position Y impacted the activity negatively.
A dose response curve of MS-0022 in Shh activated Shh-L2
cells, is shown in Figure 1C, using cyclopamine and GDC-0449 as
a comparison. MS-0022 exhibited an IC50 of 100 nM, while
cyclopamine exhibited an IC50 of 210 nM and GDC-0449 an
IC50 of 30 nM.
To ascertain that the compounds interacted at the level of
SMO, the most potent compounds, MS-0022, MS-0032 and MS-
0033 were shown to compete with BODIPY-cyclopamine with
IC50’s of 259, 93 and 287 nM respectively (Table 2). Thus, MS-
0022 and analogs of MS-0022, as well as GDC-0449, inhibit Hh
Table 1. Activity of MS-0022 and deletion/substitution analogs (See structure in figure 1A).
ID R1 R2 R3 MW IC50 (Shh-L2, nM)
MS-0022 8-methylimidazo[1,2-a]pyridine – 2-bromophenyl 406.3 100
MS-0011 8-methylimidazo[1,2-a]pyridine – Methyl 265.3 .20,000
MS-0012 8-methylimidazo[1,2-a]pyridine – 2-propyl 293.4 .20,000
MS-0013 – O-Amide 2-bromophenyl 319.2 .20,000
MS-0014 Propyl – 2-bromophenyl 318.2 10,000
MS-0015 6-morpholinopyridazin-3-yl – 2-bromophenyl 439.3 800
MS-0016 (6-phenylpyrimidin-4-yl)amino – 2-bromophenyl 445.3 2000
MS-0017 naphthalen-2-ylcarbamoyl – 2-bromophenyl 445.3 280
MS-0018 2-benzylidenehydrazinecarbonyl – 2-bromophenyl 442.3 5000
Table depicting molecular weight and bological activity (nM IC50) of deletion or substitution analogs of MS-0022 as measured by pathway inhibition in Shh inducedShh-L2 cells.doi:10.1371/journal.pone.0019904.t001
SMO Antagonist, Transient Xenograft Inhibition
PLoS ONE | www.plosone.org 2 June 2011 | Volume 6 | Issue 6 | e19904
SMO Antagonist, Transient Xenograft Inhibition
PLoS ONE | www.plosone.org 3 June 2011 | Volume 6 | Issue 6 | e19904

signaling at the level of SMO. MS-0022 inhibited SMO with
similar affinity as cyclopamine.
MS-0022 blocks Hh signaling at the level of SMO, but hasadditional activity downstream of SUFU
MS-0022 was shown to compete with BODIPY-cyclopamine,
and the observed effect on C3H10T1/2 cells and Shh-L2 cells
suggested that MS-0022 blocks Hh signaling at the level of SMO.
However, to further verify the function of MS-0022 as a SMO
blocker, the activity of MS-0022 was evaluated in experiments that
explore the various modes of Hh signaling induction in mouse cell
lines. Upstream of Gli, Hh signaling can be induced by the Hh
morphogens; by functional loss of Ptch, as present in the
constitutively active Ptch2/2 mouse embryonic fibroblast
(MEF) cell line; by a combination of the activating oxysterols
hydroxycholesterol 20-alpha and hydroxycholesterol 22S (Ac-
tOXS) and by the SMO agonist SAG and by Sufu inactivation, as
present in Sufu2/2 MEFs. As seen in Figure 1D, MS-0022
blocked Hh pathway induction in Shh, SAG and ActOXS induced
Shh-L2 cells similarly to GDC-0449 and cyclopamine. MS-0022
also reduced Gli1 mRNA expression in Ptch2/2 MEFs, similar
to GDC-0449 and cyclopamine (Figure 1E). Cyclopamine blocks
Smo function within primary cilia without blocking its transloca-
tion to the cilia. In contrast, MS-0022 effectively blocked ciliary
accumulation of Smo (Figure 1F-H), indicating an effect on the
level of Smo similar to GDC-0449, but divergent from
cyclopamine. Primary cilia in reporter cells were identified using
an antibody against the ciliary maker acetylated tubulin.
Acetylation of tubulin is found in stabilized microtubular
structures like cilia and mitotic spindles, and has effectively been
used as a marker for cilia in various studies [50,51].
As expected for a SMO antagonist, cyclopamine and GDC-
0449 exhibited little inhibitory effect on Hh signaling downstream
of Smo in Sufu2/2 MEFs. In contrast, MS-0022 reduced relative
Gli1 mRNA levels Sufu2/2 MEFs by 50% at a dose of 10 mM
(Figure 1I). Further downstream, at the level of Gli1 or Gli2, Hh
pathway inhibitory effect by MS-0022 was not detected as
indicated by the lack of inhibition of a forced expression of either
of the two transcription factors with 10 mM of MS-0022 (Figure 1J).
MS-0022 was able to show partial inhibition (Figure 1J) of Gli1 or
Gli2, only when the Hh signaling pathway was further activated by
Shh. In order to further elucidate the activity of MS-0022, Sufu2/
2 MEF cells that have been treated with MS-0022, cyclopamine
or GDC-0449 were stained with an antibody recognizing Gli1.
The intensity of Gli1 staining in the nucleus and the cytoplasm was
measured, and neither of the treatments resulted in a shift in the
ratio of Gli1 in the nucleus versus the cytoplasm (Figure 1K). Thus
the reduction of Gli1 mRNA levels in the Sufu2/2 MEF cells by
MS-0022 was not a consequence of Gli1 relocation in the cell.
However, while the treatment with 20 mM MS-0022 did not alter
the ratio of nuclear versus cytoplasmic Gli1, the total level of Gli1
in the cells was reduced (Figure 1 L–M), correlating well with the
Table 2. Activity analysis of MS-0022 chemotype (See structure in figure 1B).
ID R1 R2 R3 X Y MWIC50 (Shh-L2,nM)
IC50 (nM, BODIPY-cyclopamine inhib.) cLogP PSA
MS-0022 CH3 H 2-bromophenyl C C 406.3 100 259 5.44 46.4
MS-0030 CH3 CH3 2-bromophenyl C C 420.3 630 – 5.86 46.4
MS-0031 CH3 H 2-bromophenyl C N 407.3 2300 – 3.88 59.29
MS-0032 CH3 H 2-fluorophenyl C C 345.4 161 93 4.39 46.2
MS-0033 H H 4-methoxyphenyl C C 343.4 181 287 4.24 55.63
MS-0034 – H 2-methoxyphenyl N C 344.4 .10,000 – 3.21 68.5
MS-0035 – H 4-methoxyphenyl N C 344.4 877 – 3.1 68.52
MS-0036 – H 3,5-dimethylphenyl N C 342.4 3,700 – 4.06 59.29
MS-0037 – H 3-chlorophenyl N C 348.8 1,870 – 3.87 59.29
MS-0038 – H 2-trifluoromethylphenyl N C 382.3 1,150 – 2.98 59.3
Biological activity of side group analogues of MS-0022 measured by pathway inhibition in Shh induced Shh-L2 cells and by BODIPY-cyclopamine competition, includingcLogP (computed LogP, octanol/water partition coefficient) and polar surface area (PSA).doi:10.1371/journal.pone.0019904.t002
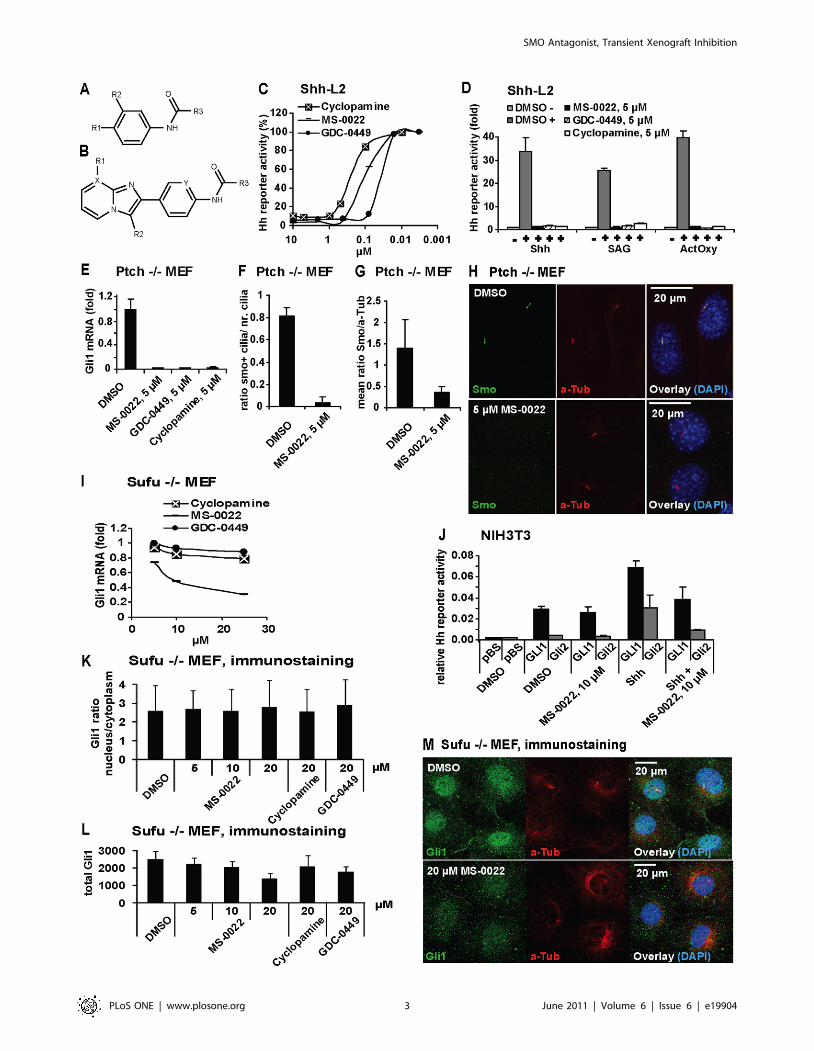
Figure 1. Identification and activity of MS-0022. A) Structure for Table 1. B) Structure for Table 2. C) Dose response curves of indicatedcompounds in Shh activated Shh-L2 cells after 48 hours treatment (n = 8). D) Shh-L2 cells activated with Shh, 200 nM SAG and ActOxs (5 mM+5 mM)treated with indicated compounds at 5 mM for 48 hours. Graph displays fold Hh reporter activity with standard deviation (SD) (n = 3). The basalactivity (DMSO) was set as = 1. E) Normalized (GADPH) Gli1 mRNA expression in Ptch2/2 MEF after 48 hours of treatment with indicated compoundsat 5 mM. Graph displays fold expression compared to DMSO control, with SD (n = 3). F–H) Immunostaining of Ptch 2/2 MEF cells treated with MS-0022 or DMSO control for 24 hours (anti-smoothened (Smo) in green, anti acetylated Tubulin (aTub) in red, DAPI in blue). Treated and control cultureslides (n = 3) were stained and 3 regions on each slide was imaged and analyzed. F) Graph displaying the ratio of Smo positive cilia versus totalnumber of cilia in stained cells by eye count, with SD. G) Graph displaying the ratio of mean ciliary intensity of Smo staining versus aTub as quantifiedusing ImageJ software, with SD. I) Dose response curve of MS-0022, GDC-0449 and cyclopamine by normalized (GAPDH) Gli1 mRNA expression inSufu 2/2 MEF after 72 hours treatment (n = 3). J) NIH3T3 cells cotransfected with GliBS-Luc in combination with pBluescript (pBS), FL-GLI1-HA orGli2-GFP, were treated with DMSO, 50% Shh conditioned medium, 10 mM MS-0022 and a combination of Shh and 10 mM MS-0022 for 48 hours.Graph displays relative Hh pathway activity (reporter firefly luciferase normalized for renilla transfection control), with SD (n = 3). K–M)Immunostaining of Sufu2/2 MEF cells treated with DMSO control, MS-0022 (5, 10 and 20 mM), cyclopamine (20 mM) and GDC-0449 (20 mM) for48 hours (n = 3). K) Graph displaying ratio of nuclear Gli1 staining intensity versus cytoplasmic Gli1 staining intensity, with SD. L) Graph displayingsum of nuclear and cytoplasmic Gli1 staining intensity in treated cells, with SD.doi:10.1371/journal.pone.0019904.g001
SMO Antagonist, Transient Xenograft Inhibition
PLoS ONE | www.plosone.org 4 June 2011 | Volume 6 | Issue 6 | e19904

reduction in Gli1 mRNA. At the same dose GDC-0449 also
reduced Gli1 levels in the cells, but to a lesser extent than MS-
0022 (Figure 1L), while cyclopamine had no significant effect.
We conclude that MS-0022 acts at the level of SMO blocking its
ciliary transport in the nanomolar range. An additional inhibitory
effect of MS-0022 on Hh signaling downstream of Sufu that
required a dose in the 10–20 micro molar range is linked to a
reduction of Gli1 protein levels.
MS-0022 blocks tumor growth in pancreaticadenocarcinoma, prostate carcinoma and melanoma celllines in vitro
To test in vitro efficacy of MS-0022, we profiled the presence of
central components of the Hh signaling pathway in the pancreas
adenocarcinoma cell lines PANC-1 and SUIT-2, the prostate
cancer cell line PC-3, and the melanoma cell line FEMX by real
time PCR (Table 3). Although all cell lines expressed detectable
levels of GLI1 mRNA, the level of expression varied, as did other
components of the Hh signaling pathway. However, the clear
presence of the direct Hh downstream marker PTCH1 in all cell
lines, indicated Hh/GLI1 pathway activity.
To determine if GLI1 mRNA levels in the tumor cells could be
reduced by MS-0022, real time PCR was carried out on cells treated
with different doses of MS-0022, cyclopamine and GDC-0449 for
48 hrs (Figure 2A). In parallel, growth inhibition was measured by
MTS (Figure 2B). For the PANC-1 cell line, growth inhibition and
reduction of GLI1 mRNA levels upon treatment, correlated well at
10 mM for all three compounds. At 5 mM, however, MS-0022 and
GDC-0449 reduced growth without reducing GLI1 mRNA levels.
In the SUIT-2 cell line, MS-0022, cyclopamine and GDC-0449 all
reduced GLI1 mRNA levels, but only MS-0022 reduced growth.
For the PC-3 cell line, both MS-0022 and GDC-0449 reduced GLI1
mRNA levels, although growth was only reduced by MS-0022. For
the FEMX cell line, the growth and GLI1 mRNA levels correlated
well at 10 mM, but not at 5 mM. In conclusion, using the SMO
antagonists GDC-0449 and cyclopamine, no correlation between
growth inhibition and reduction of GLI1 mRNA levels could be
detected in the four tumor cell lines PANC-1, SUIT-2, PC-3 and
FEMX. However, a correlation between growth inhibition and
GLI1 mRNA levels were apparent at a dose of 10 mM MS-0022
across all four tumor cell lines. The data set is consistent with an
additional Hh pathway inhibitory effect of MS-0022 downstream of
SMO/SUFU that requires relative higher doses of the compound as
compared to direct SMO inhibition. As seen in Figure 2B, both
CDG-0449 and cyclopamine did not lead to more than 30% growth
reduction in the tested cell lines PANC-1, SUIT-2, PC-3 and FEMX
during a 4 day exposure to 10 mM compound in a MTS assay. In
contrast, at the same dose, MS-0022 reduced growth from 40%–
70% in the same cell lines (Figure 2B). An immortalized,
non-tumorigenic hepatocyte cell line, THLE-2, was included as a
control, and the THLE-2 cells responded with a 25%–30% growth
reduction to 10 mM compound exposure possibly indicating a weak
Hh dependency in this control cell line (Figure 2B).
To address growth inhibition in a model relevant to xenograft
studies, PANC-1 and SUIT-2 cells were seeded in a soft agar
colony forming assay. A dose response curve was generated for
MS-0022, while using GDC-0229 and cyclopamine as controls.
For both cell lines, treatment with MS-0022 led to a reduction in
large (Figure 2C–D, and G) and medium sized colonies in a dose
dependant manner (Figure 2E–F, and G). Also upon MS-0022
treatment, an increase in the number of small colonies was
observed, indicating that the reduced growth of the small and
medium sized colonies is linked to decreased proliferation rather
than apoptosis. The cyclopamine control was excluded from the
dataset due to problems with crystallization of cyclopamine in the
soft agar.
Long term growth assays with 2–3 serial passages (5–7 days per
passage) further confirmed the efficacy of MS-0022 on the tested
PANC-1, SUIT-2, PC-3 and control THLE-2 cell lines (Figure 2H).
In the presence of 5 mM MS-0022, there was an initial growth
reduction in the first passage of the control THLE-2 cells, but by the
second passage the growth was not affected by the treatment. In
contrast, the growth was reduced by 80% in PANC-1 cells and PC-3
cells after passage 2. Serial passage growth reduction was not
significant for passage 2 and 3 in the SUIT-2 cells.
Pathway specificityTo address possible effects of MS-0022 on other central
signaling pathways, we analyzed whether MS-0022 affected Wnt
and TNF-a signaling using firefly luciferase reporter assays. As
seen in Figure 3A, MS-0022 did not significantly block L1 medium
induced Wnt signaling in HEK293 cells, nor did it block TNF-ainduced NfkB signaling in NIH3T3 cells at 10 mM and 20 mM
(Figure 3B). Instead, MS-0022 led to a slight increase of NFkB
signaling (Figure 3B). In addition, MS-0022 was tested at 10 mM
in a Millipore diversity panel comprised of 58 kinases. MS-0022
did not significantly inhibit the activity of any of the tested kinases
(Table 4).
Efficacy and bioavailability of MS-0022 in an in vivopancreatic adenocarcinoma xenograft model
In preparation for in vivo xenografts, the bioavailability of MS-
0022 in mouse plasma was evaluated. The maximum concentra-
tion (Cmax) of the compound in plasma was 934 ng/mL upon a
5 mg/kg IV injection. For a 5 mg/kg IP injection, it was 378 ng/
mL and after 5 mg/kg PO administration, it was 912 ng/mL
(Figure 3D–F and Table 5). Per oral bioavailability was calculated
to be 98%. The half-life (T1/2) after MS-0022 administration was
between 55 and 60 minutes, indicating that MS-0022 has a
moderate stability in plasma. Compound concentration in mouse
liver tissue 2 hours after IP administration was 244 ng/g. Thus,
MS-0022 readily enters tissue from the plasma. Overall, the
compound exhibited good exposure and moderate stability in
plasma.
Next the in vivo tolerability of MS-0022 was examined. No
statistically significant alterations in body weight were observed in
animals treated with daily IP injections of 200 mg/kg of MS-0022
for 5 days (Figure 3G), indicating that the compound was well
tolerated. Mice did not show any outward signs of toxicity or other
side effects (weight loss, fur ruffling, hunched posture). Even
though there were no outward signs of side effects or toxicity, we
analyzed the AST/ALT levels as a measure of liver toxicity in
xenografted animals that had been treated with MS-0022 for a
Table 3. Expression profile, Tumor cell lines.
PTCH1 SMO GLI1 GLI2 GLI3 SHH HIP SUFU
PANC-1 +++ + +++ +++ + +++ +/2 +++
SUIT-2 ++ ++ ++ ++ nt +++ nt nt
PC-3 ++ ++ ++ + + +++ + +
FEMX ++ + + + 2 2 2 +
Expression analysis of tumor cell lines according to the PCR cycle whereamplification was detected, starting with 1 mg mRNA (+++ = 20–25, ++ = 25–30,+ = 30–35, 2 = .35 and nt = not tested).doi:10.1371/journal.pone.0019904.t003
SMO Antagonist, Transient Xenograft Inhibition
PLoS ONE | www.plosone.org 5 June 2011 | Volume 6 | Issue 6 | e19904
SMO Antagonist, Transient Xenograft Inhibition
PLoS ONE | www.plosone.org 6 June 2011 | Volume 6 | Issue 6 | e19904

longer time period than 5 days. As the liver normally acts as the
primary site of drug metabolism, AST/ALT serum levels is an
easily obtainable measure of toxic side effects. As seen in
Figure 3C, AST/ALT levels remained greater than 1 in mice
treated with 50 mg/kg of MS-0022 after a 30 days injection
scheme (5 day injection, 2 day pause), suggesting that at this dose
MS-0022 was well tolerated without apparent toxic effects in the
liver in comparison to the control treated mice.
In-vivo efficacy of MS-0022 was tested against two pancreatic
adenocarcinoma cell lines PANC-1 and SUIT-2. For PANC-1,
subcutaneous tumors were established in CB17/SCID mice
(n = 6). Mice were randomized and dosed with control solvent
(water with 1% Tween 80) or MS-0022 (QD, IP at 50 mg/kg) in a
5 day injection/2 day pause scheme. Tumor volumes were
evaluated throughout the treatment by measuring two perpendic-
ular diameters with calipers, and by calculating tumor volume
(mm3) using the formula V = a6b26,Pi./6. At the end of the
treatment there was a 38% reduction in tumor volume and a 33%
reduction in tumor weight compared to tumors in control solvent
treated littermates (Figure 3H–I). The growth curve (Figure 3H),
shows that the tumors in both control and treated groups
eventually reached a similar growth pattern, and the growth
inhibition by MS-0022 appeared to be transient. At the endpoint
of the experiment, no statistically relevant difference in human
(tumor) or mouse (stroma) Ptch1 or Gli1 mRNA levels could be
identified in the extracted tumor mRNA (P.0.05) (Figure 3J).
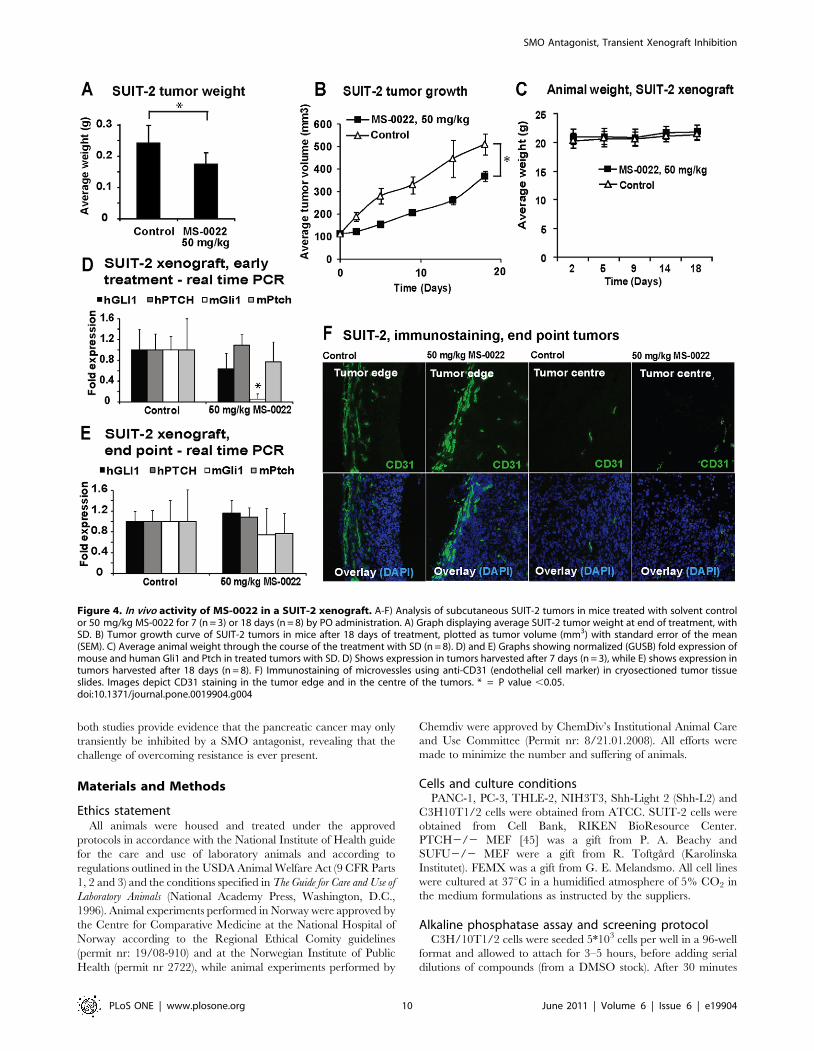
Compared to PANC-1, SUIT-2 cells displayed a stronger
responsiveness to MS-0022 in vitro, both in the reduction of
GLI1 expression and in growth (MTS assay). Therefore, the
effect of MS-0022 was also tested in vivo using SUIT-2 pancreas
adenocarcinoma cells, and subcutaneous tumors were estab-
lished in CB17/SCID mice (n = 11). Mice were randomized
and dosed daily with solvent or 50 mg/kg MS-0022 via PO
administration. The MS-0022 treatment did not result in any
outwards signs of toxicity in the mice, and animal weight
(Figure 4C) was unaffected by the treatment when compared to
the animals that received control solvent. After 7 days, 3 mice
from each treatment group were sacrificed and the tumors
were harvested for analysis, while the remaining animals (n = 8)
were sacrificed after 18 days of treatment, due to tumor
burden. In general, the SUIT-2 tumors showed a more
aggressive growth in comparison to the PANC-1 tumors. At
the endpoint of the experiment, a 27% reduction in tumor
volume and a 36% reduction in tumor weight were measured
in treated animals compared to the control group (Figure 4A–
B). Similar to PANC-1 xenografts (Figure 3D), a transient delay
of growth was observed during the first days of treatment,
followed by a recovery of growth with growth rates similar to
untreated tumors. As in PANC-1 xenografts, no statistical
relevant reduction of human or mouse Gli1, or Ptch1 mRNA
levels was detectable at the endpoint of the experiment
(Figure 4E). However, when samples from the SUIT-2
xenografts were analyzed after 7 days of treatment only,
mouse (stromal) Gli1 mRNA in the tumors was reduced
significantly (P,0.001), while both human and mouse PTCH
and human GLI1 remained unaltered (P.0.05) (Figure 4D).
There was no detectable difference in animal weight between
the control and MS-0022 treated animals (Figure 4C). As
inhibition of SMO has been linked to an increase in
vascularization in poorly vascularized tumors [41], we inves-
tigated the vascularization of the tumor tissue upon MS-0022
treatment. Samples from the harvested tumors were cryosec-
tioned, fixed and stained for the presence of the endothelial cell
marker (CD31), as a marker for microvessles in tumor tissue.
Large variations in SUIT-2 tumor shape including the
occurrence of necrotic cavities, led to substantial variations in
the vascularization of the tumors in all samples derived after 7
or 18 days of treatment and in control samples. Due to
substantial variability, no apparent difference between the
vascularization of samples derived from treated and untreated
animals was detectable. Irrespective of MS-0022 treatment,
CD31 staining revealed high vascularization at the tumor edge,
while vascularization in the center of the tumor was generally
low (Figure 4F).
Discussion
MS-0022 was identified as a potent antagonist of Hh signaling
that blocks the translocation of SMO to the cilia displaying a
transient in vivo antagonistic effect in a pancreatic adenocarcinoma
xenograft model.
MS-0022 contains a core structural motif common to other
SMO antagonists. Analysis of the core structure of MS-0022
revealed that the ‘‘phenyl-amide-phenyl’’ (Figure 1A, where R3 =
phenyl) portion of the molecule was also present in HhAntag [33],
GDC-0449 [52], Sant-2 [53] and Compound Z [54]. Deleting the
2-bromobenzene moiety of MS-0022 resulted in a total loss of
activity, confirming the importance of the identified core structure
for the activity of this class of molecules. Interestingly, although the
‘‘phenyl-amide-phenyl’’ core is identical in all of these molecules,
there are also important differences in the structures. HhAntag,
Sant-2 and Compound Z are closer to each other in structure than
MS-0022 and GDC-0449, as they share a 1H-benzoimidazo
structure coupled in the 3 position to the 4-chloro-N-phenyl.
Interestingly, when the imidazo[1,2-a]pyridine of MS-0022 was
deleted, activity was reduced. However, when it was substituted
with groups that contain nitrogen in ortho position to the N-
phenyl, partial activity was retained. Similar to GDC-0449 and
cyclopamine, MS-0022 inhibited the Hh pathway activity after
induction by various agonistic factors like Shh, oxysterols and
SAG. The ability of MS-0022 to compete with BOPIDY-
cyclopamine binding suggests that it acts by a similar mode of
action as structurally related SMO antagonists, such as GDC-
0449. This was further confirmed by the inhibition of SMO
translocation to the primary cilium by MS-0022. While MS-0022
inhibited SMO in the nanomolar range, it displayed an additional
effect on the Hh pathway downstream of SMO that required a
higher dose. In the micromolar range, MS-0022 led to a significant
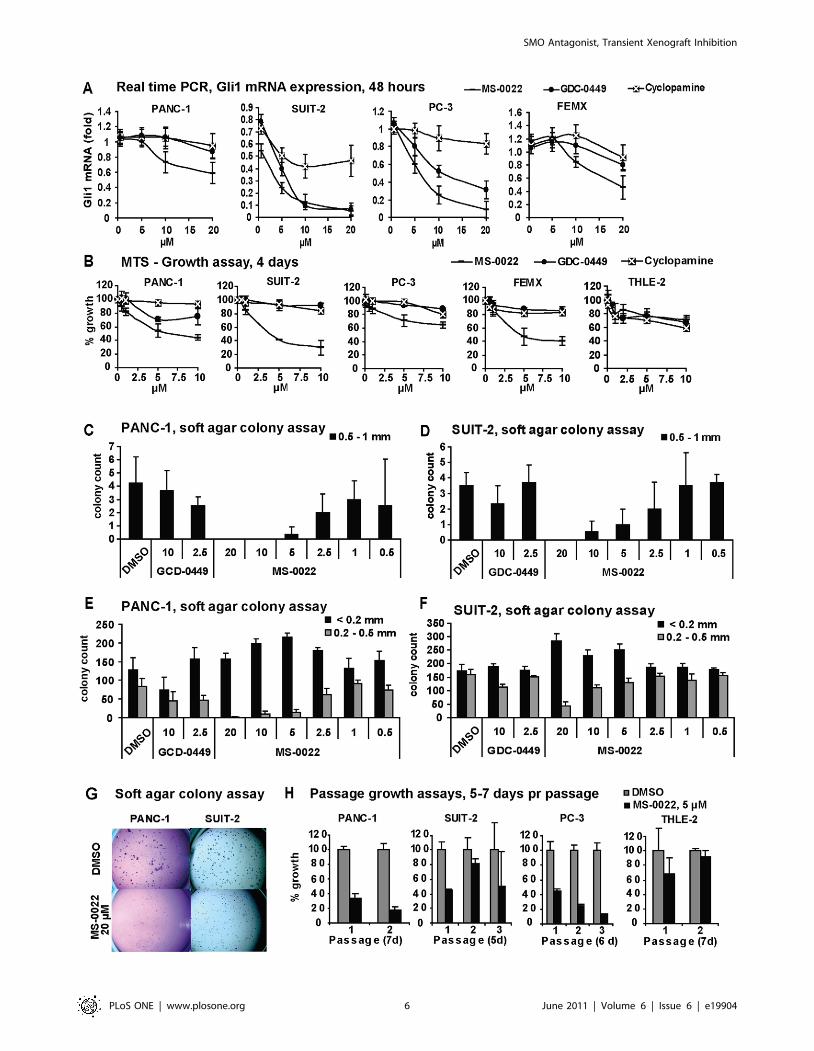
Figure 2. In vitro activity in tumor cell lines and a control cell line. A) Graphs displaying dose response curves of normalized (GAPDH) Gli1mRNA expression in indicated tumor cell lines after 48 hour treatment of MS-0022, cyclopamine and GDC-0449. Graphs include standard deviation(n = 3). B) Graphs displaying 4 day dose response curves of cell growth as a % growth of DMSO control (MTS) for PANC-1, SUIT-2, PC-3, FEMX andTHLE-2 cells treated with MS-0022, GDC-0449 and cyclopamine at the indicated dose, with SD (n = 8) C-G) Soft agar colony formation assay of PANC-1(21 days) and SUIT-2 (14 days) cells treated with DMSO or MS-0022 and GDC-0449 at the indicated doses (n = 3). Each well was imaged and colonieswere counted by eye according to size. Graphs displaying the colony count of larger colonies (0.5–1 mm) are shown in C) for PANC-1 and D) for SUIT-2, with SD. Graphs displaying the colony count of medium (0.2–0.5 mm) and small (,0.2 mm) colonies are shown in E) for PANC-1 and F) for SUIT-2,with SD. H) Passage growth assays with PANC-1, SUIT-2, PC-3 and THLE-2 cell lines treated with DMSO control or 5 mM MS-0022 for 2–3 passages of5–7 days, displayed as % growth of DMSO control, with SD (n = 3).doi:10.1371/journal.pone.0019904.g002
SMO Antagonist, Transient Xenograft Inhibition
PLoS ONE | www.plosone.org 7 June 2011 | Volume 6 | Issue 6 | e19904

Figure 3. In vitro MS-0022 pathway selectivity, in vivo tolerance and distribution, and activity in a PANC-1 xenograft model. A)HEK293 cells cotransfected with SuperTop-luc (ST-Luc) and pRL-TK, were treated with control medium and L1 medium +/2 10 and 20 mM MS-0022 for24 hours. Graph displays fold reporter activity with standard deviation (n = 3). B) NIH3T3 cells cotransfected with NFkB-luc and pRL-TK, treated with controlmedium and 10 ng/mL TNF-a +/2 10 and 20 mM NFkB inhibitor Bay11-7082 or 10 and 20 mM MS-0022 for 24 hours. Graph displays fold reporter activitywith SD (n = 3). C) Graph depicting average AST/ALT ratio from mouse blood at end of animal treatment in the PANC-1 xenograft. D–F) Blood distributioncurves after IV, IP and PO administration of 5 mg/kg MS-0022 in mice. Graphs display mean dose (ng/mL by time) +/2 SD. G) Body weight change inanimals treated with 200 mg/kg MS-0022 over 5 days, with SD (n = 5). H–J) Analysis of subcutaneous PANC-1 tumors in mice treated with solvent controlor 50 mg/kg MS-0022 for 21 days (n = 6) by IP administration. H) Growth curves of PANC-1 tumors in mice after 30 days of treatment, showing averagetumor volume (mm3) with standard error of the mean (SEM). I) Graph displaying average PANC-1 tumor weight at end of treatment, with SD. J) Graphdisplays normalized (GUSB) fold expression of mouse and human Gli1 and Ptch in treated tumors, with SD (n = 3). * = P value ,0.05. (n.s. = P value .0.05).doi:10.1371/journal.pone.0019904.g003
SMO Antagonist, Transient Xenograft Inhibition
PLoS ONE | www.plosone.org 8 June 2011 | Volume 6 | Issue 6 | e19904
reduction of Gli1 mRNA and protein levels in Sufu2/2 cells.
This effect was not due to an altered or inhibited translocation of
Gli1 to the nucleus, indicating that MS-0022 did not reduce Gli1
levels by direct inhibition of Gli1. The precise cause of this
secondary effect remains to be elucidated.
As the implications of aberrant Hh signaling are getting
increasingly evident in several cancers, pathway antagonists will
be an essential toolkit for development of future treatments. The
emerging data from clinical trials with GDC-0449 show both the
benefits and possible pitfalls of a pure SMO antagonist; a clear
tumor response in Hh driven tumors such as basal cell carcinoma
and medulloblastoma [34,55,56], and the occurrence of a drug
induced resistance caused by mutations in the Smo locus [34,55].
A possible solution to block Hh/GLI1signalling despite activation
mutations in the Smo locus would be to develop drugs that act on
the pathway downstream of SMO [47]. A GLI inhibitor would
also address non-canonical activation of GLI [57].
The high level of tumor-stroma interactions found in advanced
cancers like pancreatic adenocarcinoma poses additional chal-
lenges for developing treatment strategies based on Hh
antagonists. Such strategies would require that, in addition to
autocrine efficacy, paracrine interactions between tumor activat-
ed stroma and tumor cells are disrupted [33]. Furthermore, the
barrier that the stromal cells create around the tumor, and the
lack of compound delivery to areas of low vascularization need to
be addressed [41].
The physiochemical properties of MS-0022 (MW = 406.3;
clogP: 5.44; PSA: 46.4 (Table 2)), its excellent per oral
bioavailability, and the initial evidence that it is well tolerated
in vivo (MTD .200mg/kg) makes MS-0022 a potential drug
candidate. In PANC-1 and SUIT-2 xenograft experiments, MS-
0022 treatment led to a partial response, where growth was
halted during the first days of treatment compared to the control.
Over time, however, both the treated and control xenograft
groups reverted to similar growth. In both SUIT-2 and PANC-1
xenografts, the growth delay in the MS-0022 treated group
resulted in a statistically relevant (P,0.05) average reduction in
tumor volume of subsequently 27% and 38%. Our in vivo results
lend support to the idea that the primary effect of Hh inhibition
in pancreatic cancer treatment is due to the inhibition of Hh
pathway activity in the stromal cells, although we also observe a
mild initial reduction of GLI1 levels in tumor cells. Both
pancreatic cancer cell lines, SUIT-2 and PANC-1, that were
xenografted as a part of this study, express high levels of Shh
mRNA (Table 4), and should be able to induce a Hh response in
stromal cells. It’s interesting to note that though both MS-0022
and GDC-0449, and to a certain degree cyclopamine, led to a
reduction of GLI1 mRNA in SUIT-2 cells in vitro, suggesting the
possibility to affect autocrine Hh signaling in this cancer cell line.
In an in vivo context, the effect of MS-0022 in vivo on SUIT-2 and
PANC-1 tumors was most likely due to an inhibition paracrine
Hh signaling since no statistically relevant reduction of either
hGLI1 or hPTCH could be measured in mRNA derived from the
tumor tissue. In contrast, mGli1 was reduced in the stroma of the
SUIT-2 tumors (P,0.05) after 7 days of treatment, but not at the
end of the treatment, while at the end of the treatment in PANC-
1 xenografts, there was a slight reduction of mGli1 (although with
a P.0.05). Reasons for the lack of a measurable reduction of
hGLI1 or hPTCH in the tumors, at the time points that were
taken, could be low levels of compound reaching the tumor, or
activation mutations that occurred within the tumors. Activation
mutations in SMO have been observed in a recent clinical trial
using CDG-0449 in a medulloblastoma patient [34,58]. Also, the
development of resistance against chemotherapeutic agents in
pancreatic cancer has been linked to both dense stromal matrix
and increased stromal barrier, which over time, may cause
resistance. Interestingly, Olive et al. found that treatment with
IPI-926 led to an increased vascularization in KPC tumors, but
similarly to our observations, the effect of this SMO inhibitor was
due to a developing resistance [41].
KPC mice develop pancreatic tumors that resemble human
pancreatic ductal adenocarcinoma due to a conditional expression
of endogenous mutant Kras and p53 alleles in pancreatic cells
[59,60]. Similarly, the SUIT-2 and PANC-1 cell lines are mutant
for p53 and Kras [61–65]. Despite the differences in the two models,
with tumors forming in the mouse pancreas in the KPC model and
tumor cells injected under the skin in the in vivo xenograft model,
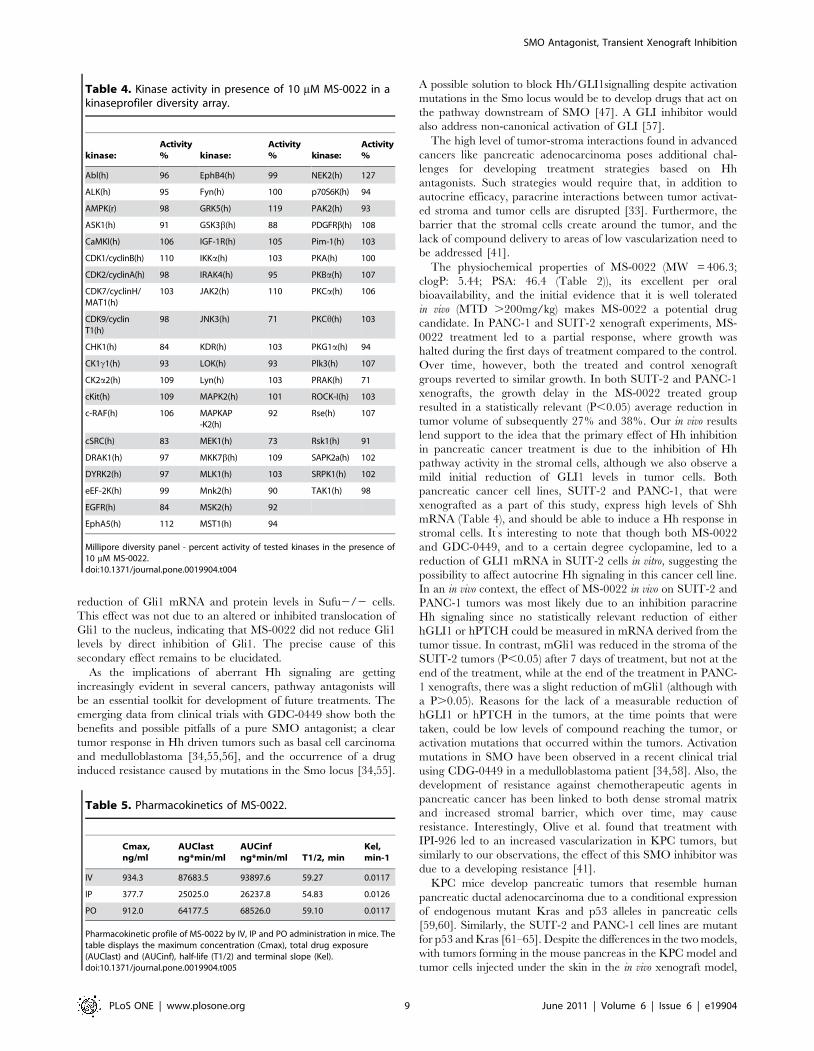
Table 4. Kinase activity in presence of 10 mM MS-0022 in akinaseprofiler diversity array.
kinase:Activity% kinase:
Activity% kinase:
Activity%
Abl(h) 96 EphB4(h) 99 NEK2(h) 127
ALK(h) 95 Fyn(h) 100 p70S6K(h) 94
AMPK(r) 98 GRK5(h) 119 PAK2(h) 93
ASK1(h) 91 GSK3b(h) 88 PDGFRb(h) 108
CaMKI(h) 106 IGF-1R(h) 105 Pim-1(h) 103
CDK1/cyclinB(h) 110 IKKa(h) 103 PKA(h) 100
CDK2/cyclinA(h) 98 IRAK4(h) 95 PKBa(h) 107
CDK7/cyclinH/MAT1(h)
103 JAK2(h) 110 PKCa(h) 106
CDK9/cyclinT1(h)
98 JNK3(h) 71 PKCh(h) 103
CHK1(h) 84 KDR(h) 103 PKG1a(h) 94
CK1c1(h) 93 LOK(h) 93 Plk3(h) 107
CK2a2(h) 109 Lyn(h) 103 PRAK(h) 71
cKit(h) 109 MAPK2(h) 101 ROCK-I(h) 103
c-RAF(h) 106 MAPKAP-K2(h)
92 Rse(h) 107
cSRC(h) 83 MEK1(h) 73 Rsk1(h) 91
DRAK1(h) 97 MKK7b(h) 109 SAPK2a(h) 102
DYRK2(h) 97 MLK1(h) 103 SRPK1(h) 102
eEF-2K(h) 99 Mnk2(h) 90 TAK1(h) 98
EGFR(h) 84 MSK2(h) 92
EphA5(h) 112 MST1(h) 94
Millipore diversity panel - percent activity of tested kinases in the presence of10 mM MS-0022.doi:10.1371/journal.pone.0019904.t004
Table 5. Pharmacokinetics of MS-0022.
Cmax,ng/ml
AUClastng*min/ml
AUCinfng*min/ml T1/2, min
Kel,min-1
IV 934.3 87683.5 93897.6 59.27 0.0117
IP 377.7 25025.0 26237.8 54.83 0.0126
PO 912.0 64177.5 68526.0 59.10 0.0117
Pharmacokinetic profile of MS-0022 by IV, IP and PO administration in mice. Thetable displays the maximum concentration (Cmax), total drug exposure(AUClast) and (AUCinf), half-life (T1/2) and terminal slope (Kel).doi:10.1371/journal.pone.0019904.t005
SMO Antagonist, Transient Xenograft Inhibition
PLoS ONE | www.plosone.org 9 June 2011 | Volume 6 | Issue 6 | e19904
both studies provide evidence that the pancreatic cancer may only
transiently be inhibited by a SMO antagonist, revealing that the
challenge of overcoming resistance is ever present.
Materials and Methods
Ethics statementAll animals were housed and treated under the approved
protocols in accordance with the National Institute of Health guide
for the care and use of laboratory animals and according to
regulations outlined in the USDA Animal Welfare Act (9 CFR Parts
1, 2 and 3) and the conditions specified in The Guide for Care and Use of
Laboratory Animals (National Academy Press, Washington, D.C.,
1996). Animal experiments performed in Norway were approved by
the Centre for Comparative Medicine at the National Hospital of
Norway according to the Regional Ethical Comity guidelines
(permit nr: 19/08-910) and at the Norwegian Institute of Public
Health (permit nr 2722), while animal experiments performed by
Chemdiv were approved by ChemDiv’s Institutional Animal Care
and Use Committee (Permit nr: 8/21.01.2008). All efforts were
made to minimize the number and suffering of animals.
Cells and culture conditionsPANC-1, PC-3, THLE-2, NIH3T3, Shh-Light 2 (Shh-L2) and
C3H10T1/2 cells were obtained from ATCC. SUIT-2 cells were
obtained from Cell Bank, RIKEN BioResource Center.
PTCH2/2 MEF [45] was a gift from P. A. Beachy and
SUFU2/2 MEF were a gift from R. Toftgard (Karolinska
Institutet). FEMX was a gift from G. E. Melandsmo. All cell lines
were cultured at 37uC in a humidified atmosphere of 5% CO2 in
the medium formulations as instructed by the suppliers.
Alkaline phosphatase assay and screening protocolC3H/10T1/2 cells were seeded 5*103 cells per well in a 96-well
format and allowed to attach for 3–5 hours, before adding serial
dilutions of compounds (from a DMSO stock). After 30 minutes
Figure 4. In vivo activity of MS-0022 in a SUIT-2 xenograft. A-F) Analysis of subcutaneous SUIT-2 tumors in mice treated with solvent controlor 50 mg/kg MS-0022 for 7 (n = 3) or 18 days (n = 8) by PO administration. A) Graph displaying average SUIT-2 tumor weight at end of treatment, withSD. B) Tumor growth curve of SUIT-2 tumors in mice after 18 days of treatment, plotted as tumor volume (mm3) with standard error of the mean(SEM). C) Average animal weight through the course of the treatment with SD (n = 8). D) and E) Graphs showing normalized (GUSB) fold expression ofmouse and human Gli1 and Ptch in treated tumors with SD. D) Shows expression in tumors harvested after 7 days (n = 3), while E) shows expression intumors harvested after 18 days (n = 8). F) Immunostaining of microvessles using anti-CD31 (endothelial cell marker) in cryosectioned tumor tissueslides. Images depict CD31 staining in the tumor edge and in the centre of the tumors. * = P value ,0.05.doi:10.1371/journal.pone.0019904.g004
SMO Antagonist, Transient Xenograft Inhibition
PLoS ONE | www.plosone.org 10 June 2011 | Volume 6 | Issue 6 | e19904
recombinant human SHH (C24II) (RnD systems (1845SH)) was
added (300 ng/mL). After 72 hours, the cells were lysed for 15
minutes using 20 mL of a 10 mM Ethanolamine Buffer (pH 8.0)
with 0.2% Triton-X100, supplemented 1:100 with Protease
Inhibitor Cocktail (EMD Bioscience). 7.5 mL of lysate was mixed
with 45 mL of CSPD Alkaline Phosphatase Substrate with
Emerald-II (Applied Biosystems) and incubated at room temper-
ature, in the dark, for 45 minutes. The plate was measured using a
Wallac VictorV reader (0.1 s Luminescence). Screening com-
pounds and MS-0022 were part of a Chemdiv chemical library.
Hh reporter assayShh-L2 cells were used as a Hh reporter cell line as described
previously [45]. Hh signaling was induced by Shh conditioned
medium, 200 nM SAG (AH-Diagnostics) and ActOXS (a
combination of 5 mM Hydroxycholesterol 20-alfa and 5 mM
Hydroxycholesterol 22S (Sigma-Aldrich)). For Shh conditioned
medium, Shh-PANC-1 cells were grown to confluence and
switched to fresh medium. Shh conditioned medium was harvested
after 48 hours, and was diluted to 50% in fresh DMEM before
use. The clonal Shh-PANC-1 cell line was generated by stably
transducing PANC-1 cells with virus containing medium from
HEK293T cells that were transfected using a Virapower Lentiviral
expression kit (Invitrogen). The vector was produced by removing
GFP from a pLenti 6.2-vector, and inserting the mouse Shh cDNA
sequence.
IC50 calculationIC50 values were calculated using dose response curve data
where n = 3. The calculations were performed with an online
calculator using the formula: a exp (2bx) + c at the website;
http://www.changbioscience.com/stat/ec50.html
NMR spectroscopy of MS-0022NMR spectra of MS-0022 (approx. 2 mg) were obtained from a
solution in 0.5 ml of DMSO-d6 ((CD3)2S(O), 99.9% D, Cam-
bridge Isotope Laboratories, Andover, MA) in a 5.0 mm tube
(WILMAD, WG-5 Economy). The spectra were acquired on an
Avance AV 600 MHz NMR spectrometer (Bruker BioSpin,
Rheinstetten, Germany) with a 5 mm CP-TCI (1H/13C, 15N-
2H) triple-resonance inverse cryo probe, equipped with a Z-
gradient coil. NMR assignments of MS-0022 were inferred from
examination of 1H- and 13C spectra, attached proton test (APT),
correlated spectroscopy (COSY45), total correlation spectroscopy
(TOCSY) pulsed field gradient heteronuclear single quantum
coherence (g-HSQC), pulsed field gradient heteronuclear multiple
bond correlation (g-HMBC) and pulsed field gradient hetero-
nuclear two-bond correlation (g-H2BC/g-HSQC-COSY). The
data were processed using the Bruker TOPSPIN software (version
1.3 or version 2.1 pl 2). Chemical shift values were referenced to
the residual solvent signals, i.e. CHD2S(O)CD3 = 2.49 ppm and
(CD3)2S(O) = 39.5 ppm, respectively. All NMR spectra were
acquired at 25uC.
BODIPY assayBODIPY assay was performed to determine competition with
cyclopamine as described previously [21,66].
Real Time PCRCells were lysed for RNA extraction after 48 or 72 hours of
treatment. Total RNA from cultured cells or tumor tissue was
isolated using the GeneElute miniprep kit (Sigma-Aldritch)
following the manufacturer’s instructions. cDNA was synthesized
from the isolated mRNA using the Retroscript kit (Ambion), and
real-time PCR was carried out using the SYBR Green PCR
master mix (Stratagene) according to the manufacturer’s
instructions with an Mx3000P cycler (Stratagene). The relative
concentrations of cDNA present in each sample were calculated
by the MxPro software (Stratagene), normalized for GAPDH
(mRNA from cells) or GUS (mRNA from tumors). For real time
PCR primer sequences see Table 6. For the tumor tissue real time
PCR, previously described human and mouse specific primers
against GUSB, PTCH1 and GLI1were used [33].
ImmunofluorescencePTCH2/2 MEF were seeded on pre-coated glass slides (1
hour coating with 0.1% Gelatin (G1393) and 0.003% Collagen
(C8919) (Sigma-Aldrich) in PBS). 80% confluent cells were
switched from 10% to 0.5% FBS in medium and cells were
treated with DMSO or 5 mM MS-0022 for 24 hours in (n = 3)
before subsequent immunofluorescent staining: Slides were fixed
with 4% paraformaldehyde (Sigma-Aldrich), permeabilized for 10
min in 0.1% v/v Triton X-100 (Sigma-Aldrich) in PBS (PBT), and
blocked with 10% w/v BSA (Saveen Werner) in PBT for 1 hour.
Primary antibodies, mouse anti-acetylated tubulin (a-Tub) (Sigma-
Aldrich (T7451), 1:1000) goat anti-Smo (Santa Cruz Biotechnol-
ogy (sc-6367), 1:1000), and goat anti-GLI-1 (RnD systems
(AF3455), 1:500) were diluted in 0.5% w/v BSA in PBT and left
on the slides over night at 4uC. Secondary antibodies donkey anti-
goat IgG-Alexa 594 and donkey anti-mouse IgG-Alexa 488
(Invitrogen, both at 1:500) were added in 0.5% w/v BSA in PBT
for 1 hour. The slides were counterstained with DAPI (Roche,
Table 6. Primer sequences for quantitative real time PCR.
Primers: Primer sequence, 59 R 39 Tm,6C
hPTCH1 fwd CGA GCC CCC CTG TAC GAA GTG G 67.7
hPTCH1 rev GAC CCC CAG CAA GCC CAG AAA A 64.0
hGLI1 fwd GCG CAT CCC GAG CCC AGC 65.1
hGLI1 rev GCC CTC GGT GCA GCT GTT GGT C 67.7
hGLI2 fwd GCC TCC GAG AAG CAA GAA GCC AAA A 64.4
hGLI2 rev CCT GGT GTC GCA TGT CAA TCG GTA G 66.3
hGLI3 fwd CGG GAC GGT GTT TGC CAT GGA C 65.8
hGLI3 rev GGA GGA TGG AAG GCA GGG AAA AGA T 64.6
hSHH fwd GCC AGC GGA AGG TAT GAA GGG AAG 66.1
hSHH rev ACC GAG ATG GCC AAA GCG TTC AAC 64.4
hHIP fwd TGG GGA TGG CTC GCA ACG TCT C 65.8
hHIP rev TGG GAT GGA ATG CGA GGC TTA GC 64.2
hSUFU fwd CCC GAG GAT GAC GAG GAC AGC C 67.7
hSUFU rev CGC GTG CGA ATC AGC TCA TGG G 65.8
hSMO fwd CCA GGA GGA AGC GCA CGG CAA G 67.7
hSMO rev TCG CAC TGG CCT GAA CTG TTG AAC T 64.6
hGAPDH fwd GCC CCC TCT GCT GAT GCC CCC A 75.7
hGAPDH rev TGG GTG GCA GTG ATG GCA TGG 70.2
mGLI1 fwd AGC CAA CTT TAT GTC AGG GTC CCA GGG T 71.2
mGLI1 rev GAG CCC GCT TCT TTG TTA ATT TGA CTG 66.5
mGAPDH fwd TAT GTC GTG GAG TCT ACT GGT GTC TTC ACC 68.1
mGAPDH rev GAG TTG TCA TAT TTC TCG TGG TTC ACA CCC 66.8
Table of real time PCR primers; name, sequence and TmuC (h = human,m = mouse).doi:10.1371/journal.pone.0019904.t006
SMO Antagonist, Transient Xenograft Inhibition
PLoS ONE | www.plosone.org 11 June 2011 | Volume 6 | Issue 6 | e19904

1 mg/ml) in PBS. 3 random regions were imaged pr slide using a
confocal LSM510 microscope (Carl Zeiss MicroImaging). The
ratio of green Smo positive cilia versus the red aTub positive cilia
was quantified manually or processed and analyzed using ImageJ
to quantify the intensity of Smo and aTub for each cilium in the
images (http://rsb.info.nih.goc/ij/). Graphs display mean with
standard deviation error bars.
Frozen tumor tissue was cryosectioned (n = 8 pr group), and the
sections were fixed with 4% paraformaldehyde for 10 minutes
before permeabilization with 0.2% Triton-X in PBS for 10 minutes.
Sections were blocked for 30 minutes at room temperature with 3%
BSA in PBS and was subsequently incubated over night at 4uC with
rat anti-mouse CD31 (BD Biosciences (550274), 1:500) in 1% BSA
in PBS. The secondary antibody used was Alexa Fluor 488 goat-
anti-rat (Molecular Probes; 1/700 dilution) in 1% BSA in PBS for
1 hour at RT. Nuclei were counterstained with DAPI, in PBS for 10
minutes at RT. Images was acquired as above and electronic images
was further processed using ImageJ.
Transfection and luciferase assayVectors were obtained from the following: GliBS-Luc reporter
[67] (gift from H. Sasaki), pBluescript (pBS) (Stratagene), FL-HA-
GLI1 (Gli1) and Gli2-GFP (Gli2) (gifts from R. Toftgard),
Super8XTOPFlash [68], and NFkB-luc (Panomics). 10 ng renilla
luciferase (pRL-TK) (Promega) was used as a transfection control.
HEK293 and NIH3T3 cells were seeded at 80,000 per well in 48-
well plates on day 1, and were co-transfected on day 2 using a total
of 0.4 mg plasmid per well mixed at 1:3 in FUGENE6 according to
manufacturer’s instructions. On day 3, control medium and
activating medium (50% L1 conditioned medium, 50% Shh
conditioned medium or medium containing 10 ng/mL recombi-
nant rcrTNF-a (R&D Systems)) +/2 10–20 mM MS-0022 were
added, using DMSO as a control (the NFkB pathway inhibitor
Bay11-7082 was used as a control in the NFkB assay). Samples
were analyzed on day 4 or 5 using the Dual Luciferase assay kit
according to manufacturer’s instructions. Graphs display relative
or fold reporter activity, and are calculated from a mean ratio of
firefly reporter luminescence/pRL-TK luminescence with stan-
dard deviation error bars (n = 3). The experiments have been
repeated with similar results.
In vitro antiproliferative assayCells were plated at a density of 3000 (THLE-2 and PC-3) and
1000 (PANC-1, SUIT-2 and FEMX) cells per well (on the basis of
their growth rate) in 200 ml of medium in a 96-well plate. Medium
was changed daily, and after four days, the assay was read using a
MTS kit (Promega) according to the instructions of the
manufacturer. Graphs display average of percent growth with
standard deviation (n = 8).
Passage growth assay20,000 cells were seeded per well in 6 well plates (triplicates)
with DMSO or 5 mM MS-0022. Treatment medium was changed
on day 3–5, and after 5–7 days the cells were trypsinized, re-
suspended in medium and counted, before reseeding cells at
20,000/well for a subsequent passage. The average growth of MS-
0022 treated cells was calculated as a percentage of the growth of
the DMSO control at the end of each passage. Graphs display
average of percent growth with standard deviation bars (n = 3).
Soft agar colony formation assay2000 PANC-1 or SUIT-2 cells were suspended in 1.5 mL
growth media containing 0.35% agar (Oxoid), over a 1.5 mL
base layer containing 0.5% agar in 6-well plates. The plates
were incubated for 14 days (SUIT-2) and 21 days (PANC-1)
and then stained for 1 h with 1 ml of 0.02% crystal violet
(Sigma-Aldrich), and colonies were counted according to sizes;
,0.2 mm (small), 0.2–1 mm (medium) and .1 mm (large).
Data represent average numbers with standard deviation bars
(n = 3). The experiments have been repeated with similar
result.
Pharmacokinetics, dose tolerance, animal tumorestablishment and treatment
For pharmacokinetic (PK) analysis, 5 mg/kg MS-0022 was given
by IV, PO and IP administration to 7–8 week old male C57BL mice
(mouse musculus), and blood was collected after 5, 15, 30, 60, 120, and
240 min, with n = 3. Animals were sacrificed and blood samples
(,0.5 mL each) were collected from the abdominal aorta into
EDTA-containing tubes, centrifuged (2–8uC for ,10 minutes at
,10000 xg) and plasma harvested into single tubes for each animal
and frozen (,270uC). Blood samples were analyzed by ChemDiv’s
bioanalytical department. The maximum concentration (Cmax),
total drug exposure (the area under the curve to the last quantifiable
concentration (AUClast) and as the AUClast value extrapolated to
infinity (AUCinf), calculated as AUCinf = AUClast+C(t)last/Kel,
where C(t)last is the last measurable concentration), half-life (T1/2)
calculated as ln(2)/Kel and Kel calculated as the slope of the terminal
linear portion of the concentration/time curve. The WinNonlin
Professional 5.2 software (Pharsight Corp.) was used for the
calculation of the PK parameters.
For the analysis of uptake of MS-0022 in organs and tissue,
livers were dissected out from mice 120 min after PO adminis-
tration of MS-0022 and frozen (,270uC). The LC-MS method
used to detect MS-0022 was described previously [69], with the
main exception being that isocratic conditions were used (50%
0.1% FA (aq), 50% 0.1% FA (ACN), v/v), and that a UV detector
was placed between the LC and MS instrument.
MS-0022 tolerance was tested by daily injections of 200 mg/kg
MS-0022 for 5 days in 7–8 week old male C57BL mice. Animal
were observed daily for outward signs of toxicity (weight loss, fur
ruffling, hunched posture).
For PANC-1 xenografts, 4–6 week old CB17/SCID mice were
injected with 56106 PANC-1 (n = 6 per group) cells in 200 ml PBS
subcutaneously on day 1. IP treatment with 50 mg/kg MS-0022
began when median tumor size reached 25 mm2 (day 27). MS-
0022 was pulverized using a pestle, and was mixed into a stable
suspension in water containing 1% Tween 80 (Sigma-Aldrich).
Mice were treated with MS-0022 or solvent for a period of 30 days
after initiation in a 5 day injection 2 day pause scheme, and tumor
size was measured throughout using calipers (mm2). After 30 days
the mice were sacrificed and tumors dissected and weighed. The
PANC-1 xenograft endpoint was taken two days after the last
compound treatment.
For SUIT-2 xenografts, 4–6 week old CB17/SCID mice were
injected with 56106 SUIT-2 (n = 11 per group) cells in 200 ml PBS
subcutaneously on day 1. IP treatment with 50 mg/kg MS-0022
began when median tumor size reached 35 mm2 (day 8). Mice were
treated daily with MS-0022 or solvent for a period of 18 days after
initiation, and tumor size was measured throughout using calipers
(mm2). After 8 days, three mice from each group were sacrificed and
tumors dissected, weighed and processed for analysis. The remaining
animals (n = 8) were sacrificed after 19 days of treatment, and tumors
harvested. Tumor volume (mm3) was calculated using the formula
a6b26,pi./6. End tumor measurement statistics were obtained
using two samples T-test in the Sigmaplot software.
SMO Antagonist, Transient Xenograft Inhibition
PLoS ONE | www.plosone.org 12 June 2011 | Volume 6 | Issue 6 | e19904

Liver transaminasesBlood was collected from the hepatic vein of freshly sacrificed
animals into heparinized capillary blood collection tubes
(Sarstedt), which were immediately centrifuged and the serum
was collected. AST and ALT were run on non-hemolyzed
samples using AST and ALT kits (Randox) following the
manufacturer’s instructions.
Supporting Information
Figure S1 Atom numbering of MS-0022. The atom
numbering of MS-0022 used in the 1H and 13C NMR analysis.
(See Table S1)
(TIF)
Table S1 NMR analysis of MS-0022. 1H and 13C NMR Data
for MS-0022 (DMSO-d6). For the atom numbering used see Figure
S1.
(DOC)
Acknowledgments
We thank Eline Buchman and Line Mygland for excellent technical
support.
Author Contributions
Conceived and designed the experiments: MFS SRW JLD DDH AK IO
DP SK. Performed the experiments: MFS SRW JLD AK IO DP. Analyzed
the data: MFS SRW JLD DDH AK IO DP SK. Contributed reagents/
materials/analysis tools: MFS SRW JLD DDH AK IO DP. Wrote the
paper: MFS SRW JLD DDH AK IO DP SK.
References
1. Fietz MJ, Concordet JP, Barbosa R, Johnson R, Ingham PW, et al. (1994) The
hedgehog gene family in Drosophila and vertebrate development. Dev Suppl:
43–51.
2. Jiang J, Hui CC (2008) Hedgehog signaling in development and cancer. Dev
Cell 15: 801–812.
3. Krauss S, Concordet JP, Ingham PW (1993) A functionally conserved homolog
of the Drosophila segment polarity gene hh is expressed in tissues with polarizing
activity in zebrafish embryos. Cell 75: 1431–1444.
4. Rohatgi R, Scott MP (2007) Patching the gaps in Hedgehog signalling. Nat Cell
Biol 9: 1005–1009.
5. Han YG, Spassky N, Romaguera-Ros M, Garcia-Verdugo JM, varez-Buylla A,
et al. (2008) Hedgehog signaling and primary cilia are required for the formation
of adult neural stem cells. Nat Neurosci 11: 277–284.
6. Altaba A, Mas C, Stecca B (2007) The Gli code: an information nexus regulating
cell fate, stemness and cancer. Trends Cell Biol 17: 438–447.
7. Altaba A (2008) Therapeutic inhibition of Hedgehog-GLI signaling in cancer:
epithelial, stromal, or stem cell targets? Cancer Cell 14: 281–283.
8. Bailey JM, Singh PK, Hollingsworth MA (2007) Cancer metastasis facilitated by
developmental pathways: Sonic hedgehog, Notch, and bone morphogenic
proteins. J Cell Biochem 102: 829–839.
9. Beachy PA, Karhadkar SS, Berman DM (2004) Tissue repair and stem cell
renewal in carcinogenesis. Nature 432: 324–331.
10. Hyman JM, Firestone AJ, Heine VM, Zhao Y, Chen JK, et al. (2009) Small-
molecule inhibitors reveal multiple strategies for Hedgehog pathway blockade.
Proc Natl Acad Sci U S A 106: 14132–14137.
11. Rubin LL, de Sauvage FJ (2006) Targeting the Hedgehog pathway in cancer.
Nat Rev Drug Discov 5: 1026–1033.
12. Rudin CM, Hann CL, Laterra J, Yauch RL, Low JA, et al. (2009) Treatment of
medulloblastoma with hedgehog pathway inhibitor GDC-0449. N Engl J Med
361: 1173–1178.
13. Scales SJ, de Sauvage FJ (2009) Mechanisms of Hedgehog pathway
activation in cancer and implications for therapy. Trends Pharmacol Sci
30: 303–312.
14. Tremblay MR, Lescarbeau A, Grogan MJ, Tan E, Castro AC, et al. (2009)
Discovery of a potent and orally active hedgehog pathway antagonist (IPI-926).
J Med Chem 52: 4400–4418.
15. Von Hoff DD, LoRusso PM, Rudin CM, Reddy JC, Low JA, et al. (2009)
Inhibition of the hedgehog pathway in advanced basal-cell carcinoma.
N Engl J Med 361: 1164–1172.
16. Barakat MT, Scott MP (2009) Tail wags dog: primary cilia and tumorigenesis.
Cancer Cell 16: 276–277.
17. Wong SY, Seol AD, So PL, Ermilov AN, Reiter JF, et al. (2009) Primary cilia
can both mediate and suppress Hedgehog pathway-dependent tumorigenesis.
Nat Med 15: 1055–1061.
18. Wilson CW, Chen MH, Chuang PT (2009) Smoothened adopts multiple active
and inactive conformations capable of trafficking to the primary cilium. PLoS
One 4: e5182.
19. Taipale J, Cooper MK, Maiti T, Beachy PA (2002) Patched acts catalytically to
suppress the activity of Smoothened. Nature 418: 892–897.
20. Zhao Y, Tong C, Jiang J (2007) Hedgehog regulates smoothened activity by
inducing a conformational switch. Nature 450: 252–258.
21. Dwyer JR, Sever N, Carlson M, Nelson SF, Beachy PA, et al. (2007) Oxysterols
are novel activators of the hedgehog signaling pathway in pluripotent
mesenchymal cells. J Biol Chem 282: 8959–8968.
22. Cheng SY, Yue S (2008) Role and regulation of human tumor suppressor SUFU
in Hedgehog signaling. Adv Cancer Res 101: 29–43.
23. Cheng SY, Bishop JM (2002) Suppressor of Fused represses Gli-mediated
transcription by recruiting the SAP18-mSin3 corepressor complex. Proc Natl
Acad Sci U S A 99: 5442–5447.
24. Yue S, Chen Y, Cheng SY (2009) Hedgehog signaling promotes the degradation
of tumor suppressor Sufu through the ubiquitin-proteasome pathway. Oncogene
28: 492–499.
25. Katoh Y, Katoh M (2009) Integrative genomic analyses on GLI1: positive
regulation of GLI1 by Hedgehog-GLI, TGFbeta-Smads, and RTK-PI3K-AKT
signals, and negative regulation of GLI1 by Notch-CSL-HES/HEY, and
GPCR-Gs-PKA signals. Int J Oncol 35: 187–192.
26. Epstein EH (2008) Basal cell carcinomas: attack of the hedgehog. Nat Rev
Cancer 8: 743–754.
27. Toftgard R (2009) Two sides to cilia in cancer. Nat Med 15: 994–996. 10.1038/
nm0909-994.
28. Unden AB, Holmberg E, Lundh-Rozell B, Stahle-Backdahl M, Vorechovsky I,
et al. (1996) Mutations in the human homologue of Drosophila patched (PTCH)
in basal cell carcinomas and the Gorlin syndrome: different in vivo mechanisms
of PTCH inactivation. Cancer Res 56: 4562–4565.
29. Berman DM, Karhadkar SS, Maitra A, Montes De OR, Beachy PA, et al. (2003)
Widespread requirement for Hedgehog ligand stimulation in growth of digestive
tract tumours. Nature 425: 846–851.
30. Thayer SP, di Magliano MP, Heiser PW, Nielsen CM, Hebrok M, et al. (2003)
Hedgehog is an early and late mediator of pancreatic cancer tumorigenesis.
Nature 425: 851–856.
31. Bailey JM, Mohr AM, Hollingsworth MA (2009) Sonic hedgehog paracrine
signaling regulates metastasis and lymphangiogenesis in pancreatic cancer.
Oncogene 28: 3513–3525.
32. Theunissen JW, de Sauvage FJ (2009) Paracrine Hedgehog signaling in cancer.
Cancer Res 69: 6007–6010.
33. Yauch RL, Gould SE, Scales SJ, Tang T, de Sauvage FJ, et al. (2008) A
paracrine requirement for hedgehog signalling in cancer. Nature 455: 406–410.
34. Yauch RL, Dijkgraaf GJ, Alicke B, Januario T, de Sauvage FJ, et al. (2009)
Smoothened Mutation Confers Resistance to a Hedgehog Pathway Inhibitor in
Medulloblastoma. Science.
35. Dembinski JL, Krauss S (2009) Characterization and functional analysis of a
slow cycling stem cell-like subpopulation in pancreas adenocarcinoma. Clin Exp
Metastasis.
36. Low JA, de Sauvage FJ (2010) Clinical experience with Hedgehog pathway
inhibitors. J Clin Oncol 28: 5321–5326.
37. Tian H, Callahan CA, DuPree KJ, Darbonne WC, Ahn CP, et al. (2009)
Hedgehog signaling is restricted to the stromal compartment during pancreatic
carcinogenesis. Proc Natl Acad Sci U S A 106: 4254–4259.
38. Nolan-Stevaux O, Lau J, Truitt ML, Chu GC, Hebrok M, et al. (2009) GLI1 is
regulated through Smoothened-independent mechanisms in neoplastic pancre-
atic ducts and mediates PDAC cell survival and transformation. Genes Dev 23:
24–36.
39. Walter K, Omura N, Hong SM, Griffith M, Vincent A, et al. (2010)
Overexpression of smoothened activates the sonic hedgehog signaling pathway
in pancreatic cancer-associated fibroblasts. Clin Cancer Res 16: 1781–1789.
40. Neesse A, Michl P, Frese KK, Feig C, Cook N, et al. (2010) Stromal biology and
therapy in pancreatic cancer. Gut 2010 Oct 21 doi:10.1136/gut.2010.226092.
41. Olive KP, Jacobetz MA, Davidson CJ, Gopinathan A, Tuveson DA (2009)
Inhibition of Hedgehog signaling enhances delivery of chemotherapy in a mouse
model of pancreatic cancer. Science 324: 1457–1461.
42. Bailey JM, Swanson BJ, Hamada T, Eggers JP, Singh PK, et al. (2008) Sonic
hedgehog promotes desmoplasia in pancreatic cancer. Clin Cancer Res 14:
5995–6004.
43. Cooper MK, Porter JA, Young KE, Beachy PA (1998) Teratogen-mediated
inhibition of target tissue response to Shh signaling. Science 280: 1603–1607.
44. Incardona JP, Gaffield W, Kapur RP, Roelink H (1998) The teratogenic
Veratrum alkaloid cyclopamine inhibits sonic hedgehog signal transduction.
Development 125: 3553–3562.
SMO Antagonist, Transient Xenograft Inhibition
PLoS ONE | www.plosone.org 13 June 2011 | Volume 6 | Issue 6 | e19904
45. Taipale J, Chen JK, Cooper MK, Wang B, Beachy PA, et al. (2000) Effects of
oncogenic mutations in Smoothened and Patched can be reversed bycyclopamine. Nature 406: 1005–1009.
46. Frank-Kamenetsky M, Zhang XM, Bottega S, Guicherit O, Porter JA, et al.
(2002) Small-molecule modulators of Hedgehog signaling: identification andcharacterization of Smoothened agonists and antagonists. J Biol 1: 10.
47. Lauth M, Bergstrom A, Shimokawa T, Toftgard R (2007) Inhibition of GLI-mediated transcription and tumor cell growth by small-molecule antagonists.
Proc Natl Acad Sci U S A 104: 8455–8460.
48. Dierks C (2010) GDC-0449–targeting the hedgehog signaling pathway. RecentResults Cancer Res 184: 235–238.
49. Kiselyov AS (2006) Biology-driven diversity: concept of focused diversity. ChemBiol Drug Des 68: 67–69.
50. Alieva IB, Gorgidze LA, Komarova YA, Chernobelskaya OA, Vorobjev IA(1999) Experimental model for studying the primary cilia in tissue culture cells.
Membr Cell Biol 12: 895–905.
51. Seeley ES, Nachury MV (2010) The perennial organelle: assembly anddisassembly of the primary cilium. J Cell Sci 123: 511–518.
52. Robarge KD, Brunton SA, Castanedo GM, Xie M, et al. (2009) GDC-0449-apotent inhibitor of the hedgehog pathway. Bioorg Med Chem Lett 19:
5576–5581.
53. Chen JK, Taipale J, Young KE, Maiti T, Beachy PA (2002) Small moleculemodulation of Smoothened activity. Proc Natl Acad Sci U S A 99:
14071–14076.54. Borzillo GV, Lippa B (2005) The Hedgehog signaling pathway as a target for
anticancer drug discovery. Curr Top Med Chem 5: 147–157.55. Kean S (2009) Medicine. Disrupting Hedgehog may reverse advanced cancer, if
only temporarily. Science 325: 1188.
56. So PL, Tang JY, Epstein EH (2010) Novel investigational drugs for basal cellcarcinoma. Expert Opin Investig Drugs 19: 1099–1112.
57. Lauth M, Toftgard R (2007) Non-canonical activation of GLI transcriptionfactors: implications for targeted anti-cancer therapy. Cell Cycle 6: 2458–2463.
58. Dijkgraaf GJ, Alicke B, Weinmann L, Januario T, West K, et al. (2011) Small
molecule inhibition of GDC-0449 refractory smoothened mutants anddownstream mechanisms of drug resistance. Cancer Res 71: 435–444.
59. Hingorani SR, Wang L, Multani AS, Combs C, Deramaudt TB, et al. (2005)
Trp53R172H and KrasG12D cooperate to promote chromosomal instabilityand widely metastatic pancreatic ductal adenocarcinoma in mice. Cancer Cell 7:
469–483.
60. Hruban RH, Adsay NV, bores-Saavedra J, Anver MR, Biankin AV, et al. (2006)Pathology of genetically engineered mouse models of pancreatic exocrine
cancer: consensus report and recommendations. Cancer Res 66: 95–106.61. Butz J, Wickstrom E, Edwards J (2003) Characterization of mutations and loss of
heterozygosity of p53 and K-ras2 in pancreatic cancer cell lines by immobilized
polymerase chain reaction. BMC Biotechnol 3: 11.62. Kainuma O, Asano T, Hasegawa M, Kenmochi T, Nakagohri T, et al. (1997)
Inhibition of growth and invasive activity of human pancreatic cancer cells by afarnesyltransferase inhibitor, manumycin. Pancreas 15: 379–383.
63. Birnbaum DJ, Adelaide J, Mamessier E, Finetti P, Lagarde A, et al. (2011)Genome profiling of pancreatic adenocarcinoma. Genes Chromosomes &
Cancer 50: 456–465 (2011).
64. Hidaka H, Ishiko T, Ishikawa S, Ikeda O, Mita S, et al. (2005) Constitutive IL-8expression in cancer cells is associated with mutation of p53. J Exp Clin Cancer
Res 24: 127–133.65. Sato N, Mizumoto K, Kusumoto M, Niiyama H, Maehara N, et al. (1998) 9-
Hydroxyellipticine inhibits telomerase activity in human pancreatic cancer cells.
FEBS Lett 441: 318–321.66. Chen JK, Taipale J, Cooper MK, Beachy PA (2002) Inhibition of Hedgehog
signaling by direct binding of cyclopamine to Smoothened. Genes Dev 16:2743–2748.
67. Sasaki H, Hui C, Nakafuku M, Kondoh H (1997) A binding site for Gli proteinsis essential for HNF-3beta floor plate enhancer activity in transgenics and can
respond to Shh in vitro. Development 124: 1313–1322.
68. Veeman MT, Slusarski DC, Kaykas A, Louie SH, Moon RT (2003) Zebrafishprickle, a modulator of noncanonical Wnt/Fz signaling, regulates gastrulation
movements. Curr Biol 13: 680–685.69. Wilson SR, Boix F, Holm A, Lundanes E, Greibrokk T, et al. (2005)
Determination of bradykinin and arg-bradykinin in rat muscle tissue by
microdialysis and capillary column-switching liquid chromatography with massspectrometric detection. J Sep Sci 28: 1751–1758.
SMO Antagonist, Transient Xenograft Inhibition
PLoS ONE | www.plosone.org 14 June 2011 | Volume 6 | Issue 6 | e19904