a note on measuring the unofficial economy
TRANSCRIPT

A Note on Measuring the Unofficial Economy in the FormerSoviet Republics
By: Michael Alexeev and William Pyle
William Davidson Working Paper Number 436September 2001

A Note on Measuring the Unofficial Economy in the Former Soviet Republics
Michael Alexeev*
and
William Pyle**
September 2001
* Department of Economics, Indiana University, Bloomington, IN 47405, phone: (812) 855-7103, fax: (812) 855-3736, e-mail: [email protected]** Economics Department, Middlebury College, Middlebury, VT 05753, phone: (802) 443-3240, fax: (802) 443-2084,e-mail: [email protected]

William Davidson Institute Working Paper 436Abstract
This note argues that the most commonly used estimates of the size of the unofficial economies
in the former Soviet republics are flawed. Most important, they are based on calculations that
disregard the variation in unofficial economic activity across space in the pre-transition Soviet
Union. In addition, these estimates appear to understate the size of the unofficial economies in
these countries. We propose alternative estimates and find that they are more strongly related to
the institutional factors commonly used to explain the size of the unofficial sector. Our
estimates also show that the size of a country's pre-transition unofficial economy is an important
predictor of its size during the transition. This suggests that the size of the unofficial economy is
to a large extent a historical phenomenon only partly determined by contemporary institutional
factors.
JEL classification: O17, P2, P3
Keywords: hidden economy, transition economies

William Davidson Institute Working Paper 436
Non-Technical Summary
Conventional wisdom holds that the unofficial economies in post-socialist countriesare quite large. With state institutions still developing the capacity to regulate and measuremarket-based activities, it is widely believed that a significant share of the goods andservices produced in these economies does not enter into official estimates of GDP. Buthow much? Arriving at a precise answer to this question is impossible, and even areasonable approximation is not easy to come by. Nor is the answer trivial in itsconsequences. A better sense of the size (and nature) of the unofficial economy may leadto a re-assessment of output dynamics during the transition and influence policies frompublic finance to social protection.
In this note, we argue that the most frequently cited size estimates of the unofficialeconomies in the FSU are flawed by an assumption that the unofficial economies of theformer Soviet republics accounted for the same 12% share of their total GDP in 1989.Starting from that assumption Kaufmann and Kaliberda (1996) and Johnson, Kaufmannand Shleifer (1997) assumed a near unit-elasticity relationship between measured electricityconsumption and total economic activity -- measured and unmeasured. This approach ledthem to conclude that by the middle of the 1990s, unofficial economies in the FSU rangedfrom a low of 6.5% in Uzbekistan to a high of 62.6% in Georgia.
We use both labor input and household income data collected in the Berkeley-Dukesurvey project to show that the average size of the unofficial economies in the Sovietrepublics, most likely, exceeded 12% of total GDP and, certainly, varied a great deal in sizeacross space. We re-estimate the sizes of republic-level unofficial economies at the end ofthe socialist period and confirm the significant variation in the extent of unmeasuredeconomic activity. Specifically, the Berkeley-Duke data suggest relatively high amounts ofunofficial activity in the Caucasian and Central Asian republics and relatively low levels inthe European republics. Using these new estimates, we apply the same “electricityconsumption” methodology used in the aforementioned studies to trace the dynamics ofthe unofficial economy during the transition. This leads us to a revised set of estimates forthe size of unofficial economies in 1995. Our estimates range from a low of 21.9% inEstonia to a high of 71.4% in Georgia.
In a series of regressions, we demonstrate that our set of revisions is more closelyrelated to governance indices that had previously been shown to be associated withunofficial economic activity. Because of the potential simultaneity between governance andthe unofficial economy, we also present the results using two variables to instrument for thegovernance regressors. The comparative results remain similar to those in the OLSregressions.
We also show that the previous estimates may have biased the conclusions of theresearchers who used them. Surprisingly, Johnson et al. (1997) found that the size of acountry's unofficial economy in 1989 did not have a statistically significant impact on thesize of its unofficial economy in 1995. In regressions with our estimates, however, the pre-transition status of the unofficial economy plays a prominent role, partly at the expense ofthe governance indicators. This outcome suggests that the size of the unofficial economy isto a large extent a historical phenomenon only partly determined by contemporarygovernance indicators, which themselves may be historically determined and not easilymodified by policy initiatives.

William Davidson Institute Working Paper 436
1
A Note on Measuring the Unofficial Economy in the Former Soviet Republics
1. Introduction
Conventional wisdom holds that the unofficial economies in post-socialist countries are
quite large. With state institutions still developing the capacity to regulate and measure market-based
activities, it is widely believed that a significant share of the goods and services produced in these
economies does not enter into official estimates of GDP. But how much? Arriving at a precise
answer to this question is impossible, and even a reasonable approximation is not easy to come by.
Nor is the answer trivial in its consequences. A better sense of the size (and nature) of the unofficial
economy may lead to a re-assessment of output dynamics during the transition and influence
policies from public finance to social protection.
Kaufmann and Kaliberda (1996) were the first to apply a consistent methodology to
measuring the unofficial economies in formerly socialist countries. Drawing on the same approach,
Johnson et al. (1997) updated Kaufmann and Kaliberda's work, producing estimates for the size of
the unofficial economy in eleven former Soviet republics and six Central and East European
countries in 1995. Subsequent studies by Johnson et al. (1998), Friedman et al. (2000), Schneider
and Enste (2000), Rosser et al. (2000) and Johnson and Kaufmann (2001) used these estimates to
evaluate the causes and consequences of cross-country variation in unofficial economic activity.
Although this work has done much to advance understanding of unofficial economies during the
transition, we feel that the size estimates of Kaufmann and Kaliberda (1996) and Johnson et al.
(1997) were significantly flawed by an assumption that the unofficial economies of the pre-transition
former Soviet republics accounted for the same 12% share of their total GDP.
Below we address this important element of the discussion of the post-socialist unofficial
economy. Using data from the Berkeley-Duke survey project, we show both that the average size of
the unofficial economies in the Soviet republics was significantly larger than assumed by Kaufmann
and Kaliberda (1996) and that there was a good deal of variation in their size across space.1 On the
basis of the Berkeley-Duke data, we re-estimate the size of the unofficial economies at the end of the
socialist period. Using these new estimates, we apply the same methodology used by both
Kaufmann and Kaliberda (1996) and Johnson et al. (1997) to trace the dynamics of the unofficial

William Davidson Institute Working Paper 436
2
economy during the transition. This leads us to a revised set of estimates for the size of unofficial
economies in 1995. We conclude with a series of side-by-side comparisons. These demonstrate that
our revisions are more closely related than the previous estimates to a set of governance variables
that have been shown to be associated with unofficial economic activity. Perhaps even more
important, we show that the flawed estimates may have biased the conclusions of the researchers
who used them. Johnson et al. (1997) found, surprisingly, that pre-transition conditions had no
impact on the size of unofficial economies in 1995. Specifically, they point out that the size of a
country's unofficial economy in 1989 did not have a statistically significant impact on the size of its
unofficial economy in 1995. In regressions with our estimates, however, the pre-transition
conditions play a prominent role, partly at the expense of the governance indicators. This outcome
suggests that the size of the unofficial economy is to a large extent a historical phenomenon only
partly determined by contemporary governance indicators, which themselves may be historically
determined and not easily modified by policy initiatives.
2. The Electricity Consumption Methodology
The initial study by Kaufmann and Kaliberda started from the observation that in the short
run electricity consumption and total economic activity move in parallel fashion, with near unit-
elasticity.2 Thus the difference between the growth rates of measured GDP and electricity
consumption can yield an estimate of the change in the size of the unofficial economy, which
Kaufmann and Kaliberda define as “the unrecorded value added by any deliberate misreporting or
evasion by a firm or individual (p. 83).”
Kaufmann and Kaliberda sub-divided the post-socialist countries into three groups on the
basis of differences in the timing and scope of policy reform.3 Since energy prices were liberated
earlier and more extensively in Central and Eastern Europe, that region’s countries were assumed to
be more efficient consumers of energy than others in the post-socialist world. Electricity
consumption, that is, was presumed to rise more slowly and fall more quickly relative to rises and
falls, respectively, in total output. Energy prices were liberalized later in the Baltic economies and
still later and not as comprehensively in the rest of the former Soviet Union. Following this tri-
partite division, Kaufmann and Kaliberda applied the output elasticity of electricity-consumption
measures that are re-produced in Table 1.

William Davidson Institute Working Paper 436
3
By themselves, these elasticities are useful only for estimating the change in the size of the
unofficial economy for given dynamics in measured output and electricity consumption. In order to
use them for computing the contribution of a country’s unofficial economy to its total GDP, one
needs to work from an estimated baseline. For instance, if the initial share of the unofficial
economy in a country’s total GDP is estimated to be 10%, and if official (i.e., measured) GDP and
electricity consumption grow by 3% and 5%, respectively, the unofficial economy would be
presumed to have grown to 11.7% of all economic activity.4 Thus, to estimate the size of the
unofficial economy in the former Soviet republics during the transition, Kaufmann and Kaliberda
worked from estimates of their sizes in the pre-transition period.
Since there were no widely recognized estimates of the sizes of the unofficial economies in
the Soviet republics, Kaufmann and Kaliberda assumed that the size of the unofficial economy was
uniform across the USSR. Without being specific, they wrote:
On the basis of the Berkeley-Duke research project on the USSR Second
Economy … as well as the work of J. Braithwaite, estimates ranging roughly
between 10 and 15 percent of total economic activity were arrived at. Thus … we
use the 1989 midpoint estimate share of unofficial activities of 12 percent (pp. 93-
94).
They relied upon other country-level studies to establish the size of unofficial economies in 1989 in
Central and Eastern Europe.5 All the estimates appear in the first column of Table 2.
By comparing the dynamics of measured output and electricity consumption and applying
the noted estimates of elasticities, Kaufmann and Kaliberda arrived at size estimates for 1994. Using
a year's worth of additional data, Johnson et al. (1997) followed the same approach and produced
estimates for 1995.6 As shown in Table 2, they found that the unofficial economy represented a
significant share of total output both prior to and during the transition. But whereas in Central and
Eastern Europe there was generally little change in its size relative to measured output, there was a
significant increase in its relative magnitude in the former Soviet republics. This trend appears to
have been most pronounced in the Caucasian states of Azerbaijan and Georgia where unofficial
activity is reported to have jumped from twelve percent to well over half of total GDP.
The estimates of Kaufmann and Kaliberda (1996) and Johnson et al. (1997) have been
recognized as the most comprehensive, internally consistent set of estimates of the unofficial
economy in post-socialist countries. But their approach has been criticized. In general terms, it has

William Davidson Institute Working Paper 436
4
been noted that unofficial economy activities can vary greatly with respect to the amount of
electricity that they require; likewise, the differences in elasticities across space and time can be
considerable and quite difficult to calibrate (Shneider and Entse, 2000). Lacko (2000), although an
advocate of using electricity consumption, voices skepticism at some of the estimates produced by
Kaufmann and Kaliberda's methodology. In particular, she suggests that their findings of significant
cross-country variation in unofficial economy dynamics do not pass the believabilty test. She
proposes an alternative methodology that involves econometrically estimating per capita household
electricity consumption. Her methodology is considerably more complicated than Kaufmann and
Kaliberda’s and it has its own serious shortcomings, some of which are noted by Schneider and
Enste (2000). Moreover, her estimates also fail the belivability test. For example, according to
Lacko, the shares of the hidden economy in Latvia and Lithuania far exceed those in Russia,
Uzbekistan, and Kazakhstan. This is hard to reconcile with anecdotal evidence and common
perception. Given these considerations and the fact that Kaufmann and Kaliberda’s estimates have
been more commonly cited, we concentrate on their approach. We will, however, compare our
estimates with those by Lacko as well.
We agree with Kaufman and Kaliberda that changes in electricity consumption can serve as a
consistent, albeit very rough, metric for assessing unofficial economy dynamics across countries. We
note, however, the crucial role of the initial estimates in evaluating the size of the unofficial economy
in any given year via electricity consumption. Surprisingly, Kaufmann and Kaliberda did not devote
much space to justifying their assumption that the size of the unofficial economy in 1989 was
uniform across all Soviet republics. Nor do they offer much support for their estimate that the
unofficial economy accounted for only 12% of total Soviet GDP. In the next section, we will use
the publications of the same Berkeley-Duke project that was referenced by Kaufmann and Kaliberda
to arrive at dramatically different estimates of the Soviet unofficial economy circa 1989.
3. The Berkeley-Duke Project and the Estimates of the Unofficial Economy Size
Soviet and Western researchers proffered a number of estimates of the size of the unofficial
economy in the Soviet Union.7 Usually, these estimates were not presented as a share of GDP
because it is often unclear to what extent unofficial economic activities add to the official GDP. For
example, if a home owner rents out part of his home in a transaction that is not declared to the tax
authorities, this is presumably part of the unofficial economy. But the official GDP includes not
only the value of paid rent, but also the imputed rent on owner-occupied housing. Therefore, the
William Davidson Institute Working Paper 436
5
unofficial rental income would be included in the GDP although it might be misclassified as
imputed rent instead of paid rent. Also, GDP calculations are often based on sources such as
consumer surveys that may take into account many unofficial transactions.8 We will disregard these
methodological issues and follow Kaufmann and Kaliberda in assuming that the share of the
unofficial economy in GDP is roughly equal to some measure of the share of unofficial economic
activity in all economic activity. For example, one such measure may be the share of labor inputs
used in the unofficial economy.
As we mentioned in the previous section, Kaufmann and Kaliberda did not fully develop the
justification for their 1989 estimates. They simply made a rather general reference to various issues
of Berkeley-Duke Occasional Papers on the Second Economy in the USSR (BDOP) and a report by
Braithwaite (1995).9 We have been able to find only two more or less general estimates of the size
of the Soviet unofficial economy based on the Berkeley-Duke survey data in the BDOP. First,
Grossman (1991) presents measures of the share of urban household income derived from the
second economy. Second, Treml (1992) estimates the amount of labor inputs used in the Soviet
second economy in urban areas. Next, we will briefly examine these estimates and argue that
Kaufmann and Kaliberda’s 12% estimate most likely understates the size of the unofficial economy
in the Soviet Union as a whole and most certainly fails to capture the variation in its size across the
individual republics.
A note on terminology is in order. Both Grossman and Treml defined the second economy
in the Soviet Union as all economic activity that either is directly for private gain or knowingly
contravenes the law, or both. Kaufman and Kaliberda define the unofficial economy as constituting
activity that is not recorded in the official GDP. Clearly, Grossman’s definition is broader because it
includes private legal economic activities that were included in the country’s official statistics. But for
urban USSR circa 1979, the year to which both Grossman’s and Treml’s second economy estimates
refer, this distinction is likely to be unimportant since the official private sector was negligible.
According to Treml’s estimates, 11.8% of all working time in the Soviet urban economy in
1979 was spent on private economic activities. Assuming that the productivity in the unofficial
economy was the same as in the official economy, this number suggests that 12% of GDP would be
a reasonable estimate for the size of the unofficial economy in 1979. Is the assumption of equal
labor productivity in the two economies reasonable? There are arguments both for and against. For
example, the unofficial economy’s productivity may be higher, because it offered much more
William Davidson Institute Working Paper 436
6
powerful incentives. On the other hand, the capital-labor ratio in the unofficial economy was
probably lower than in the official one, suggesting that the productivity in the former was also lower,
other things being equal.10 Ideally, we would like to have estimates for the value of output rather
than inputs in both economies.
Based on the same Berkeley-Duke survey data, Grossman (1991) estimates that Soviet urban
households derived on average over 30% of their total income from unofficial or second economy
sources. In evaluating these estimates, one should keep in mind that household income from
unofficial sources probably included at least part of the capital income from the second economy,
while official capital income, to the extent it was not distributed in transfers and wage subsidies,
accrued to the state. Nonetheless, the 30% figure suggests that productivity was probably higher in
the unofficial economy than in its official counterpart.
Whether or not one accepts either the 12% or the 30% figure as a suitable estimate of the
share of the unofficial economy in total GDP, it is almost certain that this share increased between
1979, the modal reference year for the Berkeley-Duke survey, and 1989. The reasons for this growth,
particularly in the second half of the 1980’s, included increased imbalances between household
incomes and opportunities to spend it in the official economy, new opportunities for unofficial
economic activities engendered by greater autonomy of state enterprises, and Gorbachev’s anti-
alcohol campaign that resulted in an explosion of bootlegging and exacerbated inflationary
pressures.11 Later, we will extrapolate the estimates based on Berkeley-Duke data from 1979 to 1989
and show that Kaufmann and Kaliberda significantly underestimated the size of the Soviet unofficial
economy prior to the transition. More important, the Berkeley-Duke study makes clear that
Kaufmann and Kaliberda erred by not making any allowance for the substantial differences in the
volume of unofficial economic activity across the former Soviet republics. Grossman (1991), in
breaking down urban household income data from official and unofficial sources for several groups
of former Soviet republics, presents the most comprehensive data that can be used to make
quantitative estimates in this regard. Table 3 summarizes the relevant numbers.
Grossman does not present incomes for some of the republics. Therefore, for those republics we
had to make estimates using aggregated regional data. For example, to calculate incomes for the
Baltic republics, we took out the data on Russia from the Russia-Baltic subzone, using the following
formula:
IB = (IRB⋅NRB – IR⋅NR)/(NRB – NR)
William Davidson Institute Working Paper 436
7
where I stands for per capita income, N denotes the number of observations, and subscripts B, RB,
and R refer to the Baltic republics, the Russia-Baltic subzone, and Russia, respectively. We then
assumed that the size of the unofficial economy was the same across republics within each region
for which we could not obtain separate estimates. For example, Belorussia and Moldavia were
presumed to have the same shares. And we assumed the same for the republics in the South zone
as well as for those in the Baltic region. The results of these calculations are shown in Table 4 below.
Notice that the shares of unofficial incomes vary in the range from 0.27 in Russia to 0.50 in the
South zone.
As we suggested earlier, the fractions in the last column of Table 4 probably overestate the
share of the unofficial economy in Soviet GDP because they do not account for capital income
accrued to the Soviet state. Thus, on the basis of Treml's (1992) esimtates of labor inputs, we adopt
the 12% figure as a conservative estimate of the share of unofficial economic activity in total GDP.
However, unlike Kaufmann and Kaliberda, we take this share to refer to 1979 since that was the year
for which Treml made his estimate.
In order to determine the share of the unofficial economy in the Soviet Union in 1989, we
use the same technique that Kaufmann and Kaliberda used to project their estimates from 1989 to
1995. According to the CIA estimates, between 1980 and 1989, Soviet official GDP grew by
approximately 21%. Over the same period, electric power output increased by about 36%.12
Assuming that in 1979 the unofficial economy contributed 12% of total GDP and using unitary
elasticity of total GDP with respect to electricity output, we can infer that by 1989 the unofficial
economy share grew to about 22%.13 This is the base estimate that we will use in our further
calculations.
Next, we determine the unofficial economy shares in eleven Soviet republics. (Following
Kaufmann and Kaliberda, we exclude four republics from our calculations because we do not have
adequate electricity consumption data to estimate unofficial economy shares in 1995.) While
Grossman’s estimates of second economy household incomes in different republics may not
measure the share of the unofficial economy in the GDP, we assume that his estimates adequately
reflect the size of unofficial economies in these republics in relative terms. We assume, for example,
that because South zone households obtained 50% of their incomes from the second economy
versus only 27% in Russia, the share of the unofficial economy in GDP was almost twice as high in
the republics of the South zone as it was in Russia. Given the relative shares shown in Table 4 and

William Davidson Institute Working Paper 436
8
using republican GNP data we can calculate the size of the unofficial economy in each republic,
making sure that the share of the unofficial economy for these republics as a group equals 22%.
Table 5 presents the results. In order to obtain the 22% share, we had to scale the shares implied by
Grossman by approximately two-thirds. For example, for Azerbaijan, 0.5⋅0.66=0.33.
Finally, we project our 1989 unofficial economy estimates to 1995, again using Kaufmann and
Kaliberda’s technique. Using our estimates for the unofficial economy in 1989 and the GDP and
electricity output indices from Johnson et al. (1997), we calculate the 1995 shares according to the
following formula:14
UE95 = 1 − (1-UE89)⋅XOF/XEL
where UE denotes the share of the unofficial economy in total GDP and XOF and XEL denote,
respectively, the indices of official GDP and total output as proxied for by electricity consumption.
The results of these calculations are presented in the next to last column of Table 6. For
comparison, we also show the estimates that Johnson et al. (1997) obtained using Kaufmann and
Kaliberda's methodology. In the next section, we will compare both their and our estimates for
1995 in a series of side-by-side regressions.
4. Side-by-Side Comparisons
One might expect that the more intrusive and the less helpful government is vis-a-vis
business, the more likely firms are to exit into the unofficial economy. More burdensome taxation
and regulation, more corruption and poorer provision of public goods all are likely to encourage
evasion from government's reach. But evaluating this proposition econometrically presents
problems. First, variables that measure state policies and capabilities tend to be highly correlated and
so multicollinearity becomes a problem when more than one are used as regressors. Second,
governance may be endogenous to the size of the unofficial economy. For example, when firms
enter the unofficial economy, they pay less tax and thereby diminish government's ability to provide
public goods. This simultaneity bias can only be alleviated if appropriate instrumental variables can
be found.
In addition to governance, it would also be reasonable to expect that a country's traditions
and norms would play an important role in determining the extent of unofficial economic activity.
Such virtually unmeasurable factors may at least be partly reflected in the historical size of the

William Davidson Institute Working Paper 436
9
unofficial economy in a country. For this reason, in what follows, we highlight regressions in which
the pre-transition share of the unofficial economy serves as one of the controls.
Several recent studies have uncovered a strong empirical relationship between the size of
unofficial economies and governance. Johnson et al. (1997) found unofficial economy size in
transitioning countries to be inversely related to fairer taxation, fewer regulations and more effective
provision of public goods. Johnson et al. (1998) and Friedman et al. (2000) further confirmed strong
associations between unofficial activity and measures of governance using expanded databases that
included OECD and developing countries.
Applying the same approach, we compare the performance of our estimates of second
economy size with those of Johnson et al. (1997). While our point estimates of the relevant
coefficients are broadly similar to theirs, we find two important differences that support our
estimates. First, our regressions exhibit better fit as measured by both the R2 values and the
statistical significance of the coefficients, which, of course, are equivalent for the bivariate
regressions. Second, the coefficient on the pre-transition size of unofficial economy is highly
significant in several of our regressions, while it is statistically insignificant in all of the
corresponding Johnson et al. (1997) regressions. We discuss both differences in some detail in turn.
The value of R2 can serve as a test of the accuracy of the dependent variable only under
rather limited circumstances. For example, let the true relationship between a dependent variable Y
and independent variable X be Y=α+βX+ε, where α and β are constant coefficients and ε is a
random error that satisfies the OLS assumptions. Suppose now that we have two measures of Y that
have errors denoted, respectively, by J and K. In other words, under the first measure we observe
values Y+J, while under the second we observe Y+K. Suppose also that when we regress Y+J and
Y+K on X, we obtain the respective R2 values of of rJ and rK. It is straightforward to show that if
the values of J and K are uncorrelated with either Y or ε, then rK>rJ implies that the variance of K is
lower than the variance of J. This would indeed suggest that Y+K is a better estimate of Y than Y+J
if both K and J have the same mean. However, if K and J have different means, the value of R2 says
nothing about which error has a smaller mean. This is because the difference in the means of the
measurement errors of the dependent variables would be reflected only in the point estimates of the
constant term. Therefore, if the above assumptions on the measurement errors are satisfied, the
better fit of our regressions favors our estimates of the unofficial economies across the former

William Davidson Institute Working Paper 436
10
Soviet republics. As for the higher average size of unofficial economy according to our estimates, we
can rely only on the arguments presented in the previous section.
With the above discussion in mind, consider Table 7. It reports the outcomes from three
pairs of bivariate regressions, each of which uses the same governance variables as regressors as
Johnson et al. (1997).15 The third column in Table 7 reproduces results presented in Johnson et al.
(1997) for fifteen transitioning countries -- the six East European countries and nine of the former
Soviet republics listed in the bottom half of Table 2. The results recorded in column four are
similarly derived with the exception that they are based on our estimates for the relative size of the
unofficial economy.16
Although they produce estimates for the unofficial economies of Belarus and Uzbekistan,
Johnson et al. (1997) do not include these two in their regressions. They argue that the governments
in these two countries were so repressive that "entrepreneurs [could not] switch into the unofficial
sector." This strikes us as an odd line of reasoning. Generally, all governments try to prevent entry
into the unofficial sector. And, no doubt, there is a good deal of variation in their capabilities. But
these are the very sort of differences in governance that our regressors are designed to capture. We,
therefore, run the same set of regressions with Belarus and Uzbekistan.17 Using the expanded set of
seventeen countries, the results for Johnson et al.'s (1997) and our estimates are presented side-by-
side in the first two columns of Table 7. Columns five and six show the results of the same
regressions run on just the eleven former Soviet republics for which we developed new estimates.
All the variables in these regressions have the expected negative signs. Better governance,
that is, is associated with smaller unofficial economies. But the series using our re-estimates offer
stronger support for this proposition. Comparing the R2 values across each pair of regressions using
the same governance variable and the same sample of countries, the ones using our re-estimates are
almost uniformly higher. With the exception of “regulation” (for which we do not have a complete
set of data for all seventeen countries), governance variables explain more of the variation in the size
of the second economy as we have estimated it. Furthermore, plugging our re-estimates into the
larger seventeen country data set, we find that all five of the variables are significant at the 1% level;
only one, however, is significant at this level using the Johnson et al. (1997) estimates.
Because of the potential simultaneity between governance and the unofficial economy, Table
7 also presents the results using two variables to instrument for the governance regressor: the
distance of the country's capital city from Brussels and a dummy variable that indicates whether the

William Davidson Institute Working Paper 436
11
country used to be part of the Soviet Union. The comparative results are similar to those in the OLS
regressions.
A somewhat surprising feature of Johnson et al.’s (1997) regressions is the lack of any strong
relationship between the pre- and post-transition shares of the unofficial economy. As shown in
Table 8, in their regressions, none of the coefficients on their 1989 share estimates are statistically
significant in determining 1995 shares. This is particularly unexpected because in the absence of any
cross-country variation in the rate of structural change during the 1989–1995 period, the correlation
between the two sets of shares would have been perfect. Did the transition produce such a radical
change of regime with respect to the unofficial economy share of GDP that the post-transition
governance indicators became the only significant explanatory factor? In contrast to Johnson et al.
(1997), our estimates show that this was not the case. The pre-transition shares of the unofficial
economy are positive and highly significant in all our OLS regressions for 15 economies and are
significant at least at the 10% level in our 17-economy regressions (see Table 8). While this
correlation is natural because we work with levels (shares) rather than growth rates, we would argue
that the correlation is enhanced because the pre-transition shares of unofficial economy could be
viewed as proxies for cultural environment and historical factors in each country.18 To the extent
that this is the case, the positive relationship between the 1989 and 1995 shares suggests that the
shares of the unofficial economy are path-dependent and only partly determined by the post-
transition governance environment. Finally, given that the positive relationship between the 1989
and 1995 shares is to be expected, the fact that it exists for our estimates reinforces their validity
relative to the estimates produced by Kaufmann and Kaliberda.
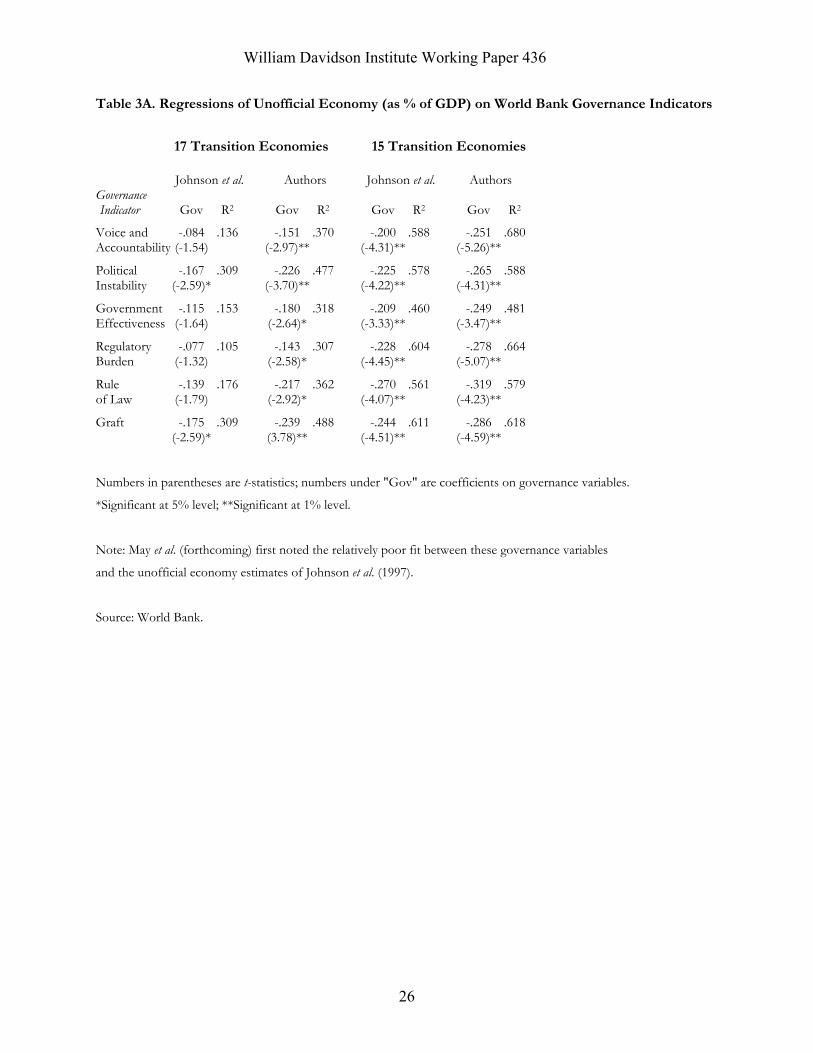
We present additional results in the Appendix tables. All offer further confirmation of the
conclusions drawn from Table 7. Table 1A re-produces regressions that control for being a former
Soviet republic. Table 2A presents the same set of bivariate regressions run in Table 7 but makes
the comparison between our and Lacko's estimates. Table 3A runs the same regression as in Table 7
but for a newer set of governance variables recently released by the World Bank. The R2 values for
our estimates and the significance of the coefficients are consistently higher in the pairwise
comparisons.
5. Conclusion
In this paper, we argue that the most commonly used estimates of the shares of the
unofficial economy in the former Soviet republics are flawed in two important respects. First, the

William Davidson Institute Working Paper 436
12
estimates of Kaufmann and Kaliberda and Johnson et al. (1997) disregard the variation in the
development of unofficial economies across space in the former Soviet Union. Second, their
estimates for 1989 and, as a consequence, for 1995 significantly understate the average size of
unofficial economies in this entire group of countries. We propose our own estimates and compare
the two sets by evaluating how strongly they are related to the institutional factors commonly used
to explain the size of the unofficial sector. We find that our estimates, combined with Kaufmann
and Kaliberda’s estimates for a few other transition economies, are more strongly associated with the
explanatory variables as measured by the R2 values and the statistical significance of the coefficients
in almost all regressions.
In addition, we question the validity of Kaufmann and Kaliberda’s estimates in view of the
fact that their 1995 unofficial economy shares are uncorrelated with their 1989 estimates. The
absence of a positive correlation is surprising because the levels of unofficial activity are unlikely to
change radically and differently across countries over six years, even during the economic transition.
In contrast, our 1995 estimates are clearly positively correlated with our 1989 estimates. Moreover,
the 1989 shares remain a significant explanatory factor in our regressions even in the presence of
explanatory governance variables, suggesting perhaps that the pre-transition starting point is
important above and beyond the institutional environment that was achieved in the process of
transition.
Finally, we compare the goodness of fit of our estimates with those generated by Lacko
(2000). Here again, our estimates perform better than hers in the regressions.

William Davidson Institute Working Paper 436
13
References
Alexeev, M. (1997), 'The Russian Underground Economy in Transition,' in Lippert, O. and M.
Walker (eds.), The Underground Economy: Global Evidence of Its Size and Impact, Vancouver, Canada: The Fraser Institute, pp. 255-273.
Alexeev, M. and V. Treml (1994), 'The Growth of the Second Economy in the Soviet Union and Its Impact on the System,' in Campbell, R. (ed.), The Postcommunist Economic Transformation, Boulder: Westview Press, pp. 221- 247.
Braithwaite, J. (1995), 'From Second Economy to Informal Sector: The Russian Labor Market in Transition,' ESP Discussion Paper Series, No. 58, World Bank.
Dobozi, I. and G. Pohl (1995), 'Real Output Decline in Transition Economies -- Forget GDP, Try Power Consumption Data!' Transition Newsletter, 6:1-2, pp. 17-18.
Friedman, E., S. Johnson, D. Kaufmann and P. Zoido-Lobaton (2000) 'Dodging the Grabbing Hand: The Determinants of Unofficial Activity in 69 Countries,' Journal of Public Economics, 76, pp. 459-493.
Grossman, G. (1991), 'Wealth Estimates Based on the Berkeley-Duke Émigré Questionnaire: A Statistical Compilation, ' Berkeley-Duke Occasional Papers on the Second Economy in the USSR, No. 27, May.
Johnson, S. and D. Kaufmann (2001), 'Institutions and the Underground Economy,' in Havrylyshyn, O. and S. Nsouli (eds.), A Decade of Transition: Achievements and Challenges, Washington, D.C.: International Monetary Fund.
Johnson, S. D. Kaufmann and A. Shleifer (1997), 'The Unofficial Economy in Transition,' Brookings Papers on Economic Activity, 2, pp. 159-221.
Johnson, S. D. Kaufmann and P. Zoido-Lobaton (1998), 'Regulatory Discretion and the Unofficial Economy,' American Economic Review, 88:2, pp. 387-392.
Kaufmann, D. and A. Kaliberda. (1996), 'Integrating the Unofficial Economy into the Dynamics of Post-Socialist Economies: A Framework for Analysis and Evidence' in Kaminski, B. (ed.) Economic Transition in Russia and the New States of Eurasia, London: M.E. Sharpe, pp. 81-120.
Lacko, M. (2000), 'Hidden Economy -- An Unknown Quantity: Comparative Analysis of Hidden Economies in Transition Countries, 1989-95,' Economics of Transition, 8:1, pp. 117-149.
Levine, H. (1983), 'Possible Causes of the Deterioration of Soviet Productivity Growth in the Period 1976-80,' in Soviet Economy in the 1980’s: Problems and Prospects, Joint Economic Committee, Congress of the United States, US Government Printing Office: Washington, DC, pp. 153-168.
May, J., W. Pyle and P. Sommers, 'Does Governance Explain Unofficial Activity,' Applied Economics Letters, forthcoming.
Millar, J., ed. (1987), Politics, Work, and Daily Life in the USSR : A Survey of Former Soviet Citizens, Cambridge University Press: Cambridge, Mass.
Narodnoe khoziaistvo SSSR v 1980 godu, Moscow: Finansy i statistika.

William Davidson Institute Working Paper 436
14
Noren, J. and L. Kurtzweg (1993), 'The Soviet Economy Unravels: 1985-91,' in The Former Soviet Union in Transition, v. 1, Joint Economic Committee, Congress of the United States, US Government Printing Office: Washington, DC, pp. 8-33.
Ofer, G. and A. Vinokur (1992), The Soviet Household Under the Old Regime: Economic Conditions and Behavior in the 1970s, Cambridge University Press: Cambridge, Mass.
Reed, J. (1995), 'The Great Growth Race,' Central European Economic Review, December -January, pp. 8-10.
Rosser, J., M. Rosser and E. Ahmed (2000), 'Income Inequality and the Informal Economy in Transition Economies,' Journal of Comparative Economics, 28, pp. 156-171.
Rutgaizer, V. (1992) 'The Shadow Economy in the USSR,' Berkeley-Duke Occasional Papers on the Second Economy in the USSR, No. 34, February.
Schneider, F. and D. Enste (2000), 'Shadow Economies: Size, Causes, and Consequences,' Journal of Economic Literature, 38, pp. 77-114.
Smith, P. 'Assessing the Size of the Underground Economy: The Statistics Canada Perspective,' in Lippert, O. and M. Walker (eds.), The Underground Economy: Global Evidence of Its Size and Impact, The Fraser Institute: Vancouver, Canada, 1997, pp. 11-36.
Treml, V. (1992), “A Study of Labor Inputs Into the Second Economy of the USSR,” Berkeley-Duke Occasional Papers on the Second Economy in the USSR, No. 33, January.

William Davidson Institute Working Paper 436
15
Table 1. Output Elasticity of Electricity-consumption
Elasticity Central and East Europe Baltic Countries Former Soviet Union Output Rises 0.9 1.0 1.15 Output Falls 1.11 1.0 0.87
Note: Output elasticity of electricity-consumption measures the percentage change in
measured electricity consumption divided by the percentage change in total GDP.

William Davidson Institute Working Paper 436
16
Table 2. Unofficial Economy’s Share of Total Output: Kaufmann and Kaliberda's Methodology
Central and Eastern Europe 1989 1994 1995
Bulgaria 22.8 29.1 36.2 Czech Republic 6.0 17.6 11.3
Hungary 27.0 27.7 29.0 Poland 15.7 15.2 12.6
Romania 22.3 17.4 19.1 Slovakia 6.0 14.6 5.8
Former Soviet Union Azerbaijan 12.0 58.0 60.6
Belarus 12.0 18.9 19.3 Estonia 12.0 25.1 11.8 Georgia 12.0 63.5 62.6
Kazakhstan 12.0 34.1 34.3 Latvia 12.0 34.2 35.3
Lithuania 12.0 28.7 21.6 Moldova 12.0 39.7 35.7 Russia 12.0 40.3 41.6
Ukraine 12.0 45.7 48.9 Uzbekistan 12.0 9.5 6.5
Note: Neither Kaufmann and Kaliberda (1996) nor Johnson et al.
(1997) presented estimates for Armenia, Kyrgyzstan, Tadzhikistan or
Turkmenistan. See p. 176 in Johnson et al. (1997).
Source: Johnson et al. (1997).

William Davidson Institute Working Paper 436
17
Table 3. Per Capita Incomes from Official and Unofficial Sources: Berkeley-Duke Survey
Region Number of
observationsSocialist income
Total personal income
Unofficial income
North zone 1944 1280 1890 610 Russia-Baltic subzone 1384 1270 1780 510 Russia 1057 1330 1830 500 Belorussia-Moldavia-Ukraine 560 1300 2170 870 Ukraine 361 1350 2190 840 South zone excluding Armenia 488 896 1780 884 Notes: 1. North zone includes Russia, Ukraine, Belorussia, the Baltic republics, and Moldavia.
South zone includes all other republics. We exclude Armenia because, like Kaufmann and
Kaliberda we do not have the electricity consumption data that would be necessary for our
subsequent estimates. 2. We refer to the former Soviet republics by their Soviet names.
Source: Grossman (1991), pp. 13-16.

William Davidson Institute Working Paper 436
18
Table 4. Per Capita Incomes from Official and Unofficial Sources
for 11 Soviet Republics: Berkeley-Duke Survey
Region Number of observations
Socialist income
Total personal income
Unofficial income
Share of unofficial income
Russia 1057 1330 1830 500 0.27 Baltic republics 327 1076.1 1618.4 542.3 0.34 Belorussia-Moldavia 199 1209.3 2133.7 924.4 0.43 Ukraine 361 1350 2190 840 0.38 South zone excluding Armenia
488 896 1780 884 0.50
Source: Authors’ calculations based on Grossman (1991), pp. 13-16.

William Davidson Institute Working Paper 436
19
Table 5. Estimated Shares of Unofficial Economy in 11 Republics of the FSU, 1989
Official GNP
(mln. rub.)
Unofficial economy
share, 1979
Extrapolated shares of unofficial
economy, 1989
Unofficial GNP
(mln. rub.)
Total GNP
(mln. rub.)
Azerbaijan 14,697 0.50 0.33 7,166 21,863 Belarus 40,100 0.43 0.29 16,058 56,158 Estonia 7,977 0.34 0.22 2,265 10,242 Georgia 14,900 0.50 0.33 7,265 22,165 Kazakhstan 46,363 0.50 0.33 22,606 68,969 Latvia 12,488 0.34 0.22 3,546 16,034 Lithuania 12,897 0.34 0.22 3,662 16,559 Moldova 12,681 0.43 0.29 5,078 17,759 Russia 626,300 0.27 0.18 137,786 764,086 Ukraine 164,761 0.38 0.25 55,847 220,608 Uzbekistan 32,430 0.50 0.33 15,813 48,243 Total 985,594 0.34 0.22 277,094 1,262,688
Sources: Official GNP is from World Bank (1993), Table 2b, pp. 10-11. We used
the GNP data for 1990, because this was the earliest year for which such data were
available to us. Given that we used these data only as relative weights, the
difference between 1990 and 1989 must have been negligible. Unofficial economy
shares for 1979 are calculated based on Grossman (1991).

William Davidson Institute Working Paper 436
20
Table 6. Estimates of Unofficial Economies in 1995
Unofficial economy
share, 1989 (%)
Index of official
GDP, 1995 (1989=100)
Index of electricity
output, 1995 (1989=100)
Unofficial economy
share, 1995 (%)
Unofficial economy share, 1995 Johnson
et al. (1997) (%)
Azerbaijan 32.8 31.4 70.1 69.9 60.6 Belarus 28.6 56.1 61.2 34.5 19.3 Estonia 22.1 69.1 68.9 21.9 11.8 Georgia 32.8 16.0 37.6 71.4 62.6 Kazakhstan 32.8 46.5 62.3 49.8 34.3 Latvia 22.1 47.3 62.3 40.9 35.3 Lithuania 22.1 45.1 50.6 30.6 21.6 Moldova 28.6 43.0 58.8 47.8 35.7 Russia 18.0 49.1 74.0 45.6 41.6 Ukraine 25.3 39.0 67.0 56.5 48.9 Uzbekistan 32.8 84.0 79.0 28.5 6.5
Sources: Columns 1 and 4 are based on authors' calculations. Columns 2, 3 and 5 are from
Table 1 in Johnson et al. (1997).

Will
iam
Dav
idso
n In
stitu
te W
orki
ng P
aper
436
21
Tab
le 7
. Reg
ress
ions
of U
noffi
cial
Eco
nom
y (a
s % o
f GD
P) o
n G
over
nanc
e In
dica
tors
17
Tra
nsiti
on C
ount
ries
15 T
rans
ition
Cou
ntrie
s 11
FSU
Cou
ntrie
s
(e
xclu
des B
elar
us a
nd U
zbek
ista
n)
Jo
hnso
n et
al.
Aut
hors
Jo
hnso
n et
al.
Aut
hors
Jo
hnso
n et
al.
Aut
hors
G
overn
ance
In
dicat
or
Gov
R2
G
ov
R2
Gov
R2
G
ov
R2
Gov
R2
G
ov
R2
Lega
l O
LS
-.041
.3
06
-.060
.5
60
-.060
.6
42
-.074
.7
29
-.044
.1
90
-.055
.3
91
Safe
guar
ds
(-2
.57)
*
(-4
.37)
**
(-
4.83
)**
(-5
.91)
**
(-1
.45)
(-2.4
0)*
IV
-.036
.3
00
-.065
.5
57
-.059
.6
42
-.083
.7
19
(-1
.84)
(-3.8
6)**
(-3.9
6)**
(-5.3
5)**
Crim
e an
d O
LS
-.039
.3
21
-.056
.5
52
-.055
.6
43
-.067
.7
03
-.041
.2
16
-.048
.3
82
Corr
uptio
n
(-2.6
6)*
(-4.3
0)**
(-4.
84)*
*
(-5.
54)*
*
(-1.5
7)
(-2
.36)
*
IV
-.035
.3
18
-.064
.5
40
-.059
.6
41
-.082
.6
69
(-1
.90)
(-3.8
4)**
(-3.9
7)**
(-4.9
8)**
Tax
Burd
en
OLS
-.0
55
.223
-.0
86
.458
-.1
16
.764
-.1
38
.801
-.0
27
.039
-.0
43
.127
(-2
.07)
(-3.5
6)**
(-6.
49)*
*
(-7.
23)*
*
(-0.6
1)
(-1
.15)
IV
-.066
.2
14
-.117
.3
94
-.116
.7
64
-.163
.7
77
(-1
.82)
(-3.4
1)**
(-4.9
2)**
(-6.0
9)**
Regu
latio
n†
OLS
-.1
32
.482
-.1
39
.419
-.1
30
.484
-.1
39
.419
-.1
81
.765
-.1
77
.815
(-3
.48)
**
(-3
.06)
**
(-
3.35
)**
(-2
.94)
*
(-4.7
7)**
(-5.5
5)**
IV
-.192
.3
78
-.204
.3
27
-.187
.3
93
-.202
.3
33
(-3
.59)
**
(-3
.23)
**
(-3
.43)
**
(-3
.09)
**
Lega
l O
LS
-.086
.2
63
-.125
.4
64
-.130
.5
78
-.156
.6
16
-.075
.1
39
-.088
.2
51
Eff
ectiv
enes
s
(-2.3
1)*
(-3
.60)
**
(-
4.21
)**
(-
4.57
)**
(-1
.21)
(-1.7
4)
IV
-.088
.2
63
-.160
.4
27
-.144
.5
70
-.201
. 5
67
(-1
.80)
(-3.4
1)**
(-3.5
9)**
(-4.2
7)**

William Davidson Institute Working Paper 436
22
Numbers in parentheses are t-statistics; numbers under "Gov" are coefficients on governance variables.
*Significant at 5% level; **Significant at 1% level.
Boldened results are those reported in Johnson et al. (1997).
†For "regulation," no observations for Kazakhstan and Uzbekistan.
Sources: The legal safeguards, crime and corruption and tax burden variables were taken from the December
1995-January 1996 issue of the. A panel of eight experts was asked to rank 26 transition countries on the basis
of a number of factors affecting business. Grades were given on a scale of 0 to 10, with 10 representing the
best environment for business. The panel members included: Dirk Damrau, Salomon Brothers Internation;
Susanne Gahler, JP Morgan; Donald Green, PlanEcon; Andreas Gummich, Deutsche Bank Research; Peter
Havlik, Vienna Institute for Comparative Economic Studies; Jonathan Hoffman, CS First Boston; James
Lister-Cheese, Independent Strategy; and Werner Varga, Creditanstalt Bankverein. In their article, Johnson et
al. (1997) refer to the "tax fairness" and "corruption" variables from the survey in the Central European Economic
Review; the survey actually asked about "tax burden" and "crime and corruption."
The regulation variable was created by experts at the Heritage Foundation (see www.heritage.org/index). The
original scale was from 0 to 4, with 0 meaning that there is little or no corruption, existing regulations are
straightforward, not burdensome and applied uniformly to all businesses. We follow Johnson et al. (1997) by
reversing the scale so that 4 means the least burdensome regulation, allowing us to consistently have the pro-
business governance scored with the higher numbers.
As reported in Johnson et al. (1997), we use the European Bank for Reconstruction and Development's "legal
effectiveness" index for 1995.

William Davidson Institute Working Paper 436
23
Table 8. Regressions of Unofficial Economy (as % of GDP) on Governance Indicators and Estimated Share
of Unofficial Economy in 1989 17 Transition Countries 15 Transition Countries (excluding Belarus and Uzbekistan) Johnson et al. Authors Johnson et al. Authors
Gov Init R2 Gov Init R2 Gov Init R2 Gov Init R2
Legal OLS -.045 .728 .355 -.037 .920 .640 -.063 .665 .690 -.048 1.090 .842
Safeguards (-2.73)* (1.04) (-2.02)#(1.77) # (-5.15)**(1.36) (-3.58)**(2.93)*
IV -.041 .697 .353 -.031 1.051 .637 -.064 .672 .690 -.046 1.126 .841
(-2.06) # (0.98) (-1.04) (1.52) (-2.06)* (0.98) (-2.26)*(2.41)* Crime and OLS -.043 .744 .373 -.035 .976 .656 -.058 .676 .692 -.043 1.188 .856
Corruption (-2.84)* (1.07) (-2.22)*(2.06) # (-5.17)**(1.38) (-3.90)**(3.56)**
IV -.041 .731 .372 -.031 1.054 .655 -.064 .721 .685 -.045 1.151 .855
(-2.14)* (1.04) (-1.17) (1.66) (-4.31)**(1.44) (-2.50)* (2.71)*
Tax Burden OLS -.057 .545 .251 -.042 1.151 .592 -.118 .442 .786 -.097 .989 .897
(-2.12) # (0.73) (-1.39)(2.15)* (-6.61)**(1.01) (-5.11)**(3.34)**
IV -.076 .614 .226 -.085 .609 .529 -.124 .454 .784 -.109 .864 .893
(-2.05) # (0.80) (-1.24) (0.64) (-5.29)**(1.12) (-3.05)** (2.01) #
Regulation† OLS -.144 -.553 .511 -.051 1.586 .667 -.143 -.585 .517 -.039 1.772 .692
(-3.51)**(-0.84) (-1.11)(2.99)* (-3.41)**(-0.87) (-0.80)(3.13)**
IV -.215 -.959 .388 -.088 1.318 .650 -.210 -.967 .404 -.066 1.562 .684
(-3.68)**(-1.26) (-1.22) (1.96) # (-3.54)**(-1.24) (-0.83) (2.08)#
Legal OLS -.088 .481 .285 -.062 1.14 .595 -.131 .323 .589 -.087 1.297 .785
Effectiveness (-2.32)* (0.66) (-1.43)(2.13) # (-4.13)**(0.58) (-2.50)* (3.06)**
IV -.100 .501 .280 -.086 .925 .585 -.152 .341 .574 -.114 1.086 .774
(-2.03) # (0.68) (-1.02) (1.12) (-3.69)**(0.60) (-1.83) #(1.84) #
Numbers in parentheses are t-statistics; numbers under "Gov" are coefficients on governance variables; "Init" is the
share of the unofficial economy in 1989 as estimated by Johnson et al. and the authors, respectively. # Significant at 10% level; * Significant at 5% level; ** Significant at 1% level.
Boldened results are those reported in Johnson et al. (1997). †For "regulation," no observations for Kazakhstan and Uzbekistan.
Sources: See note in Table 7. All governance data are for 1995.

William Davidson Institute Working Paper 436
24
Appendix
Table 1A. Regressions of Unofficial Economy (as % of GDP) on Governance Indicators and
Soviet Dummy
17 Transition Countries 15 Transition Countries (excluding Belarus and Uzbekistan)
Johnson et al. Authors Johnson et al. Authors
Gov Sov R2 Gov Sov R2 Gov Sov R2 Gov Sov R2
Legal OLS -.036 .033 .310 -.044 .115 .605 -.055 .033 .648 -.055 .115 .775
Safeguards (-1.61) (0.31) (-2.38)* (1.27) (-3.26)**(0.42) (-3.67)**(1.57)
Crime and OLS -.035 .031 .325 -.040 .120 .604 -.051 .038 .650 -.051 .126 .760
Corruption (-1.72) (0.29) (-2.36)* (1.35) (-3.28)**(0.49) (-3.45)**(1.69)
Tax Burden OLS -.039 .074 .247 -.053 .154 .544 -.114 .010 .765 -.114 .101 .837
(-1.09) (0.67) (-1.74) (1.63) (-4.67)**(0.16) (-4.83)**(1.63)
Regulation† OLS -.118 .146 .648 -.116 .236 .760 -.113 .165 .691 -.113 .248 .774
(-3.56)**(2.38)* (-3.76)**(4.14)** (-3.53)**(2.72)* (-3.61)**(4.15)**
Legal OLS -.068 .061 .280 -.079 .154 .556 -.110 .067 .601 -.109 .159 .715
Effectiveness (-1.37) (0.58) (-1.86) (1.70) (-2.83)*(0.85) (-2.85)* (2.04)
Numbers in parentheses are t-statistics; numbers under "Gov" are coefficients on governance variables; "Sov" is a
dummy variable for former Soviet republics.
* Significant at 5% level; ** Significant at 1% level.
Boldened results are those reported in Johnson et al. (1997).
†For "regulation," no observations for Kazakhstan and Uzbekistan.
Sources: see note in Table 7. All governance data are for 1995.

William Davidson Institute Working Paper 436
25
Table 2A. Regressions of Unofficial Economy (as % of GDP) on Governance Indicators Lacko Authors
Gov R2 Gov R2
Legal -.015 .428 -.060 .552 Safeguards (-3.24)** (-4.16)**
Crime and -.013 .407 -.055 .543 Corruption (-3.10)** (-4.08)**
Tax Burden -.023 .415 -.086 .470 (-3.15)** (-3.52)**
Regulation† -.032 .282 -.141 .446 (-2.17)* (-3.11)**
Legal -.031 .354 -.124 .470 Effectiveness (-2.85)* (-3.52)**
Note: Lacko produced estimates for the ratio of the hidden economy to the official GDP. Since we and Johnson et al.
(1997) used the ratio of the hidden economy to total GDP as our dependent variable, we adjust Lacko's estimates
according to the following formula: L/(1+L), where L refers to Lacko's estimate of the ratio of the hidden economy to
official GDP. We thus convert her estimates into the ratio of the hidden economy to total GDP. She produces
estimates for twenty countries. The above regressions are, however, just run for the sixteen countries for which we
both have estimates. These are the seventeen countries listed in Table 2 minus Moldova.
William Davidson Institute Working Paper 436
26
Table 3A. Regressions of Unofficial Economy (as % of GDP) on World Bank Governance Indicators
17 Transition Economies 15 Transition Economies
Johnson et al. Authors Johnson et al. Authors Governance Indicator Gov R2 Gov R2 Gov R2 Gov R2
Voice and -.084 .136 -.151 .370 -.200 .588 -.251 .680 Accountability (-1.54) (-2.97)** (-4.31)** (-5.26)**
Political -.167 .309 -.226 .477 -.225 .578 -.265 .588 Instability (-2.59)* (-3.70)** (-4.22)** (-4.31)**
Government -.115 .153 -.180 .318 -.209 .460 -.249 .481 Effectiveness (-1.64) (-2.64)* (-3.33)** (-3.47)**
Regulatory -.077 .105 -.143 .307 -.228 .604 -.278 .664 Burden (-1.32) (-2.58)* (-4.45)** (-5.07)**
Rule -.139 .176 -.217 .362 -.270 .561 -.319 .579 of Law (-1.79) (-2.92)* (-4.07)** (-4.23)**
Graft -.175 .309 -.239 .488 -.244 .611 -.286 .618 (-2.59)* (3.78)** (-4.51)** (-4.59)**
Numbers in parentheses are t-statistics; numbers under "Gov" are coefficients on governance variables.
*Significant at 5% level; **Significant at 1% level.
Note: May et al. (forthcoming) first noted the relatively poor fit between these governance variables
and the unofficial economy estimates of Johnson et al. (1997).
Source: World Bank.

William Davidson Institute Working Paper 436
27
ENDNOTES 1 Our use of Berkeley-Duke data is justified in part because it was the only family budget survey specifically aimed at studying the unofficial or second economy in the USSR and because Kaufmann and Kaliberda claim to have derived their estimates, in part, from Berkeley-Duke data. 2 Dobozi and Pohl (1995) first addressed the degree of correlation between measured output and electricity consumption during the transition. 3 Kaufmann and Kaliberda note several biases in using electricity consumption as a proxy for overall GDP. Applying a near-unit-elasticity assumption could lead to incorrectly high estimates of total output if the economy slumps and electricity is primarily a fixed cost, or if electricity costs rise because of a lack of basic maintenance, or if energy users substitute from other sources to electricity. Downward biases could result from improved efficiency in electricity use, price-induced substitution away from electricity, or a shift in output away from electricity-intensive industries. On balance, they feel that the upward and downward biases offset each other. 4 This figure is calculated with the assumption of unitary output elasticity of electricity consumption and according to the formula (105-92.7)/105=11.7%. 5 See footnote 25 in Kaufmann and Kaliberda (1996). 6 Kaufmann and Kaliberda produce estimates for 1994 and present them in a bar graph that indicates the relative sizes of unofficial economies across republics. Exact percentages are not provided. Johnson et al. (1997) use the same methodology and baseline estimates to update the estimates for 1995. They provide the exact percentages for both 1994 and 1995. 7 Rutgaizer (1992) presents a survey of estimates made by Soviet researchers who, as he stresses, provided virtually no substantiation for their numbers. The estimates from other surveys of emigrants out of the USSR are reported in Ofer and Vinokur (1992) and Millar (1987). Note, however, that unlike the Berkely-Duke project, neither of these surveys focused on the study of the underground economy. 8 See Smith (1997) for arguments along these lines. 9 See footnote 23 in Kaufmann and Kaliberda. Braithwaite’s estimate of approximately 13% of the labor force being engaged in the unofficial economy relates to the post-1992 period. More important, her estimate is derived under the apparent assumption that none of the full-time officially employed individuals participated in the unofficial economy. We think that this assumption is at great odds with casual observation and undermines the validity of Braithwaite’s estimates. 10 Note, however, that a significant share of unofficial income was obtained by using state-owned capital at state-owned enterprises. 11 The estimates of the dynamics of unofficial economy made by the Soviet researchers are summarized in Rutgaizer (1992). Alexeev and Treml (1994) provide some econometric evidence of its growth. See also Alexeev (1997) for a discussion of the reasons for the growth of the underground economy in the USSR in the late 1980’s. 12 The CIA estimates of Soviet GNP growth for 1980 are reported in Levine (1983). Noren and Kurtzweg (1993) present CIA GNP growth estimates for 1981-1989 and electricity output growth rates for the same period. The growth rate of electricity output for 1980 was calculated based on Narodnoe (1981). 13 This number is obtained as (1.36−0.88⋅1.21)/1.36≈0.22. We use unitary elasticity of output with respect to electricity consumption for the 1979-89 period essentially by default, as we do not have strong priors for the value of this elasticity in the former USSR.

William Davidson Institute Working Paper 436
28
14 To derive this formula, normalize the total 1989 GDP to 1. Then the official 1995 GDP can be obtained as XOF⋅(1-UE89), implying that the unofficial economy in 1995 is XEL − XOF⋅(1-UE89). The formula for the share of this unofficial economy is then obtained by dividing the latter expression by XEL. 15 Tables 2 and 3 in Johnson et al. (1997) also present regressions with several other governance variables which we have chosen not to present here. The data for “internal liberalization” were not available publicly. “External liberalization” and “large-scale privatization” do not relate as directly to governance and firm-level decisions to enter the underground economy as variables measuring the legal, regulatory and tax environments. “Rule of law” was constructed in 1997, two years subsequent to the unofficial economy data; the origins of the “legal extensiveness” data were not clear. 16 In later studies using cross-section data that included OECD and developing countries, Johnson et al. (1998) and Friedman et al. (2000) continued to use the same set of unofficial economy size estimates for transition countries. These had been constructed with output and electricity consumption data through 1995. These later studies, however, regressed these estimates on a number of governance indicators that had been created after 1995. 17 In Johnson et al. (1998) and Friedman et al. (2000), the argument about the uniqueness of these countries is not made and Belarus and Uzbekistan are included in the regressions. 18 Using growth rate of the shares during 1989-95 period would have presented its own problems, because higher initial shares would tend to grow slowly simply because they would have less room for growth. In the limit, if a country’s share of unofficial economy is 100%, it could only decline.
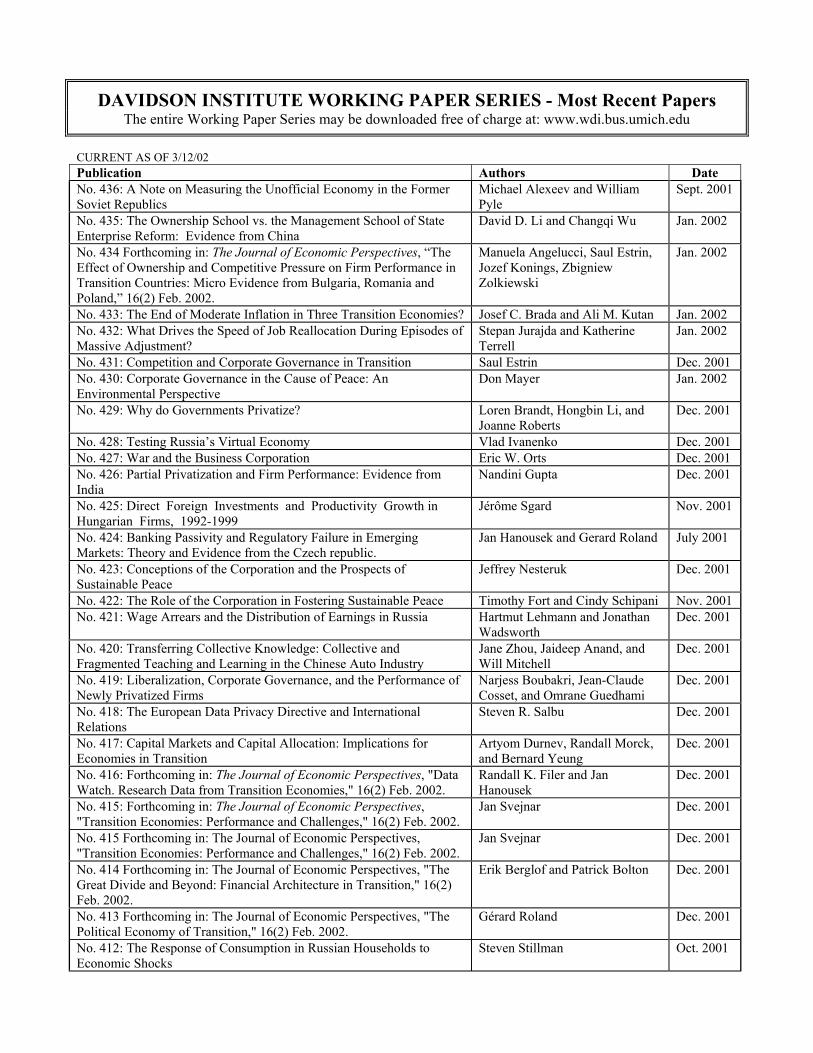
DAVIDSON INSTITUTE WORKING PAPER SERIES - Most Recent Papers The entire Working Paper Series may be downloaded free of charge at: www.wdi.bus.umich.edu
CURRENT AS OF 3/12/02 Publication Authors Date No. 436: A Note on Measuring the Unofficial Economy in the Former Soviet Republics
Michael Alexeev and William Pyle
Sept. 2001
No. 435: The Ownership School vs. the Management School of State Enterprise Reform: Evidence from China
David D. Li and Changqi Wu Jan. 2002
No. 434 Forthcoming in: The Journal of Economic Perspectives, “The Effect of Ownership and Competitive Pressure on Firm Performance in Transition Countries: Micro Evidence from Bulgaria, Romania and Poland,” 16(2) Feb. 2002.
Manuela Angelucci, Saul Estrin, Jozef Konings, Zbigniew Zolkiewski
Jan. 2002
No. 433: The End of Moderate Inflation in Three Transition Economies? Josef C. Brada and Ali M. Kutan Jan. 2002 No. 432: What Drives the Speed of Job Reallocation During Episodes of Massive Adjustment?
Stepan Jurajda and Katherine Terrell
Jan. 2002
No. 431: Competition and Corporate Governance in Transition Saul Estrin Dec. 2001 No. 430: Corporate Governance in the Cause of Peace: An Environmental Perspective
Don Mayer Jan. 2002
No. 429: Why do Governments Privatize? Loren Brandt, Hongbin Li, and Joanne Roberts
Dec. 2001
No. 428: Testing Russia’s Virtual Economy Vlad Ivanenko Dec. 2001 No. 427: War and the Business Corporation Eric W. Orts Dec. 2001 No. 426: Partial Privatization and Firm Performance: Evidence from India
Nandini Gupta Dec. 2001
No. 425: Direct Foreign Investments and Productivity Growth in Hungarian Firms, 1992-1999
Jérôme Sgard Nov. 2001
No. 424: Banking Passivity and Regulatory Failure in Emerging Markets: Theory and Evidence from the Czech republic.
Jan Hanousek and Gerard Roland July 2001
No. 423: Conceptions of the Corporation and the Prospects of Sustainable Peace
Jeffrey Nesteruk Dec. 2001
No. 422: The Role of the Corporation in Fostering Sustainable Peace Timothy Fort and Cindy Schipani Nov. 2001 No. 421: Wage Arrears and the Distribution of Earnings in Russia Hartmut Lehmann and Jonathan
Wadsworth Dec. 2001
No. 420: Transferring Collective Knowledge: Collective and Fragmented Teaching and Learning in the Chinese Auto Industry
Jane Zhou, Jaideep Anand, and Will Mitchell
Dec. 2001
No. 419: Liberalization, Corporate Governance, and the Performance of Newly Privatized Firms
Narjess Boubakri, Jean-Claude Cosset, and Omrane Guedhami
Dec. 2001
No. 418: The European Data Privacy Directive and International Relations
Steven R. Salbu Dec. 2001
No. 417: Capital Markets and Capital Allocation: Implications for Economies in Transition
Artyom Durnev, Randall Morck, and Bernard Yeung
Dec. 2001
No. 416: Forthcoming in: The Journal of Economic Perspectives, "Data Watch. Research Data from Transition Economies," 16(2) Feb. 2002.
Randall K. Filer and Jan Hanousek
Dec. 2001
No. 415: Forthcoming in: The Journal of Economic Perspectives, "Transition Economies: Performance and Challenges," 16(2) Feb. 2002.
Jan Svejnar Dec. 2001
No. 415 Forthcoming in: The Journal of Economic Perspectives, "Transition Economies: Performance and Challenges," 16(2) Feb. 2002.
Jan Svejnar Dec. 2001
No. 414 Forthcoming in: The Journal of Economic Perspectives, "The Great Divide and Beyond: Financial Architecture in Transition," 16(2) Feb. 2002.
Erik Berglof and Patrick Bolton Dec. 2001
No. 413 Forthcoming in: The Journal of Economic Perspectives, "The Political Economy of Transition," 16(2) Feb. 2002.
Gérard Roland Dec. 2001
No. 412: The Response of Consumption in Russian Households to Economic Shocks
Steven Stillman Oct. 2001
