a new seismic design approach for bridge ... new seismic design approach for bridge columns in...
TRANSCRIPT
A NEW SEISMIC DESIGN APPROACH FOR BRIDGE COLUMNS IN MODERATE SEISMICITY REGIONS
Jae-Hoon Lee1 Jin-Ho Choi2 and Sung-Jin Shin3
SUMMARY
Seismic performance of reinforced concrete columns are strongly influenced by amount, spacing, and details of confining steel as well as longitudinal reinforcement details. The current Korean Bridge Design Specifications have adopted the same concept as the AASHTO specifications for seismic design of bridge columns. It specifies constant response modification factors, R, such as 3.0 or 5.0 when plastic behavior is expected, regardless of ductility demand. According to the Design Specifications a large amount of confinement steel is provided to guarantee the full ductility even in case that the ductility demands are quite low. This sometimes results in undesirable situations such as difficulty in construction due to steel congestion and economic problems. The design concept adopted in the current design specifications which is appropriate in strong seismic regions is not always valid for moderate or low seismicity regions such as Korean Peninsular. This paper introduces a newly developed confining steel design procedure for the bridge columns in low to moderate earthquake regions. It includes ductility demand estimation procedure and required confining steel estimation procedure. The equations consider natural period of bridge, column aspect ratio, mechanical properties of concrete and reinforcement, longitudinal steel ratio, axial force ratio, and ductility demand. This paper also provides design examples of ten bridge models and discussion on economy, safety, and consistency of the current design method and the proposed design method. Keywords: bridge columns, confining steel, moderate seismicity region, ductility demand, new design method
INTRODUCTION The current seismic design criteria of the Korean Bridge Design Specifications [KBDS, 2005] have adopted the same seismic design concept and requirements as the AASHTO specifications [AASHTO, 2002 and AASHTO-LRFD, 2004]. This design approach has been based on the force-based full ductility design concept which was essentially developed for 1 Professor, Department of Civil Engineering, Yeungnam University, KOREA, e-mail:[email protected] 2 PhD, Student, Department of Civil Engineering, Yeungnam University, KOREA, e-mail:[email protected] 3 PhD, Student, Department of Civil Engineering, Yeungnam University, KOREA, e-mail: [email protected]
strong earthquake regions. It regulates the use of constant values of response modification factor, i.e. R=3 or 5 regardless of ductility demand, and requires providing a large amount of confining steel to bridge columns so that enough ductility can be guaranteed. The column ductility, which is defined as the ability of the columns to sustain large deformation without significant strength degradation at a post-elastic stage, is essential for the earthquake resisting bridges especially in strong earthquake regions. The columns subjected to cyclic loading during earthquake event should have enough deformation capacity without failure up to the target ductility. Therefore the design specifications regulate the constant values of response modification factor and the minimum amount of confining steel for bridge columns. This approach is based on the force-based design concept, which implicitly considers the ductility of the bridge columns. However, adopting the full ductility design concept sometimes results in not economical design and construction problems due to reinforcement congestion, especially in moderate seismicity regions like Korea. In moderate seismicity regions, it frequently happens that the calculated elastic moment is slightly greater than the flexural strength. This means a large amount of confining steel is provided according to the current design specifications based on the force-based full ductility design concept even if the ductility demand is quite low. It sometimes results in construction problems such as steel cage manufacturing and concrete placement due to reinforcement congestion as well as economic problems. Therefore, a design based on required ductility and proving required transverse steel determined by the demand might be a reasonable approach for the moderate earthquake regions. This paper introduces the confining steel design procedure developed for low to moderate seismicity. It is based on the column ductility demand which can be varied and determined by the seismic intensity, earthquake resisting structural system, and flexural design capacity of the columns. It uses newly developed design equations to determine the required confining steel amount, curvature ductility demand, displacement ductility demand, and required response modification factor which is variable and determined by elastic moment demand and capacity of the column. This paper also provides design examples of ten bridge models by the current design specifications and the proposed design method, and discussion on the design results.
RESEARCH ACTINITIES FOR DEVELOPING DUCTILITY DEMAND BASED DESIGN APPROACH
Experimental Tests of Reinforced Concrete Columns The Korean Bridge Design Specifications adopted the AASHTO regulations for seismic design in 1992, since enough researches were not conducted in Korea to develop seismic design specifications. Therefore the minimum required confining steel ratio, either spirals or perfect circular hoops, has been defined as the greater value of Eq. (1) or Eq. (2) [KBDS, 2005; AASHTO, 2002; AASHTO-LRFD, 2004], where fck is concrete compressive strength, fyh is yield strength of transverse steel, and Ag/Ac is ratio of the gross section area to core concrete area. In general, it is normal that Eq. (2) governs in practical design for normal size of column sections.
yh
ck
c
gS f
fAA
⎟⎟⎠
⎞⎜⎜⎝
⎛−= 145.0ρ (1)
yh
ckS f
f12.0=ρ (2)
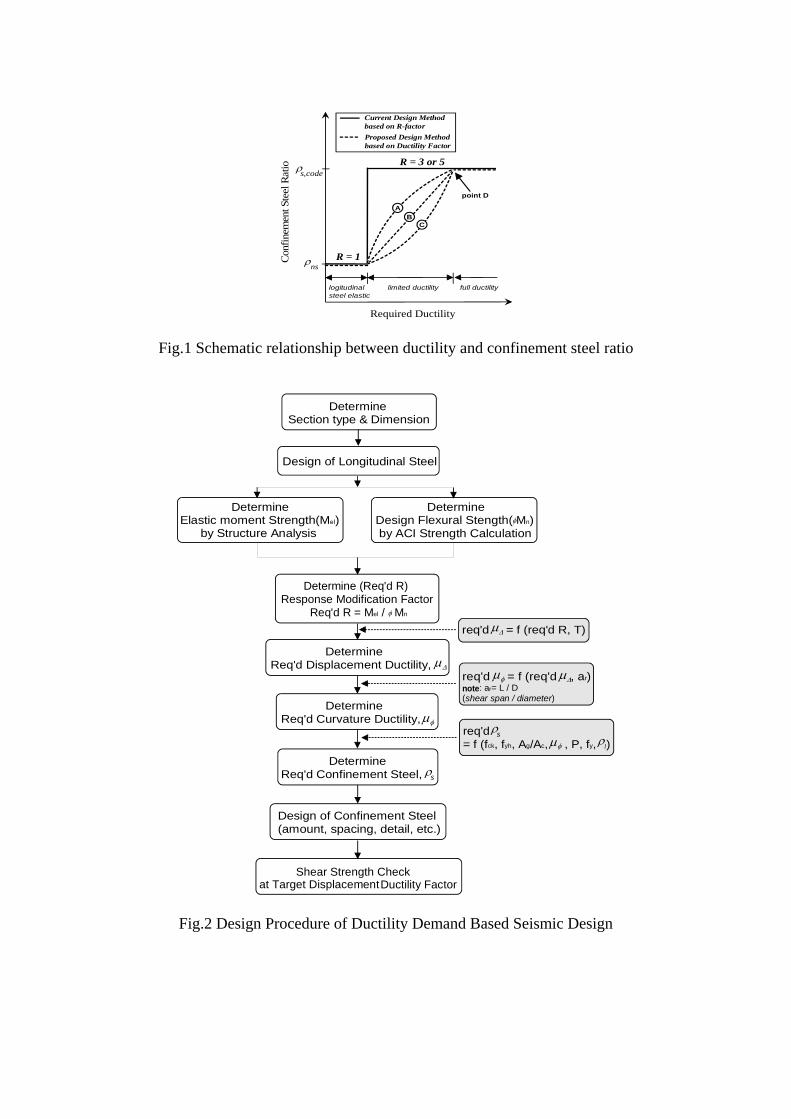
A lot of experimental researches for bridge columns have been conducted from the middle of 1990 in Korea. Those activities have been performed primarily by several organizations such as the Korea Earthquake Engineering Research Center (KEERC), the Highway and Transportation Research Institute of Korea Highway Corporation (HTRI), the Korea Institute of Construction Technology (KICT), the Korea Infrastructure Safety and Technology Corporation (KISTEC), the Korea Bridge Design and Engineering Research Center (KBRC) and several universities. The tests were performed to investigate seismic performance of reinforced concrete columns and to verify seismic design regulations. Majority of tested columns had circular shape and was conducted especially for flexure behavior under compression and for shear behavior. The variables of the tests included aspect ratio, amount and details of longitudinal steel, axial load ratio, amount and spacing of transverse steel, details of circular ties, and material strength of concrete and reinforcement. One of the conclusions of those tests was that higher ductility than expected could be obtained, even though the columns were lightly confined if they had adequate details in transverse steel and continuous longitudinal steel in plastic hinge region. Therefore there were extensive discussions in Korean structural engineer’s society on the minimum requirement of confining steel defined by Eq. (1) and Eq. (2). Based on this behavior and discussions, researches on new design method have been conducted. Concept of New Design Method Based on the conclusion from the experimental tests of the columns with adequate details in transverse steel and continuous longitudinal steel in plastic hinge region, ductility demand base design approach was developed. This approach differs from the current traditional seismic design criteria such as KBDS and/or AASHTO Specifications, and can be seen to produce more systematic and reasonable seismic design methodology. Figure 1 shows relationship between ductility demand and confining steel amount. In the currently used full ductility design method as shown as solid line in Figure 1, a constant large amount of confining steel is used regardless of the ductility demand even though the required ductility factor is slightly greater than 1.0. Then the constant response modification factor, R, of 3.0 or 5.0 is applied to the elastic response. The basic concept can be described as indicated with the dotted line in Figure 1. It is the main idea that R factor should be used as variable and determined as required, which is the constant value by the current design specifications of KBDS and/or AASHTO. The required confining steel amount is determined by the required ductility demand of the columns, which results in a reasonable design and to prevent any possible construction problems due to excessive use of transverse reinforcement. In developing the aforementioned design approach, it is essential to prove which correlation exists between required ductility and confining steel amount among ⓐ, ⓑ and ⓒ in Figure 1. And also, appropriate design equations should be developed to determine the required confining steel amount with respect to ductility demand and relevant detailing regulations should be prepared. Development of Design Equations Column stiffness estimation is required for calculating natural frequency of the bridge system and displacement. In general, the column stiffness at yield of longitudinal steel is determined by use of nonlinear moment-curvature analysis. For design purpose, however, simplified equation may be useful. A simple equation for yield stiffness of reinforced columns was
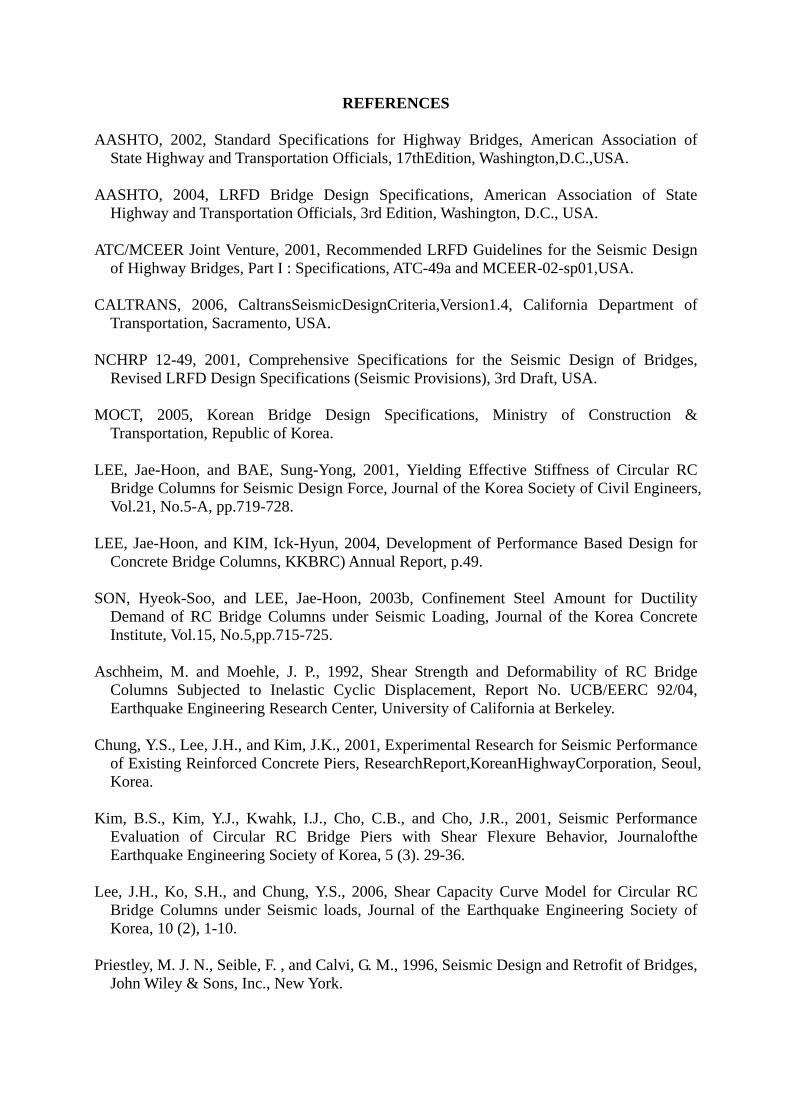
developed [LEE et al, 2001] which is shown in the next chapter. Based on the experimental tests and analytical studies for 5,760 column models, correlation equations of circular columns between curvature ductility and displacement ductility were developed for seismic design purpose as well as for assessment purpose [SON et al, 2003a]. Correlation equations of circular columns between curvature ductility demand and confining steel amount were also developed for seismic design purpose as well as for assessment purpose [SON et al, 2003b]. Framework of New Design Method and Development of Design Procedure Based on the previous experimental and analytical studies, researches on new design method had been conducted. As a result of those activities, ductility demand based seismic design method was proposed by research group on seismic bridge design of the KBRC [LEE et al, 2004]. Table 1 shows comparison of the current design method of the specifications and the proposed ductility demand based seismic design method. Figure 2 shows the procedure of the ductility demand based seismic design for reinforced concrete bridge columns. The detailed procedure is shown in the following chapter.
PROPOSED DESIGN METHOD: Ductility Demand Based Design Approach The practical design procedure of the ductility demand based design approach can be summarized as follows. It shall be conducted after column size and longitudinal steel are determined for vertical loads. STEP-1: Determine elM and nMφ The structural analysis is performed for earthquake load by either dynamic or equivalent static analysis. In general, linear elastic structural analysis is used for design purpose. Therefore, elastic column moment, elM , is calculated by use of yield stiffness of reinforced columns which can be obtained by moment-curvature analysis or a simplified equation such as Eq. (3) [LEE et al, 2001]. The design flexural strength of column, nMφ , is determined from section analysis by any design codes.
ggc
leff IAf
PI⎟⎟⎠
⎞⎜⎜⎝
⎛++=
'3.01216.0 ρ (3)
STEP-2: Determine Rdreq' The required response modification factor, Rdreq' , is determined by the ratio of elastic column moment to the design flexural strength of the column as shown in Eq. (4).
n
el
MMRdreqφ
=' (4)
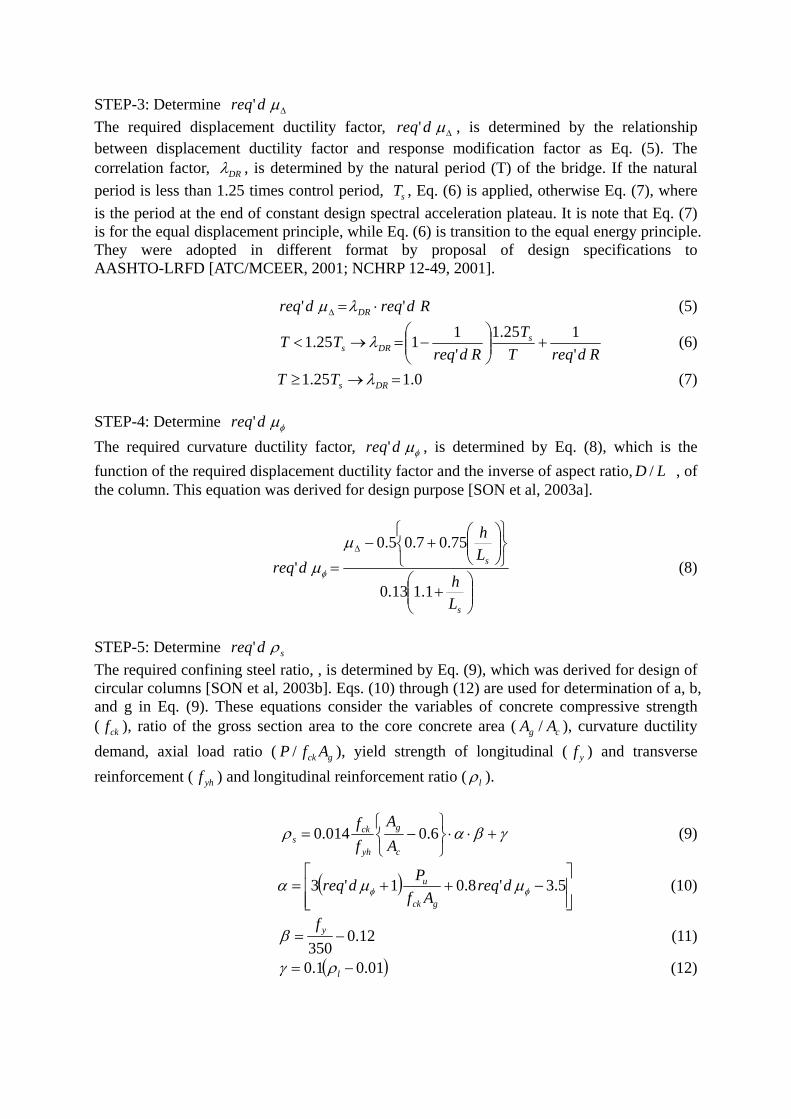
STEP-3: Determine Δμdreq' The required displacement ductility factor, Δμdreq' , is determined by the relationship between displacement ductility factor and response modification factor as Eq. (5). The correlation factor, DRλ , is determined by the natural period (T) of the bridge. If the natural period is less than 1.25 times control period, sT , Eq. (6) is applied, otherwise Eq. (7), where is the period at the end of constant design spectral acceleration plateau. It is note that Eq. (7) is for the equal displacement principle, while Eq. (6) is transition to the equal energy principle. They were adopted in different format by proposal of design specifications to AASHTO-LRFD [ATC/MCEER, 2001; NCHRP 12-49, 2001].
Rdreqdreq DR '' ⋅=Δ λμ (5)
RdreqTT
RdreqTT s
DRs '125.1
'1125.1 +⎟⎟
⎠
⎞⎜⎜⎝
⎛−=→< λ (6)
0.125.1 =→≥ DRsTT λ (7) STEP-4: Determine φμdreq' The required curvature ductility factor, φμdreq' , is determined by Eq. (8), which is the function of the required displacement ductility factor and the inverse of aspect ratio, LD / , of the column. This equation was derived for design purpose [SON et al, 2003a].
⎟⎟⎠
⎞⎜⎜⎝
⎛+
⎭⎬⎫
⎩⎨⎧
⎟⎟⎠
⎞⎜⎜⎝
⎛+−
=Δ
s
s
Lh
Lh
dreq1.113.0
75.07.05.0'
μμφ (8)
STEP-5: Determine sdreq ρ' The required confining steel ratio, , is determined by Eq. (9), which was derived for design of circular columns [SON et al, 2003b]. Eqs. (10) through (12) are used for determination of a, b, and g in Eq. (9). These equations consider the variables of concrete compressive strength ( ckf ), ratio of the gross section area to the core concrete area ( cg AA / ), curvature ductility demand, axial load ratio ( gck AfP / ), yield strength of longitudinal ( yf ) and transverse reinforcement ( yhf ) and longitudinal reinforcement ratio ( lρ ).
γβαρ +⋅⋅⎭⎬⎫
⎩⎨⎧
−= 6.0014.0c
g
yh
cks A
Aff
(9)
( )⎥⎥⎦
⎤
⎢⎢⎣
⎡−++= 5.3'8.01'3 φφ μμα dreq
AfPdreq
gck
u (10)
12.0350
−= yfβ (11)
( )01.01.0 −= lργ (12)
STEP-6: Design of confining steel (details: size and spacing) Longitudinal steel in the potential plastic hinge region of the column shall be restrained by transverse steel to prevent from buckling. Therefore, the spacing of the transverse steel in the potential plastic hinge region of the column, s shall not less than Eq. (13).
ss
sp
dA
sρ
4= (13)
STEP-7: Shear strength check (at target displacement ductility factor) Reinforced concrete columns with relatively small aspect ratio show flexure-shear behavior, which is flexural behavior at initial and medium displacement stages and shear failure at final stage. This type of columns has lower ductility than those with flexural failure. For prevented brittle failure, shear strength check is needed at the Δμdreq' by use of shear model and max. plastic hinging force as shown figure 3. Lee at al. (2006) proposed shear capacity model as shown in Eq. (31) through (35) in SI units. For the shear strength of reinforcement, 40° angle is adopted as shown in Eq. (34). For ultimate displacement prediction, Lee et al.’s model provides closer results to the test than the other models. COMPARISON OF DESIGN RESULTS: Proposed Method and Current Method for Flexure
Selected Bridge Models for Comparison Typical bridge models were selected and designed for longitudinal direction of the bridge to compare efficiency and safety of the currently used design method and the proposed method. The main variable of the models is the self-weight of superstructure increasing from 50kN/m to 500kN/m with the interval of 50kN/m to make 10bridge models. The rest of the variables are identical as follow: (1) Super structure : 4 span continuous beam
(2) Boundary conditions : 1 hinge and 4 roller supports
(3) Span length and total length : 4 x 50 m = 200 m
(4) Pier system : T-shaped single column bent
(5) Column shape and section size : Circular section with diameter (D) of 2400 mm
(6) Column height (L) and aspect ratio (L/D) : L = 8,000 mm, L/D = 4.0
(7) Concrete compressive strength : 27 MPa
(8) Yield strength of longitudinal and transverse reinforcement : 400 MPa
(9) Longitudinal reinforcement and steel ratio ( lρ ) : 72-D35, lρ = 0.0152
(10) Design peak ground acceleration : 0.154 g [KBDS, 2005]
(11) Applied acceleration response spectra : Korean Bridge Design Specifications [KBDS, 2005]
Results of Column Design Table 2 summarizes the results of column design for ten bridge models by the ductility demand based seismic design method. It is note that axial load ratio, effective yield stiffness, period of vibration, and elastic moment demand, elM , increase as the superstructure self-weight increases. The design flexural strength of column also increases as the superstructure self-weight increases, even though the column section of each bridge model is identical. It is because the flexural strength of reinforced concrete column under tension controls region increases as the axial load increases. It is note that the flexural demand increases more rapidly than the flexural capacity. Therefore, required response modification factor and the ductility demand increases as the superstructure self-weight increases, and does the required confining steel ratio. The final design for confining steel with D19 or D22 reinforcement is designated in the second last row of Table 2. The confining steel designed by the current design method [KBDS, 2005; AASHTO, 2002; AASHTO-LRFD, 2004] is also designated in the last row of Table 2, which is D22 steel with 84 mm spacing. It is note that Bridge Models 7 through 10 can not be designed by the current design specifications with the chosen size column since the R-factor of 3.0 is permitted for single column bent [KBDS, AASHTO]. Therefore, design modification for column section cannot be avoided in case that the self-weight of superstructure is greater than 330 kN/m. Efficiency of Transverse Steel Figure 4 shows the displacement ductility demand which can be converted to the required R-factor for 10 bridge models. The ductility demand increases up to 3.67 as the self-weight of superstructure increases from 50 kN/m to 500 kN/m. It shows non-linearly increasing as increasing the self-weight of superstructure, since the demand increases non-linearly and the capacity is not constant. It is note that the currently used force-based design method permits to apply 3.0 of the R-factor to single column bent [KBDS, AASHTO]. Therefore, the bridge models of which superstructure self-weight are greater than 330 kN/m can not be designed with the selected column best system by the current design specifications. However, those bridge models can be designed by the proposed design method, since 3.67 of ductility demand seems to be practically acceptable if corresponding confining steel does not result in any construction problems. It may be regulated that the maximum permissible R-factor shall be 4.0 or 5.0. Figure 5 shows material cost (volume) ratio of transverse steel designed by the proposed method to that designed by the current design method. The proposed method requires 30∼ 84% of transverse steel determined by the current design method for the bridge models that can be designed by the current specifications. For the bridge models that can not be designed by the current specifications up to 500 kN/m of superstructure self-weight, 98∼ 144% of transverse steel determined by Eq.(2) are required by the proposed method. Safety and Consistency Displacement demand and displacement capacity of each bridge model were calculated and compared in order to investigate safety and consistency of the design methods. The displacement demands, drequ ',Δ , of 10 bridge models were obtained by linear elastic structural analysis with effective yield stiffness of the columns for design earthquake load. Nonlinear push-over analyses by moment-curvature analysis were performed to obtain two different values of displacement capacity of each bridge model: propcap,Δ , of the column designed by the proposed method; and codecap,Δ , of the column designed by the current design
specifications. Figure 6 presents the results. As shown in the figure, the displacement demand, drequ ',Δ , increases as the self-weight of superstructure increases from 50 kN/m to 500 kN/m. It is note that both displacement capacities, propcap,Δ and codecap,Δ , are greater than the displacement demand, drequ ',Δ , resulting in satisfactorily safe design. However tendencies of safety margin are basically different. The displacement capacities, propcap,Δ , of the columns designed by the proposed method also increase as the self-weight of superstructure increases, except bridge model 1 (superstructure self-weight is 50 kN/m) of which longitudinal steel of column is in elastic range under design earthquake load. That is the same tendency as the displacement demand which also increases as the self-weight of superstructure increases. The displacement capacities, codecap,Δ , of the columns designed by the current design method, however, decrease as the self-weight of superstructure increases except bridge model 1, which is the opposite tendency to increasing the displacement demand. It is because that increasing axial load results in reduced displacement capacity even though the columns of bridge models have the identical section. Therefore, it can be anticipated that the current design specifications provide irrational design result, due to adopting full ductility design method with constant R-factor. And also, rapidly decreasing safety margin as increasing superstructure self weight may be expected. Figure 7 shows the ratio of displacement capacity to displacement demand which may represents margin of safety. The displacement safety factors of the columns designed by the current design specifications vary from 1.21 to 4.14 except the column under elastic design (superstructure self-weight is 50 kN/m). Those by the proposed method show range of 1.38 and 2.89, which may be evaluated as more consistent and rational.
DISPLACEMENT BASED FLEXURE-SHEAR CAPACITY MODELS Caltrans CALTRANS Seismic Design Criteria (2006) defines shear capacity model as Eq. (14) through (21) in SI units. The nominal shear strength is calculated as summation of contributions of concrete, cV , and transverse reinforcement, sV . CALTRANS defines shear strength of concrete, cV differently by classifying inside the plastic hinge region and the rest. In cV determination for the plastic hinge region, displacement ductility factor dμ is used as a main variable. The volumetric ratio of transverse steel, yield strength of transverse steel, and axial load effect are also considered in cV . The shear effective area, eA in Eq. (15), is taken as 0.8 times gross sectional area for circular sections. The shear strength of transverse steel, sV , is calculated by Eq. (21) for circular sections based on 45° angle truss model, where spA is the area of hoop or spiral and spD is the diameter of core concrete measured between center to center of hoop or spiral.
scn VVV += (14)
ecc AvV = (15)
'' 33.021 ccc ffFactorFactorv ≤××= (16)
dyhs f
Factor μρ
083.0305.05.12
1 −+= (17)
25.01025.0 ≤≤ Factor (18)
gAPFactor8.13
12 += (19)
5.120.1 ≤≤ Factor (20)
sDfA
V spyhsps 2
π= (21)
Aschheim and Moehle Aschheim and Moehle (1992) proposed Eq. (22) through (25) in SI units to compute the nominal shear strength of reinforced concrete columns. Considering displacement ductility and the effect of compression, cV is calculated by Eq. (23) and (24) for plastic hinge region. The effective shear area, eA in Eq. (23), is 0.8 times gross section area (0.8 gA ) for circular sections. The shear strength of reinforcement, sV , is calculated by Eq. (25) based on 30° angle truss model, and 0.8D is used for d in circular columns, where D is the diameter of the sections.
scn VVV += (22)
ecg
c AfA
PkV '
143.0 ⎟
⎟⎠
⎞⎜⎜⎝
⎛+= (23)
13
40 ≤−
=≤ Δμk (24)
°= 30cot2 s
DfAV spyhsp
sπ
(25)
Priestley et al. Priestley et al. (1996) proposed Eq. (26) through (30) in SI units to calculate nominal shear strength of reinforced concrete columns for design purpose. Considering the effect of displacement ductility, cV is calculated by Eq. (27) and (28) for plastic hinge region. The shear strength of reinforcement, sV , is calculated by Eq. (29) based on 35° angle truss model for circular columns. The effect of shear strength enhancement resulting from arch action in axial compression is considered by Eq. (30). For the columns bent in single curvature, the strut forms between the center of the section at the top where the axial load is applied and the center of flexural compression at the bottom. Therefore αtan becomes LDc 2/ , where
2/cD is the horizontal distance between center of the section and center of flexural compression, and L is the cantilever column length. In the case of circular sections, 0.65D is recommended for cD . The coefficient 0.85 in Eq. (30) is used for seismic design, but 1.0 is suggested for seismic performance evaluation.
pscn VVVV ++= (26)
ecc AfkV '= (27)
( )
( )⎥⎥⎥⎥⎥⎥
⎦
⎤
⎢⎢⎢⎢⎢⎢
⎣
⎡
=≤−−=≤≤
==−−=≤≤
=≤
Δ
ΔΔ
Δ
ΔΔ
Δ
042.0:8401025.0083.0:84
083.0:420835.025.0:42
25.0:2
kkkkk
μμμ
μμμ
μ
(28)
°= 35cot2 s
DfAV spyhsp
sπ
(29)
LDPPV c
p 285.0tan85.0 == α (30)
Lee et al. Lee at al. (2006) proposed shear capacity model as shown in Eq. (31) through (35) in SI units, which is basically the same format as Priestley et al.’ s model but modified. For the shear strength of concrete, k in Eq.(32) is modified to Eq. (33) to produce three straight lines divided by the displacement ductility of 2 and 5, while Priestley et al.’ s model has four straight lines divided by the displacement ductility of 2, 4, and 8. For the shear strength of reinforcement, 40° angle is adopted as shown in Eq. (34). The axial load effect on shear strength is considered as the same format as Priestley et al.’ s model, but 2/3 times D is recommended for cD as shown in Eq. (35) for circular sections.
pscn VVVV ++= (31)
ecc AfkV '= (32)
( )⎥⎥⎥⎥
⎦
⎤
⎢⎢⎢⎢
⎣
⎡
=≤
−−=≤≤
=≤
Δ
ΔΔ
Δ
0:5
21013.0:52
3.0:2
k
k
k
μ
μμ
μ
(33)
°= 40cot2 s
DfAV spyhsp
sπ (34)
LDP
LDPPV c
p 385.0
285.0tan85.0 === α (35)
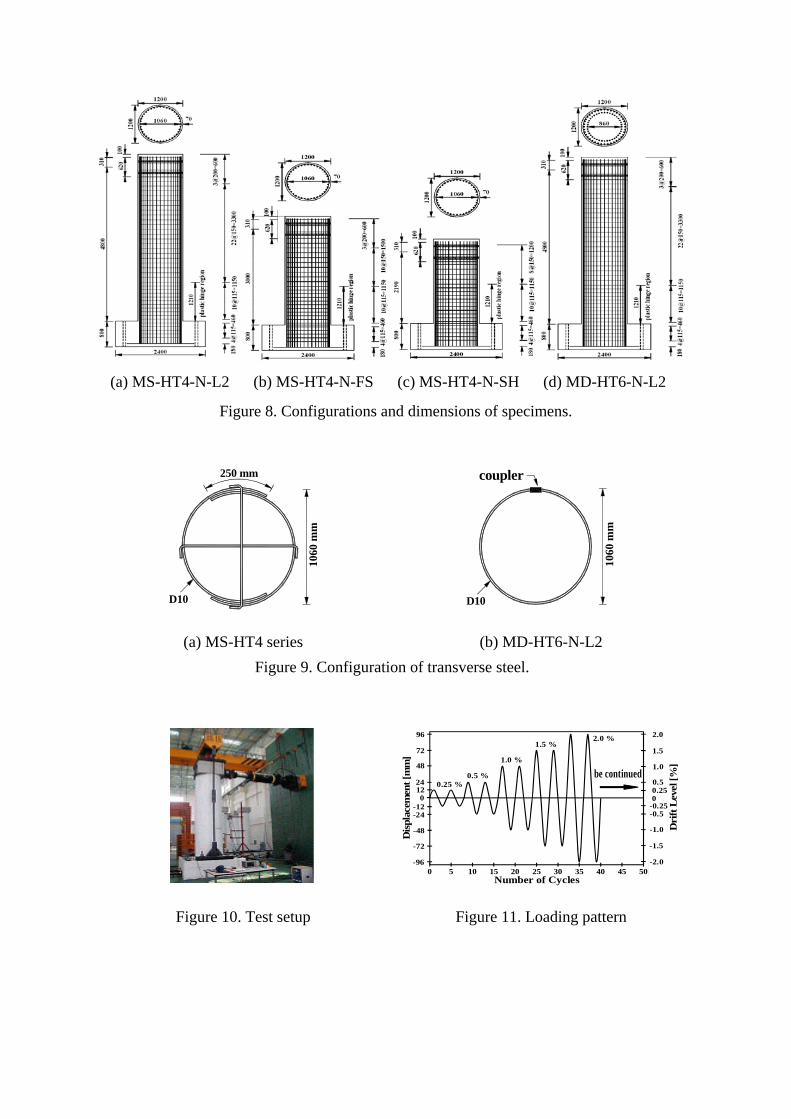
EXPERIMENT Specimens and Test Four large size circular reinforced concrete columns were constructed. All the columns have 1200 mm diameter cross-section and main variables are longitudinal steel ratio and aspect ratio (span-depth ratio). Total height of MS-HT4-N-L2 and MD-HT6-N-L2 specimen is 5920 mm and loading height is 4800 mm, so that the aspect ratio should be 4.0. Total height of MS-HT4-N-FS specimen is 4120 mm and loading height is 3000 mm, so that the aspect ratio should be 2.5. Total height of MS-HT4-N-SH specimen is 3310 mm and loading height is 2190 mm, so that the aspect ratio should be 1.825. D19 (diameter of 19 mm) and D10 bars were used as longitudinal reinforcement and transverse reinforcement, respectively, for all the column specimens. Details and variables of the column specimens are shown in Figure 8 and Table 3. For the longitudinal reinforcement, 40-D19 and 80-D19 were used for MS-HT4-N series columns and MS-HT6-N-L2 column specimen, respectively, so that the steel ratio should be 0.0102 and 0.0203, respectively. D10 circular ties were provided as transverse reinforcement. In addition to the circular ties, crossties were used for MS-HT4 series columns as shown in Figure 9. Perfect hoops by use of couplers were used for MD-HT6-N-L2 column. Space of transverse steel in plastic hinge region was 115 mm for all the specimens, which resulted in volumetric ratio of 0.0023. It corresponds to 24% of the required confining steel ratio defined by AASHTO Specifications (2002) and Korean Bridge Design Specifications (2005). Space of 115 mm in plastic hinge is equivalent to 6 times the longitudinal bar diameter and 12 times the transverse bar diameter. Material test was carried out to determine the actual mechanical properties of concrete and steel. The concrete compressive strength by 100 X 200 mm cylinder was 24.8 MPa at the time of loading test. Yield strength of the reinforcement was measured to be 343 MPa for D19 reinforcement and 373 MPa for D10 reinforcement. As shown in Figure 10, quasi-static test was conducted under constant axial load and incrementally increasing lateral deformation reversals using Hydraulic actuator with ±500 mm displacement capacity and 3500 kN force capacity. Axial load of 1863 kN was applied so that the axial load ratio should be 0.07. Two cycles of lateral load were applied at each drift level as shown in Figure 11. Test Results MS-HT4-N-L2 specimen (aspect ratio = 4.0) showed typical flexure failure in plastic hinge region, while the other three columns showed flexure-shear failure. Figure 12 presents failure of MS-HT4-N-SH specimen (aspect ratio = 1.825), which shows diagonal cracks due to flexure and shear action. Figure 13 shows failure of MD-HT6-N-L2 specimen. It shows flexure-shear failure even though its aspect ratio is 4.0. It is believed that relatively small amount of transverse steel compared with longitudinal steel resulted in diagonal cracks and shear related failure after plastic hinge formed by flexure at the bottom of column. Failure mode was eventually flexure-shear failure by fracture of transverse steel and shear cracks. It should be note that MD-HT6-N-L2 specimen has twice the longitudinal steel ratio compared with MS-HT4-N-L2 specimen. During the load test, lateral load and lateral displacement were measured up to failure. Envelop curves of the column specimens were obtained from the measured cyclic relationships, which will be compared with the displacement based flexure-shear capacity models. More information about the test can be found elsewhere (Chung et al. 2001).
COMPARISION OF MODELS WITH RESULTS Selected Experimental Results In order to compare the ductility based flexure-shear models, two sets of experimental results were selected: (1) four large scale columns tested by the authors which are previously introduced in this paper, and (2) two large scale column test conducted by Kim et al. (2001). Kim et al. (2001) conducted quasi-static test for two large scale circular columns, of which diameter was 1200 mm. FS-H-LS000 specimen had 4950 mm of total height and 3200 mm of loading height so that the aspect ratio should be 2.67. The other specimen FS-L-LS000 had 4450 mm of total height and 2700 mm of loading height so that the aspect ratio should be 2.25. The other variables of the two column specimens are identical. Thirty six D25 (diameter of 25.4 mm) reinforcing bars were used for longitudinal steel, which resulted in 0.0161 of longitudinal steel ratio. Circular hoops with 300 mm spacing were used for plastic hinge region so that the volumetric lateral steel ratio should be 0.00169. The space of 300 mm is equivalent to 11.8 times the longitudinal diameter and 23.6 times the transverse steel diameter. The yield stress of D25 and D13 reinforcement were 331 MPa and 326 MPa, respectively. The compressive strength of concrete was measured to be 24.5 MPa at the age of test. More information about the test columns can be found in their paper (Kim et al. 2001). Application of Equations for Cross-tie Three column specimens (MS-HT4 series) tested by the authors have two cross-ties perpendicular to each other. Shear force is resisted by one cross-tie parallel to the lateral loading direction as well as the hoop reinforcement. Shear strength of cross-tie is calculated by Eq. (36), where sctA is area of cross-tie in a parallel direction to the applied lateral load and spD is distance between centers of the perimeter hoop.
θcots
DfAV spyhsct
sct = (36)
For MS-HT4 series columns, shear strength of transverse steel, sV , is calculated by summation of shear strength produced by hoop reinforcement and cross-tie. When each model is applied, the same value of angle such as 45° (CALTRANS), 40° (Lee et al.), 35° (Priestley et al.) or 30° (Aschheim et al.) is used for θ in Eq. (36). Failure Mode Prediction Figure 14 shows displacement based shear capacity models applied to the envelope curves of test results. The envelope curves are obtained from the measured lateral load-displacement relationship under cyclic loading. Two envelope curves for each column specimen are provided from the test results for push direction and pull direction. The displacement at intersection of the envelope curve and the shear capacity models presents predicted displacement capacity of the column under flexure-shear failure. For MS-HT4-N-SH specimen which showed flexure-shear failure during the test, CALTRANS model, Aschheim et al.’s model and Lee et al.’s model predict failure mode of
flexure-shear failure, but Priestley et al.’s model predicts flexure failure, as shown in Figure 14(a). For MS-HT4-N-FS specimen which also showed flexure-shear failure during the test, CALTRANS model and Lee et al.’s model predict the same failure mode, but Aschheim et al.’s model and Priestley et al.’s model predict flexure failure, as shown in Figure 14(b). In the case of MS-HT4-N-L2 specimen, all the models predict the same failure mode as the test result of flexure failure, as shown in Figure 14(c). For MD-HT6-N-L2, FS-H-S000, and FS-L-S000 specimens which showed flexure-shear failure during the test, all the models predict flexure -shear failure, as shown in Figure 14(d), (e), and (f). Table 4 presents predicted failure mode by each model. CALTRANS and Lee et al.’s model predict the same failure modes as test result for all the specimens. Accuracy of Displacement Capacity Prediction Table 5 shows the measured ultimate displacement and the predicted ultimate displacement by the models for 5 specimens under flexure-shear failure. The ratio of predicted ultimate displacement to test result is also presented in Table 5. It is note that Aschheim et al.’s model predicts flexure failure for MS-HT4-N-FS specimen and Priestley et al.’s model predict flexure failure for MS-HT4-N-FS and MS-HT4-N-SH specimen. For five large size columns, the ratio of predicted ultimate displacement by CALTRANS model to test result are between 0.42 and 0.63, while those by Lee et al’ s model are between 0.54 and 0.98. Aschheim et al.’s model provides the ratio between 0.48 and 0.75 for four column specimens. By Priestley et al.’s model, three specimens show the ratio between 0.86 and 0.93.
CONCLUTIONS A new seismic design approach, the ductility demand based design method, provides economical reinforced concrete bridge column design compared to the current design method of the KBDS and AASHTO specifications. It also gives safe and more consistent design result providing relatively narrow range of safety margin. It is believed that the proposed method is rational in concept especially for the low to moderate earthquake regions.
ACKNOWLEDGEMENTS Support for this work was provided by the Korea Bridge Design & Engineering Research Center(KBRC). This financial support is gratefully acknowledged.
REFERENCES AASHTO, 2002, Standard Specifications for Highway Bridges, American Association of
State Highway and Transportation Officials, 17thEdition, Washington,D.C.,USA. AASHTO, 2004, LRFD Bridge Design Specifications, American Association of State
Highway and Transportation Officials, 3rd Edition, Washington, D.C., USA. ATC/MCEER Joint Venture, 2001, Recommended LRFD Guidelines for the Seismic Design
of Highway Bridges, Part I : Specifications, ATC-49a and MCEER-02-sp01,USA. CALTRANS, 2006, CaltransSeismicDesignCriteria,Version1.4, California Department of
Transportation, Sacramento, USA. NCHRP 12-49, 2001, Comprehensive Specifications for the Seismic Design of Bridges,
Revised LRFD Design Specifications (Seismic Provisions), 3rd Draft, USA. MOCT, 2005, Korean Bridge Design Specifications, Ministry of Construction &
Transportation, Republic of Korea. LEE, Jae-Hoon, and BAE, Sung-Yong, 2001, Yielding Effective Stiffness of Circular RC
Bridge Columns for Seismic Design Force, Journal of the Korea Society of Civil Engineers, Vol.21, No.5-A, pp.719-728.
LEE, Jae-Hoon, and KIM, Ick-Hyun, 2004, Development of Performance Based Design for
Concrete Bridge Columns, KKBRC) Annual Report, p.49. SON, Hyeok-Soo, and LEE, Jae-Hoon, 2003b, Confinement Steel Amount for Ductility
Demand of RC Bridge Columns under Seismic Loading, Journal of the Korea Concrete Institute, Vol.15, No.5,pp.715-725.
Aschheim, M. and Moehle, J. P., 1992, Shear Strength and Deformability of RC Bridge
Columns Subjected to Inelastic Cyclic Displacement, Report No. UCB/EERC 92/04, Earthquake Engineering Research Center, University of California at Berkeley.
Chung, Y.S., Lee, J.H., and Kim, J.K., 2001, Experimental Research for Seismic Performance
of Existing Reinforced Concrete Piers, ResearchReport,KoreanHighwayCorporation, Seoul, Korea.
Kim, B.S., Kim, Y.J., Kwahk, I.J., Cho, C.B., and Cho, J.R., 2001, Seismic Performance
Evaluation of Circular RC Bridge Piers with Shear Flexure Behavior, Journalofthe Earthquake Engineering Society of Korea, 5 (3). 29-36.
Lee, J.H., Ko, S.H., and Chung, Y.S., 2006, Shear Capacity Curve Model for Circular RC
Bridge Columns under Seismic loads, Journal of the Earthquake Engineering Society of Korea, 10 (2), 1-10.
Priestley, M. J. N., Seible, F. , and Calvi, G. M., 1996, Seismic Design and Retrofit of Bridges,
John Wiley & Sons, Inc., New York.
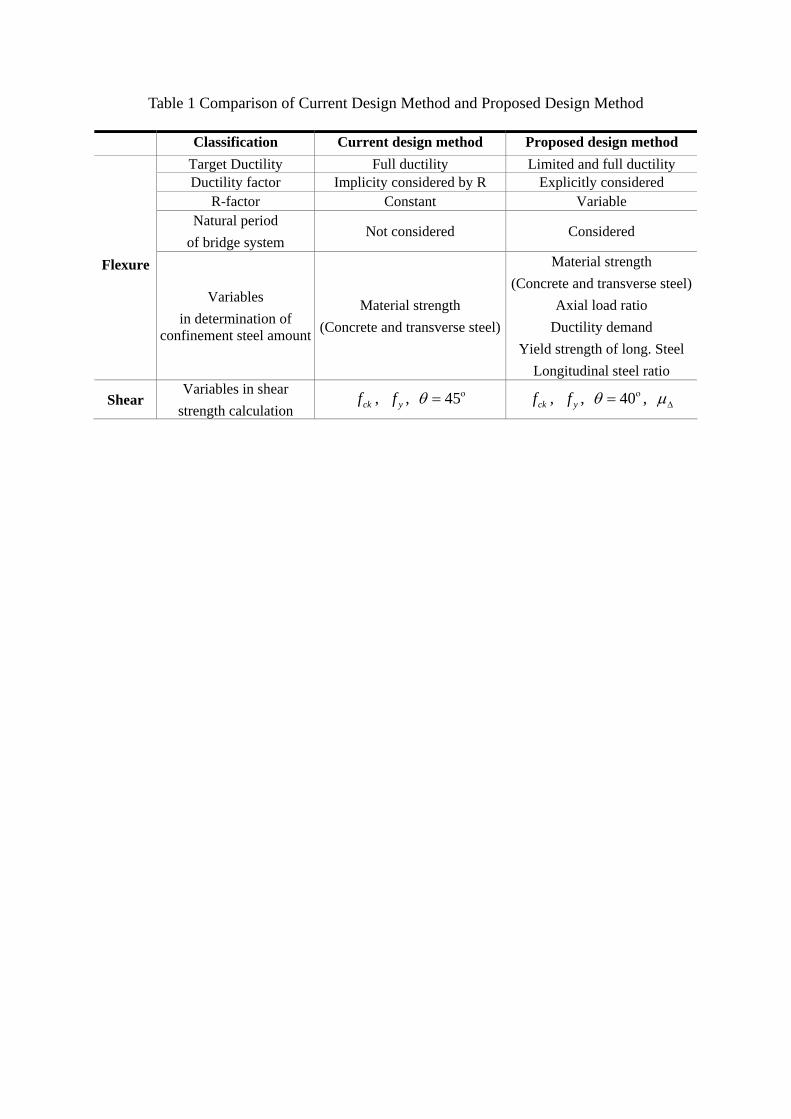
Table 1 Comparison of Current Design Method and Proposed Design Method Classification Current design method Proposed design method
Target Ductility Full ductility Limited and full ductility Ductility factor Implicity considered by R Explicitly considered
R-factor Constant Variable Natural period
of bridge system Not considered Considered
Flexure
Variables in determination of
confinement steel amount
Material strength (Concrete and transverse steel)
Material strength (Concrete and transverse steel)
Axial load ratio Ductility demand
Yield strength of long. Steel Longitudinal steel ratio
Shear Variables in shear
strength calculation ckf , yf , ο45=θ ckf , yf , ο40=θ , Δμ
Table 2 Results of Column Design for Ten Bridge Models
Bridge
Model
Bridge
Model
Bridge
Model
Bridge
Model
Bridge
Model
Bridge
Model
Bridge
Model
Bridge
Model
Bridge
Model
Bridge
ModelClassification
1 2 3 4 5 6 7 8 9 10
Superstructure
Self-Weight [kN/m] 50 100 150 200 250 300 350 400 450 500
Axial Load Ratio
( gck AfP / ) 0.019 0.038 0.057 0.076 0.095 0.114 0.133 0.152 0.171 0.190
Effective Yiedl
Stiffness( effI ) 0.38 gI 0.40 gI 0.41 gI 0.43 gI 0.43 gI 0.44 gI 0.45 gI 0.46 gI 0.47 gI 0.47 gI
Period of Vibration
T [sec] 0.88 1.21 1.46 1.67 1.84 2.00 2.14 2.27 2.39 2.50
Elastic Response
Coefficient sC [g] 0.235 0.190 0.168 0.153 0.144 0.136 0.130 0.125 0.121 0.117
elM [kN-m] 22600 35600 48400 58800 69100 78200 87400 96000 104500 112300
nMφ [kN-m] 23200 24200 25100 25900 26500 27500 28400 29200 30000 30600
Rdreqdreq '' =Δμ 0.97
(elastic) 1.51 1.93 2.27 2.60 2.85 3.07 3.28 3.49 3.67
φμdreq' 3.0 6.1 8.5 10.4 12.3 13.7 15.0 16.2 17.4 18.4
)10(' 3−×sdreq ρ 0.08 1.61 2.97 4.24 5.58 6.78 7.95 9.15 10.44 11.66
Trial with
D22
853
bld6φ
423
bld6φ
229
bld6φ160 122 100 85 74 65 58
Final with
D19 or
D22
210
(D19)
210
(D19)
170
(D19)
160
(D22)
122
(D22)
100
(D22)
85
(D22)
74
(D22)
65
(D22)
58
(D22)
Transverse
Steel
Spacing
[mm] Current
Design
by KBDS
300
(D16)
84
(D22)
Not Permitted
by Current Specification
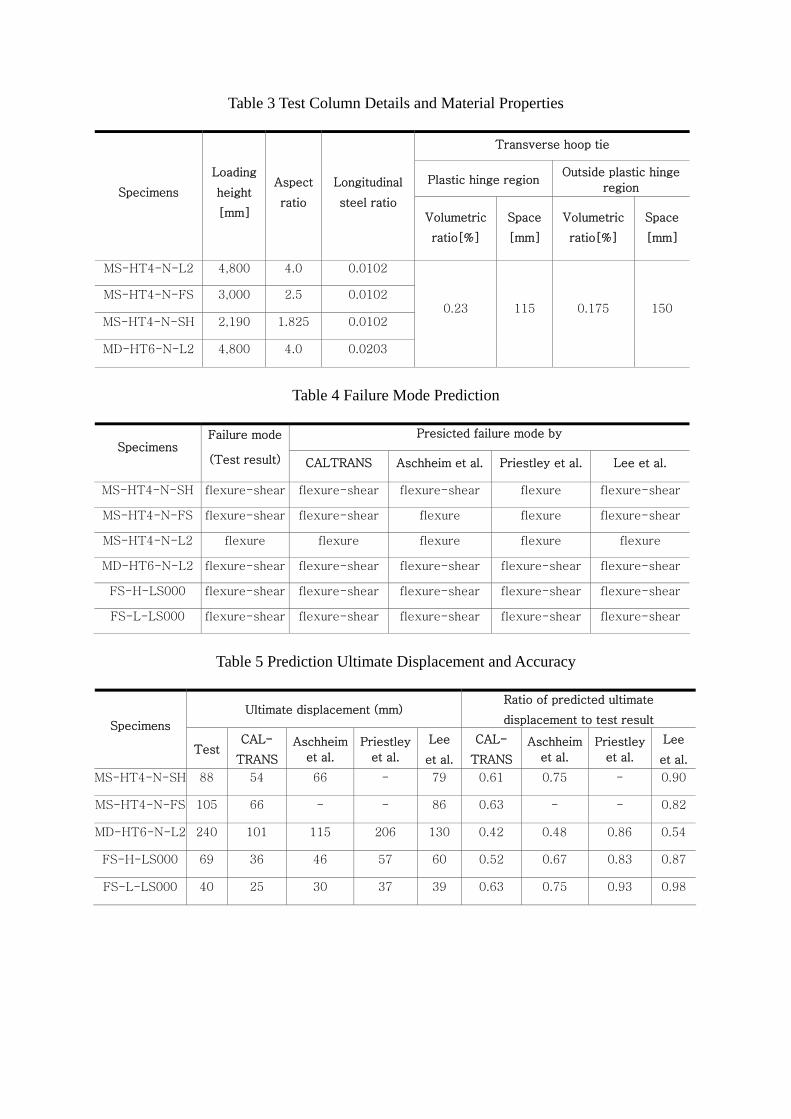
Table 3 Test Column Details and Material Properties
Transverse hoop tie
Plastic hinge region Outside plastic hinge
region Specimens
Loading
height
[mm]
Aspect
ratio
Longitudinal
steel ratio Volumetric
ratio[%]
Space
[mm]
Volumetric
ratio[%]
Space
[mm]
MS-HT4-N-L2 4,800 4.0 0.0102
MS-HT4-N-FS 3,000 2.5 0.0102
MS-HT4-N-SH 2,190 1.825 0.0102
MD-HT6-N-L2 4,800 4.0 0.0203
0.23 115 0.175 150
Table 4 Failure Mode Prediction
Presicted failure mode by
Specimens Failure mode
(Test result) CALTRANS Aschheim et al. Priestley et al. Lee et al.
MS-HT4-N-SH flexure-shear flexure-shear flexure-shear flexure flexure-shear
MS-HT4-N-FS flexure-shear flexure-shear flexure flexure flexure-shear
MS-HT4-N-L2 flexure flexure flexure flexure flexure
MD-HT6-N-L2 flexure-shear flexure-shear flexure-shear flexure-shear flexure-shear
FS-H-LS000 flexure-shear flexure-shear flexure-shear flexure-shear flexure-shear
FS-L-LS000 flexure-shear flexure-shear flexure-shear flexure-shear flexure-shear
Table 5 Prediction Ultimate Displacement and Accuracy
Ultimate displacement (mm) Ratio of predicted ultimate
displacement to test result Specimens
Test CAL-
TRANS
Aschheim
et al.
Priestley
et al.
Lee
et al.
CAL-
TRANS
Aschheim
et al.
Priestley
et al.
Lee
et al.
MS-HT4-N-SH 88 54 66 - 79 0.61 0.75 - 0.90
MS-HT4-N-FS 105 66 - - 86 0.63 - - 0.82
MD-HT6-N-L2 240 101 115 206 130 0.42 0.48 0.86 0.54
FS-H-LS000 69 36 46 57 60 0.52 0.67 0.83 0.87
FS-L-LS000 40 25 30 37 39 0.63 0.75 0.93 0.98
Con
finem
ent S
teel
Rat
io
ρ
ρs,code
nsR = 1
R = 3 or 5
Required Ductility
Current Design Methodbased on R-factorProposed Design Methodbased on Ductility Factor
full ductilitylimited ductility
AB
C
point D
logitudinalsteel elastic
Fig.1 Schematic relationship between ductility and confinement steel ratio
Design of Longitudinal Steel
μΔ
φ
ρ
μ
s
DetermineReq'd Confinement Steel,
DetermineReq'd Curvature Ductility,
DetermineReq'd Displacement Ductility,
Design of Confinement Steel(amount, spacing, detail, etc.)
DetermineSection type & Dimension
Determine Elastic moment Strength(Mel) by Structure Analysis
φ
Determine Design Flexural Stength( Mn) by ACI Strength Calculation
φ
req'd = f (req'd R, T)μΔ
φμ μΔreq'd = f (req'd , ar)note: ar= L / D(shear span / diameter)
Shear Strength Checkat Target Displacement Ductility Factor
ρs ρl
req'd = f (fck, fyh, Ag/Ac, , P, fy, )μφ
Determine (Req'd R)Response Modification Factor Req'd R = Mel / Mn
Fig.2 Design Procedure of Ductility Demand Based Seismic Design
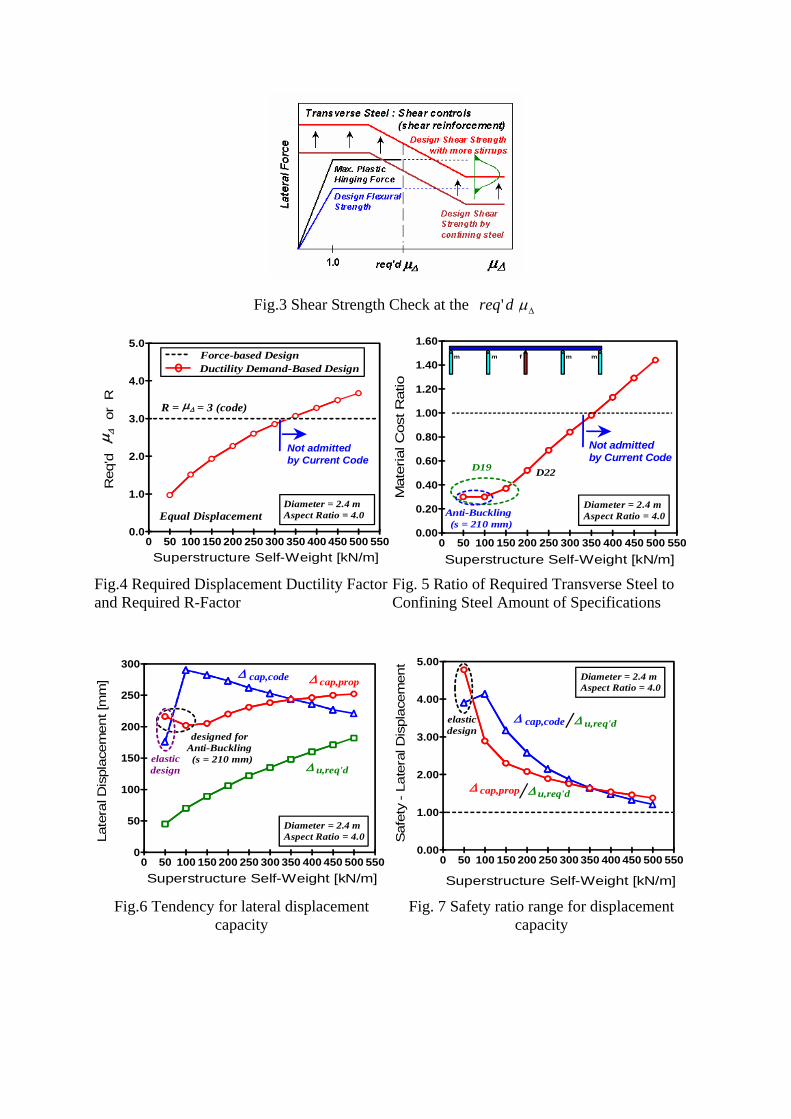
Fig.3 Shear Strength Check at the Δμdreq'
0.0
1.0
2.0
3.0
4.0
5.0
0 50 100 150 200 250 300 350 400 450 500 550
Equal Displacement
μΔR = = 3 (code)
μ ΔR
eq'd
or
R
Diameter = 2.4 mAspect Ratio = 4.0
Superstructure Self-Weight [kN/m]
Not admittedby Current Code
Force-based DesignDuctility Demand-Based Design
0.00
0.20
0.40
0.60
0.80
1.00
1.20
1.40
1.60
0 50 100 150 200 250 300 350 400 450 500 550
Mat
eria
l Cos
t Rat
io
Not admittedby Current Code
Diameter = 2.4 mAspect Ratio = 4.0
D22D19
Anti-Buckling (s = 210 mm)
m m mf m
Superstructure Self-Weight [kN/m]
Fig.4 Required Displacement Ductility Factor and Required R-Factor
Fig. 5 Ratio of Required Transverse Steel to Confining Steel Amount of Specifications
0
50
100
150
200
250
300
0 50 100 150 200 250 300 350 400 450 500 550
Δ u,req'd
Δ cap,propΔ cap,code
Late
ral D
ispl
acem
ent [
mm
]
Diameter = 2.4 mAspect Ratio = 4.0
designed forAnti-Buckling (s = 210 mm)elastic
design
Superstructure Self-Weight [kN/m]
Δ cap,code
0.00
1.00
2.00
3.00
4.00
5.00
0 50 100 150 200 250 300 350 400 450 500 550
Saf
ety
- La
tera
l Dis
plac
emen
t
Δ u,req'd
Δ cap,prop Δ u,req'd
Diameter = 2.4 mAspect Ratio = 4.0
elasticdesign
Superstructure Self-Weight [kN/m]
Fig.6 Tendency for lateral displacement capacity
Fig. 7 Safety ratio range for displacement capacity
(a) MS-HT4-N-L2 (b) MS-HT4-N-FS (c) MS-HT4-N-SH (d) MD-HT6-N-L2
Figure 8. Configurations and dimensions of specimens.
250 mm
D10
1060
mm
coupler
D1010
60 m
m
(a) MS-HT4 series (b) MD-HT6-N-L2 Figure 9. Configuration of transverse steel.
0 5 10 15 20 25 30 35 40 45 50
be continued0.25 %
0.5 %
1.0 %
1.5 %2.0 %96
72
48
24120
-12-24
-48
-72
-96
Disp
lace
men
t [m
m]
2.0
1.5
1.0
0.50.250
-0.25-0.5
-1.0
-1.5
-2.0
Dri
ft L
evel
[%]
Number of Cycles
Figure 10. Test setup Figure 11. Loading pattern
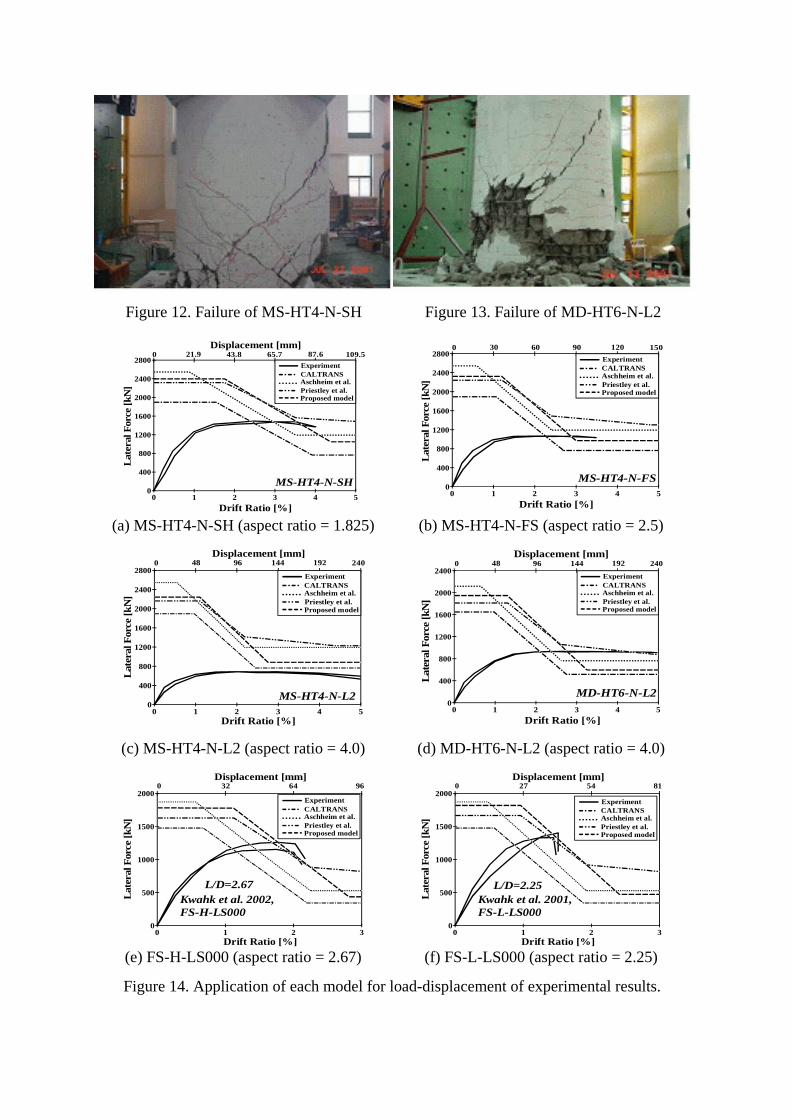
Figure 12. Failure of MS-HT4-N-SH Figure 13. Failure of MD-HT6-N-L2
0
400
800
1200
1600
2000
2400
2800
0 1 2 3 4 5
Displacement [mm]
Late
ral F
orce
[kN
]
Drift Ratio [%]
MS-HT4-N-SH
CALTRANS
0 21.9 43.8 65.7 87.6 109.5Experiment
Aschheim et al.Priestley et al.Proposed model
0
400
800
1200
1600
2000
2400
2800
0 1 2 3 4 5
0
Late
ral F
orce
[kN
]
Drift Ratio [%]
MS-HT4-N-FS
30 60 90 120 150
CALTRANSExperiment
Aschheim et al.Priestley et al.Proposed model
(a) MS-HT4-N-SH (aspect ratio = 1.825) (b) MS-HT4-N-FS (aspect ratio = 2.5)
0
400
800
1200
1600
2000
2400
2800
0 1 2 3 4 5
Displacement [mm]
MS-HT4-N-L2
0 2401921449648
Late
ral F
orce
[kN
]
Drift Ratio [%]
CALTRANSExperiment
Aschheim et al.Priestley et al.Proposed model
0
400
800
1200
1600
2000
2400
0 1 2 3 4 5
MD-HT6-N-L2
Displacement [mm]
Late
ral F
orce
[kN
]
Drift Ratio [%]
0 2401921449648
CALTRANSExperiment
Aschheim et al.Priestley et al.Proposed model
(c) MS-HT4-N-L2 (aspect ratio = 4.0) (d) MD-HT6-N-L2 (aspect ratio = 4.0)
0
500
1000
1500
2000
0 1 2 3
Displacement [mm]0
Lat
eral
For
ce [k
N]
Drift Ratio [%]
CALTRANSExperiment
Aschheim et al.Priestley et al.Proposed model
32 64 96
L/D=2.67Kwahk et al. 2002,FS-H-LS000
0
500
1000
1500
2000
0 1 2 3
Displacement [mm]0
Lat
eral
For
ce [k
N]
Drift Ratio [%]
CALTRANSExperiment
Aschheim et al.Priestley et al.Proposed model
Kwahk et al. 2001,FS-L-LS000
L/D=2.25
27 54 81
(e) FS-H-LS000 (aspect ratio = 2.67) (f) FS-L-LS000 (aspect ratio = 2.25)
Figure 14. Application of each model for load-displacement of experimental results.