a new future for sanlúcar de barrameda - aalborg...
TRANSCRIPT
A new future for Sanlucar | Alonso Enrique González de Gregorio Viñamata
1
A new future for Sanlúcar de Barrameda Based on
“A 100% renewable energy plan for Sanlúcar”
Alonso Enrique González de Gregorio Viñamata AAU SEPM Master
Master Thesis 20091477
A new future for Sanlucar | Alonso Enrique González de Gregorio Viñamata
2
Preface In November 2009 an initiative was put in place by the author to transform the community of Sanlúcar de Barrameda into a 100% renewable city. This ambitious project started with a study -“A 100% Renewable Energy Plan for Sanlucar”- which had as its main purpose to analyze the feasibility of this endeavor by evaluating the town´s natural resources and as a result the potential Renewable Energy Systems that could be used. This was made under the umbrella of providing a solution, both economic and environmental, to the town´s problems. Even though important data was gathered and some conclusions drawn, the study was left unfinished, and the objective was not accomplished becoming today a preliminary piece of work. The objective of the present project; “A new future for Sanlucar” is to complete and expand the study presented in semester 8 (2010) as part of the Master of Sustainable Energy Planning & Management syllabus, to serve the Town Hall of Sanlúcar de Barrameda build a new future for the municipality.

A new future for Sanlucar | Alonso Enrique González de Gregorio Viñamata
3
TABLE OF CONTENTS 1.0 INTRODUCTION: ................................................................................................................................. 5 2.0 SANLUCAR: SOCIO-ECONOMIC CONTEXT & BACKGROUND .................................................................. 6
2.1. Introduction .................................................................................................................................. 6 2.2 Socio-economic context ................................................................................................................. 7 2.2.1 What are the problems that Sanlucar faces today? ...................................................................... 7
a) Economic downturn and unemployment rise: .............................................................................. 7 b) Electricity prices on the rise; ........................................................................................................ 9 c) Biomass and waste; a problem rather than a solution: ................................................................. 9
2.2.2 Why are these problems and who is affected by them? ............................................................ 11 2.2.3 How to solve these problems and foster economic development? ............................................. 12
a) Organisational resources; .......................................................................................................... 13 b) Financial resources; ................................................................................................................... 14
3.0 RESEARCH QUESTION........................................................................................................................ 15 3.1 Aim, Scope & limitations............................................................................................................... 16
4.0 DEFINITIONS AND METHODOLOGY ................................................................................................... 16 4.1. Definitions ................................................................................................................................... 16 4.1.1 What does “Renewable Energy Sources” mean, and what is included within it?...................... 16 4.2.2 What is a 100% Renewable energy plan? .............................................................................. 17 4.2 Methodology................................................................................................................................ 17
5.0 TECHNICAL ANALYSIS: ....................................................................................................................... 20 5.1 CURRENT SCENARIO: from a supply and demand perspective. ...................................................... 20
5.1.1 Supply................................................................................................................................... 20 4.1.2 Demand ................................................................................................................................ 21
4.2 ALTERNATIVE SCENARIO 1 ............................................................................................................ 22 4.2.1 Principle governing the study ................................................................................................ 23 4.2.2 Demand Reduction ............................................................................................................... 24 4.2.3 Constant Supply .................................................................................................................... 28 4.2.4 Flexible Supply: ..................................................................................................................... 44 4.2.4 Balance of the system ........................................................................................................... 53
6.0 BRINGING FLEXIBILITY TO THE SYSTEM .............................................................................................. 55 6.1 Detemining the energy to be stored: ............................................................................................ 55 6.2 Different storage options:............................................................................................................. 55 6.3 Methodology:............................................................................................................................... 56 6.4 Analysis; ....................................................................................................................................... 57
7.0 SOCIO-ECONOMIC ANALYSIS ............................................................................................................. 60 7.1 Demand Reduction ....................................................................................................................... 61 7.2 Constant Supply ........................................................................................................................... 61
7.1.1 Cost: ..................................................................................................................................... 61 7.1.2 Financing a Biomass project in Sanlúcar: ............................................................................... 63 7.1.3 Employment creation: ........................................................................................................... 66
7.3 Flexible Supply ............................................................................................................................. 66 7.2.1 Cost ...................................................................................................................................... 66 7.2.3 Financing a wind project in Sanlúcar:..................................................................................... 67 7.2.4 Employment: ........................................................................................................................ 70
7.3 Storage ........................................................................................................................................ 71 8.0 CONCLUSION …………………………………………………………………………………………………………………………………….71
A new future for Sanlucar | Alonso Enrique González de Gregorio Viñamata
4
LIST OF ABBREVIATIONS: AU SEPM 8th S. 2010 – Aalborg University, Sustainable Energy Planning & Management, 8th Semester Project, carried in 2010. Authors: Alonso de Gregorio, Ludivine de la Broise, Attila Bartha, Pascal Blyth and Florin Bujac. EC - European Community RD - Royal Decree POT - Territorial Ordinance Plan (Plan de Ordenacion Territorial 2007) PV - Photovoltaic ICW - Infectious and Chemoterapical Waste MSW - Municipal Solid Waste CTAER – Advanced Technological Center for Renewable Energies (Centro Tecnológico Avanzado de Energías Renovables) RE- Renewable Energy RES- Renewable Energy Systems OECC - Spanish Climate Change Office - Oficina Española del Cambio Climatico ICIO - Tax on Building Works (Impuesto sobre Construciones Instalaciones y Obras) PASENER - Andalucian Sustainable Energy Plan FUNCAS - Fundación Cajas de Ahorro IDAE - Agency for Innovation and Development of Andalusia INE - National Institute of Statistics (Instituto Nacional de Estadística) AEBIOM - The European Biomass Association BSW - Solid Waste LHV - Caloriphic Value LVF - Light Vehicle Fleet ICEV - Combustion Engine Vehicle AEA - Andalucian Energy Agency CNE - National Energy Commission CFL - Compact Fluorescent Lamp CTAER – Advanced Technological Center for Renewable Energies (Centro Tecnológico Avanzado de Energías Renovables) CITANDALUCIA – The Centre for Innovation and Technology Transference of Andalusia CESEAND - Centre of Services for European Affairs in Andalusia CTA - Technological Corporation of Andalusia PEN - National Energy Plan MLE - Stable Legal Framework ESA - Electricity Supply Act CSP - Concentrated Solar Power NREL – National Renewable Energy Laboratory (U.S.A.) DOE - Department of Energy (U.S.A.) REPS 2010 – A 100% Renewable Energy Plan for Sanlucar Project (AAU SPEM 8th Semester project 2010). IDAE- Institute of Energy Saving of Spain S.S.S 2011 – A Storage Solution for Sanlucar Project (AAU SEPM 9th Semester project 2011)
A new future for Sanlucar | Alonso Enrique González de Gregorio Viñamata
5
1.0 INTRODUCTION:
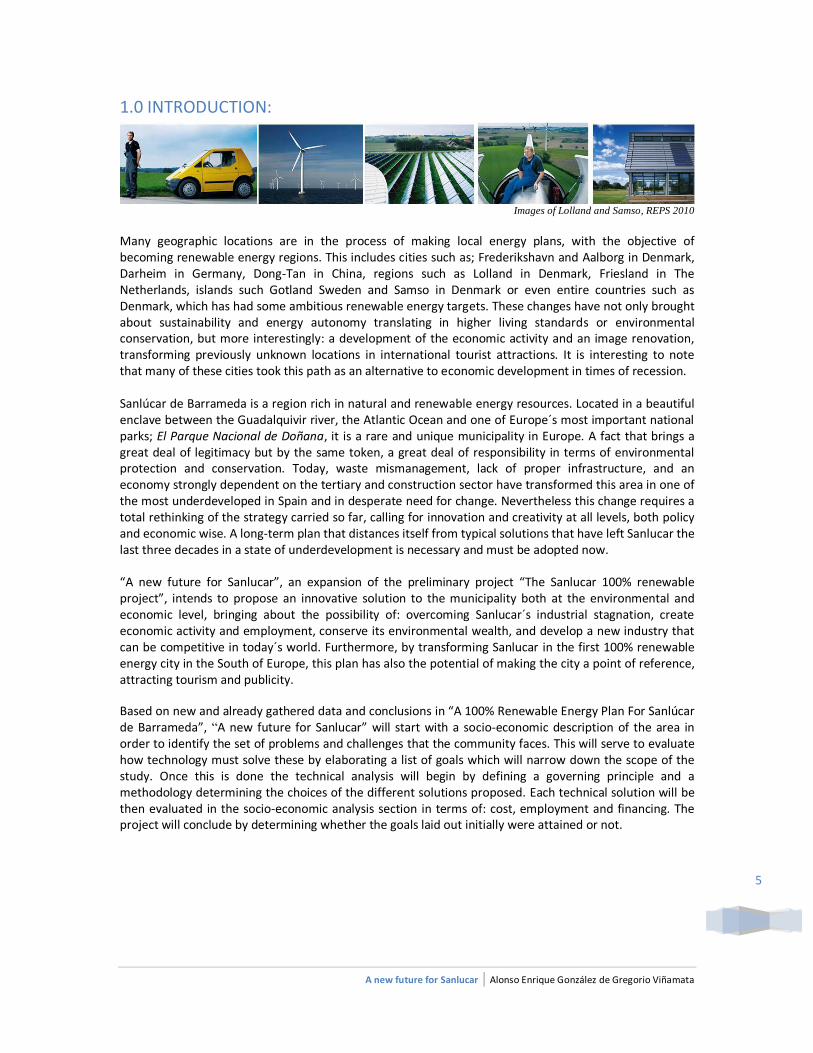
Images of Lolland and Samso, REPS 2010
Many geographic locations are in the process of making local energy plans, with the objective of becoming renewable energy regions. This includes cities such as; Frederikshavn and Aalborg in Denmark, Darheim in Germany, Dong-Tan in China, regions such as Lolland in Denmark, Friesland in The Netherlands, islands such Gotland Sweden and Samso in Denmark or even entire countries such as Denmark, which has had some ambitious renewable energy targets. These changes have not only brought about sustainability and energy autonomy translating in higher living standards or environmental conservation, but more interestingly: a development of the economic activity and an image renovation, transforming previously unknown locations in international tourist attractions. It is interesting to note that many of these cities took this path as an alternative to economic development in times of recession. Sanlúcar de Barrameda is a region rich in natural and renewable energy resources. Located in a beautiful enclave between the Guadalquivir river, the Atlantic Ocean and one of Europe´s most important national parks; El Parque Nacional de Doñana, it is a rare and unique municipality in Europe. A fact that brings a great deal of legitimacy but by the same token, a great deal of responsibility in terms of environmental protection and conservation. Today, waste mismanagement, lack of proper infrastructure, and an economy strongly dependent on the tertiary and construction sector have transformed this area in one of the most underdeveloped in Spain and in desperate need for change. Nevertheless this change requires a total rethinking of the strategy carried so far, calling for innovation and creativity at all levels, both policy and economic wise. A long-term plan that distances itself from typical solutions that have left Sanlucar the last three decades in a state of underdevelopment is necessary and must be adopted now. “A new future for Sanlucar”, an expansion of the preliminary project “The Sanlucar 100% renewable project”, intends to propose an innovative solution to the municipality both at the environmental and economic level, bringing about the possibility of: overcoming Sanlucar´s industrial stagnation, create economic activity and employment, conserve its environmental wealth, and develop a new industry that can be competitive in today´s world. Furthermore, by transforming Sanlucar in the first 100% renewable energy city in the South of Europe, this plan has also the potential of making the city a point of reference, attracting tourism and publicity.
Based on new and already gathered data and conclusions in “A 100% Renewable Energy Plan For Sanlúcar de Barrameda”, “A new future for Sanlucar” will start with a socio-economic description of the area in order to identify the set of problems and challenges that the community faces. This will serve to evaluate how technology must solve these by elaborating a list of goals which will narrow down the scope of the study. Once this is done the technical analysis will begin by defining a governing principle and a methodology determining the choices of the different solutions proposed. Each technical solution will be then evaluated in the socio-economic analysis section in terms of: cost, employment and financing. The project will conclude by determining whether the goals laid out initially were attained or not.
A new future for Sanlucar | Alonso Enrique González de Gregorio Viñamata
6
2.0 SANLUCAR: SOCIO-ECONOMIC CONTEXT & BACKGROUND
2.1. Introduction
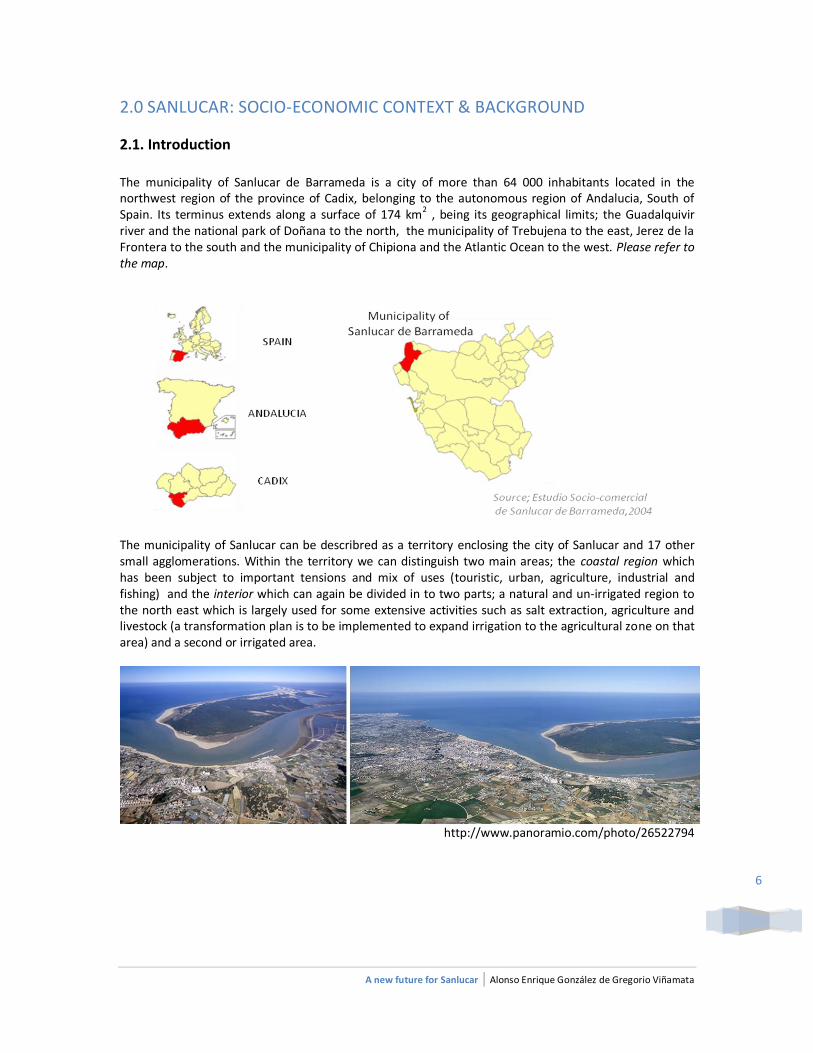
The municipality of Sanlucar de Barrameda is a city of more than 64 000 inhabitants located in the northwest region of the province of Cadix, belonging to the autonomous region of Andalucia, South of Spain. Its terminus extends along a surface of 174 km2 , being its geographical limits; the Guadalquivir river and the national park of Doñana to the north, the municipality of Trebujena to the east, Jerez de la Frontera to the south and the municipality of Chipiona and the Atlantic Ocean to the west. Please refer to the map.
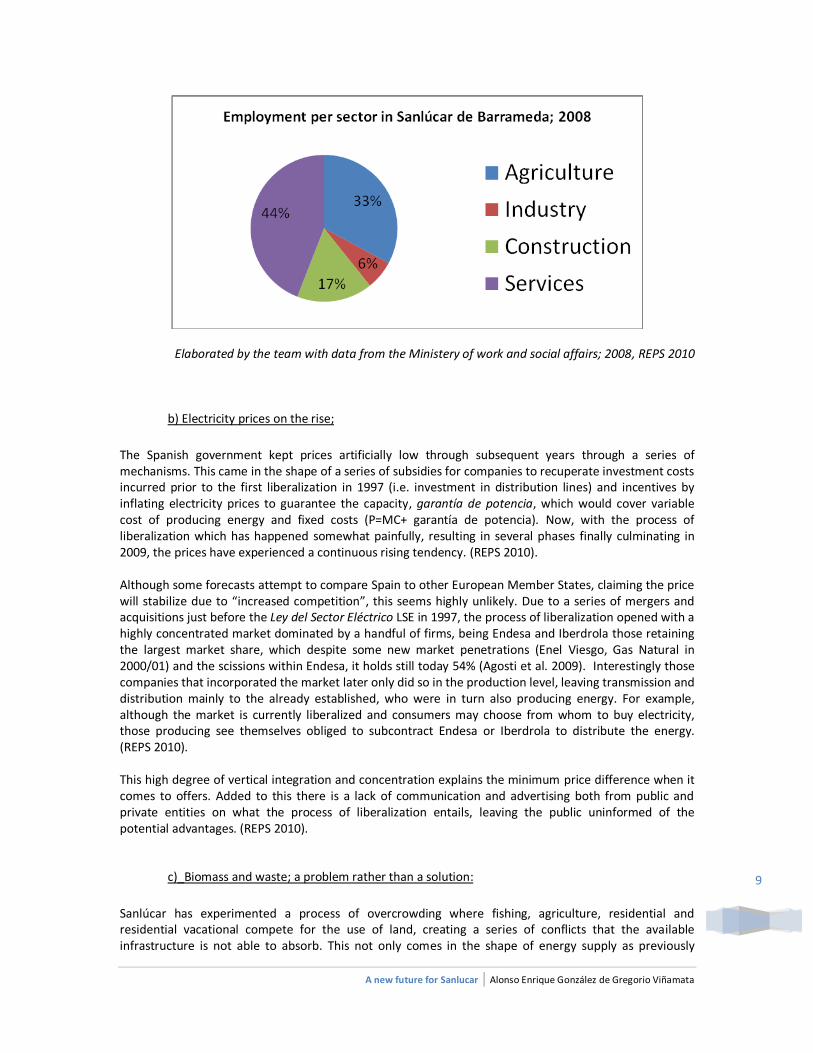
The municipality of Sanlucar can be describred as a territory enclosing the city of Sanlucar and 17 other small agglomerations. Within the territory we can distinguish two main areas; the coastal region which has been subject to important tensions and mix of uses (touristic, urban, agriculture, industrial and fishing) and the interior which can again be divided in to two parts; a natural and un-irrigated region to the north east which is largely used for some extensive activities such as salt extraction, agriculture and livestock (a transformation plan is to be implemented to expand irrigation to the agricultural zone on that area) and a second or irrigated area.
http://www.panoramio.com/photo/26522794
A new future for Sanlucar | Alonso Enrique González de Gregorio Viñamata
7
2.2 Socio-economic context
This chapter will be divided in 2 sections whose objective will be to define the context where the study takes place and the actors that affect it, ultimately serving as a basis to set a list of goals which will give a direction and a purpose to this piece of work. This section will try to answer three key questions 1) What are the problems that Sanlucar faces today? 2) Why are these problems? 3) Who is affected by them?.
2.2.1 What are the problems that Sanlucar faces today?
The North-eastern coast of Cadix is a region that is suffering an accelerated transformation accompanied by a growing young population and an important unemployment rate. This economy, still under development, seems to be shifting from a traditional agricultural, wine making and fishing vocation, to the growth of a second residence and vacational area, recently decelerated by the impacts of the economic recession. Various problems hinder the development of the area making it discontinuous and uneven. In a macro dimension we can identify the negative impacts of the recent economic downturn along a rising tendency on the price of energy. At the local level, or in a more micro dimension, Sanlucar is characteristic of the problems related to a territory that is suffering a rapid process of occupation and overexploitation, such as; insufficiency in the energy supply network, conflict of land use, waste mismanagement and water pollution. With the perspective of achieving a 100% renewable energy plan that takes into account local available inputs, we will explore each of these problems with the purpose of understanding what are the necessities and opportunities in the area, elaborate a list of objectives, and tailor that plan that can best answer those goals. For simplicity reasons, the writer has identified 4 key problem areas:
a) Economic downturn and unemployment rise:
The economic structure of Sanlúcar de Barrameda, like that of the region and a good part of Spain, can be divided four sectors; services, construction, traditional industry and agriculture. The construction and the service sector represent the two pillars that sustain its economy. (REPS 2010). Before the crisis, the index of employment in Sanlucar de Barrameda reached the 17622 inhabitants with 3992 unemployed (Estudio socio-comercial Sanlucar de Barrameda 2003). The chart bellow provides a good description of all the economic activities that conformed and still conform the economic activity in Sanlucar de Barrameda. Their share of importance can be visible through the amount of labor positions they offer. (REPS 2010).
A new future for Sanlucar | Alonso Enrique González de Gregorio Viñamata
8
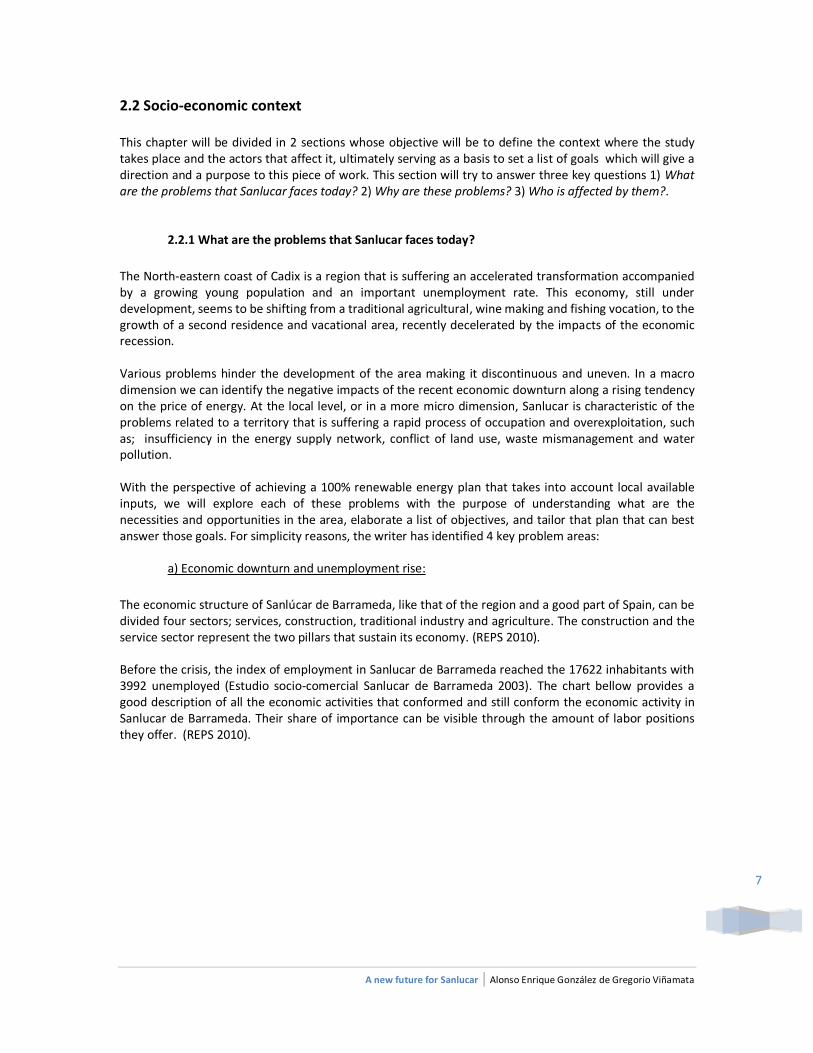
Employment per Sector and sex 2003, Sanlúcar de Barrameda
Estudio socio-comercial Sanlucar de Barrameda 2003, REPS 2010
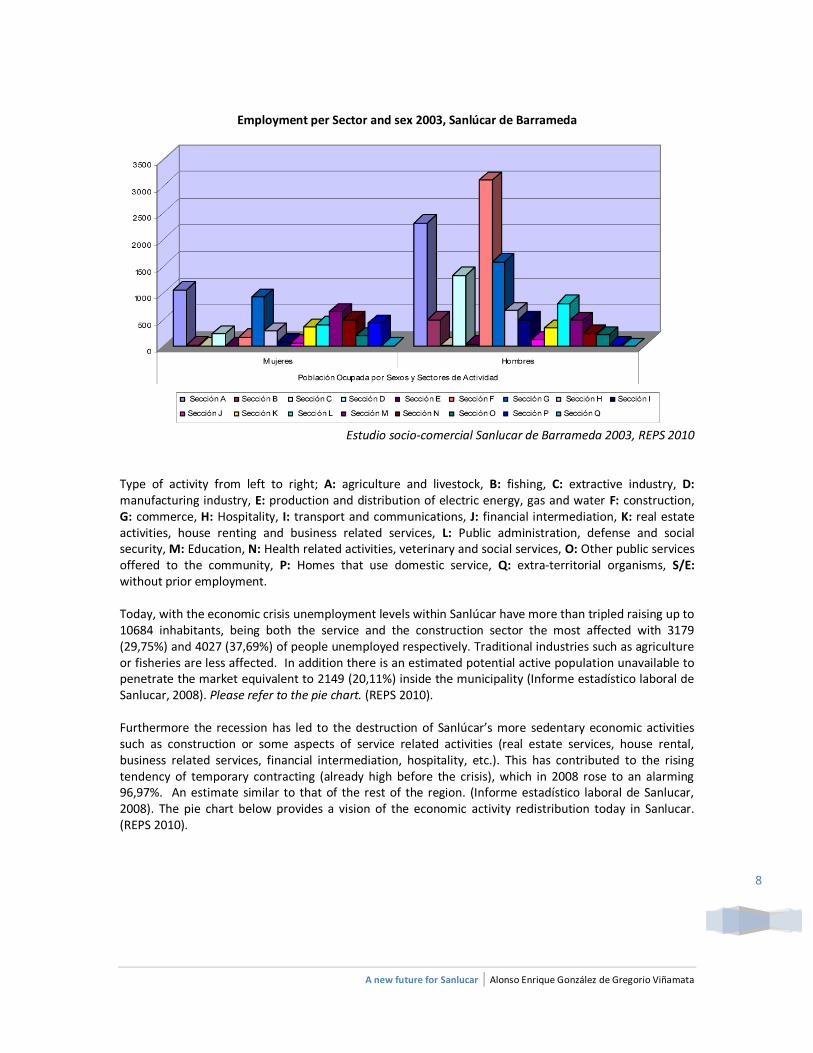
Type of activity from left to right; A: agriculture and livestock, B: fishing, C: extractive industry, D: manufacturing industry, E: production and distribution of electric energy, gas and water F: construction, G: commerce, H: Hospitality, I: transport and communications, J: financial intermediation, K: real estate activities, house renting and business related services, L: Public administration, defense and social security, M: Education, N: Health related activities, veterinary and social services, O: Other public services offered to the community, P: Homes that use domestic service, Q: extra-territorial organisms, S/E: without prior employment. Today, with the economic crisis unemployment levels within Sanlúcar have more than tripled raising up to 10684 inhabitants, being both the service and the construction sector the most affected with 3179 (29,75%) and 4027 (37,69%) of people unemployed respectively. Traditional industries such as agriculture or fisheries are less affected. In addition there is an estimated potential active population unavailable to penetrate the market equivalent to 2149 (20,11%) inside the municipality (Informe estadístico laboral de Sanlucar, 2008). Please refer to the pie chart. (REPS 2010). Furthermore the recession has led to the destruction of Sanlúcar’s more sedentary economic activities such as construction or some aspects of service related activities (real estate services, house rental, business related services, financial intermediation, hospitality, etc.). This has contributed to the rising tendency of temporary contracting (already high before the crisis), which in 2008 rose to an alarming 96,97%. An estimate similar to that of the rest of the region. (Informe estadístico laboral de Sanlucar, 2008). The pie chart below provides a vision of the economic activity redistribution today in Sanlucar. (REPS 2010).
A new future for Sanlucar | Alonso Enrique González de Gregorio Viñamata
9
Elaborated by the team with data from the Ministery of work and social affairs; 2008, REPS 2010
b) Electricity prices on the rise;
The Spanish government kept prices artificially low through subsequent years through a series of mechanisms. This came in the shape of a series of subsidies for companies to recuperate investment costs incurred prior to the first liberalization in 1997 (i.e. investment in distribution lines) and incentives by inflating electricity prices to guarantee the capacity, garantía de potencia, which would cover variable cost of producing energy and fixed costs (P=MC+ garantía de potencia). Now, with the process of liberalization which has happened somewhat painfully, resulting in several phases finally culminating in 2009, the prices have experienced a continuous rising tendency. (REPS 2010). Although some forecasts attempt to compare Spain to other European Member States, claiming the price will stabilize due to “increased competition”, this seems highly unlikely. Due to a series of mergers and acquisitions just before the Ley del Sector Eléctrico LSE in 1997, the process of liberalization opened with a highly concentrated market dominated by a handful of firms, being Endesa and Iberdrola those retaining the largest market share, which despite some new market penetrations (Enel Viesgo, Gas Natural in 2000/01) and the scissions within Endesa, it holds still today 54% (Agosti et al. 2009). Interestingly those companies that incorporated the market later only did so in the production level, leaving transmission and distribution mainly to the already established, who were in turn also producing energy. For example, although the market is currently liberalized and consumers may choose from whom to buy electricity, those producing see themselves obliged to subcontract Endesa or Iberdrola to distribute the energy. (REPS 2010). This high degree of vertical integration and concentration explains the minimum price difference when it comes to offers. Added to this there is a lack of communication and advertising both from public and private entities on what the process of liberalization entails, leaving the public uninformed of the potential advantages. (REPS 2010).
c)_Biomass and waste; a problem rather than a solution:
Sanlúcar has experimented a process of overcrowding where fishing, agriculture, residential and residential vacational compete for the use of land, creating a series of conflicts that the available infrastructure is not able to absorb. This not only comes in the shape of energy supply as previously
A new future for Sanlucar | Alonso Enrique González de Gregorio Viñamata
10
mentioned, but in an increased amount of waste that cannot be handled by the existing (in some case lacking) infrastructure leading to the creation of illegal dumps and superficial and underground water pollution. Moreover the spills coming from activities such as those carried by the chemical industry, wood treatment (furniture industry) or paint fabrication, leads to the contamination of the areas they occupy enhancing the aforementioned process (Diagnóstico Medio Ambiental de la Agenda 21 de Sanlúcar de Barrameda 2006). (REPS 2010). When it comes to the dealing of that waste, although Sanlúcar has seen a surge in the recycling sector especially in the treatment of metal or plastic derivatives, developing the biggest recycling company in Spain, in terms of energy production no special treatment nor distinction is made for biomass. The domestic, agricultural or fish waste is gathered up both from Sanlucar and the neighboring municipality of Chipiona in a transfer plant in Sanlucar to be sent to Medina Sidonia (the Miramundo Plant) where they are to be treated. This process costs the town hall of Sanlucar de Barrameda around 100 000 € a month. When it comes to domestic oil, external companies are paid to pick it up and deliver to be transformed (e.g. Biodesel). (REPS 2010). No space in Sanlucar is dedicated yet for the production of energy crops, however, there exists a private initiative to use the lands dedicated to salt extraction for the growing of Salicornia for the production of Biofuel.
a) Demand-side problems: Please refer to section 5.
b) Poor energy infrastructure: Please refer to section 5.
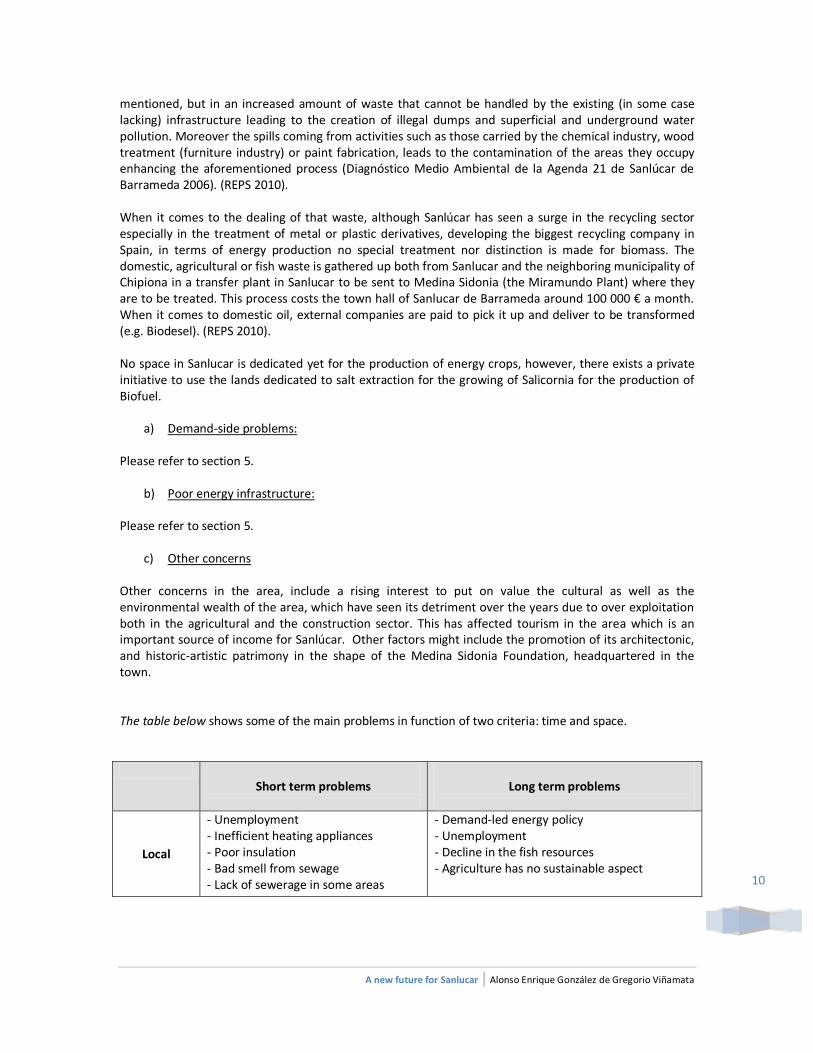
c) Other concerns Other concerns in the area, include a rising interest to put on value the cultural as well as the environmental wealth of the area, which have seen its detriment over the years due to over exploitation both in the agricultural and the construction sector. This has affected tourism in the area which is an important source of income for Sanlúcar. Other factors might include the promotion of its architectonic, and historic-artistic patrimony in the shape of the Medina Sidonia Foundation, headquartered in the town. The table below shows some of the main problems in function of two criteria: time and space.
Short term problems
Long term problems
Local
- Unemployment - Inefficient heating appliances - Poor insulation - Bad smell from sewage - Lack of sewerage in some areas
- Demand-led energy policy - Unemployment - Decline in the fish resources - Agriculture has no sustainable aspect
A new future for Sanlucar | Alonso Enrique González de Gregorio Viñamata
11
Regional
- Tourism affected by environmental problems - Discharge of untreated sewage to creeks - Illegal dumps
- Supply side oriented energy policy - Electricity network instability - Electricity and fuel prices
Completed from initial table REPS 2010
2.2.2 Why are these problems and who is affected by them?
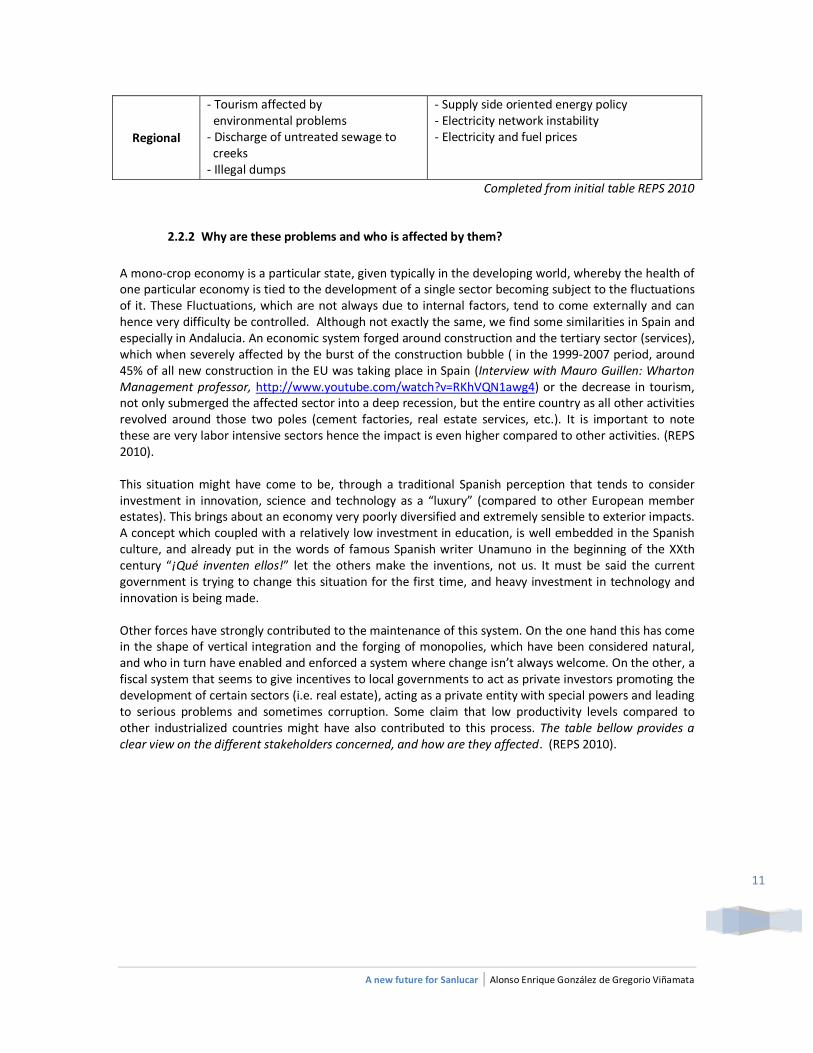
A mono-crop economy is a particular state, given typically in the developing world, whereby the health of one particular economy is tied to the development of a single sector becoming subject to the fluctuations of it. These Fluctuations, which are not always due to internal factors, tend to come externally and can hence very difficulty be controlled. Although not exactly the same, we find some similarities in Spain and especially in Andalucia. An economic system forged around construction and the tertiary sector (services), which when severely affected by the burst of the construction bubble ( in the 1999-2007 period, around 45% of all new construction in the EU was taking place in Spain (Interview with Mauro Guillen: Wharton Management professor, http://www.youtube.com/watch?v=RKhVQN1awg4) or the decrease in tourism, not only submerged the affected sector into a deep recession, but the entire country as all other activities revolved around those two poles (cement factories, real estate services, etc.). It is important to note these are very labor intensive sectors hence the impact is even higher compared to other activities. (REPS 2010). This situation might have come to be, through a traditional Spanish perception that tends to consider investment in innovation, science and technology as a “luxury” (compared to other European member estates). This brings about an economy very poorly diversified and extremely sensible to exterior impacts. A concept which coupled with a relatively low investment in education, is well embedded in the Spanish culture, and already put in the words of famous Spanish writer Unamuno in the beginning of the XXth century “¡Qué inventen ellos!” let the others make the inventions, not us. It must be said the current government is trying to change this situation for the first time, and heavy investment in technology and innovation is being made. Other forces have strongly contributed to the maintenance of this system. On the one hand this has come in the shape of vertical integration and the forging of monopolies, which have been considered natural, and who in turn have enabled and enforced a system where change isn’t always welcome. On the other, a fiscal system that seems to give incentives to local governments to act as private investors promoting the development of certain sectors (i.e. real estate), acting as a private entity with special powers and leading to serious problems and sometimes corruption. Some claim that low productivity levels compared to other industrialized countries might have also contributed to this process. The table bellow provides a clear view on the different stakeholders concerned, and how are they affected. (REPS 2010).
A new future for Sanlucar | Alonso Enrique González de Gregorio Viñamata
12
Stakeholder Category Problem consequences
Public Sector Local government -Lack of revenue sources to face problems
Private sector Construction - Severe decline in economic activity - Rising energy prices
Services - Severe decline in economic activity related to real estate purposes - Decrease in tourism affecting hotel management and restoration sector - Decline in local consumption -In some cases disturbed by the waste problem (e.g. tourism) -Rising energy prices
Agriculture And Fisheries
-Decline in consumption - Affected by waste problem due to pollutants -Affected by overcrowding in terms of insufficient infrastructure, transport, and appropriate development of activities -Rising energy prices
Industry -Affected by decreased consumption, and some cease of activity in some cases (e.g. commercial). - Irruptions in the system or lack of sufficient power has forced additional investment in private substations (i.e. commercial centers, recycling company) - Bad infrastructure related to transport not enabling the appropriate development of activities -Rising energy prices
Inhabitants - High unemployment -Disturbed by the waste problem -Rising energy prices
Completed from initial table REPS 2010
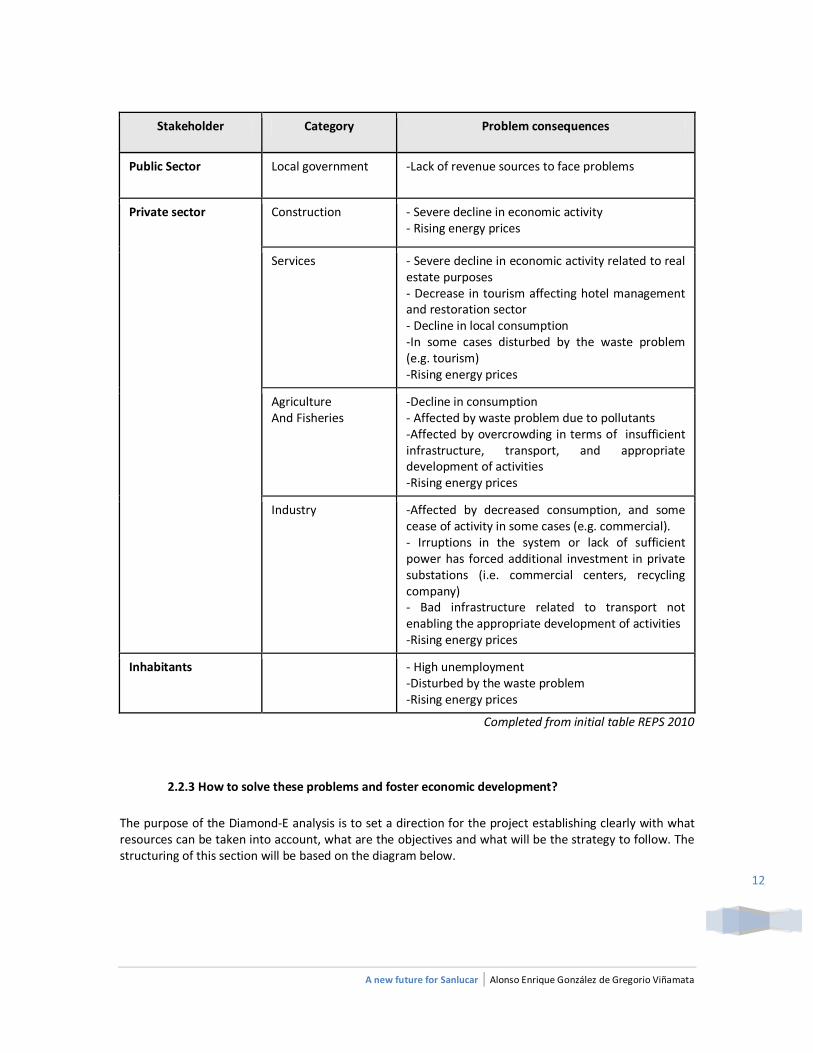
2.2.3 How to solve these problems and foster economic development?
The purpose of the Diamond-E analysis is to set a direction for the project establishing clearly with what resources can be taken into account, what are the objectives and what will be the strategy to follow. The structuring of this section will be based on the diagram below.
A new future for Sanlucar | Alonso Enrique González de Gregorio Viñamata
13
(Frede Hvelplund & Henrik Lund, 1998) (REPS 2010)
a)_Organisational resources;
Sanlucar has very high and important resources, or local inputs, that are simply not being used properly, or that even cost money for the inhabitants. Under this stance a list was made of those key inputs to be developed later in our technical and institutional analysis (REPS 2010). 5 elements will be identified:
i) Solar; Even though there are electricity network limitations, when it comes to renewable energy resources, Sanlucar benefits from one of the highest levels of solar irradiation in Europe, making photovoltaics and solar thermal an essential input to consider for both electricity and heat production (REPS 2010).
ii) Wind; On the other hand, Sanlucar given its location close to the Atlantic and the Gibraltar straight benefits from high wind speeds. A factor that is already under consideration making the regional government to consider the introduction of an offshore wind farm in the neighboring locality of Chipiona, subject of high debate (REPS 2010).
iii) Biomass; As we have seen, Biomass in Sanlucar comes mainly from waste as there are yet no energy dedicated crops in the area. Waste can either be domestic or come from the fish or the agricultural industry. There are no plants (e.g. food) generating bi-products that could be used for energy production (REPS 2010). Biomass waste in Sanlucar is not only not being used but is in a large percentage freely available (does not have to be bought and imported such as is the case of Denmark from Latvia) and in addition costs money to eliminate creating several problems in the area. This provides an essential input to consider, as it addresses various issues that need solution while providing stability to intermittent energy systems such as wind or solar energy (REPS 2010).
iv) Other sources of energy production;
A new future for Sanlucar | Alonso Enrique González de Gregorio Viñamata
14
It would be interesting to mention that due to the conditions present in Sanlucar, such as the type of soil or the changing tides of the Guadalquivir river, other options such as geothermal or tidal energy could be considered. Nevertheless given the limited time frame, or the youth of some of these technologies we will overrule these possibilities and invite other experts to explore further.
v) Unemployment and literacy levels; The estate of the labor market is not only an estimate that indicates the estate of health of the economy in a particular region, but can become an essential input as a certain level of unemployment is necessary if a shift to a new energy plan is intended. The scarcity of this resource became a problem in regions such as Lolland, Denmark, where emigration as a result of an economic downturn led to an aged and dependent population that made the shift to a 100% renewable energy system more complicated and financially more significant. In the case of Sanlucar unemployment is high and young, specially within the age range of 25 to 34 for both men and women, also for women between the ages of 45 to 49. (REPS 2010). Another factor to look at will be the literacy rate, especially if the shift in the energy system requires the introduction of technologies with a learning curve. Interestingly, in Sanlucar, unemployment has affected to the largest extent that sector who has achieved secondary education and post secondary studies (Informe estadístico laboral de Sanlucar, 2008). As it was mentioned previously, this can be explained by a decline in more skill intensive sectors (which are more characteristic of the service sector), and that the vacancies available reside in the traditional industry, which generally do not require any specific skill and are generally seasonal. (REPS 2010).
vi) The Construction sector: Sanlucar´s biggest threat is also its biggest opportunity, with an economy linked to the construction sector and related services, there exists the means and the tools within the community to start implementing any demand reduction measures.
b)_Financial resources;
Sanlucar has limited financial resources, however it does count with a very favorable political environment, the rising of funding institutions both nationaly and internationally, as well as the fiscal tools to create incentive for change to happen. The desired shift will probably have to come from a combination of top-down and bottom-up approaches with some type of FDI, nevertheless this will dealt with further on. The purpose of this section will be to describe the current state of affairs, or financial resources, from two perspectives Top level (town hall) and bottom level (households). (REPS 2010).
i) The town hall of Sanlucar de Barrameda;
Sanlúcar along other Spanish municipalities feeds itself fundamentally out of three main sources; 1.- licencias de obra or building permits; therefore, every time that a construction work is carried within the area that conforms the municipality of Sanlucar, the local government has the right to perceive a percentage. 2.- Impuesto de Bienes Inmuebles (IBI), annual property tax, this is an annual tax on property or terrain perceived by the municipality depending on its size. 3.- Plusvalías, capital gains on real estate, that are generated in the selling of a property or terrain located within the municipality. Other sources of revenue exist to cover specific services such as garbage tax for example or fines/sanctions, which are generally translated in the salaries of the public work force, nevertheless the three fiscal taxes listed above represent the most important revenue source.
A new future for Sanlucar | Alonso Enrique González de Gregorio Viñamata
15
As we have no clear information regarding the local government balance of payments we can only assume that with the market collapse and severe recession affecting the service and construction sector the local government is finding itself with important budget problems. On a later interview it was found out the current debt exceeds the 108 M €, hence their interest to reactivate the economy is imminent.
ii) Household income in Sanlucar de Barrameda;
According to available estimates concerning the socio-economic scenario in Sanlúcar prior to the crisis (years 2003 and 2004), the population in Sanlucar is organized in households comprising 3-4 members each in average, which amount in turn to a total of 18.187 (Estudio Socio-comercial de Sanlucar de Barrameda, 2003). The average disposable rent (total sum of cash inflows perceived) per family oscillates between the 7 000 - 8 100 € per year, being along with Chipiona, the lowest in the region of Cadix (Anuario económico “La Caixa”, 2004). According to the latter estimate, the average household in the locality would have a disposable income of 583-675 € per month. (REPS 2010).
Now an important factor to take into account if the shift in the energy structure requires a percentage of the investment coming from the city inhabitants, is the savings rate, especially if this were to happen through the creation of cooperatives and community funds, as a this might limit the extent of the action to take place. (REPS 2010).
Prior to the crisis, year 2005, in Spain only 3 out of 10 families was able to save after covering basic consumption and facing debt. This saving came, and comes still today, as a result of the disposable income and the positive returns of their financial patrimony (home, actions, funds, deposits). Out of these 3 families a 20% was bond to a mortgage contract and obtained their “budget surplus” after the payment of the interests of the loan. For the rest, we found and still find two situations; either a household that spends bellow their disposable income and the debt is covered by what is left, or the household that financed debt with more debt. (Fundación Cajas de Ahorro (FUNCAS, 2005 ). (REPS 2010).
Prior to the crisis, in the case of Andalucía, the savings rate generally oscillated around the 9.5% (period 2000-06), being traditionally one of the lowest in Spain. When it came to Cadix it went as low as 8,6% (2005), again the lowest in the region (Fundación Cajas de Ahorro (FUNCAS):, 2005 ). No data was available for Sanlucar. Assuming Sanlucar would have a similar savings rate to that of Cadix and that the household disposable income did not change from the year 2004 to 2005, we could estimate an average monthly saving of ~50,2 – 58,1 € in the locality. (REPS 2010).
Nevertheless it must be noted that as a consequence of uncertainty, inflation reduction and most importantly the destruction of the “wealth effect”, which had contributed so much to the steady increase in household consumption, there has been an increase in the savings rate that started in 2008 and in 2009 reached historical levels in Spain. However recent estimates point out that although the situation might have increased in some areas, in Cadix along other provinces it seems it seems to have remained stable. (REPS 2010). This information will be essential to set the scope, the constraints as well as the goals directing the study. These will be laid out in the next sections.
3.0 RESEARCH QUESTION
Is it technically and socio-economically feasible to transform the city of Sanlucar de Barrameda into a 100% renewable energy city?
A new future for Sanlucar | Alonso Enrique González de Gregorio Viñamata
16
3.1 Aim, Scope & limitations
The purpose of this project will be to complete and improve the work carried in “A 100% Renewable Energy Plan for Sanlucar” providing a valuable solution to the Town Hall of Sanlucar de Barrameda that can ultimately benefit the municipality. According to the problems and challenges described in the previous section this will be based upon five key goals. :
1. Deal with the high unemployment levels of Sanlucar de Barrameda.
2. Generate a new economic activity within the municipality that can be long-lasting.
3. Provide a source of revenue for the municipality.
4. Provide a solution to the waste problem in the municipality.
5. Give sustainability and energy independence to Sanlucar, complying with the interest in environmental protection.
Due to financial, time constraints and lack of data the present study will not include elements such as transportation, an essential factor to take into account when devising a 100% energy plan, while consider some plausible options in terms of: natural resources in the area (salt extraction, water power, etc.), technology (i.e. storage options, etc.) and socio-economic analysis (i.e. limited financial analysis). In addition it is important to note the data obtained and the results formulated will only reflect a one year period, this lack of forecasting both in the reference and alternative scenario threatens to turn the present study into an obsolete piece of work in the years to come. Further study is strongly recommended.
4.0 DEFINITIONS AND METHODOLOGY
4.1. Definitions
4.1.1 What does “Renewable Energy Sources” mean, and what is included within it?
According to the Renewable Energy Association (REA) renewable energy sources are divided in to two types: 1) Elemental renewables and 2) Biological renewables. The former one includes: solar, water, wind, wave, tidal, geothermal and geopressure. The latter includes: energy crops, standard crops and their by-products, biomass element of waste streams including ICW and MSW, forestry, forestry by-products and animal by-products from the food chain. (REPS 2010).
Concerning waste and its processing, in particular, it must be pointed out that in Spain, direct combustion of solid waste in incineration is considered as a renewable energy source. Nevertheless, this is not the case in all countries, and the trend shows that this approach is year by year less accepted internationally. In the case of Sanlúcar de Barrameda waste will be considered a renewable energy source, as only the organic part of the waste will be taken into account. (REPS 2010).
A new future for Sanlucar | Alonso Enrique González de Gregorio Viñamata
17
4.2.2 What is a 100% Renewable energy plan?
A 100% renewable energy region is that, that produces the same amount of energy that it consumes over a period of time, normally a year. There are different levels at which a renewable energy plan can operate depending on the origins of the renewable energy sources and renewable energy systems themselves. As laid out in the REPS 2010, or initial energy plan for Sanlucar. We will distinguish three categories:
d) Geographical approach: strong sustainability
All energy consumed is produced within the geographical borders of the region and the inputs come, as well, from within those borders. This approach is found in a 100% renewable project in Malmö, Sweden, where all the heat and electricity demand of a district is produced by renewable energy sources that can be exploited in the same district.
e) Ownership approach – medium sustainability
A portion of the output (electricity/heat) or the input (biomass, wind, etc.) is produced outside of the
geographical borders of the municipality, but owned by the municipality.
f) Economic approach - low sustainability
A portion of the output or the input can be imported (bought) from external renewable energy sources not owned by the municipality, nor owned by it. It is important to mention, some authors talk as well about three types of technical systems that a 100% renewable plan can fall into, these are categorized as: island, semi-island, and open mode, which describe the degree of connectedness of the system to the exterior grid, and its ability to import/export energy. Apart from the complexities an island mode would require, under the Spanish law, the connected mode, or open mode, will be the one considered for this work.
4.2 Methodology
Taking into account the socio-economic needs and conditions of the town, the objective of this thesis will be to transform Sanlucar into a 100% renewable energy city by continuing and expanding the study presented in semester 8 (2010) as part of the Master of Sustainable Energy Planning & Management syllabus. The expansion will imply: 1.- Establishment of a principle that will govern the study followed by a clear methodology to approach both the technical and socio-economic section of the project bringing: order, coherence and logic to the piece of work. 2.- Correction and reorganization of data, complemented by missing data, as well as rebuilding of the initial models providing corrected, and understandable results. 3.- Re-evaluation of existing technical solutions and/or inclusion of new, to achieve a 100% energy plan for the city. 4.- Completion of the socio-economic section. 5.- Development of only those areas relevant to the objective of this study bringing a micro approach, the rest will be excluded.
4.2.1 Data obtention The data has been obtained via four methods: 1) previous study “A 100% Renewable Energy Plan for Sanlucar” whose essential data gathered through local measurements and interviews with co-operatives, local companies and town hall officials resulted essential as a basis for the present piece of work. 2) Semi-formal interviews and online questionnaires with: Sanlucar de Barrameda Town Hall authorities in the
A new future for Sanlucar | Alonso Enrique González de Gregorio Viñamata
18
following delegations: waste management, industry & tourism, urban planning, AEA (Andalusian Energy Agency), Gent Renewable Energy Research Center VITO for Biomass, Junta de Andalucia (regional government) with: delegation for innovation and technology. 3) Official websites: National Institute of Energy Saving (Instituto Nacional de Ahorro Energético (IDEA)), the National Institute of Statistics (Instituto Nacional de Estadística (INE)), the Spanish Electricity Network (Red Electrica Española REE), The Statistic Institute of Andalucia (Instituto Nacional de Estadística de la Junta de Andalucia), Meteorological Institute of Cadix (Instituto meteorológico de Cádiz), Danish Wind Energy Association. 4) Observations made by the author on the multiple visits to the area. This was complemented by literature revision such as: scientific journals, press reviews and articles, as well as all other information that the subscriber might gather at conferences and seminars about the topic.
4.2.2 Data organization
In order to provide consistency to the study and the maximum veracity to its results, the considerable amount of data gathered over one and a half year work was revised and rectified by choosing a reference year for all figures to relate to whenever possible. 2008 was selected due to the fact that a significant percentage of the data available relates to the given year. It must be noted however, that in some sections this was not possible due to limited data sources. When this happened, the year available or the closest to 2008 was selected. Please refer to methodology for a word on data sources.
A word about the Sanlucar´s electricity demand:
Even though Sanlúcar´s 2008 yearly electricity demand was obtained from the Instituto Nacional de Estadística de Andalucía, it was not possible to obtain the hourly electricity consumption for the municipality. Sanlucar´s Town Hall and the Fundación Casa de Medina Sidonia must be praised for their insistence and dedication to this endeavor. For this reason and in order to carry the study further, the national hourly demand had to be utilized and adapted to Sanlúcar. This was provided by REE (REE Red Electrica Española). It is important to note that REE only publishes graphs, hence the data had to be derived manually in a process that took several days. Due to lack of time and man power, only the first week of every month was recorded and used for the other three weeks. A total of 12 weeks were derived from the graphs.
4.2.3 Data processing:
For this analysis, various programs were used depending on the technology implemented.
For Demand Reduction, RETScreen proved a valuable tool. This is a Microsoft Excel-based free software package used to determine the feasibility of clean energy projects, which includes renewable energy installations and the means to assess a wide range of energy efficiency options. The software provides the user with a broad range of options for assessing the technical, financial and environmental suitability for an investment in a clean energy project, which includes: energy efficiency, renewable energy, and cogeneration (combined heat and power). It integrates a number of databases to assist the site assessor, including a global database of climatic conditions obtained from 4,700 ground-based stations and NASA's satellite data. (http://en.wikipedia.org/wiki/RETScreen). The model which was mainly utilized for energy efficiency in building and meteorological data in the previous project, became a very valuable tool on this project to evaluate the economic feasibility of each of the technical solutions proposed in the socio-economic analysis sections. These involved information using information about cost, financing, revenue generated, incentives/grants, to determine cashflows, risks, payback times and the financial feasibility of the different projects individually.
A new future for Sanlucar | Alonso Enrique González de Gregorio Viñamata
19
When it comes to wind power generation several options where used, due to the fact that the license for some programs (i.e. WindPRO) was acquired very late, the analysis shows a combination of different programs and results. One of the programs used was Meteosim. Meteosim uses the MesoMap system, which consists of an integration of simulation models of the atmosphere, databases, workstations, disk drives, etc. which help create maps of average wind speeds at: 60 , 80 and 100 m. altitude. From the resulting maps and through the ArcReader software, which allows users to view and extract data for each of one of the aforementioned levels at any point in the region, different Weibull parameters are extracted to build Weibull distributions.
With this data and using the computer program WindPRO through one of its calculation modules and always with the help of WAsP calculation package, the wind resources of the area in question were obtained with a predefined resolution, based on: the wind speed statistics, the topography of the area, the lines that define the different kinds of roughness of the environment and local obstacles, if any. This wind resource maps of the area proved crucial to learn, more accurately: average speeds, productions or behavior of the wind on the site which will then enable to place the turbines more efficiently along the selected site.
Once the layout of the turbines is chosen, it is necessary to know the specific wind data (frequencies and Weibull parameters) for each of their exact locations. Since it is impossible to have this information, it is necessary to use the software package WindPRO with WAsP calculation. These, based on data contours (topography), roughness classes in the surrounding terrain, obstacles, if any, and wind data for a specific position in the vicinity, yield wind statistics for the entire study area, and a forecast or estimate of the wind conditions that may exist in the exact locations of the turbines.
To estimate the energy produced by the wind, WindPRO is used again, this time with WAsP as calculation tool. With the characteristics of the selected wind turbines (hub height, diameter, power curve, etc..), And based on an average of three wind statistics described in the preceding paragraph, the program gets the energy produced by the wind farm taking into account the wake effect of interference between different machines on the model of NO Jensen. Nevertheless it must be mentioned this data was calculated previously and WindPRO served as a complement.
Finally, for the balance analysis of the different technologies a simple Excel model was used. The objective of which was to plot the different energy yields per week, compare them to one another and to the town´s total demand. The idea was to evaluate whether the combination of the different technologies together could satisfy the demand, and if so in what frequencies during the period of one year. The model in Excel, through basic calculations, concludes by displaying the amount of energy exported (surpluss created by the energy system) and imported (which could not be covered), during same period. The balance thus determines the level of success achieved by the different technical solutions proposed.
A new future for Sanlucar | Alonso Enrique González de Gregorio Viñamata
20
5.0 TECHNICAL ANALYSIS:
5.1 CURRENT SCENARIO: from a supply and demand perspective
5.1.1 Supply
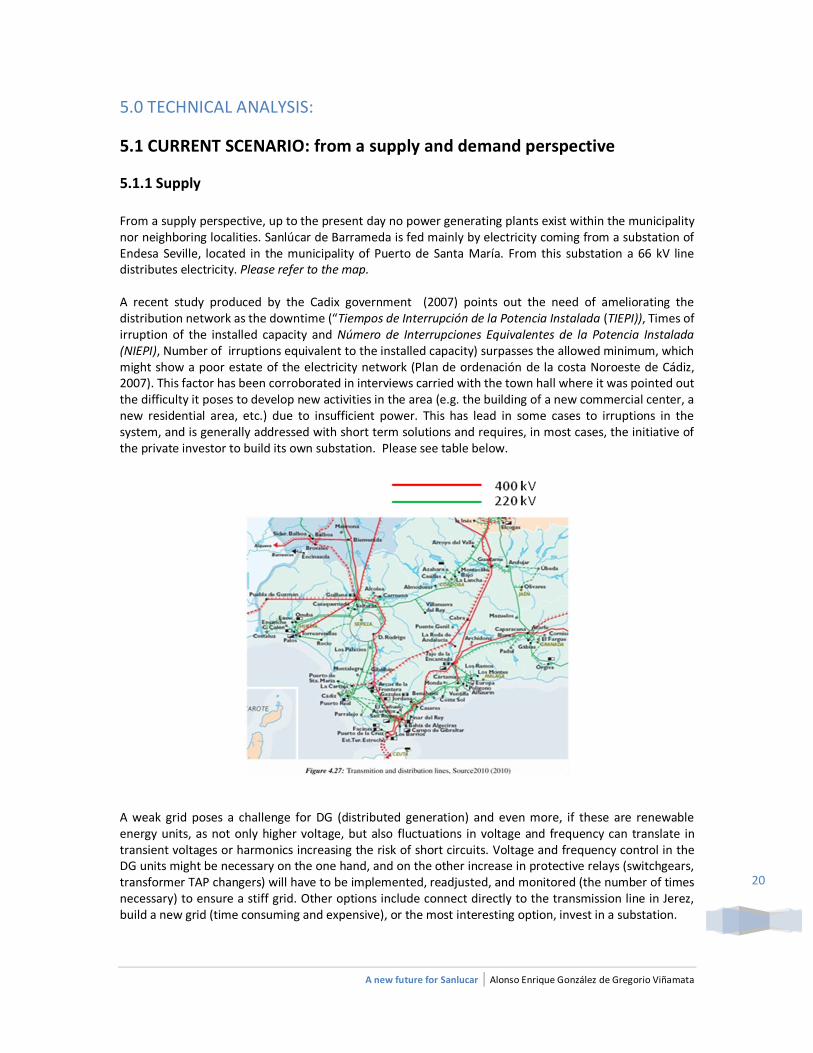
From a supply perspective, up to the present day no power generating plants exist within the municipality nor neighboring localities. Sanlúcar de Barrameda is fed mainly by electricity coming from a substation of Endesa Seville, located in the municipality of Puerto de Santa María. From this substation a 66 kV line distributes electricity. Please refer to the map. A recent study produced by the Cadix government (2007) points out the need of ameliorating the distribution network as the downtime (“Tiempos de Interrupción de la Potencia Instalada (TIEPI)), Times of irruption of the installed capacity and Número de Interrupciones Equivalentes de la Potencia Instalada (NIEPI), Number of irruptions equivalent to the installed capacity) surpasses the allowed minimum, which might show a poor estate of the electricity network (Plan de ordenación de la costa Noroeste de Cádiz, 2007). This factor has been corroborated in interviews carried with the town hall where it was pointed out the difficulty it poses to develop new activities in the area (e.g. the building of a new commercial center, a new residential area, etc.) due to insufficient power. This has lead in some cases to irruptions in the system, and is generally addressed with short term solutions and requires, in most cases, the initiative of the private investor to build its own substation. Please see table below.
A weak grid poses a challenge for DG (distributed generation) and even more, if these are renewable energy units, as not only higher voltage, but also fluctuations in voltage and frequency can translate in transient voltages or harmonics increasing the risk of short circuits. Voltage and frequency control in the DG units might be necessary on the one hand, and on the other increase in protective relays (switchgears, transformer TAP changers) will have to be implemented, readjusted, and monitored (the number of times necessary) to ensure a stiff grid. Other options include connect directly to the transmission line in Jerez, build a new grid (time consuming and expensive), or the most interesting option, invest in a substation.
A new future for Sanlucar | Alonso Enrique González de Gregorio Viñamata
21
In parallel, over the past years, Endesa has been expanding its natural gas network (transport and distribution) through Andalucia, succeeding to make it a basic energy resource. In the North-west coast of Cadix, although works are still underway, a small portion of gas mainly used for cooking has arrived to Sanlucar de Barrameda. According to interviews carried with the town hall, this should represent a 2% used for cooking or heating. When it comes to renewable energy, the region has already some installations and numerous initiatives of development plans, especially photovoltaics, due to the high potential of solar power (in 2006, in the region 200 MW came from solar thermal and 150 MW from photovoltaics). Sanlucar has a photovoltaic plant with a capacity of 1,8 MW, and solar thermal individual systems equivalent to 3% of the total heating demand. However due to network restriction it is forecasted the expansion will come mainly from solar thermal. In the case of wind some farms already exist and some are under development, none in the Sanlucar municipality. Again besides a high number of project proposals, the network capacity becomes a barrier of entry severely limiting the number of installations to mainly low power small scale ones (isolated installations for individual consumption).
4.1.2 Demand
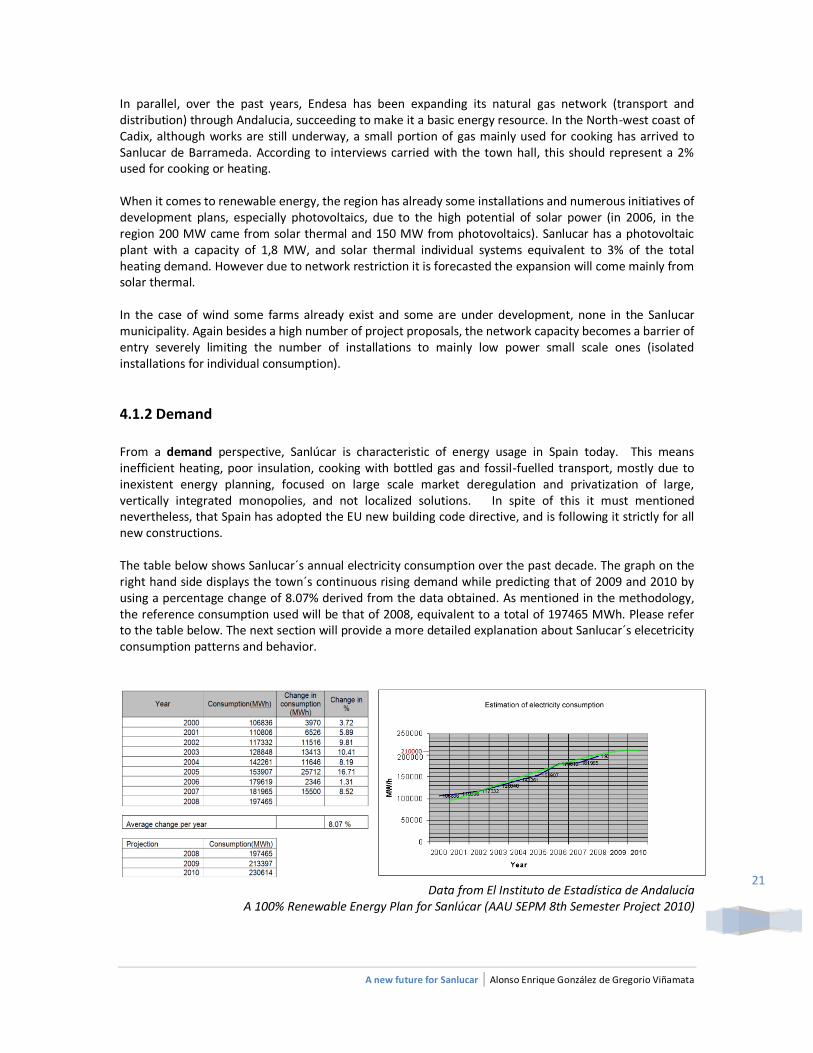
From a demand perspective, Sanlúcar is characteristic of energy usage in Spain today. This means inefficient heating, poor insulation, cooking with bottled gas and fossil-fuelled transport, mostly due to inexistent energy planning, focused on large scale market deregulation and privatization of large, vertically integrated monopolies, and not localized solutions. In spite of this it must mentioned nevertheless, that Spain has adopted the EU new building code directive, and is following it strictly for all new constructions. The table below shows Sanlucar´s annual electricity consumption over the past decade. The graph on the right hand side displays the town´s continuous rising demand while predicting that of 2009 and 2010 by using a percentage change of 8.07% derived from the data obtained. As mentioned in the methodology, the reference consumption used will be that of 2008, equivalent to a total of 197465 MWh. Please refer to the table below. The next section will provide a more detailed explanation about Sanlucar´s elecetricity consumption patterns and behavior.
Data from El Instituto de Estadística de Andalucía A 100% Renewable Energy Plan for Sanlúcar (AAU SEPM 8th Semester Project 2010)
A new future for Sanlucar | Alonso Enrique González de Gregorio Viñamata
22
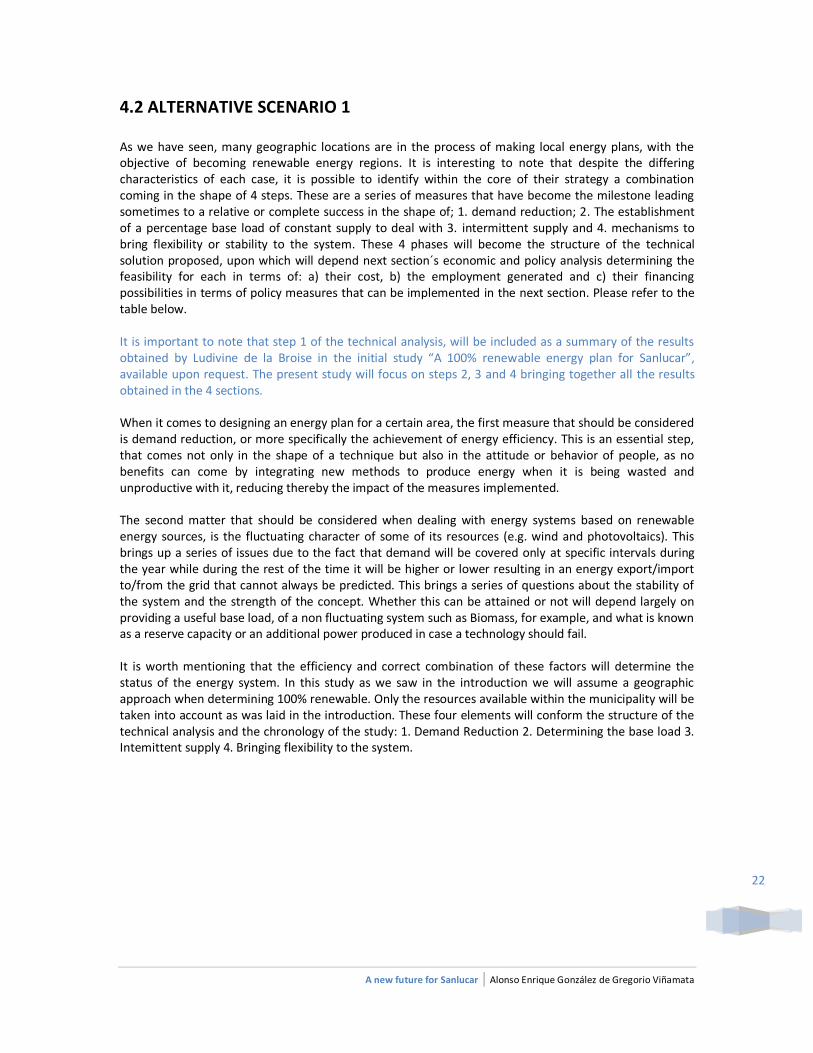
4.2 ALTERNATIVE SCENARIO 1 As we have seen, many geographic locations are in the process of making local energy plans, with the objective of becoming renewable energy regions. It is interesting to note that despite the differing characteristics of each case, it is possible to identify within the core of their strategy a combination coming in the shape of 4 steps. These are a series of measures that have become the milestone leading sometimes to a relative or complete success in the shape of; 1. demand reduction; 2. The establishment of a percentage base load of constant supply to deal with 3. intermittent supply and 4. mechanisms to bring flexibility or stability to the system. These 4 phases will become the structure of the technical solution proposed, upon which will depend next section´s economic and policy analysis determining the feasibility for each in terms of: a) their cost, b) the employment generated and c) their financing possibilities in terms of policy measures that can be implemented in the next section. Please refer to the table below. It is important to note that step 1 of the technical analysis, will be included as a summary of the results obtained by Ludivine de la Broise in the initial study “A 100% renewable energy plan for Sanlucar”, available upon request. The present study will focus on steps 2, 3 and 4 bringing together all the results obtained in the 4 sections. When it comes to designing an energy plan for a certain area, the first measure that should be considered is demand reduction, or more specifically the achievement of energy efficiency. This is an essential step, that comes not only in the shape of a technique but also in the attitude or behavior of people, as no benefits can come by integrating new methods to produce energy when it is being wasted and unproductive with it, reducing thereby the impact of the measures implemented. The second matter that should be considered when dealing with energy systems based on renewable energy sources, is the fluctuating character of some of its resources (e.g. wind and photovoltaics). This brings up a series of issues due to the fact that demand will be covered only at specific intervals during the year while during the rest of the time it will be higher or lower resulting in an energy export/import to/from the grid that cannot always be predicted. This brings a series of questions about the stability of the system and the strength of the concept. Whether this can be attained or not will depend largely on providing a useful base load, of a non fluctuating system such as Biomass, for example, and what is known as a reserve capacity or an additional power produced in case a technology should fail. It is worth mentioning that the efficiency and correct combination of these factors will determine the status of the energy system. In this study as we saw in the introduction we will assume a geographic approach when determining 100% renewable. Only the resources available within the municipality will be taken into account as was laid in the introduction. These four elements will conform the structure of the technical analysis and the chronology of the study: 1. Demand Reduction 2. Determining the base load 3. Intemittent supply 4. Bringing flexibility to the system.
A new future for Sanlucar | Alonso Enrique González de Gregorio Viñamata
23
Diagram made by author
4.2.1 Principle governing the study
To ensure the correct and long-term sustainability, all technological change must take into account the resources and inputs of the region where it is taking place. The reason is not only because by involving all parties (public institutions, cooperatives, start-ups, construction sector, etc) that sytem is guaranteed to perdure, as it is in everyone’s interest, but also because wealth is being created. This translates in the economic development of the region, employment and better autonomy. Tylecotte & Galvao (2001) insist in this point based on the studies of Brasil and Japan, claiming that the change does not only have to include the area’s inputs (natural, human capital), but also those technologies to transform those resources. Therefore, those technologies must be;
Easily absorbed by the current system.
Take into account the activities, practices existing in the region (ameliorating them).
Technologies must contribute to the productivity and growth of the region where they are operating.
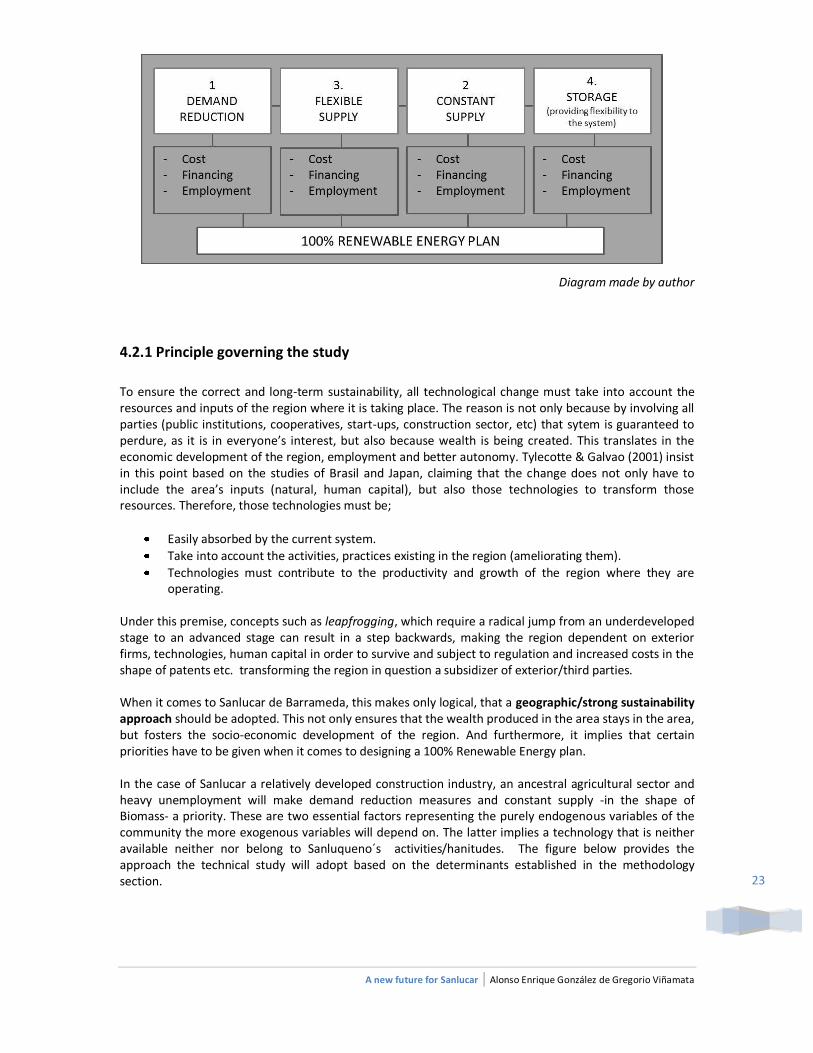
Under this premise, concepts such as leapfrogging, which require a radical jump from an underdeveloped stage to an advanced stage can result in a step backwards, making the region dependent on exterior firms, technologies, human capital in order to survive and subject to regulation and increased costs in the shape of patents etc. transforming the region in question a subsidizer of exterior/third parties. When it comes to Sanlucar de Barrameda, this makes only logical, that a geographic/strong sustainability approach should be adopted. This not only ensures that the wealth produced in the area stays in the area, but fosters the socio-economic development of the region. And furthermore, it implies that certain priorities have to be given when it comes to designing a 100% Renewable Energy plan. In the case of Sanlucar a relatively developed construction industry, an ancestral agricultural sector and heavy unemployment will make demand reduction measures and constant supply -in the shape of Biomass- a priority. These are two essential factors representing the purely endogenous variables of the community the more exogenous variables will depend on. The latter implies a technology that is neither available neither nor belong to Sanluqueno´s activities/hanitudes. The figure below provides the approach the technical study will adopt based on the determinants established in the methodology section.
A new future for Sanlucar | Alonso Enrique González de Gregorio Viñamata
24
Diagram made by author To conclude, it must be mentioned that other studies (Alexander & Hurt 2007) further add the importance of not obstructing the current market cycles when dealing with Renewable Energy production, especially when it comes to Biomass. Cases in China and Brazil are cited where crop production previously dedicated to food, would be redirected to biofuel generation (i.e. soya) leading to undesirable consequences (price inflation, scarcity etc.). This will also be taken into account.
4.2.2 Demand Reduction
With today´s technological advances it is possible to diminish a household´s energy demand by a considerable amount. Nevertheless, under the basis of the principle established the objective here will not imply implementing the latest innovations within the field, but looking for solutions, locally, that adapt to the: economic, social and technologic context of the municipality. A study made by civil engineer Ludivine de la Broise assisted by the author, within the context of AAU 8
th semester project, covers this
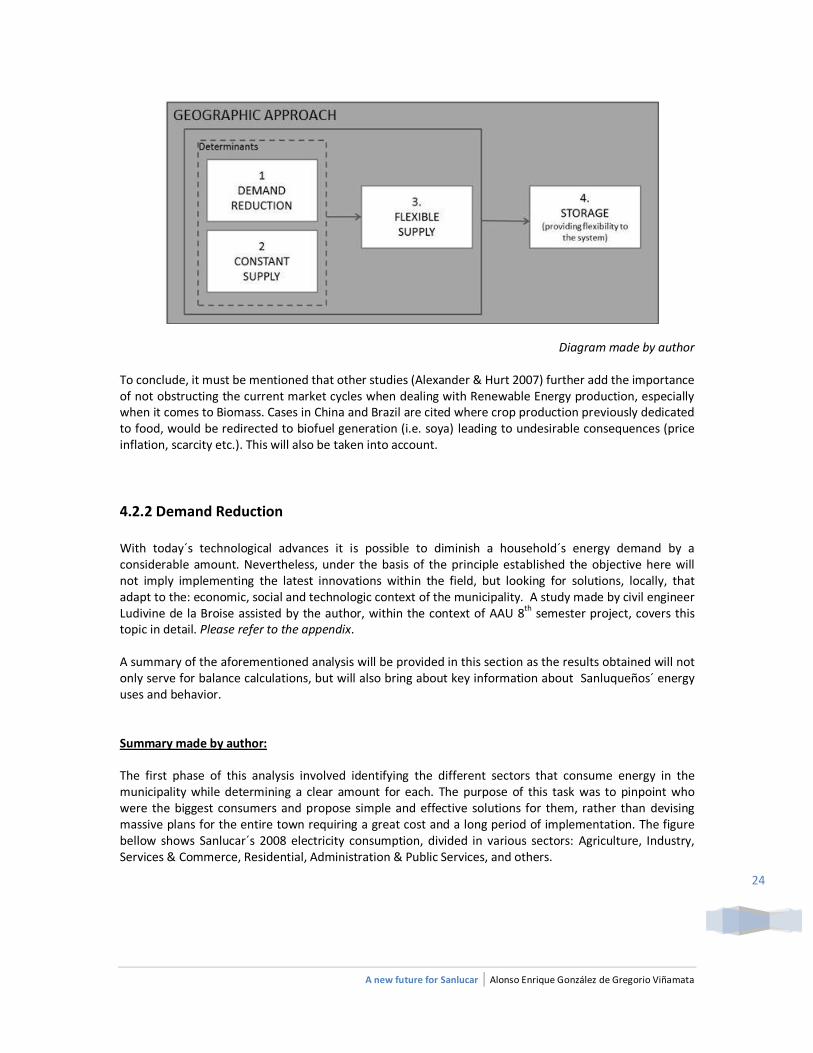
topic in detail. Please refer to the appendix. A summary of the aforementioned analysis will be provided in this section as the results obtained will not only serve for balance calculations, but will also bring about key information about Sanluqueños´ energy uses and behavior. Summary made by author: The first phase of this analysis involved identifying the different sectors that consume energy in the municipality while determining a clear amount for each. The purpose of this task was to pinpoint who were the biggest consumers and propose simple and effective solutions for them, rather than devising massive plans for the entire town requiring a great cost and a long period of implementation. The figure bellow shows Sanlucar´s 2008 electricity consumption, divided in various sectors: Agriculture, Industry, Services & Commerce, Residential, Administration & Public Services, and others.

A new future for Sanlucar | Alonso Enrique González de Gregorio Viñamata
25
Instituto Estadístico de Andalucía: 2008 data A 100% Renewable Energy Plan for Sanlúcar (AAU SEPM 8th Semester Project 2010)
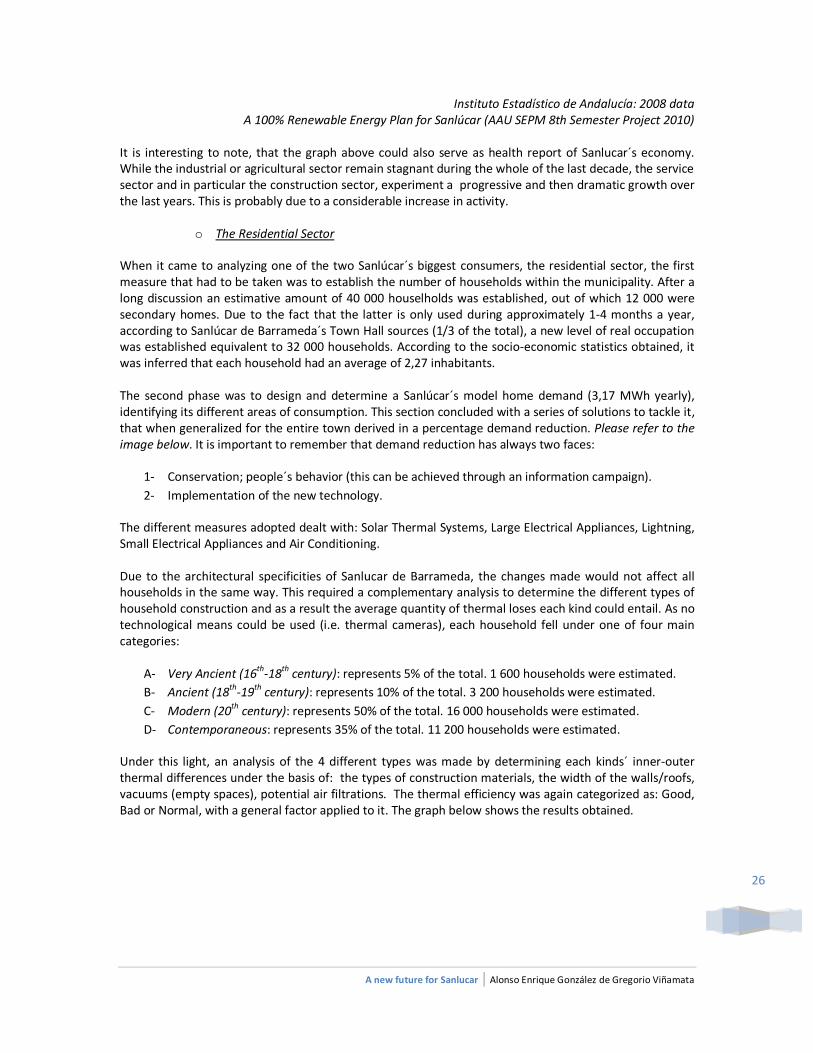
As can be inferred by the figure, the two sectors that consume the most are: the residential sector (51% of the total demand) and the Services & Commerce sector (30% of the total demand). Once added up, they represent no less than 81% of Sanlucar´s total demand. When a retrospective was done by looking at the demand behavior over the past decade (see figure below), this did no longer come as a surprise, as both of them have doubled their demand since 2001. The analysis in the appendix provides a series of possible explanations of how this came about followed by recommendations.
A new future for Sanlucar | Alonso Enrique González de Gregorio Viñamata
26
Instituto Estadístico de Andalucía: 2008 data A 100% Renewable Energy Plan for Sanlúcar (AAU SEPM 8th Semester Project 2010)
It is interesting to note, that the graph above could also serve as health report of Sanlucar´s economy. While the industrial or agricultural sector remain stagnant during the whole of the last decade, the service sector and in particular the construction sector, experiment a progressive and then dramatic growth over the last years. This is probably due to a considerable increase in activity.
o The Residential Sector
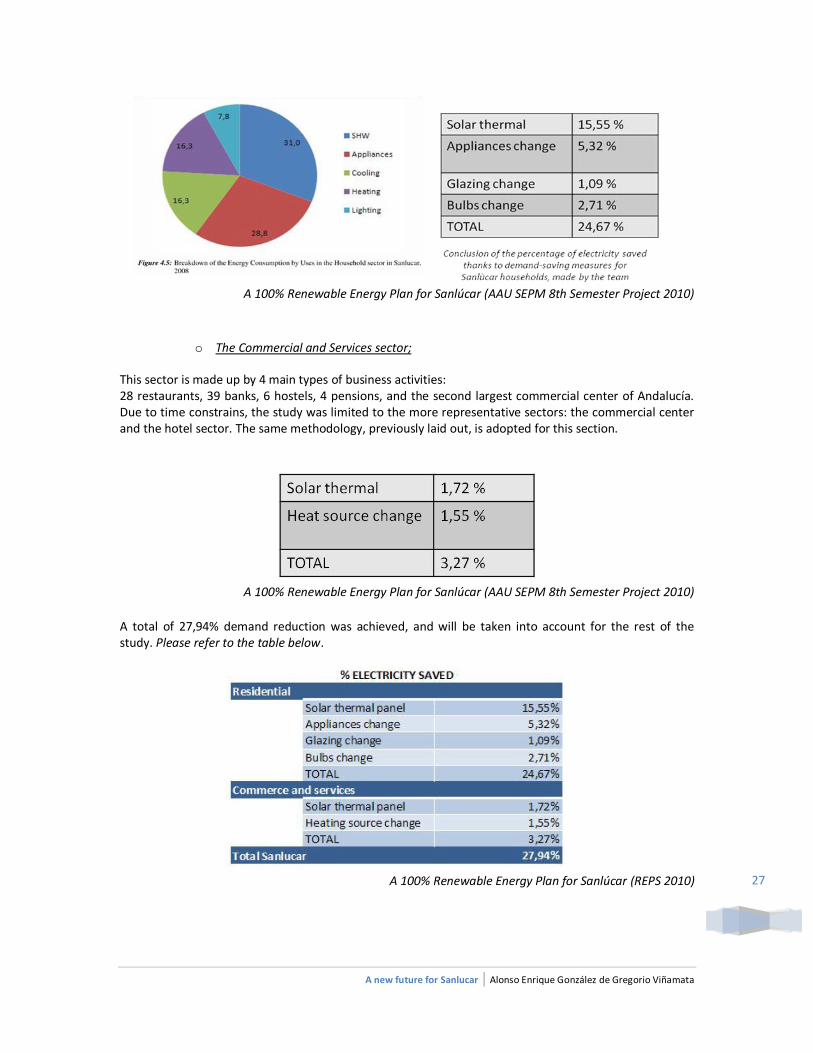
When it came to analyzing one of the two Sanlúcar´s biggest consumers, the residential sector, the first measure that had to be taken was to establish the number of households within the municipality. After a long discussion an estimative amount of 40 000 houselholds was established, out of which 12 000 were secondary homes. Due to the fact that the latter is only used during approximately 1-4 months a year, according to Sanlúcar de Barrameda´s Town Hall sources (1/3 of the total), a new level of real occupation was established equivalent to 32 000 households. According to the socio-economic statistics obtained, it was inferred that each household had an average of 2,27 inhabitants. The second phase was to design and determine a Sanlúcar´s model home demand (3,17 MWh yearly), identifying its different areas of consumption. This section concluded with a series of solutions to tackle it, that when generalized for the entire town derived in a percentage demand reduction. Please refer to the image below. It is important to remember that demand reduction has always two faces:
1- Conservation; people´s behavior (this can be achieved through an information campaign).
2- Implementation of the new technology.
The different measures adopted dealt with: Solar Thermal Systems, Large Electrical Appliances, Lightning, Small Electrical Appliances and Air Conditioning. Due to the architectural specificities of Sanlucar de Barrameda, the changes made would not affect all households in the same way. This required a complementary analysis to determine the different types of household construction and as a result the average quantity of thermal loses each kind could entail. As no technological means could be used (i.e. thermal cameras), each household fell under one of four main categories:
A- Very Ancient (16th-18th century): represents 5% of the total. 1 600 households were estimated.
B- Ancient (18th-19th century): represents 10% of the total. 3 200 households were estimated.
C- Modern (20th century): represents 50% of the total. 16 000 households were estimated.
D- Contemporaneous: represents 35% of the total. 11 200 households were estimated.
Under this light, an analysis of the 4 different types was made by determining each kinds´ inner-outer thermal differences under the basis of: the types of construction materials, the width of the walls/roofs, vacuums (empty spaces), potential air filtrations. The thermal efficiency was again categorized as: Good, Bad or Normal, with a general factor applied to it. The graph below shows the results obtained.
A new future for Sanlucar | Alonso Enrique González de Gregorio Viñamata
27
A 100% Renewable Energy Plan for Sanlúcar (AAU SEPM 8th Semester Project 2010)
o The Commercial and Services sector;
This sector is made up by 4 main types of business activities: 28 restaurants, 39 banks, 6 hostels, 4 pensions, and the second largest commercial center of Andalucía. Due to time constrains, the study was limited to the more representative sectors: the commercial center and the hotel sector. The same methodology, previously laid out, is adopted for this section.
A 100% Renewable Energy Plan for Sanlúcar (AAU SEPM 8th Semester Project 2010)
A total of 27,94% demand reduction was achieved, and will be taken into account for the rest of the study. Please refer to the table below.
A 100% Renewable Energy Plan for Sanlúcar (REPS 2010)
A new future for Sanlucar | Alonso Enrique González de Gregorio Viñamata
28
4.2.3 Constant Supply
From a purely technical point of view, when the supply of energy is subject to external variables that are uncontrollable or unpredictable, such as the climate, a minimum percentage base load of the total energy demand coming from a non-fluctuating or intermittent energy resource is highly recommendable. This factor is essential, as should there be a sudden shortage in the energy supply coming from other sources, a minimum of the total energy demand could be guaranteed or covered most of the time. It has been assumed that the energy systems considered should contain a minimum base load of 30%, and this can come from a variety of sources such as nuclear, coal, natural gas, biomass, etc. (REPS 2010) As it was previously pointed out, besides wind and photovoltaic energy Sanlucar de Barrameda has a deep fishing and agricultural tradition that goes back to fenician times, making Biomass an essential element to consider. Until the present day Biomass in the shape of the vine, cereal growth, or fishing, not only represents Sanlúcar main economic activity and food resource, but also has become inextricably linked to Sanluqueños lifestyle and culture, which makes this the core input in the technical analysis of this study according to the principle of the study. (REPS 2010). In this chapter we will analyze the Biomass resources identifying on one hand what is available in the area and on the other the potential for new resources in the area in the shape of energy crops, all with the purpose of providing a useful and reliable base load.
Definition of terms:
Bioenergy many times is defined as the energy - in form of heat, electricity, cooling and fuels - resulting of biomass conversion. (Ralph E. H. Sims, aebiom.org). Sims in his book "The Brilliance of Bioenergy" states that bioenergy is the energy gain from biomass. He defines biomass as "recent organic matter originally derived from plants as a result of the photosynthetic conversion process or from animals, and which is destined to be utilized as a store of chemical energy to provide heat, electricity or transport fuels." (Ralph E. H. Sims, 2002) (REPS 2010) Other authors say that "biomass is a very broad term covering a wide range of plan and animal materials that can be seen as energy source, thus its definition usually depends on the context in which it is used for" (D.Brenes, 2006).The European Biomass Association (AEBIOM) says "Biomass refers to renewable energy coming from biological material such as trees, plants, manure, and sometimes waste". A more detailed definition is given by directive no. 2009/28/EC of EU regarding renewable energy : "Biomass means the biodegradable fraction of products, wastes and residues from biological origin from agriculture (including vegetable and animal substances), forestry and related industries including fisheries and aquaculture, as well as the biodegradable fraction of industrial and municipal waste". This statement in itself gives also a categorization of different type of biomass. (REPS 2010). Both Sims and Brenes as a first criteria distinguish woody and non-woody biomass. The European Biomass Association distinguishes three types of biomass: 1 - forest and wood-based biomass, 2 - biomass from agriculture, 3 - biodegradable wastes. The same approach has the FAO establishing the classification of biomass resources. In function of the site where biomass is produced it is distinguished biomass connected to forest, agricultural and municipal activity and a more detailed classification is established. (REPS 2010). It is worth mentioning that many of the above mentioned sources accept that there is confusion regarding what the terms biomass and biofuel covers and can be used interchangeably. In case of Sanlúcar the aim of using bioenergy is to use renewable energy, a distinction between renewable and non-renewable municipal solid waste can be made and just the renewable part of the total municipal solid waste can be considered as a resource for bioenergy potential estimation. (REPS 2010).
A new future for Sanlucar | Alonso Enrique González de Gregorio Viñamata
29
Prior to the technical analysis, a study to define all the biomass resources was carried with the aim of identifying first the feasibility of using biomass as a potential for base load, and second, within the different categories of Biomass available, what sources were worth exploiting under the terms of availability and readiness to use.
4.2.3.1 Biomass resource analysis:
The uncertainty concerning the availability of resources for investors who could not guarantee the provision (i.e. contracts with suppliers have a maximum of 5 year validity), coupled with the lack of information and risk perceived by producers from switching from traditional to energy crop growth makes the situation relatively unstable still today. As a result when taking into account Biomass for energy conversion four conditions will have to be carefully weighed in order to determine whether this option should be considered.
1) Determining the availability of the resource of Biomass to produce the energy required. 2) Identifying if the market is reliable and can assure thereby the constant provision of Biomass. 3) That the price of Biomass is lower than that of traditional sources of energy. 4) That the use of the resource will not interrupt in a negative way the normal market flow or
economic activities being carried in the region.
These factors have characterized the slow down in the introduction of Biomass as an energy source in the Spanish market. In the case of Sanlucar, as we will see, the municipality does not only comply with these conditions, but in addition incurs loses by trying to eliminate its own potential energy fuel, biomass. When it comes to identify Biomass resources in Sanlucar de Barrameda, an analysis was carried under the terms of resource availability and readiness to use in order to determine the potential of the different resources available. In this analysis several options were considered, these included agrofuels in solid (i.e. straws) and liquid form (i.e. animal manure, fishing waste) and organic Municipal Waste both in liquid and solid form. The potential for energy crops was added later. (REPS 2010). After a thorough study it was concluded that; the small quantity of livestock in the area, (characterized mainly by poultry and to a small extent by ovine and bovine (IEA Junta de Andalucía, 1999), the lack of data concerning fish waste, the treatment process put in place to deal with sewage, and the little forestry (bagasse) being produced, made it relatively complicated to use these resources. As a result, the exploitation of Organic Municipal Solid Waste and Agrofuel in solid form became the most interesting options to consider. (REPS 2010). Nevertheless, it should be pointed out that further exploration should be made, as utilization of manure, especially combined with fish waste can be an interesting complement at an individual level for the production of Biogas. It is worth mentioning relatively easy to use technologies are available at small scale. (REPS 2010).
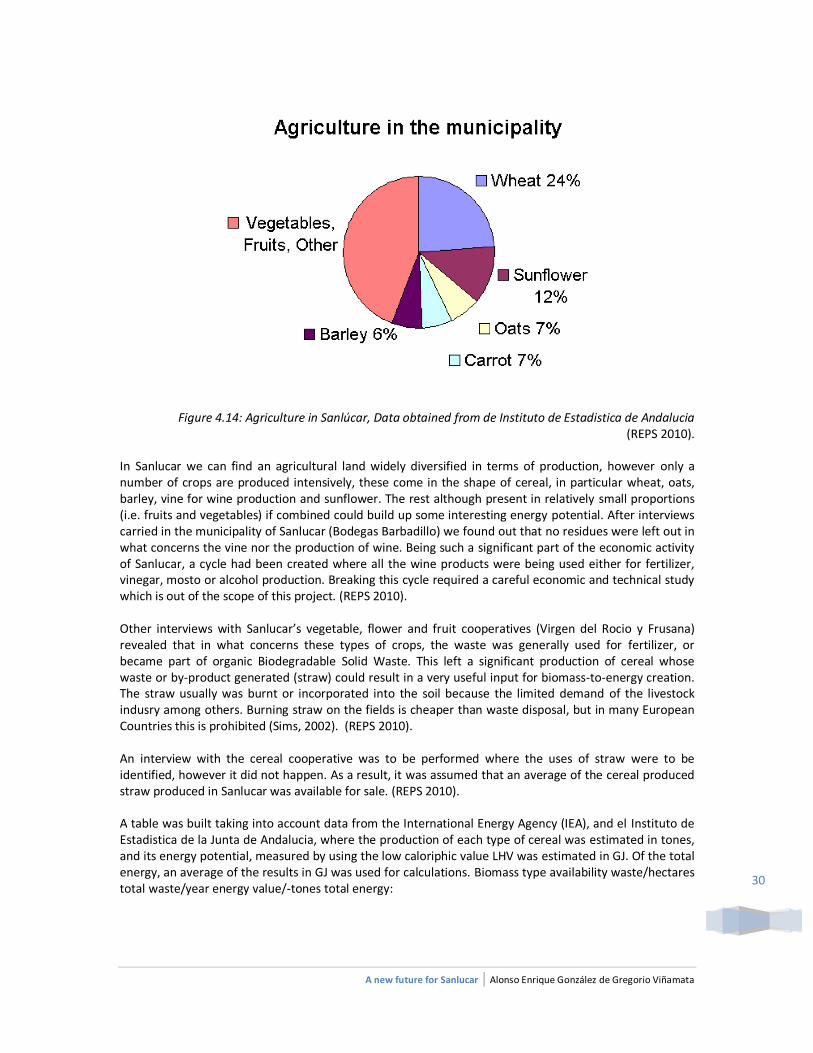
Agrofuels: On the pie-chart below can be seen that cereals (wheat, oats and barley) makes up 37% of the total hectares cultivated in the municipality. 12% is made up by sunflower, 7% by carrots. On the remaining 44% of the agricultural fields are cultivated other 32 type of plants, mainly fruits and vegetables, where each of them makes up less than 5% of the total hectares under cultivation in the municipality. (REPS 2010).
A new future for Sanlucar | Alonso Enrique González de Gregorio Viñamata
30
Figure 4.14: Agriculture in Sanlúcar, Data obtained from de Instituto de Estadistica de Andalucia (REPS 2010).
In Sanlucar we can find an agricultural land widely diversified in terms of production, however only a number of crops are produced intensively, these come in the shape of cereal, in particular wheat, oats, barley, vine for wine production and sunflower. The rest although present in relatively small proportions (i.e. fruits and vegetables) if combined could build up some interesting energy potential. After interviews carried in the municipality of Sanlucar (Bodegas Barbadillo) we found out that no residues were left out in what concerns the vine nor the production of wine. Being such a significant part of the economic activity of Sanlucar, a cycle had been created where all the wine products were being used either for fertilizer, vinegar, mosto or alcohol production. Breaking this cycle required a careful economic and technical study which is out of the scope of this project. (REPS 2010). Other interviews with Sanlucar’s vegetable, flower and fruit cooperatives (Virgen del Rocio y Frusana) revealed that in what concerns these types of crops, the waste was generally used for fertilizer, or became part of organic Biodegradable Solid Waste. This left a significant production of cereal whose waste or by-product generated (straw) could result in a very useful input for biomass-to-energy creation. The straw usually was burnt or incorporated into the soil because the limited demand of the livestock indusry among others. Burning straw on the fields is cheaper than waste disposal, but in many European Countries this is prohibited (Sims, 2002). (REPS 2010). An interview with the cereal cooperative was to be performed where the uses of straw were to be identified, however it did not happen. As a result, it was assumed that an average of the cereal produced straw produced in Sanlucar was available for sale. (REPS 2010). A table was built taking into account data from the International Energy Agency (IEA), and el Instituto de Estadistica de la Junta de Andalucia, where the production of each type of cereal was estimated in tones, and its energy potential, measured by using the low caloriphic value LHV was estimated in GJ. Of the total energy, an average of the results in GJ was used for calculations. Biomass type availability waste/hectares total waste/year energy value/-tones total energy:
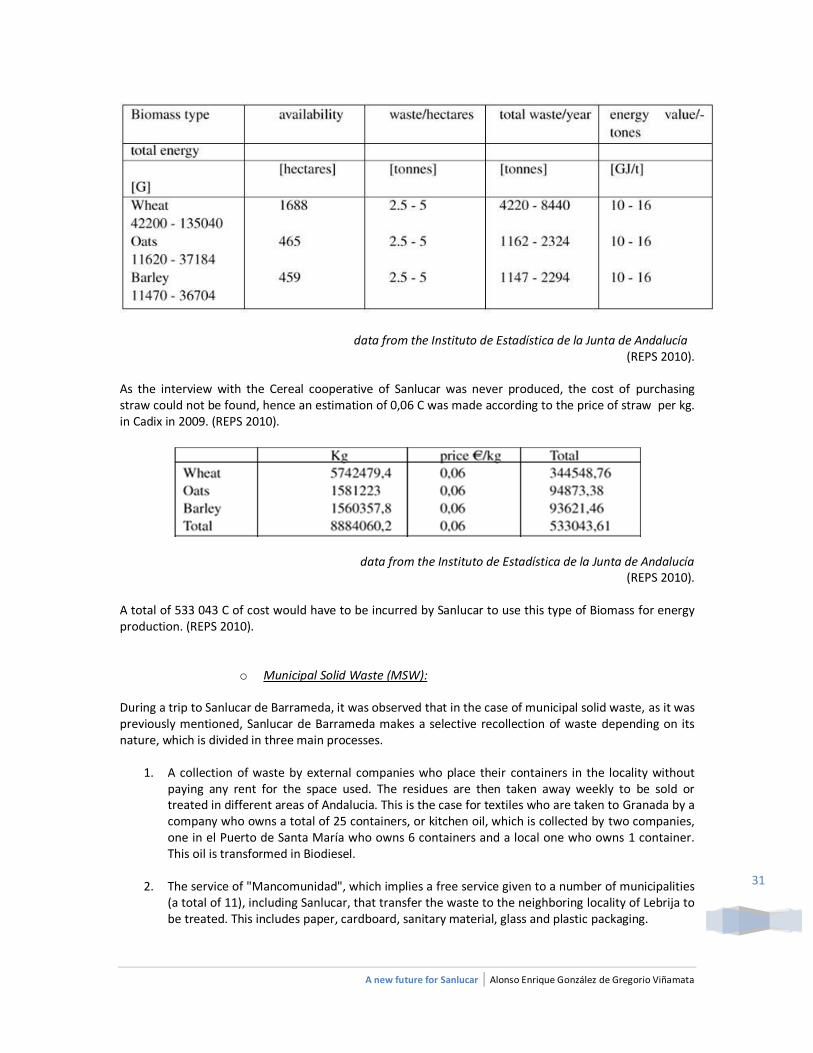
A new future for Sanlucar | Alonso Enrique González de Gregorio Viñamata
31
data from the Instituto de Estadística de la Junta de Andalucía (REPS 2010).
As the interview with the Cereal cooperative of Sanlucar was never produced, the cost of purchasing straw could not be found, hence an estimation of 0,06 C was made according to the price of straw per kg. in Cadix in 2009. (REPS 2010).
data from the Instituto de Estadística de la Junta de Andalucía (REPS 2010).
A total of 533 043 C of cost would have to be incurred by Sanlucar to use this type of Biomass for energy production. (REPS 2010).
o Municipal Solid Waste (MSW):
During a trip to Sanlucar de Barrameda, it was observed that in the case of municipal solid waste, as it was previously mentioned, Sanlucar de Barrameda makes a selective recollection of waste depending on its nature, which is divided in three main processes.
1. A collection of waste by external companies who place their containers in the locality without paying any rent for the space used. The residues are then taken away weekly to be sold or treated in different areas of Andalucia. This is the case for textiles who are taken to Granada by a company who owns a total of 25 containers, or kitchen oil, which is collected by two companies, one in el Puerto de Santa María who owns 6 containers and a local one who owns 1 container. This oil is transformed in Biodiesel.
2. The service of "Mancomunidad", which implies a free service given to a number of municipalities
(a total of 11), including Sanlucar, that transfer the waste to the neighboring locality of Lebrija to be treated. This includes paper, cardboard, sanitary material, glass and plastic packaging.
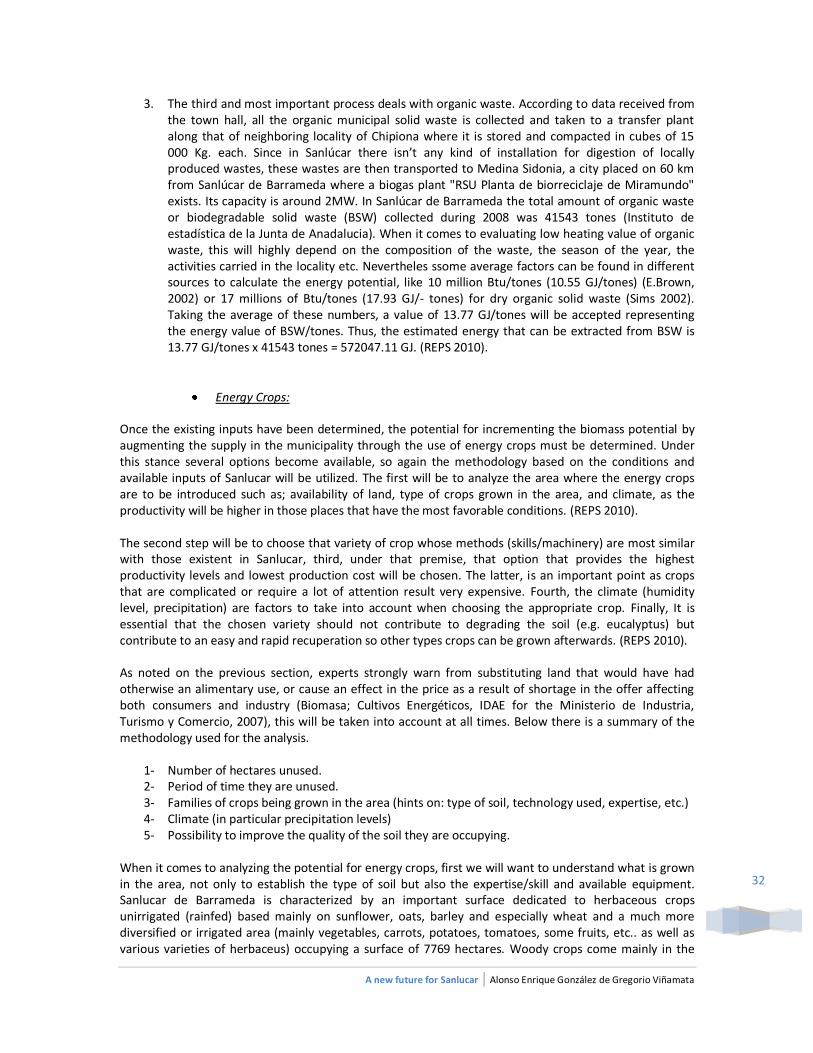
A new future for Sanlucar | Alonso Enrique González de Gregorio Viñamata
32
3. The third and most important process deals with organic waste. According to data received from the town hall, all the organic municipal solid waste is collected and taken to a transfer plant along that of neighboring locality of Chipiona where it is stored and compacted in cubes of 15 000 Kg. each. Since in Sanlúcar there isn’t any kind of installation for digestion of locally produced wastes, these wastes are then transported to Medina Sidonia, a city placed on 60 km from Sanlúcar de Barrameda where a biogas plant "RSU Planta de biorreciclaje de Miramundo" exists. Its capacity is around 2MW. In Sanlúcar de Barrameda the total amount of organic waste or biodegradable solid waste (BSW) collected during 2008 was 41543 tones (Instituto de estadística de la Junta de Anadalucia). When it comes to evaluating low heating value of organic waste, this will highly depend on the composition of the waste, the season of the year, the activities carried in the locality etc. Nevertheles ssome average factors can be found in different sources to calculate the energy potential, like 10 million Btu/tones (10.55 GJ/tones) (E.Brown, 2002) or 17 millions of Btu/tones (17.93 GJ/- tones) for dry organic solid waste (Sims 2002). Taking the average of these numbers, a value of 13.77 GJ/tones will be accepted representing the energy value of BSW/tones. Thus, the estimated energy that can be extracted from BSW is 13.77 GJ/tones x 41543 tones = 572047.11 GJ. (REPS 2010).
Energy Crops: Once the existing inputs have been determined, the potential for incrementing the biomass potential by augmenting the supply in the municipality through the use of energy crops must be determined. Under this stance several options become available, so again the methodology based on the conditions and available inputs of Sanlucar will be utilized. The first will be to analyze the area where the energy crops are to be introduced such as; availability of land, type of crops grown in the area, and climate, as the productivity will be higher in those places that have the most favorable conditions. (REPS 2010). The second step will be to choose that variety of crop whose methods (skills/machinery) are most similar with those existent in Sanlucar, third, under that premise, that option that provides the highest productivity levels and lowest production cost will be chosen. The latter, is an important point as crops that are complicated or require a lot of attention result very expensive. Fourth, the climate (humidity level, precipitation) are factors to take into account when choosing the appropriate crop. Finally, It is essential that the chosen variety should not contribute to degrading the soil (e.g. eucalyptus) but contribute to an easy and rapid recuperation so other types crops can be grown afterwards. (REPS 2010). As noted on the previous section, experts strongly warn from substituting land that would have had otherwise an alimentary use, or cause an effect in the price as a result of shortage in the offer affecting both consumers and industry (Biomasa; Cultivos Energéticos, IDAE for the Ministerio de Industria, Turismo y Comercio, 2007), this will be taken into account at all times. Below there is a summary of the methodology used for the analysis.
1- Number of hectares unused. 2- Period of time they are unused. 3- Families of crops being grown in the area (hints on: type of soil, technology used, expertise, etc.) 4- Climate (in particular precipitation levels) 5- Possibility to improve the quality of the soil they are occupying.
When it comes to analyzing the potential for energy crops, first we will want to understand what is grown in the area, not only to establish the type of soil but also the expertise/skill and available equipment. Sanlucar de Barrameda is characterized by an important surface dedicated to herbaceous crops unirrigated (rainfed) based mainly on sunflower, oats, barley and especially wheat and a much more diversified or irrigated area (mainly vegetables, carrots, potatoes, tomatoes, some fruits, etc.. as well as various varieties of herbaceus) occupying a surface of 7769 hectares. Woody crops come mainly in the
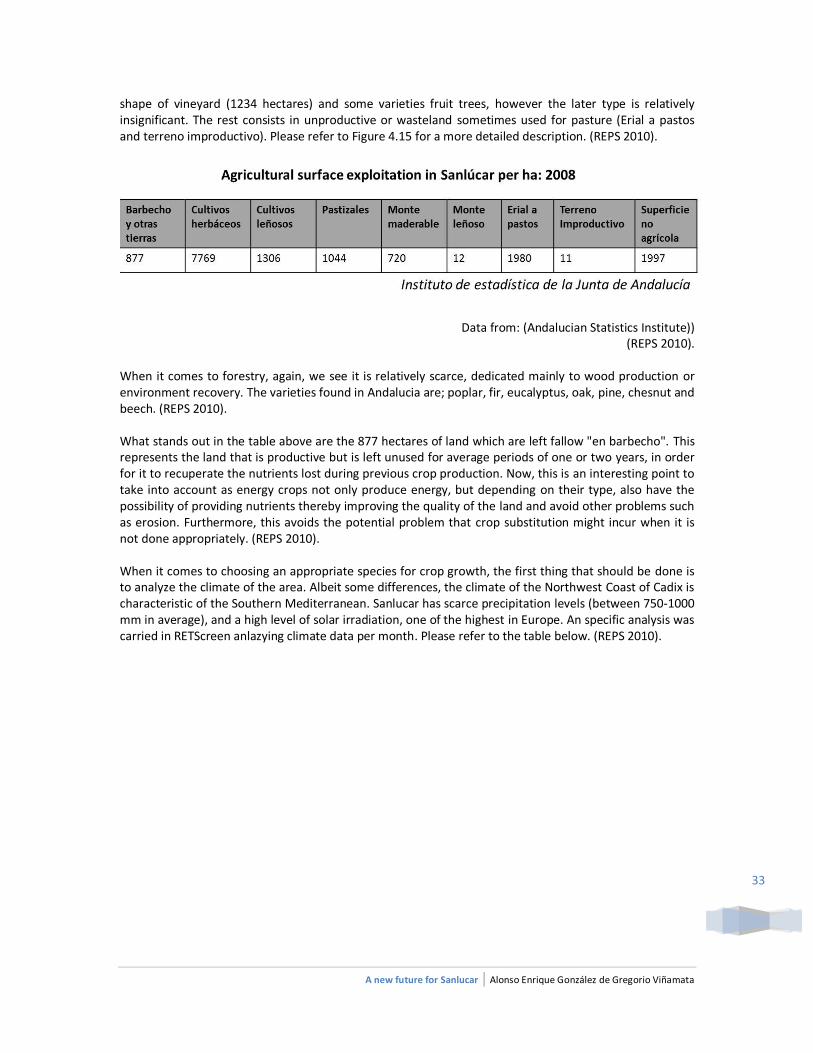
A new future for Sanlucar | Alonso Enrique González de Gregorio Viñamata
33
shape of vineyard (1234 hectares) and some varieties fruit trees, however the later type is relatively insignificant. The rest consists in unproductive or wasteland sometimes used for pasture (Erial a pastos and terreno improductivo). Please refer to Figure 4.15 for a more detailed description. (REPS 2010).
Data from: (Andalucian Statistics Institute)) (REPS 2010).
When it comes to forestry, again, we see it is relatively scarce, dedicated mainly to wood production or environment recovery. The varieties found in Andalucia are; poplar, fir, eucalyptus, oak, pine, chesnut and beech. (REPS 2010). What stands out in the table above are the 877 hectares of land which are left fallow "en barbecho". This represents the land that is productive but is left unused for average periods of one or two years, in order for it to recuperate the nutrients lost during previous crop production. Now, this is an interesting point to take into account as energy crops not only produce energy, but depending on their type, also have the possibility of providing nutrients thereby improving the quality of the land and avoid other problems such as erosion. Furthermore, this avoids the potential problem that crop substitution might incur when it is not done appropriately. (REPS 2010). When it comes to choosing an appropriate species for crop growth, the first thing that should be done is to analyze the climate of the area. Albeit some differences, the climate of the Northwest Coast of Cadix is characteristic of the Southern Mediterranean. Sanlucar has scarce precipitation levels (between 750-1000 mm in average), and a high level of solar irradiation, one of the highest in Europe. An specific analysis was carried in RETScreen anlazying climate data per month. Please refer to the table below. (REPS 2010).
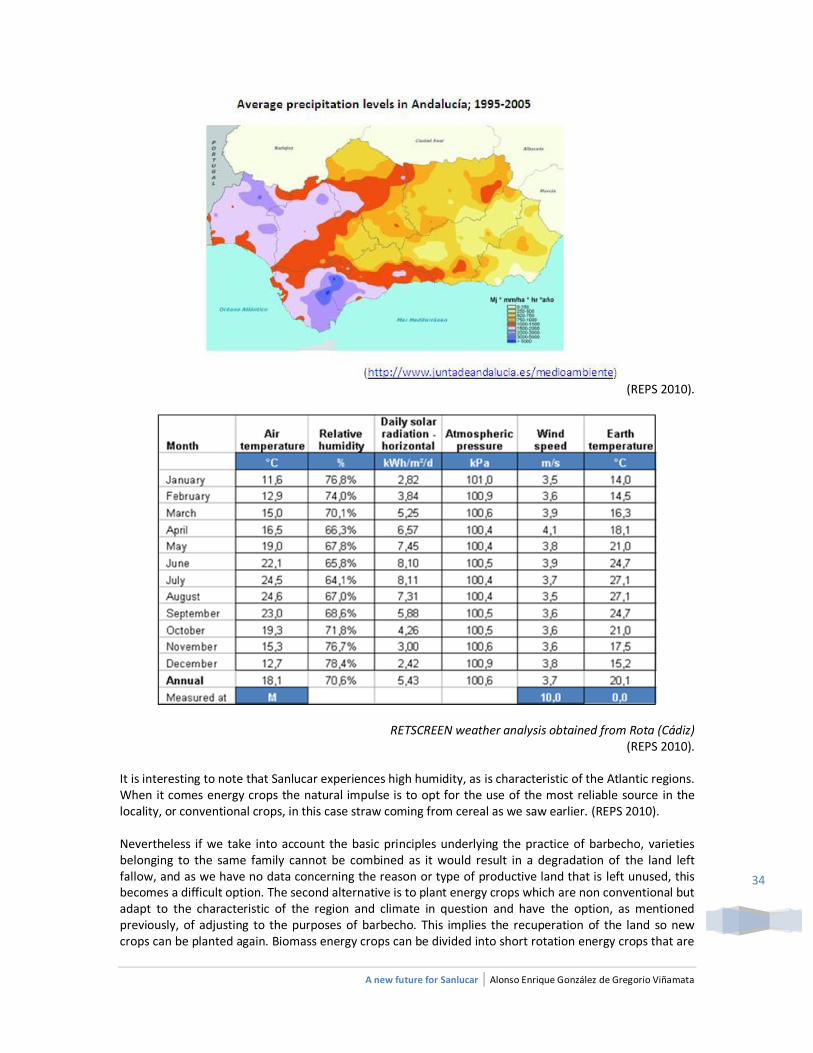
A new future for Sanlucar | Alonso Enrique González de Gregorio Viñamata
34
(REPS 2010).
RETSCREEN weather analysis obtained from Rota (Cádiz) (REPS 2010).
It is interesting to note that Sanlucar experiences high humidity, as is characteristic of the Atlantic regions. When it comes energy crops the natural impulse is to opt for the use of the most reliable source in the locality, or conventional crops, in this case straw coming from cereal as we saw earlier. (REPS 2010). Nevertheless if we take into account the basic principles underlying the practice of barbecho, varieties belonging to the same family cannot be combined as it would result in a degradation of the land left fallow, and as we have no data concerning the reason or type of productive land that is left unused, this becomes a difficult option. The second alternative is to plant energy crops which are non conventional but adapt to the characteristic of the region and climate in question and have the option, as mentioned previously, of adjusting to the purposes of barbecho. This implies the recuperation of the land so new crops can be planted again. Biomass energy crops can be divided into short rotation energy crops that are
A new future for Sanlucar | Alonso Enrique González de Gregorio Viñamata
35
harvested on a cycle of anything from 2 to 20 years depending on the crop and the system and herbaceous energy crops that are harvested annually. (REPS 2010). When it comes to the locality of Sanlucar, the most suitable option is to use herbaceus crops as they pose strong similarities in type, planting and harvesting, implying thereby high suitability in terms of skill and equipment, as well as adjusting to the "barbecho" time frame posing little challenge to the original structure of farm lands. Brassica carinata or Cyara cardunculus, similar to the Spanish "cardo" but modified genetically to increase its yields, are two options that have been already tested in Spain for our purpose and are characteristic of southern Mediterranean climates. Each of these options will be analyzed in the following paragraphs. (REPS 2010). Brasica Carinata is a mustard crop originally from Ethiopia that has shown high adaptation in Mediterranean climate countries such as Spain, Greece and Italy. It is characteristic of a large biomass production which integrates very well in rotations being even more profitable than a year of barbecho as it enhances the quality of the soil. This factor not only makes Brasica Carinata suitable, but also economically sustainable, as it increases productivity specially in cereal while reducing the use in fertilizers - hence reducing emissions- (Dopazo et al. 2007 ) a type of crop so common in the locality, please see table below. (REPS 2010). The sowing of this type is recommended between mid-september to mid-october, so it can reach winter with a relatively well developed body. The depth of the seed needs to be superficial, non exceeding the 2 cm., and a total dose of 150 seeds/m2 is recommended (6Kg/ha) while the ideal separation between lines should be between 15-30 cm. Now, when it comes to the harvest of this type of herbaceus crop is performed prior to the grain formation, when the siliquas are being formed. There are two reasons for this, the first the humidity content will be lower (initial content of 60-80%) and secondly we are not interested in the development of the reproductive capacity of the plant but rather on its vegetative part, the part that will produce the straw residue to utilize for energy. Once recollected, the biomass is generally left to dry in the field achieving 15% of humidity content prior to be compacted in pallet. (REPS 2010). Conventional machinery used for cereal can be used for its recollection, non-requiring any specific investment from farmers however. It is important to take into account that some loses will be incurred in the process of harvest, packing and manipulation. Previous experiences, such as in the region of Navarra, point out that less biomass is lost if appropriate equipment is used. ("Biomasa, cultivos energéticos", estudio del Ministerio de Industria, turismo y comerdio 2007). (REPS 2010). Brassica carinata adapts itself well to rainfed and semi-irrigated areas, which also interesting for Sanlucar, and has a production of 6-8 tone of Biomass per hectare with 15% humidity level. Storage is generally recommended, nevertheless given the scarce level of precipitation this can be easily be done in the field by using a protective plastic layer, this is important as it will influence positively in the low heating value. The Operation and Maintenance costs require a similar treatment as that carried with Barley, already present in the region with the exception it requires a higher level of sulphur, Herbicides will also be necessary, similar to those required for Colza.("Biomasa, cultivos energéticos", estudio del Ministerio de Industria, turismo y comerdio 2007). (REPS 2010). Cynara cardunculus is an interesting option to combine with Brasica Carinata in the sense that it yields more tones of biomass, has a higher caloriphic content and is already existent in Sanlucar, although not used for any specific purpose. Cynara Cardunculus is a species that adapts very well to the Mediterranean climate, especially very dry and hot summers, as well as unirrigated/dry land, it only needs a minimum precipitation (ideally 500 mm per year) especially during spring, its active growing period. The reason why is that it has a root system that expands various meters below the surface (both widely and profoundly) enabling the plant to reach underground water as well as other nutrients. (REPS 2010).
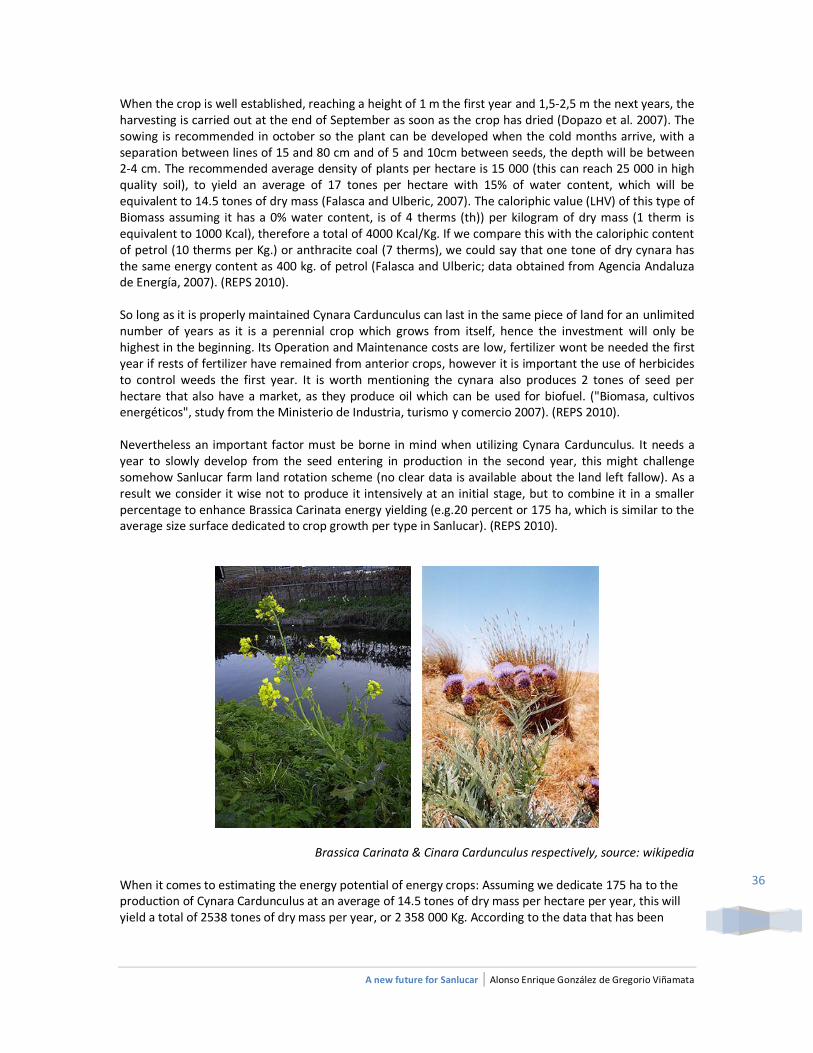
A new future for Sanlucar | Alonso Enrique González de Gregorio Viñamata
36
When the crop is well established, reaching a height of 1 m the first year and 1,5-2,5 m the next years, the harvesting is carried out at the end of September as soon as the crop has dried (Dopazo et al. 2007). The sowing is recommended in october so the plant can be developed when the cold months arrive, with a separation between lines of 15 and 80 cm and of 5 and 10cm between seeds, the depth will be between 2-4 cm. The recommended average density of plants per hectare is 15 000 (this can reach 25 000 in high quality soil), to yield an average of 17 tones per hectare with 15% of water content, which will be equivalent to 14.5 tones of dry mass (Falasca and Ulberic, 2007). The caloriphic value (LHV) of this type of Biomass assuming it has a 0% water content, is of 4 therms (th)) per kilogram of dry mass (1 therm is equivalent to 1000 Kcal), therefore a total of 4000 Kcal/Kg. If we compare this with the caloriphic content of petrol (10 therms per Kg.) or anthracite coal (7 therms), we could say that one tone of dry cynara has the same energy content as 400 kg. of petrol (Falasca and Ulberic; data obtained from Agencia Andaluza de Energía, 2007). (REPS 2010). So long as it is properly maintained Cynara Cardunculus can last in the same piece of land for an unlimited number of years as it is a perennial crop which grows from itself, hence the investment will only be highest in the beginning. Its Operation and Maintenance costs are low, fertilizer wont be needed the first year if rests of fertilizer have remained from anterior crops, however it is important the use of herbicides to control weeds the first year. It is worth mentioning the cynara also produces 2 tones of seed per hectare that also have a market, as they produce oil which can be used for biofuel. ("Biomasa, cultivos energéticos", study from the Ministerio de Industria, turismo y comercio 2007). (REPS 2010). Nevertheless an important factor must be borne in mind when utilizing Cynara Cardunculus. It needs a year to slowly develop from the seed entering in production in the second year, this might challenge somehow Sanlucar farm land rotation scheme (no clear data is available about the land left fallow). As a result we consider it wise not to produce it intensively at an initial stage, but to combine it in a smaller percentage to enhance Brassica Carinata energy yielding (e.g.20 percent or 175 ha, which is similar to the average size surface dedicated to crop growth per type in Sanlucar). (REPS 2010).
Brassica Carinata & Cinara Cardunculus respectively, source: wikipedia When it comes to estimating the energy potential of energy crops: Assuming we dedicate 175 ha to the production of Cynara Cardunculus at an average of 14.5 tones of dry mass per hectare per year, this will yield a total of 2538 tones of dry mass per year, or 2 358 000 Kg. According to the data that has been
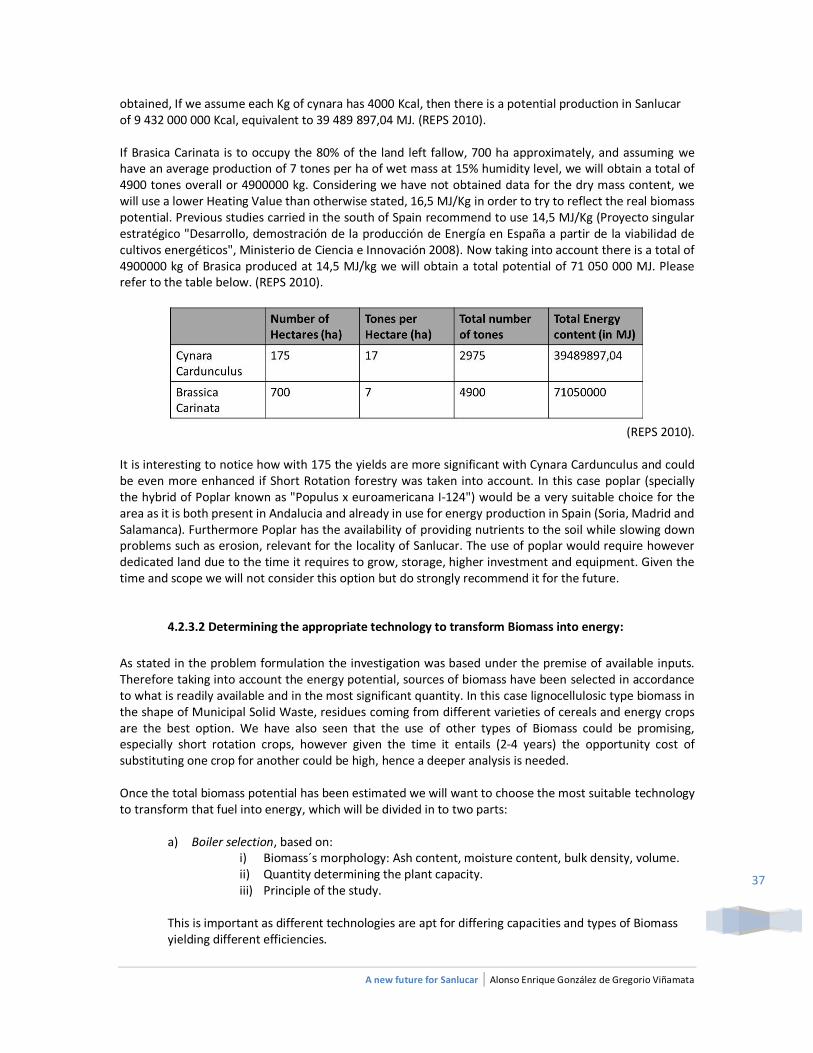
A new future for Sanlucar | Alonso Enrique González de Gregorio Viñamata
37
obtained, If we assume each Kg of cynara has 4000 Kcal, then there is a potential production in Sanlucar of 9 432 000 000 Kcal, equivalent to 39 489 897,04 MJ. (REPS 2010). If Brasica Carinata is to occupy the 80% of the land left fallow, 700 ha approximately, and assuming we have an average production of 7 tones per ha of wet mass at 15% humidity level, we will obtain a total of 4900 tones overall or 4900000 kg. Considering we have not obtained data for the dry mass content, we will use a lower Heating Value than otherwise stated, 16,5 MJ/Kg in order to try to reflect the real biomass potential. Previous studies carried in the south of Spain recommend to use 14,5 MJ/Kg (Proyecto singular estratégico "Desarrollo, demostración de la producción de Energía en España a partir de la viabilidad de cultivos energéticos", Ministerio de Ciencia e Innovación 2008). Now taking into account there is a total of 4900000 kg of Brasica produced at 14,5 MJ/kg we will obtain a total potential of 71 050 000 MJ. Please refer to the table below. (REPS 2010).
(REPS 2010).
It is interesting to notice how with 175 the yields are more significant with Cynara Cardunculus and could be even more enhanced if Short Rotation forestry was taken into account. In this case poplar (specially the hybrid of Poplar known as "Populus x euroamericana I-124") would be a very suitable choice for the area as it is both present in Andalucia and already in use for energy production in Spain (Soria, Madrid and Salamanca). Furthermore Poplar has the availability of providing nutrients to the soil while slowing down problems such as erosion, relevant for the locality of Sanlucar. The use of poplar would require however dedicated land due to the time it requires to grow, storage, higher investment and equipment. Given the time and scope we will not consider this option but do strongly recommend it for the future.
4.2.3.2 Determining the appropriate technology to transform Biomass into energy:
As stated in the problem formulation the investigation was based under the premise of available inputs. Therefore taking into account the energy potential, sources of biomass have been selected in accordance to what is readily available and in the most significant quantity. In this case lignocellulosic type biomass in the shape of Municipal Solid Waste, residues coming from different varieties of cereals and energy crops are the best option. We have also seen that the use of other types of Biomass could be promising, especially short rotation crops, however given the time it entails (2-4 years) the opportunity cost of substituting one crop for another could be high, hence a deeper analysis is needed. Once the total biomass potential has been estimated we will want to choose the most suitable technology to transform that fuel into energy, which will be divided in to two parts:
a) Boiler selection, based on:
i) Biomass´s morphology: Ash content, moisture content, bulk density, volume. ii) Quantity determining the plant capacity. iii) Principle of the study.
This is important as different technologies are apt for differing capacities and types of Biomass yielding different efficiencies.
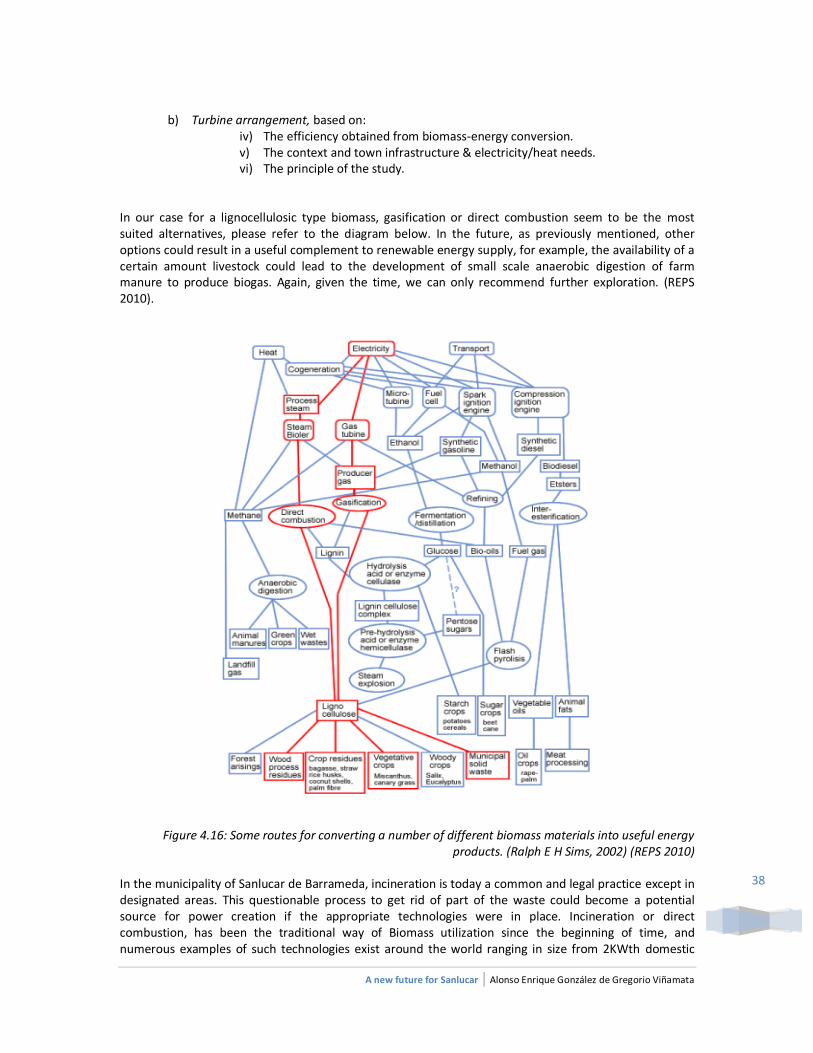
A new future for Sanlucar | Alonso Enrique González de Gregorio Viñamata
38
b) Turbine arrangement, based on:
iv) The efficiency obtained from biomass-energy conversion. v) The context and town infrastructure & electricity/heat needs. vi) The principle of the study.
In our case for a lignocellulosic type biomass, gasification or direct combustion seem to be the most suited alternatives, please refer to the diagram below. In the future, as previously mentioned, other options could result in a useful complement to renewable energy supply, for example, the availability of a certain amount livestock could lead to the development of small scale anaerobic digestion of farm manure to produce biogas. Again, given the time, we can only recommend further exploration. (REPS 2010).
Figure 4.16: Some routes for converting a number of different biomass materials into useful energy products. (Ralph E H Sims, 2002) (REPS 2010)
In the municipality of Sanlucar de Barrameda, incineration is today a common and legal practice except in designated areas. This questionable process to get rid of part of the waste could become a potential source for power creation if the appropriate technologies were in place. Incineration or direct combustion, has been the traditional way of Biomass utilization since the beginning of time, and numerous examples of such technologies exist around the world ranging in size from 2KWth domestic
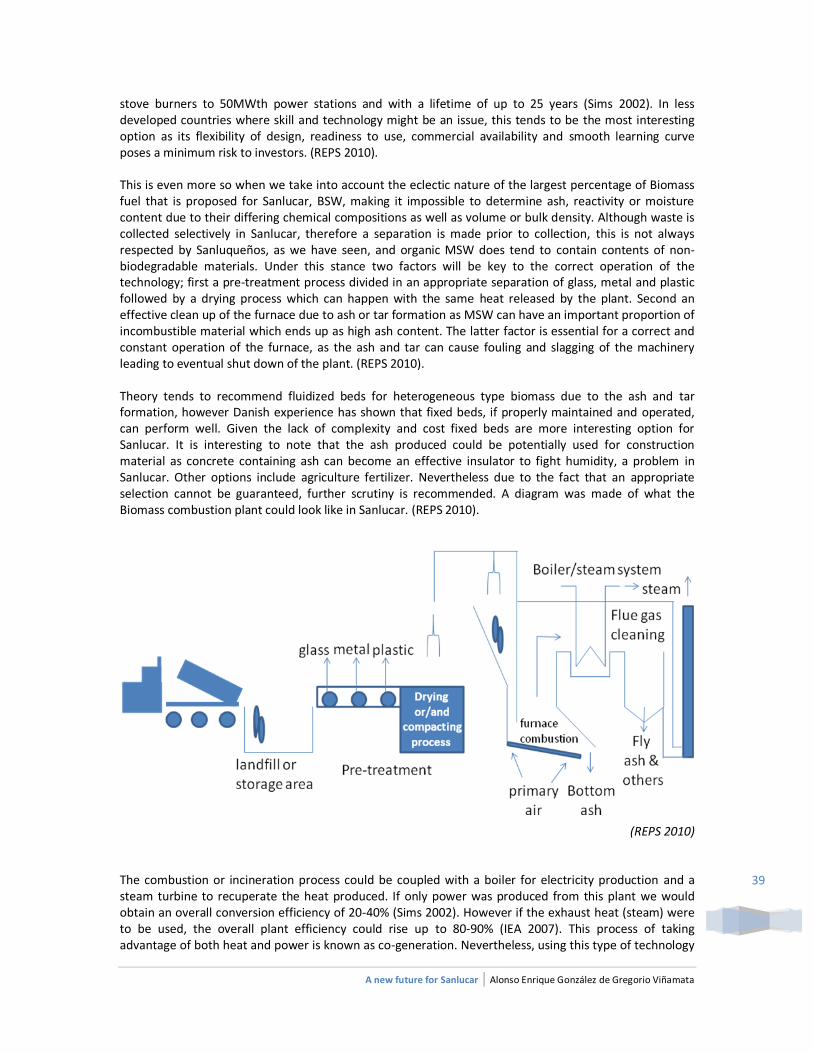
A new future for Sanlucar | Alonso Enrique González de Gregorio Viñamata
39
stove burners to 50MWth power stations and with a lifetime of up to 25 years (Sims 2002). In less developed countries where skill and technology might be an issue, this tends to be the most interesting option as its flexibility of design, readiness to use, commercial availability and smooth learning curve poses a minimum risk to investors. (REPS 2010). This is even more so when we take into account the eclectic nature of the largest percentage of Biomass fuel that is proposed for Sanlucar, BSW, making it impossible to determine ash, reactivity or moisture content due to their differing chemical compositions as well as volume or bulk density. Although waste is collected selectively in Sanlucar, therefore a separation is made prior to collection, this is not always respected by Sanluqueños, as we have seen, and organic MSW does tend to contain contents of non-biodegradable materials. Under this stance two factors will be key to the correct operation of the technology; first a pre-treatment process divided in an appropriate separation of glass, metal and plastic followed by a drying process which can happen with the same heat released by the plant. Second an effective clean up of the furnace due to ash or tar formation as MSW can have an important proportion of incombustible material which ends up as high ash content. The latter factor is essential for a correct and constant operation of the furnace, as the ash and tar can cause fouling and slagging of the machinery leading to eventual shut down of the plant. (REPS 2010). Theory tends to recommend fluidized beds for heterogeneous type biomass due to the ash and tar formation, however Danish experience has shown that fixed beds, if properly maintained and operated, can perform well. Given the lack of complexity and cost fixed beds are more interesting option for Sanlucar. It is interesting to note that the ash produced could be potentially used for construction material as concrete containing ash can become an effective insulator to fight humidity, a problem in Sanlucar. Other options include agriculture fertilizer. Nevertheless due to the fact that an appropriate selection cannot be guaranteed, further scrutiny is recommended. A diagram was made of what the Biomass combustion plant could look like in Sanlucar. (REPS 2010).
(REPS 2010)
The combustion or incineration process could be coupled with a boiler for electricity production and a steam turbine to recuperate the heat produced. If only power was produced from this plant we would obtain an overall conversion efficiency of 20-40% (Sims 2002). However if the exhaust heat (steam) were to be used, the overall plant efficiency could rise up to 80-90% (IEA 2007). This process of taking advantage of both heat and power is known as co-generation. Nevertheless, using this type of technology
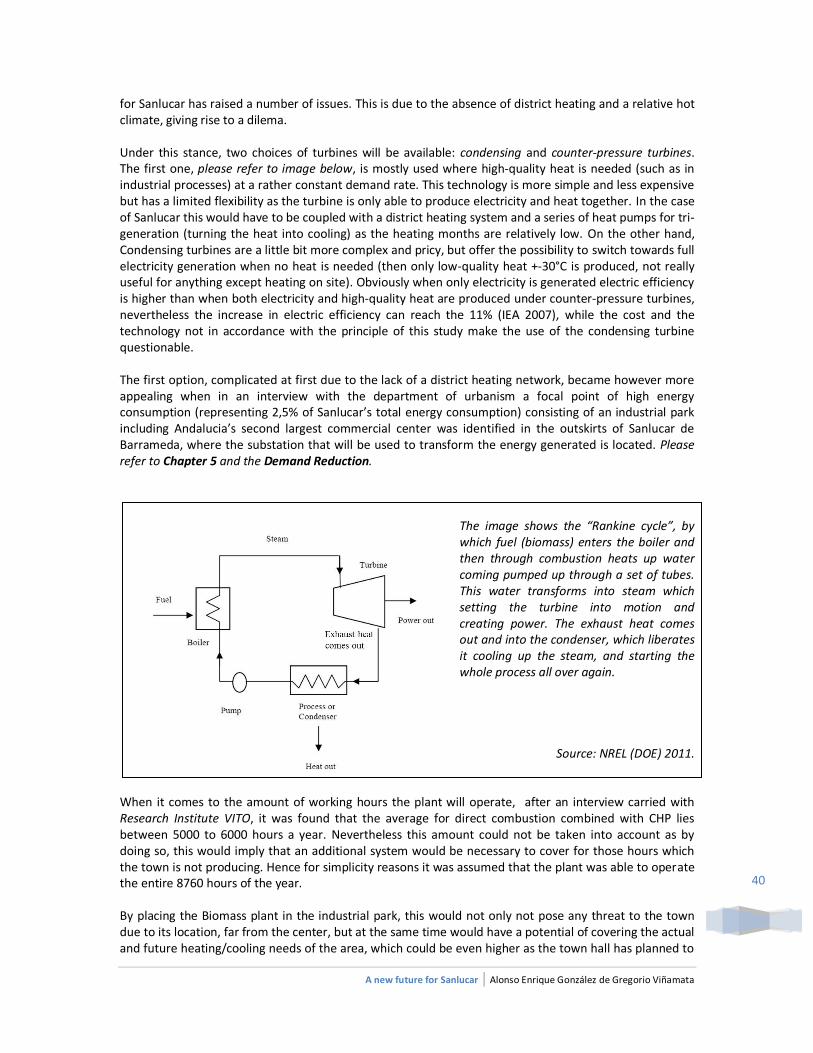
A new future for Sanlucar | Alonso Enrique González de Gregorio Viñamata
40
for Sanlucar has raised a number of issues. This is due to the absence of district heating and a relative hot climate, giving rise to a dilema. Under this stance, two choices of turbines will be available: condensing and counter-pressure turbines. The first one, please refer to image below, is mostly used where high-quality heat is needed (such as in industrial processes) at a rather constant demand rate. This technology is more simple and less expensive but has a limited flexibility as the turbine is only able to produce electricity and heat together. In the case of Sanlucar this would have to be coupled with a district heating system and a series of heat pumps for tri-generation (turning the heat into cooling) as the heating months are relatively low. On the other hand, Condensing turbines are a little bit more complex and pricy, but offer the possibility to switch towards full electricity generation when no heat is needed (then only low-quality heat +-30°C is produced, not really useful for anything except heating on site). Obviously when only electricity is generated electric efficiency is higher than when both electricity and high-quality heat are produced under counter-pressure turbines, nevertheless the increase in electric efficiency can reach the 11% (IEA 2007), while the cost and the technology not in accordance with the principle of this study make the use of the condensing turbine questionable. The first option, complicated at first due to the lack of a district heating network, became however more appealing when in an interview with the department of urbanism a focal point of high energy consumption (representing 2,5% of Sanlucar’s total energy consumption) consisting of an industrial park including Andalucia’s second largest commercial center was identified in the outskirts of Sanlucar de Barrameda, where the substation that will be used to transform the energy generated is located. Please refer to Chapter 5 and the Demand Reduction.
The image shows the “Rankine cycle”, by which fuel (biomass) enters the boiler and then through combustion heats up water coming pumped up through a set of tubes. This water transforms into steam which setting the turbine into motion and creating power. The exhaust heat comes out and into the condenser, which liberates it cooling up the steam, and starting the whole process all over again.
Source: NREL (DOE) 2011.
When it comes to the amount of working hours the plant will operate, after an interview carried with Research Institute VITO, it was found that the average for direct combustion combined with CHP lies between 5000 to 6000 hours a year. Nevertheless this amount could not be taken into account as by doing so, this would imply that an additional system would be necessary to cover for those hours which the town is not producing. Hence for simplicity reasons it was assumed that the plant was able to operate the entire 8760 hours of the year. By placing the Biomass plant in the industrial park, this would not only not pose any threat to the town due to its location, far from the center, but at the same time would have a potential of covering the actual and future heating/cooling needs of the area, which could be even higher as the town hall has planned to
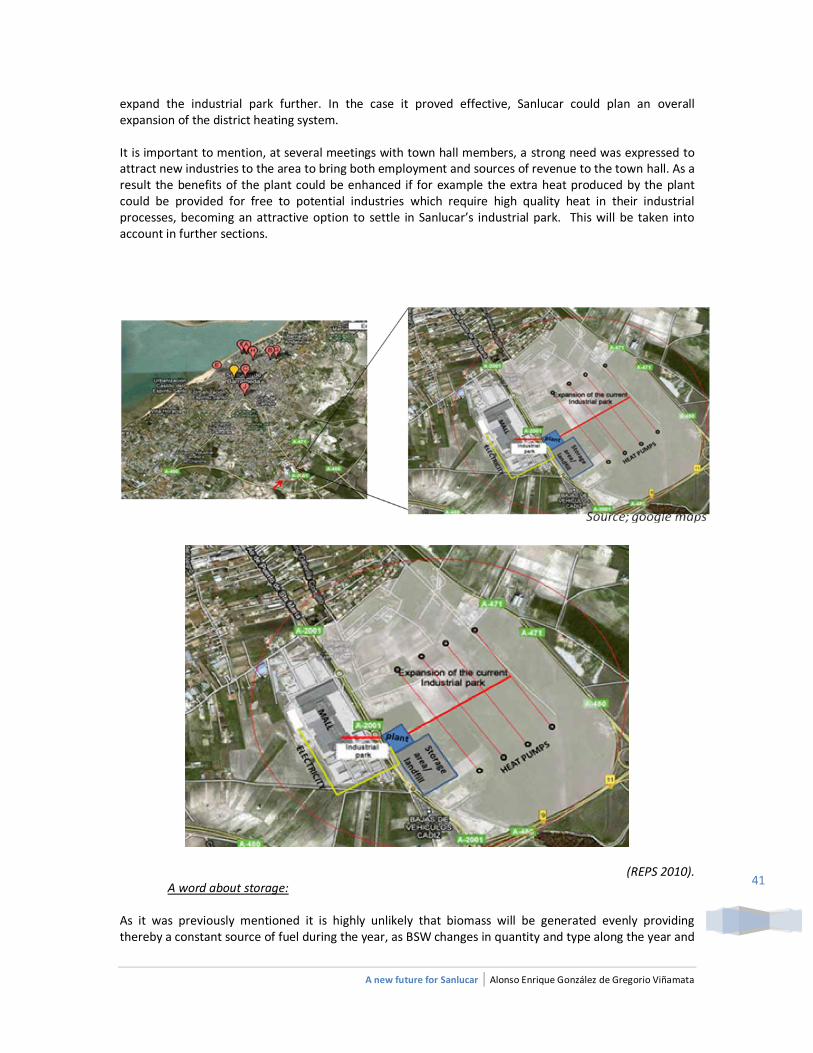
A new future for Sanlucar | Alonso Enrique González de Gregorio Viñamata
41
expand the industrial park further. In the case it proved effective, Sanlucar could plan an overall expansion of the district heating system. It is important to mention, at several meetings with town hall members, a strong need was expressed to attract new industries to the area to bring both employment and sources of revenue to the town hall. As a result the benefits of the plant could be enhanced if for example the extra heat produced by the plant could be provided for free to potential industries which require high quality heat in their industrial processes, becoming an attractive option to settle in Sanlucar’s industrial park. This will be taken into account in further sections.
(REPS 2010). A word about storage:
As it was previously mentioned it is highly unlikely that biomass will be generated evenly providing thereby a constant source of fuel during the year, as BSW changes in quantity and type along the year and
A new future for Sanlucar | Alonso Enrique González de Gregorio Viñamata
42
crops are ready to be harvested at specific times during the year. This will require the moving of the actual transfer plant to the new location and store sources one year in advance. (REPS 2010).
An alternative to direct combustion: Another possible technology to consider would be biomass gasification. Although this is a relatively young technology the potential advantages could be much greater than direct combustion if the barriers could be overcome. A biomass-fired gas turbine is similar in principle to a natural-gas-fired system. As opposed to combustion, under gasification biomass is partially combusted to create a gas known as "producer gas" which contains; hydrogen, carbon monoxide, methane, and nitrogen with a caloriphic value that ranges between 4-18 MJ/Nm3 depending on the gasification medium (Pang 2006) this is usually air but can also be oxygen, hydrogen or steam leading in turn to different gas quality and costs. Producer gas can be temporarily stored and then combusted making it possible for the technology to become a stand-alone generation system. This is not only interesting in terms of meeting peak hour demands (producer gas only needs 10 seconds for start up (Sims 2002)) giving flexibility to fluctuating/intermittent sources such as wind or PV, but also by guaranteeing stability if suddenly there was a temporary shortage in the Biomass fed to the plant. It is interesting to note that gasification can also have advantages over combustion if the plant is close to a natural gas line, which can be used as a back-up supply if feedstock supply is suddenly limited or unavailable. Gasification can hence increase the overall plant availability making it suitable for Sanlucar. Furthermore, the overall average conversion efficiency waste-to-electricity is higher in this case, average 45% (Sims 2002). (REPS 2010). Nevertheless it is important to note that as opposed to direct combustion, gasification adds on to the usual problems of ash formation, as the producer gas also contains; tar, particulates, alkalis and compounds of nitrogen and sulfur, which not only need to be cleaned up from the producer gas in a separate process, but also create residues that can cause severe fouling and slagging of gasifiers. This will be especially the case for MSW, whose nature makes these factors impossible to predict, as we have seen. Other factors enhancing the difficulty of operation are; high moisture contents or volume of Biomass, leading to eventual reduction of energy used in the reduction processes and converting thermal energy into the chemical bound energy in the gas, or in the case of volume, transport problems through the equipment. (REPS 2010). These factors can translate in significant O&M costs for gasification. Again according to theory, as with direct combustion, fluidized bed reactors could be most efficient for gasification. This is because of their inherent capacity to control the operating temperature thereby suffering less from ash melting and fusion problems. However due to the lack of data available and uncertainties concerning technologies we will not take into account gasification technologies in the overall analysis but will recommend strongly its further study. (REPS 2010).
4.2.3.3 Determining the biomass energy generated and the capacity:
a) Determining the biomass energy generated:
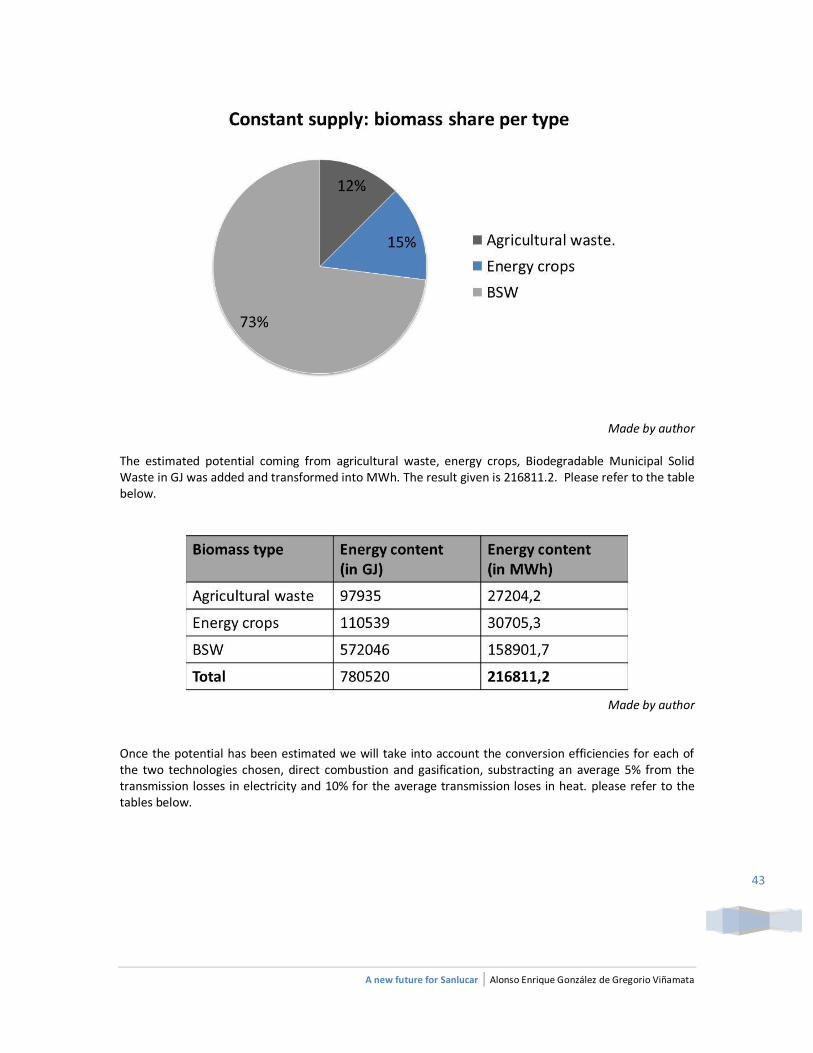
A new future for Sanlucar | Alonso Enrique González de Gregorio Viñamata
43
Made by author
The estimated potential coming from agricultural waste, energy crops, Biodegradable Municipal Solid Waste in GJ was added and transformed into MWh. The result given is 216811.2. Please refer to the table below.
Made by author
Once the potential has been estimated we will take into account the conversion efficiencies for each of the two technologies chosen, direct combustion and gasification, substracting an average 5% from the transmission losses in electricity and 10% for the average transmission loses in heat. please refer to the tables below.
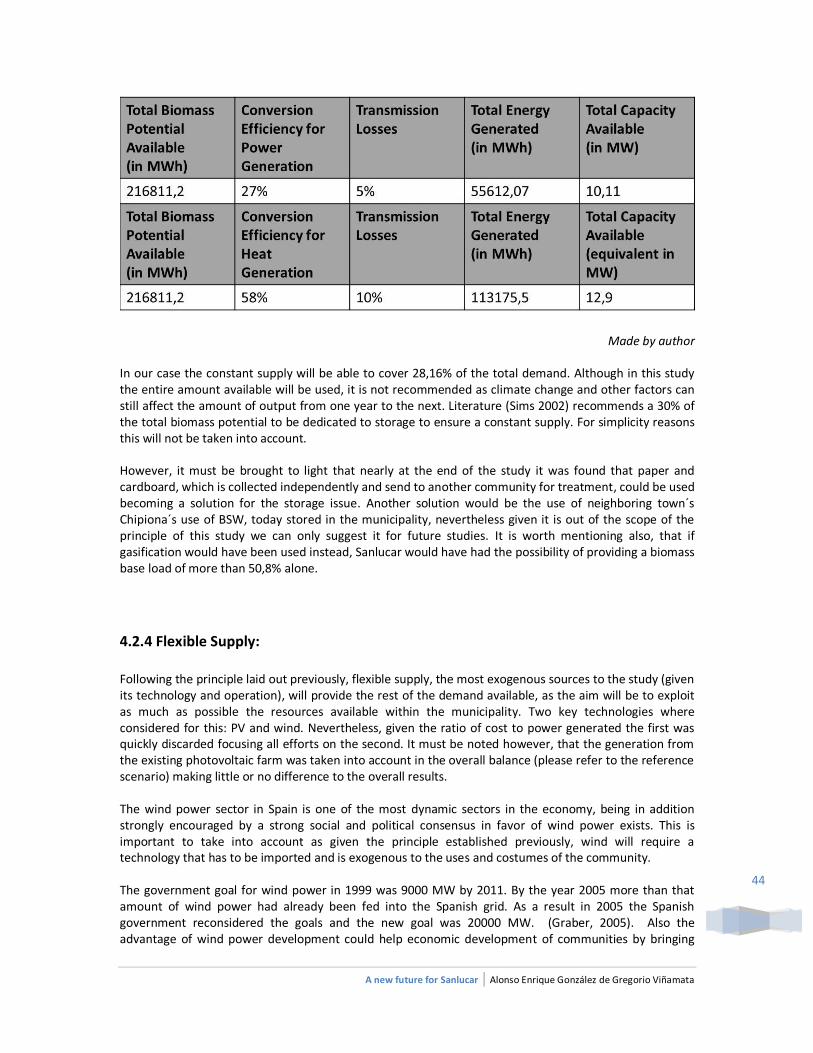
A new future for Sanlucar | Alonso Enrique González de Gregorio Viñamata
44
Made by author In our case the constant supply will be able to cover 28,16% of the total demand. Although in this study the entire amount available will be used, it is not recommended as climate change and other factors can still affect the amount of output from one year to the next. Literature (Sims 2002) recommends a 30% of the total biomass potential to be dedicated to storage to ensure a constant supply. For simplicity reasons this will not be taken into account. However, it must be brought to light that nearly at the end of the study it was found that paper and cardboard, which is collected independently and send to another community for treatment, could be used becoming a solution for the storage issue. Another solution would be the use of neighboring town´s Chipiona´s use of BSW, today stored in the municipality, nevertheless given it is out of the scope of the principle of this study we can only suggest it for future studies. It is worth mentioning also, that if gasification would have been used instead, Sanlucar would have had the possibility of providing a biomass base load of more than 50,8% alone.
4.2.4 Flexible Supply:
Following the principle laid out previously, flexible supply, the most exogenous sources to the study (given its technology and operation), will provide the rest of the demand available, as the aim will be to exploit as much as possible the resources available within the municipality. Two key technologies where considered for this: PV and wind. Nevertheless, given the ratio of cost to power generated the first was quickly discarded focusing all efforts on the second. It must be noted however, that the generation from the existing photovoltaic farm was taken into account in the overall balance (please refer to the reference scenario) making little or no difference to the overall results. The wind power sector in Spain is one of the most dynamic sectors in the economy, being in addition strongly encouraged by a strong social and political consensus in favor of wind power exists. This is important to take into account as given the principle established previously, wind will require a technology that has to be imported and is exogenous to the uses and costumes of the community. The government goal for wind power in 1999 was 9000 MW by 2011. By the year 2005 more than that amount of wind power had already been fed into the Spanish grid. As a result in 2005 the Spanish government reconsidered the goals and the new goal was 20000 MW. (Graber, 2005). Also the advantage of wind power development could help economic development of communities by bringing
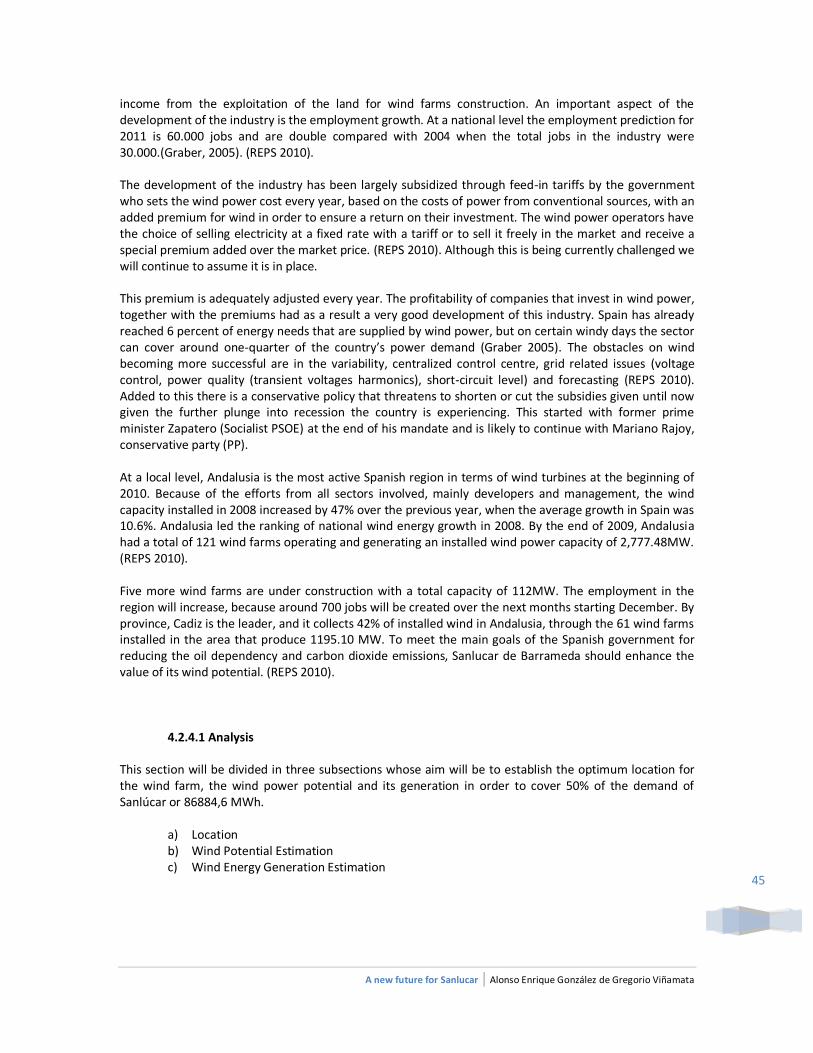
A new future for Sanlucar | Alonso Enrique González de Gregorio Viñamata
45
income from the exploitation of the land for wind farms construction. An important aspect of the development of the industry is the employment growth. At a national level the employment prediction for 2011 is 60.000 jobs and are double compared with 2004 when the total jobs in the industry were 30.000.(Graber, 2005). (REPS 2010). The development of the industry has been largely subsidized through feed-in tariffs by the government who sets the wind power cost every year, based on the costs of power from conventional sources, with an added premium for wind in order to ensure a return on their investment. The wind power operators have the choice of selling electricity at a fixed rate with a tariff or to sell it freely in the market and receive a special premium added over the market price. (REPS 2010). Although this is being currently challenged we will continue to assume it is in place. This premium is adequately adjusted every year. The profitability of companies that invest in wind power, together with the premiums had as a result a very good development of this industry. Spain has already reached 6 percent of energy needs that are supplied by wind power, but on certain windy days the sector can cover around one-quarter of the country’s power demand (Graber 2005). The obstacles on wind becoming more successful are in the variability, centralized control centre, grid related issues (voltage control, power quality (transient voltages harmonics), short-circuit level) and forecasting (REPS 2010). Added to this there is a conservative policy that threatens to shorten or cut the subsidies given until now given the further plunge into recession the country is experiencing. This started with former prime minister Zapatero (Socialist PSOE) at the end of his mandate and is likely to continue with Mariano Rajoy, conservative party (PP). At a local level, Andalusia is the most active Spanish region in terms of wind turbines at the beginning of 2010. Because of the efforts from all sectors involved, mainly developers and management, the wind capacity installed in 2008 increased by 47% over the previous year, when the average growth in Spain was 10.6%. Andalusia led the ranking of national wind energy growth in 2008. By the end of 2009, Andalusia had a total of 121 wind farms operating and generating an installed wind power capacity of 2,777.48MW. (REPS 2010). Five more wind farms are under construction with a total capacity of 112MW. The employment in the region will increase, because around 700 jobs will be created over the next months starting December. By province, Cadiz is the leader, and it collects 42% of installed wind in Andalusia, through the 61 wind farms installed in the area that produce 1195.10 MW. To meet the main goals of the Spanish government for reducing the oil dependency and carbon dioxide emissions, Sanlucar de Barrameda should enhance the value of its wind potential. (REPS 2010).
4.2.4.1 Analysis
This section will be divided in three subsections whose aim will be to establish the optimum location for the wind farm, the wind power potential and its generation in order to cover 50% of the demand of Sanlúcar or 86884,6 MWh.
a) Location b) Wind Potential Estimation c) Wind Energy Generation Estimation
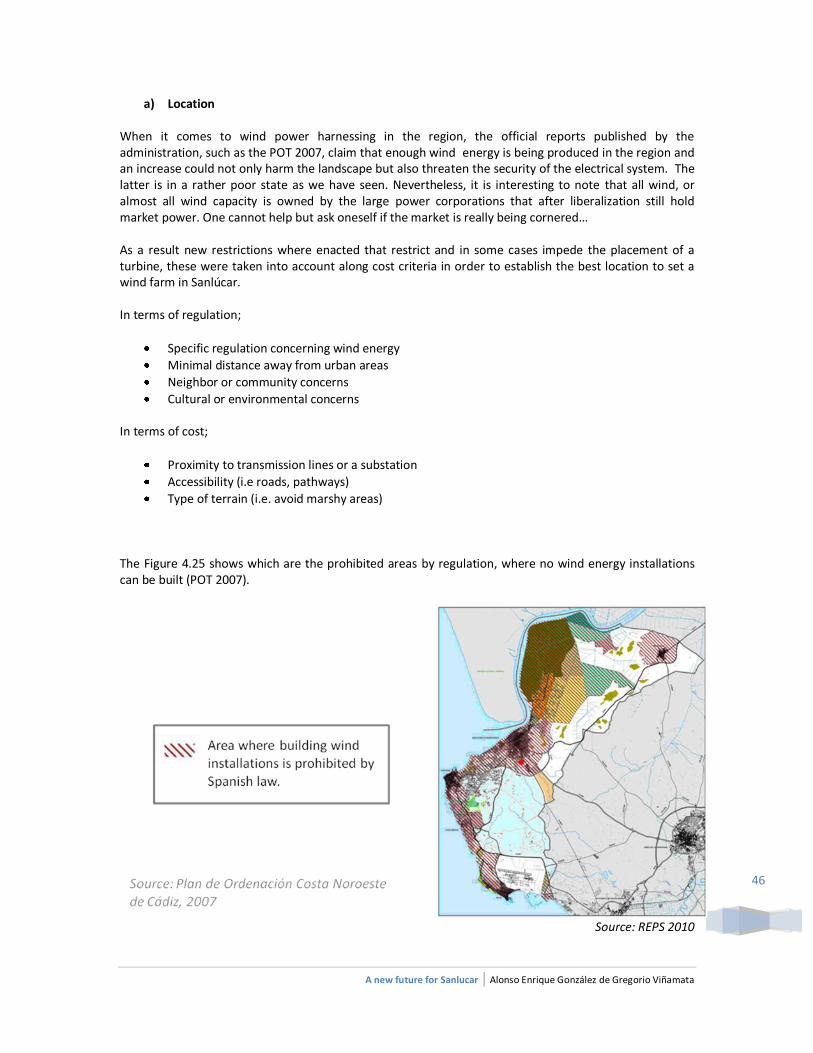
A new future for Sanlucar | Alonso Enrique González de Gregorio Viñamata
46
a) Location When it comes to wind power harnessing in the region, the official reports published by the administration, such as the POT 2007, claim that enough wind energy is being produced in the region and an increase could not only harm the landscape but also threaten the security of the electrical system. The latter is in a rather poor state as we have seen. Nevertheless, it is interesting to note that all wind, or almost all wind capacity is owned by the large power corporations that after liberalization still hold market power. One cannot help but ask oneself if the market is really being cornered… As a result new restrictions where enacted that restrict and in some cases impede the placement of a turbine, these were taken into account along cost criteria in order to establish the best location to set a wind farm in Sanlúcar. In terms of regulation;
Specific regulation concerning wind energy
Minimal distance away from urban areas
Neighbor or community concerns
Cultural or environmental concerns
In terms of cost;
Proximity to transmission lines or a substation
Accessibility (i.e roads, pathways)
Type of terrain (i.e. avoid marshy areas)
The Figure 4.25 shows which are the prohibited areas by regulation, where no wind energy installations can be built (POT 2007).
Source: REPS 2010
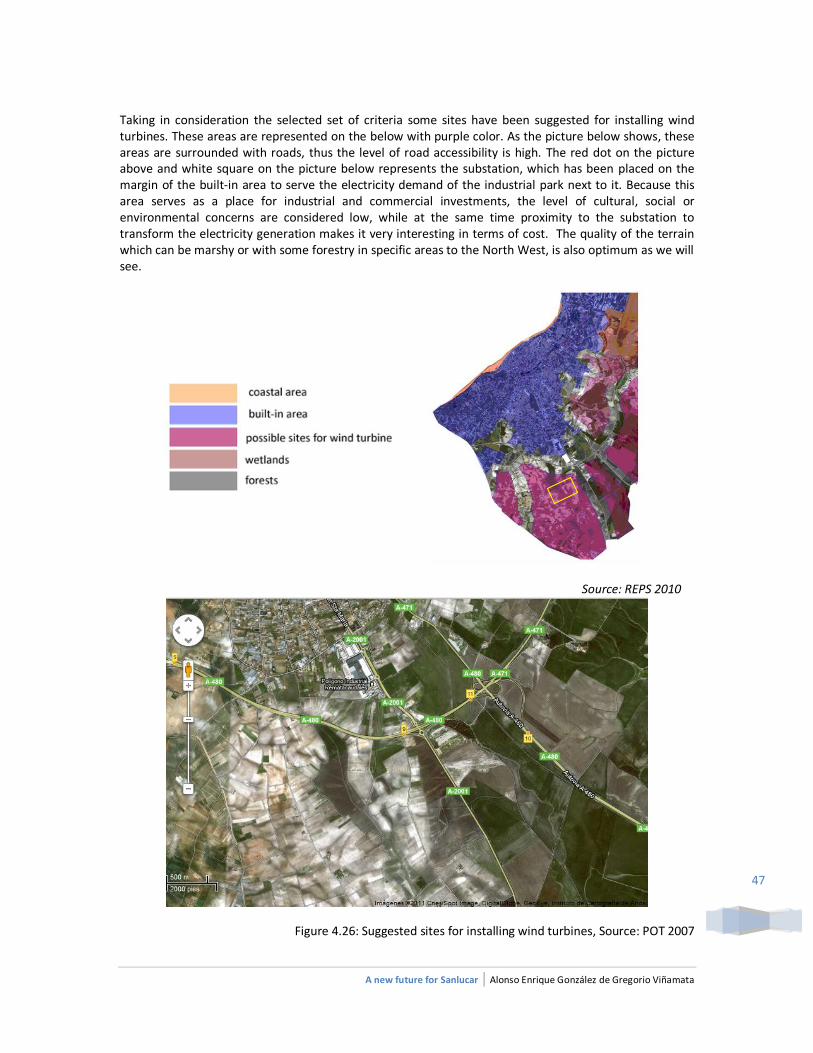
A new future for Sanlucar | Alonso Enrique González de Gregorio Viñamata
47
Taking in consideration the selected set of criteria some sites have been suggested for installing wind turbines. These areas are represented on the below with purple color. As the picture below shows, these areas are surrounded with roads, thus the level of road accessibility is high. The red dot on the picture above and white square on the picture below represents the substation, which has been placed on the margin of the built-in area to serve the electricity demand of the industrial park next to it. Because this area serves as a place for industrial and commercial investments, the level of cultural, social or environmental concerns are considered low, while at the same time proximity to the substation to transform the electricity generation makes it very interesting in terms of cost. The quality of the terrain which can be marshy or with some forestry in specific areas to the North West, is also optimum as we will see.
Source: REPS 2010
Figure 4.26: Suggested sites for installing wind turbines, Source: POT 2007
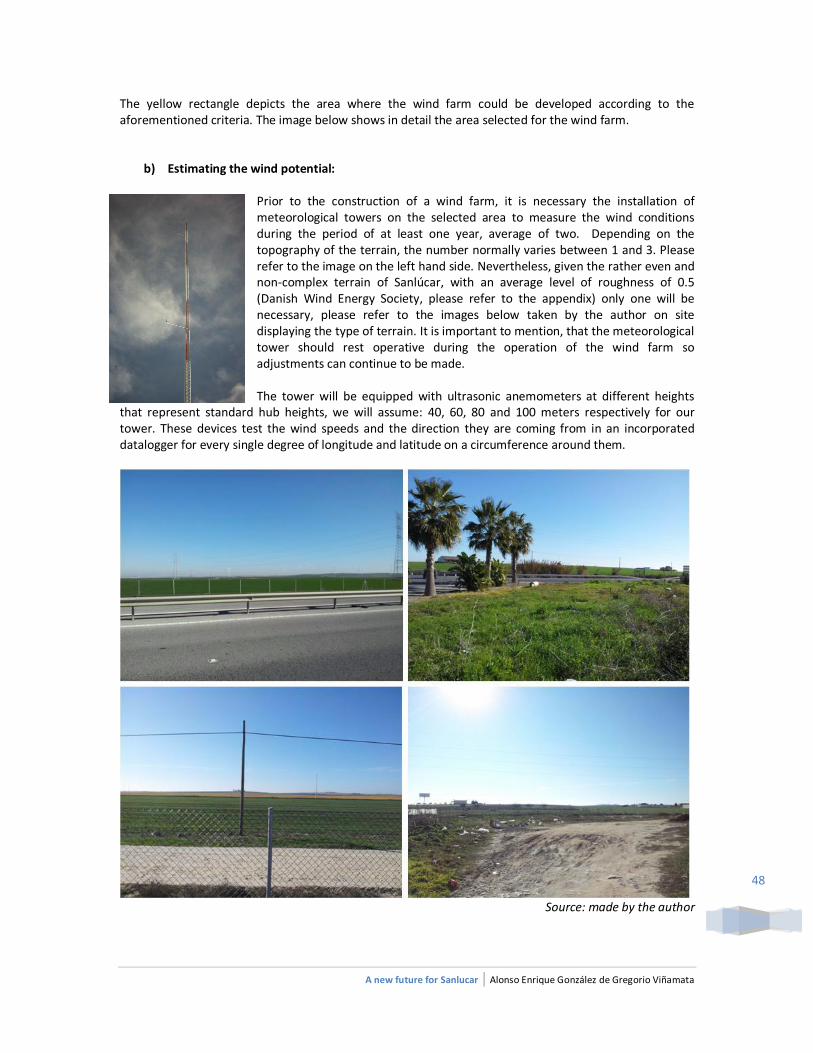
A new future for Sanlucar | Alonso Enrique González de Gregorio Viñamata
48
The yellow rectangle depicts the area where the wind farm could be developed according to the aforementioned criteria. The image below shows in detail the area selected for the wind farm.
b) Estimating the wind potential:
Prior to the construction of a wind farm, it is necessary the installation of meteorological towers on the selected area to measure the wind conditions during the period of at least one year, average of two. Depending on the topography of the terrain, the number normally varies between 1 and 3. Please refer to the image on the left hand side. Nevertheless, given the rather even and non-complex terrain of Sanlúcar, with an average level of roughness of 0.5 (Danish Wind Energy Society, please refer to the appendix) only one will be necessary, please refer to the images below taken by the author on site displaying the type of terrain. It is important to mention, that the meteorological tower should rest operative during the operation of the wind farm so adjustments can continue to be made. The tower will be equipped with ultrasonic anemometers at different heights
that represent standard hub heights, we will assume: 40, 60, 80 and 100 meters respectively for our tower. These devices test the wind speeds and the direction they are coming from in an incorporated datalogger for every single degree of longitude and latitude on a circumference around them.
Source: made by the author
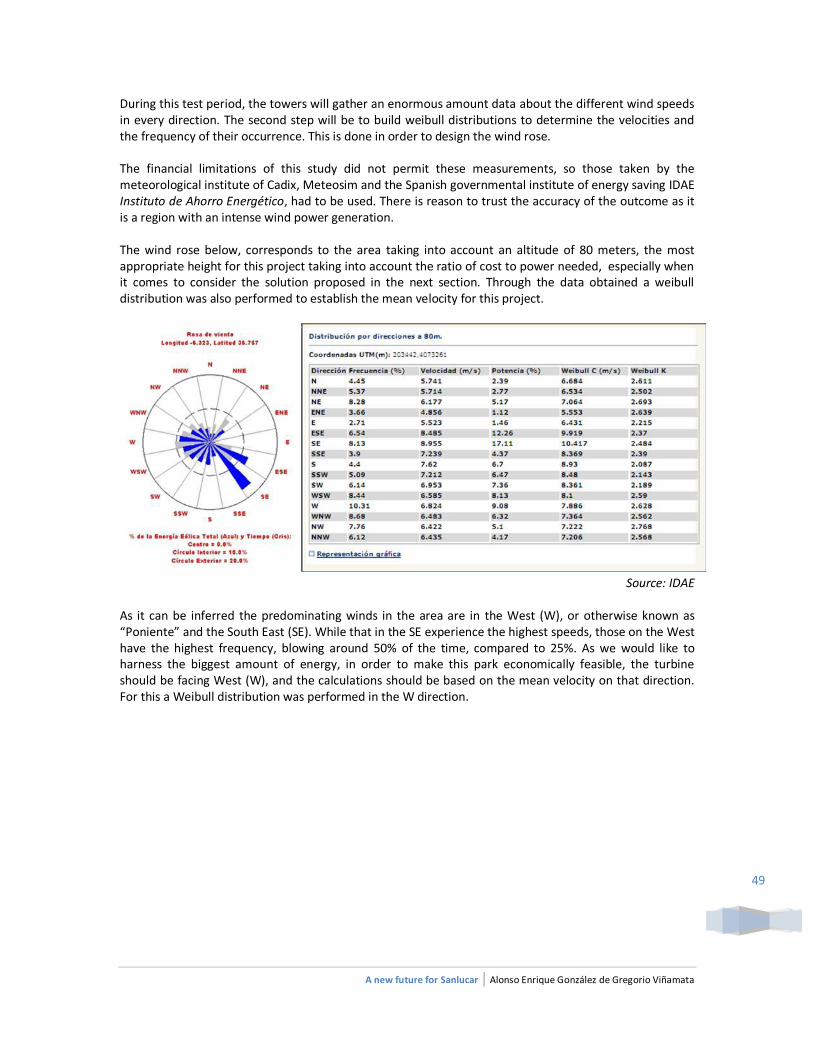
A new future for Sanlucar | Alonso Enrique González de Gregorio Viñamata
49
During this test period, the towers will gather an enormous amount data about the different wind speeds in every direction. The second step will be to build weibull distributions to determine the velocities and the frequency of their occurrence. This is done in order to design the wind rose. The financial limitations of this study did not permit these measurements, so those taken by the meteorological institute of Cadix, Meteosim and the Spanish governmental institute of energy saving IDAE Instituto de Ahorro Energético, had to be used. There is reason to trust the accuracy of the outcome as it is a region with an intense wind power generation. The wind rose below, corresponds to the area taking into account an altitude of 80 meters, the most appropriate height for this project taking into account the ratio of cost to power needed, especially when it comes to consider the solution proposed in the next section. Through the data obtained a weibull distribution was also performed to establish the mean velocity for this project.
Source: IDAE
As it can be inferred the predominating winds in the area are in the West (W), or otherwise known as “Poniente” and the South East (SE). While that in the SE experience the highest speeds, those on the West have the highest frequency, blowing around 50% of the time, compared to 25%. As we would like to harness the biggest amount of energy, in order to make this park economically feasible, the turbine should be facing West (W), and the calculations should be based on the mean velocity on that direction. For this a Weibull distribution was performed in the W direction.
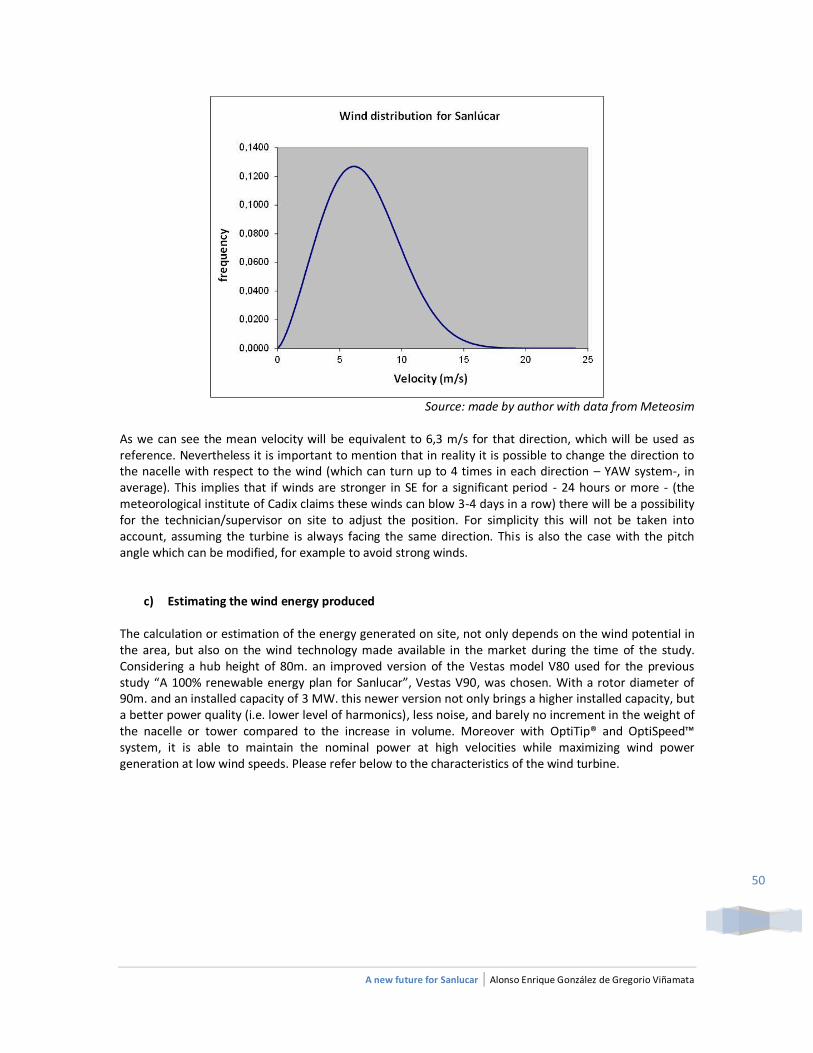
A new future for Sanlucar | Alonso Enrique González de Gregorio Viñamata
50
Source: made by author with data from Meteosim
As we can see the mean velocity will be equivalent to 6,3 m/s for that direction, which will be used as reference. Nevertheless it is important to mention that in reality it is possible to change the direction to the nacelle with respect to the wind (which can turn up to 4 times in each direction – YAW system-, in average). This implies that if winds are stronger in SE for a significant period - 24 hours or more - (the meteorological institute of Cadix claims these winds can blow 3-4 days in a row) there will be a possibility for the technician/supervisor on site to adjust the position. For simplicity this will not be taken into account, assuming the turbine is always facing the same direction. This is also the case with the pitch angle which can be modified, for example to avoid strong winds.
c) Estimating the wind energy produced The calculation or estimation of the energy generated on site, not only depends on the wind potential in the area, but also on the wind technology made available in the market during the time of the study. Considering a hub height of 80m. an improved version of the Vestas model V80 used for the previous study “A 100% renewable energy plan for Sanlucar”, Vestas V90, was chosen. With a rotor diameter of 90m. and an installed capacity of 3 MW. this newer version not only brings a higher installed capacity, but a better power quality (i.e. lower level of harmonics), less noise, and barely no increment in the weight of the nacelle or tower compared to the increase in volume. Moreover with OptiTip® and OptiSpeed™ system, it is able to maintain the nominal power at high velocities while maximizing wind power generation at low wind speeds. Please refer below to the characteristics of the wind turbine.
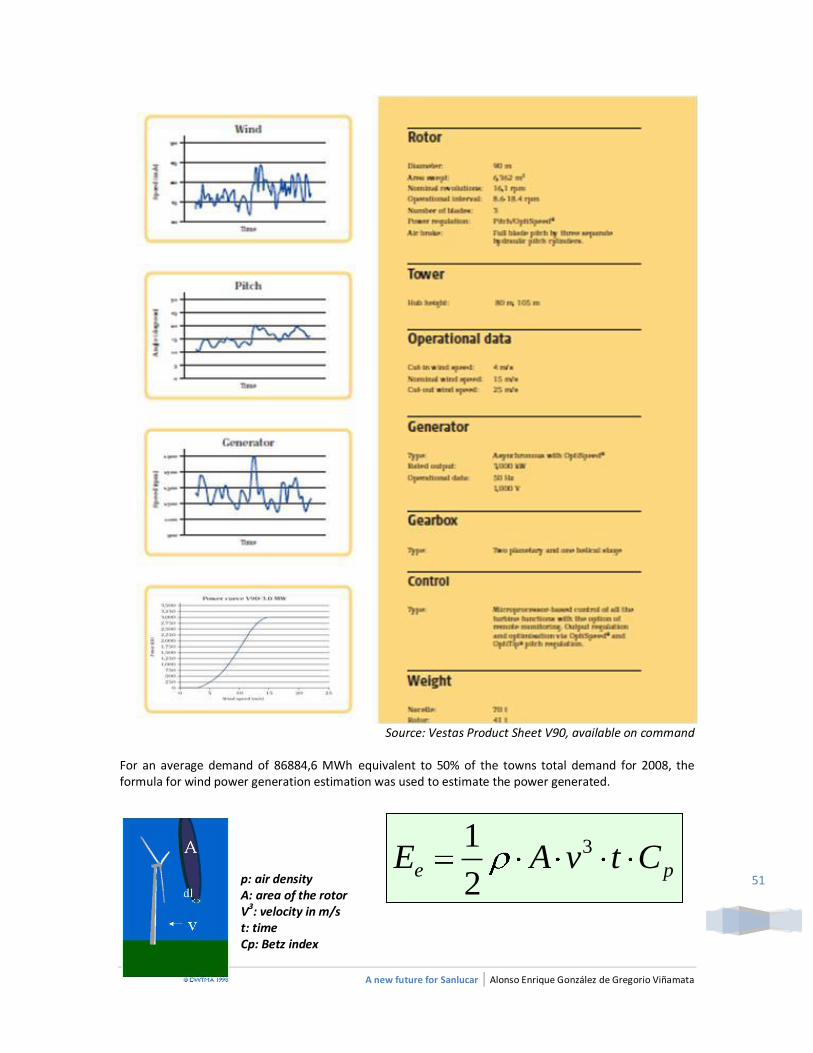
A new future for Sanlucar | Alonso Enrique González de Gregorio Viñamata
51
Source: Vestas Product Sheet V90, available on command
For an average demand of 86884,6 MWh equivalent to 50% of the towns total demand for 2008, the formula for wind power generation estimation was used to estimate the power generated.
p: air density A: area of the rotor V3: velocity in m/s t: time Cp: Betz index
pe CtvAE 3
2
1

A new future for Sanlucar | Alonso Enrique González de Gregorio Viñamata
52
The data obtained from the VESTAS V90 along with the wind potential will be used in WindPRO to obtain the number of turbines used, the installed capacity and the total production. This is done by using the aforementioned formula. For this task it was assumed a rotor area of 282,74m2 , a 0.59 Betz index, an average velocity of 6,3 m/s, and a frequency of 2449 hours. Please refer to the appendix to see the analysis, and the methodology section for a concrete explanation on WindPRO.
Number of
turbines
Installed
capacity
Production Equivalent
hours
Mean
Speed
Mean
Heigth
16 48 MW 117530 MWh 2449 6,3 m/s 80 m In this case the amount of energy needed to be covered, 50% of the total demand or was obtained with 12 wind turbines, nevertheless to bring flexibility to the system in order to cover the peak demands a larger number was used. Under this stance a total of 117.530 MWh of production per year was obtained in 2449 hours with 16 turbines. This represents an installed capacity of 48 MW. It is important to note that the amount of hours indicates the frequency or amount of time the wind farm will be producing energy, and hence it becomes an essential factor to determine the economic feasibility of the project, taking into account the current feed-in tariff. In the case of Spain this is estimated above 2000 hours per year, anything below that makes the wind park not economically feasible (TARAZON et al. 2011). Once the wind power has been estimated, an important step will be to establish the placement of the turbines. Under this stance, it will be important to take into account the wake effect, which is the effect that one turbine can cause upon neighboring turbines as air passes and a turbulence is created. This problem can severely diminish production, if the location is not correctly studied. Please refer to the images below. Theory recommends a separation of at least 4 times the diameter of the rotor, transversally, and 7 times the diameter of the rotor with respect to the direction of the wind (TARAZON et. al 2011). Please refer to the image below on the right hand side.
Source: Danish Wind Energy Association Taking also into account the topographic and meteorological constraints, WindPRO has an option to establish the correct disposition of each device. Please refer to the image below.

A new future for Sanlucar | Alonso Enrique González de Gregorio Viñamata
53
Source: simulation corrected by author using data from WindPRO
Once this is done it will be necessary to learn the wind data (frequencies and Weibull parameters) for each turbine taking into account its exact location. Given this is impossible, it was necessary to use the WindPRO program. The latter taking into account the topography of the terrain, the level of roughness, nearby obstacles (if any) and wind data for every location, yield a statistic covering the entire area. Therefore, an estimation or prediction of the concrete wind conditions that could exist in the location of every single turbine. Finally for the estimation of the energy produced WINDPro is used again. By optimizing the micrositing of the location, the losses due to the wake effect were considerably reduced and the production of the park augmented.
4.2.4 Balance of the system
3 types of renewable energy sources are considered: demand reduction measures, wind and biomass. When it comes to summarize the different amounts obtained, we have: a 27,94% of demand reduction, a 28,16% coming from Biomass and a 59,52% coming from Wind Power. This gives a total 115.62% covered by the renewable energy plan proposed here. The table below summarizes the energy obtained. Photovoltaics was not taken into account.
Energy
produced in
MWh
Percentages
Demand
reduction55171,721 27,94%
Constant
Supply55612,07 28,16%
Flexible
Supply117530 59,62%
Total 228.313,79 115,62% Source: made by author
When analyzing the system more closely through the interaction of the different elements, we can see that the electricity provided by biomass plant could function continuously on a base load if the input is
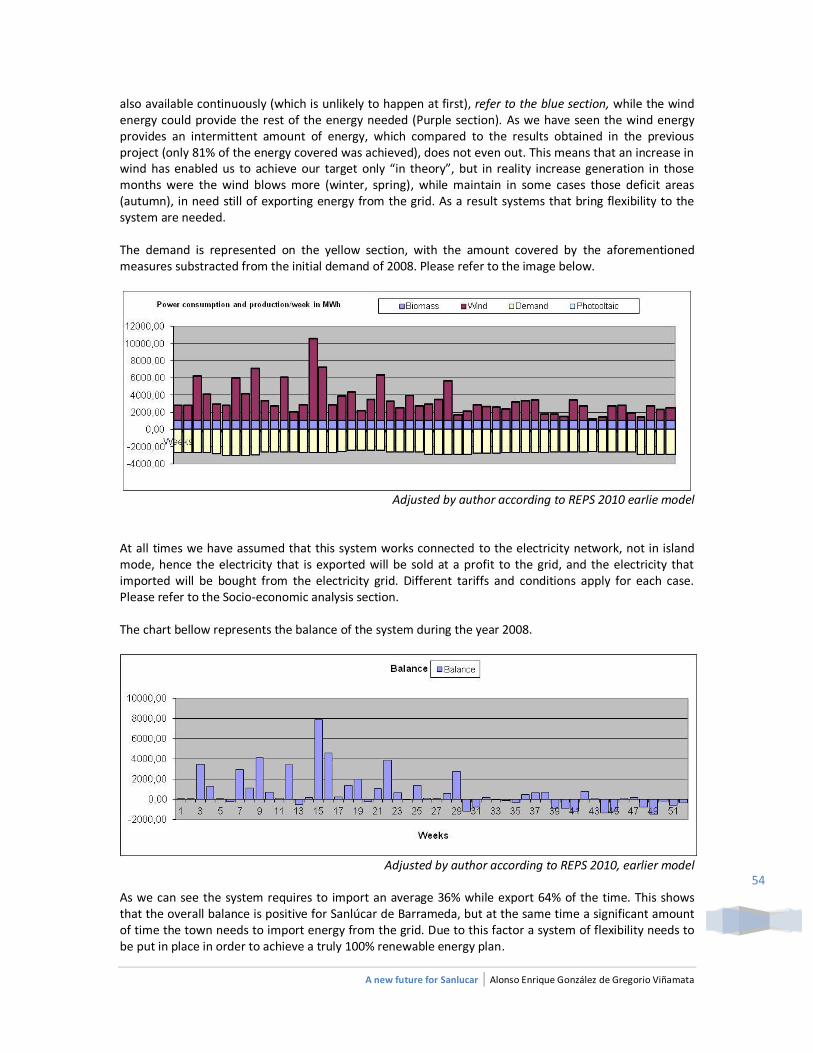
A new future for Sanlucar | Alonso Enrique González de Gregorio Viñamata
54
also available continuously (which is unlikely to happen at first), refer to the blue section, while the wind energy could provide the rest of the energy needed (Purple section). As we have seen the wind energy provides an intermittent amount of energy, which compared to the results obtained in the previous project (only 81% of the energy covered was achieved), does not even out. This means that an increase in wind has enabled us to achieve our target only “in theory”, but in reality increase generation in those months were the wind blows more (winter, spring), while maintain in some cases those deficit areas (autumn), in need still of exporting energy from the grid. As a result systems that bring flexibility to the system are needed. The demand is represented on the yellow section, with the amount covered by the aforementioned measures substracted from the initial demand of 2008. Please refer to the image below.
Adjusted by author according to REPS 2010 earlie model
At all times we have assumed that this system works connected to the electricity network, not in island mode, hence the electricity that is exported will be sold at a profit to the grid, and the electricity that imported will be bought from the electricity grid. Different tariffs and conditions apply for each case. Please refer to the Socio-economic analysis section. The chart bellow represents the balance of the system during the year 2008.
Adjusted by author according to REPS 2010, earlier model
As we can see the system requires to import an average 36% while export 64% of the time. This shows that the overall balance is positive for Sanlúcar de Barrameda, but at the same time a significant amount of time the town needs to import energy from the grid. Due to this factor a system of flexibility needs to be put in place in order to achieve a truly 100% renewable energy plan.
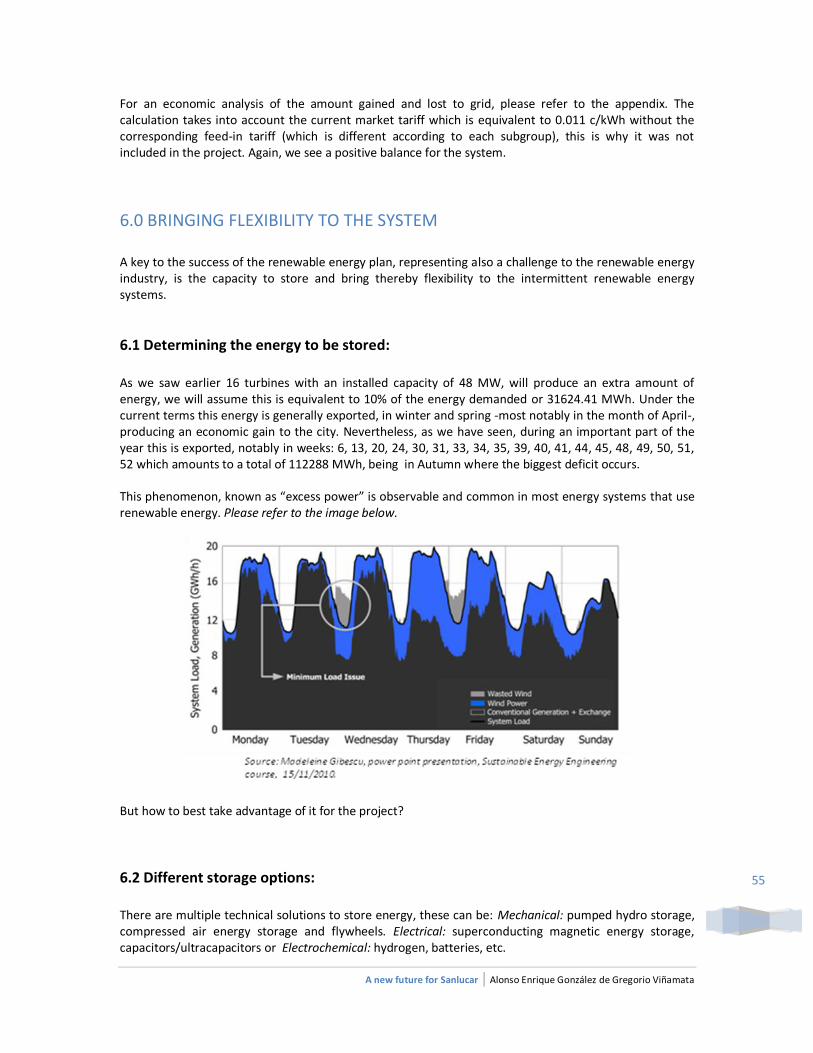
A new future for Sanlucar | Alonso Enrique González de Gregorio Viñamata
55
For an economic analysis of the amount gained and lost to grid, please refer to the appendix. The calculation takes into account the current market tariff which is equivalent to 0.011 c/kWh without the corresponding feed-in tariff (which is different according to each subgroup), this is why it was not included in the project. Again, we see a positive balance for the system.
6.0 BRINGING FLEXIBILITY TO THE SYSTEM
A key to the success of the renewable energy plan, representing also a challenge to the renewable energy industry, is the capacity to store and bring thereby flexibility to the intermittent renewable energy systems.
6.1 Determining the energy to be stored:
As we saw earlier 16 turbines with an installed capacity of 48 MW, will produce an extra amount of energy, we will assume this is equivalent to 10% of the energy demanded or 31624.41 MWh. Under the current terms this energy is generally exported, in winter and spring -most notably in the month of April-, producing an economic gain to the city. Nevertheless, as we have seen, during an important part of the year this is exported, notably in weeks: 6, 13, 20, 24, 30, 31, 33, 34, 35, 39, 40, 41, 44, 45, 48, 49, 50, 51, 52 which amounts to a total of 112288 MWh, being in Autumn where the biggest deficit occurs. This phenomenon, known as “excess power” is observable and common in most energy systems that use renewable energy. Please refer to the image below.
But how to best take advantage of it for the project?
6.2 Different storage options:
There are multiple technical solutions to store energy, these can be: Mechanical: pumped hydro storage, compressed air energy storage and flywheels. Electrical: superconducting magnetic energy storage, capacitors/ultracapacitors or Electrochemical: hydrogen, batteries, etc.
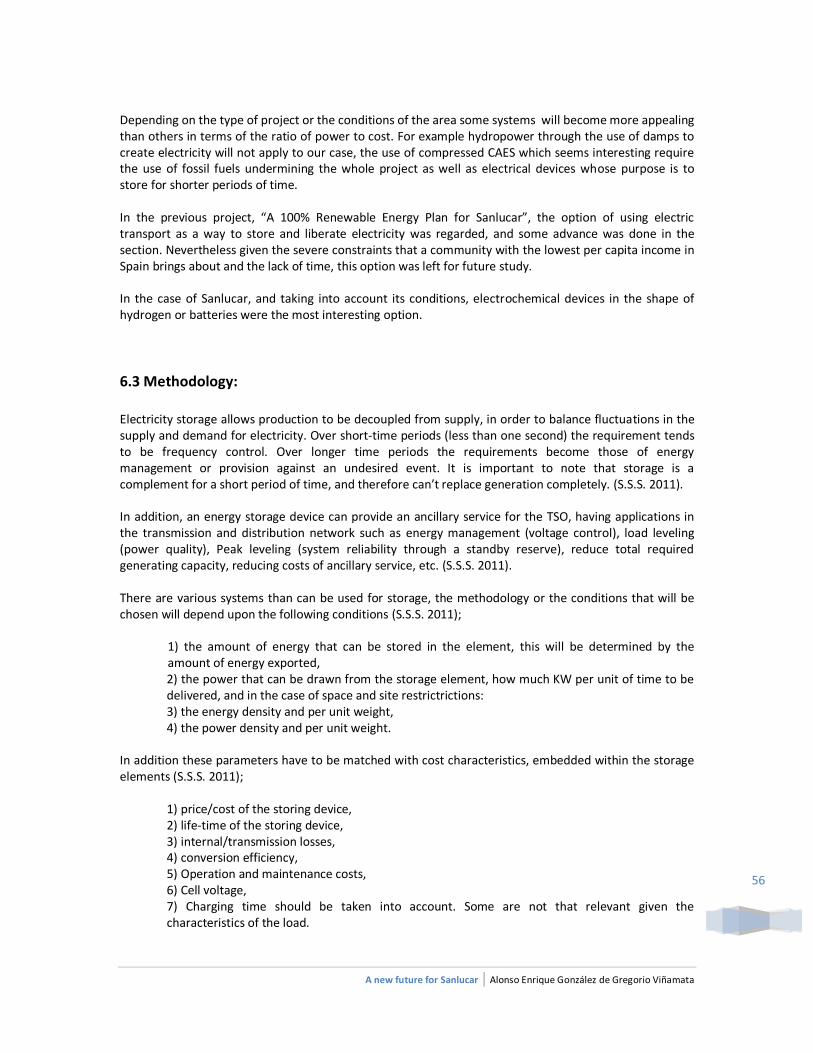
A new future for Sanlucar | Alonso Enrique González de Gregorio Viñamata
56
Depending on the type of project or the conditions of the area some systems will become more appealing than others in terms of the ratio of power to cost. For example hydropower through the use of damps to create electricity will not apply to our case, the use of compressed CAES which seems interesting require the use of fossil fuels undermining the whole project as well as electrical devices whose purpose is to store for shorter periods of time. In the previous project, “A 100% Renewable Energy Plan for Sanlucar”, the option of using electric transport as a way to store and liberate electricity was regarded, and some advance was done in the section. Nevertheless given the severe constraints that a community with the lowest per capita income in Spain brings about and the lack of time, this option was left for future study. In the case of Sanlucar, and taking into account its conditions, electrochemical devices in the shape of hydrogen or batteries were the most interesting option.
6.3 Methodology:
Electricity storage allows production to be decoupled from supply, in order to balance fluctuations in the supply and demand for electricity. Over short-time periods (less than one second) the requirement tends to be frequency control. Over longer time periods the requirements become those of energy management or provision against an undesired event. It is important to note that storage is a complement for a short period of time, and therefore can’t replace generation completely. (S.S.S. 2011). In addition, an energy storage device can provide an ancillary service for the TSO, having applications in the transmission and distribution network such as energy management (voltage control), load leveling (power quality), Peak leveling (system reliability through a standby reserve), reduce total required generating capacity, reducing costs of ancillary service, etc. (S.S.S. 2011). There are various systems than can be used for storage, the methodology or the conditions that will be chosen will depend upon the following conditions (S.S.S. 2011);
1) the amount of energy that can be stored in the element, this will be determined by the amount of energy exported, 2) the power that can be drawn from the storage element, how much KW per unit of time to be delivered, and in the case of space and site restrictrictions: 3) the energy density and per unit weight, 4) the power density and per unit weight.
In addition these parameters have to be matched with cost characteristics, embedded within the storage elements (S.S.S. 2011);
1) price/cost of the storing device, 2) life-time of the storing device, 3) internal/transmission losses, 4) conversion efficiency, 5) Operation and maintenance costs, 6) Cell voltage, 7) Charging time should be taken into account. Some are not that relevant given the characteristics of the load.
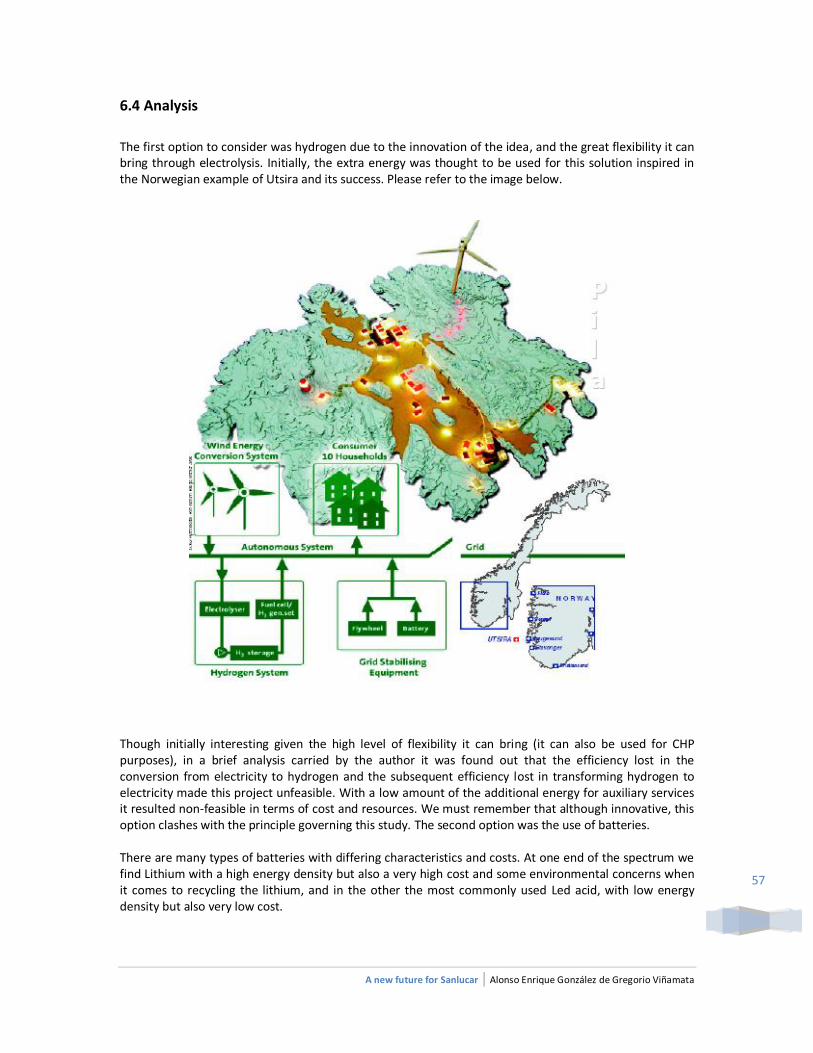
A new future for Sanlucar | Alonso Enrique González de Gregorio Viñamata
57
6.4 Analysis
The first option to consider was hydrogen due to the innovation of the idea, and the great flexibility it can bring through electrolysis. Initially, the extra energy was thought to be used for this solution inspired in the Norwegian example of Utsira and its success. Please refer to the image below.
Though initially interesting given the high level of flexibility it can bring (it can also be used for CHP purposes), in a brief analysis carried by the author it was found out that the efficiency lost in the conversion from electricity to hydrogen and the subsequent efficiency lost in transforming hydrogen to electricity made this project unfeasible. With a low amount of the additional energy for auxiliary services it resulted non-feasible in terms of cost and resources. We must remember that although innovative, this option clashes with the principle governing this study. The second option was the use of batteries. There are many types of batteries with differing characteristics and costs. At one end of the spectrum we find Lithium with a high energy density but also a very high cost and some environmental concerns when it comes to recycling the lithium, and in the other the most commonly used Led acid, with low energy density but also very low cost.
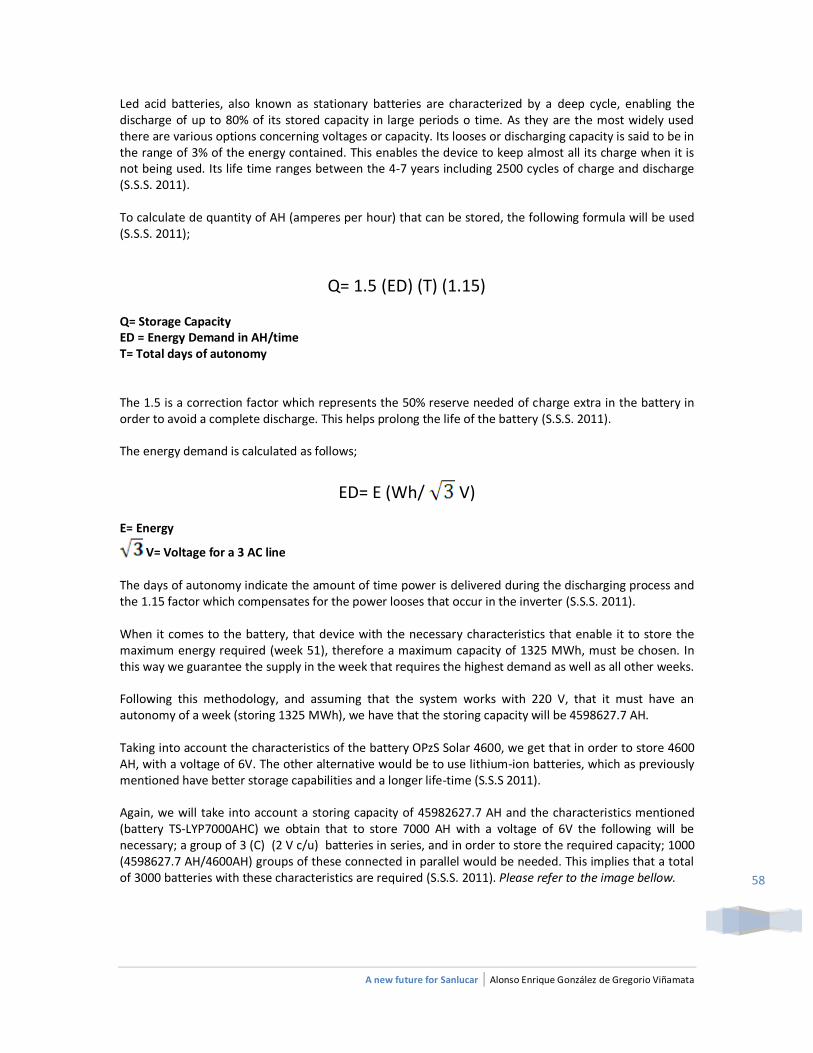
A new future for Sanlucar | Alonso Enrique González de Gregorio Viñamata
58
Led acid batteries, also known as stationary batteries are characterized by a deep cycle, enabling the discharge of up to 80% of its stored capacity in large periods o time. As they are the most widely used there are various options concerning voltages or capacity. Its looses or discharging capacity is said to be in the range of 3% of the energy contained. This enables the device to keep almost all its charge when it is not being used. Its life time ranges between the 4-7 years including 2500 cycles of charge and discharge (S.S.S. 2011). To calculate de quantity of AH (amperes per hour) that can be stored, the following formula will be used (S.S.S. 2011);
Q= 1.5 (ED) (T) (1.15)
Q= Storage Capacity ED = Energy Demand in AH/time T= Total days of autonomy The 1.5 is a correction factor which represents the 50% reserve needed of charge extra in the battery in order to avoid a complete discharge. This helps prolong the life of the battery (S.S.S. 2011). The energy demand is calculated as follows;
ED= E (Wh/ V) E= Energy
V= Voltage for a 3 AC line
The days of autonomy indicate the amount of time power is delivered during the discharging process and the 1.15 factor which compensates for the power looses that occur in the inverter (S.S.S. 2011). When it comes to the battery, that device with the necessary characteristics that enable it to store the maximum energy required (week 51), therefore a maximum capacity of 1325 MWh, must be chosen. In this way we guarantee the supply in the week that requires the highest demand as well as all other weeks. Following this methodology, and assuming that the system works with 220 V, that it must have an autonomy of a week (storing 1325 MWh), we have that the storing capacity will be 4598627.7 AH. Taking into account the characteristics of the battery OPzS Solar 4600, we get that in order to store 4600 AH, with a voltage of 6V. The other alternative would be to use lithium-ion batteries, which as previously mentioned have better storage capabilities and a longer life-time (S.S.S 2011). Again, we will take into account a storing capacity of 45982627.7 AH and the characteristics mentioned (battery TS-LYP7000AHC) we obtain that to store 7000 AH with a voltage of 6V the following will be necessary; a group of 3 (C) (2 V c/u) batteries in series, and in order to store the required capacity; 1000 (4598627.7 AH/4600AH) groups of these connected in parallel would be needed. This implies that a total of 3000 batteries with these characteristics are required (S.S.S. 2011). Please refer to the image bellow.
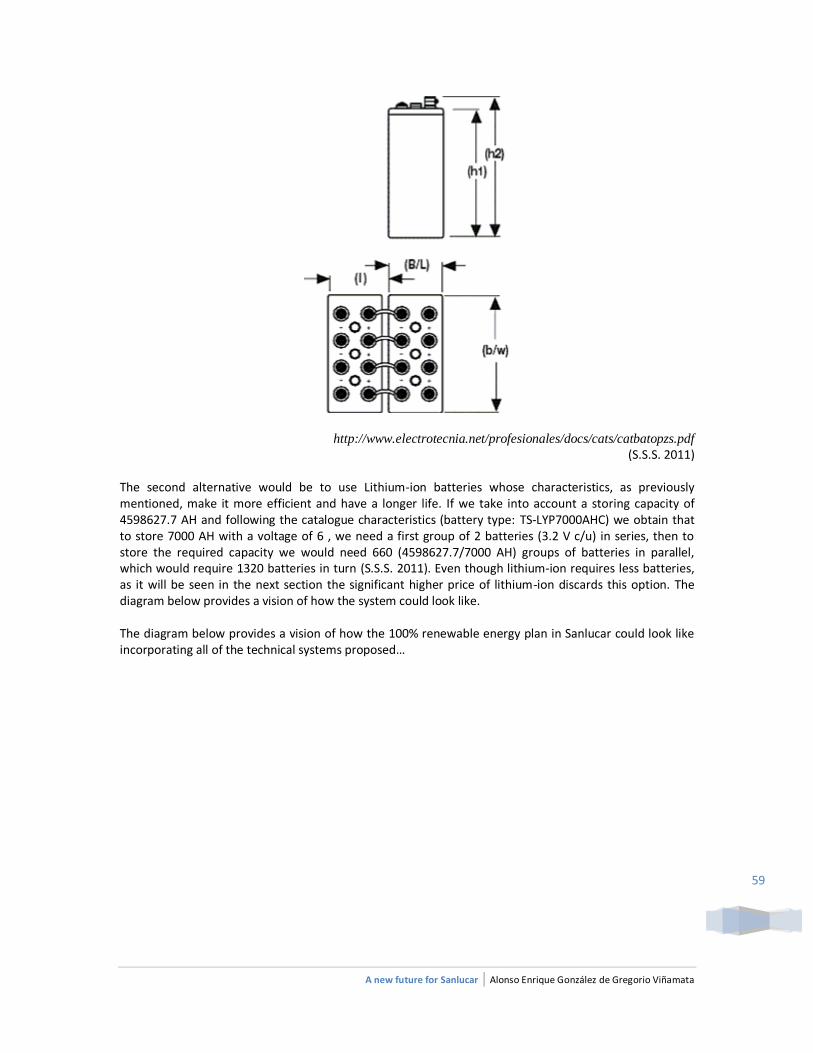
A new future for Sanlucar | Alonso Enrique González de Gregorio Viñamata
59
http://www.electrotecnia.net/profesionales/docs/cats/catbatopzs.pdf
(S.S.S. 2011) The second alternative would be to use Lithium-ion batteries whose characteristics, as previously mentioned, make it more efficient and have a longer life. If we take into account a storing capacity of 4598627.7 AH and following the catalogue characteristics (battery type: TS-LYP7000AHC) we obtain that to store 7000 AH with a voltage of 6 , we need a first group of 2 batteries (3.2 V c/u) in series, then to store the required capacity we would need 660 (4598627.7/7000 AH) groups of batteries in parallel, which would require 1320 batteries in turn (S.S.S. 2011). Even though lithium-ion requires less batteries, as it will be seen in the next section the significant higher price of lithium-ion discards this option. The diagram below provides a vision of how the system could look like. The diagram below provides a vision of how the 100% renewable energy plan in Sanlucar could look like incorporating all of the technical systems proposed…
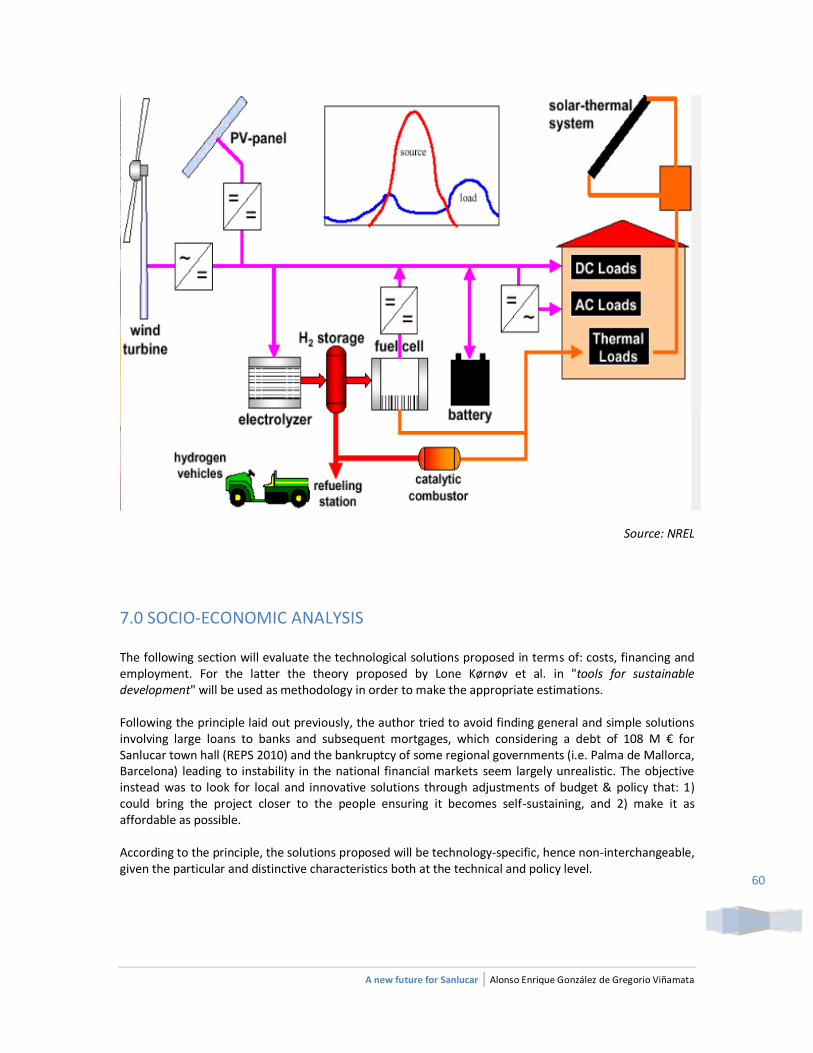
A new future for Sanlucar | Alonso Enrique González de Gregorio Viñamata
60
Source: NREL
7.0 SOCIO-ECONOMIC ANALYSIS The following section will evaluate the technological solutions proposed in terms of: costs, financing and employment. For the latter the theory proposed by Lone Kørnøv et al. in "tools for sustainable development" will be used as methodology in order to make the appropriate estimations. Following the principle laid out previously, the author tried to avoid finding general and simple solutions involving large loans to banks and subsequent mortgages, which considering a debt of 108 M € for Sanlucar town hall (REPS 2010) and the bankruptcy of some regional governments (i.e. Palma de Mallorca, Barcelona) leading to instability in the national financial markets seem largely unrealistic. The objective instead was to look for local and innovative solutions through adjustments of budget & policy that: 1) could bring the project closer to the people ensuring it becomes self-sustaining, and 2) make it as affordable as possible. According to the principle, the solutions proposed will be technology-specific, hence non-interchangeable, given the particular and distinctive characteristics both at the technical and policy level.
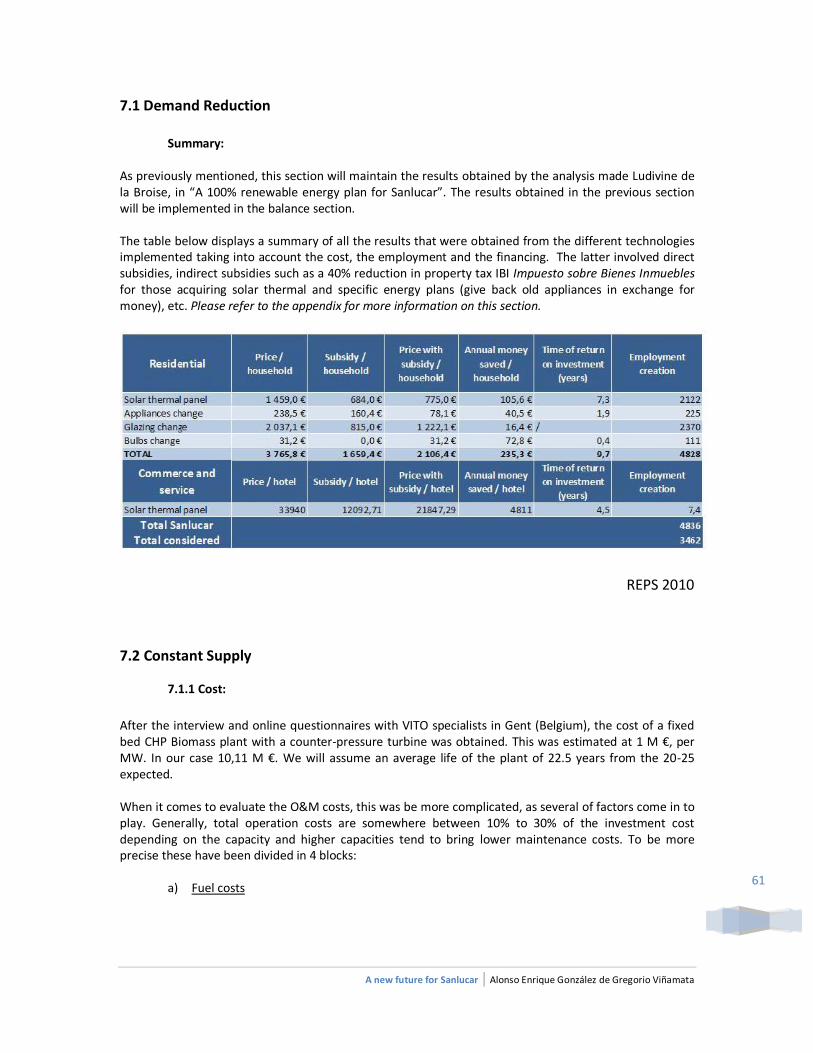
A new future for Sanlucar | Alonso Enrique González de Gregorio Viñamata
61
7.1 Demand Reduction
Summary:
As previously mentioned, this section will maintain the results obtained by the analysis made Ludivine de la Broise, in “A 100% renewable energy plan for Sanlucar”. The results obtained in the previous section will be implemented in the balance section. The table below displays a summary of all the results that were obtained from the different technologies implemented taking into account the cost, the employment and the financing. The latter involved direct subsidies, indirect subsidies such as a 40% reduction in property tax IBI Impuesto sobre Bienes Inmuebles for those acquiring solar thermal and specific energy plans (give back old appliances in exchange for money), etc. Please refer to the appendix for more information on this section.
REPS 2010
7.2 Constant Supply
7.1.1 Cost:
After the interview and online questionnaires with VITO specialists in Gent (Belgium), the cost of a fixed bed CHP Biomass plant with a counter-pressure turbine was obtained. This was estimated at 1 M €, per MW. In our case 10,11 M €. We will assume an average life of the plant of 22.5 years from the 20-25 expected. When it comes to evaluate the O&M costs, this was be more complicated, as several of factors come in to play. Generally, total operation costs are somewhere between 10% to 30% of the investment cost depending on the capacity and higher capacities tend to bring lower maintenance costs. To be more precise these have been divided in 4 blocks:
a) Fuel costs
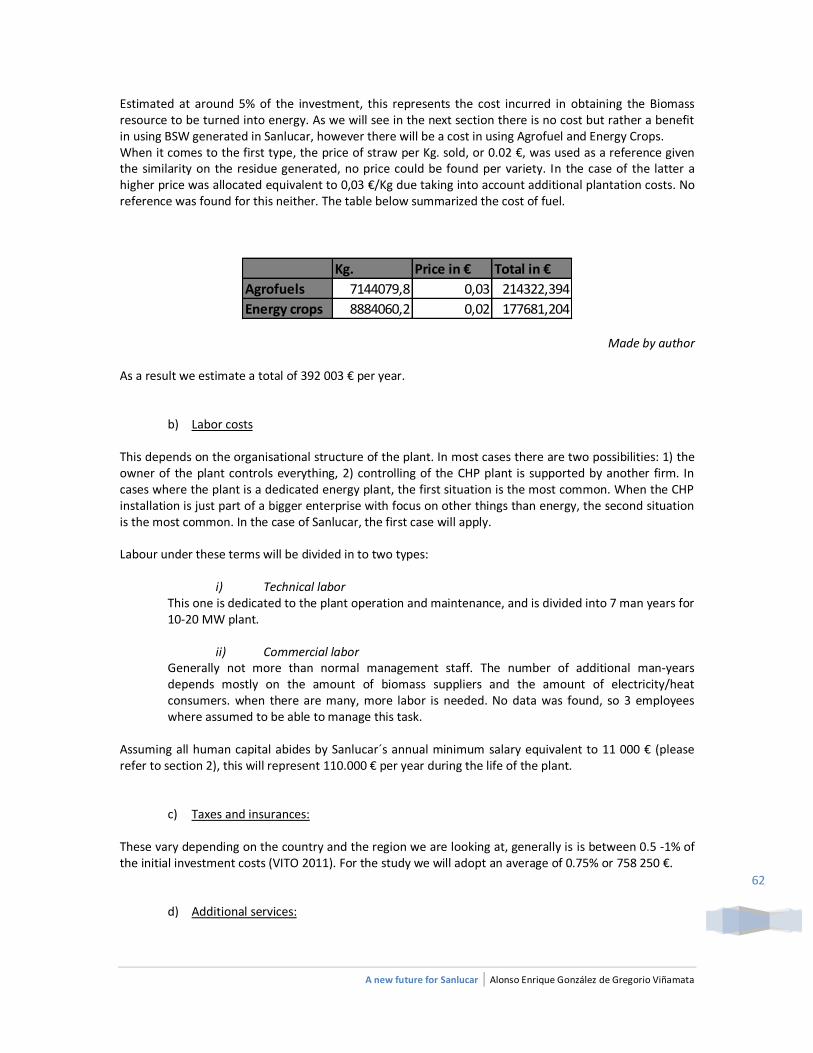
A new future for Sanlucar | Alonso Enrique González de Gregorio Viñamata
62
Estimated at around 5% of the investment, this represents the cost incurred in obtaining the Biomass resource to be turned into energy. As we will see in the next section there is no cost but rather a benefit in using BSW generated in Sanlucar, however there will be a cost in using Agrofuel and Energy Crops. When it comes to the first type, the price of straw per Kg. sold, or 0.02 €, was used as a reference given the similarity on the residue generated, no price could be found per variety. In the case of the latter a higher price was allocated equivalent to 0,03 €/Kg due taking into account additional plantation costs. No reference was found for this neither. The table below summarized the cost of fuel.
Kg. Price in € Total in €
Agrofuels 7144079,8 0,03 214322,394
Energy crops 8884060,2 0,02 177681,204
Made by author As a result we estimate a total of 392 003 € per year.
b) Labor costs
This depends on the organisational structure of the plant. In most cases there are two possibilities: 1) the owner of the plant controls everything, 2) controlling of the CHP plant is supported by another firm. In cases where the plant is a dedicated energy plant, the first situation is the most common. When the CHP installation is just part of a bigger enterprise with focus on other things than energy, the second situation is the most common. In the case of Sanlucar, the first case will apply. Labour under these terms will be divided in to two types:
i) Technical labor This one is dedicated to the plant operation and maintenance, and is divided into 7 man years for 10-20 MW plant.
ii) Commercial labor Generally not more than normal management staff. The number of additional man-years depends mostly on the amount of biomass suppliers and the amount of electricity/heat consumers. when there are many, more labor is needed. No data was found, so 3 employees where assumed to be able to manage this task.
Assuming all human capital abides by Sanlucar´s annual minimum salary equivalent to 11 000 € (please refer to section 2), this will represent 110.000 € per year during the life of the plant.
c) Taxes and insurances: These vary depending on the country and the region we are looking at, generally is is between 0.5 -1% of the initial investment costs (VITO 2011). For the study we will adopt an average of 0.75% or 758 250 €.
d) Additional services:
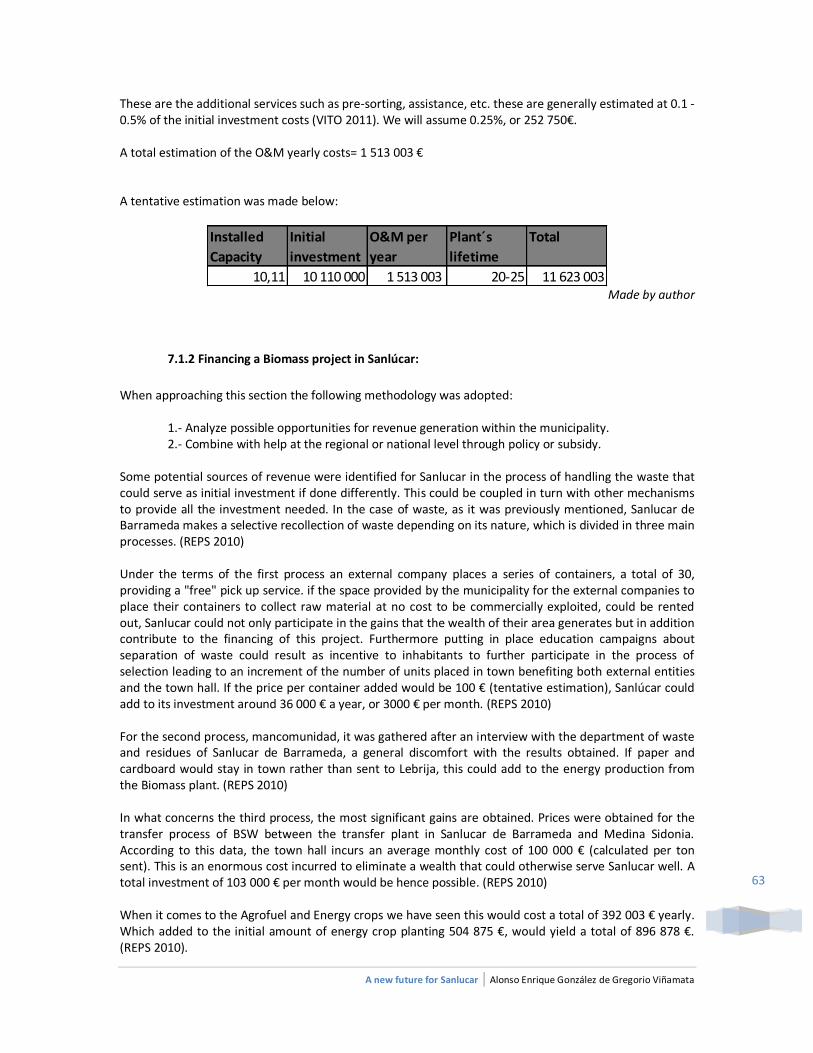
A new future for Sanlucar | Alonso Enrique González de Gregorio Viñamata
63
These are the additional services such as pre-sorting, assistance, etc. these are generally estimated at 0.1 - 0.5% of the initial investment costs (VITO 2011). We will assume 0.25%, or 252 750€. A total estimation of the O&M yearly costs= 1 513 003 € A tentative estimation was made below:
Installed
Capacity
Initial
investment
O&M per
year
Plant´s
lifetime
Total
10,11 10 110 000 1 513 003 20-25 11 623 003 Made by author
7.1.2 Financing a Biomass project in Sanlúcar:
When approaching this section the following methodology was adopted:
1.- Analyze possible opportunities for revenue generation within the municipality. 2.- Combine with help at the regional or national level through policy or subsidy.
Some potential sources of revenue were identified for Sanlucar in the process of handling the waste that could serve as initial investment if done differently. This could be coupled in turn with other mechanisms to provide all the investment needed. In the case of waste, as it was previously mentioned, Sanlucar de Barrameda makes a selective recollection of waste depending on its nature, which is divided in three main processes. (REPS 2010) Under the terms of the first process an external company places a series of containers, a total of 30, providing a "free" pick up service. if the space provided by the municipality for the external companies to place their containers to collect raw material at no cost to be commercially exploited, could be rented out, Sanlucar could not only participate in the gains that the wealth of their area generates but in addition contribute to the financing of this project. Furthermore putting in place education campaigns about separation of waste could result as incentive to inhabitants to further participate in the process of selection leading to an increment of the number of units placed in town benefiting both external entities and the town hall. If the price per container added would be 100 € (tentative estimation), Sanlúcar could add to its investment around 36 000 € a year, or 3000 € per month. (REPS 2010) For the second process, mancomunidad, it was gathered after an interview with the department of waste and residues of Sanlucar de Barrameda, a general discomfort with the results obtained. If paper and cardboard would stay in town rather than sent to Lebrija, this could add to the energy production from the Biomass plant. (REPS 2010) In what concerns the third process, the most significant gains are obtained. Prices were obtained for the transfer process of BSW between the transfer plant in Sanlucar de Barrameda and Medina Sidonia. According to this data, the town hall incurs an average monthly cost of 100 000 € (calculated per ton sent). This is an enormous cost incurred to eliminate a wealth that could otherwise serve Sanlucar well. A total investment of 103 000 € per month would be hence possible. (REPS 2010) When it comes to the Agrofuel and Energy crops we have seen this would cost a total of 392 003 € yearly. Which added to the initial amount of energy crop planting 504 875 €, would yield a total of 896 878 €. (REPS 2010).
A new future for Sanlucar | Alonso Enrique González de Gregorio Viñamata
64
An interesting solution both to finance, manage and ensure the long-life of the plant the creation of cooperatives inspired by the Scandinavian model could be an interesting option. Via reducing or eliminating the price of biofuel in exchange of a part (or share) in the Biomass plant we could be providing a constant source of revenue (dividend per share owned) for farmers/ producers and ensuring a constant supply, as farmers would be also interested in the correct running of the plant they partly own. This process could be carried through the signing of a long term contract (for example the length of the project or the life of the biomass plant) where a cooperative/s could be put in place depending on fuel source where farmers would pay for a share of the biomass plant through their crops. Therefore, through this process farmers would not only engage themselves in supplying a constant amount of fuel, at a constant rate, regardless of market fluctuations but also eliminate, for both parties, uncertainties on price and quantity sold. This plant could be run in turn by three parties whose interests are linked to the correct running of the plant, therefore the town hall, the energy crop cooperative and the cereal waste cooperative. (REPS 2010) This is a profitable structure as in any decision a coalition would be needed and no party could force the others to comply to solutions for its own benefit. Nevertheless it is important to mention that a legal framework would have to be put in place taking into account inflation as well as surplus and shortages of fuel supply. After interviews carried with the town hall, it was mentioned that private ownership was a better option for Andalucia, as they were deemed to work more efficiently. (REPS 2010) A solution to this problem inspired in the Frederikshavn example, the Lolland case (BAS) or even in the island of Samso (The Samso Energy Academy) Sanlucar could impinge the creation of an independent team or agency, financed by the waste readjustments with a technical character whose purpose would be to make sure the energy plan follows route acting independently to whomever political party is governing the locality. (REPS 2010) When it comes to estimating the tariff price for the Biomass plant, a series of holes were pinpointed in the Spanish law (BOE Real Decreto 661/2007, del 25 of mayo por el que se regula la actividad de producción de energía electrica en regimen especial). First under the definitions of "regimen especial" different sets of categories corresponding to different sets of renewable energy technologies were created. When it comes to co-generation through direct combustion, the technology used in our case, different tariffs apply to different types of Biomass used. Under this premise the tariff will be defined according to that source that provides the 90% of the fuel to the plant, without taking into consideration hybrids (mixes of sources) and will change, depending on the capactity and the time (high tariff the first 15 years and a reduced one the next). (REPS 2010) When it comes to Energy crops (subgroup a 1.3. fuel subgroup b.6.1.), if these provide 90% or more the tariffs will reach 14,7 c/C/kWh the first 15 years, and 12,3 the next for a capacity of 2MW, in the case of residues from agriculture (subgroup a 1.3. fuel subgroup b.6.2.) this will reach 10,8 c/C/kWh for the first 15 years and 8,1 c/C/kWh the next. (REPS 2010) Regarding Biomass fuel coming from BSW (Biodegradable or organic Municipal Solid Waste) no category exists, however there exists a category for Municipal Solid and the tariff is very inferior (category c. subgroup c.1.) 5,4 c/C/KWh. In the case of subgroup c the law establishes that the majority will be 70% instead of 90% and does not explain what would implicate the mix of this resource with other subgroups. This creates a strong disincentive for producers and entrepreneurs in various forms creating an incentive to use non-renewable biomass fuel sources. First even though metal and glass can be prejudicial to furnaces requiring a pre-treatment of the biomass fuel, plastics do not, while carrying in addition a low heating value which could be interesting in terms of energy production. (REPS 2010)
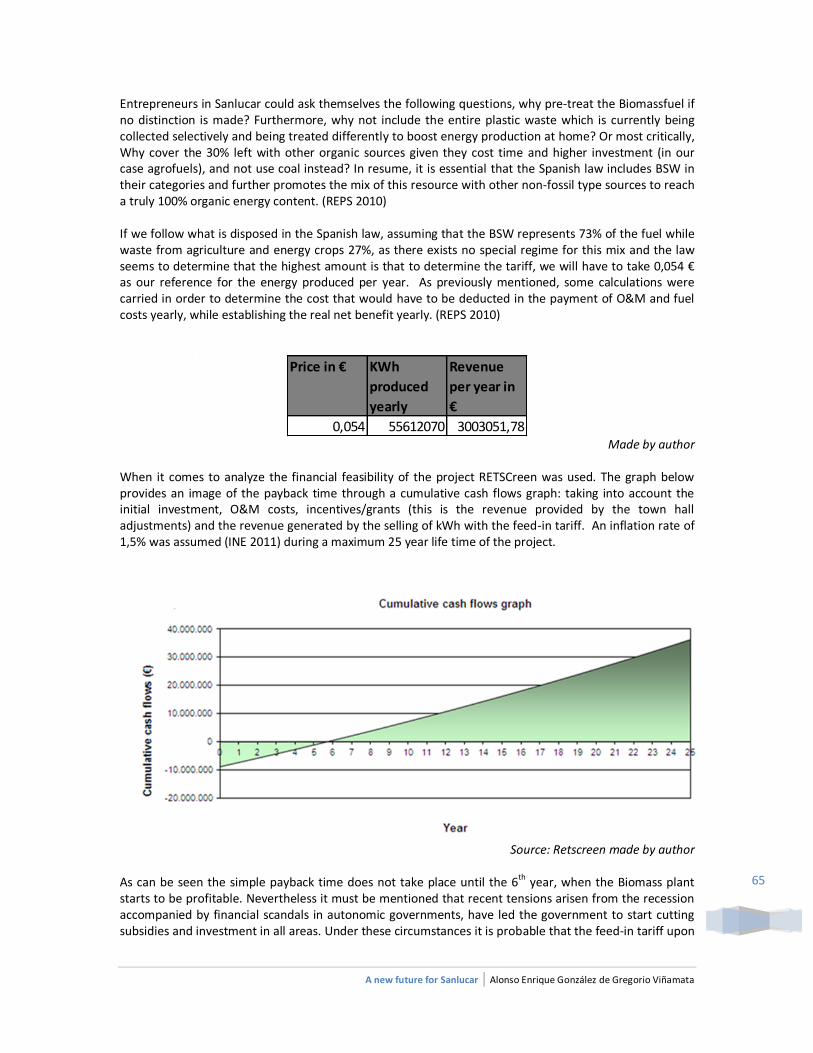
A new future for Sanlucar | Alonso Enrique González de Gregorio Viñamata
65
Entrepreneurs in Sanlucar could ask themselves the following questions, why pre-treat the Biomassfuel if no distinction is made? Furthermore, why not include the entire plastic waste which is currently being collected selectively and being treated differently to boost energy production at home? Or most critically, Why cover the 30% left with other organic sources given they cost time and higher investment (in our case agrofuels), and not use coal instead? In resume, it is essential that the Spanish law includes BSW in their categories and further promotes the mix of this resource with other non-fossil type sources to reach a truly 100% organic energy content. (REPS 2010) If we follow what is disposed in the Spanish law, assuming that the BSW represents 73% of the fuel while waste from agriculture and energy crops 27%, as there exists no special regime for this mix and the law seems to determine that the highest amount is that to determine the tariff, we will have to take 0,054 € as our reference for the energy produced per year. As previously mentioned, some calculations were carried in order to determine the cost that would have to be deducted in the payment of O&M and fuel costs yearly, while establishing the real net benefit yearly. (REPS 2010)
Price in € KWh
produced
yearly
Revenue
per year in
€
0,054 55612070 3003051,78 Made by author
When it comes to analyze the financial feasibility of the project RETSCreen was used. The graph below provides an image of the payback time through a cumulative cash flows graph: taking into account the initial investment, O&M costs, incentives/grants (this is the revenue provided by the town hall adjustments) and the revenue generated by the selling of kWh with the feed-in tariff. An inflation rate of 1,5% was assumed (INE 2011) during a maximum 25 year life time of the project.
Source: Retscreen made by author
As can be seen the simple payback time does not take place until the 6th year, when the Biomass plant starts to be profitable. Nevertheless it must be mentioned that recent tensions arisen from the recession accompanied by financial scandals in autonomic governments, have led the government to start cutting subsidies and investment in all areas. Under these circumstances it is probable that the feed-in tariff upon
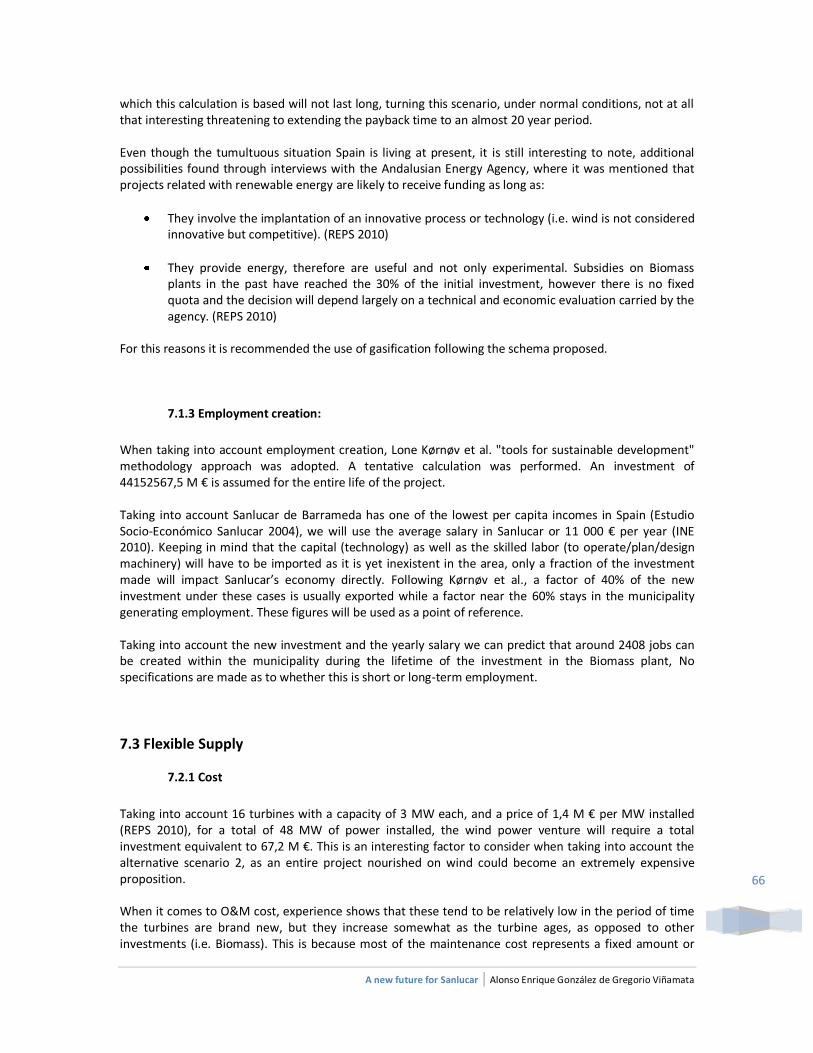
A new future for Sanlucar | Alonso Enrique González de Gregorio Viñamata
66
which this calculation is based will not last long, turning this scenario, under normal conditions, not at all that interesting threatening to extending the payback time to an almost 20 year period. Even though the tumultuous situation Spain is living at present, it is still interesting to note, additional possibilities found through interviews with the Andalusian Energy Agency, where it was mentioned that projects related with renewable energy are likely to receive funding as long as:
They involve the implantation of an innovative process or technology (i.e. wind is not considered innovative but competitive). (REPS 2010)
They provide energy, therefore are useful and not only experimental. Subsidies on Biomass plants in the past have reached the 30% of the initial investment, however there is no fixed quota and the decision will depend largely on a technical and economic evaluation carried by the agency. (REPS 2010)
For this reasons it is recommended the use of gasification following the schema proposed.
7.1.3 Employment creation:
When taking into account employment creation, Lone Kørnøv et al. "tools for sustainable development" methodology approach was adopted. A tentative calculation was performed. An investment of 44152567,5 M € is assumed for the entire life of the project. Taking into account Sanlucar de Barrameda has one of the lowest per capita incomes in Spain (Estudio Socio-Económico Sanlucar 2004), we will use the average salary in Sanlucar or 11 000 € per year (INE 2010). Keeping in mind that the capital (technology) as well as the skilled labor (to operate/plan/design machinery) will have to be imported as it is yet inexistent in the area, only a fraction of the investment made will impact Sanlucar’s economy directly. Following Kørnøv et al., a factor of 40% of the new investment under these cases is usually exported while a factor near the 60% stays in the municipality generating employment. These figures will be used as a point of reference. Taking into account the new investment and the yearly salary we can predict that around 2408 jobs can be created within the municipality during the lifetime of the investment in the Biomass plant, No specifications are made as to whether this is short or long-term employment.
7.3 Flexible Supply
7.2.1 Cost
Taking into account 16 turbines with a capacity of 3 MW each, and a price of 1,4 M € per MW installed (REPS 2010), for a total of 48 MW of power installed, the wind power venture will require a total investment equivalent to 67,2 M €. This is an interesting factor to consider when taking into account the alternative scenario 2, as an entire project nourished on wind could become an extremely expensive proposition. When it comes to O&M cost, experience shows that these tend to be relatively low in the period of time the turbines are brand new, but they increase somewhat as the turbine ages, as opposed to other investments (i.e. Biomass). This is because most of the maintenance cost represents a fixed amount or
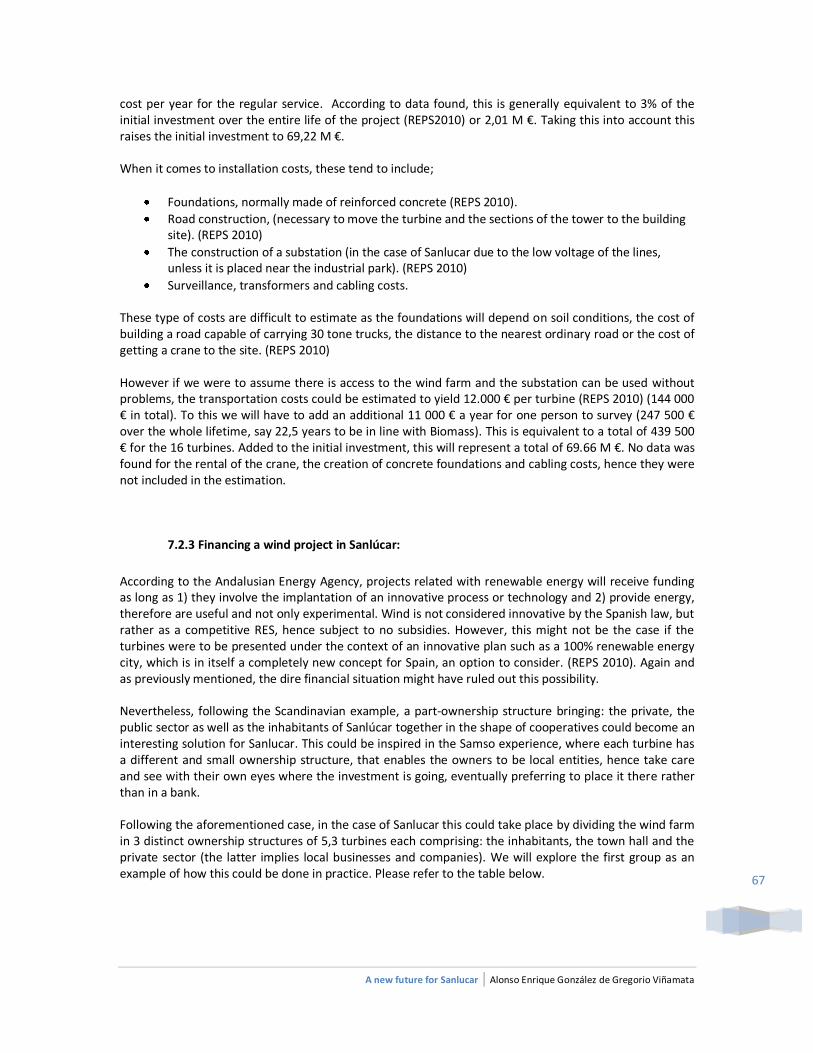
A new future for Sanlucar | Alonso Enrique González de Gregorio Viñamata
67
cost per year for the regular service. According to data found, this is generally equivalent to 3% of the initial investment over the entire life of the project (REPS2010) or 2,01 M €. Taking this into account this raises the initial investment to 69,22 M €. When it comes to installation costs, these tend to include;
Foundations, normally made of reinforced concrete (REPS 2010).
Road construction, (necessary to move the turbine and the sections of the tower to the building site). (REPS 2010)
The construction of a substation (in the case of Sanlucar due to the low voltage of the lines, unless it is placed near the industrial park). (REPS 2010)
Surveillance, transformers and cabling costs. These type of costs are difficult to estimate as the foundations will depend on soil conditions, the cost of building a road capable of carrying 30 tone trucks, the distance to the nearest ordinary road or the cost of getting a crane to the site. (REPS 2010) However if we were to assume there is access to the wind farm and the substation can be used without problems, the transportation costs could be estimated to yield 12.000 € per turbine (REPS 2010) (144 000 € in total). To this we will have to add an additional 11 000 € a year for one person to survey (247 500 € over the whole lifetime, say 22,5 years to be in line with Biomass). This is equivalent to a total of 439 500 € for the 16 turbines. Added to the initial investment, this will represent a total of 69.66 M €. No data was found for the rental of the crane, the creation of concrete foundations and cabling costs, hence they were not included in the estimation.
7.2.3 Financing a wind project in Sanlúcar:
According to the Andalusian Energy Agency, projects related with renewable energy will receive funding as long as 1) they involve the implantation of an innovative process or technology and 2) provide energy, therefore are useful and not only experimental. Wind is not considered innovative by the Spanish law, but rather as a competitive RES, hence subject to no subsidies. However, this might not be the case if the turbines were to be presented under the context of an innovative plan such as a 100% renewable energy city, which is in itself a completely new concept for Spain, an option to consider. (REPS 2010). Again and as previously mentioned, the dire financial situation might have ruled out this possibility. Nevertheless, following the Scandinavian example, a part-ownership structure bringing: the private, the public sector as well as the inhabitants of Sanlúcar together in the shape of cooperatives could become an interesting solution for Sanlucar. This could be inspired in the Samso experience, where each turbine has a different and small ownership structure, that enables the owners to be local entities, hence take care and see with their own eyes where the investment is going, eventually preferring to place it there rather than in a bank. Following the aforementioned case, in the case of Sanlucar this could take place by dividing the wind farm in 3 distinct ownership structures of 5,3 turbines each comprising: the inhabitants, the town hall and the private sector (the latter implies local businesses and companies). We will explore the first group as an example of how this could be done in practice. Please refer to the table below.
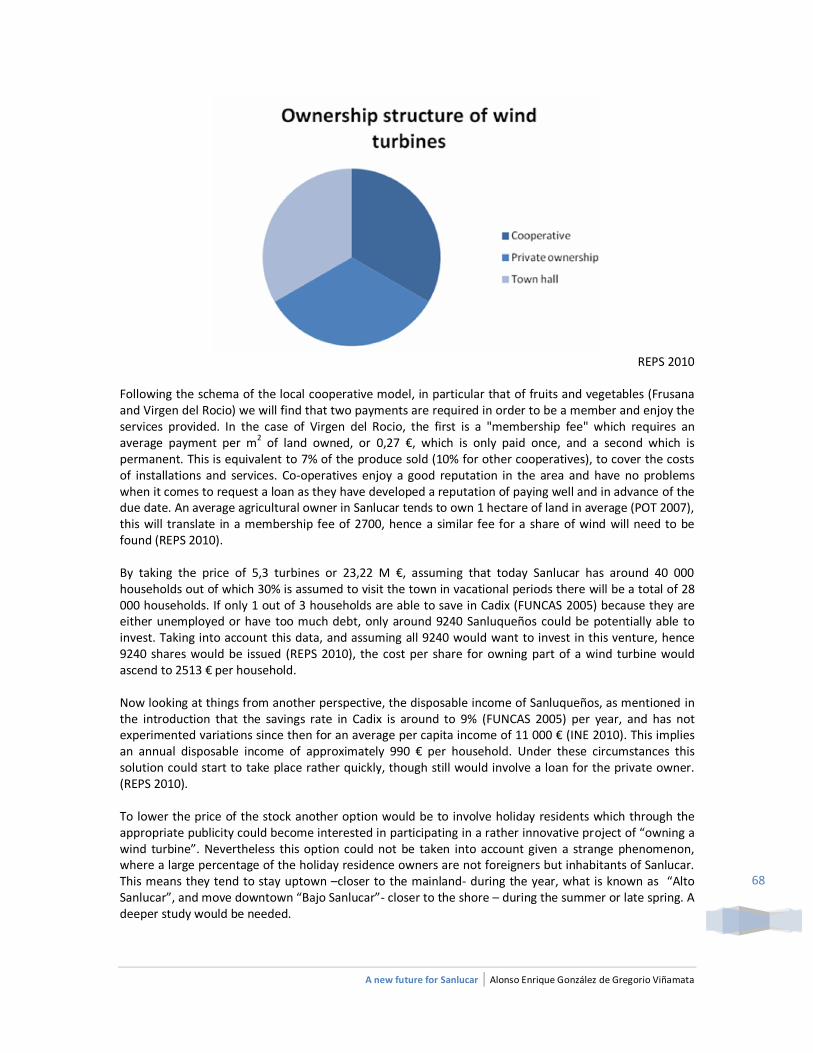
A new future for Sanlucar | Alonso Enrique González de Gregorio Viñamata
68
REPS 2010
Following the schema of the local cooperative model, in particular that of fruits and vegetables (Frusana and Virgen del Rocio) we will find that two payments are required in order to be a member and enjoy the services provided. In the case of Virgen del Rocio, the first is a "membership fee" which requires an average payment per m2 of land owned, or 0,27 €, which is only paid once, and a second which is permanent. This is equivalent to 7% of the produce sold (10% for other cooperatives), to cover the costs of installations and services. Co-operatives enjoy a good reputation in the area and have no problems when it comes to request a loan as they have developed a reputation of paying well and in advance of the due date. An average agricultural owner in Sanlucar tends to own 1 hectare of land in average (POT 2007), this will translate in a membership fee of 2700, hence a similar fee for a share of wind will need to be found (REPS 2010). By taking the price of 5,3 turbines or 23,22 M €, assuming that today Sanlucar has around 40 000 households out of which 30% is assumed to visit the town in vacational periods there will be a total of 28 000 households. If only 1 out of 3 households are able to save in Cadix (FUNCAS 2005) because they are either unemployed or have too much debt, only around 9240 Sanluqueños could be potentially able to invest. Taking into account this data, and assuming all 9240 would want to invest in this venture, hence 9240 shares would be issued (REPS 2010), the cost per share for owning part of a wind turbine would ascend to 2513 € per household. Now looking at things from another perspective, the disposable income of Sanluqueños, as mentioned in the introduction that the savings rate in Cadix is around to 9% (FUNCAS 2005) per year, and has not experimented variations since then for an average per capita income of 11 000 € (INE 2010). This implies an annual disposable income of approximately 990 € per household. Under these circumstances this solution could start to take place rather quickly, though still would involve a loan for the private owner. (REPS 2010). To lower the price of the stock another option would be to involve holiday residents which through the appropriate publicity could become interested in participating in a rather innovative project of “owning a wind turbine”. Nevertheless this option could not be taken into account given a strange phenomenon, where a large percentage of the holiday residence owners are not foreigners but inhabitants of Sanlucar. This means they tend to stay uptown –closer to the mainland- during the year, what is known as “Alto Sanlucar”, and move downtown “Bajo Sanlucar”- closer to the shore – during the summer or late spring. A deeper study would be needed.
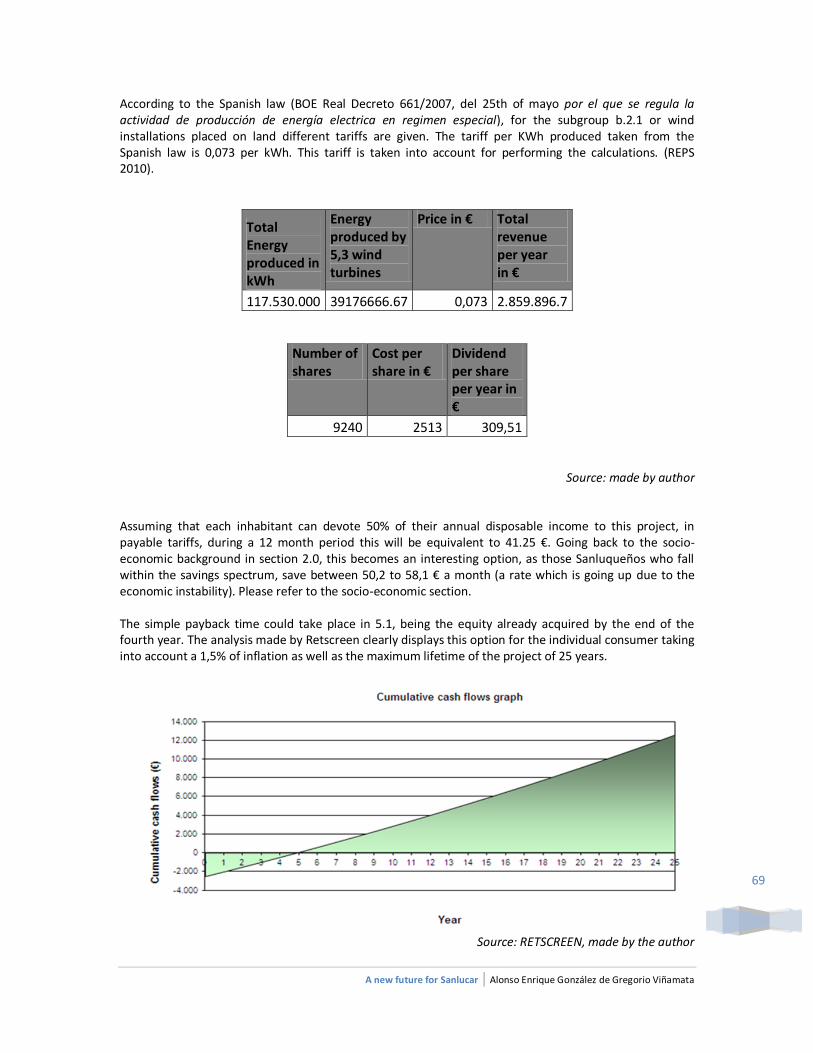
A new future for Sanlucar | Alonso Enrique González de Gregorio Viñamata
69
According to the Spanish law (BOE Real Decreto 661/2007, del 25th of mayo por el que se regula la actividad de producción de energía electrica en regimen especial), for the subgroup b.2.1 or wind installations placed on land different tariffs are given. The tariff per KWh produced taken from the Spanish law is 0,073 per kWh. This tariff is taken into account for performing the calculations. (REPS 2010).
Total Energy produced in kWh
Energy produced by 5,3 wind turbines
Price in € Total revenue per year in €
117.530.000 39176666.67 0,073 2.859.896.7
Number of shares
Cost per share in €
Dividend per share per year in €
9240 2513 309,51
Source: made by author Assuming that each inhabitant can devote 50% of their annual disposable income to this project, in payable tariffs, during a 12 month period this will be equivalent to 41.25 €. Going back to the socio-economic background in section 2.0, this becomes an interesting option, as those Sanluqueños who fall within the savings spectrum, save between 50,2 to 58,1 € a month (a rate which is going up due to the economic instability). Please refer to the socio-economic section. The simple payback time could take place in 5.1, being the equity already acquired by the end of the fourth year. The analysis made by Retscreen clearly displays this option for the individual consumer taking into account a 1,5% of inflation as well as the maximum lifetime of the project of 25 years.
Source: RETSCREEN, made by the author
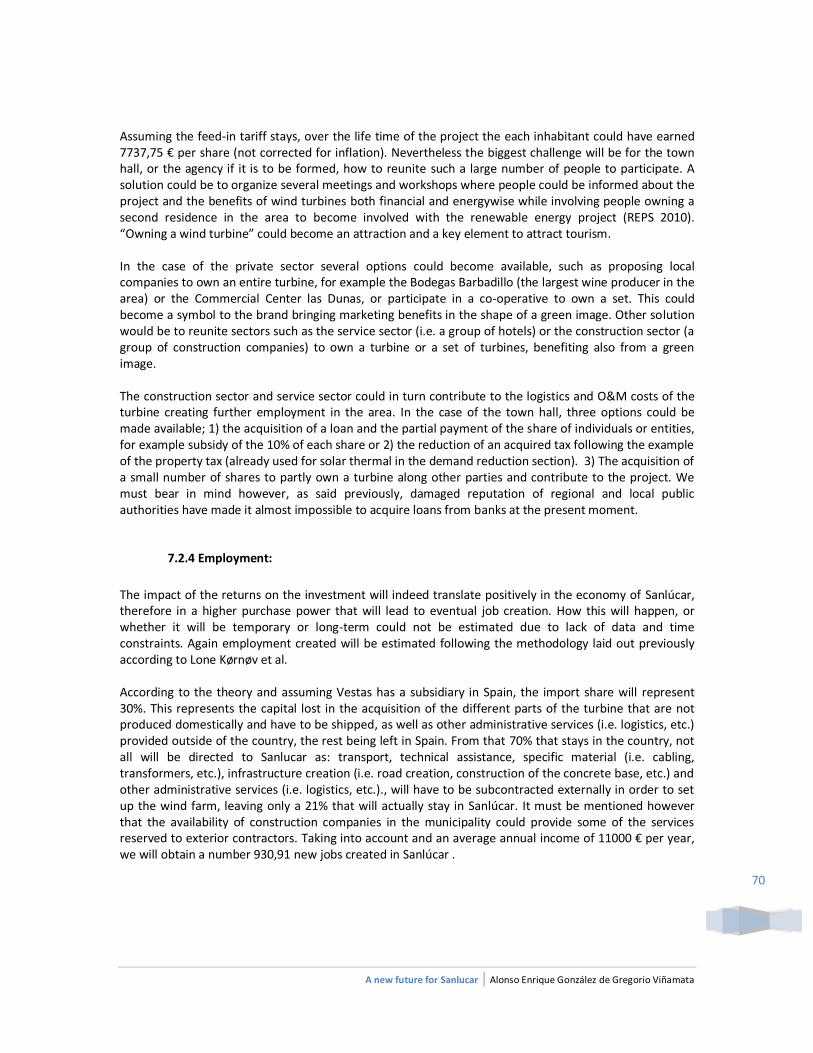
A new future for Sanlucar | Alonso Enrique González de Gregorio Viñamata
70
Assuming the feed-in tariff stays, over the life time of the project the each inhabitant could have earned 7737,75 € per share (not corrected for inflation). Nevertheless the biggest challenge will be for the town hall, or the agency if it is to be formed, how to reunite such a large number of people to participate. A solution could be to organize several meetings and workshops where people could be informed about the project and the benefits of wind turbines both financial and energywise while involving people owning a second residence in the area to become involved with the renewable energy project (REPS 2010). “Owning a wind turbine” could become an attraction and a key element to attract tourism. In the case of the private sector several options could become available, such as proposing local companies to own an entire turbine, for example the Bodegas Barbadillo (the largest wine producer in the area) or the Commercial Center las Dunas, or participate in a co-operative to own a set. This could become a symbol to the brand bringing marketing benefits in the shape of a green image. Other solution would be to reunite sectors such as the service sector (i.e. a group of hotels) or the construction sector (a group of construction companies) to own a turbine or a set of turbines, benefiting also from a green image. The construction sector and service sector could in turn contribute to the logistics and O&M costs of the turbine creating further employment in the area. In the case of the town hall, three options could be made available; 1) the acquisition of a loan and the partial payment of the share of individuals or entities, for example subsidy of the 10% of each share or 2) the reduction of an acquired tax following the example of the property tax (already used for solar thermal in the demand reduction section). 3) The acquisition of a small number of shares to partly own a turbine along other parties and contribute to the project. We must bear in mind however, as said previously, damaged reputation of regional and local public authorities have made it almost impossible to acquire loans from banks at the present moment.
7.2.4 Employment:
The impact of the returns on the investment will indeed translate positively in the economy of Sanlúcar, therefore in a higher purchase power that will lead to eventual job creation. How this will happen, or whether it will be temporary or long-term could not be estimated due to lack of data and time constraints. Again employment created will be estimated following the methodology laid out previously according to Lone Kørnøv et al. According to the theory and assuming Vestas has a subsidiary in Spain, the import share will represent 30%. This represents the capital lost in the acquisition of the different parts of the turbine that are not produced domestically and have to be shipped, as well as other administrative services (i.e. logistics, etc.) provided outside of the country, the rest being left in Spain. From that 70% that stays in the country, not all will be directed to Sanlucar as: transport, technical assistance, specific material (i.e. cabling, transformers, etc.), infrastructure creation (i.e. road creation, construction of the concrete base, etc.) and other administrative services (i.e. logistics, etc.)., will have to be subcontracted externally in order to set up the wind farm, leaving only a 21% that will actually stay in Sanlúcar. It must be mentioned however that the availability of construction companies in the municipality could provide some of the services reserved to exterior contractors. Taking into account and an average annual income of 11000 € per year, we will obtain a number 930,91 new jobs created in Sanlúcar .
A new future for Sanlucar | Alonso Enrique González de Gregorio Viñamata
71
7.3 Storage
7.3.1 Cost & financing
When it comes to estimating the cost, hydrogen, the average price per cubic Newtometer stored seems to be around 6 € per installed Watt which is close to the price of PV in Spain. Nevertheless, at present seems to have become the most interesting option of all. This is because of the talks of a recent launch of a program in the European Union (http://res2h2.com/) that could finance the entire project. Under this stance, this would be the most interesting option to consider for this project. Due to lack of time, Only further study can be recommended. In the case of the led-acid batteries the price is 1714 € c/u. With the aforementioned amount, the total cost incurred would be 5 142 000€ without taking into account the cost of converters and the cost that would imply the renting of the room or place where these batteries would have to be placed (around 200 m2.). (S.S.S. 2011). In the case of Lithium this would amount to 10300 € c/u, and a total investment of 13 680 000 €, which represents twice as much as led-acid. This makes Led-acid a more interesting option for this study. (S.S.S. 2011). No O&M or financing options could be considered for the batteries due to lack of time.
7.3.2 Employment.
There are many companies that provide this service in Spain, therefore as opposed to wind a significant amount of the capital invested will stay in the country. Following the methodology proposed we will consider that a factor of 60% of the investment will stay in the community. For led-acid batteries, the option chosen this will be equivalent to 280 jobs created.
8.0 CONCLUSION
The mission of this study was to improve and complete “A 100% renewable energy plan for Sanlucar”, lack of financial and data sources still proves this task fell short, becoming a mere step forward towards the final goal. By the same token, it becomes obvious through this piece of work, that this project can not be one time endeavor, but must become an ongoing task that takes place before, during and after implementation. In the process of completion of the project, several doubts and dilemmas arose concerning the principle governing the project and whether this was the most appropriate approach given the resources of the area. This is because it was initially thought that the enormous amount of Biomass available at no cost could cover a large percentage the demand needed, if not all, while proving as an essential factor to develop the town economically. Late in the game it was found out, when the conversion was applied, that this was far from the truth. As a result different systems had to be applied at last minute (hydrogen/batteries) in the shape of auxiliary sources of energy in order to provide flexibility to the system in peak hours.
A new future for Sanlucar | Alonso Enrique González de Gregorio Viñamata
72
8.1 Alternative scenario 2 A more plausible or a more “well-rounded” solution for Sanlúcar in technical terms, would have been to cover the entire amount of energy needed by wind alone. Under this stance Biomass, and not batteries, would be used as an auxiliary system to balance the peak periods. By using Biomass flexibly, as it can be stored in pellets and used when necessary, batteries would not have been necessary. Nevertheless it must be mentioned, that in terms of cost, the second alternative scenario would have proved a considerable challenge, running the risk of being completely discarded. The cost of the Biomass solution is today considerably lower to that of wind. It is interesting to note, that the economy was seen as the main problem affecting the town, more than any other factors.
8.2 Implementation: recommendations After an informal conversation maintained with the delegate from industry in the Sanlucar de Barrameda Town Hall, Biomass was envisaged as the first step forward, complemented by demand reduction measures. This is because even though there might be a more appropriate solution from an engineering point of view (refer to alternative scenario 2) from an economic perspective, the current system does make this piece of work understandable and feasible to the municipality. By implementing this plan slowly, step by step, providing confidence as the project grows, adjusting it as it goes along, this gives signs that a higher goal is achievable, and gives time to wait and reinvest when necessary. This would not be the case, for example, if from the very start an investment higher than the entire debt of the town hall would be required (as suggested in alternative scenario 2)… Nevertheless for the project to work the participation of all actors in the system is required, as change not only comes from innovative technology but from setting the necessary infrastructure for it to work while involving those stakeholders which might oppose the system because they don´t understand it (i.e. inhabitants refusing to implement the necessary demand reduction measures), due to high costs (i.e. planting of new crops) or because it creates a conflict with their structure (putting a wind farm over agricultural land). This can happen in four ways: 1) information, which implies organizing talks involving and informing those concerned as well as the entire village, an advertising campaign would also work, 2) Creation of incentives such as the reduction of the IBI tax, 3) involving all actors in the project, making them financially part of it, for example, making it their own, something to be proud of, or 4) The creation of events, such as industrial/energy education fairs, following the example of Frederikshavn energy week. Past experience with other examples calls for strong monitoring and control, in order to avoid private interest and corruption, a solution could be an independent party (such as an energy institute) to manage and promote this change. This is an important factor as a shift in the administration could also cause a shift in the interest, objectives of the project. This idea could contribute to the development making it more endogenous and guaranteed for the long-term, would be the promotion of knowledge creation and diffusion. An institute of energy of Sanlúcar, could be created to be in charge of this project while promoting it through R&D. The institute, located in the park of Las Dunas, for example, could become an ideal place for informing inhabitants, cooperatives, public and private entities of the plan as well as for organizing training programs, educating renewable energy technology or benefits and following the example of the recent expansion of Samso´s Energy
A new future for Sanlucar | Alonso Enrique González de Gregorio Viñamata
73
Institute invite national and foreign researchers becoming an innovation test center inviting foreign parties to participate.
8.3 The Goals and the reality in 2012 As we have seen the goals established initially have been accomplished. The town can be liberated from its illegal dumps and excess waste by creating energy, generating revenue through energy sold and at the same time long-lasting economic activity (whether it involves: the agricultural sector, the construction sector or others). This not only comes in the shape of the energy sold and the new capital & services that will need to be provided but also on the disappearance of costs that are today incurred in eliminating waste, for example. Furthermore, even though Kornov´s broad theory of employment creation is rather questionable, it is clear that new jobs could be created through new activity. As we have seen unemployment could be capped by 68% as 7080 new jobs could be created. It is clear a reactivation of the economy is possible both from a direct and indirect perspective. Nevertheless it must be mentioned, that a new directive (Real decreto por el cual se regulan el precio de la energía en regimen especial B.O.E.) plans to cut (or has cut already), the feed-in tariffs that make these technical solutions so profitable. This cut could represent a 65% of the feed-in tariff applied to this project, bringing it closer to the real price. This change threats to put in jeopardy the renewable energy industry in Spain. However, to conclude on a positive note, which is always important, it is interesting to note that Sanlucar seems to have indirectly started with the 100% renewable energy plan as the construction industry, which has to abide by the new European building code and is looking to exploit a new niche, is making retrofitting a very popular activity in the area… Step 1 is on its way!
A new future for Sanlucar | Alonso Enrique González de Gregorio Viñamata
74
List of References; Plan de Ordenacion Territorial, de la Costa Noroeste P.O.T. (2007). Ayuntamiento de Sanlucar de Barrameda, Cádiz, España. Estudio Socio-economico de Sánlucar de Barrameda (2003-2004). Ayuntamiento de Sanlúcar de Barrameda, Cádiz, España. Del Guayo, I. (2007). Energy Law in Europe. National, EU and International Regulation (Second Edition ed.)., Chapter Energy Law in Spain, pp. 1077–1167. Oxford: Oxford University Press.14.01–14.205. A.R. et al. (2007). Solar energy in Andalusia (Spain): present state and prospects for the future. Spain: University of Granada. European Comision, J. R. C. (2007). Yearly sum of global irradiation on a horizontal surface - spain and portugal. http://re.jrc.ec.europa.eu/pvgis/countries/europe Graber, C. (2005). Wind power in spain. Recinto Universitario de Mayagüez de la Universidad de Puerto Rico. Downloaded: 02.03.2010. Groenewegen, J. and M. van der Steen (2006, June). The evolution of national systems of innovation. Journal of Economic Issues 16, 277–285. GRRN. Garbage is not renewable energy. http://www.grrn.org/landfill/notrenewableenergy/. last accessed 4th June 2010. planogmiljo/em8/BilagPID/slideslecture32010fh.pdf. IDAE, O. (2009). Energy efficiency policies and measures in spain in 2007. Institute, R. M. (2009, November). Hypercar. http://move.rmi.org/markets-in-motion/case-studies/automotive/hypercar.html. Kuada, J. (2008). Research Methods in Social Science - A Student Project Guide. Aalborg:Aalborg University. Kumar, R. (2008). Research Methodology: A step by step guide for beginners (Second Edition ed.). Lund, H. Maïzia, M. (2009). Urban heat. Lecture in UTC, Compiegne. Merriam, S. B. (1998). Qualitative Research and Case Studies Applications in Education. San Francisco: Jossey-Bass Publications. ORFEU. Más de 200.000 viviendas están en situación irregular en andalucía con la gestión socialista en la mayoría de los ayuntamientos y en la junta de andalucía. web. Downloaded:17.05.2010. Rand, D. A., R. Woods, and R. M. Dell (1998). Batteries for electric vehicles. Taunton: Research Studies Press.
Tylecote A & C Galvao (2001) The missing link: innovation and the needs of less-developed country users, in: R Coombs, K Green, A Richards & V Walsh, Technology and the Market: demand, users and innovation, Edward Elgar, pp. 281-296.
Ummels Bart (2008), Wind Integration: Power system operation with large-scale wind power in liberalized environments, Phd Thesis (TU Delft).
A new future for Sanlucar | Alonso Enrique González de Gregorio Viñamata
75
Madeleine Gibescu (15/11/2010), Wind Power Integration, power point presentation, Sustainable Engineering Course (TU Delft). Madeleine Gibescu (23/11/2010), Large-scale Wind Power Storage, power point presentation Sustainable Engineering Course (TU Delft). Kas Hemmes, Superwind Concept, power point presentation and class notes, Course: Technology in Sustainable Development, TU Delft (10/11/2010). (2009), Baterias Estacionarias, web catalogue. Visited the 10/01/2011 http://www. electrotecnia. net/ profesionales /docs / cats +/catbatopzs.pdf Tienda online de Energías Renovables (2009), Tienda Online de Energías Renovables 2009, web page. Visited the 11/01/2011 http://www.proiner.com/index.php?page=shop.product_details&flypage=flypage.tpl&product_id=543&category_id=91&vmcchk=1&option=com_virtuemart&Itemid=3 Hong Kong, Asia’s world city (2009) Selection and Pricing. Online shop, visited 12/10/2011http://www.everspring.net/txt/product-battery-pricing.htm Europa Press (2009) La industria Española paga la luz a precio de oro, web page, visited 13/10/2011.http://www.libertaddigital.com/economia/la-industria-espanola-paga-la-luz-a-precio-de-oro-1276380622/ REA. Renewable energy association, energy environment. http://www.r-e-a.net/info/energy-info. last accessed 4th June 2010. Área Solar, Dpto. de Energías Renovables, J. d. A. (2010). Production of sanitary hot wáter by solar termal energy. http://www.agenciaandaluzadelaenergia.es/ agenciadelaenergia/portal/com/bin/contenidos/proyectos/areas/ energiasRenovables/solar/solar_term1/1185263124893_aae_cte_he4.pdf. Sevillia, E. (2008). Sims, R. E. H. (2002). The Briliance of Bioenergy in business and in practice, Chapter 1. James James (Science Publisher) Ltd. ISBN 1-902916-28-X. Solar Test Installation, Photovoltaic Geographical Information System (PVGIS), E. C. Photovoltaic geographical information system - interactive maps. web. Accesed: 15.04.2010. U.S. Department of Energy, N. R. E. L. N. van der Steen, M., J. Groenewegen, M. Jonker, R. Künneke, and E. Mast (2008). Innovations for a Low Carbon Economy: Economic, Institutional and Management Approaches, Chapter 7, pp. 175–202. Edward Elgar Publishing Limited. ISBN 978-1-84720-382-3. Vestas. Wind turbine product brochure type:V90 3.0mw.
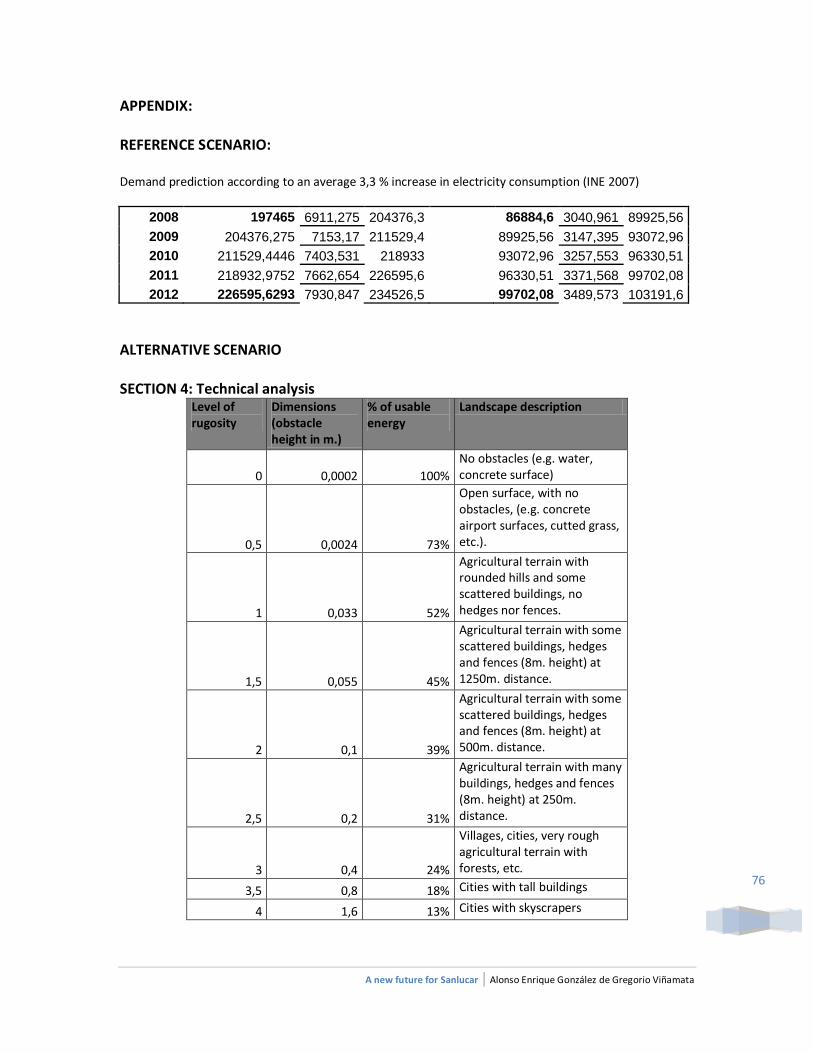
A new future for Sanlucar | Alonso Enrique González de Gregorio Viñamata
76
APPENDIX: REFERENCE SCENARIO: Demand prediction according to an average 3,3 % increase in electricity consumption (INE 2007)
2008 197465 6911,275 204376,3 86884,6 3040,961 89925,56
2009 204376,275 7153,17 211529,4
89925,56 3147,395 93072,96
2010 211529,4446 7403,531 218933
93072,96 3257,553 96330,51
2011 218932,9752 7662,654 226595,6
96330,51 3371,568 99702,08
2012 226595,6293 7930,847 234526,5 99702,08 3489,573 103191,6
ALTERNATIVE SCENARIO SECTION 4: Technical analysis
Level of rugosity
Dimensions (obstacle height in m.)
% of usable energy
Landscape description
0 0,0002 100%
No obstacles (e.g. water, concrete surface)
0,5 0,0024 73%
Open surface, with no obstacles, (e.g. concrete airport surfaces, cutted grass, etc.).
1 0,033 52%
Agricultural terrain with rounded hills and some scattered buildings, no hedges nor fences.
1,5 0,055 45%
Agricultural terrain with some scattered buildings, hedges and fences (8m. height) at 1250m. distance.
2 0,1 39%
Agricultural terrain with some scattered buildings, hedges and fences (8m. height) at 500m. distance.
2,5 0,2 31%
Agricultural terrain with many buildings, hedges and fences (8m. height) at 250m. distance.
3 0,4 24%
Villages, cities, very rough agricultural terrain with forests, etc.
3,5 0,8 18% Cities with tall buildings
4 1,6 13% Cities with skyscrapers
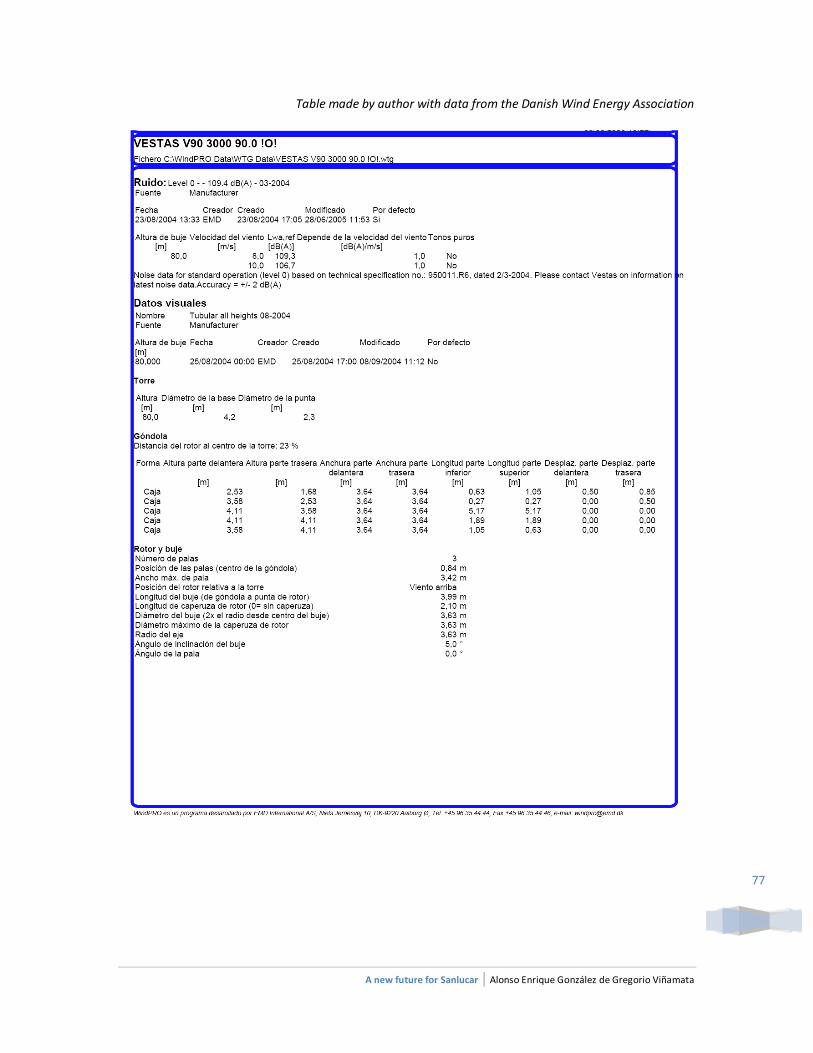
A new future for Sanlucar | Alonso Enrique González de Gregorio Viñamata
77
Table made by author with data from the Danish Wind Energy Association
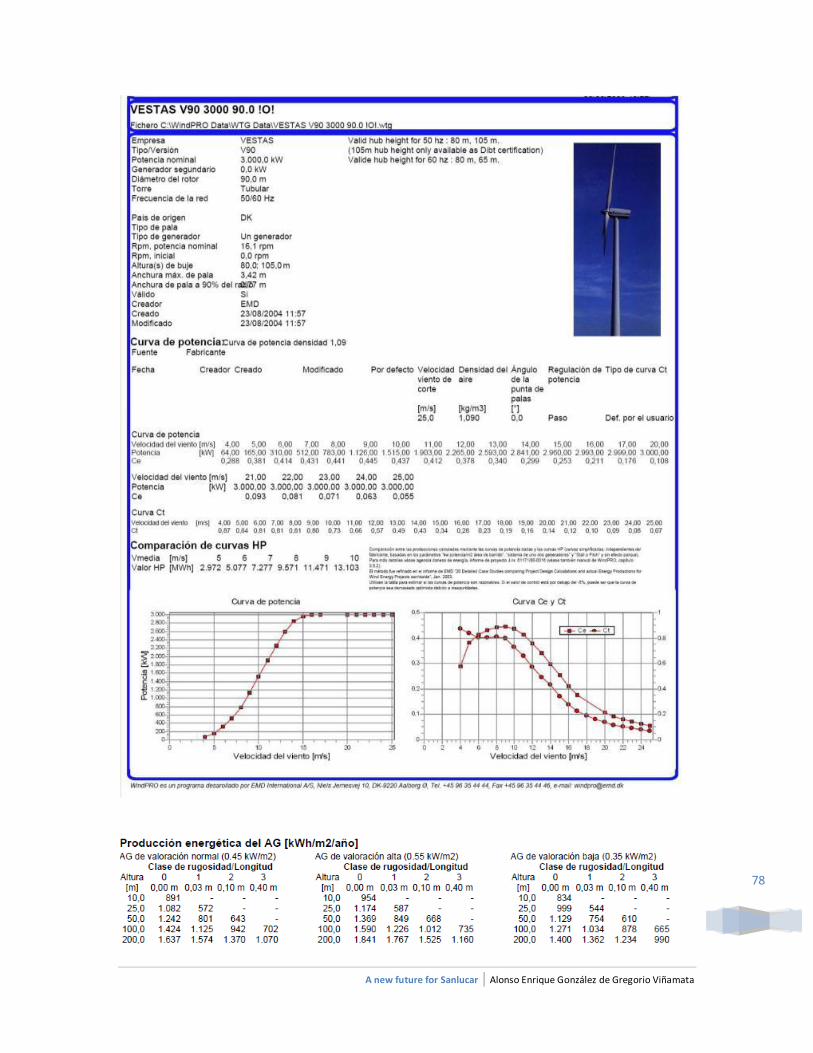
A new future for Sanlucar | Alonso Enrique González de Gregorio Viñamata
78
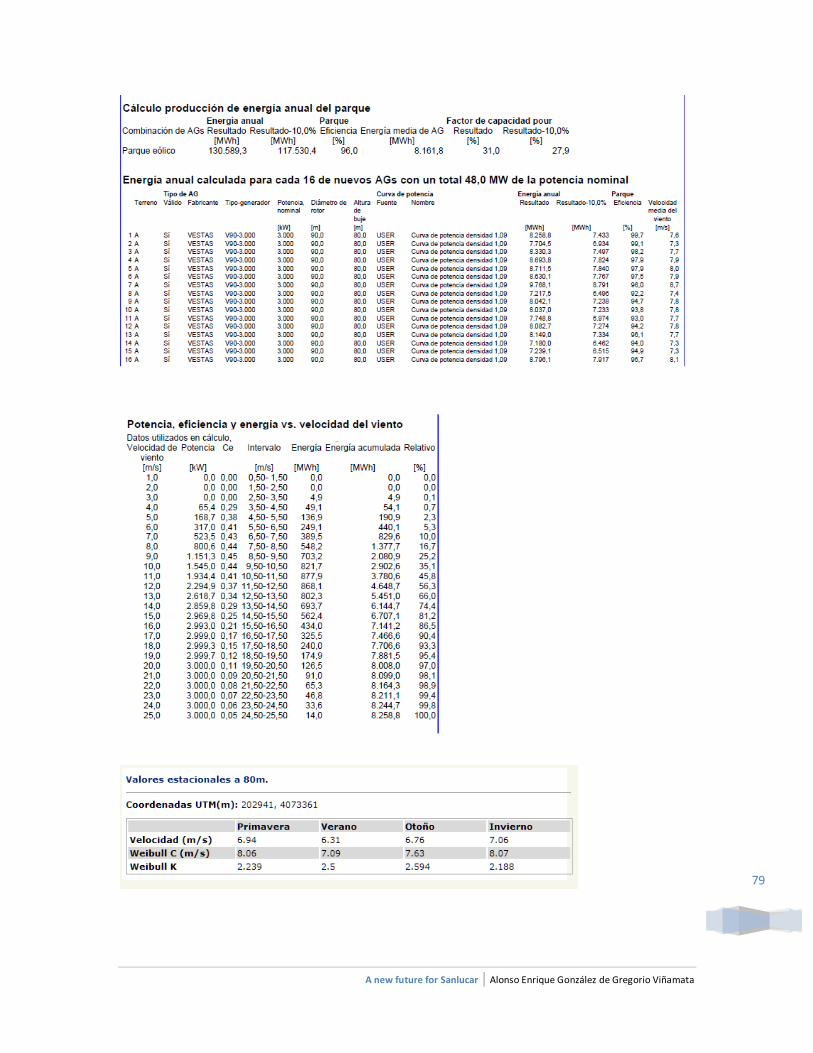
A new future for Sanlucar | Alonso Enrique González de Gregorio Viñamata
79
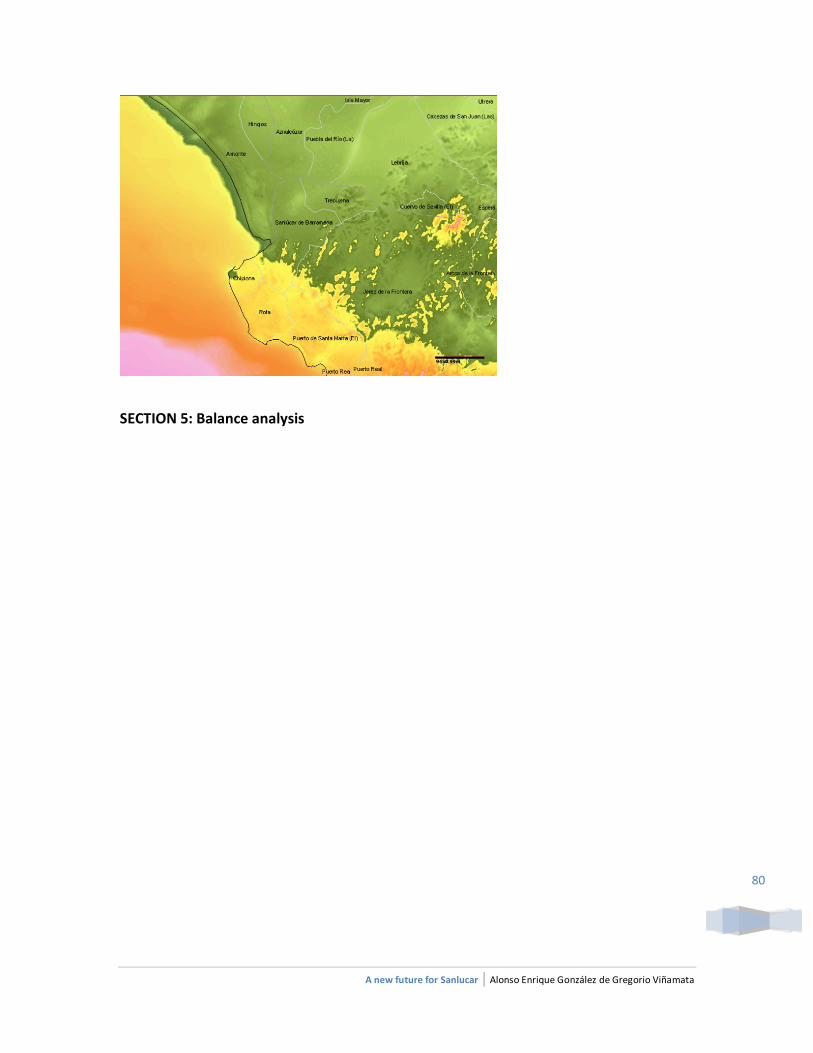
A new future for Sanlucar | Alonso Enrique González de Gregorio Viñamata
80
SECTION 5: Balance analysis
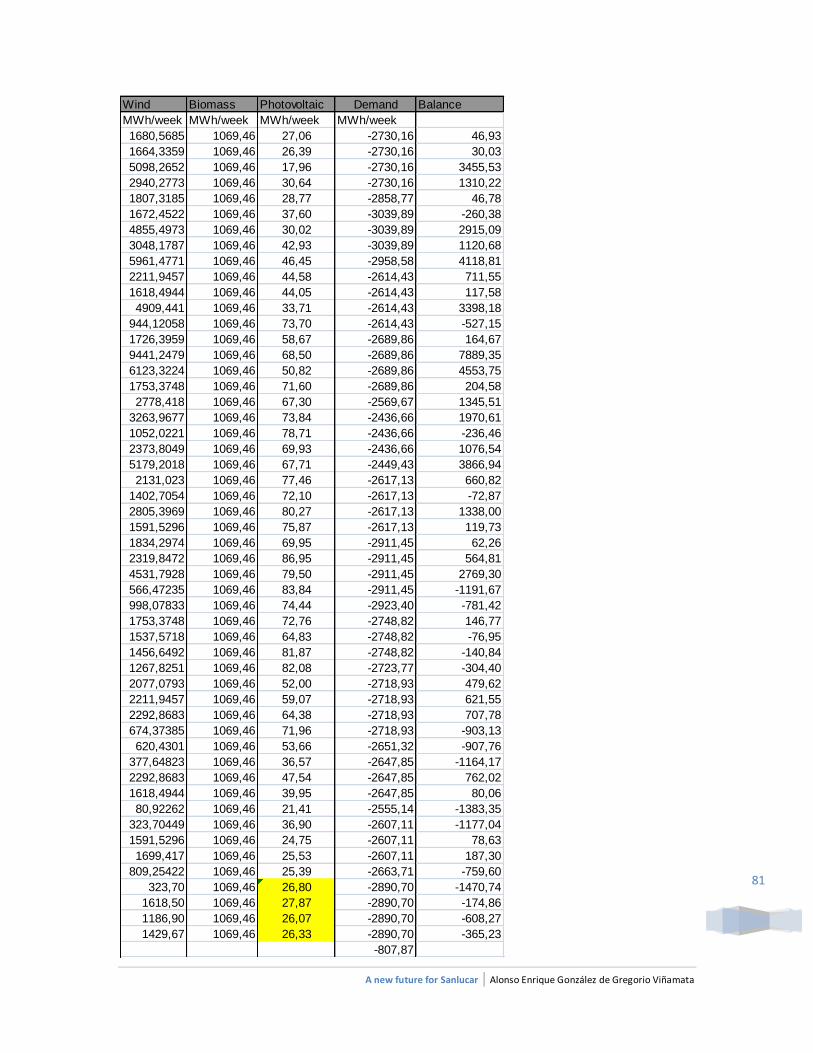
A new future for Sanlucar | Alonso Enrique González de Gregorio Viñamata
81
Wind Biomass Photovoltaic Demand Balance
MWh/week MWh/week MWh/week MWh/week
1680,5685 1069,46 27,06 -2730,16 46,93
1664,3359 1069,46 26,39 -2730,16 30,03
5098,2652 1069,46 17,96 -2730,16 3455,53
2940,2773 1069,46 30,64 -2730,16 1310,22
1807,3185 1069,46 28,77 -2858,77 46,78
1672,4522 1069,46 37,60 -3039,89 -260,38
4855,4973 1069,46 30,02 -3039,89 2915,09
3048,1787 1069,46 42,93 -3039,89 1120,68
5961,4771 1069,46 46,45 -2958,58 4118,81
2211,9457 1069,46 44,58 -2614,43 711,55
1618,4944 1069,46 44,05 -2614,43 117,58
4909,441 1069,46 33,71 -2614,43 3398,18
944,12058 1069,46 73,70 -2614,43 -527,15
1726,3959 1069,46 58,67 -2689,86 164,67
9441,2479 1069,46 68,50 -2689,86 7889,35
6123,3224 1069,46 50,82 -2689,86 4553,75
1753,3748 1069,46 71,60 -2689,86 204,58
2778,418 1069,46 67,30 -2569,67 1345,51
3263,9677 1069,46 73,84 -2436,66 1970,61
1052,0221 1069,46 78,71 -2436,66 -236,46
2373,8049 1069,46 69,93 -2436,66 1076,54
5179,2018 1069,46 67,71 -2449,43 3866,94
2131,023 1069,46 77,46 -2617,13 660,82
1402,7054 1069,46 72,10 -2617,13 -72,87
2805,3969 1069,46 80,27 -2617,13 1338,00
1591,5296 1069,46 75,87 -2617,13 119,73
1834,2974 1069,46 69,95 -2911,45 62,26
2319,8472 1069,46 86,95 -2911,45 564,81
4531,7928 1069,46 79,50 -2911,45 2769,30
566,47235 1069,46 83,84 -2911,45 -1191,67
998,07833 1069,46 74,44 -2923,40 -781,42
1753,3748 1069,46 72,76 -2748,82 146,77
1537,5718 1069,46 64,83 -2748,82 -76,95
1456,6492 1069,46 81,87 -2748,82 -140,84
1267,8251 1069,46 82,08 -2723,77 -304,40
2077,0793 1069,46 52,00 -2718,93 479,62
2211,9457 1069,46 59,07 -2718,93 621,55
2292,8683 1069,46 64,38 -2718,93 707,78
674,37385 1069,46 71,96 -2718,93 -903,13
620,4301 1069,46 53,66 -2651,32 -907,76
377,64823 1069,46 36,57 -2647,85 -1164,17
2292,8683 1069,46 47,54 -2647,85 762,02
1618,4944 1069,46 39,95 -2647,85 80,06
80,92262 1069,46 21,41 -2555,14 -1383,35
323,70449 1069,46 36,90 -2607,11 -1177,04
1591,5296 1069,46 24,75 -2607,11 78,63
1699,417 1069,46 25,53 -2607,11 187,30
809,25422 1069,46 25,39 -2663,71 -759,60
323,70 1069,46 26,80 -2890,70 -1470,74
1618,50 1069,46 27,87 -2890,70 -174,86
1186,90 1069,46 26,07 -2890,70 -608,27
1429,67 1069,46 26,33 -2890,70 -365,23
-807,87
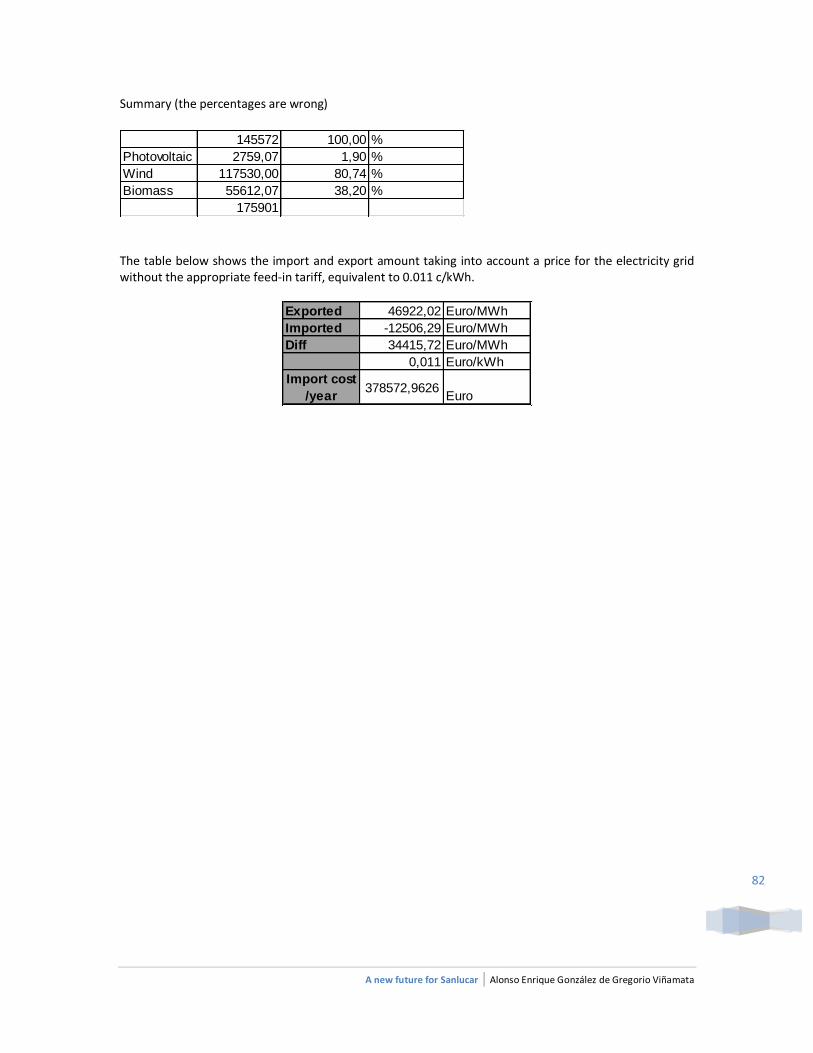
A new future for Sanlucar | Alonso Enrique González de Gregorio Viñamata
82
Summary (the percentages are wrong)
145572 100,00 %
Photovoltaic 2759,07 1,90 %
Wind 117530,00 80,74 %
Biomass 55612,07 38,20 %
175901
The table below shows the import and export amount taking into account a price for the electricity grid without the appropriate feed-in tariff, equivalent to 0.011 c/kWh.
Exported 46922,02 Euro/MWh
Imported -12506,29 Euro/MWh
Diff 34415,72 Euro/MWh
0,011 Euro/kWh
Import cost
/year378572,9626
Euro
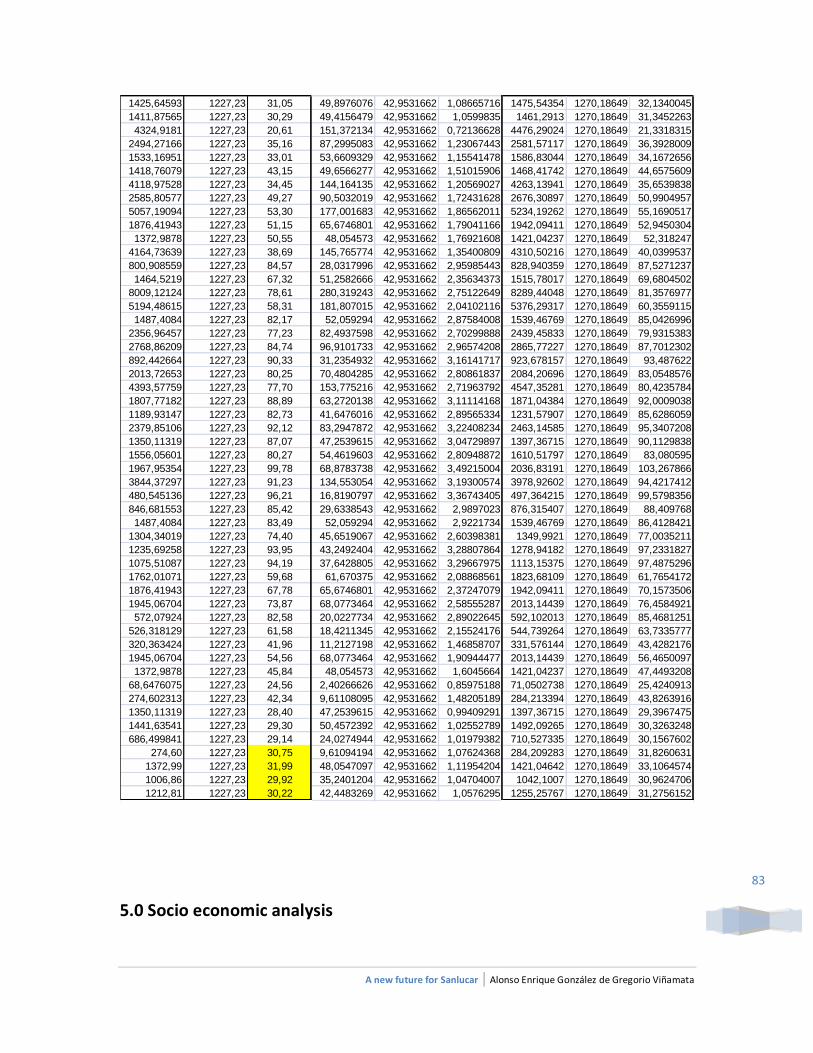
A new future for Sanlucar | Alonso Enrique González de Gregorio Viñamata
83
1425,64593 1227,23 31,05 49,8976076 42,9531662 1,08665716 1475,54354 1270,18649 32,1340045
1411,87565 1227,23 30,29 49,4156479 42,9531662 1,0599835 1461,2913 1270,18649 31,3452263
4324,9181 1227,23 20,61 151,372134 42,9531662 0,72136628 4476,29024 1270,18649 21,3318315
2494,27166 1227,23 35,16 87,2995083 42,9531662 1,23067443 2581,57117 1270,18649 36,3928009
1533,16951 1227,23 33,01 53,6609329 42,9531662 1,15541478 1586,83044 1270,18649 34,1672656
1418,76079 1227,23 43,15 49,6566277 42,9531662 1,51015906 1468,41742 1270,18649 44,6575609
4118,97528 1227,23 34,45 144,164135 42,9531662 1,20569027 4263,13941 1270,18649 35,6539838
2585,80577 1227,23 49,27 90,5032019 42,9531662 1,72431628 2676,30897 1270,18649 50,9904957
5057,19094 1227,23 53,30 177,001683 42,9531662 1,86562011 5234,19262 1270,18649 55,1690517
1876,41943 1227,23 51,15 65,6746801 42,9531662 1,79041166 1942,09411 1270,18649 52,9450304
1372,9878 1227,23 50,55 48,054573 42,9531662 1,76921608 1421,04237 1270,18649 52,318247
4164,73639 1227,23 38,69 145,765774 42,9531662 1,35400809 4310,50216 1270,18649 40,0399537
800,908559 1227,23 84,57 28,0317996 42,9531662 2,95985443 828,940359 1270,18649 87,5271237
1464,5219 1227,23 67,32 51,2582666 42,9531662 2,35634373 1515,78017 1270,18649 69,6804502
8009,12124 1227,23 78,61 280,319243 42,9531662 2,75122649 8289,44048 1270,18649 81,3576977
5194,48615 1227,23 58,31 181,807015 42,9531662 2,04102116 5376,29317 1270,18649 60,3559115
1487,4084 1227,23 82,17 52,059294 42,9531662 2,87584008 1539,46769 1270,18649 85,0426996
2356,96457 1227,23 77,23 82,4937598 42,9531662 2,70299888 2439,45833 1270,18649 79,9315383
2768,86209 1227,23 84,74 96,9101733 42,9531662 2,96574208 2865,77227 1270,18649 87,7012302
892,442664 1227,23 90,33 31,2354932 42,9531662 3,16141717 923,678157 1270,18649 93,487622
2013,72653 1227,23 80,25 70,4804285 42,9531662 2,80861837 2084,20696 1270,18649 83,0548576
4393,57759 1227,23 77,70 153,775216 42,9531662 2,71963792 4547,35281 1270,18649 80,4235784
1807,77182 1227,23 88,89 63,2720138 42,9531662 3,11114168 1871,04384 1270,18649 92,0009038
1189,93147 1227,23 82,73 41,6476016 42,9531662 2,89565334 1231,57907 1270,18649 85,6286059
2379,85106 1227,23 92,12 83,2947872 42,9531662 3,22408234 2463,14585 1270,18649 95,3407208
1350,11319 1227,23 87,07 47,2539615 42,9531662 3,04729897 1397,36715 1270,18649 90,1129838
1556,05601 1227,23 80,27 54,4619603 42,9531662 2,80948872 1610,51797 1270,18649 83,080595
1967,95354 1227,23 99,78 68,8783738 42,9531662 3,49215004 2036,83191 1270,18649 103,267866
3844,37297 1227,23 91,23 134,553054 42,9531662 3,19300574 3978,92602 1270,18649 94,4217412
480,545136 1227,23 96,21 16,8190797 42,9531662 3,36743405 497,364215 1270,18649 99,5798356
846,681553 1227,23 85,42 29,6338543 42,9531662 2,9897023 876,315407 1270,18649 88,409768
1487,4084 1227,23 83,49 52,059294 42,9531662 2,9221734 1539,46769 1270,18649 86,4128421
1304,34019 1227,23 74,40 45,6519067 42,9531662 2,60398381 1349,9921 1270,18649 77,0035211
1235,69258 1227,23 93,95 43,2492404 42,9531662 3,28807864 1278,94182 1270,18649 97,2331827
1075,51087 1227,23 94,19 37,6428805 42,9531662 3,29667975 1113,15375 1270,18649 97,4875296
1762,01071 1227,23 59,68 61,670375 42,9531662 2,08868561 1823,68109 1270,18649 61,7654172
1876,41943 1227,23 67,78 65,6746801 42,9531662 2,37247079 1942,09411 1270,18649 70,1573506
1945,06704 1227,23 73,87 68,0773464 42,9531662 2,58555287 2013,14439 1270,18649 76,4584921
572,07924 1227,23 82,58 20,0227734 42,9531662 2,89022645 592,102013 1270,18649 85,4681251
526,318129 1227,23 61,58 18,4211345 42,9531662 2,15524176 544,739264 1270,18649 63,7335777
320,363424 1227,23 41,96 11,2127198 42,9531662 1,46858707 331,576144 1270,18649 43,4282176
1945,06704 1227,23 54,56 68,0773464 42,9531662 1,90944477 2013,14439 1270,18649 56,4650097
1372,9878 1227,23 45,84 48,054573 42,9531662 1,6045664 1421,04237 1270,18649 47,4493208
68,6476075 1227,23 24,56 2,40266626 42,9531662 0,85975188 71,0502738 1270,18649 25,4240913
274,602313 1227,23 42,34 9,61108095 42,9531662 1,48205189 284,213394 1270,18649 43,8263916
1350,11319 1227,23 28,40 47,2539615 42,9531662 0,99409291 1397,36715 1270,18649 29,3967475
1441,63541 1227,23 29,30 50,4572392 42,9531662 1,02552789 1492,09265 1270,18649 30,3263248
686,499841 1227,23 29,14 24,0274944 42,9531662 1,01979382 710,527335 1270,18649 30,1567602
274,60 1227,23 30,75 9,61094194 42,9531662 1,07624368 284,209283 1270,18649 31,8260631
1372,99 1227,23 31,99 48,0547097 42,9531662 1,11954204 1421,04642 1270,18649 33,1064574
1006,86 1227,23 29,92 35,2401204 42,9531662 1,04704007 1042,1007 1270,18649 30,9624706
1212,81 1227,23 30,22 42,4483269 42,9531662 1,0576295 1255,25767 1270,18649 31,2756152
5.0 Socio economic analysis
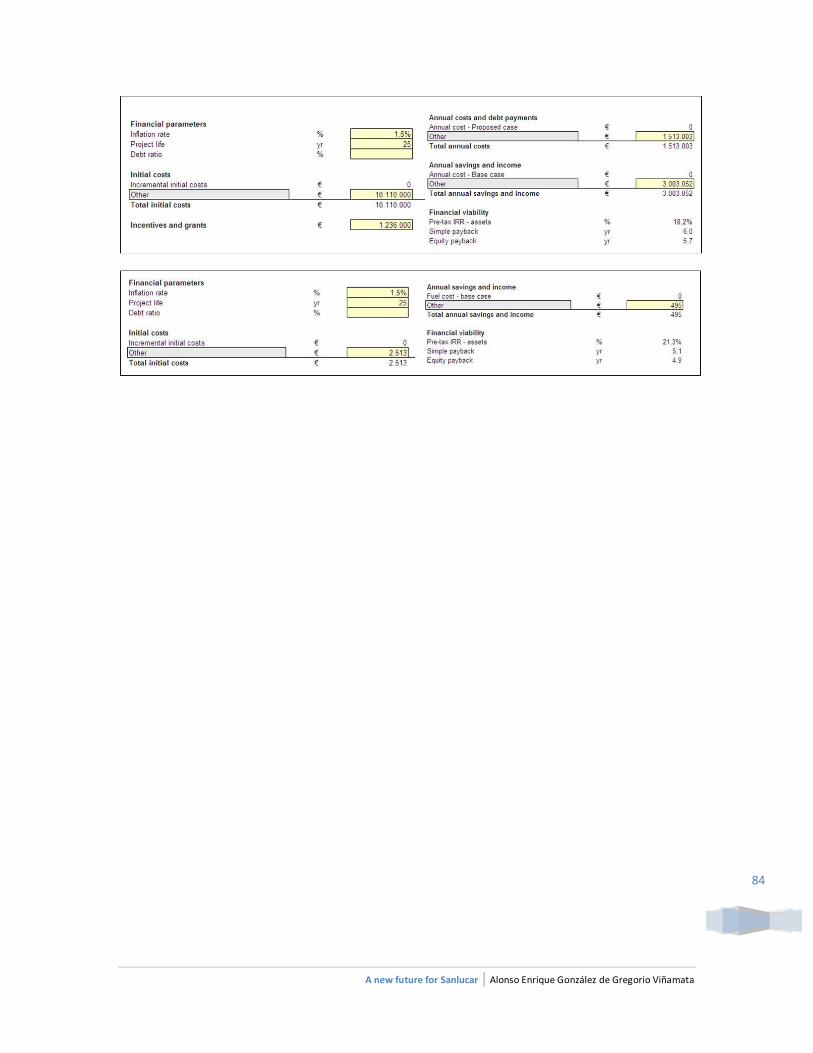
A new future for Sanlucar | Alonso Enrique González de Gregorio Viñamata
84