a model of the exchange of inorganic chemicals between water and sediments
TRANSCRIPT

Environ. Sci. Technol. 1990, 24, 713-722
A Model of the Exchange of Inorganic Chemicals between Water and Sediments
Miriam L. Diamond,*vt Donald Mackay,t R. Jack Cornett,t and Lorna A. Chants
Institute for Environmental Studies, University of Toronto, Toronto, Ontario M5S 1A4, Canada, and Environmental Research Branch, Chalk River Nuclear Laboratories, Chalk River, Ontario KOJ 1J0, Canada
A simple mathematical model is developed to describe the movement of radioisotopes added to lake enclosures, first during initial loss from water to sediments, and second during release from sediments into isotope-free water. The model is based on the concept of “aquivalent” concentra- tion, an equilibrium criterion analogous to fugacity, but suitable for involatile chemicals. I t treats two homoge- neous compartments, water and an active layer of sedi- ments, and exchange by bidirectional diffusion, sediment deposition, and resuspension. Model simulations of isotope loss agree well with experimental results obtained for seven isotopes added to two lake enclosures. Simulations of isotope release from sediments were satisfactory but less accurate. The results illustrate that the behavior of iso- topes can be estimated from their differing particle-sorp- tion characteristics, as quantified by the isotope-specific K, and by enclosure-specific suspended particle concen- trations and sediment deposition/resuspension rates.
Introduction Mackay and Paterson (I, 2) and Paterson and Mackay
(3) have developed a family of environmental fate models based on the thermodynamic principle of fugacity, which provides useful predictions and insights into the behavior of contaminants while maintaining relative mathematical simplicity. These models have been applied to organic contaminants entering a variety of ecosystems and have been calibrated and tested with available literature data ( 4 , 5).
The central modeling concept is that concentrations are replaced by an equilibrium criterion (usually fugacity), thus simplifying expressions for intermedia partitioning and transport. Fugacities are first calculated in the vapor phase by equating fugacity to the chemical’s partial pressure. Fugacities in other phases, and their relationships to concentrations, are then calculated by using equilibrium partition coefficients. Consequently, fugacity is an in- convenient expression for involatile chemicals, such as metals, organometallics, and ionic compounds, since their vapor concentrations are negligible and air-water partition coefficients cannot be calculated. Another criterion based in the aqueous phase, such as activity, is preferable. I t transpires that to use activity as an equilibrium criterion would require some departure from its conventional thermodynamic usage. Thus, in this paper we adopt a new equilibrium criterion for involatile chemicals, termed “equivalent aqueous” or “aquivalent” concentration de- veloped and discussed by Mackay and Diamond (6). Models written in terms of concentration, fugacity, or aquivalent concentration are ultimately equivalent math- ematically.
The aim of this paper is to present a model for chemical exchange between water and sediments using aquivalent concentration as a formalism. Quantitative descriptions of sediment-water exchange processes are essential com-
University of Toronto. * Chalk River Nuclear Laboratories.
ponents of any whole lake model (7-10). Since process rates are difficult to measure in a whole lake, we have obtained and modeled experimental measurements of the movement of radioisotopes added to lake enclosures, in- volving both the initial loss from the water to the sedi- ments and the subsequent release from the sediments into the water (11). Radioisotope analogues of trace elements are used in enclosures to provide known source terms, which minimize potential analytical contamination and facilitate experimental manipulation. The enclosures have the advantage of retaining much of the complexity of a natural system while allowing for better experimental control and monitoring than that in an uncontained sys- tem. Similar enclosure experiments (e.g., refs 12-15), and models developed by Santschi et al. (I5), Snodgrass (I6), and Nyffeler et al. (I 7) to describe such results, have em- phasized transport from water to sediments. In contrast, the model described here treats transport both to and from sediments. Rather than considering the complexities of metal surface sorption phenomena (I8), the model focuses on the generality of transport processes for a wide range of chemicals. Thus, although we describe and later validate the model for metals and metalloids in a particular lake, the same model is believed to apply to nonpolar organic or organometallic chemicals in different lake types.
We first describe the experimental system and results. Second, we present the model, starting with a discussion of the use of aquivalent concentration as an equilibrium criterion, defining transport and transformation parame- ters, and then use these parameters to assemble an un- steady-state sediment-water exchange model. Finally, the data from the enclosures are used to test the model and, with a sensitivity analysis, to elucidate the importance of the processes controlling tracer movement.
Experimental Sys tem The enclosures were installed in Perch Lake, a small (45
ha area), shallow (mean depth 2 m), softwater lake located in the Ottawa River Valley (77’22’ W, 46’2’ N, refs 19 and 20). The lake is dimictic (circulates twice a year) and is dystrophic with concentrations of dissolved organic carbon of 10 mg/L (11).
Eight enclosures were installed on June 4, 1986. The enclosures were 0.78 m in diameter, approximately 2 m deep, and open to the gyttja-type sediments (Table I). The enclosures were made of heavy-gauge polyethylene and were held open by hollow rings of PVC tubing: a top ring that was fixed to floating rafts at the lake surface, a middle ring 1 m below the surface of the water, and a weighted bottom ring that sank 10-15 cm into the sedi- ments (Figure 1).
Fifteen radioisotopes were added to six of the enclosures and nine of these tracers were added to the remaining two enclosures. These isotopes were “Na, 57C0, 59Fe, @Ni, 66Zn, 74As, &Sr, q c , lI3Sn, l=I, 1311, l q a , lacs, 203Hg, and 241Am. Most of the isotopes were carrier free and in a chloride salt form. The specific activities were high enough so that isotope additions did not increase the concentrations of
0013-936X/90/0924-0713$02.50/0 0 1990 American Chemical Society Environ. Sci. Technol., Vol. 24. No. 5, 1990 713

Table I. Summary of the Values Used in the Model
Enclosure Dimensions diameter 0.78 m area 0.50 m2 depth of water 2 m depth of active sediments 0.010 m volume of water 1 m3 volume of active sediments 0.005 m3
density of suspended particles and solid 1.5 kg/L
95 70
1.025 kg/L
Water Particulate and Sediment Properties
sediments
sediments
sediments
c-1 3.0 f 1.1 mg/L c - 2 1.5 f 0.8 mg/L
c - 1 1.0 f 0.4 g/m2-day c - 2 0.4 f 0.2 g/m2.day
diffusion mass-transfer coefficient 0.05 m/day
most elements by more than lo%, with the exceptions of 74As and mHg. Of the eight enclosures, two (C-1 and C-2) were monitored as controls, while the remaining six were artificially manipulated by, for example, adding humic acids. We discuss here the sediment-water interactions of only seven of the isotopes (57C0, 59Fe, 65Zn, l4As, l13Sn, lacs, and %Hg) in the two control enclosures, C-1 and C-2, these isotopes encompassing the range of observed be- havior.
To monitor the flux of particles and radioisotopes to the sediments, sediment traps of Plexiglass tubing 5 cm in diameter, and 20 cm tall were suspended just above the sediments in each enclosure and in the lake. Adsorption of tracers to enclosure walls was monitored by counting the activity on plastic strips hung in one of the control enclosures. A conservative tracer, 22Na, was added to all enclosures to assess leakage. Corrections for water loss were made when necessary (11).
Following the addition of tracers to the enclosures, samples of water, suspended particles (material >0.4 pm), sediment trap material, and plastic strips were sampled every 2 days for 21 days. This first phase gave data for net water-to-sediment transfer. After 21 days, the walls of C-2 were slit, the overlying water thoroughly flushed for 3 days, and a new enclosure placed in the same position. The net release of tracers from the sediments in this second phase was then monitored by measuring activity in the overlying water. This was done every few days with de- creasing frequency during the next 75 days.
All samples were analyzed for activity by y spectroscopy using a germanium or germanium-lithium drifted crystal
volume percentage of pore water in
density of combined pore water and
suspended particle concentration
sedimentation rate
L A K E ENCLOSURE
WATER COLUMN
Flgure 1. Illustration of the lake enclosure design and processes considered in the model of chemical exchange between water and sediments.
detector that was linked to a Canberra Series 40 multi- channel analyzer. Sample counting geometries were cal- ibrated for each detector by using standard sources. The counts were corrected for detector efficiencies, geometry effects, and radioactive decay. All data have been ex- pressed relative to the day the isotopes were added to the enclosures. Chant and Cornett (11) have presented a more complete description of the enclosure design and methods.
Results Losses of radioisotopes from the water column were
exponential during the first 2 weeks of the experiment (Figure 2). The rates (expressed as loss half-times during the first 2 weeks) varied from a rapid 3.6 days for 57C0 to a slow 23 days for '%Cs and were within 25% of each other (Table 111). The rates were similar to those reported by Schindler et al. (12), Hesslein et al. (13), and Santschi et al. (15). After 2 weeks the loss rates diminished. In the second phase of the experiment, the isotopes migrated back to the water column as shown in Figure 3.
During the first phase the concentration of suspended particles varied from 0.4 to 5 mg/L with a mean value of approximately 3.0 f 1.1 mg/L in C-1 and 1.5 f 0.8 mg/L in C-2. Variation in suspended particle concentration was unrelated to time in C-2; however, the concentration in C-1 increased from about 1 to 4 mg/L during the 21 days of monitoring. The total catch in the sediment traps varied by a similar factor, averaging 1.0 f 0.4 g/m2-day in C-1 and 0.4 f 0.2 g/m2.day in C-2, and was considered a combi-
Table 11. Observed Fractions of Particle Sorption and Calculated Mean Partition Coefficients (ICD, L/kg) and 95% Confidence Limits for Radioisotopesn
% particle KP sorbed suspended particle sediment trap
isotope c - 1 c - 2 mean 95% CL (N = 15) mean 95% CL ( N = 11)
57c0 100 100 1.3 x 10⁷ 6.2 X 10⁶-2.3 X lo7 5.4 x 10⁶ 2.2 x 10⁶-1.0 x 10⁷
65Zn 17 13 1.1 x 10⁵ 6.4 X 10'-1.8 X lo5 6.4 x 10⁴ 4.9 x 10⁴-8.0 x 10⁴ 69Fe 60 52 8.5 x 10⁵ 4.5 X 10⁵-1.4 X lo6 3.9 x 10⁵ 2.2 X lO"5.9 X lo5
74As 23 18 1.5 x 10⁵ 7.2 X 10⁴-2.6 X lo5 1.0 x 10⁵ 5.3 X 10'-1.6 X lo6 W n 90 80 2.9 X IO6 1.6 X 10⁶-4.7 X lo6 9.4 x 10⁵ 4.9 X 10⁵-1.5 X 10' '"CS 3 2 1.5 x 10⁴ 5.5 X 10³-2.9 X lo4 5.5 x 10⁴ 4.0 X 10⁴-7.2 X lo4 203Hg 40 32 3.6 x 10⁵ 2.1 X 10⁵-5.5 X lo5 1.3 x 10⁵ 8.7 X 10⁴-1.8 X lo5
column. Means and confidence limits were calculated by using a square root transformation to normalize the data (34).
714 Environ. Sci. Technol.. Vol. 24, No. 5, 1990
"KP values were calculated as the ratio of activity in suspended particles or sediment trap material and activity dissolved in the water

COBALT-57
1 -
. 8 -
.6-
. 4 -
. 2 -
0 .
IRON-59
m + c-1 - - c-1
0 c-2 - c-2
I
a W e I
z E z
c u < (L LL
. 8 - 1 -
. 6 -
. 4 -
. 2 -
0 .
w \@ - c-2
.* . . +‘ . + -
*-. + .
a W c
3
z z c U < a
- E
1 -
. e - a W c < 3
.6- f
El c * 4 -
z
< a U
. 2 .
O J I 0 5 10 15 20 25
TIME (days)
0 c-2 - c-2
* + -D
*
TIN-113
. 8 -
. 6 -
. 4 -
. 2 1
1 ,
1 -
. 8 -
.6-
. 4 -
. 2 -
0 4
*
- c-2
. . * + -
*
:%\ + \
+ c-1 - - c-1
0 c-2 - c-2
\:\ . * + . .
+ * +. + *
a W c <
z E z
c u < a LL
a W c < 3
3
z c u < E
0 0 5 10 15 20 25
TIME (days)
ARSENIC-74
O l I 0 1 0 5 10 15 20 25 0 5 10 15 20
TIME (days) TIME (days)
a
< L
E
E z
e u < a LL
MERCURY-203
5
Figure 2. Observed and modeled loss of radioisotopes from water column during days 1-21 in enclosures C-1 and C-2.
nation of settling and resuspending particles (17, 22). These rates, and the associated variability within the en- closures, were approximately half that measured in sedi- ment traps located outside the enclosures (11).
Isotope partition coefficients, Kp (L/ kg), were calculated from measurements of total, CT (Bq/L), and particle- sorbed isotope concentrations expressed on a mass basis, Cp (Bq/g of dry wt), and on a water volume basis Cp’
Envlron. Sci. Technol., Vol. 24, No. 5, 1990 715
COBALT-57 I RON-59
0 c-2 c c-2
010 - 0
0 0
4 005 -
0 .
Z I I
1 25 35 45 55 65 75
TIME (doys)
Z I NC-65
,010 0 c-2
1 - c-2 I I . 006 4
LL I W
c 3 . 0 0 6 z z 0 . 004 U
n LL
. DO2
25 35 45 55 65 75 TIME (days)
TIN-1 13
.010 0 c-2 1 - c-2
TIME (doys)
25 35 45 55 65 7 s TIME (days)
ARSENIC-74
020 0 c-2 - c-2
5 . 015 I
CESIUM-134
, 0 2 0
~ - c-2 / .O15 4
c 3
z 6 , c ’
,310 . .. = i i
’ Oo5 1
i c c
25 35 45 55 65 75 TIME (doys)
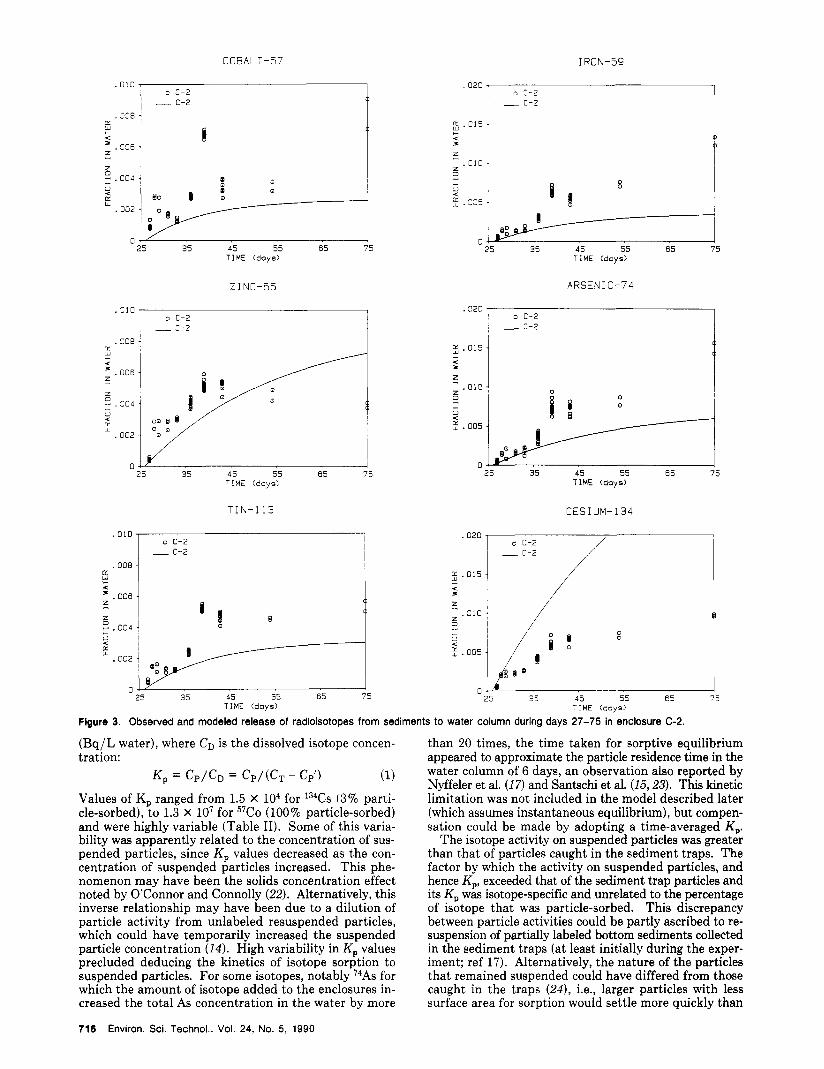
Figure 3. Observed and modeled release of radioisotopes from sediments to water column during days 27-75 in enclosure C-2.
(Bq/L water), where CD is the dissolved isotope concen- tration:
(1)
Values of K, ranged from 1.5 X lo4 for 134Cs (3% parti- cle-sorbed), to 1.3 X lo’ for 57C0 (100% particle-sorbed) and were highly variable (Table 11). Some of this varia- bility was apparently related to the concentration of sus- pended particles, since Kp values decreased as the con- centration of suspended particles increased. This phe- nomenon may have been the solids concentration effect noted by O’Connor and Connolly (22). Alternatively, this inverse relationship may have been due to a dilution of particle activity from unlabeled resuspended particles, which could have temporarily increased the suspended particle concentration (14). High variability in K, values precluded deducing the kinetics of isotope sorption to suspended particles. For some isotopes, notably I4As for which the amount of isotope added to the enclosures in- creased the total As concentration in the water by more
716 Environ. Sci. Technol., Vol. 24, No. 5, 1990
K , = CP/CD = Cp/(C, - Cp’)
than 20 times, the time taken for sorptive equilibrium appeared to approximate the particle residence time in the water column of 6 days, an observation also reported by Nyffeler et al. (17 ) and Santschi et al. (15,23). This kinetic limitation was not included in the model described later (which assumes instantaneous equilibrium), but compen- sation could be made by adopting a time-averaged K,.
The isotope activity on suspended particles was greater than that of particles caught in the sediment traps. The factor by which the activity on suspended particles, and hence K,, exceeded that of the sediment trap particles and its K, was isotope-specific and unrelated to the percentage of isotope that was particle-sorbed. This discrepancy between particle activities could be partly ascribed to re- suspension of partially labeled bottom sediments collected in the sediment traps (at least initially during the exper- iment; ref 17). Alternatively, the nature of the particles that remained suspended could have differed from those caught in the traps (24), i.e., larger particles with less surface area for sorption would settle more quickly than

Table 111. D Values and Percentage Contributions of D Values for Sediment Deposition (dep) and Diffusion (diff), and Observed (obs) and Estimated (est) Loss Half-Times for Radioisotopesa
loss
D value transport days % half-time,
dep diff dep diff obs est t % P tracer encl
57C0 C-1 4.778 0.024 99.5 0.5 3.6 8.2 9.5 <0.1
59Fe C-1 0.239 0.024 91 9 9.5 9.8 0.9 40
&Zn C-1 0.033 0.024 58 42 16.2 15.8 0.5 60
C-2 2.389 0.024 99 1 5.1 8.9 7.2 <0.1
C-2 0.119 0.024 83 17 12.1 12.0 0.1 90
C-2 0.017 0.024 41 59 19.0 20.3 1.1 30
C-2 0.024 0.024 50 50 20.4 18.6 1.5 15
c-2 0.239 0.024 90 10 10.8 10.5 0.4 70
C-2 0.002 0.024 9 90 22.4 24.5 1.5 15
c-2 0.042 0.024 63 36 16.3 15.9 0.3 80
"AS C-1 0.048 0.024 67 33 18.0 14.3 6.0 <0.1
? 3 n C-1 0.478 0.024 95 5 8.1 9.0 1.7 10
'"Cs C-1 0.005 0.024 16 83 22.9 21.8 0.7 50
mHg C-1 0.084 0.024 78 22 12.6 12.3 0.6 60
Observed half-times calculated from isotope water activity during days 1-15. T statistic with 13 degrees of freedom and the percent probability (P) that observed and estimated loss rates are not different.
smaller particles with large sorptive surfaces (14). Another possibility is that elements taken up by biota, such as Co, Fe, and As (As is readily taken up by some algal species; refs 25 and 26), could be maintained within the plankton of the euphotic zone longer than expected if random set- tling is assumed. This explanation is supported by ob- servations of differences in chemical composition between plankton within the water column and those that settle (27, 28).
Fugacity and Aquiualent Concentration The use of fugacity as a surrogate for concentration in
environmental modeling has been discussed by Mackay and Paterson (1 ,2 ) , Mackay et al. (41, and Paterson and Mackay (3). Fugacity, f (Pa), expresses the escaping tendency of a chemical from a phase. It is linearly related to concentration, C (mol/m3), through a capacity term, or Z value (mol/m3.Pa):
c = f Z (2) The ratio of two Z values, Z1/Z2, is equivalent to the
dimensionless partition coefficient, K12. The Z value for air, ZA, is first established as l /RT, where R T is the gas constant-temperature group (Pa.m3/mol). Subsequent Z values, e.g., Zi, can be obtained by multiplying a known Zi value by K . . for a specified pair of phases. By use of air-water, seiiment-water, and fish-water partition coefficients, it is possible to calculate Z values for these phases.
The fugacity approach is not suitable for compounds such as metals, ions, or polymers, for which a vapor pressure is unavailable because KAW (air-water) is essen- tially zero, resulting in Z for water, Zw, becoming infinite. This difficulty can be overcome by basing the Z value calculations in the water phase rather than the air phase and setting Zw equal to 1.00 (6). This is equivalent to multiplying all fugacity Z values by P / C s or H where PS is vapor pressure (Pa), Cs is solubility (mol/m3), and H is Henry's law constant (Pa.m3/mol). The equilibrium criterion is then redefined as f C s / P or f / H . We have termed this criterion the "equivalent equilibrium aqueous phase" concentration, or "aquivalent" concentration, A. Thus, eq 2 is modified to
C = f Z = cf/H)(ZH) = A 2 (3)
Since Zw is, by definition 1.00, A in the water phase is the actual dissolved concentration with units of moles per cubic meter, and Zw is dimensionless. For a sediment- water system at equilibrium, A could be 1 mol/m3 (in both water and sediment), and the water concentration, Cw, would be 1 mol/m3. If the dimensionless sediment-water partition coefficient, Ksw (which equals Kp X sediment density) is 1000, 2 s (for sediment) would be 1000 and sediment concentration, Cs, would also be 1000 moi/m3. Z is thus simply the dimensionless phase-to-water partition coefficient. For an involatile chemical, Z in the air phase, ZA, is negligible because KAW is essentially zero.
The advantage of using aquivalent concentrations is that the formalisms developed for the fugacity approach can be applied by simply replacing fugacity by aquivalence and redefining Z values by using as a basis an aqueous solution Zw value of 1.00.
Transport or transformation of the chemical may occur by several processes. In the fugacity approach these rates (mol/day) are expressed as the products Of, where D is a transport or transformation parameter (mol/Pa.day). Similarly, in the aquivalence approach, rates of chemical transfer can be expressed as products D A , where D has units of cubic meters per day. D values can be defined, as discussed by Mackay and Diamond (6), for the following types of processes: GZ, for advective flow where G is the phase flow rate (m3/day) as in sediment deposition or water flow; KaZ, for diffusion-controlled by a mass-transfer coefficient K (m/day) applying to area a (m2); BaZ/ Y, for diffusion-controlled by a diffusivity B (m2/day), an area a (m2), and a diffusion path length Y (m). B may be a molecular or eddy diffusivity, or in the case of diffusion in a porous medium, an effective diffusivity taking porosity into account; and k V Z , for a first-order reaction rate constant k (day-') occurring in volume V (m3).
These D values have identical units and can be added and compared when they apply to processes originating in one phase of constant fugacity or aquivalent concen- tration.
Development of the Model In the model, the experimental system is defined as an
enclosed, homogeneous water column of constant volume and consisting of an aqueous phase and suspended par- ticles (Figure 1). Underlying the water are sediments comprised of a homogeneous, surface-active layer from which chemical diffusion and particle resuspension can occur, and beneath that a layer that serves as a sink and later as a source. The sediments are defined as consisting of 5% solids and 95% (by weight) pore water (from measurements of sediment water content). The activity on particles and in the aqueous phase within the water column are assumed to be in equilibrium, as is that in the sediments and pore water.
A defined amount of isotope is assumed to be fully mixed into the water column a t time zero. Because the chemicals are involatile and elemental, the amount of chemical in the system is conserved; movement can occur between compartments, but the only loss from the system is through sediment burial. The rates of transfer are de- scribed by D values, namely, sediment deposition DD, re- suspension DR, and bidirectional watersediment diffusion DT (Figure 1).
Isotope concentrations in the water and sediment under unsteady-state conditions can be described by two dif- ferential equations, assuming that the isotopes are con- tained in closed volumes of water and sediment, and
Environ. Sci. Technol., Vol. 24, No. 5, 1990 717

neglecting losses due to transformation or volatilization:
(4) d(VDwZDwADw + VpZpAp)/dt =
-DTADW - DDAP + DTAI + d(VssZssAss + VIZ,AI)/dt =
-&ASS - DTAI + DTADW + DDAP (5)
where the subscripts DW, P, SS, and I refer to dissolved water, suspended particles, sediment solids, and pore water.
Equations 4 and 5 can be simplified if it is assumed that, (i) the water is in equilibrium with particles together in a bulk water-particle compartment (i.e., Aw = ADw = Apt where the subscript W refers to the water phase) and (ii) sediment is in equilibrium with pore water also in a bulk sediment-pore water compartment (i.e., As = Ass = AI, where the subscript S is the sediment phase). The 2 value for the bulk phases, ZBw and ZBS, are volume fraction weighted averages of the constituent 2 values (ZDw and Zp, 2,s and 21)
VWZBW = VDWZDW + VPZP (6)
and
VSZBS = vSSzSS + (7)
where Vs and Vw are the volumes of sediment (solids plus pore water) and water (dissolved and suspended particles). It is assumed that all volumes, Z values, and diffusion and transport parameters remain constant with time.
With these modifications, eqs 4 and 5 can be rewritten as
( V W ~ B W ) dAw/dt = -(OD + DT)Aw + (DR + &)As (8)
and
(V&'BS) dAs/dt = + + (OD + DTMW (9)
These equations can be solved in combination with the overall mass balance for the amount of chemical in the system, which is constant with time:
AWVWZBW + ASVSZBS = AWOVWZBW + ASOVSZBS (10) where Awo and Am are the initial aquivalent concentrations of chemical in the water and sediment. Thus, eqs 8 and 9 become
AW = AWI + (AWO - Awl) exp(-kt) (11)
AS = As1 + (As0 - &I) exp(-kt) (12)
k = (OD + DT)/VWZBW + (DR + DT)/VSZBS (13)
(14)
and
where
AWI = (DR + DT)(Aso/VWZBW + A w o / V S ~ B S ) / ~ and
As1 = (OD + DT)(Aso/VWZBW + A w o / V S Z B ~ ) / ~ (15)
In eqs 11 and 12, Awo and Aw are as defined above. For the first phase of the experiment when the isotopes are added to the water column, Awo in water expresses the total activity in the system and Aso for the sediments is zero. In the second phase when the water column is flushed and the remaining activity is contained in the sediments, As can be calculated and set a t the initial condition Aso: and Awo is zero. AwI and As1 are the steady-state (infinite time) aquivalent concentrations in water and sediment, respectively, and are calculated sep-
718 Environ. Sci. Technol., Vol. 24, No. 5, 1990
arately for each time phase. Since isotope concentrations were measured by counting radioactive disintegrations, the counts (adjusted to zero time) are proportional to total water concentrations, and Aw can be expressed in bec- querels per liter.
The overall rate constant is k in both experimental phases. Indeed, the same equations apply to both the loss and release phases, the only difference being the values assigned to the initial conditions. I t is a t first surprising that the time constant or half-time is identical for the two cases in which chemical movement is first principally downward and second principally upward. Examination of k shows that it consists of the sum of two terms, (DD + DT)/ VWZBW, which is a rate constant for removal from water, and (DR + DT)/ VSZBS, which is for removal from sediment. The larger (faster) rate constant, in this case (DD + DT)/ VWZBW, dominates and controls the overall time to steady state. Inspection of the differential equation shows that if chemical is added to the water, then the initial rate of loss in water concentration is controlled by only deposition rate terms (DD + DT), and conversely, if the chemical is added to the sediment, then the initial rate of loss is controlled by the resuspension rate terms (DR + DT). But the overall rate constants and half-times are identical and are independent of the direction of transfer.
This model is a simple, algebraic expression that can be readily fitted to the experimental data. Since both DD and DR terms appear as sums with DT, it may not be possible to discriminate between DD and D T or DR and D T in some systems. Discrimination is possible here because data are available for actual sediment deposition and resuspension rates, and for several chemicals with different partition coefficients (Kp). The model could be made more faithful to reality, and more complex, by including terms for (i) degrading reactions in the case of nonconservative chem- icals, (ii) allowing for diffusive penetration into the bottom sediments or expanding the depth of the active layer of sediments, and (iii) including kinetic terms for sorption- desorption of radioisotopes between dissolved and parti- cle-sorbed phases.
Fitting Model Parameters Enclosure dimensions were measured directly. Water
volumes in the enclosures were estimated by adding known amounts of bromine and 22Na (11). The concentrations of suspended particles and sediment deposition and re- suspension rates were averages of measurements taken during the first phase of the experiment. Actual deposition plus resuspension rates were assumed to equal the mea- sured total deposition rates since the sediment traps were deployed immediately above the sediments (21). Resus- pension rates were assumed to approximately equal de- position rates since, at least in enclosure C-2, the concen- tration of suspended particles did not change systemati- cally with time. In c - 1 the concentration of suspended particles did increase with time (from 1 to 4 mg/L). For simplicity, however, this change was neglected and a time-averaged value was adopted. These values are sum- marized in Table I.
The model was "fitted" to the experimental data in stages. First, Z values were estimated by using Kp values for each isotope calculated from observed particle-sorbed and dissolved isotope concentrations in the water column (Table 11). D values for sediment deposition and resus- pension were calculated by using measured particle sedi- mentation rates. The diffusive mass-transfer coefficient, from which DT was calculated, was set a t 0.05 m/day by using the 134Cs data since Cs loss was almost entirely diffusional (it was 97% dissolved). The accessible volume

of sediment was first set with a 6-mm de th of active sediments by compiling a mass balance for RCo (approx- imately 100% sorbed). The depth of the active sediments was later revised to 1 cm in order to better fit the release data for all isotopes.
With these initial estimates the model could be com- pared with the observed loss and release data for all iso- topes in one enclosure, the only differences being the 2 values derived from K, estimates. The model was then applied to the second control enclosure. Only the mea- sured concentrations of suspended particles and depos- ition/resuspension rates were changed to fit the isotope data from this enclosure. Adjustments were then made to the sediment volume and diffusive mass-transfer coef- ficient (which are the same for all isotopes in both enclo- sures) and to 2 values on an isotope-specific basis (the 2 values are also the same for each isotope in both enclo- sures).
Comparison of Model Simulations wi th Observations The model simulations of isotope loss in the enclosures
agree well with observed values, with the exceptions of 57C0 in both enclosures and 74As in C-1 (Figure 2). This agreement can be judged by the probability that observed and estimated loss rates are equal (Table 111, Student’s t test for similarity of slopes with 13 degrees of freedom; ref 29). This correspondence was achieved by changing only the isotope-specific Kp or suspended-particle concentration and sediment deposition/resuspension rates between the enclosures. The rate a t which an isotope is lost from the water column increases as a function of isotope particle sorption.
The differences in suspended particle concentration and deposition and resuspension rates between enclosures C-1 and C-2 result in different loss rates of the isotopes (Table 111). This illustrates the importance of these factors in determining the actual loss rate of the same element. The agreement between results from the two enclosures sug- gests that describing the rates of the key processes of deposition/resuspension and diffusion is sufficient to de- scribe chemical exchange between sediment and water in these enclosures.
In contrast to the loss phase, the isotope release rates are unrelated to particle sorption, and model predictions of these rates are less satisfactory (Figure 3). Five reasons are proposed for the poorer fit between modeled and ob- served rates. First, whereas in the loss phase the isotope activities in the water were in the order of thousands of becquerels per liter, in the release phase the total water activities observed were less than 100 Bq/L, and thus were more difficult to measure accurately. Second, the release of a chemical from sediments to water is more difficult to model accurately because of sediment heterogeneity, as well as temporal and spatial variability in resuspension (11) and bioturbation processes (although bioturbation was minimal because of the sparse benthic community). Ac- commodating this variability is beyond the scope of this simple model. Third, desorption may have been subject to a kinetic limitation, i.e., isotope desorption becomes more difficult after prolonged sorption and is a slower process relative to isotope sorption (30, 31). Fourth, whereas the initial condition in the first phase is known accurately from the amount of isotope added to the water, the initial condition in the second phase (Le., the starting sediment isotope activity) can only be calculated and may have been in error. Finally, the model does not contain an expression for diffusive losses to depths greater than 1 cm (depth of sediment active layer) followed by parti- tioning between solid and pore water phases, as was ob-
served in sediment cores that were taken a t the end of the experiment (11). This diffusive loss is most evident for the predominantly dissolved isotopes, such as 134Cs and 65Zn.
The final possibility, isotope diffusion to depths greater than that of the fixed, sediment active layer, can be ac- commodated by modifying eq 5 to include another term, -DLAS, on the right-hand side. DL can be viewed as a diffusion process characterized by either a diffusivitylpath length, a mass-transfer coefficient, or most simply by a fictitious downward flow of pore water at a rate of Gi m3/h. DL is then GJw. Simulations using reasonable values of Gi based on estimated diffusivities indicated that the rate of isotope release from the sediments is not changed sig- nificantly by incorporating this additional process. Al- ternatively, the depth of active sediments can be increased with time at a rate equivalent to DL. Again, reasonable rates of increasing sediment volume did not significantly affect rates of isotope release.
The satisfactory fit of the model simulations to the ob- servations suggests that first, the behavior of these isotopes is attributable to, and predictable from, their differing particle-sorption tendencies. This predictability, as manifested by the sufficiency of this simple model, is in contrast to the often-emphasized differences in trace ele- ment chemistry and partitioning characteristics. Second, the transport mechanisms of sediment deposition, resus- pension, and diffusion included in this simple model ap- pear capable of describing the movement of a diversity of isotopes ranging from 3% to 100% particle-sorbed. The relative contribution of each process to an isotope’s movement is controlled by its Kp’ These contributions can be quantitatively assessed by examining values of the transport parameter, or D values (Table 111). Further, it is believed that the model can accommodate lake-to-lake variations if lake-specific data are available, notably sed- iment deposition and resuspension rates (G, and GR) as well as 2 values (which may be affected by water chem- istry).
Finally, a feature of sediment-water exchange elucidated by the model is that a t infinite time or steady state, the chemical in water and sediments does not necessarily reach equilibrium. At steady state eq 8 becomes
A s / A w = (OD + + DT) (16)
Chemical equilibrium between sediment and water is at- tained when As equals Aw However, when deposition exceeds resuspension (OD > DR) and DT is relatively small, the sediment will achieve a higher aquivalent concentration than the water. Thus, sediment will strive to reach equilibrium by sediment-water diffusion. The disequili- brium between sediment and water, as quantified by the difference between As and Aw, is then a function of chemical transport processes as quantified by D values. Examination of sediment and water concentrations in terms of aquivalence (which is essentially examining their equilibrium status) is, therefore, useful as a means of discerning the controlling transfer mechanism, i.e., estab- lishing the relative magnitudes of D D , D g , and DT. A convenient method of measuring As is to analyze chemical concentration in pore water.
Sensit ivity Analysis A sensitivity analysis of the model clarifies the points
raised by these results. lUCs, I4As, and 57C0 were selected to typify primarily dissolved (97%), intermediate (23%), and particle-sorbed (100%) isotopes. Values of four var- iables, the diffusion mass-transfer coefficient, sediment
Environ. Sci. Technol., Vol. 24, No. 5, 1990 719

Diffusion Moss Transfer
Coefficient ( 0 05m/d 1
0 0 2 5
0 IO
Sedimentation Rote
(0 25g/m2/d)
0 125
0 5 0
Sediment Depth
(OOlm)
0 0 0 5
0 02
Partition Coefficient
i 2
X 2
IO' 10: 44-74
-100 0 tl00 -100 0 *IO0 -100 0 +IO0 ---
I 6 107 0 0
- 1 0 0 1 0 + I 0 0 I *
-100 0 +I00
cs-134 AS-74 Co-57
% Deviation of Modelled Loss Half-time
Figure 4. Sensitivity analysis of model variables depicted as percent deviation of modeled loss half-time from optimum modeled for enclo- sure C-2, for 134Cs, 74As, and 57C0 (K, of 1.5 X lo4, 1.5 X lo5, and 1.3 X lo7 L/kg, respectively).
deposition rate, depth of the sediment active layer, and K,, were increased and decreased by a factor of 2 and the resultant effects on isotope loss half-times were examined (Figure 4). For 134Cs, doubling or halving the rate of sediment deposition changes the loss half-time by less than 10% ; however, doubling or halving the diffusion rate changes the loss half-time commensurately. Conversely, changes in diffusion rate affect the loss half-time of 57C0 by less than lo%, but its loss rate is highly sensitive to the deposition rate. I4As, intermediate between these ex- tremes, is sensitive to both parameters, with the estimated half-time changing by 30-40% in response to doubling or halving both parameters.
Simulations of isotope release, especially of the more dissolved isotopes, are effected by the depth of the sedi- ment active layer. This sensitivity implies that changes of a few millimeters in the mixed zone can directly affect the amount of isotope that will return to the water column. Thus, bioturbation, which can rapidly change the depth of the zone (32,33), could influence contaminant dynamics at the sediment-water interface.
The model is less sensitive to changes in K , than to changes in deposition and diffusion rates. The sensitivity is lowest for either very low P4Cs) or very high (57C0) K, values. These K, values extend over 3 orders of magnitude, the greatest range of all variables considered. This reduced sensitivity may in part explain the ability of the model to account for the behavior of a wide diversity of radioiso- topes.
Loss (and release) rates are not linearly correlated with either the fraction particle-sorbed or the K , values of the isotopes, a result also found in enclosure work done else- where (12,13). This is understandable since the D values that express the magnitude of transport by either particle movement or diffusion do not respond linearly to changes in K,.
Exploring this sensitivity further, we recall that the overall rate constant k (eq 13) is the sum of two terms, one
720 Environ. Sci. Technol., Vol. 24, No. 5, 1990
WATER-ID-SEDIMENT ., DIFFUSION - ,' I J'' \,+
'\ w I W
- 10-3- t- z 5 z 8 t w 10-4-
a
\
for chemical removal from water and the other from sed- iment. k can be further decomposed into four terms,
resenting rate constants for sediment deposition, water- to-sediment diffusion, resuspension, and sediment-to-water diffusion, respectively. Both rates of isotope diffusion decrease with decreasing dissolved fraction or increasing K, (Figure 5). However, a t low K , values the rate of water-to-sediment diffusion is less sensitive to K, than the rate of sediment-to-water diffusion (i.e., the former curve flattens). This difference in rate constant behavior is a consequence of the negligible particle-sorbed isotope fraction associated with dilute suspended particles in the water column in comparison to the bed sediments. The shape of the water-to-sediment diffusion curve is a function of suspended particle concentration.
In contrast to the diffusion rates, the rate at which particle-sorbed isotope is released from the sediment due to resuspension is independent of K,. For sediment de- position, the rate of chemical loss increases with increasing isotope particle sorption. The change in the deposition rate is greatest at low K , values and tends to reach satu- ration at high values when all the isotope is sorbed.
Comparing the contributions of diffusion and sediment transport rate constants, the K, range in which either dominates the overall rate constant is determined by suspended particle concentration. For example, diffusion rate constants (water-to-sediment and sediment-to-water) dominate the overall rate constant at K, values less than 100000 L/kg in enclosure C-1 with 3.0 mg/L suspended particles and less than 200000 L/kg in C-2 with 1.5 mg/L particles concentration. At K, values greater than these, sediment deposition and resuspension rate constants dominate the overall constant.
Comparing the contributions of constituent rate con- stants to the overall, the constants for isotope release from
OD/ VWZBW, DT/ vWzBW, DR/ vSzBS, and DT/ vSzBS, rep-
Kp ( L/kg
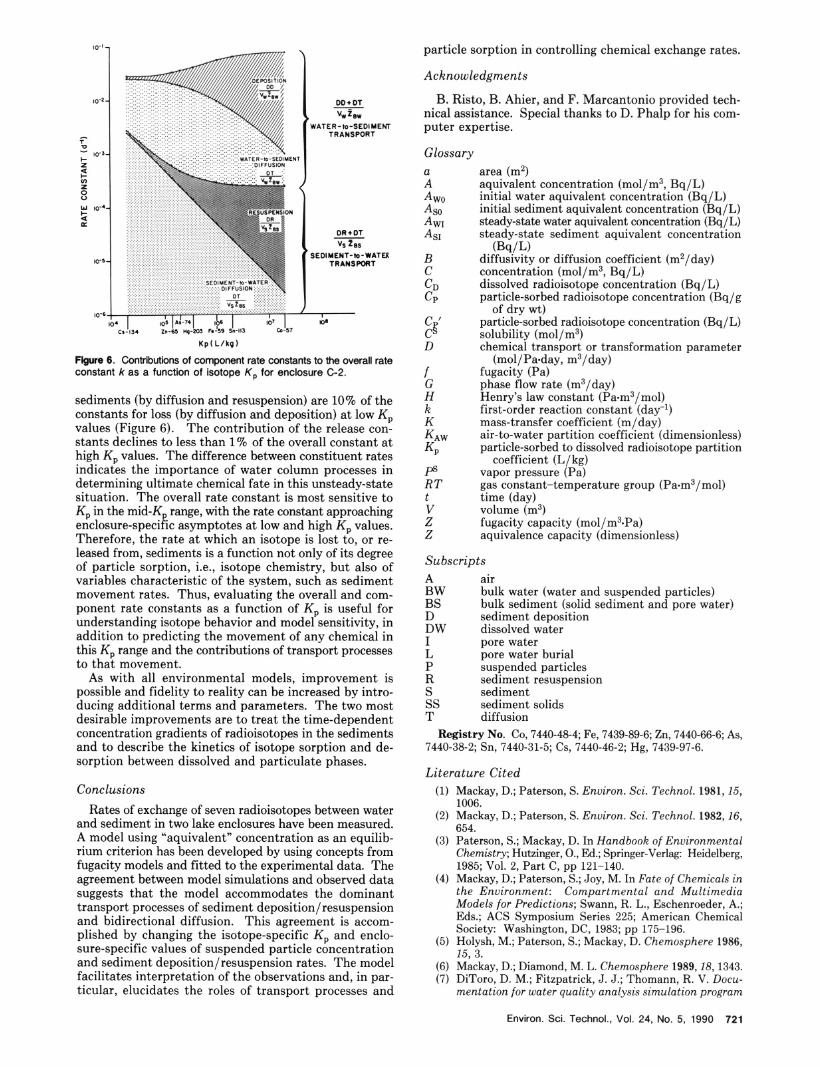
DD+ DT
Vw%w WATER- to-SED1 MEW
TRANSPORT
DR+DT
Vs t e s SEDIMENT-lo- WATER
TRANSPORT
Figure 6. Contributions of component rate constants to the overall rate constant k as a function of isotope K , for enclosure C-2.
sediments (by diffusion and resuspension) are 10% of the constants for loss (by diffusion and deposition) at low Kp values (Figure 6). The contribution of the release con- stants declines to less than 1% of the overall constant at high Kp values. The difference between constituent rates indicates the importance of water column processes in determining ultimate chemical fate in this unsteady-state situation. The overall rate constant is most sensitive to Kp in the mid-K range, with the rate constant approaching enclosure-specific asymptotes at low and high Kp values. Therefore, the rate at which an isotope is lost to, or re- leased from, sediments is a function not only of its degree of particle sorption, i.e., isotope chemistry, but also of variables characteristic of the system, such as sediment movement rates. Thus, evaluating the overall and com- ponent rate constants as a function of Kp is useful for understanding isotope behavior and model sensitivity, in addition to predicting the movement of any chemical in this Kp range and the contributions of transport processes to that movement.
As with all environmental models, improvement is possible and fidelity to reality can be increased by intro- ducing additional terms and parameters. The two most desirable improvements are to treat the time-dependent concentration gradients of radioisotopes in the sediments and to describe the kinetics of isotope sorption and de- sorption between dissolved and particulate phases.
Conclusions Rates of exchange of seven radioisotopes between water
and sediment in two lake enclosures have been measured. A model using “aquivalent” concentration as an equilib- rium criterion has been developed by using concepts from fugacity models and fitted to the experimental data. The agreement between model simulations and observed data suggests that the model accommodates the dominant transport processes of sediment deposition/resuspension and bidirectional diffusion. This agreement is accom- plished by changing the isotope-specific Kp and enclo- sure-specific values of suspended particle concentration and sediment deposition/resuspension rates. The model facilitates interpretation of the observations and, in par- ticular, elucidates the roles of transport processes and
particle sorption in controlling chemical exchange rates.
Acknowledgments
B. Risto, B. Ahier, and F. Marcantonio provided tech- nical assistance. Special thanks to D. Phalp for his com- puter expertise.
Glossary a A Awo As0 A W I As1
B c C D CP
g D
f G H k K KAW KP Ps RT t V z z
area (m2) aquivalent concentration (mol/m3, Bq/L) initial water aquivalent concentration (Bq/L) initial sediment aquivalent concentration (Bq/L) steady-state water aquivalent concentration (Bq/L) steady-state sediment aquivalent concentration
diffusivity or diffusion coefficient (m2/day) concentration (mol/m3, Bq/L) dissolved radioisotope concentration (Bq/L) particle-sorbed radioisotope concentration (Bq/g
particle-sorbed radioisotope concentration (Bq/L) solubility (mol/m3) chemical transport or transformation parameter
(mol/Pa.day, m3/day) fugacity (Pa) phase flow rate (m3/day) Henry’s law constant (Pa.m3/mol) first-order reaction constant (day-’) mass-transfer coefficient (m/day) air-to-water partition coefficient (dimensionless) particle-sorbed to dissolved radioisotope partition
coefficient (L/kg) vapor pressure (Pa) gas constant-temperature group (Pa.m3/mol) time (day) volume (m3) fugacity capacity (mol/m3*Pa) aquivalence capacity (dimensionless)
(Bq/L)
of dry wt)
Subscripts A BW BS D DW I L P R S ss T
air bulk water (water and suspended particles) bulk sediment (solid sediment and pore water) sediment deposition dissolved water pore water pore water burial suspended particles sediment resuspension sediment sediment solids diffusion
Registry No. Co, 7440-48-4; Fe, 7439-89-6; Zn, 7440-66-6; As, 7440-38-2; Sn, 7440-31-5; Cs, 7440-46-2; Hg, 7439-97-6.
Literature Cited (1) Mackay, D.; Paterson, S. Enuiron. Sci. Technol. 1981,15,
1006. (2) Mackay, D.; Paterson, S. Enuiron. Sci. Technol. 1982,16,
654. (3) Paterson, S.; Mackay, D. In Handbook of Environmental
Chemistry; Hutzinger, O., Ed.; Springer-Verlag: Heidelberg, 1985; Vol. 2, Part C, pp 121-140.
(4) Mackay, D.; Paterson, S.; Joy, M. In Fate of Chemicals in the Enuironment: Compartmental and Multimedia Models for Predictions; Swann, R. L., Eschenroeder, A.; Eds.; ACS Symposium Series 225; American Chemical Society: Washington, DC, 1983; pp 175-196.
(5) Holysh, M.; Paterson, S.; Mackay, D. Chemosphere 1986, 15, 3.
(6) Mackay, D.; Diamond, M. L. Chemosphere 1989,18,1343. (7) DiToro, D. M.; Fitzpatrick, J. J.; Thomann, R. V. Docu-
mentation for water quality analysis simulation program
Environ. Sci. Technol., Vol. 24, No. 5, 1990 721

Environ. Sci. Technol. 1990, 24, 722-727
(WASP) and model verification program (MVP); U S . Environmental Protection Agency. US. Government Printing Office: Washington, DC, 1981; EPA-600/3-81-044. Dolan, D. M.; Bierman, V. J. J . Great Lakes Res. 1982,8, 676. Mackay, D.; Paterson, S.; Joy, M. Chemosphere 1983, 12, 981. Reuber, B.; Mackay, D.; Paterson, S.; Stokes, P. Enuiron. Toxicol. Chem. 1987, 6, 731. Chant, L.; Cornett, R. J. Hydrobiologia 1988, 159, 237. Schindler, D. W.; Hesslein, R. H.; Wagemann, R. Can. J . Fish. Aquat. Sci. 1980, 37, 373. Hesslein, R. H.; Broecker, W. S.; Schlindler, D. W. Can. J . Fish. Aquat. Sci. 1980, 37, 378. Santschi, P. H.; Adler, D. M.; Amdurer, M. In Trace Metals in Sea Water; Wong, C., et al., Eds.; Plenum Press: New York, 1983; pp 331-349. Santschi, P. H.; Nyffeler, U. P.; Anderson, R. F.; Schiff, S. L.; O’Hara, P.; Hesslein, R. H. Can. J. Fish. Aquat. Sci. 1986, 43, 60. Snodgrass, W. J. In Sediments and Water Interactions; Sly, P. G., Ed.; Springer-Verlag: New York, 1986; pp 209-227. Nyffeler, U. P.; Santschi, P. H.; Li, Y.-H. Limnol. Oceanogr. 1986, 31, 277. Honeyman, B. D.; Santschi, P. H. Enuiron. Sci. Technol. 1988, 22, 862. Cornett, R. J.; Ophel, I. L. Can. J . Fish. Aquat. Sci. 1986, 43, 877. Evans, R. D.; Cornett, R. J.; McCulloch, V. A. In Sediments and Water Interactions; Sly, P. G., Ed.; Springer-Verlag: New York, 1986; pp 125-132. Bloesch, J.; Uehlinger, U. Limnol. Oceanogr. 1986,31,1094. O’Connor, D. J.; Connolly, J. P. Water Res. 1980,14, 1517.
Carbon Speciation and Surface Tension
Santschi, P. H.; Nyffeler, U. P.; Li, Y.-H.; O’Hara, P. In Sediments and Water Interactions; Sly, P. G., Ed.; Springer-Verlag: New York, 1986; pp 183-191. Vezina, A. F.; Cornett, R. J. Geochim. Cosmochim. Acta, in press. Planas, D.; Lamarche, A. Can. J . Fish. Aquat. Sci. 1983, 40, 156. Maeda, S.; Nakashima, S.; Takeshita, T. Sep. Sci. Technol. 1985. 20, 153. Gachter, R.; Bloesch, J. Hydrobiologia 1985, 128, 193. Ochiai, M.; Yamamoto, S.; Hayashi, H.; Fukushima, K.; Ogura, K.; Ishiwateri, R. Rikusuigaku Zasshi 1986,47,115. Neter, J.; Wasserman, W. Applied Linear Statistical Models; R. D. Irwin: Homewood, IL, 1974; Chapter 3. DiToro, D. M.; Mahony, J. D.; Kirchgraber, P. R.; OByme, A. L.: Pasquale, L. R.; Piccirilli, D. C. Environ. Sci. Technol. 1986, 20, 55. Jenne, E. A,; Zachara, J. M. In Fate and Effects of Sedi- ment-bound Chemicals in Aquatic Systems; Dickson, K. L., et al., Eds.; Pergamon Press: New York, 1987; pp 83-98. Karickhoff, S. W.; Morris, K. R. Enuiron. Sci. Technol. 1985, 19, 51. Krantzberg, D. Environ. Pollut., Ser. A 1985, 39, 99. Sokal, R. R.; Rohlf, F. J. Biometry; W. H. Freeman and Co.: San Francisco, CA, 1969; pp 384-385.
Received for review February 14,1989. Accepted December 11, 1989. We are grateful to the Ontario Ministry of the Enuiron- ment and NSERC for funding this work and t o Atomic Energy of Canada, particularly Dr. Richard Osborne and members of the Environmental Research Branch at Chalk River Nuclear Laboratories, f o r providing facilities, logistical support, and advice concerning the lake enclosure experiment.
of Fog
Paul D. Capel,”,’ Rok Gunde,t Fritz Ziircher,’ and Walter Gigert
Swiss Federal Institute for Water Resources and Water Pollution Control (EAWAG), CH-8600 Dubendorf, Switzerland, and Swiss Federal Institute of Technology-Zurich (ETH-Zurich), Department of Industrial and Engineering Chemistry, CH-8092 Zurich, Switzerland
The speciation of carbon (dissolved/particulate, or- ganic/inorganic) and surface tension of a number of ra- diation fogs from the urban area of Zurich, Switzerland, were measured. The carbon species were dominated by “dissolved” organic carbon (DOC; i.e., the fraction that passes through a filter), which was typically present a t levels of 40-200 mg/L. Less than 10% of the DOC was identified as specific individual organic compounds. Particulate organic carbon (POC) accounted for 26-41 ’70 of the mass of the particles, but usually less than 10% of the total organic carbon mass. Inorganic carbon species were relatively minor. The surface tensions of all the measured samples were less than pure water and were correlated with their DOC concentrations. The combi- nation of high DOC and POC and low surface tension suggests a mechanism for the concentration of hydrophobic organic contaminants in the fog droplet, which have been observed by numerous investigators.
Introduction Many chemicals of environmental concern are trans-
ported through the atmosphere and deposited onto aquatic
* Correspondence address:
+ EAWAG. * ETH-Zurich.
United States Geological Survey, Water Resources Division, St. Paul, MN 55101.
and terrestrial surfaces through depositional processes (1-3). Recently, there has been increased interest in fog as a medium for the transfer of pollutants from the at- mosphere to terrestrial ecosystems. Of environmental concern is the fog’s acidity ( 4 , 5 ) and elevated concentra- tions of inorganic (6-8) and organic (9-12) species. Ka- wamura and Kaplan (9) reported 10-fold enrichments of volatile organic acids (C,-C,) in Los Angeles, CA, fog compared to rain. Cape1 and Giger (10) estimated similar enrichments for alkanes (1-130-fold), polycyclic aromatic hydrocarbons (PAH; 50-280-fold), polychlorinated bi- phenyls (PCBs; 4000-6000-fold), and chlorinated dioxins and furans (3-100-fold). Glotfelty et al. (11) compared the measured concentrations of pesticides in fog from the Central Valley of California to their predicted concentra- tions based on measured air concentrations and Henry’s law partitioning. They observed enrichment factors in the fog between 2 and 3000, depending on the chemical. The magnitude of this enrichment factor was strongly related to the hydrophobicity of the pesticide. Glotfelty et al. (11) suggested that these enrichments are due either to par- titioning by dissolved/colloidal organic matter or by the effect of surface-active material at the air/water interface.
The partitioning of hydrophobic chemicals by natural dissolved and/or colloidal organic matter has been dem- onstrated in lake water (13), estuary water (14), sediment porewater (15, 16), laboratory studies (17-19), and possibly
722 Environ. Sci. Technol., Vol. 24, No. 5, 1990 0013-936X/90/0924-0722$02.50/0 0 1990 American Chemical Society