a model for the economic evaluation of water quality in irrigation
TRANSCRIPT
A MODEL FOR THE ECONOMIC EVALUATION OF WATER QUALITY
IN IRRIGATION D. YARON and E. BRESLER*
A model for determination of the efficient combination of water quantity and quality (salinity) in irrigation is presented. The efficient combination is evaluated with respect to a predetermined threshold salt concentration in the soil solution. A leaching model, designed for tracing salt distribu- tion in the soil profile, serves as the basis for the analysis. The optimal quantity-quality combinations are derived with the aid of a linear pro- gramming model. An illustrative application of the model concludes the presentation.
Introduction Many investigations have shown that plants respond to the concentra-
tion of salts in the soil solution of the root zone [l, 3, 4, 6 , 8, 9, 10, 11, 12, 131. The response may arise from a high total concentration of salts (osmotic effects), a relatively high concentration of a specific ion, or a combination of the two. The specific effect of an ion may be one of direct toxicity or of nutrition. Depending on the nature of the par- ticular plant and given conditions of growth, one of the above two effects is dominant. Another effect is that of a gradual perennial accumulation of salts in the soil, which may lead to soil deterioration in the long run, even though the effects with respect to the concurrent crops are negli- gible.
Most fruit trees, particularly citrus, are specifically sensitive to the concentration of chloride ion in the soil solution [2, 31. Consequently, in Israel-with citrus as a major product-the chloride concentration is considered to be the main factor determining the suitability of water for irrigation. The chloride concentration is referred to as the measure of salinity in this study, and the terms salinity and chloride concentration will be used interchangeably throughout this paper. At the same time the approach of the model is adequate in reference to other measures of salinity, such as total salt concentration and electrical conductivity of the soil solution.
Information on the processes of accumulation and leaching of salts in irrigated soils and of the response of plants is prerequisite to the management of an orderly irrigation regime, when saline water is used. It is generally accepted by soil scientists that the salt concentration of the soil solution, rather than that of the irrigation water, is the ultimate factor which affects crop yields [l, 3, 4, 7, 9, 10, 111. By increasing the quantity of water applied per land unit, a portion of the salt in the soil solution can be leached below the root zone, and consequently, irriga- tion water with a higher salinity rate may be used. Here the question
* Respectively, T h e Hebrew University, and The Volcani Institute of Agri- cultural Research, Israel.
53
54 AUSTRALIAN JOURNAL OF AGRICULTURAL ECONOMICS JUNE
arises what is the ‘best’ combination of water quantity and quality in irrigation under particular field conditions?
Frame of Analysis and Objectives An economic evaluation of the ‘best’ combination of water quantity
and quality implies knowledge of the production function which relates the crop yield per land unit to varying levels of the above two factors. In a most general form such a function may be written as: (1) Y = f < Q , S, IK) where
Y z crop yield per unit area of land; Q = quantity of water of standard quality applied per unit
S = index of salt concentration in the soil solution, during
K designating all other factors, assumed to be constant.
area of land;
the growth period; with At this stage we confine ourselves to a rather vague definition of S; a precise definition will be presented in the following sections of the paper.
The salt concentration of the soil solution is itself a function of other variables, which, in a general way, can be expressed as: (2) where :
S = g(So, Q , C, IK)
So = index of initial salinity conditions; C = salt concentration of the irrigation water applied; S, Q, K are as previously explained.
Substituting (2) into ( 1 ) we obtain1 Y = h(&, Q, C, IK). (3 1
The model assumes the existence of a variety of water resources with different levels of salinity and cost of supply. Such a situation prevails in Israel, where water suppliers (mostly regional and national, and some private suppliers) face the problem of increasing cost of water supply with decreasing salt content. The objective of this paper is to present an approach for the derivation of the optimal combination of quality and quantity of water under given conditions of climate, soil, land use, and the relative cost of water quantity and quality, subject to restrictions on salt concentration in the soil solution. The ultimate relationship of interest in this context is the function (3). However, while research aimed at the estimation of such functions is underway, the present study is restricted to developing an approach for the estimation of functions of the type of (2).2 More specifically, a model is designed within the framework of which:
1 As only a general frame of the relationships involved is presented here, PO reference to indices of time i s made. Also the effect of salt accumulation in the soil profile by the end of the irrigation period is temporarily ignored. A detailed model which allows for a specific treatment of these phenomena is presented later in the paper.
2EmpiricaI estimation of ( 3 ) is a significantly more ambitious goal than that of ( 2 ) . This is so due to the complexity of ( 3 ) relative to (2) and to the relative scarcity of data for estimation of ( 3 ) .
1970 WATER QUALITY 55 ( a ) So and K of (2) are considered as given; (b) S-the index of salt concentration in the soil solution during
the irrigation period, is restricted not to exceed a predetermined critical level;
(c) efficient combinations of Q and C which comply with the above conditions are estimated.
The rationale of estimating functions of type (2) originates in the conception maintained by certain workers (Bernstein [2, 31, Bierhuizen [ 5 ] ) that significant yield response to salinity is observed only above a critical threshold concentration; below the threshold concentration the response is negligible. Accordingly, a partial analysis based on functions of type (2) may provide practical guides for irrigation policy.
Following the discussion of the conceptual framework of the study we present in the next (third) section the essence of the economic frame- work of the analysis; in the fourth section the physical relationships underlying the model are presented and in the fifth section the approach to the evaluation of the optimal combination of water quantity and quality is demonstrated. An attempt to evaluate the results and to point out possible extensions of the study concludes the presentation.
The Economic Framework In this section we introduce some elementary concepts needed for the
determination of the economically optimal combination of water quality and quantity in irrigation. Let our starting point be function (2) of the previous section with constant So and K : (4) S = g ( Q , C, I&, K ) .
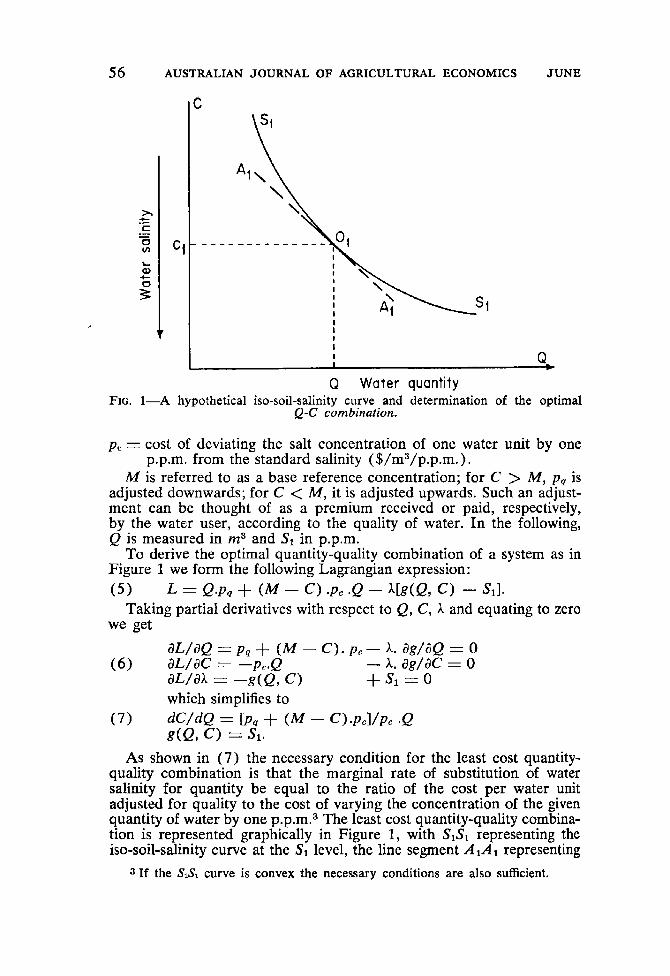
Let us consider those combinations of Q and C which yield the same soil salinity index at the end of the irrigation period, denoted, say, by Sl, and draw them on a graph in two dimensions, the axes being Q-the quantity of water applied in irrigation, and C-the salinity of water, with the degree of salinity increasing along the ordinate towards the origin (Figure 1). Denote the curve which represents the above combinations of Q and C by SIS,. Available information regarding the processes of salt accumulation and leaching suggests that over a certain range of this curve (in which salt is leached by excessive amounts of water) Q and C vary in the same direction, namely the same index of soil solution salinity may be achieved by simultaneously increasing (or decreasing) both the quantity of water and its salt concentration. In the following we shall refer to SISl as the ‘iso-soil-salinity’ curve at the S1 level. Note that other iso-soil-salinity curves will correspond to other levels of S.
Our problem is to find the least cost combination of water quantity and salinity, which provides for a given soil salinity index S1, at the end of the irrigation period. I t is assumed that (a) the water supplier can control the level of water salinity by mixing water from different sources; (b) cost of water supply increases with the decrease in its salt content. Denote : M = salt concentration of irrigation water of standard salinity (p.p.m.); pp = cost per water unit of standard salinity ( $/m3) ;
56 AUSTRALIAN JOURNAL OF AGRICULTURAL ECONOMICS JUNE
I C
I
I I I Q- 0 Water quantity
FIG. 1-A hypothetical iso-soil-salinity curve and determination of the optimal Q-C combination.
p c = cost of deviating the salt concentration of one water unit by one
M is referred to as a base reference concentration; for C > M , p q is adjusted downwards; for C < M , it is adjusted upwards. Such an adjust- ment can be thought of as a premium received or paid, respectively, by the water user, according to the quality of water. In the following, Q is measured in m3 and S1 in p.p.m.
To derive the optimal quantity-quality combination of a system as in Figure 1 we form the following Lagrangian expression:
p.p.m. from the standard salinity ( $/rn3/p.p.m.).
( 5 ) L = Q*Pq + (M - C ) . ~ c .Q - X k ( Q , C) - 5'11. Taking partial derivatives with respect to Q , C , A and equating to zero
we get dL/dQ = p 4 + ( M - C ) . p e - A. dg/JQ = 0
( 6 ) dL/dC = - p c . Q - A. dg/dC = 0 dL/dA = - g ( Q , C) + & = O which simplifies to
As shown in (7) the necessary condition for the least cost quantity- quality combination is that the marginal rate of substitution of water salinity for quantity be equal to the ratio of the cost per water unit adjusted for quality to the cost of varying the concentration of the given quantity of water by one ~ . p . m . ~ The least cost quantity-quality combina- tion is represented graphically in Figure I , with SISl representing the iso-soil-salinity curve at the S1 level, the line segment AIAl representing
31f the SIS, curve is convex the necessary conditions are also sufficient.
1970 WATER QUALlTY 57 the cost of quantity and quality ratio and the point Ol-the optimal com- b i n a t i ~ n . ~ Clearly, if
at any point on the SrSl curve, it pays to simultaneously increase water quantity and salinity; a move in the opposite direction is justified if the inequality sign in (8) is reversed. Note also that for any level of ‘iso- soil-salinity’ conditions an optimal Q - C combination can be derived similarly .
The determination of the desired iso-salinity level depends on the knowledge of the empirical functions ( 3 ) previously discussed. If these functions are not known, the iso-salinity level may be determined at the Jevel of the threshold concentration. Evaluation of the threshold con- centration regarding citrus is provided by Bernstein [2] : ‘For example, with sweet orange or citrange roots, the chloride concentration in the saturation extract of the soil should not exceed 10 meq./l. or 350 p.p.m. Trees on sour orange, rough lemon or tangelo roots, however, will not be damaged if chloride is less than 15 meq./l. in the saturation extract. On Rangpur lime and Cleopatra mandarin roots, trees will tolerate up to 25 meq./l. chloride.’
Model for Tracing Salt Distribution in the Soil In this section we present a model for tracing salt distribution in the
soil profile under varying field irrigation conditions.5 The model is essen- tially a reformulation of the law of mass conservation, and states that the amount of salt added in irrigation to any of the soil layers, less the amount drained and the amount absorbed by the plants, is equal to the net increment (positive or negative) of salt in this layer. Assuming that the amount of salt absorbed by the plant is negligible, and that the salt concentration of the water which is drained through any soil layer is equal to the arithmetic mean of the concentrations before and after irri- gation, the basic relationship of the model for one layer and a single water application can be written as ( 9 ) where Q z depth of irrigation water applied (mm); C = chloride concentration in the irrigation water (meq./l.)6; E = water consumption (evapotranspiration) from the relevant soil
6 = water content (volume fraction) at time of extraction for chloride
Xo = initial chloride concentration in the soil solution at water content
XI == chloride concentration in the soil solution, at water content 8, after
D = depth of the relevant soil layer (mm).
(8 ) d C l d Q > [ P , + (M - C). ~ c l / ~ c - Q
Qc - <Q - E ) ( X o + X1)/2 = (XI - Xo)eD
layer (mm);
analysis ( cm3/cm3) ;
8 (meq./l.);
irrigation (meq. /I. ) ;
4 Note that: (a) d C / d Q along a given iso-soil-salinity curve is positive; (b) the cost ratio [pq + ( M - C ) . P C ] / P C . Q is not constant
and depends on C and Q . 5For more details on the model and review of other approaches, see Bresler
6 1 meq. C1/1. (one millequivalent of chloride per litre = 35.5 mg C1/1. [7] or Yaron and Bresler [14].
= 35.5 p.p.m. CI.
58 AUSTRALIAN JOURNAL OF AGRICULTURAL ECONOMICS JUNE
Note that QC represents the amount added, ((2 - E ) (X, - X1)/2 the amount drained, and ( X I - X , ) OD the net increment of salt in the relevant soil layer.
Equation (9) can be extended so as to enable tracing of salt distribu- tion over any number of soil layers, in response to any number of suc- cessive irrigations. For the r-th soil layer (r = 1 , 2, ..., m) and the j-th successive irrigation applied ( j = 1, 2, !.., n ) , we obtain
where W , = O,Lli. Thus, for rn soil layers and n irrigations, a system of rn X n linear
equations is obtained, solvable for the Xi j by routine methods. The validity of this salt tracing model and its predictive power was
tested using data obtained from three citrus irrigation experiments carried out at three locations in Israel-Gevat, Shefayim, and Gilat. The experimental results, i.e. the actual salt distribution throughout the soil profile during the irrigation process, were compared with the values of X4j’s calculated using the model. The comparisons have shown a fairly good fit between the observed and the calculated values. Details of these comparisons are presented in Bresler [7] and Yaron and Bresler 1141. In view of these results it seems that the above model constitutes a fairly good tool for the approximate estimation and prediction, under field conditions, of accumulation and leaching of chlorides in soils.
Estimation of Iso-Soil Salinity Curves and Determination of the Optimal Water Quantity and Salinity Combinations
The variables in the system (10) can be classified into three major groups : (a) constants and (directly or indirectly) predetermined vari- ables,? such as Wi, Xzo and Eij; ( b ) parameters which are liable to direct man control, such as C j and Q J ; and (c) dependent variables such as X,j. Of particular interest is the dependence of Xdj on the values of the control variables C and Q which uniquely determine the salinity regime throughout the soil profile during the irrigation process, subject to the values of Xio, W, and Ecj. With these relationships in mind the leaching model can be applied to the analysis of the influence of particular C and Q values on the salt distribution in the soil profile.
In this paper an application of linear programming and computer simulation to the estimation of iso-soil-salinity curves under field con- ditions is presented. To this end we formulate the following problem. (a ) Let Qj be predetermined at some specific level. (b) Let the chlo- ride concentration in the soil solution in each soil layer and after each irrigation, be restricted not to exceed 12.5 meq. C!l/l,, equivalent to 444 pap.m. C1.* (c) Find the maximal level of C which will not violate
7 It is assumed that over a range of variation in Q,, in which leaching occurs, the evapotranspiration rate does not change.
8 This restriction was formulated on the basis of Bernstein’s evaluation [2] regarding threshold salinity of the soil solution with respect to citrus. Other re- striction levels in the range of 10-15 meq. C1/1. were applied in other analyses.
1970 WATEk QUALITY 59 the restriction (b ) , with Qj and other parameters (Wi, XtO, E t l ) being given.
In the linear progranirning formuiation the problem takes the follow- ing form:
find the value of C which maximizes L : n
j-1 L = C . 1 Qj-max
subject to: ( i ) the set of salt balance equations (10) with given values of
Ei; , X i , and Wi ( i = 1, 2, ..., m; j = 1, 2, ..., n ) ; ( i i ) restrictions on the critical levels of chloride concentration in the
soil solution: i = 1, 2 , ..., rn j = 1 , 2 )..., n.
X;j 5 12.5
Note that the problem consists of a linear function (1 1) to be maxi- mized subject to a set of linear equalities and inequalities (i) and (ii). The solution provides for the maximal permissible value of C and the re- sulting values of X i j . By successively varying the predetermined values of Q j and solving for C accordingly, a set of combinations of SQi with the maximal permissible water salinity C is achieved, which maintain the iso-soil-salinity conditions,9 specified by Xij 2 12.5.
Another approach to the solution of the same problem is based on application of a computer simulation code designed for solving the leach- ing model (10) for X i j subject to variations in the control parameters C and Qj. The maximal permissible value of C is found by computcrized trial and error.l0
For sake of illustration we present the essentials of an application of this model to the analysis of irrigation of citrus groves at Gevat (Israel), Irrigation experiments performed there provided the general framework for the analysis. Five layers of 30 cm each, and six irrigations were considered. The initial salinity values (X,i,)) were assumed tQ be 7.0: 8.0, 8.5, 9.0, and 9.5 meq. Cl/l., equivalent to 249, 284, 302. 320, and 337 p.p.m. C1, in the five layers respectively." The total tity of water applied in the six irrigations was 663 Inm and the critical salinity in the soil solution was set not to exceed 12-5 meq. Cl/l.; equi- valent to 444 p.p.m. C1.I" The maximum permissible chloride concentra- tion in the irrigation water was found to be 202 p.p.m. CI.
D An alternative specification of these restrictions could be m 2 X j j / n r 5 12.5. However, in order to be on the safe side, the more re-
;= 1 strictive formulation was chosen.
'"The present code consumes 1 . 4 minutes of 7040 IBM computer time to solve 15 sets of a system, each consisting of five soil layers and six irrigations, with 15 alternative vaIues of C .
11 The actual initial salinity values were, in general, considerably Iower (see [14]). The assumed values seemed to comply better with situations which may develop after several seasons of irrigations under conditions unfavourable for salt leaching.
1" The shift in units from meq. CIA. to the p.p.m. CI is parallel to the common practice in Israel; while soil scientists tend to use meq. CIA. economists, policy makers and water suppliers generalIy refer to p.p.m.
60 AUSTRALIAN JOURNAL OF AGRICULTURAL ECONOMICS JUNE
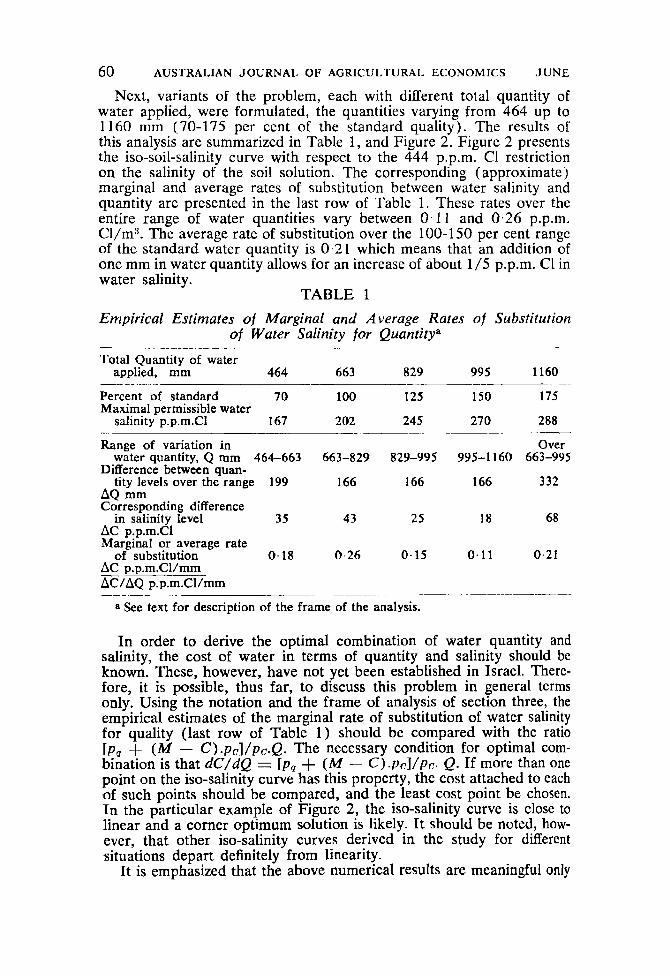
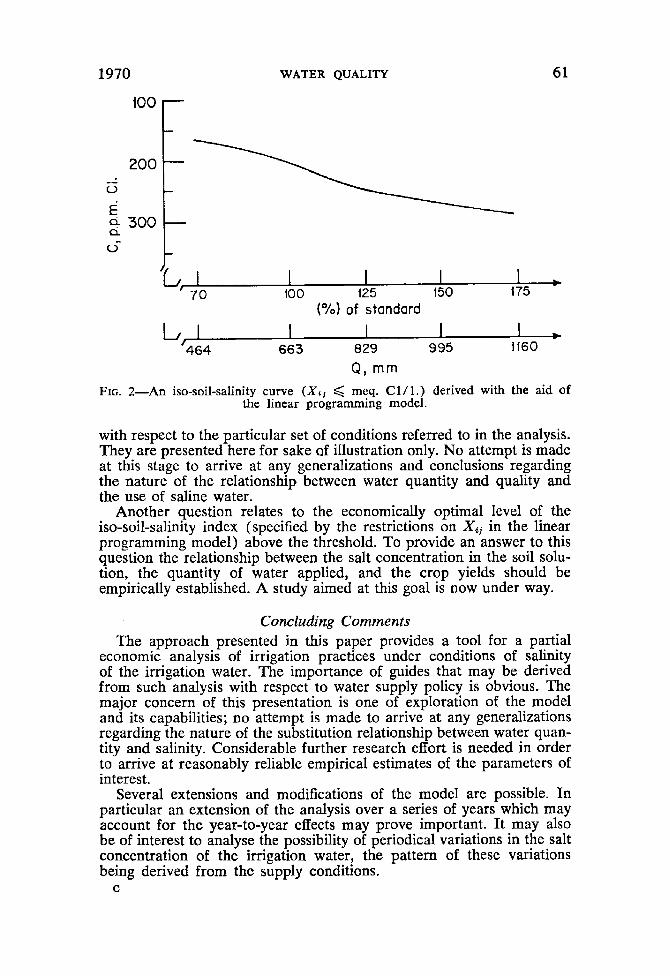
Next, variants of the problem, each with different total quantity of water applied, were formulated, the quantities varying from 464 up to 1160 mm (70-175 per cent of the standard quality). The results of this analysis are summarized in Table 1, and Figure 2. Figure 2 presents the iso-soil-salinity curve with respect to the 444 p.p.m. C1 restriction on the salinity of the soil solution. The corresponding (approximate) rnarginal and average rates of substitution between water salinity and quantity are presented in the last row of Table 1. These rates over the entire range of water quantities vary between 0-11 and 0.26 p.p.m. Cl/m3. The average rate of substitution over the 100-1 50 per cent range of the standard water quantity is 0.21 which means that an addition of one mm in water quantity allows for an increase of about 1/5 p.p.m. C1 in water salinity.
TABLE 1
Empirical Estimates of Marginal and A verage Rates of Substitution of Water Salinity for Quantitya
Total Quantity of water applied, mm 464 663 829 995 1160
-. ~~ .-
Percent of standard 70 100 125 150 175 Maximal permissible water
salinity p.p.m.Cl 167 202 245 27 0 288
Range of variation in Over water quantity, Q mm 464-663 663-829 829-995 995-1160 663-995
Difference between quan- tity levels over the range 199 166 166 I66 332
AQ mrn Corresponding difference in salinity level 35 43 25 18 68
AC p.p.m.Cl Marginal or average rate
of substitution 0 .18 0 - 2 6 0-15 0.11 0.21 AC p.p.rn.Cl/mm E/AQ p.p.m.Cl/mm
~
a See text for description of the frame of the analysis.
In order to derive the optimal combination of water quantity and salinity, the cost of water in terms of quantity and salinity should be known. These, however, have not yet been established in Israel. There- fore, it is possible, thus far, to discuss this problem in general terms only. Using the notation and the frame of analysis of section three, the empirical estimates of the marginal rate of substitution of water salinity for quality (last row of Table 1) should be compared with the ratio [ p , + (M - C) .pc ] /pG.Q. The necessary condition for optimal com- bination is that dC/dQ = [ p , + ( M - C).p~l /pc. Q. If more than one point on the iso-salinity curve has this property, the cost attached to each of such points should be compared, and the least cost point be chosen. In the particular example of Figure 2, the iso-salinity curve is close to linear and a comer optimum solution is likely. I t should be noted, how- ever, that other iso-salinity curves derived in the study for different situations depart definitely from linearity.
I t is emphasized that the above numerical results are meaningful only
1970
loo r 200 L
WATER QUALITY 61
i - 0
i d 300 0-
a
I I I I 70 100 125 150 175
(%I of standard
I I I I c 464 663 829 995 1160
L, I
Q, mm FIG. 2-An iso-soil-salinity curve ( X c , < meq. C l / l . ) derived with the aid of
the linear programming model.
with respect to the particular set of conditions referred to in the analysis. They are presented here for sake of illustration only. No attempt is made at this stage to arrive at any generalizations and conclusions regarding the nature of the relationship between water quantity and quality and the use of saline water.
Another question relates to the economically optimal level of the iso-soil-salinity index (specified by the restrictions on X,, in the linear programming model) above the threshold. To provide an answer to this question the relationship between the salt concentration in the soil solu- tion, the quantity of water applied, and the crop yields should be empirically established. A study aimed at this goal is now under way.
Concluding Comments The approach presented in this paper provides a tool for a partial
economic analysis of irrigation practices under conditions of salinity of the irrigation water. The importance of guides that may be derived from such analysis with respect to water supply policy is obvious. The major concern of this presentation is one of exploration of the model and its capabilities; no attempt is made to arrive at any generalizations regarding the nature of the substitution relationship between water quan- tity and salinity. Considerable further research effort is needed in order to arrive at reasonably reliable empirical estimates of the parameters of interest.
Several extensions and modifications of the model are possible. In particular an extension of the analysis over a series of years which may account for the year-to-year effects may prove important. It may also be of interest to analyse the possibility of periodical variations in the salt concentration of the irrigation water, the pattern of these variations being derived from the supply conditions.
C
62 AUSTRALIAN JOURNAL OF AGRICULTURAL ECONOMICS JUNE
Finally it should be noted that the present study deals with only one particular aspect of the whole compIex of economic problems involved in the use of saline water in irrigation, An extensive and diversified research effort is needed in order to provide the information necessary for sound policy decisions with respect to water resource development.
References [l] Allison, L. E., ‘Salinity in Relation to Irrigation’. Advances in Agronomy,
121 Bernstein, L., ‘Salinity and Citrus’. Calif. Citrograph, Vol. 50, 1965, pp.
131 -, Salt Tolerance of Fruit Crops, U.S. Dept. Agr., Inform. Bull. No.
[4] Bernstein, L. and Hayward, H. E., ‘Physiology of Plant Tolerance’. Review
[ 5 ] Bierhuizen, J. F., ’Water Quality and Yield Depression’. Ins?. for Land and
[6] Black, C. A., Soil Plant Relationship. John Wiley & Sons, New York, 1968,
[7] Bresler, E., ‘A Model for Tracing Salt Distribution in the Soil Profile and Estimating the Efficient Combination of Water Quality and Quantity under Varying Field Conditons’. Soil Science, Vol. 104, 1967. pp. 227-233.
[8] Grillot, G., ‘The Biological and Agricultural Problems Presented by Plants Tolerant of Saline or Brackish Water and the Employment of Such Water for Irrigation’. Arid Zone Research, Vol. 4, 1954, pp. 9-35.
[9] Hayward, H, E., ‘Plant Growth Under Saline Conditions’. Arid Zone Re- search, Vol. 4, 1954, pp. 37-71.
[lo] Hayward, H. E. and Bernstein, L., ‘Plant-Growth Relationship on Salt Affected Soils’. Botanical Review, Vol. 24, 1958, pp. 584-635.
[Ill Hayward, H. E. and Wadleigh, C. H., ‘Plant Growth on Saline and Alkali Soils’. Advances in Agronomy, Vol. 1 , 1949, p. 1-38.
[12] Magistad, 0. C., ‘Plant Growth Relations on Saline and Alkali Soils, Botani- cal Review, VoI. 1 1 , 1945, pp. 181-230.
[13] Magistad, 0. C., Ayers, A. D., Wadleigh, C. H. and Guach, H. G., ‘Effect of SaIt Concentration, Kind of Salt and Climate on Plant Growth in Sand Cultures’, Plant Physiology, Vof. 18, 1943, pp. 151-166.
[14] Yaron, D. and Bresler, E., An Economic Approach to the Analysis of fhe Salinity Problem. Research Report, Dept. of Agricultural Economics. Hebrew University of Jerusalem, 1966.
Vol. 16, 1964, pp. 139-178.
27 3-274.
292, 1964.
of Plant Physiology, Vol. 9, 958, pp. 25-46.
Water Management, Wageningen, Holland, Res. Tech. Bull. 61, 1969.
pp. 356-404.