a methodological proposal for estimating indirect...
TRANSCRIPT
1
A methodological proposal for estimating indirect disability transition rates from
national cross-sectional healthy surveys: an application to Brazil from 1998 to 2003
Abstract
This paper proposes a new method to estimate disability transition rates from national cross-sectional
health surveys. The proposed method estimates age-specific transition rates from cross-sectional data
according to well-documented longitudinal age-specific health transition rates of other populations, used
as standards, and the proportion of health and unhealthy individuals by age, reported in cross-sectional
datasets. In order to estimate healthy life expectancy, this paper makes use of most recent Brazilian health
survey data The preliminary results indicate that the estimated disability transition rates are consistent
with the current literature. Moreover, the estimated parameters for the simple model specification seem to
produce very reliable results. In 1998, 2003 and 2008 the estimated life expectancy – with and without
any disability – do not show significant statistical differences from other estimates, produced by other
methods. A second exercise will be conducted by estimating the parameters including covariates: sex,
race and education and to estimate differentials in healthy life expectancy.
Marcos Roberto Gonzaga [email protected]
Universidade Federal do Rio Grande do Norte
Roberto Nascimento Rodrigues [email protected]
Universidade Federal de Minas Gerais
Bernardo Lanza Queiroz
Universidade Federal de Minas Gerais
Paper presented at the XXVII IUSSP International Population Conference
Busan, South Korea – August, 2013.
2
Introduction
Changes in mortality and morbidity patterns are responsible for increases in life
expectancy and reductions in the variability of age at death in Brazil (Gonzaga, Queiroz
and Machado, 2008). Those changes follow a similar pattern as observed in the
developed countries (Wilmoth and Horiuchi, 1999) and can be explained by an
improvement in living conditions that reduced the number of deaths caused by
infectious diseases, leading to an increase in the participation of non-infectious diseases
as the main causes of deaths and a change in the age pattern of mortality (Schramm et
al, 2004). At the same time, one can observed a decline in the mortality rates of the
elderly population leading to an increase in the oldest age at death (Horiuchi and
Wilmoth, 1998; Campos and Rodrigues, 2004). They also suggest that this phenomenon
is still under way, in Brazil, and one could expect further decline in the mortality rates
at older ages.
If people are living longer, including at older ages, serious doubts exist about the overall
health conditions of the population. In more developed countries there is a debate about
compression of morbidity hypothesis and alternative views on the association between
mortality, morbidity and population health (Manton, 1982; Olshansky et al, 1991;
Crimmins and Beltran-Sanchez, 2011). A good indicator for analyzing those hypotheses
is one that could measure the implication of both mortality and health changes.
Despite the limitations in constructing an ideal measure of health, healthy life
expectancy (HALE) has been the most common indicator used in healthy and morbidity
compression studies (Nusselder, 2003). However, to produce good estimates of HALE
it is usually necessary to have individual age-specific transitions by health status and
death during a period of reference. This information is used as input to calculate multi-
state life tables. However, in most developing countries, for example in Brazil, an
important drawback in estimating age-specific healthy transition rates or probabilities is
the absence of public available data on health conditions and longitudinal surveys. In
most of developing countries, estimates of HALE use the Sullivan method, but it has
some questionable assumptions and/or significant data requirements that make their use
limited (Romero, et.al, 2005; Camargos, et. al, 2008).
To solve those limitations on traditional methods to estimate HALE in the absence of
health conditions longitudinal surveys, Guillot and Yu (2009) proposed a new approach
3
called Intercensal Method. The method makes possible to recover a multistate transition
framework by using age-specific proportions of “healthy” individuals at two successive,
independent cross-sectional health surveys together with information on general
mortality. In order to apply the Intercensal Method one needs to make the assumptions
that age-specific transition rates are well described by exponential functions at ages 60
and above.
In this paper, we present an alternative methodology to estimate disability transition
rates by using information from only one national cross-sectional healthy survey and a
standard function for age-specific disability transition rates. The proposed method
estimates indirect or implicit age-specific transition rates from cross-sectional data
according to well-documented longitudinal age-specific health transition rates of other
populations, and the proportion of health and unhealthy individuals by age, reported in
cross-sectional data for the country of interest.
Data and Methods
Methods
The method we proposed in this paper estimates age profiles for the transition rates
implied in cross-sectional surveys based on an age profile of a standard population,
based on longitudinal surveys, and proportions of individuals by health status by age,
from the cross-sectional surveys of the country of interest. Therefore, it is expected that
the proposed method can be used in any population that has any survey with
information from health conditions from cross-sectional studies.
In most developing countries, and for a series of developed countries, studies of HALE
are based on the Sullivan method. However, despite its usefulness, one of the major
limitations of the Sullivan method, with regard to the analysis of trends in the indicator
refers to the violation of the assumptions of stability of measures of incidence and
homogeneity in the risk of death in the time interval considered for analysis. The
method we propose, unlike the Sullivan method, allows the simulation of cohorts of
active and disabled individuals, incorporating heterogeneity in the risk of death for each
cohort and allowing the construction of multistate life tables for estimation of active life
expectancy.
4
Intuitively, the method works as follows: we assume that information about the health
status of individuals are available to make possible the construction of a variable
indicating a state of health, for example, if the individual is considered active or
functionally disabled at age x. In this case, it is reasonable to assume that the observed
proportion of active individuals at age x + n is a function of the proportions of active
and disabled individuals at age x, exposed to different types of risks (competitive) in the
interval (x, x + n-Δ), where Δ is as small as possible. That is, the observed proportion of
active individuals at age x + n is a function of the proportions of active and disabled
individuals at age x, exposed to transition rates between two transient states (active /
disabled) and the mortality risks for each state between ages x and x + n.
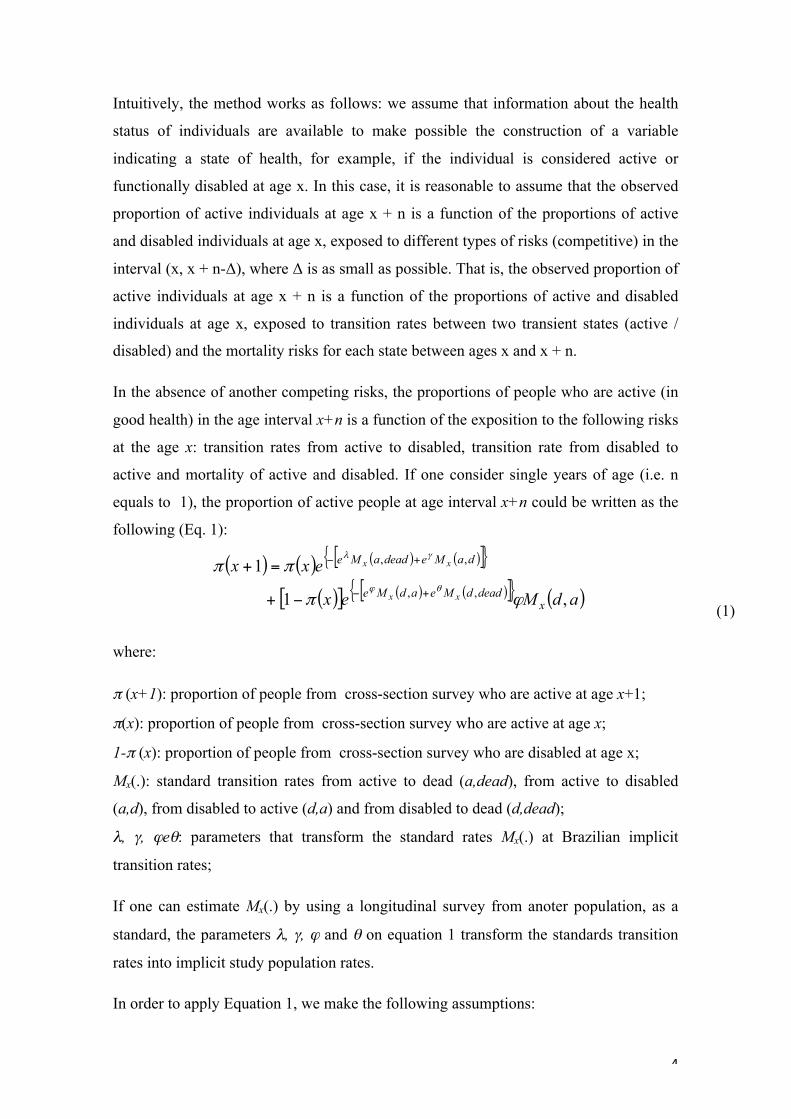
In the absence of another competing risks, the proportions of people who are active (in
good health) in the age interval x+n is a function of the exposition to the following risks
at the age x: transition rates from active to disabled, transition rate from disabled to
active and mortality of active and disabled. If one consider single years of age (i.e. n
equals to 1), the proportion of active people at age interval x+n could be written as the
following (Eq. 1):
(1)
where:
π (x+1): proportion of people from cross-section survey who are active at age x+1;
π(x): proportion of people from cross-section survey who are active at age x;
1-π (x): proportion of people from cross-section survey who are disabled at age x;
Mx(.): standard transition rates from active to dead (a,dead), from active to disabled
(a,d), from disabled to active (d,a) and from disabled to dead (d,dead);
λ, γ, ϕeθ: parameters that transform the standard rates Mx(.) at Brazilian implicit
transition rates;
If one can estimate Mx(.) by using a longitudinal survey from anoter population, as a
standard, the parameters λ, γ, ϕ and θ on equation 1 transform the standards transition
rates into implicit study population rates.
In order to apply Equation 1, we make the following assumptions:
( ) ( ) ( ) ( )[ ]{ }
( )[ ] ( ) ( )[ ]{ } ( )adMex
exx
xdeaddMeadMe
daMedeadaMe
xx
xx
,1
1,,
,,
ϕπ
ππθϕ
γλ
+−
+−
−+
=+
5
a) Only one transition occurs per age interval;
b) All transitions should occur at the end of the interval (i.e. x, x+n-∆, where ∆ is
going to be as small as possible);
c) The age patterns for age-specific of the studied population transition rates are
similar to the standards transition rates.
In order to apply this method all functions Mx(.) need to be estimated from a
longitudinal survey that has the same health conditions information we have on the
population of interest. The strategy is to assume that the age structures of the transition
rates, implied in sectional studies are similar to that of the standard population. Thus, if
the model of Equation 1 fits the data well, it is expected that the coefficient estimates
for the parameters λ (lambda), γ (gamma), φ (psi) and θ (theta), multiplied by the
respective transition rates Mx(a, m), Mx(a, i), Mx(i, a) and Mx(i, m), will return the
transition rates implicit by the observed proportions of the study population.
A possible computational limitation in estimating the parameters λ, γ, θ and φ can be
imposed by the number of observations in the model, available only if there is only one
point in time. For example, if the age range in which the objective is to estimate the
rates implied transition comprises single ages from 60 to 95 years, the model has 36
observations and 4 parameters to be estimated. The computational procedure can be
made more complex if one is interested in producing estimates for sub-population
groups.
But, if the study population has consecutives cross-sectional surveys one can pool the
data in order to improve the estimation procedure. Then, we can make each parameter
as a function of covariates such as sex, education and race. However, adding covariates
on Eq. 1 could increase the complexity of the estimation process. For example, if there
is interest in estimating sex-specific implied transition rates; the number of parameters
must be multiplied by 2 (an intercept and a slope). For the case of Brazil, we use data
from three (3) PNADs and including in the model a variable for each year in order to
identify changes in transitions rate over time. In this case, one needs to estimate 3 x 4
parameters in the model.
Complex computational procedures, such as optimization techniques for solving
systems of equations (Guillot& Yu, 2009), can be used for estimating the parameters of
Equation 1. However, in order to simplify the estimation process, we chose to use the
6
adjustment procedure for nonlinear regression available in STATA ®. The command
"nl" STATA ® uses an iterative Gauss-Newton methods modified to estimate the
parameters of a nonlinear function using least squares. With the interactive version of
the command, you can write the function directly from the command line. The Gauss-
Newton method, also known as a method of linearization, is a particular case of the least
square method (Myers, 1990). This method uses a Taylor series expansion to
approximate non-linear regression model with linear terms. Then applies OLS to
estimate the parameters. Iteration of these steps leads to a solution for the estimation of
parameters in non-linear regression (Myers, 1990).
Data
In order to apply the proposed method and estimate healthy life expectancy, we make
use of Brazilian Cross-sectional Household Surveys (PNAD) from 1998, 2003 and 2008
and two longitudinal Healthy Surveys form Latin America: Mexican Health and Aging
Study (MHAS), 2001 and 2003, and Puerto Rican Elderly: Health Conditions
(PREHCO), 2002/2003 and 2006/2007. We use Mexico and Puerto Rico as standards
to estimate HALE and health transitions in Brazil. In relation to Guillot and Yu (2009),
our method can be estimated using a single year of data for the population of interest
and allows studying health status differential, for education and other variables of
interest.
The health supplements of PNAD collected information on two modules: health
characteristics and physical mobility of residents. Information on health included
questions on morbidity and self-reported diseases. For morbidity, PNAD collected
information on: a) self-perceived health, b) information on activities not performed for
health reasons in the past two weeks, indicating which activities, how many days left to
carry out such activities and why c) it had been bedridden for the past two weeks and
the reason d) self-reported diseases. The MHAS is a prospective panel study nationally
representative of adult and older individuals. The first interview was conducted in 2001
and a second wave was applied in 2003. The data collected provided a substantial
amount of sociodemographic, health, functional and cognitive performance and
anthropometric measures. The sample consists of individuals 50 years or older,
characterized by a high prevalence of communicable and non-communicable diseases,
income inequality and health and certain predominance of extended families that work
7
generally as institutions that promote social capital, human and financial (Kohler
&Soldo, 2004). The Puerto Rican Elderly: Health Conditions (PREHCO) is a
representative sample of the population aged 60 or older living in private households,
whether or not capable physically and mentally (Palloni et al, 2005). In addition to
addressing general characteristics of the population aged 60 and over residing in Puerto
Rico, provides other information, such as: health, household characteristics,
intergenerational transfer, functional status, work history and sources of income,
migration characteristics of childhood, health insurance, utilization and access to health
services, abuse, marital history, sexuality and anthropometric measurements.
Regarding the question about activities of daily living, both in the PREHCO and MHAS
as the respondent was asked whether, because of health problems, had difficulty
performing certain activity. The activities included in both questionnaires were:
walking, bathing, eating, lying down or getting up from the bed and using the toilet. The
response categories considered in MHAS and PREHCO were: yes, no, can not, does /
does not apply. There was a low frequency of responses classified as unable or does /
does not apply in the two surveys (around 0.30% in all activities). Thus, we decided to
consider only the categories of responses classified as yes or no to the construction of
the indicator of disability in research. For PNAD, since it considers three activities
combined into a single issue (eating, bathing, toileting), we chose to use the same three
activities to build the indicator of disability in databases. Therefore, the respondent was
classified as functionally incapacitated if he had answered yes to at least one of these
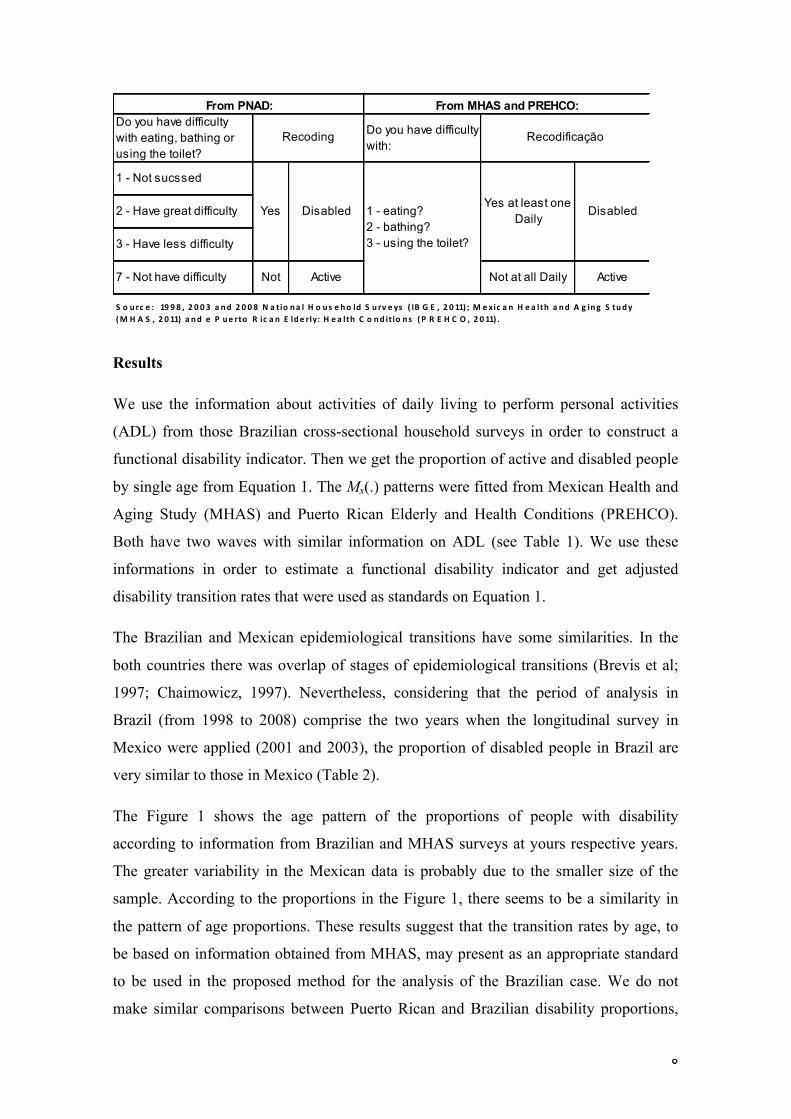
activities. Table 1 presents a summary of the information and the process used to
construct a disability indicator on each survey.
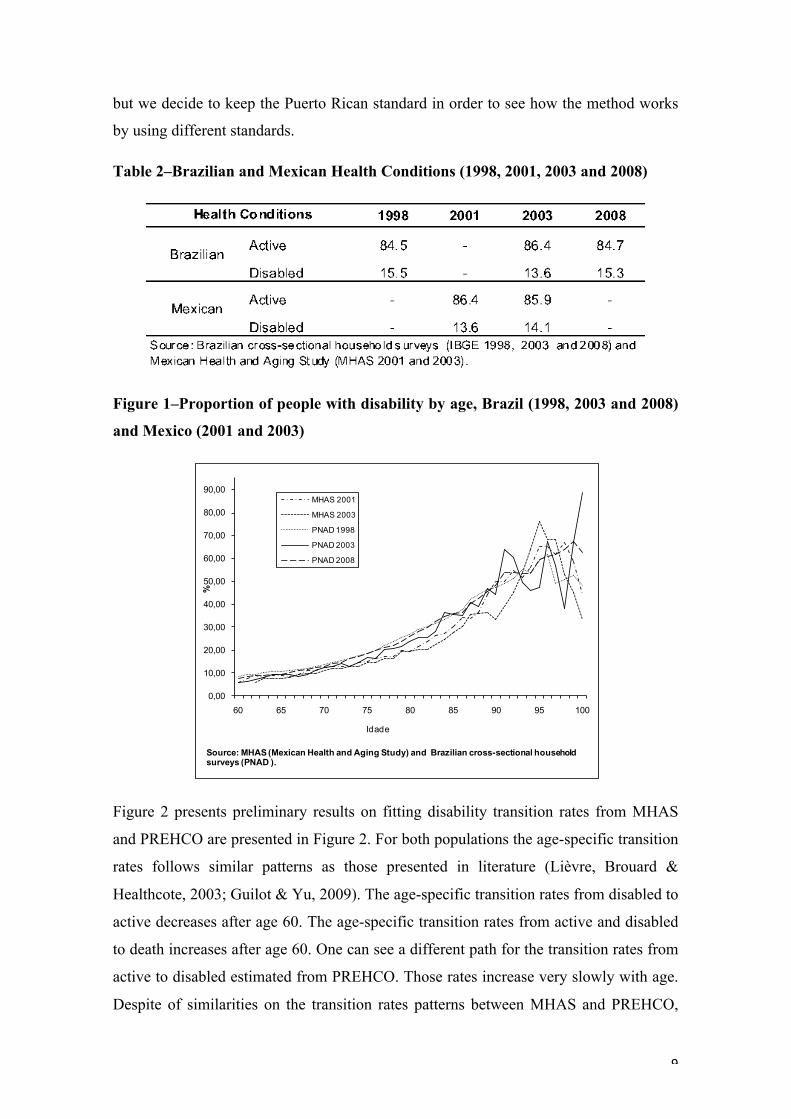
Table 1 - Compatibility of information about ADL databases PNAD, MHAS and PREHCO
8
Results
We use the information about activities of daily living to perform personal activities
(ADL) from those Brazilian cross-sectional household surveys in order to construct a
functional disability indicator. Then we get the proportion of active and disabled people
by single age from Equation 1. The Mx(.) patterns were fitted from Mexican Health and
Aging Study (MHAS) and Puerto Rican Elderly and Health Conditions (PREHCO).
Both have two waves with similar information on ADL (see Table 1). We use these
informations in order to estimate a functional disability indicator and get adjusted
disability transition rates that were used as standards on Equation 1.
The Brazilian and Mexican epidemiological transitions have some similarities. In the
both countries there was overlap of stages of epidemiological transitions (Brevis et al;
1997; Chaimowicz, 1997). Nevertheless, considering that the period of analysis in
Brazil (from 1998 to 2008) comprise the two years when the longitudinal survey in
Mexico were applied (2001 and 2003), the proportion of disabled people in Brazil are
very similar to those in Mexico (Table 2).
The Figure 1 shows the age pattern of the proportions of people with disability
according to information from Brazilian and MHAS surveys at yours respective years.
The greater variability in the Mexican data is probably due to the smaller size of the
sample. According to the proportions in the Figure 1, there seems to be a similarity in
the pattern of age proportions. These results suggest that the transition rates by age, to
be based on information obtained from MHAS, may present as an appropriate standard
to be used in the proposed method for the analysis of the Brazilian case. We do not
make similar comparisons between Puerto Rican and Brazilian disability proportions,
Do you have difficulty with eating, bathing or using the toilet?
Do you have difficulty with:
1 - Not sucssed
2 - Have great difficulty
3 - Have less difficulty
7 - Not have difficulty Not Active Not at all Daily Active
1 - eating? 2 - bathing? 3 - using the toilet?
S o urc e : 19 9 8 , 2 0 0 3 a nd 2 0 0 8 N a tio na l H o us e ho ld S u rv e ys ( IB G E , 2 0 11) ; M e xic a n H e a lth a nd A g ing S tudy (M H A S , 2 0 11) a nd e P ue rto R ic a n E lde rly: H e a lth C o nd it io ns ( P R E H C O , 2 0 11) .
From MHAS and PREHCO:From PNAD:
Yes Disabled
Recoding
Yes at least one Daily
Disabled
Recodificação
9
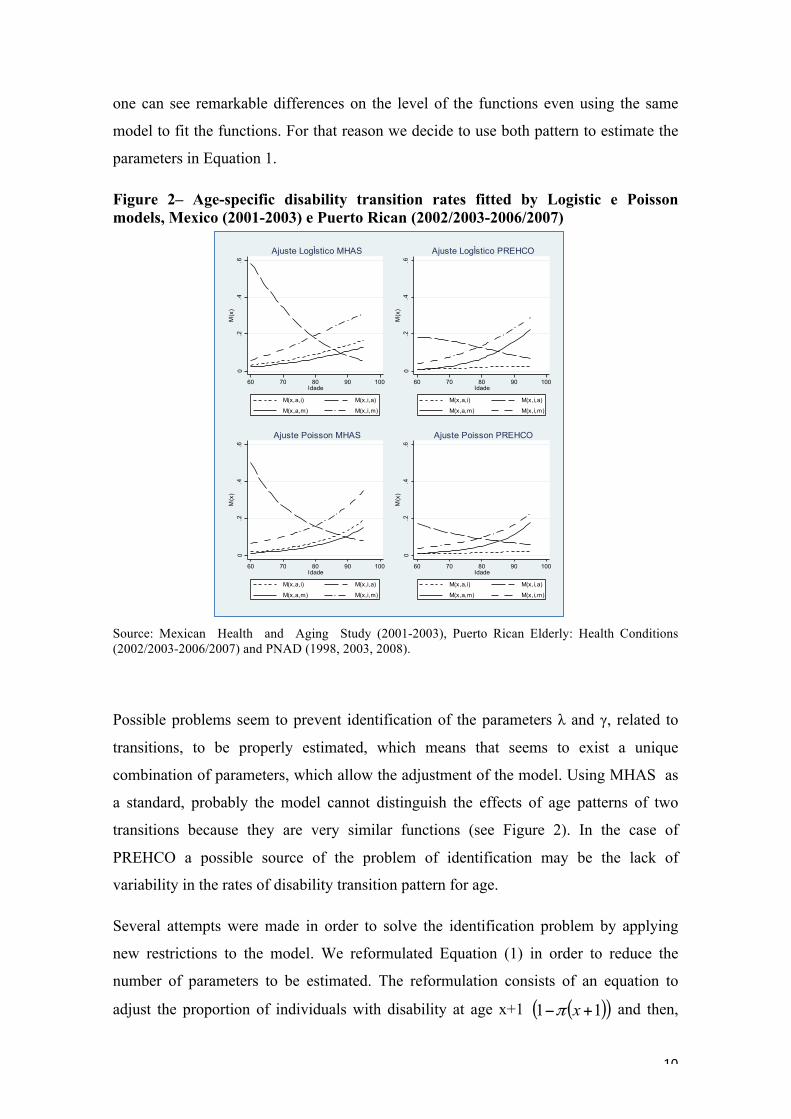
but we decide to keep the Puerto Rican standard in order to see how the method works
by using different standards.
Table 2–Brazilian and Mexican Health Conditions (1998, 2001, 2003 and 2008)
Figure 1–Proportion of people with disability by age, Brazil (1998, 2003 and 2008)
and Mexico (2001 and 2003)
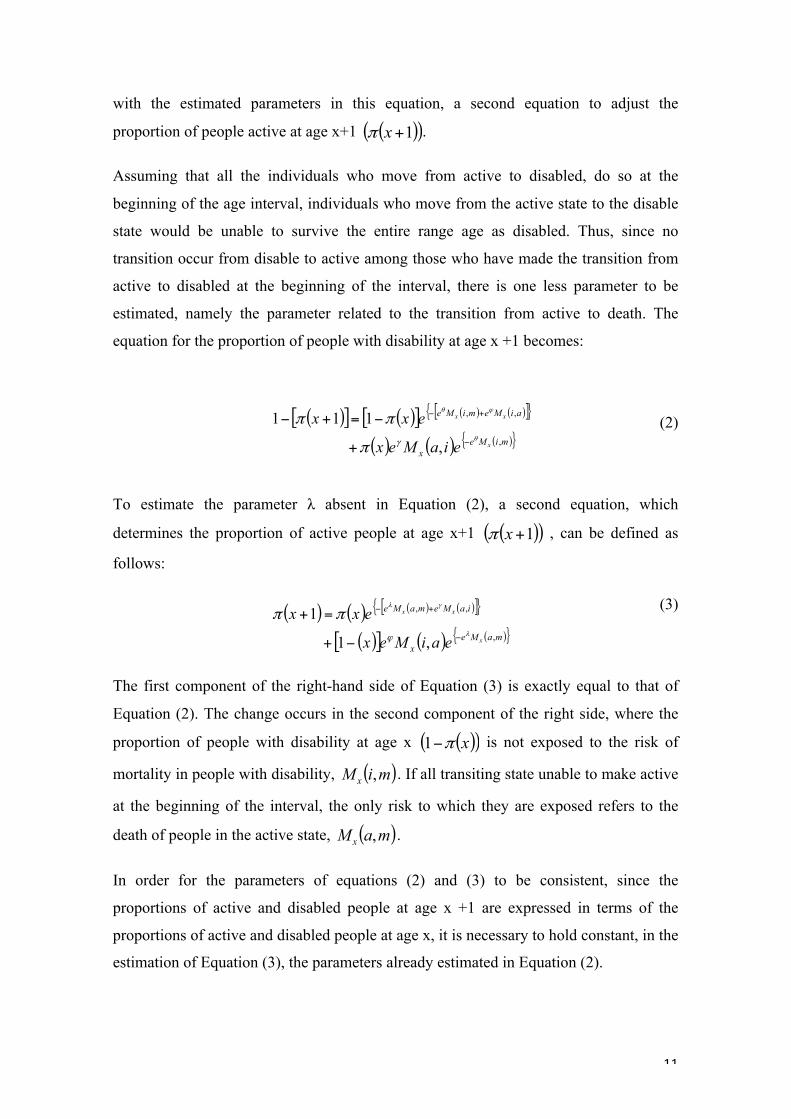
Figure 2 presents preliminary results on fitting disability transition rates from MHAS
and PREHCO are presented in Figure 2. For both populations the age-specific transition
rates follows similar patterns as those presented in literature (Lièvre, Brouard &
Healthcote, 2003; Guilot & Yu, 2009). The age-specific transition rates from disabled to
active decreases after age 60. The age-specific transition rates from active and disabled
to death increases after age 60. One can see a different path for the transition rates from
active to disabled estimated from PREHCO. Those rates increase very slowly with age.
Despite of similarities on the transition rates patterns between MHAS and PREHCO,
0,00
10,00
20,00
30,00
40,00
50,00
60,00
70,00
80,00
90,00
60 65 70 75 80 85 90 95 100
%
Idade
MHAS 2001
MHAS 2003
PNAD 1998
PNAD 2003
PNAD 2008
Source: MHAS (Mexican Health and Aging Study) and Brazilian cross-sectional householdsurveys (PNAD ).
10
one can see remarkable differences on the level of the functions even using the same
model to fit the functions. For that reason we decide to use both pattern to estimate the
parameters in Equation 1.
Figure 2– Age-specific disability transition rates fitted by Logistic e Poisson models, Mexico (2001-2003) e Puerto Rican (2002/2003-2006/2007)
Source: Mexican Health and Aging Study (2001-2003), Puerto Rican Elderly: Health Conditions (2002/2003-2006/2007) and PNAD (1998, 2003, 2008).
Possible problems seem to prevent identification of the parameters λ and γ, related to
transitions, to be properly estimated, which means that seems to exist a unique
combination of parameters, which allow the adjustment of the model. Using MHAS as
a standard, probably the model cannot distinguish the effects of age patterns of two
transitions because they are very similar functions (see Figure 2). In the case of
PREHCO a possible source of the problem of identification may be the lack of
variability in the rates of disability transition pattern for age.
Several attempts were made in order to solve the identification problem by applying
new restrictions to the model. We reformulated Equation (1) in order to reduce the
number of parameters to be estimated. The reformulation consists of an equation to
adjust the proportion of individuals with disability at age x+1 ( )( )11 +− xπ and then,
0.2
.4.6
M(x
)
60 70 80 90 100Idade
M(x,a,i) M(x,i,a)
M(x,a,m) M(x,i,m)
Ajuste LogÌstico MHAS
0.2
.4.6
M(x
)
60 70 80 90 100Idade
M(x,a,i) M(x,i,a)
M(x,a,m) M(x,i,m)
Ajuste LogÌstico PREHCO0
.2.4
.6M
(x)
60 70 80 90 100Idade
M(x,a,i) M(x,i,a)
M(x,a,m) M(x,i,m)
Ajuste Poisson MHAS
0.2
.4.6
M(x
)
60 70 80 90 100Idade
M(x,a,i) M(x,i,a)
M(x,a,m) M(x,i,m)
Ajuste Poisson PREHCO
11
with the estimated parameters in this equation, a second equation to adjust the
proportion of people active at age x+1 ( )( )1+xπ .
Assuming that all the individuals who move from active to disabled, do so at the
beginning of the age interval, individuals who move from the active state to the disable
state would be unable to survive the entire range age as disabled. Thus, since no
transition occur from disable to active among those who have made the transition from
active to disabled at the beginning of the interval, there is one less parameter to be
estimated, namely the parameter related to the transition from active to death. The
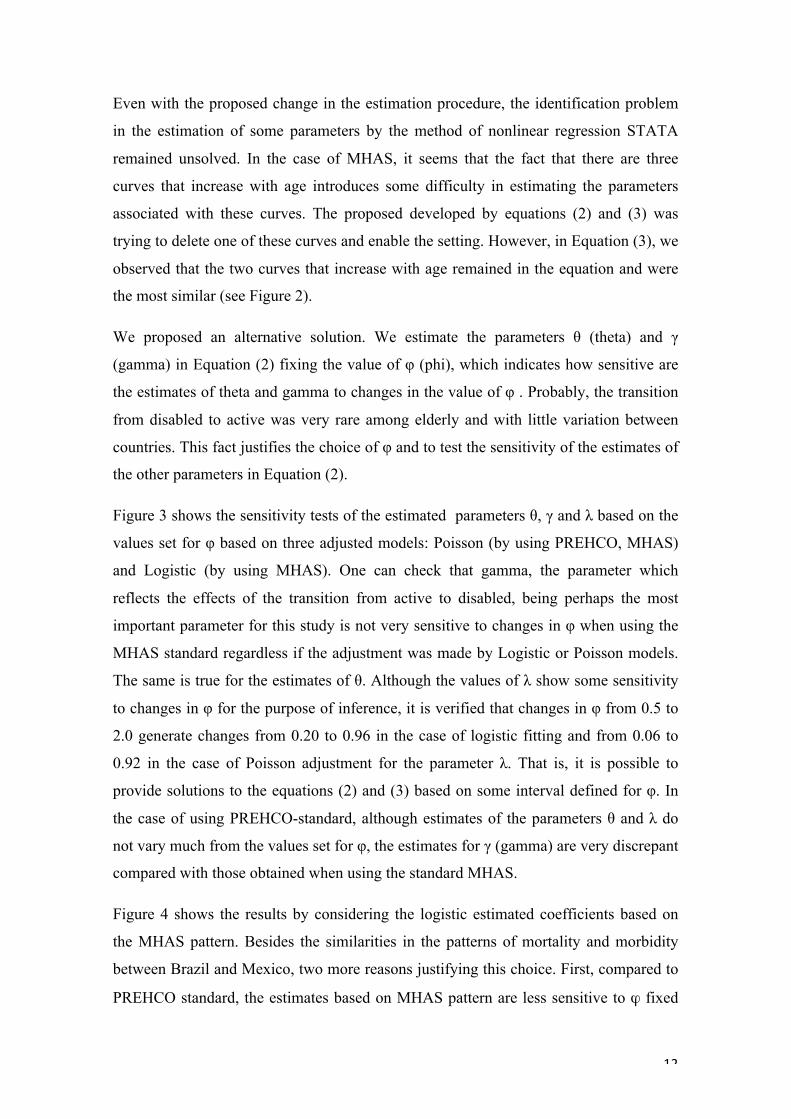
equation for the proportion of people with disability at age x +1 becomes:
(2)
To estimate the parameter λ absent in Equation (2), a second equation, which
determines the proportion of active people at age x+1 ( )( )1+xπ , can be defined as
follows:
(3)
The first component of the right-hand side of Equation (3) is exactly equal to that of
Equation (2). The change occurs in the second component of the right side, where the
proportion of people with disability at age x ( )( )xπ−1 is not exposed to the risk of
mortality in people with disability, ( )miMx , . If all transiting state unable to make active
at the beginning of the interval, the only risk to which they are exposed refers to the
death of people in the active state, ( )maMx , .
In order for the parameters of equations (2) and (3) to be consistent, since the
proportions of active and disabled people at age x +1 are expressed in terms of the
proportions of active and disabled people at age x, it is necessary to hold constant, in the
estimation of Equation (3), the parameters already estimated in Equation (2).
( )[ ] ( )[ ] ( ) ( )[ ]{ }
( ) ( ) ( ){ }miMex
aiMemiMe
x
xx
eiaMex
exx,
,,
,
111θ
ϕθ
γπ
ππ−
+−
+
−=+−
( ) ( ) ( ) ( )[ ]{ }
( )[ ] ( ) ( ){ }maMex
iaMemaMe
x
xx
eaiMex
exx,
,,
,1
1λ
γλ
ϕ
ππ−
+−
−+
=+
12
Even with the proposed change in the estimation procedure, the identification problem
in the estimation of some parameters by the method of nonlinear regression STATA
remained unsolved. In the case of MHAS, it seems that the fact that there are three
curves that increase with age introduces some difficulty in estimating the parameters
associated with these curves. The proposed developed by equations (2) and (3) was
trying to delete one of these curves and enable the setting. However, in Equation (3), we
observed that the two curves that increase with age remained in the equation and were
the most similar (see Figure 2).
We proposed an alternative solution. We estimate the parameters θ (theta) and γ
(gamma) in Equation (2) fixing the value of φ (phi), which indicates how sensitive are
the estimates of theta and gamma to changes in the value of φ . Probably, the transition
from disabled to active was very rare among elderly and with little variation between
countries. This fact justifies the choice of φ and to test the sensitivity of the estimates of
the other parameters in Equation (2).
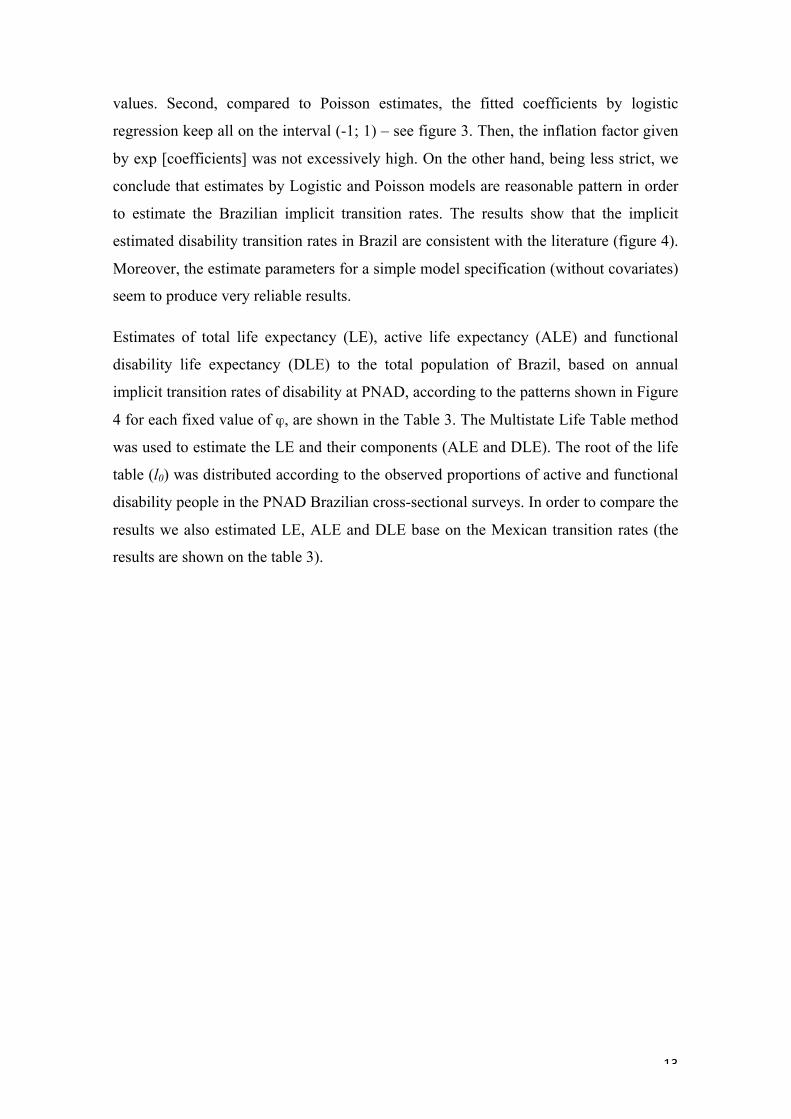
Figure 3 shows the sensitivity tests of the estimated parameters θ, γ and λ based on the
values set for φ based on three adjusted models: Poisson (by using PREHCO, MHAS)
and Logistic (by using MHAS). One can check that gamma, the parameter which
reflects the effects of the transition from active to disabled, being perhaps the most
important parameter for this study is not very sensitive to changes in φ when using the
MHAS standard regardless if the adjustment was made by Logistic or Poisson models.
The same is true for the estimates of θ. Although the values of λ show some sensitivity
to changes in φ for the purpose of inference, it is verified that changes in φ from 0.5 to
2.0 generate changes from 0.20 to 0.96 in the case of logistic fitting and from 0.06 to
0.92 in the case of Poisson adjustment for the parameter λ. That is, it is possible to
provide solutions to the equations (2) and (3) based on some interval defined for φ. In
the case of using PREHCO-standard, although estimates of the parameters θ and λ do
not vary much from the values set for φ, the estimates for γ (gamma) are very discrepant
compared with those obtained when using the standard MHAS.
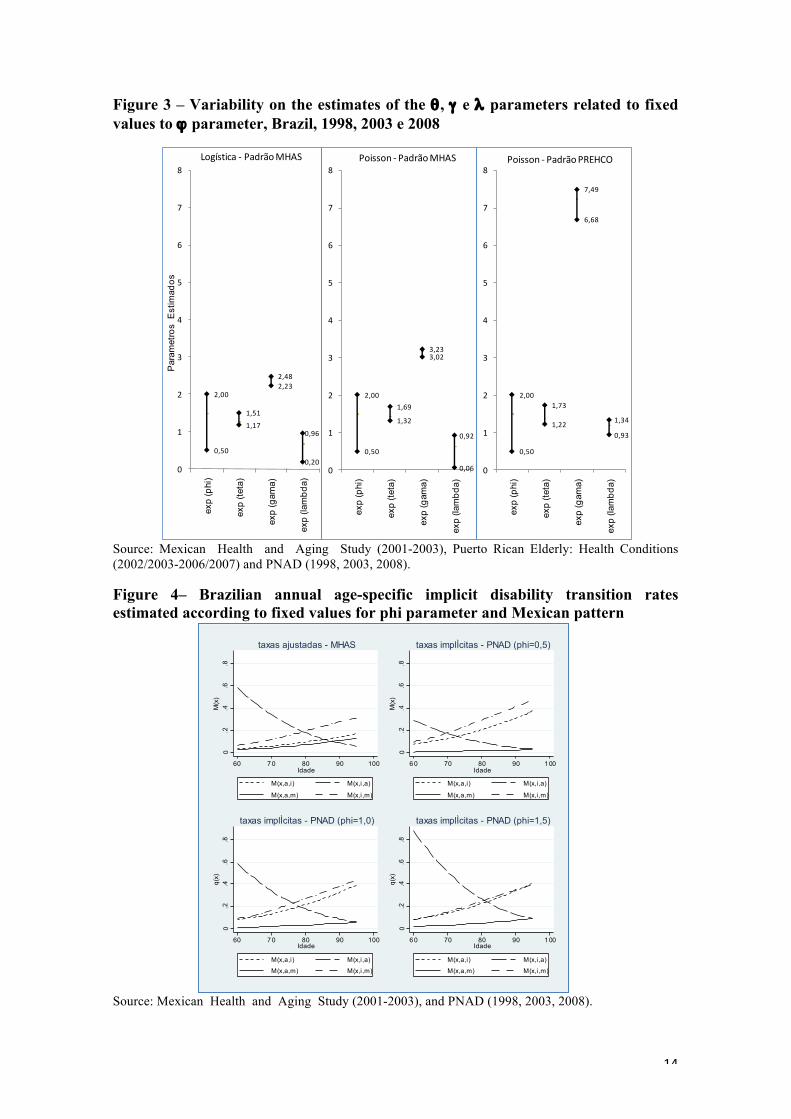
Figure 4 shows the results by considering the logistic estimated coefficients based on
the MHAS pattern. Besides the similarities in the patterns of mortality and morbidity
between Brazil and Mexico, two more reasons justifying this choice. First, compared to
PREHCO standard, the estimates based on MHAS pattern are less sensitive to ϕ fixed
13
values. Second, compared to Poisson estimates, the fitted coefficients by logistic
regression keep all on the interval (-1; 1) – see figure 3. Then, the inflation factor given
by exp [coefficients] was not excessively high. On the other hand, being less strict, we
conclude that estimates by Logistic and Poisson models are reasonable pattern in order
to estimate the Brazilian implicit transition rates. The results show that the implicit
estimated disability transition rates in Brazil are consistent with the literature (figure 4).
Moreover, the estimate parameters for a simple model specification (without covariates)
seem to produce very reliable results.
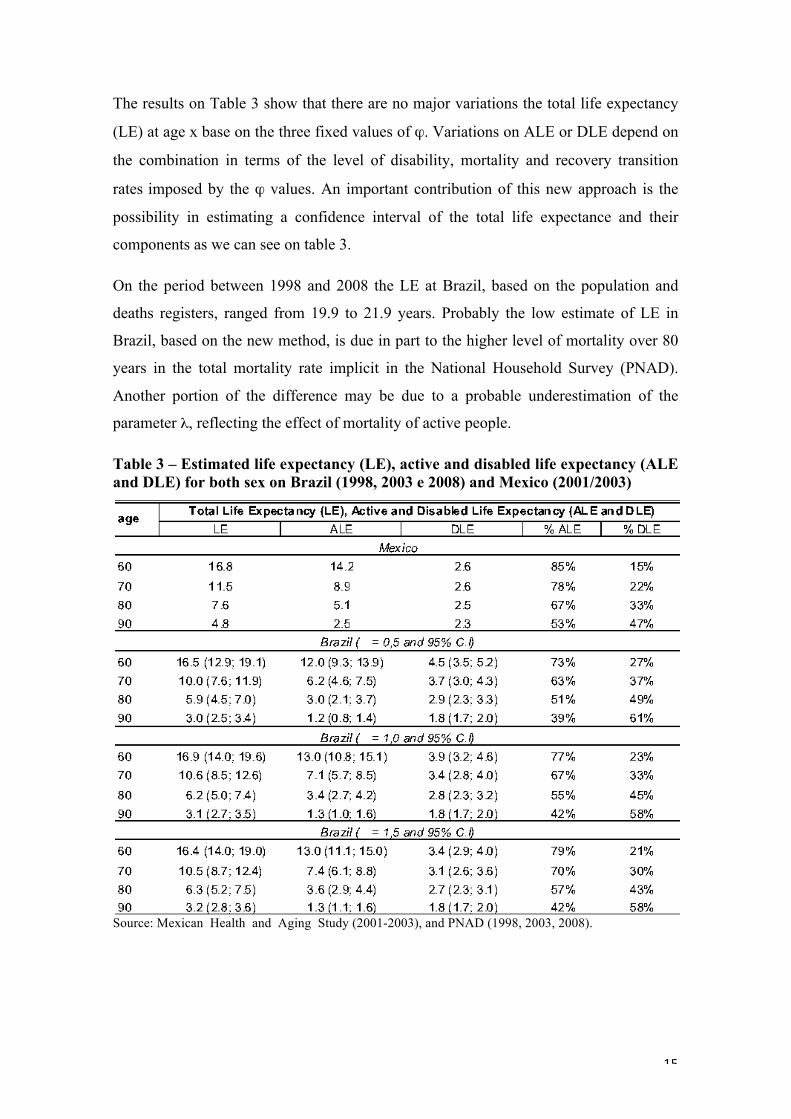
Estimates of total life expectancy (LE), active life expectancy (ALE) and functional
disability life expectancy (DLE) to the total population of Brazil, based on annual
implicit transition rates of disability at PNAD, according to the patterns shown in Figure
4 for each fixed value of ϕ, are shown in the Table 3. The Multistate Life Table method
was used to estimate the LE and their components (ALE and DLE). The root of the life
table (l0) was distributed according to the observed proportions of active and functional
disability people in the PNAD Brazilian cross-sectional surveys. In order to compare the
results we also estimated LE, ALE and DLE base on the Mexican transition rates (the
results are shown on the table 3).
14
Figure 3 – Variability on the estimates of the θ , γ e λ parameters related to fixed values to ϕ parameter, Brazil, 1998, 2003 e 2008
Source: Mexican Health and Aging Study (2001-2003), Puerto Rican Elderly: Health Conditions (2002/2003-2006/2007) and PNAD (1998, 2003, 2008).
Figure 4– Brazilian annual age-specific implicit disability transition rates estimated according to fixed values for phi parameter and Mexican pattern
Source: Mexican Health and Aging Study (2001-2003), and PNAD (1998, 2003, 2008).
0,50
1,51
2,23
0,20
2,00
1,17
2,48
0,96
0
1
2
3
4
5
6
7
8
exp
(phi
)
exp
(teta
)
exp
(gam
a)
exp
(lam
bda)
Par
amet
ros
Est
imad
osLogística -‐ Padrão MHAS
0,50
1,69
3,02
0,06
2,00
1,32
3,23
0,92
0
1
2
3
4
5
6
7
8
exp
(phi
)
exp
(teta
)
exp
(gam
a)
exp
(lam
bda)
Poisson -‐ Padrão MHAS
0,50
1,73
6,68
0,93
2,00
1,22
7,49
1,34
0
1
2
3
4
5
6
7
8
exp
(phi
)
exp
(teta
)
exp
(gam
a)
exp
(lam
bda)
Poisson -‐ Padrão PREHCO
0.2
.4.6
.8M
(x)
60 7 0 80 90 100Idade
M(x,a,i) M(x,i,a)
M(x,a,m) M(x,i,m)
taxas ajustadas - MHAS
0.2
.4.6
.8M
(x)
6 0 70 80 90 1 00Idade
M(x,a,i) M(x,i,a)
M(x,a,m) M(x,i,m)
taxas implÌcitas - PNAD (phi=0,5)
0.2
.4.6
.8q(
x)
60 7 0 80 90 100Idade
M(x,a,i) M(x,i,a)
M(x,a,m) M(x,i,m)
taxas implÌcitas - PNAD (phi=1,0)
0.2
.4.6
.8q(
x)
6 0 70 80 90 1 00Idade
M(x,a,i) M(x,i,a)
M(x,a,m) M(x,i,m)
taxas implÌcitas - PNAD (phi=1,5)
15
The results on Table 3 show that there are no major variations the total life expectancy
(LE) at age x base on the three fixed values of ϕ. Variations on ALE or DLE depend on
the combination in terms of the level of disability, mortality and recovery transition
rates imposed by the ϕ values. An important contribution of this new approach is the
possibility in estimating a confidence interval of the total life expectance and their
components as we can see on table 3.
On the period between 1998 and 2008 the LE at Brazil, based on the population and
deaths registers, ranged from 19.9 to 21.9 years. Probably the low estimate of LE in
Brazil, based on the new method, is due in part to the higher level of mortality over 80
years in the total mortality rate implicit in the National Household Survey (PNAD).
Another portion of the difference may be due to a probable underestimation of the
parameter λ, reflecting the effect of mortality of active people.
Table 3 – Estimated life expectancy (LE), active and disabled life expectancy (ALE and DLE) for both sex on Brazil (1998, 2003 e 2008) and Mexico (2001/2003)
Source: Mexican Health and Aging Study (2001-2003), and PNAD (1998, 2003, 2008).
16
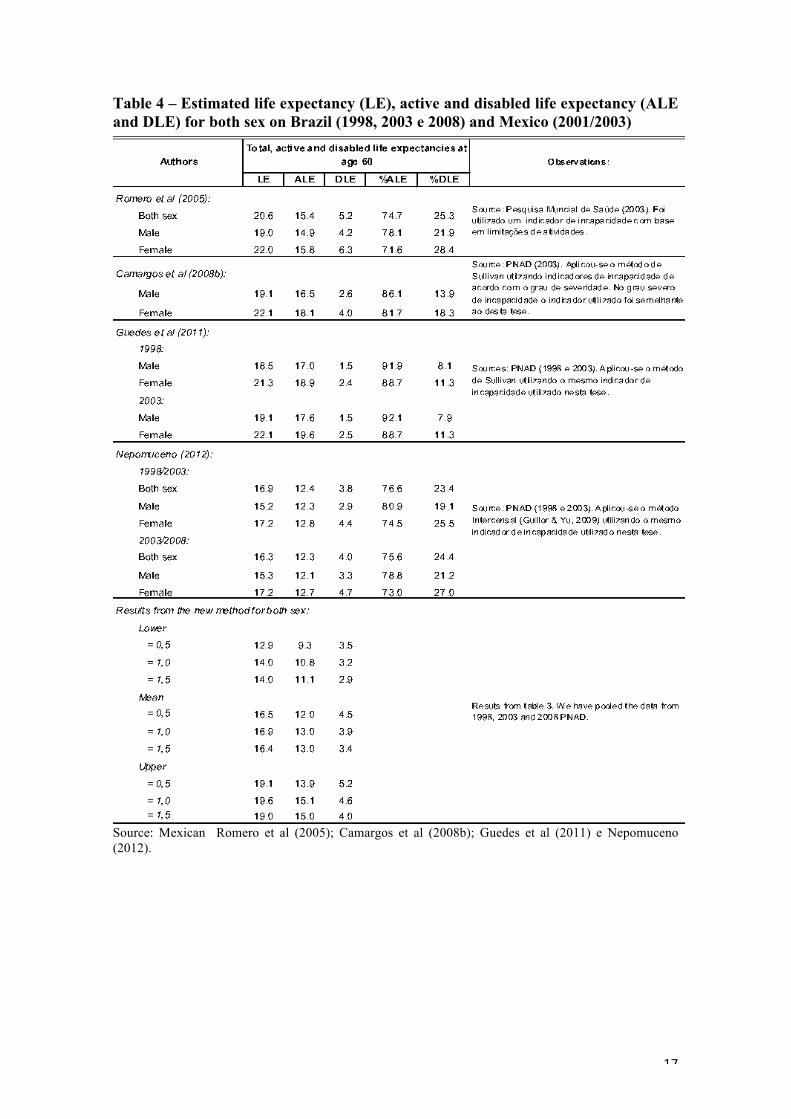
In order to verify the applicability of the new method, we compared our estimates with
the others in the literature. We show on table 4 some published and selected results for
estimates of total, active and disabled life expectancies to Brazil from 2005 to 2012.
The four published studies were selected based on the following criteria: a) results for
the total population of Brazil, b) some degree of similarity of the used indicators and c)
data sources and reference year.
The only one that uses data from the 2008 National Household Survey, of those
presented in Table 4, on their estimates are those presented by Nepomuceno (2012),
which used Guillot and Yu method. The results for healthy life expectancy are similar to
our average estimates. However, the estimates produced there are valid for the periods
between the PNADs 1998, 2003 and 2008. While the estimates produced in this paper
take into account the pooled data from 1998, 2003 and 2008. The intercensal method
estimates the age pattern of transitions linking the proportions of active at age x at time
t, the proportions of active subjects of age x + n at time t + n, whereas the method
proposed in this paper relates to the proportion of active individuals at age x to the
proportions of active individuals with disability and age x+n. This means that if there is
only one cross-sectional, and the parameters of the equations (2) and (3) were correctly
estimated, the method proposed here would enable the estimation of transition rates
implied by considering only a cross-sectional, which would not be possible with
applying the census method proposed by Guillot & Yu.
The next steps consist estimating the parameters on the equations (2) and (3) using
dummies for sex, education, race and years of PNAD as covariates Since adding
covariates on the equations (2) and (3) means to increase considerably the number of
parameters to be estimated, it is important to develop and consider alternative ways to
obtain more robust estimates of these parameters.
17
Table 4 – Estimated life expectancy (LE), active and disabled life expectancy (ALE and DLE) for both sex on Brazil (1998, 2003 e 2008) and Mexico (2001/2003)
Source: Mexican Romero et al (2005); Camargos et al (2008b); Guedes et al (2011) e Nepomuceno (2012).
18
Discussion
Estimates of healthy life expectancy in order to analyze trends in the health status of a
population requires knowledge of the age pattern of rates or transition probabilities
between health states and death, between two or more time points, thus enabling using
the life table method to construct the multistate indicator.
In the absence of such rates or probabilities, under the assumption that the
characteristics under study are stable over time, the Sullivan method has emerged as the
primary tool for estimating HALE. However, despite its usefulness, one of its major
limitations, with regard to the analysis of trends in the indicator refers to the violation of
the assumptions of stability of measures of incidence and homogeneity in the risk of
death in the time interval considered for analysis.
For countries that do not have longitudinal data to estimate the rates or transition
probabilities, some new approaches have been proposed in order to reduce the bias in
the estimates of HALE due to violation of the assumptions adopted by the Sullivan
method. Noteworthy is the intercensal method, proposed by Guillot& Yu (2009) that
reproduces a multistate structure and enables the estimation of HALE in the presence of
heterogeneity of risk of death.
The method proposed in this paper, unlike the Sullivan method, allows the simulation of
cohorts of active and disabled people, incorporating heterogeneity in the risk of death
for each cohort and allowing the construction of multistate life tables for estimation of
active life expectancy. For this, the method estimates the age structure for the transition
rates implicit in cross-sectional surveys based on a standard age for the transition rates
between health states and death from nationally representative longitudinal surveys and
other populations, and proportions of healthy and unhealthy by age, from cross-
sectional surveys.
Difficulties in implementing the original proposal of the method led to a reformulation
and simulations in order to enable more robust estimates of the parameters. As a result,
the rates implied transition of disability by age, estimated by the new method are
consistent with those presented in the literature. Moreover, estimates of HALE for the
total population in 1998, 2003 and 2008 are consistent with those produced by other
methods.
19
A possible differential method proposed here in relation to traditional methods and the
intercensal method, which also estimates the age pattern of transitions of disability, is
the possibility of a multivariate analysis of trends in the HALE. However, limitations
related to the estimation of the parameters in the presence of covariates of interest
hinder the multivariate indicator. The limitations encountered in the implementation of
the proposed method should serve as a stimulus for new reformulations of the equations
and assumptions adopted. In this sense, the difficulties encountered in the application of
the method can serve as a basis for a research agenda in finding the most appropriate
solutions. Such an agenda should be considered in order to make the method more
easily replicable in other populations, as well as Brazil, lack of adequate information to
monitor trends in healthy life expectancy of the population.
Acknowledgments
This research was supported by Fogarty Foundation grant (Marcos
Gonzaga), Fapemig and CNPq (Bernardo Queiroz). We would like to thank
Alberto Palloni for comments and suggestions, and the Univeristy of
Wisconsin at Madison for the support while part of the project was
developed.
References
Arriaga, Eduardo E., and Kingsley Davis. "The pattern of mortality change in Latin America." Demography 6.3 (1969): 223-242. Behm, Hugo. "Social and economic determinants of mortality in Latin America." Salud Colectiva 7.2 (2011): 231-253. Brevis, CA.; Del Río, FV; Mabel, YG (1997) Transición epidemiológica en América Latina: comparación de cuatro países. Rev. méd. Chile; v.125, n.6, p. 719-27, Jun. Camargos, Mirela Castro Santos, Carla Jorge Machado, and Roberto Nascimento Rodrigues. "Life expectancy among elderly Brazilians in 2003 according to different levels of functional disability." Cadernos de SaúdePública 24.4 (2008): 845-852.
Chaimowicz, FA(1997). A saúde dos idosos brasileiros às vésperas do século XXI: problemas, projeções e alternativas. Rev. Saúde Pública, v. 31, n. 2, p. 184-200.
20
Crimmins, Eileen M., and Hiram Beltrán-Sánchez. "Mortality and morbidity trends: is there compression of morbidity?." The Journals of Gerontology Series B: Psychological Sciences and Social Sciences 66.1 (2011): 75-86.
Frenk, Julio, Jose L. Bobadilla, and Rafael Lozano. "The epidemiological transition in Latin America." Adult Mortality in Latin America 123 (1996).
Gonzaga, Marcos Roberto, Bernardo Lanza Queiroz, and Carla Jorge Machado. Compression of mortality: a study on the variability of age at death in the StateofSao Paulo, 1980-2005" Cad. SaúdePública 25, no. 7 (2009): 1475-1485. Guillot, M.; Yu, Y. (2009). Estimating health expectancy from two cross-sectional surveys: The intercensal method. Demographic Research, v. 21, n. 17, p. 503-534, oct. Horiuchi, Shiro, and John R. Wilmoth. "Deceleration in the age pattern of mortality at olderages." Demography 35.4 (1998): 391-412. Lièvre, A; Brouard, N; Heathcote, C. (2003).The estimation of health expectancies from cross-longitudinal surveys. Mathematical Population Studies, v. 10, p. 211-48. Manton, KG. (1982). Changing Concepts of Morbidity and Mortality in the Elderly Population.Milkbank Memorial Fund Quarterly/Health and Society, Massachusetts, v. 60, n.2, p. 183-244.
Nunes A. (2004). O envelhecimento populacional e as despesas do Sistema Único de Saúde. In: Camarano AA, organizadora. Os novos idosos brasileiros: muito além dos 60? IPEA/IBGE, 2004. p. 427-50. Nusselder, WJ. (2003). Compression of Morbidity. In ROBINE, J.M., JAGGER, C., MATHERS, C.D., CRIMMINS, E., SUZMAN, R. (Orgs) Determining Health Expectancies: Chichester, United Kingdom: John Wiley & Sons, p. 35-58.
Olshansky, SJ, Rudberg, MA, Carnes, BA, Cassel, BA, Brady, JA. (1991). Trading Off Longer Life for Worsening Health: The Expansion of Morbidity Hypothesis. Journal of Aging and Health, v. 3, n. 2, p. 193-216, may. Palloni, A., & Pinto-Aguirre, G. (2011). Adult mortality in Latin America and the Caribbean. In R. Rogers, & E. Crimmins (Eds.), International Handbook of Adult Mortality, 2(1), 101-132.
Palloni, A., Pinto-Aguirre, G., & Pelaez, M. (2002). Demographic and health conditions of ageing in Latin America and the Caribbean. International Journal of Epidemiology, 31, 762-771. Palloni, Alberto, and Randy Wyrick. "Mortality decline in Latin America: changes in the structure of causes of deaths, 1950–1975." Biodemography and Social Biology 28.3-4 (1981): 187-216.
Romero, Dalia Elena, Iúri da Costa Leite, and CéliaLandmannSzwarcwald. "Healthy life expectancy in Brazil: applying the Sullivan method." Cadernos de SaúdePública 21 (2005): S7-S18. Schramm JMA, Oliveira AF, Leite IC, Valente JG, Gadelha AMJ, Portela MC, et al. (2004). Transição epidemiológica e o estudo de carga de doença no Brasil. Ciência & Saúde Coletiva; 9:897-908.
Wilmoth JR, Horiuchi SE. (1999). Rectangularization revisited: variability of age at death within human populations. Demography ; 36:475-95.