a man for all seasons? - resolutionfoundation.org · a man for all seasons? what the chancellor can...
TRANSCRIPT
A man for all seasons?
What the Chancellor can expect in the OBR’s Spring outlook
Matt Whittaker
March 2018
@MattWhittakerRF @resfoundation
1
IN THE BLEAK MIDWINTER
The OBR’s Nov-17 outlook lowered both the government’s fiscal headroom and households’
living standards prospects
Autumn
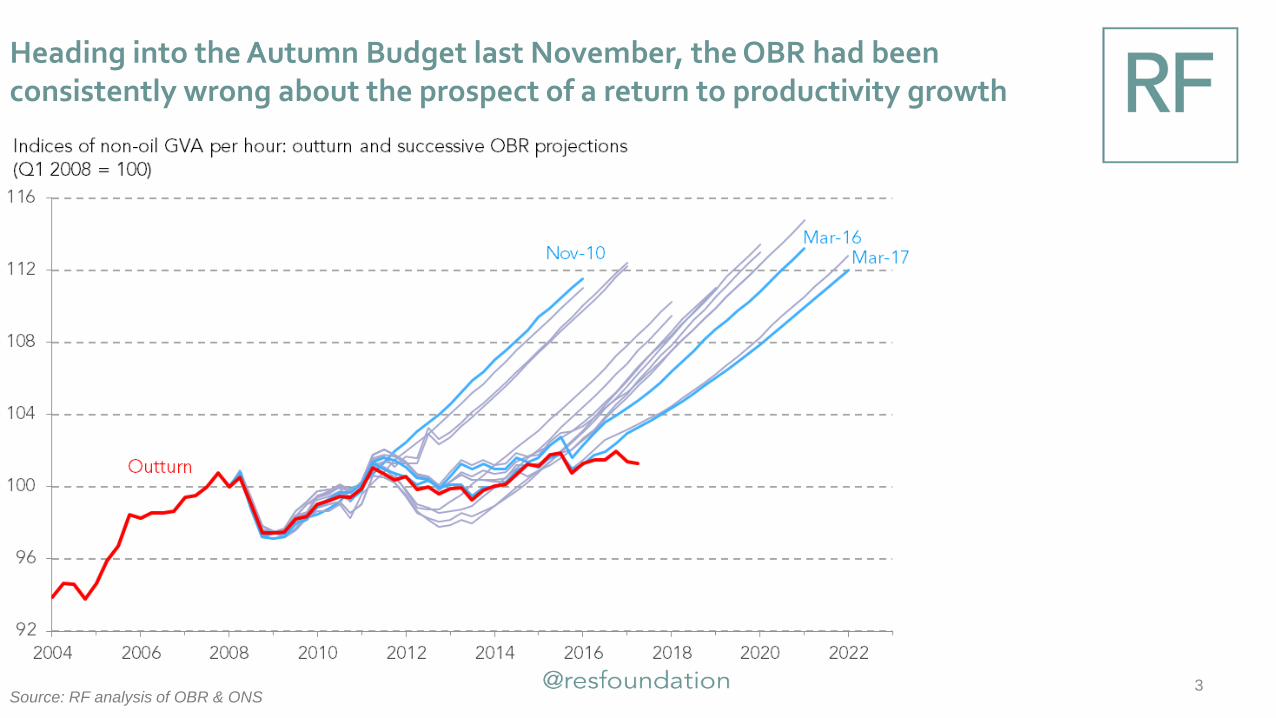
Heading into the Autumn Budget last November, the OBR had been consistently wrong about the prospect of a return to productivity growth
3Source: RF analysis of OBR & ONS

So, after a near-decade of stagnation, the OBR chose to significantly revise down its projection for trend productivity growth
4
Trend productivity growth was revised down from
2.1 per cent before Mar-16 to 1.2 per cent in the
Nov-17 outlook. This marked a mid-path
between the pre- and post-crisis trends
Output per hour was subsequently forecast to
be 4.6 per cent lower in 2022 than previously
thought
Source: RF analysis of OBR & ONS
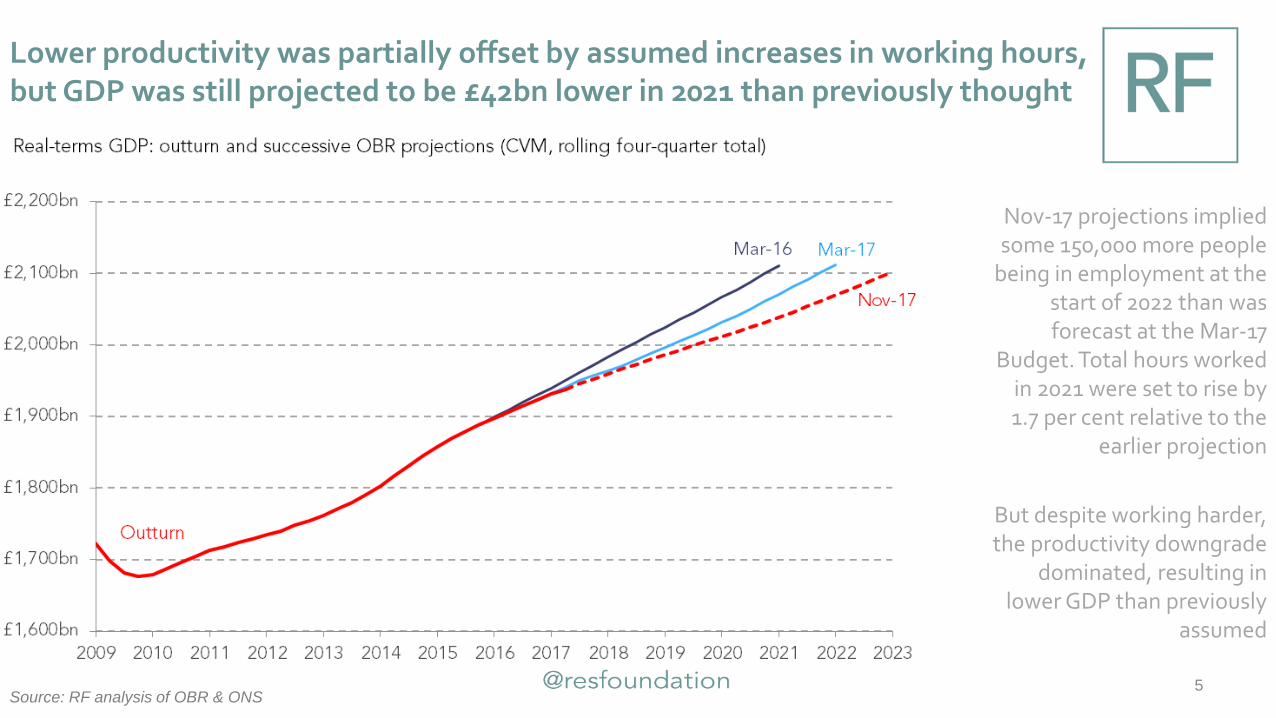
Lower productivity was partially offset by assumed increases in working hours, but GDP was still projected to be £42bn lower in 2021 than previously thought
5
Nov-17 projections implied some 150,000 more people
being in employment at the start of 2022 than was forecast at the Mar-17
Budget. Total hours worked in 2021 were set to rise by 1.7 per cent relative to the
earlier projection
But despite working harder, the productivity downgrade
dominated, resulting in lower GDP than previously
assumed
Source: RF analysis of OBR & ONS
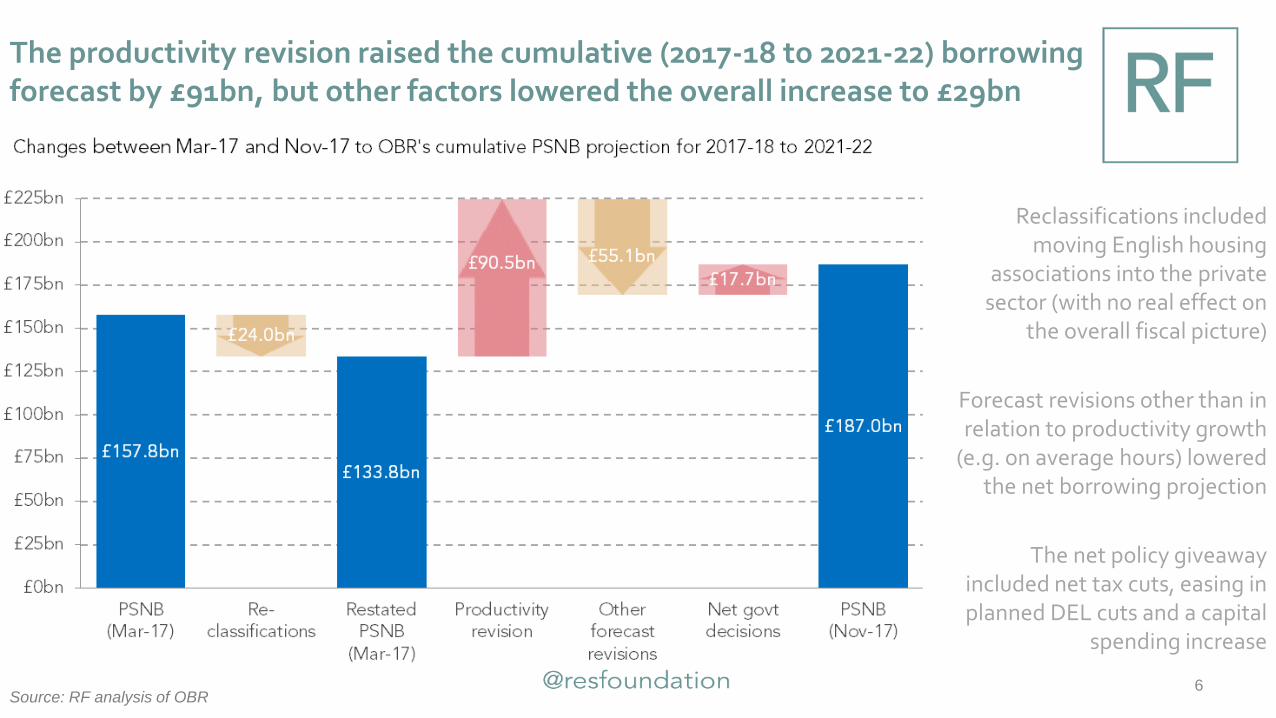
The productivity revision raised the cumulative (2017-18 to 2021-22) borrowing forecast by £91bn, but other factors lowered the overall increase to £29bn
6
Reclassifications included moving English housing
associations into the private sector (with no real effect on
the overall fiscal picture)
Forecast revisions other than in relation to productivity growth
(e.g. on average hours) lowered the net borrowing projection
The net policy giveaway included net tax cuts, easing in planned DEL cuts and a capital
spending increase
Source: RF analysis of OBR

These revisions lowered the Chancellor’s headroom in 2020-21 from £26bn to £15bn
7Source: RF analysis of OBR
The fiscal mandate requires the government to lower cyclically-adjusted public
sector net borrowing below 2 per cent of GDP by 2020-
21, while the Treasury’s broader ‘objective for fiscal
policy’ is:
“to return the public finances to balance at the
earliest possible date in the next Parliament”
Notes: CACB = cyclically adjusted current budget; PSNB =
public sector net borrowing; CAPSNB = cyclically adjusted
public sector net borrowing
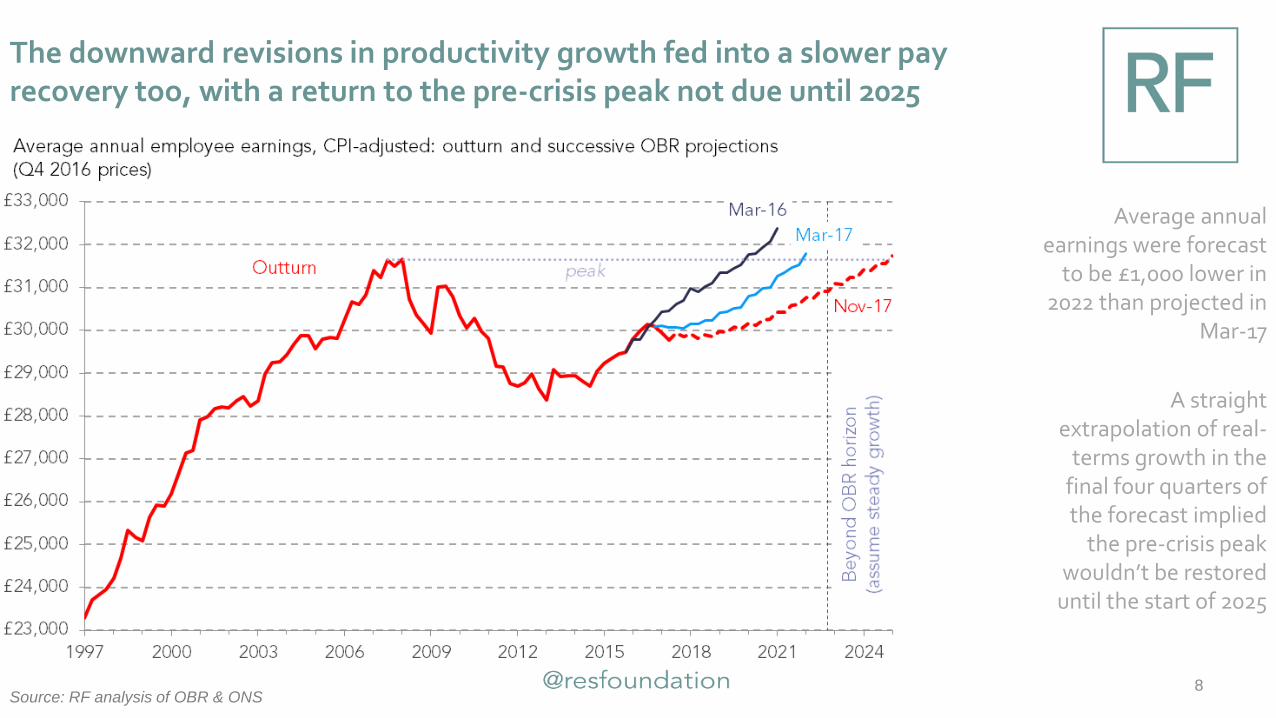
The downward revisions in productivity growth fed into a slower pay recovery too, with a return to the pre-crisis peak not due until 2025
8
Average annual earnings were forecast
to be £1,000 lower in 2022 than projected in
Mar-17
A straight extrapolation of real-
terms growth in the final four quarters of the forecast implied
the pre-crisis peak wouldn’t be restored
until the start of 2025
Source: RF analysis of OBR & ONS

And broader income growth was projected to undergo a longer squeeze than the one felt immediately after the financial crisis
9
Disposable income per person fell across 17
quarters between Q3 2007 and Q4 2011; but
the OBR’s outlook suggested that the
current squeeze –which started after Q3 2015 – is set to last 19
quarters (until Q2 2020)
Source: RF analysis of OBR & ONS
HOPE SPRINGS
Better recent performance on productivity, pay and borrowing could bring some cheer for the
Chancellor in next week’s outlook
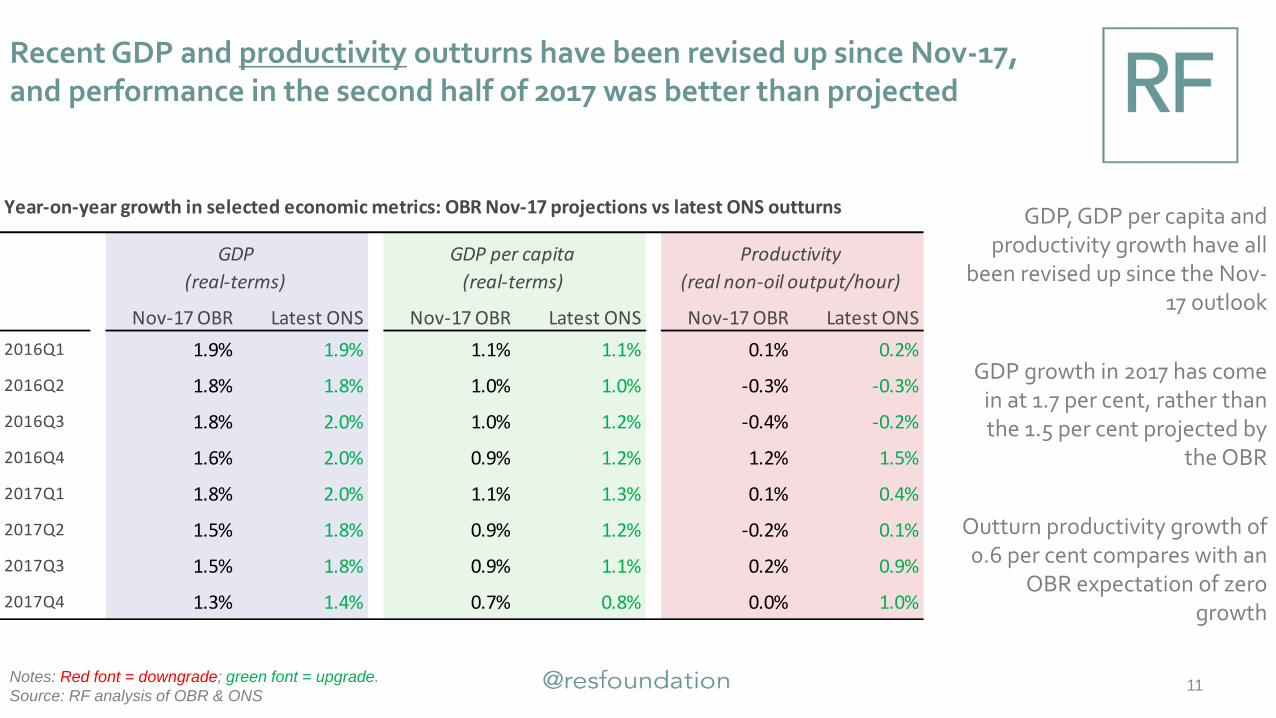
Recent GDP and productivity outturns have been revised up since Nov-17, and performance in the second half of 2017 was better than projected
11Notes: Red font = downgrade; green font = upgrade.
Source: RF analysis of OBR & ONS
GDP, GDP per capita and productivity growth have all
been revised up since the Nov-17 outlook
GDP growth in 2017 has come in at 1.7 per cent, rather than the 1.5 per cent projected by
the OBR
Outturn productivity growth of 0.6 per cent compares with an
OBR expectation of zero growth
Year-on-year growth in selected economic metrics: OBR Nov-17 projections vs latest ONS outturns
Nov-17 OBR Latest ONS Nov-17 OBR Latest ONS Nov-17 OBR Latest ONS
2016Q1 1.9% 1.9% 1.1% 1.1% 0.1% 0.2%
2016Q2 1.8% 1.8% 1.0% 1.0% -0.3% -0.3%
2016Q3 1.8% 2.0% 1.0% 1.2% -0.4% -0.2%
2016Q4 1.6% 2.0% 0.9% 1.2% 1.2% 1.5%
2017Q1 1.8% 2.0% 1.1% 1.3% 0.1% 0.4%
2017Q2 1.5% 1.8% 0.9% 1.2% -0.2% 0.1%
2017Q3 1.5% 1.8% 0.9% 1.1% 0.2% 0.9%
2017Q4 1.3% 1.4% 0.7% 0.8% 0.0% 1.0%
GDP
(real-terms)
GDP per capita
(real-terms)
Productivity
(real non-oil output/hour)
12Source: RF analysis of OBR & ONS
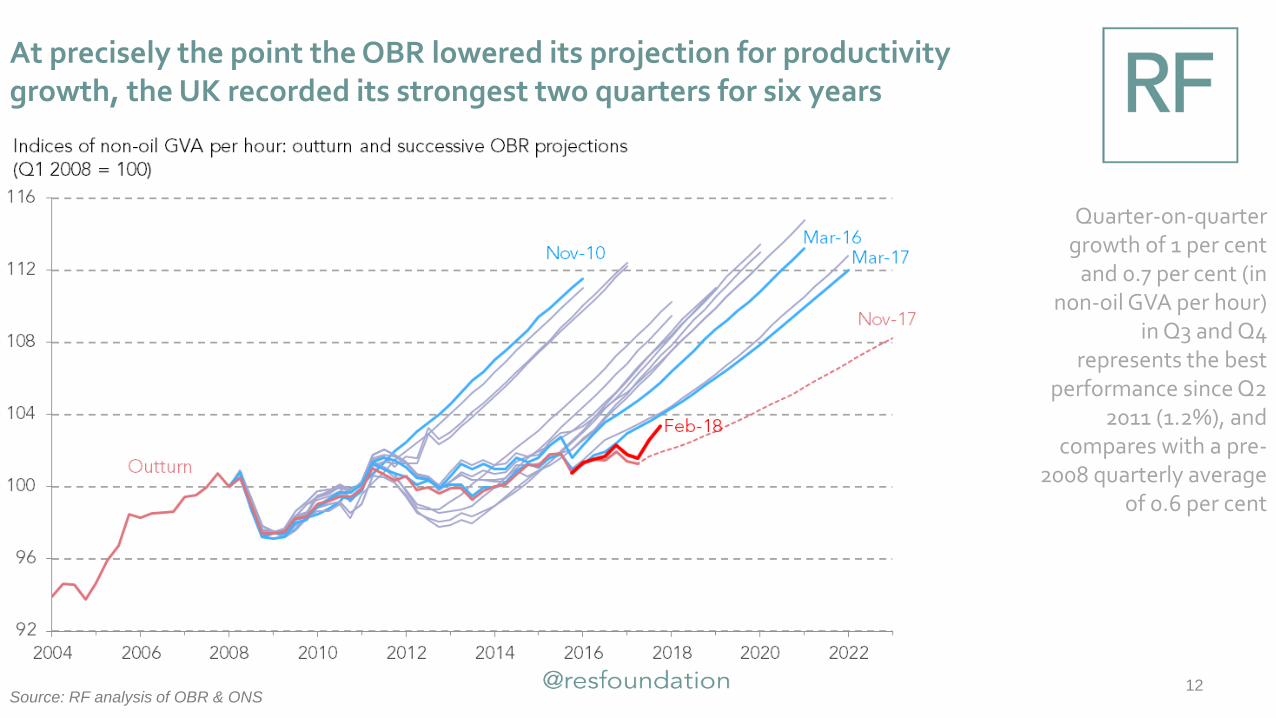
Quarter-on-quarter growth of 1 per cent
and 0.7 per cent (in non-oil GVA per hour)
in Q3 and Q4 represents the best
performance since Q2 2011 (1.2%), and
compares with a pre-2008 quarterly average
of 0.6 per cent
At precisely the point the OBR lowered its projection for productivity growth, the UK recorded its strongest two quarters for six years
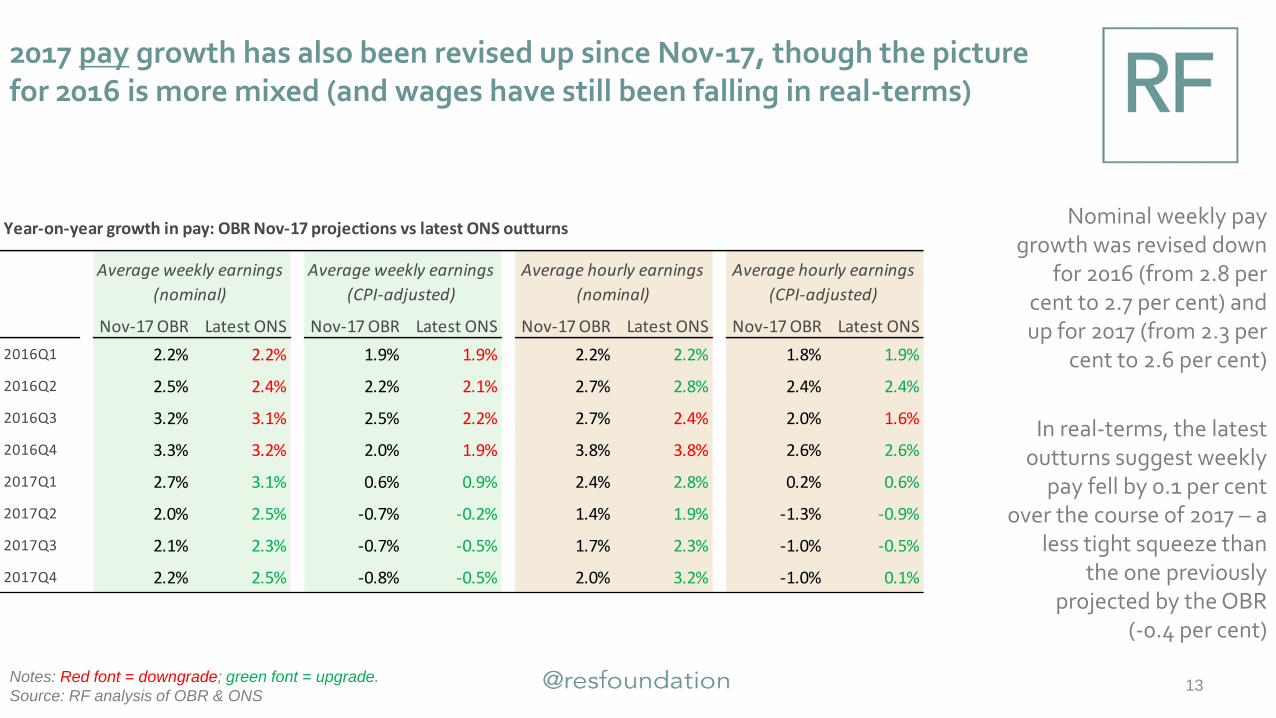
2017 pay growth has also been revised up since Nov-17, though the picture for 2016 is more mixed (and wages have still been falling in real-terms)
13Notes: Red font = downgrade; green font = upgrade.
Source: RF analysis of OBR & ONS
Year-on-year growth in pay: OBR Nov-17 projections vs latest ONS outturns
Nov-17 OBR Latest ONS Nov-17 OBR Latest ONS Nov-17 OBR Latest ONS Nov-17 OBR Latest ONS
2016Q1 2.2% 2.2% 1.9% 1.9% 2.2% 2.2% 1.8% 1.9%
2016Q2 2.5% 2.4% 2.2% 2.1% 2.7% 2.8% 2.4% 2.4%
2016Q3 3.2% 3.1% 2.5% 2.2% 2.7% 2.4% 2.0% 1.6%
2016Q4 3.3% 3.2% 2.0% 1.9% 3.8% 3.8% 2.6% 2.6%
2017Q1 2.7% 3.1% 0.6% 0.9% 2.4% 2.8% 0.2% 0.6%
2017Q2 2.0% 2.5% -0.7% -0.2% 1.4% 1.9% -1.3% -0.9%
2017Q3 2.1% 2.3% -0.7% -0.5% 1.7% 2.3% -1.0% -0.5%
2017Q4 2.2% 2.5% -0.8% -0.5% 2.0% 3.2% -1.0% 0.1%
Average hourly earnings
(CPI-adjusted)
Average weekly earnings
(nominal)
Average weekly earnings
(CPI-adjusted)
Average hourly earnings
(nominal)
Nominal weekly pay growth was revised down
for 2016 (from 2.8 per cent to 2.7 per cent) and up for 2017 (from 2.3 per
cent to 2.6 per cent)
In real-terms, the latest outturns suggest weekly
pay fell by 0.1 per cent over the course of 2017 – a
less tight squeeze than the one previously
projected by the OBR (-0.4 per cent)
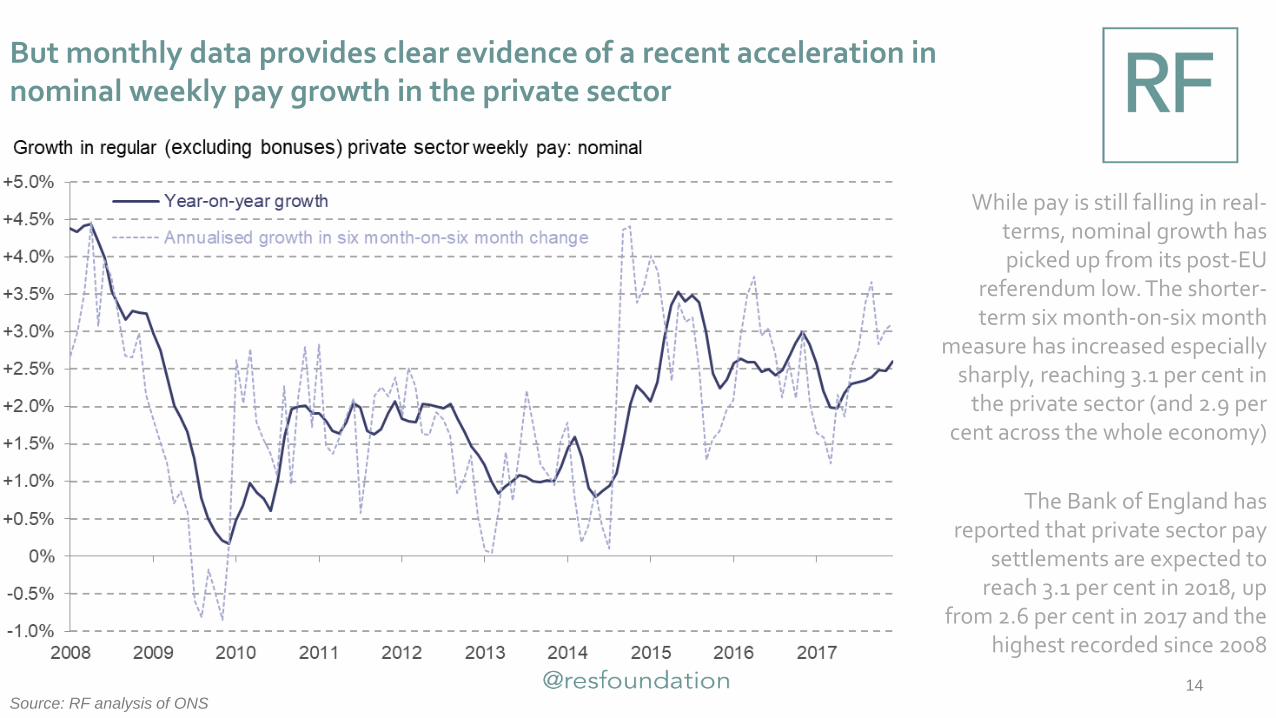
But monthly data provides clear evidence of a recent acceleration in nominal weekly pay growth in the private sector
14Source: RF analysis of ONS
While pay is still falling in real-terms, nominal growth has picked up from its post-EU
referendum low. The shorter-term six month-on-six month
measure has increased especially sharply, reaching 3.1 per cent in
the private sector (and 2.9 per cent across the whole economy)
The Bank of England has reported that private sector pay
settlements are expected to reach 3.1 per cent in 2018, up
from 2.6 per cent in 2017 and the highest recorded since 2008
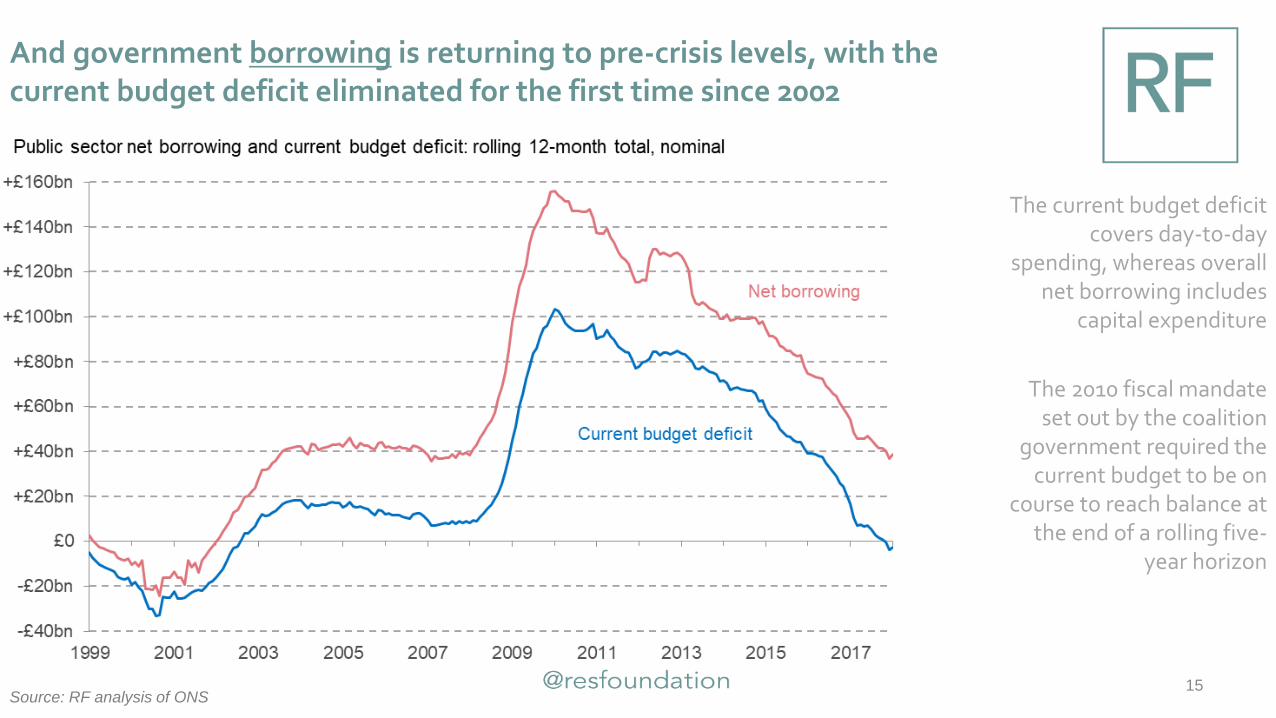
And government borrowing is returning to pre-crisis levels, with the current budget deficit eliminated for the first time since 2002
15Source: RF analysis of ONS
The current budget deficit covers day-to-day
spending, whereas overall net borrowing includes
capital expenditure
The 2010 fiscal mandate set out by the coalition
government required the current budget to be on
course to reach balance at the end of a rolling five-
year horizon
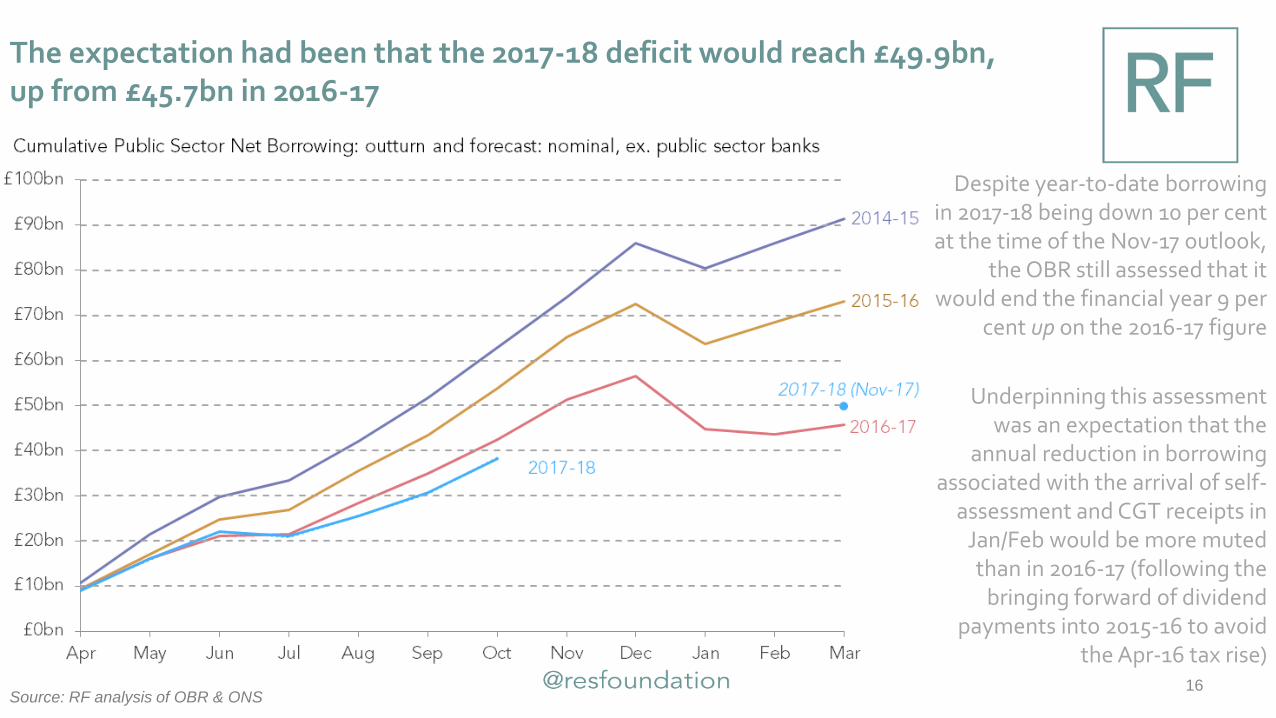
The expectation had been that the 2017-18 deficit would reach £49.9bn, up from £45.7bn in 2016-17
16Source: RF analysis of OBR & ONS
Despite year-to-date borrowing in 2017-18 being down 10 per cent at the time of the Nov-17 outlook,
the OBR still assessed that it would end the financial year 9 per
cent up on the 2016-17 figure
Underpinning this assessment was an expectation that the
annual reduction in borrowing associated with the arrival of self-
assessment and CGT receipts in Jan/Feb would be more muted than in 2016-17 (following the
bringing forward of dividend payments into 2015-16 to avoid
the Apr-16 tax rise)
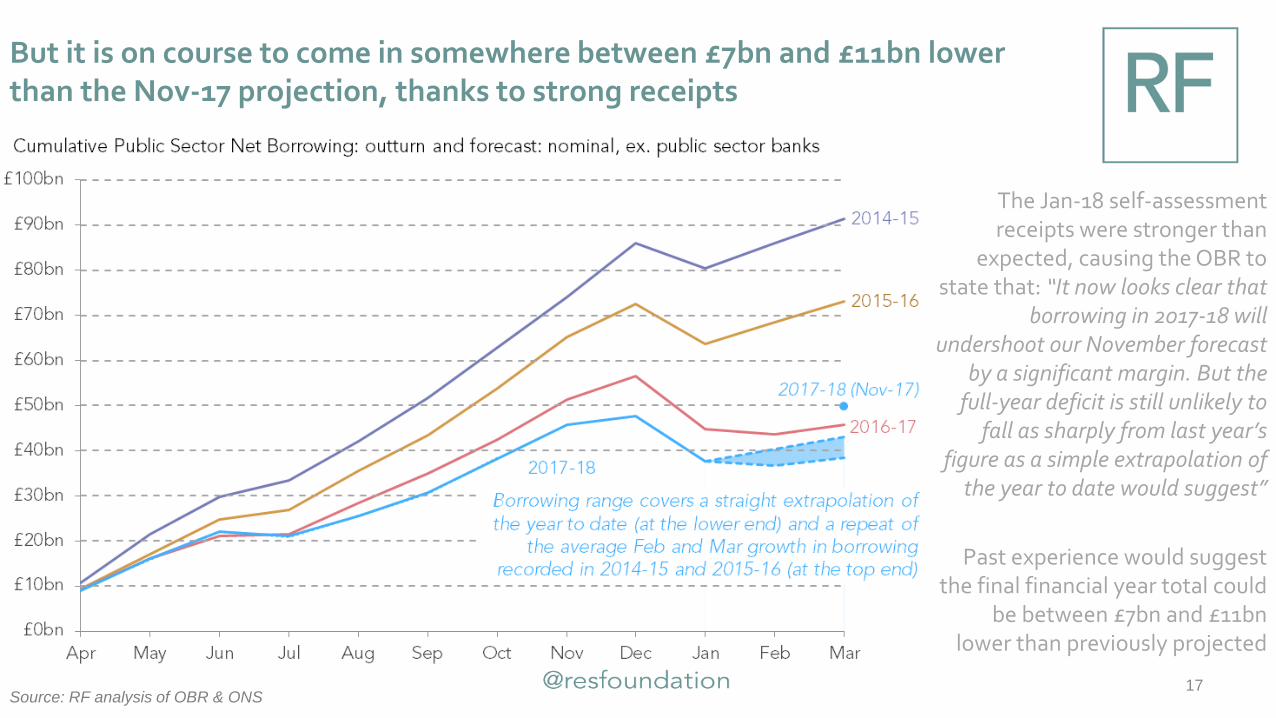
17Source: RF analysis of OBR & ONS
The Jan-18 self-assessment receipts were stronger than
expected, causing the OBR to state that: “It now looks clear that
borrowing in 2017-18 will undershoot our November forecast
by a significant margin. But the full-year deficit is still unlikely to
fall as sharply from last year’s figure as a simple extrapolation of
the year to date would suggest”
Past experience would suggest the final financial year total could
be between £7bn and £11bn lower than previously projected
But it is on course to come in somewhere between £7bn and £11bn lower than the Nov-17 projection, thanks to strong receipts
Despite better news, significant challenges remain in relation to both public finances and living standards
HOPE SPRINGSA False
?
19
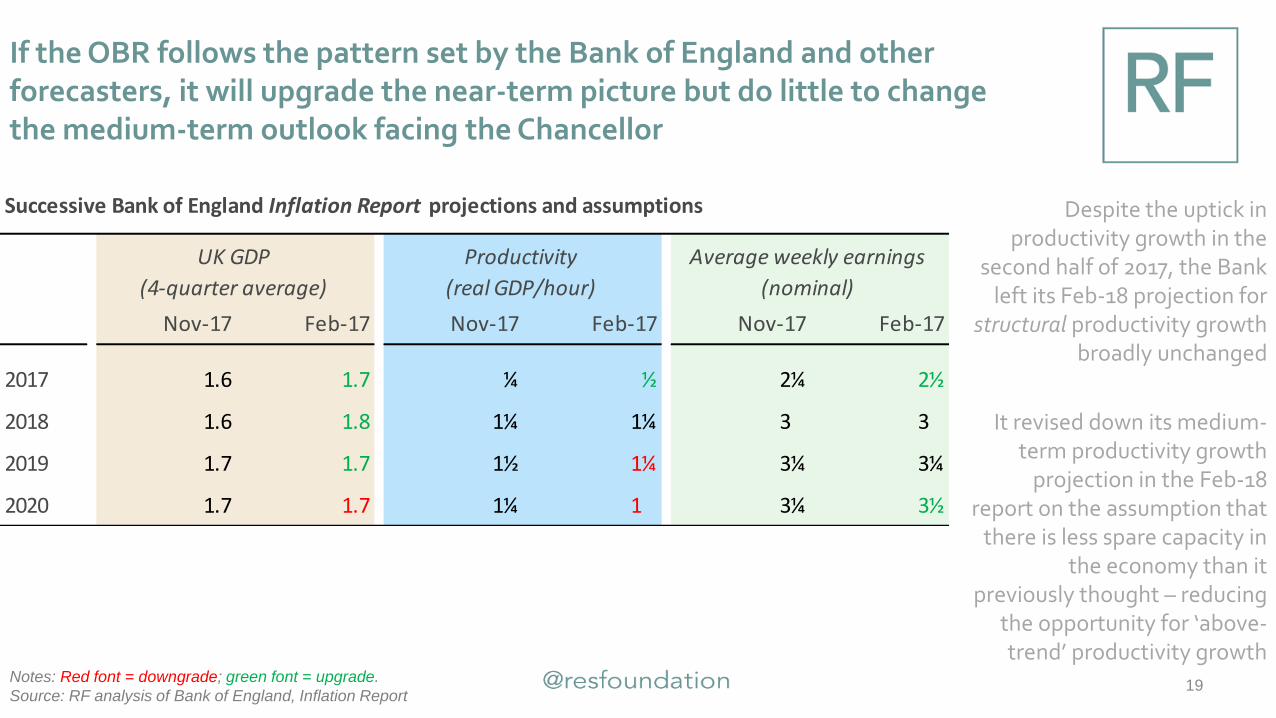
If the OBR follows the pattern set by the Bank of England and other forecasters, it will upgrade the near-term picture but do little to change the medium-term outlook facing the Chancellor
Notes: Red font = downgrade; green font = upgrade.
Source: RF analysis of Bank of England, Inflation Report
Despite the uptick in productivity growth in the
second half of 2017, the Bank left its Feb-18 projection for
structural productivity growth broadly unchanged
It revised down its medium-term productivity growth
projection in the Feb-18 report on the assumption that
there is less spare capacity in the economy than it
previously thought – reducing the opportunity for ‘above-trend’ productivity growth
Successive Bank of England Inflation Report projections and assumptions
Nov-17 Feb-17 Nov-17 Feb-17 Nov-17 Feb-17
2017 1.6 1.7 ¼ ½ 2¼ 2½
2018 1.6 1.8 1¼ 1¼ 3¼ 3¼
2019 1.7 1.7 1½ 1¼ 3¼ 3¼
2020 1.7 1.7 1¼ 1½ 3¼ 3½
UK GDP
(4-quarter average)
Productivity
(real GDP/hour)
Average weekly earnings
(nominal)
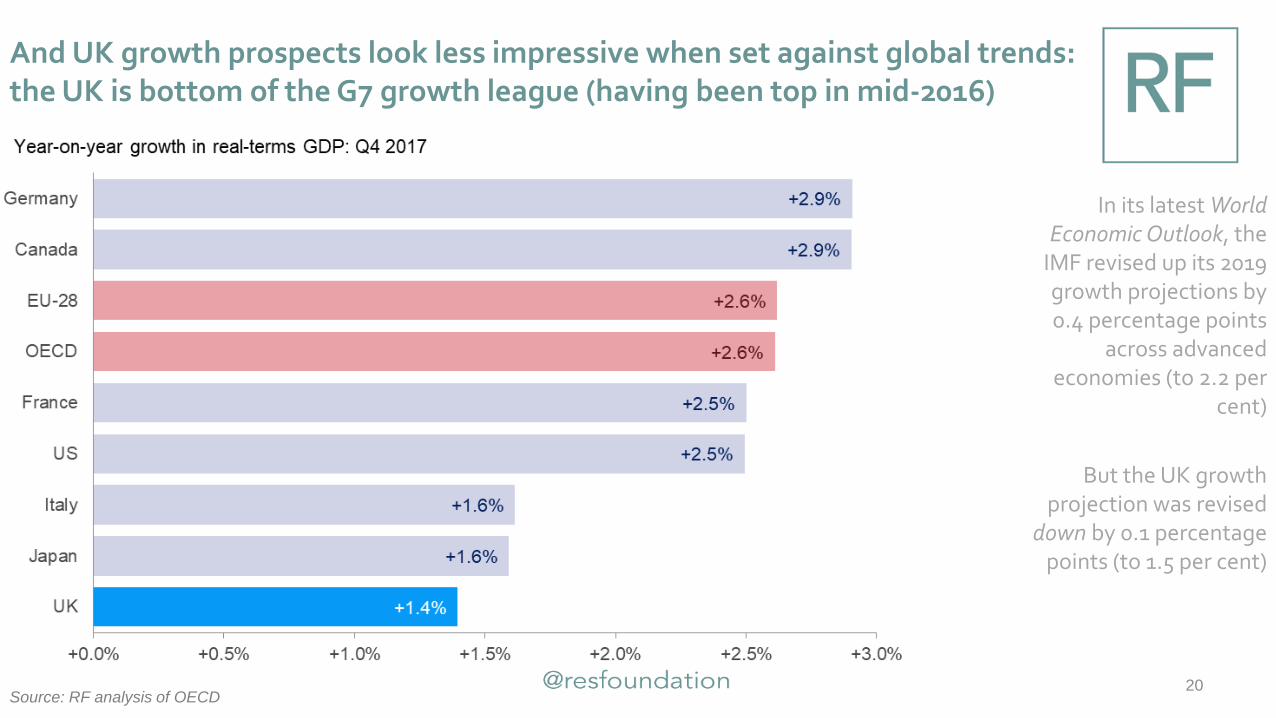
And UK growth prospects look less impressive when set against global trends: the UK is bottom of the G7 growth league (having been top in mid-2016)
20
In its latest World Economic Outlook, the
IMF revised up its 2019 growth projections by 0.4 percentage points
across advanced economies (to 2.2 per
cent)
But the UK growth projection was revised
down by 0.1 percentage points (to 1.5 per cent)
Source: RF analysis of OECD
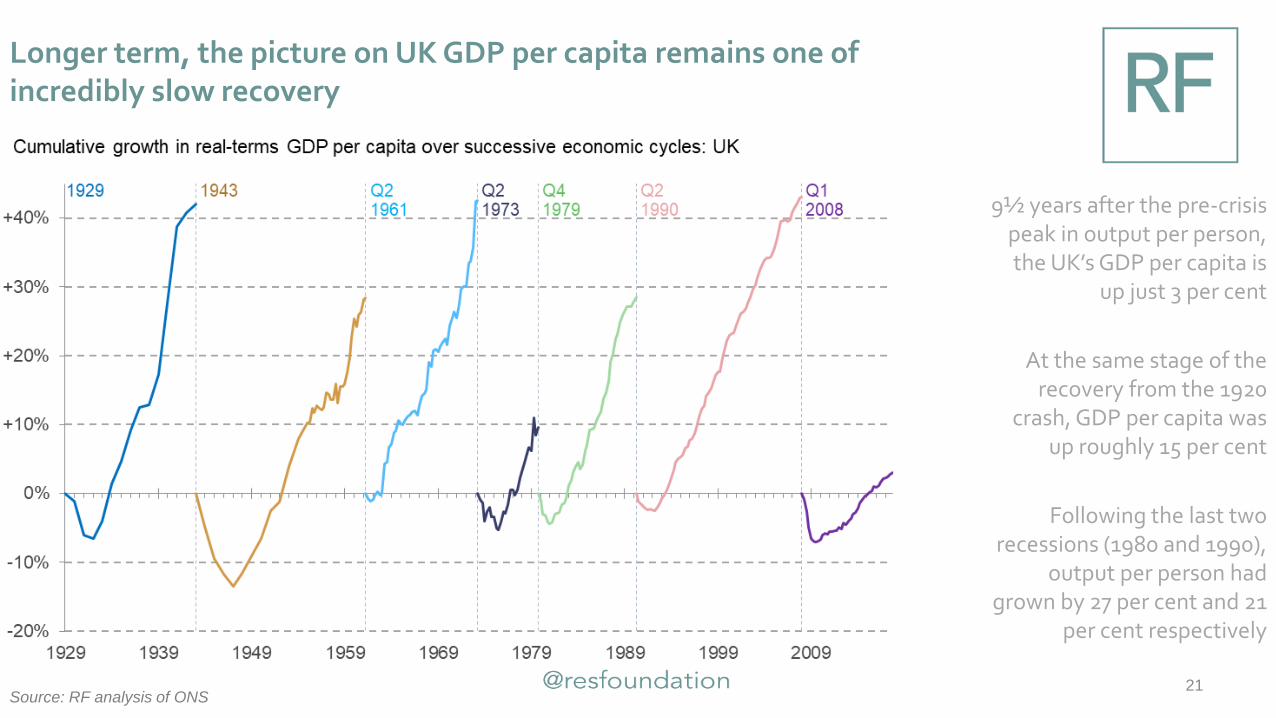
Longer term, the picture on UK GDP per capita remains one of incredibly slow recovery
21
9½ years after the pre-crisis peak in output per person, the UK’s GDP per capita is
up just 3 per cent
At the same stage of the recovery from the 1920
crash, GDP per capita was up roughly 15 per cent
Following the last two recessions (1980 and 1990),
output per person had grown by 27 per cent and 21
per cent respectively
Source: RF analysis of ONS
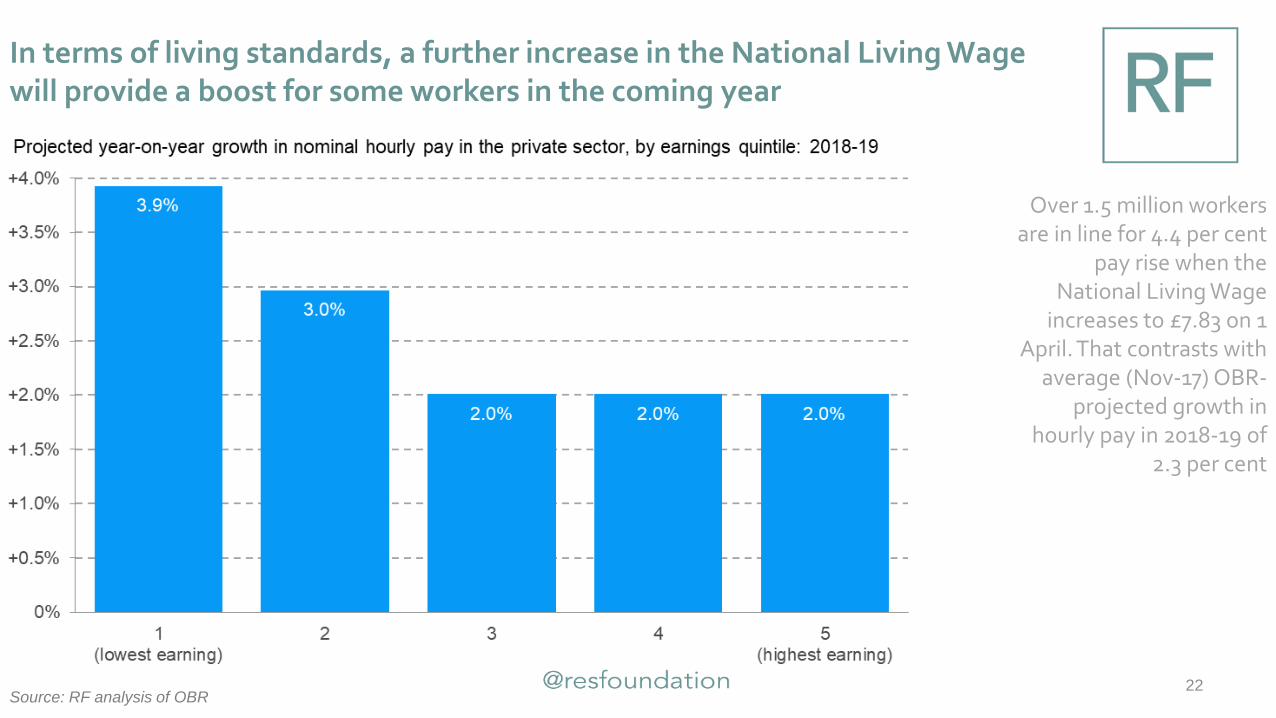
In terms of living standards, a further increase in the National Living Wage will provide a boost for some workers in the coming year
22
Over 1.5 million workers are in line for 4.4 per cent
pay rise when the National Living Wage
increases to £7.83 on 1 April. That contrasts with
average (Nov-17) OBR-projected growth in
hourly pay in 2018-19 of 2.3 per cent
Source: RF analysis of OBR
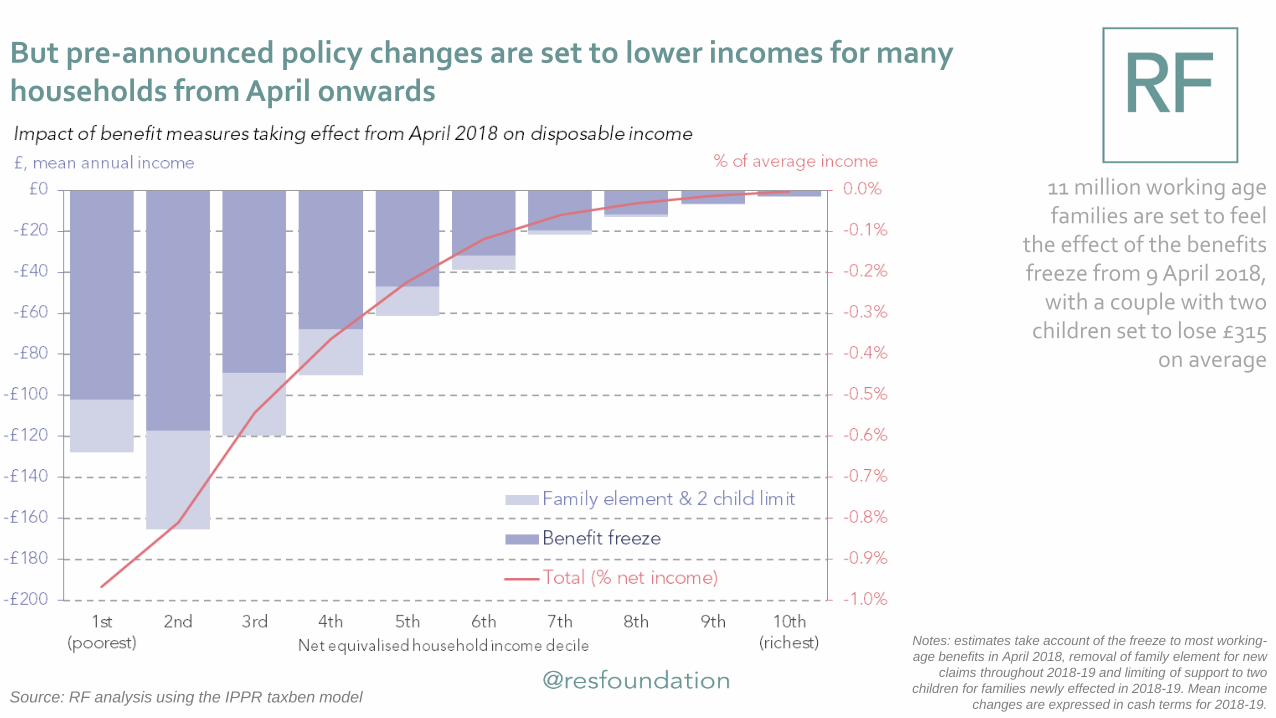
But pre-announced policy changes are set to lower incomes for many households from April onwards
23
11 million working age families are set to feel
the effect of the benefits freeze from 9 April 2018,
with a couple with two children set to lose £315
on average
Source: RF analysis using the IPPR taxben model
Notes: estimates take account of the freeze to most working-
age benefits in April 2018, removal of family element for new
claims throughout 2018-19 and limiting of support to two
children for families newly effected in 2018-19. Mean income
changes are expressed in cash terms for 2018-19.
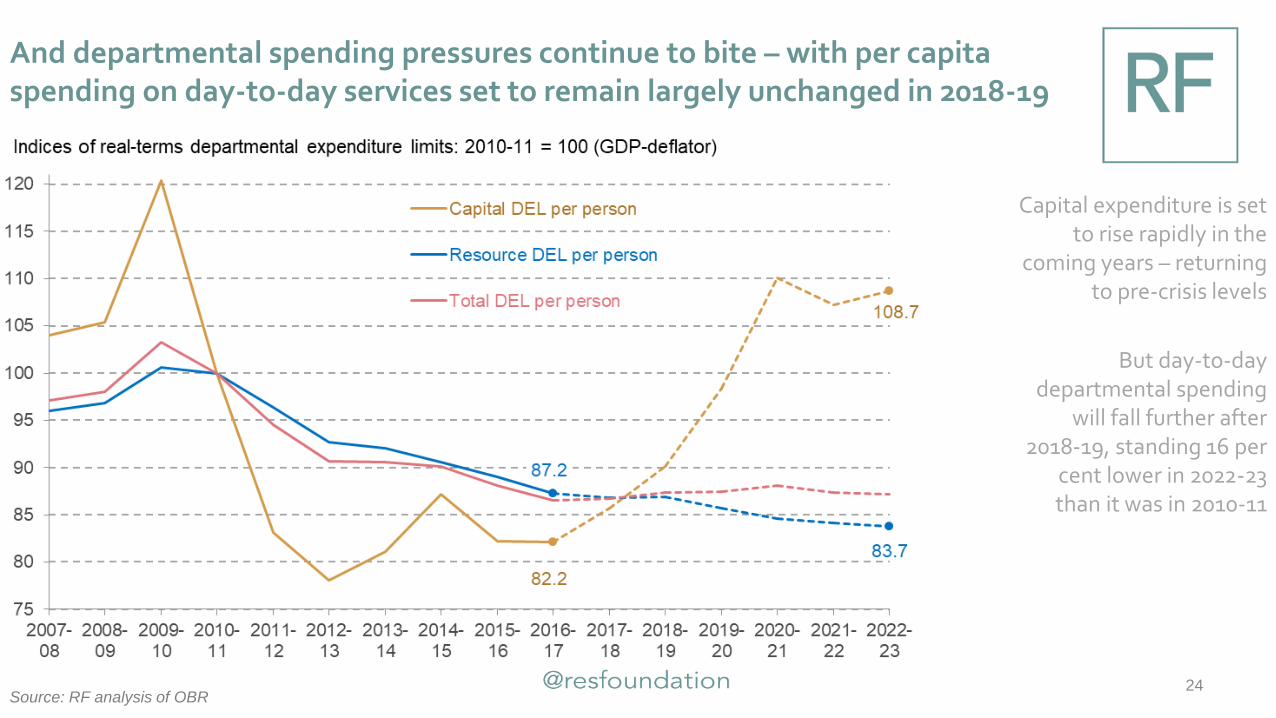
And departmental spending pressures continue to bite – with per capita spending on day-to-day services set to remain largely unchanged in 2018-19
24
Capital expenditure is set to rise rapidly in the
coming years – returning to pre-crisis levels
But day-to-day departmental spending
will fall further after 2018-19, standing 16 per
cent lower in 2022-23 than it was in 2010-11
Source: RF analysis of OBR

Given this backdrop, and the fact that the deficit is back in more ‘normal’ territory, there is a strong case for the Chancellor to spend some money
25
On current spending plans, the UK
appears to be only part way through an
unprecedentedly long pause in the
growth of government
spending per person
Source: RF analysis of OBR
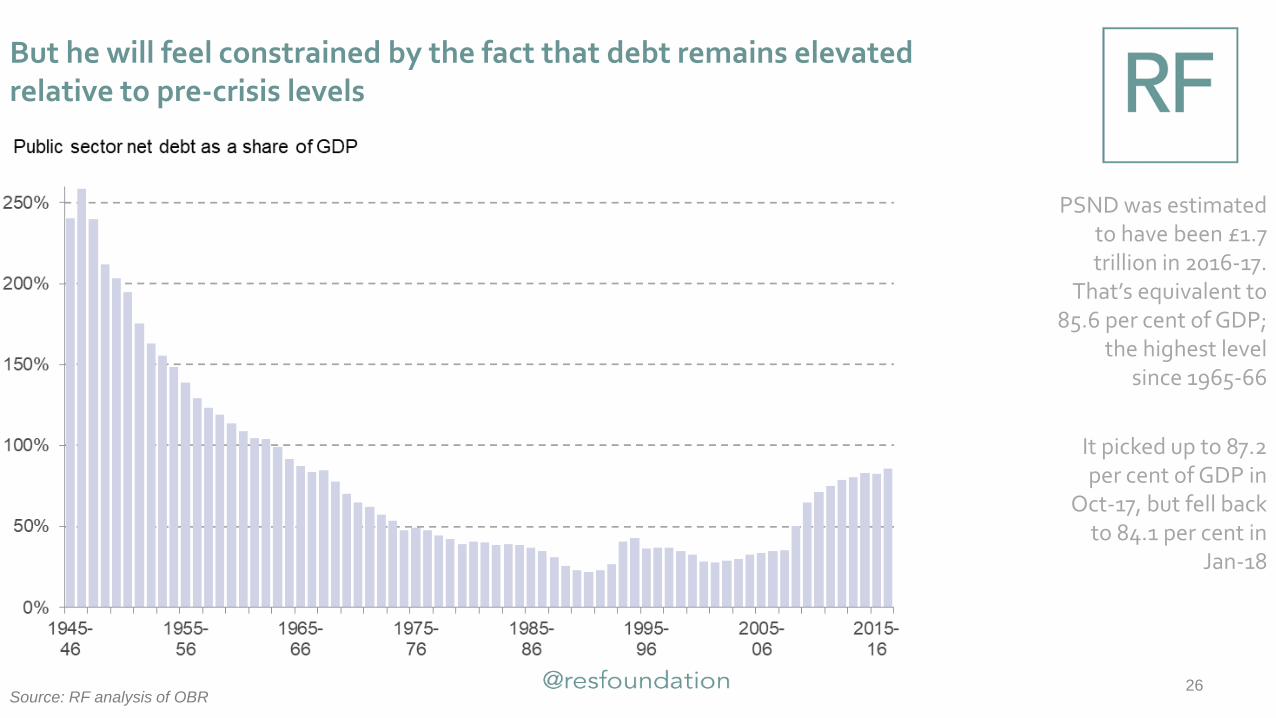
But he will feel constrained by the fact that debt remains elevated relative to pre-crisis levels
26
PSND was estimated to have been £1.7 trillion in 2016-17.
That’s equivalent to 85.6 per cent of GDP;
the highest level since 1965-66
It picked up to 87.2 per cent of GDP in
Oct-17, but fell back to 84.1 per cent in
Jan-18
Source: RF analysis of OBR

And vulnerable to what might happen to public finances when the next crisis hits
27
It is possible to run an overall budget deficit each year (as
per the current fiscal mandate) and still lower the
debt to GDP ratio, but that inevitably slows the pace
relative to the government’s fiscal ‘objective’ of overall
balance
The introduction of illustrative, but plausible,
future ‘shocks’ further slows the pace of debt reduction
Source: RF modelling
In all scenarios, GDP is assumed to grow in line with Nov-17 forecasts through to 2022 and then at a steady 4.1
per cent. “Fiscal ‘mandate’” shows path associated with moving towards a 2% cyclically-adjusted deficit by 2020-
21 and remaining there thereafter; “Fiscal ‘objective’” shows the impact of moving towards an overall balance by
2025-26 and then returning a balance in every subsequent year; “’Mandate’ plus shocks” uses the ‘mandate’ line
as a base, adding in an illustrative shock that increased PSND by 10% of GDP every eight years.
Some conclusions for the Chancellor
A MAN FOR ALL SEASONS?
Conclusions
29
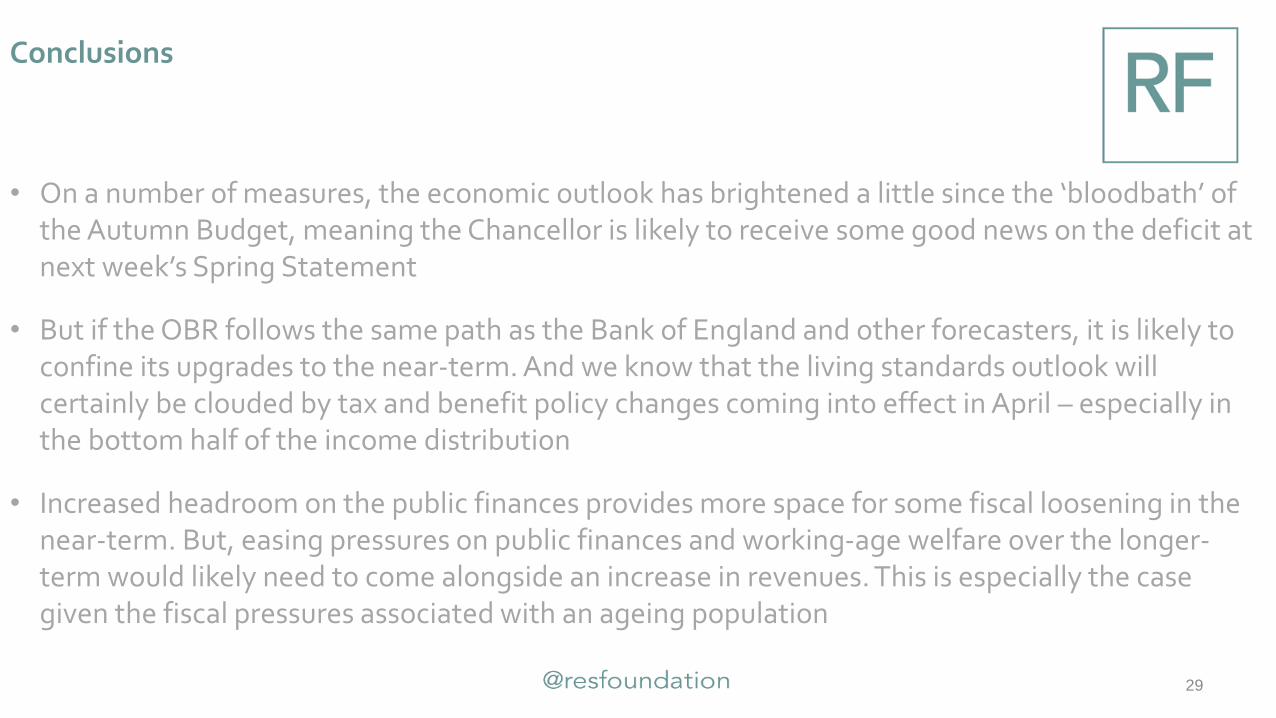
• On a number of measures, the economic outlook has brightened a little since the ‘bloodbath’ of the Autumn Budget, meaning the Chancellor is likely to receive some good news on the deficit at next week’s Spring Statement
• But if the OBR follows the same path as the Bank of England and other forecasters, it is likely to confine its upgrades to the near-term. And we know that the living standards outlook will certainly be clouded by tax and benefit policy changes coming into effect in April – especially in the bottom half of the income distribution
• Increased headroom on the public finances provides more space for some fiscal loosening in the near-term. But, easing pressures on public finances and working-age welfare over the longer-term would likely need to come alongside an increase in revenues. This is especially the case given the fiscal pressures associated with an ageing population

A man for all seasons?
What the Chancellor can expect in the OBR’s Spring outlook
Matt Whittaker
March 2018
@MattWhittakerRF @resfoundation
30