a linear state estimation formulation for
DESCRIPTION
A Linear State Estimation Formulation ForTRANSCRIPT
IEEE TRANSACTIONS ON POWER SYSTEMS, VOL. 28, NO. 2, MAY 2013 1187
A Linear State Estimation Formulation forSmart Distribution Systems
Daniel A. Haughton, Student Member, IEEE, and Gerald Thomas Heydt, Life Fellow, IEEE
Abstract—This paper presents a linearized, three-phase, dis-tribution class state estimation algorithm for applications insmart distribution systems. Unbalanced three-phase cases andsingle-phase cases are accommodated. The estimator follows acomplex variable formulation and is intended to incorporate syn-chronized phasor measurements into distribution state estimation.Potential applications in smart distribution system control andmanagement are discussed.
Index Terms—Distribution management systems, distributionsystem monitoring and control, distribution system state esti-mation, power distribution engineering, synchronized phasormeasurements, three-phase unbalance.
I. STATE ESTIMATION IN DISTRIBUTION SYSTEMS
D ISTRIBUTION system monitoring, automation, controland operation are key challenges facing the Smart Grid.
Increased efficiency, reliability and flexibility may be achievedthrough enhancing these features of power distribution. Directload control, demand response (DR), increased renewable elec-tric generation, and sensory and communication networks areenvisioned as part of the Smart Grid [1]. The cited Smart Gridobjectives motivate the work reported in this paper, namely stateestimation for distribution systems.Characteristics of conventional distribution circuits include:• radial operation;• unbalanced loading inherent in systems with laterals con-sisting of 1 or 2 phase conductors;
• distributed loads separated by short distances;• untransposed phase conductors;• conductors with high ratios;• low penetration of distributed generation (DG), and noconventional generation;
• paucity of feeder measurements (low redundancy).Further discussions are found in [2]–[6]. Three-phase un-balanced radial distribution power flow techniques based onladder iterative, or similar, methods are generally employed fordistribution system analysis [2]. However, as utilities tend to-ward smart distribution systems, the need for enhanced system
Manuscript received January 12, 2012; revised April 30, 2012 and July 05,2012; accepted August 03, 2012. Date of publication September 13, 2012; dateof current version April 18, 2013. This work was supported by the Power Sys-tems Engineering Research Center (PSerc), a Generation III Industry/Univer-sity Cooperative Research Center, under grant NSF EEC-0001880 and EEC-0968993 and the Future Renewable Electric Energy Distribution and Manage-ment Center (FREEDM), an Engineering Research Center under grant NSFEEC-08212121. Paper no. TPWRS-00038-2012.The authors are with the Department of Electrical, Computer, and Energy
Engineering, Arizona State University, Tempe, AZ 85287 USA (e-mail: [email protected]; [email protected]).Color versions of one or more of the figures in this paper are available online
at http://ieeexplore.ieee.org.Digital Object Identifier 10.1109/TPWRS.2012.2212921
monitoring and control based on real-time data becomes sig-nificant. Smart distribution systems are characterized as havinghigher penetration of DG, DR enabled loads, and controllableelements. Perhaps integral to the smart distribution system isthe distribution management system (DMS) where an informa-tion technology (IT) layer allows for enhanced automation andcontrol functions [3]. Distribution automation (DA) and DMSsystems may generally include components of voltage/VArcontrol and outage management. Its transmission engineeringanalog, energy management system (EMS), is used extensivelyfor near real-time analysis and control [4].The need for state estimation at the distribution level is partic-
ularly acute in the smart distribution applications. For example,monitoring and situational awareness may become necessaryfor: circuits with active DG injection where potential bi-direc-tional power flows may occur in each phase; exacerbation ofvoltage unbalance issues due to DG and stochastic loading; andassessment of system conditions after DR enabled loads respondto curtailment commands.Previous approaches to the distribution state estimation for-
mulation are discussed in [5]–[11]. In [5] a state estimation al-gorithm involves constraints on circuit quantities such as powerfactors, and real and reactive parts of substation transformer cur-rents. Authors in [6] formulate an algorithm analogous to trans-mission state estimation for three-phase circuits. Use of branchcurrent state vector was shown in [7], [8]; decoupling of phasesand increasing computational efficiency are shown. A ladder it-erative method employing branch current measurements is pre-sented in [9]. Formulations discussed generally focus on lowavailability of real-time measurements, although [10] identifiesthe potential for improvements based on synchrophasor mea-surements widely deployed throughout the feeders.Other key developments in state estimation include incorpo-
ration of synchronized phasor measurement devices [12]–[14]and smart meter devices [15], [16]. In transmission state esti-mation, the former enables effective wide-area monitoring forassessment of real-time system state. This is due to its abilityto capture measurements in full phasor detail [12]. The latterhas recently been adopted by utilities and is expected to dras-tically enhance monitoring and near real-time data availabilityfor distribution networks. Also automatic meter-reading, remoteconnect/disconnect and DR initiatives, and variable pricing areenhanced [15], [16].
II. STATE ESTIMATION FORMULATION FOR ELECTRICPOWER DISTRIBUTION SYSTEMS
State estimation is a mathematical tool in which a set of mea-surements is combined with an assumed mathematical model ofa system so that the resulting set of equations relating measure-ments to the system are satisfied in the least squares sense. Thatis, the system states are estimated using an overdetermined set
0885-8950/$31.00 © 2012 IEEE
1188 IEEE TRANSACTIONS ON POWER SYSTEMS, VOL. 28, NO. 2, MAY 2013
of equations whose right- and left-hand sides agree with a min-imum squared difference. Mathematically, the measurementsare arranged in a vector and related to the system statesby the vector valued function (of vector valued argument)
(1)
where is a vector of noise (error) terms. Let the measurementvector incorporate noise terms and rewrite as
(2)
If is linearized about an expected operating point, oneobtains
(3)
where the notation indicates the linear relationship betweenprocess matrix and state vector. Note that in (3), , and , arereal valued vectors, and , is a real valuedmatrix. Equation (3) isthe basis of unbiased linear state estimation as applied in powerengineering. The estimation is the result of the minimization ofthe Euclidian 2-norm of the vector
(4)
Namely the objective function is written as
(5)
where is an arbitrary measurement and is the number ofmeasurements. The minimum of is found when
(6)
Note that the scalar, , is the sum of squares of residuals foreach measurement. The estimate is found when
(7)
where is referred to as the pseudoinverse of the matrix .This is the unbiased, least squares estimator. Weighted esti-mation is utilized to bias results towards dependable measure-ments. When the weight is selected as the inverse of the vari-ance, the maximum likelihood estimate is obtained [17]; there-fore, accurate data with low variance receive high weight. As-suming independent, uncorrelated transducer errors, a diagonalweight matrix, , is incorporated to produce a weighted solu-tion for (7)
Note that when the measurement function is linear, or is effec-tively linearized, this calculation may be direct. The details ofthis mathematical tool and its applications have been widely re-ported in the literature of which [17]–[20] are a small sampling.The condition number of is often cited as a measure of thesensitivity of estimates to noise. The process matrix conditionnumber is calculated using
(8)
where is the 2-norm and and denote max/minsingular values, respectively [21].Again, the main application of power system state estimation
has been in transmission engineering and large scale system op-eration where calculation provides a best estimate of unmea-sured parameters, noisy measured quantities, and other unmea-sured nodes. In this case, the state estimator makes availableto operators all salient system bus voltages, currents, and realand reactive power injections and flows. Perhaps the most evi-dent application has been in the estimation of voltage and cur-rent phase angles which, prior to the advent of synchrophasormeasurement technologies, have not been conveniently and syn-chronously measured.
III. LINEAR THREE-PHASE STATE ESTIMATOR
Attention turns to the development of a three-phase distribu-tion state estimator. The basic design of the estimator is non-it-erative, purely real, linearized and in full phase detail. In thedistribution system application, it is assumed that coincident de-mands (e.g., smart meter [22]) and selected synchronous mea-surements will be used. In the formulation below, data shall berepresented in complex, rectangular, phasor form. Three-phaseunbalanced voltages and current measurements are envisionedalong with some branch active and reactive power flow mea-surements. Measurement vector , the state vector
, and the process matrix are com-plex quantities where the subscripts and refer to real andimaginary components. Note that differentiation with respectto a complex variable is generally nonanalytic. Therefore (4)is rewritten
(9)
Note that residual vector may be separated into real and imagi-nary parts
(10)
Then, the minimization of the 2-norm may directly follow (6),where the state variables in this case are real-valued and parti-tioned into real and imaginary subvectors. Direct calculation forthe 2-norm of a complex vector is
(11)
The notation refers to the Hermitian operation which istransposition followed by complex conjugation. Minimizationof entails the simultaneous solution of
Note that and are independent variables. Given an as-sumed voltage state vector for a distribution network, it maybe practical to assume that bus voltage phase angle deviationsfor small changes in total feeder load are small. Linearizationapproximations in this estimator formulation exploit the smallangle assumption.
HAUGHTON AND HEYDT: A LINEAR STATE ESTIMATION FORMULATION FOR SMART DISTRIBUTION SYSTEMS 1189
The residual vector may be separated into real and imaginarycomponents accordingly, thus producing a real-valued vector.In matrix form
The estimator then solves for the state estimate
(12)
The noise term is included in the measurement vector (2), andincludes measurement device error, data transmission and othermeasurement errors. The linear estimator equations are devel-oped here as
where
identity matrix;
line measurement coefficient matrix;
system admittance model;
measurement vectors, in rectangular form;
measured and assumed injections/loads.
Full complex forms of the measurements in rectangular coordi-nates are used.The is formed using three-phase block impedance rep-
resentation of system components. Three-phase, four-wire linesegments may be simplified by Kron reduction [2]. As a non-it-erative solution procedure, there is little concern for instabilitiescaused by Newton-type iterative and fast decoupled methodswhen high conductors are present [9], [17].The advantages of a linear and non-iterative state estimation
include: low computational burden, accommodation of meshednetworks and avoidance of convergence issues (which mayoccur in dealing with systems with high ratios).
IV. DISTRIBUTION SYSTEM MEASUREMENTS INTHE SMART GRID ENVIRONMENT
A. Historical Data and Measurement Paucity
The measurement paucity, characteristic of conventional dis-tribution systems, motivated some researchers to use historicaldata to supplant measurements to obtain an observable processmatrix [5]–[9], [23]. However, reliance on historical data withinsufficient measurement redundancy may produce inconsistentresults when loading patterns deviate from history, or when un-expected outages and topology changes occur. In this case, theestimator may provide spurious results. Exploiting the availablereal-time data may fulfill the objective of enhanced decisionmaking and control as envisioned for Smart Grid DMS and DAfunctions.
B. Smart Measurement Instruments
The state estimation formulation explored here exploits theadvantages of the new technologies identified in Section I as
they relate to distribution system engineering. That is, the datagathered from smart meters provide the requisite near real-timeload measurement and potentially statistical data within shorttime intervals. Smart meters may record and transmit activeand reactive power, energy consumption over time intervals,e.g., 5, 15, 60 min, and voltage magnitude data [16], [22]. Also,synchrophasors are envisioned to provide direct voltage phaseangle measurement [12] for distribution buses. The practicalityof this implementation is application dependant. Line powerflows and current magnitudes may be ascertained via directphasor quantity measurement. Note that standards [24] requiremeasurement synchronization to within 1 , which corre-sponds to 0.0216 phase error in a 60-Hz system. Additionally,a maximum phase error of 0.57 produces total vector error(TVE), as defined in [24], of 1.0% which is the maximumallowable TVE.
C. Incorporation of Measurements
In the distribution state estimation formulation, it is assumedthat both substation bus voltages and power flows (or currentmagnitudes) are always available. Other assumptions includesufficient availability of near real-time data (e.g., active and re-active power measurements, some voltage magnitudes and loadpower factors) to complement the estimator. The measurementsmay come from smart meters at loads and from distribution classsynchrophasors at other buses. Assumed and measured load andDG injection currents are calculated. For example, a constantpower load (other models may be used) current injection maybe found using
(13)
where denotes the phase and the voltage angle, , isassumed near nominal for that phase , respec-tively, when not measured. If measured via synchrophasor, themeasured , or that of a nearby bus, may be used. Currents cal-culated in (13) are written in linear expressions in terms of thestates, namely the bus voltages in rectangular notation. Substa-tion active and reactive power flows may be expressed in termsof real and imaginary part of currents which are also linearly re-lated to the states, particularly since substation bus voltage mag-nitude is known (as is impedance to the first load node). Otherload models may be employed [2], [5], [23], [25]. Field tuningof load models may be required for verification, especially forpower flow study accuracy. At the operating point, the solutionto the system is linear, irrespective of loadmodel used accordingto .
D. Selection of Weights for Calculated Measurements
The selection of weights for calculated, linearized currentsmay be approximated mathematically or determined heuristi-cally. Measured , , and are random variables eachwith an expected value and variance [26]. Approximate expres-sions for mean and variance of calculated currents, (13), maybe obtained when measurements are treated as independentrandom variables. The expected values of measured variablesare , and their variance is chosen based ontransducer accuracy. Attention now turns to the approximationof variance of the calculated current.The expectation of real and imaginary parts of ( ,
respectively) may be approximated from the nonlinear function
1190 IEEE TRANSACTIONS ON POWER SYSTEMS, VOL. 28, NO. 2, MAY 2013
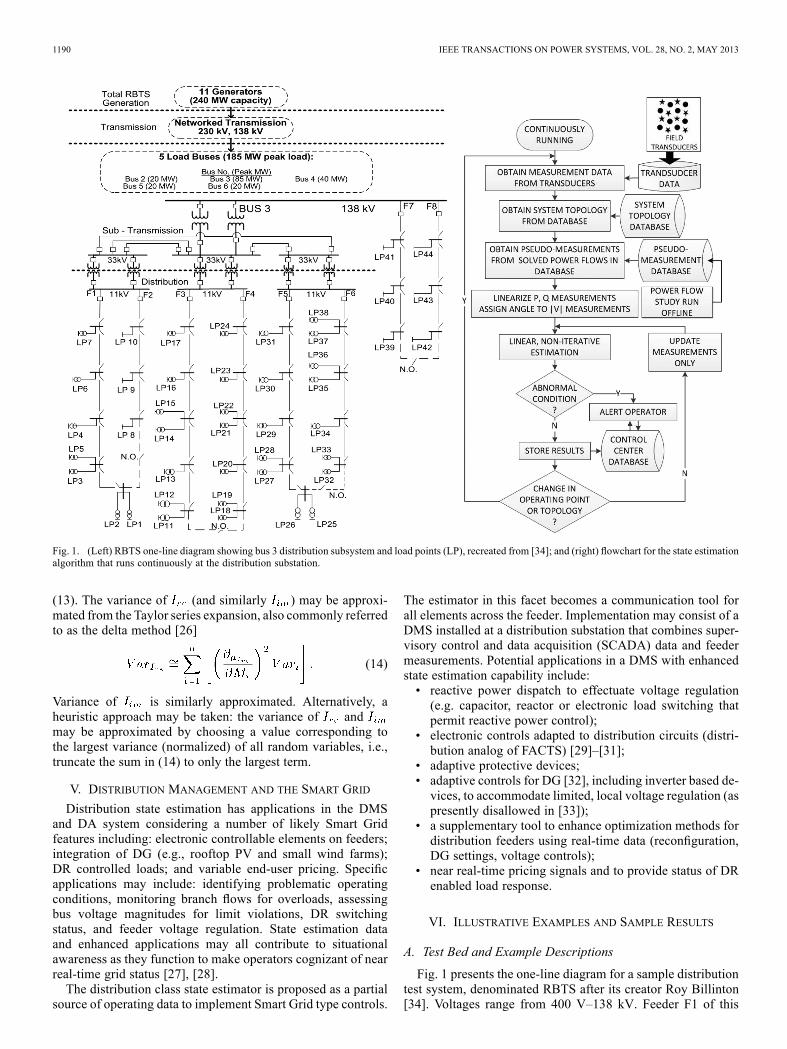
Fig. 1. (Left) RBTS one-line diagram showing bus 3 distribution subsystem and load points (LP), recreated from [34]; and (right) flowchart for the state estimationalgorithm that runs continuously at the distribution substation.
(13). The variance of (and similarly ) may be approxi-mated from the Taylor series expansion, also commonly referredto as the delta method [26]
(14)
Variance of is similarly approximated. Alternatively, aheuristic approach may be taken: the variance of andmay be approximated by choosing a value corresponding tothe largest variance (normalized) of all random variables, i.e.,truncate the sum in (14) to only the largest term.
V. DISTRIBUTION MANAGEMENT AND THE SMART GRID
Distribution state estimation has applications in the DMSand DA system considering a number of likely Smart Gridfeatures including: electronic controllable elements on feeders;integration of DG (e.g., rooftop PV and small wind farms);DR controlled loads; and variable end-user pricing. Specificapplications may include: identifying problematic operatingconditions, monitoring branch flows for overloads, assessingbus voltage magnitudes for limit violations, DR switchingstatus, and feeder voltage regulation. State estimation dataand enhanced applications may all contribute to situationalawareness as they function to make operators cognizant of nearreal-time grid status [27], [28].The distribution class state estimator is proposed as a partial
source of operating data to implement Smart Grid type controls.
The estimator in this facet becomes a communication tool forall elements across the feeder. Implementation may consist of aDMS installed at a distribution substation that combines super-visory control and data acquisition (SCADA) data and feedermeasurements. Potential applications in a DMS with enhancedstate estimation capability include:• reactive power dispatch to effectuate voltage regulation(e.g. capacitor, reactor or electronic load switching thatpermit reactive power control);
• electronic controls adapted to distribution circuits (distri-bution analog of FACTS) [29]–[31];
• adaptive protective devices;• adaptive controls for DG [32], including inverter based de-vices, to accommodate limited, local voltage regulation (aspresently disallowed in [33]);
• a supplementary tool to enhance optimization methods fordistribution feeders using real-time data (reconfiguration,DG settings, voltage controls);
• near real-time pricing signals and to provide status of DRenabled load response.
VI. ILLUSTRATIVE EXAMPLES AND SAMPLE RESULTS
A. Test Bed and Example Descriptions
Fig. 1 presents the one-line diagram for a sample distributiontest system, denominated RBTS after its creator Roy Billinton[34]. Voltages range from 400 V–138 kV. Feeder F1 of this
HAUGHTON AND HEYDT: A LINEAR STATE ESTIMATION FORMULATION FOR SMART DISTRIBUTION SYSTEMS 1191
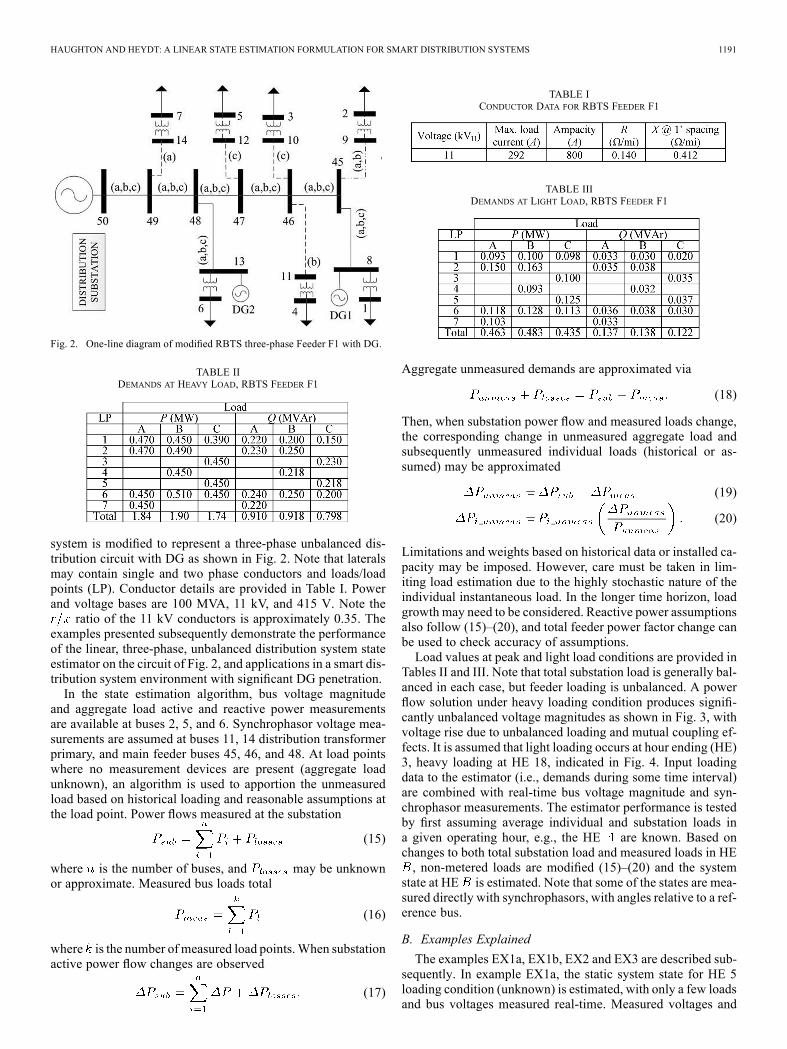
Fig. 2. One-line diagram of modified RBTS three-phase Feeder F1 with DG.
TABLE IIDEMANDS AT HEAVY LOAD, RBTS FEEDER F1
system is modified to represent a three-phase unbalanced dis-tribution circuit with DG as shown in Fig. 2. Note that lateralsmay contain single and two phase conductors and loads/loadpoints (LP). Conductor details are provided in Table I. Powerand voltage bases are 100 MVA, 11 kV, and 415 V. Note the
ratio of the 11 kV conductors is approximately 0.35. Theexamples presented subsequently demonstrate the performanceof the linear, three-phase, unbalanced distribution system stateestimator on the circuit of Fig. 2, and applications in a smart dis-tribution system environment with significant DG penetration.In the state estimation algorithm, bus voltage magnitude
and aggregate load active and reactive power measurementsare available at buses 2, 5, and 6. Synchrophasor voltage mea-surements are assumed at buses 11, 14 distribution transformerprimary, and main feeder buses 45, 46, and 48. At load pointswhere no measurement devices are present (aggregate loadunknown), an algorithm is used to apportion the unmeasuredload based on historical loading and reasonable assumptions atthe load point. Power flows measured at the substation
(15)
where is the number of buses, and may be unknownor approximate. Measured bus loads total
(16)
where is the number ofmeasured load points.When substationactive power flow changes are observed
(17)
TABLE ICONDUCTOR DATA FOR RBTS FEEDER F1
TABLE IIIDEMANDS AT LIGHT LOAD, RBTS FEEDER F1
Aggregate unmeasured demands are approximated via
(18)
Then, when substation power flow and measured loads change,the corresponding change in unmeasured aggregate load andsubsequently unmeasured individual loads (historical or as-sumed) may be approximated
(19)
(20)
Limitations and weights based on historical data or installed ca-pacity may be imposed. However, care must be taken in lim-iting load estimation due to the highly stochastic nature of theindividual instantaneous load. In the longer time horizon, loadgrowth may need to be considered. Reactive power assumptionsalso follow (15)–(20), and total feeder power factor change canbe used to check accuracy of assumptions.Load values at peak and light load conditions are provided in
Tables II and III. Note that total substation load is generally bal-anced in each case, but feeder loading is unbalanced. A powerflow solution under heavy loading condition produces signifi-cantly unbalanced voltage magnitudes as shown in Fig. 3, withvoltage rise due to unbalanced loading and mutual coupling ef-fects. It is assumed that light loading occurs at hour ending (HE)3, heavy loading at HE 18, indicated in Fig. 4. Input loadingdata to the estimator (i.e., demands during some time interval)are combined with real-time bus voltage magnitude and syn-chrophasor measurements. The estimator performance is testedby first assuming average individual and substation loads ina given operating hour, e.g., the HE are known. Based onchanges to both total substation load and measured loads in HE, non-metered loads are modified (15)–(20) and the system
state at HE is estimated. Note that some of the states are mea-sured directly with synchrophasors, with angles relative to a ref-erence bus.
B. Examples Explained
The examples EX1a, EX1b, EX2 and EX3 are described sub-sequently. In example EX1a, the static system state for HE 5loading condition (unknown) is estimated, with only a few loadsand bus voltages measured real-time. Measured voltages and
1192 IEEE TRANSACTIONS ON POWER SYSTEMS, VOL. 28, NO. 2, MAY 2013
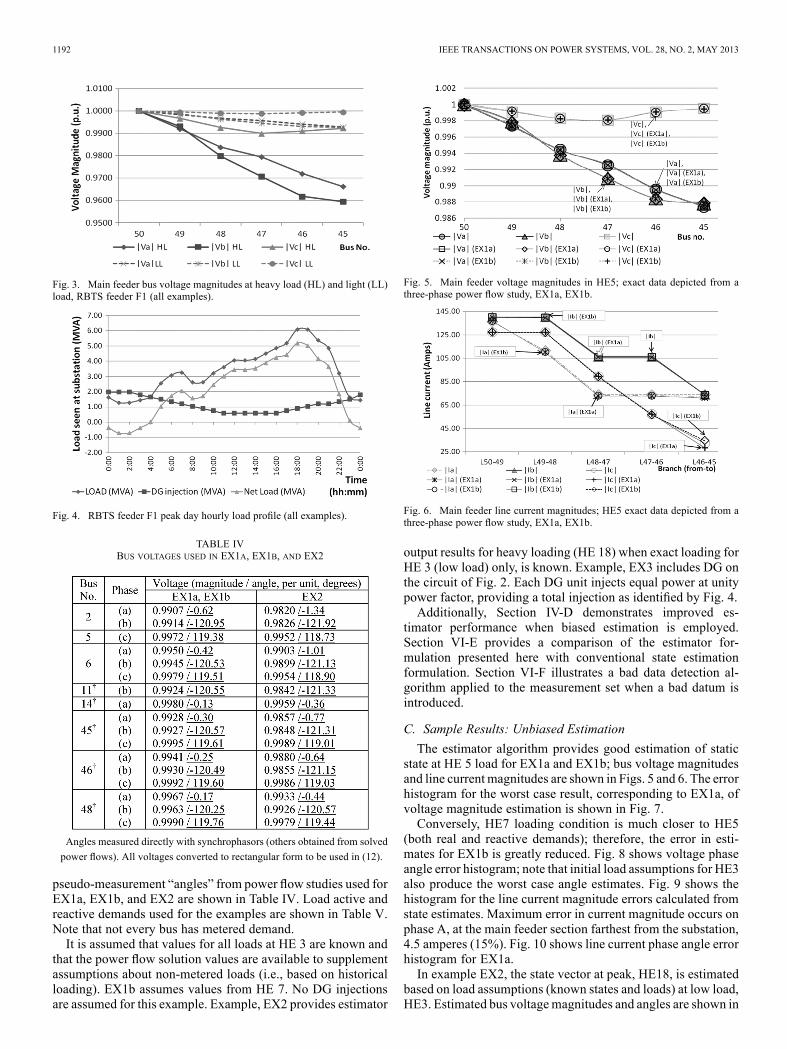
Fig. 3. Main feeder bus voltage magnitudes at heavy load (HL) and light (LL)load, RBTS feeder F1 (all examples).
Fig. 4. RBTS feeder F1 peak day hourly load profile (all examples).
TABLE IVBUS VOLTAGES USED IN EX1A, EX1B, AND EX2
Angles measured directly with synchrophasors (others obtained from solved
power flows). All voltages converted to rectangular form to be used in (12).
pseudo-measurement “angles” from power flow studies used forEX1a, EX1b, and EX2 are shown in Table IV. Load active andreactive demands used for the examples are shown in Table V.Note that not every bus has metered demand.It is assumed that values for all loads at HE 3 are known and
that the power flow solution values are available to supplementassumptions about non-metered loads (i.e., based on historicalloading). EX1b assumes values from HE 7. No DG injectionsare assumed for this example. Example, EX2 provides estimator
Fig. 5. Main feeder voltage magnitudes in HE5; exact data depicted from athree-phase power flow study, EX1a, EX1b.
Fig. 6. Main feeder line current magnitudes; HE5 exact data depicted from athree-phase power flow study, EX1a, EX1b.
output results for heavy loading (HE 18) when exact loading forHE 3 (low load) only, is known. Example, EX3 includes DG onthe circuit of Fig. 2. Each DG unit injects equal power at unitypower factor, providing a total injection as identified by Fig. 4.Additionally, Section IV-D demonstrates improved es-
timator performance when biased estimation is employed.Section VI-E provides a comparison of the estimator for-mulation presented here with conventional state estimationformulation. Section VI-F illustrates a bad data detection al-gorithm applied to the measurement set when a bad datum isintroduced.
C. Sample Results: Unbiased Estimation
The estimator algorithm provides good estimation of staticstate at HE 5 load for EX1a and EX1b; bus voltage magnitudesand line current magnitudes are shown in Figs. 5 and 6. The errorhistogram for the worst case result, corresponding to EX1a, ofvoltage magnitude estimation is shown in Fig. 7.Conversely, HE7 loading condition is much closer to HE5
(both real and reactive demands); therefore, the error in esti-mates for EX1b is greatly reduced. Fig. 8 shows voltage phaseangle error histogram; note that initial load assumptions for HE3also produce the worst case angle estimates. Fig. 9 shows thehistogram for the line current magnitude errors calculated fromstate estimates. Maximum error in current magnitude occurs onphase A, at the main feeder section farthest from the substation,4.5 amperes (15%). Fig. 10 shows line current phase angle errorhistogram for EX1a.In example EX2, the state vector at peak, HE18, is estimated
based on load assumptions (known states and loads) at low load,HE3. Estimated bus voltagemagnitudes and angles are shown in
HAUGHTON AND HEYDT: A LINEAR STATE ESTIMATION FORMULATION FOR SMART DISTRIBUTION SYSTEMS 1193
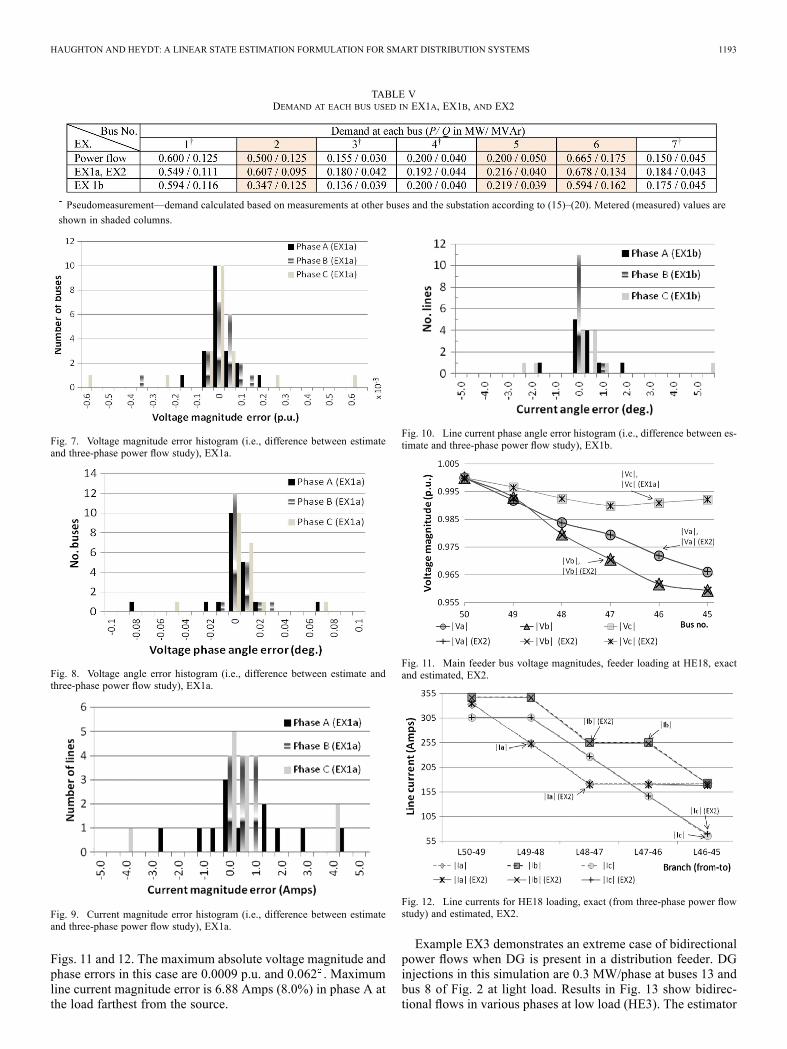
TABLE VDEMAND AT EACH BUS USED IN EX1A, EX1B, AND EX2
Pseudomeasurement—demand calculated based on measurements at other buses and the substation according to (15)–(20). Metered (measured) values are
shown in shaded columns.
Fig. 7. Voltage magnitude error histogram (i.e., difference between estimateand three-phase power flow study), EX1a.
Fig. 8. Voltage angle error histogram (i.e., difference between estimate andthree-phase power flow study), EX1a.
Fig. 9. Current magnitude error histogram (i.e., difference between estimateand three-phase power flow study), EX1a.
Figs. 11 and 12. The maximum absolute voltage magnitude andphase errors in this case are 0.0009 p.u. and 0.062 . Maximumline current magnitude error is 6.88 Amps (8.0%) in phase A atthe load farthest from the source.
Fig. 10. Line current phase angle error histogram (i.e., difference between es-timate and three-phase power flow study), EX1b.
Fig. 11. Main feeder bus voltage magnitudes, feeder loading at HE18, exactand estimated, EX2.
Fig. 12. Line currents for HE18 loading, exact (from three-phase power flowstudy) and estimated, EX2.
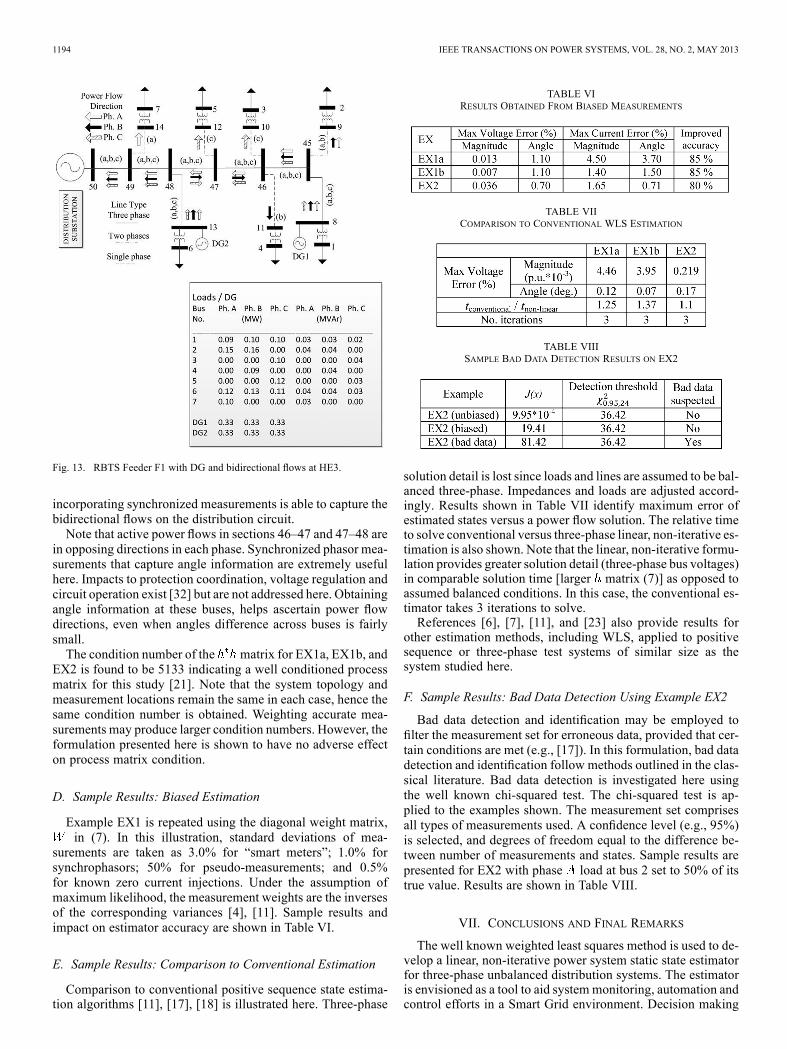
Example EX3 demonstrates an extreme case of bidirectionalpower flows when DG is present in a distribution feeder. DGinjections in this simulation are 0.3 MW/phase at buses 13 andbus 8 of Fig. 2 at light load. Results in Fig. 13 show bidirec-tional flows in various phases at low load (HE3). The estimator
1194 IEEE TRANSACTIONS ON POWER SYSTEMS, VOL. 28, NO. 2, MAY 2013
Fig. 13. RBTS Feeder F1 with DG and bidirectional flows at HE3.
incorporating synchronized measurements is able to capture thebidirectional flows on the distribution circuit.Note that active power flows in sections 46–47 and 47–48 are
in opposing directions in each phase. Synchronized phasor mea-surements that capture angle information are extremely usefulhere. Impacts to protection coordination, voltage regulation andcircuit operation exist [32] but are not addressed here. Obtainingangle information at these buses, helps ascertain power flowdirections, even when angles difference across buses is fairlysmall.The condition number of the matrix for EX1a, EX1b, and
EX2 is found to be 5133 indicating a well conditioned processmatrix for this study [21]. Note that the system topology andmeasurement locations remain the same in each case, hence thesame condition number is obtained. Weighting accurate mea-surements may produce larger condition numbers. However, theformulation presented here is shown to have no adverse effecton process matrix condition.
D. Sample Results: Biased Estimation
Example EX1 is repeated using the diagonal weight matrix,in (7). In this illustration, standard deviations of mea-
surements are taken as 3.0% for “smart meters”; 1.0% forsynchrophasors; 50% for pseudo-measurements; and 0.5%for known zero current injections. Under the assumption ofmaximum likelihood, the measurement weights are the inversesof the corresponding variances [4], [11]. Sample results andimpact on estimator accuracy are shown in Table VI.
E. Sample Results: Comparison to Conventional Estimation
Comparison to conventional positive sequence state estima-tion algorithms [11], [17], [18] is illustrated here. Three-phase
TABLE VIRESULTS OBTAINED FROM BIASED MEASUREMENTS
TABLE VIICOMPARISON TO CONVENTIONAL WLS ESTIMATION
TABLE VIIISAMPLE BAD DATA DETECTION RESULTS ON EX2
solution detail is lost since loads and lines are assumed to be bal-anced three-phase. Impedances and loads are adjusted accord-ingly. Results shown in Table VII identify maximum error ofestimated states versus a power flow solution. The relative timeto solve conventional versus three-phase linear, non-iterative es-timation is also shown. Note that the linear, non-iterative formu-lation provides greater solution detail (three-phase bus voltages)in comparable solution time [larger matrix (7)] as opposed toassumed balanced conditions. In this case, the conventional es-timator takes 3 iterations to solve.References [6], [7], [11], and [23] also provide results for
other estimation methods, including WLS, applied to positivesequence or three-phase test systems of similar size as thesystem studied here.
F. Sample Results: Bad Data Detection Using Example EX2
Bad data detection and identification may be employed tofilter the measurement set for erroneous data, provided that cer-tain conditions are met (e.g., [17]). In this formulation, bad datadetection and identification follow methods outlined in the clas-sical literature. Bad data detection is investigated here usingthe well known chi-squared test. The chi-squared test is ap-plied to the examples shown. The measurement set comprisesall types of measurements used. A confidence level (e.g., 95%)is selected, and degrees of freedom equal to the difference be-tween number of measurements and states. Sample results arepresented for EX2 with phase load at bus 2 set to 50% of itstrue value. Results are shown in Table VIII.
VII. CONCLUSIONS AND FINAL REMARKS
The well known weighted least squares method is used to de-velop a linear, non-iterative power system static state estimatorfor three-phase unbalanced distribution systems. The estimatoris envisioned as a tool to aid systemmonitoring, automation andcontrol efforts in a Smart Grid environment. Decision making
HAUGHTON AND HEYDT: A LINEAR STATE ESTIMATION FORMULATION FOR SMART DISTRIBUTION SYSTEMS 1195
based on real-time information communication and better con-trol algorithms are made possible.The formulation presented and examples incorporate smart
meter data and synchronized phasor measurements at the pri-mary distribution level. Estimator performance is illustrated ona range of feeder loading conditions. Biasing measurements isshown to increase expected accuracy. In the examples shown,relying on trusted measurements results in nearly an order ofmagnitude accuracy improvement in voltage magnitude andangle estimates, and also reduced calculated current magnitudeerrors from 15% down to 4%.Knowledge of bus voltage phase angle from synchronized
phasor measurements improves the state estimation process forpower systems, and is shown here for distribution circuits. Thepracticality of large scale deployment of synchrophasor mea-surements in distribution systems is unknown. Direct measure-ment of bus voltage angle may be useful in distribution circuitsfor ascertaining power flows (both directions and magnitudes).DG injections and loading conditions of feeders may create aninteresting case of bidirectional power flow.The estimator formulation presented here is shown to be com-
parable to conventional estimation formulation of positive se-quence quantities only, but the proposed formulation has the ad-vantage of providing full three-phase detail. Bad data detectionis illustrated on the test system.
REFERENCES[1] Office of Electric Transmission and Distribution, United States Depart-
ment of Energy, Grid 2030: A National Vision for Electricity’s Second100 Years. Washington, DC, Apr. 2003.
[2] W. H. Kersting, Distribution System Modeling and Analysis, 2nd ed.New York: CRC, 2007.
[3] J. Northcote-Green and R. G. Wilson, Control and Automation of Elec-trical Power Distribution Systems. Boca Raton, FL: CRC, 2006.
[4] A. J. Wood and B. F. Wollenberg, Power Generation Operation andControl, 2nd ed. New York: Wiley, 2007.
[5] I. Roytelman and S. M. Shahidehpour, “State estimation for electricpower distribution systems in quasi real-time conditions,” IEEE Trans.Power Del., vol. 8, no. 4, pp. 2009–2015, Oct. 1993.
[6] M. E. Baran and A. W. Kelley, “State estimation for real-time moni-toring of distribution systems,” IEEE Trans. Power Syst., vol. 9, no. 3,pp. 1601–1609, Aug. 1994.
[7] M. E. Baran and A. W. Kelley, “A branch-current based state estima-tion method for distribution systems,” IEEE Trans. Power Syst., vol.10, no. 1, pp. 483–491, Feb. 1995.
[8] C. N. Lu, J. H. Teng, and W. E. Liu, “Distribution system state estima-tion,” IEEE Trans. Power Syst., vol. 10, no. 1, pp. 229–240, Feb. 1995.
[9] R. Hoffman, “Practical state estimation for electric distribution net-works,” in Proc. IEEE Power Systems Conf. Expo., Oct. 2006, pp.510–517.
[10] A. P. S. Meliopoulos and F. Zhang, “Multiphase power flow and stateestimation for power distribution systems,” IEEE Trans. Power Syst.,vol. 11, no. 2, pp. 939–946, May 1996.
[11] R. Singh, B. C. Pal, and R. A. Jabr, “Choice of estimator for distributionsystem state estimation,” IET Gen., Transm., Distrib., vol. 3, no. 7, pp.666–678, Jul. 2009.
[12] A. G. Phadke and J. S. Thorp, Synchronized Phasor Measurements andTheir Applications. New York: Springer, 2010.
[13] A. Abur, “Impact of phasor measurements on state estimation,” inProc. Int. Conf. Electrical and Electronics Engineering, Nov. 2009,pp. I3–I7.
[14] A. G. Phadke, “Synchronized phasor measurements—A historicaloverview,” in Proc. IEEE Transmission and Distribution Conf. Expo.Asia Pacific, Yokohama, Japan, Oct. 2002, vol. 3, pp. 476–479.
[15] D. Wight et al., Assessment of Demand Response and Advanced Me-tering Staff Report, U.S. Federal Energy Regulatory Commission, Feb.2011.
[16] S. Mak, “Smart meters serving as synchro-sensors for smart distribu-tion grid applications,” in Proc. IEEE PES General Meeting, Detroit,MI, Jul. 2011.
[17] A. Abur and A. Gómez Expósito, Power System State Estimation:Theory and Implementation. New York: Marcel Dekker, 2004.
[18] A. Monticelli, “Electric power system state estimation,” Proc. IEEE,vol. 88, no. 2, pp. 262–282, Feb. 2000.
[19] O. Alsac, N. Vempati, B. Stott, and A. Monticelli, “Generalized stateestimation,” IEEE Trans. Power Syst., vol. 13, no. 3, pp. 1069–1075,Aug. 1998.
[20] R. E. Larson, W. F. Tinney, L. P. Hajdu, and D. S. Piercy, “State es-timation in power systems part II: Implementation and applications,”IEEE Trans. Power App. Syst., vol. PAS-89, no. 3, pp. 353–363, 1970.
[21] R. Ebrahimian and R. Baldick, “State estimator condition number anal-ysis,” IEEE Trans. Power Syst., vol. 16, no. 2, pp. 273–279, May 2001.
[22] Itron, Smart Meter Specifications Data Sheets, 2011. [Online]. Avail-able: http://www.itron.com.
[23] E. Manitsas, R. Singh, B. Pal, and G. Strbac, “Modeling of pseudo-measurements for distribution system state estimation,” in Proc. IETCIRED Smart Grids for Distribution, Frankfurt, Germany, 2008, pp.1–4.
[24] IEEE Standard C37.118-2005, Standard for Synchrophasors for PowerSystems. Piscataway, NJ, 2005.
[25] M. W. Davis, R. Broadwater, and J. Hambrick, Modeling andTesting of Unbalanced Loading and Voltage Regulation, Na-tional Renewable Energy Laboratory (NREL), SubcontractReport NREL/SR-581-41805, Jul. 2007. [Online]. Available:http://www.nrel.gov/docs/fy07osti/41805.pdf.
[26] D. Montgomery, G. C. Runger, and N. F. Hubele, Engineering Statis-tics, 3rd ed. New York: Wiley, 2004.
[27] M. Powalko, K. Rudion, P. Komarnicki, and J. Blumschein, “Observ-ability of the distribution system,” inProc. CIRED Int. Conf. ElectricityDistribution, Jun. 2009, pp. 8–11.
[28] M. E. Baran, J. Jung, and T. McDermott, “Topology error identifica-tion using branch current state estimation for distribution systems,” inProc. Transmission and Distribution Conf. Expo., Asia and Pacific,Oct. 2009, pp. 1–4.
[29] H. Mori, “Optimal allocation of facts devices in distribution systems,”in Proc. IEEE Power Engineering Society Winter Meeting, Dec. 2001,vol. 2, pp. 936–937.
[30] V. Salehi, S. Afsharnia, and S. Kahrobaee, “Improvement of voltagestability in wind farm connection to distribution network using facts de-vices,” in Proc. IEEE Conf. Industrial Electronics, Paris, France, 2006,pp. 4242–4247.
[31] R. Grundbaum, “FACTS for voltage control and power quality im-provement in distribution grids,” in Proc. IET Conf. Smart Grids forDistribution, Aug. 2008, pp. 1–4.
[32] R. Dugan, M. McGranaghan, S. Santoso, and H. Beaty, ElectricalPower Systems Quality, 2nd ed. New York: McGraw-Hill, 2002.
[33] , IEEE Standard 1547, Standard for Interconnecting Distributed Re-sources With Electric Power Systems. Piscataway, NJ, 2009.
[34] R. Billinton and S. Jonnavithalu, “A test system for teaching overallpower system reliability assessment,” IEEE Trans. Power Syst., vol.11, no. 4, pp. 1670–1676, Nov. 1996.
Daniel A. Haughton (S’09) is from Jamaica andresided in Belize. He received the B.S.E.E degreefrom the University of South Florida, Tampa, in2006, and the M.S.E.E. degree from Arizona StateUniversity, Tempe, in 2009. He is presently pursuingthe Ph.D. degree at Arizona State University.He has industrial experience with Intel Corp.,
Chandler, AZ; California ISO, Folsom, CA; TampaElectric Co., Tampa FL; and Belize ElectricityLimited, Belize.
Gerald Thomas Heydt (S’62–M’64–SM’80–F’91–LF’04) is from Las Vegas, NV. He received the Ph.D.degree in electrical engineering from Purdue Univer-sity, West Lafayette, IN, in 1970.His industrial experience is with the Common-
wealth Edison, Chicago, IL, and E. G. & G.,Mercury, NV. He is presently the site director of apower engineering center program at Arizona StateUniversity, Tempe, where he is a Regents’ Professor.Dr. Heydt is the 2010 recipient of the Harold
Kauffman Award for excellence in distributionengineering. He is a member of the National Academy of Engineering.