a land use and transportation integration method for land use allocation and transportation...
TRANSCRIPT
Transportation Research Part A 69 (2014) 329–353
Contents lists available at ScienceDirect
Transportation Research Part A
journal homepage: www.elsevier .com/locate / t ra
A land use and transportation integration method for land useallocation and transportation strategies in Chinaq
http://dx.doi.org/10.1016/j.tra.2014.08.0170965-8564/� 2014 Elsevier Ltd. All rights reserved.
q Funding sources: Natural Science Foundation of China (50808048); New Century Excellent Person Plan of the Ministry of Education (NCET-0Shanghai Maritime University Research Grant.⇑ Corresponding author at: W & S Solutions, 5776 Hopyard Rd., Suite 170, Pleasanton, CA 94588, USA.
E-mail address: [email protected] (J.H. Wu).
Hailong Su a, Jia Hao Wub,c,d,⇑, Yinghui Tan a, Yuanqiu Bao b,c, Bing Song b,c, Xinghua He d
aResearch Center for Urban Planning and Development of Fudan University, ChinabW & S Solutions, CA, USAcWu & Song Associates, Shanghai, Chinad Shanghai Maritime University, China
a r t i c l e i n f o
Article history:Received 26 May 2011Received in revised form 1 February 2014Accepted 13 August 2014
Keywords:Urban planningLand use allocationLand use modelUPlanDemand forecasting modelEmme
a b s t r a c t
In this paper, we will first review literature of the land use and transportation interactionand then develop a new land use allocation methodology called Three Stages-Two-Feedback Method (Integration Method) for both land use allocation and the transpor-tation policy options with a practical implementation. Then we apply this method in anurban general planning project in China with more than 1.2 million populations. In thisproject, we evaluated three land use allocation strategies and three transportation policyoptions using two application tools (with and without feedbacks) using this methodimplemented in a land use planning system UPlan and a transportation planning systemEmme. The results show that the use of the feedback method (Application Two) resultsin a vehicle distance reduction and the increase in the service coverage area of transitbus stops at the same time. Due to the use of transportation accessibility and the congestionmeasures with a MSA implementation, the accessibility measure shows a convergentprocess over iterations. This nice feature can be used for alternative comparisons. Futureresearch subjects are also discussed.
� 2014 Elsevier Ltd. All rights reserved.
1. Introduction
Increasing demand for industrial and residential lands may result in climate changes, biodiversity losses, deteriorating airquality, and traffic congestion. The increase in travel demand results from different spatial activities with different land usepatterns. On the other hand, the transportation system plays an important role in land use change because of its accessibilityand travel costs. ICF (2005) describes the methods and approaches to understand the link between transportation invest-ment and land development and indicates that transportation agencies are recognizing induced land development as animpact of transportation capacity projects. Thus to facilitate future transportation planning and policy, it is vital to under-stand and model how land use change interacts with transportation, explore the dynamics and drivers of land-use change,and reflect the change in transportation policies.
7-0206);
330 H. Su et al. / Transportation Research Part A 69 (2014) 329–353
1.1. Rapid urban developments in China
The rapid urban and economy development in China has greatly improved the living standards and created social activ-ities among different regions. On the other hand, it has resulted in serious challenges to the society. In 2006, the Chinese GDPreached 5.5% of the total world GDP and now is ranked second in 2010, next to the US, while its energy consumption consistsof 15% of the total world energy consumption and 90% of rivers passing through the urban area have been polluted to certainextend. To maintain a sustainable social development, the Central Government’s new ‘‘Twelve Five-Year Plan” has called forenergy saving and environmental friendly societies. This plan will serve as a new regulation for urban general plans.
Land use allocations have had direct impacts on the urban spatial patterns, future urban developments, and transporta-tion systems in general. Since the urban transportation energy consumption accounts for 30% of China’s total energy con-sumption, the transportation system is a major emission generator in China. In the San Francisco area, the transportationsectors generate 40% of the emission. Thus the subject of the land use allocation based on the transportation conditionhas been very crucial due to the energy and environment constraints in both China and the US. In February, 2010, the ChinaMinistry of Housing and Urban–Rural Development issued a legal document called ‘‘Urban Comprehensive TransportationSystem Planning Procedure,” which requires that both transportation system planning and urban general planning needto be done in a coordinated way and will serve as a legal requirement for development of urban and transportation planningprocedures in China.
The 1991 Intermodal Surface Transportation Efficiency Act (ISTEA) marked a major turning point in how transportationmodeling is conducted. Prior to the Act, in transportation planning procedures, travel demand models were run with thesame land use inputs for all scenarios, so changes in land uses due to network improvements were not accounted for. How-ever, a study in the Sacramento, California region indicates that vehicle hours of delay could be reduced by 13.3% for thetransit alternative with land use measures and auto pricing policies, compared to 5.2% for the highway alternative(Johnston and Rodier, 1999). A simulation study in the Portland, Oregon region indicates that vehicle hours of delay couldbe reduced by 65.9% in the transit investment alternative with land use measures only, compared to 43% for the highwayalternatives (Cambridge Systematics Inc., 1996). Walker et al. (2007) described the use of UPlan for the urban development.Metropolitan Transportation Commission (MTC, 2009) in San Francisco Bay Area indicated that the integration of land useand transportation were performed in its 2035 Transportation Plan. Thus, although the planning procedures used in Chinaare different, these US practices and findings may still serve as many lessons and insights to the future regional and urbandevelopment in China. Especially, the land use and transportation modeling approaches used in the US may be reviewed,refined, and used for applications in China, since a proper land use model with transportation considerations may helpreduce vehicle distance traveled.
1.2. Research contributions to practice and literature
In this paper, we develop a new land use allocation methodology called Three Stages-Two-Feedback Method (IntegrationMethod) for both land use allocation and the transportation policy options with a practical implementation. To best of ourknowledge, the method presented for the City of Luohe case was developed for the first time in China. Although there areresearch results published in China regarding the integrated land use and transportation, there is no paper (to the best ofour knowledge) where the proposed method for a real citywide urban general plan with more than one million populationswas implemented and used. Here are specific contributions.
1. Contributions of this research to the practice may include the following items. (1) This is the first time that this methodwith the land use allocation model software UPlan and transportation model software Emme is used for a real city ofmore than one million population in the Central China based on the City draft general plan; (2) There are many landuse modeling methods available with extensive data requirement. In many cases, these methods may not be applicablein current Chinese situations due to the lack of the data or data restriction. This method has been developed based on theavailable data in the current urban and transportation planning environment in China, which can be used in this model-ing process; (3) This method is reasonable and intuitive from implementation and planning point of view; (4)The resultscan be easily refined, explained, and justified; (5) The land use allocation rules and transportation models can be refinedand adjusted in an iterative way; and (6) This process can be adapted to facilitate the planning process following the newChinese regulation, which is similar to the SB 375 in California to reduce vehicle distance travelled and encourage thedevelopment of the transit systems. Most importantly, the model is inexpensive in terms of the data collection as com-pared with other analytical methods and applicable in China for planners and citizen groups.
2. Contributions to the literature may consist of the following: (1) The new method includes a development of a uniqueThree-Stage –Two-Feedback method from the urban land use allocation down to the transportation planning processwith three stages (Land Use Sketch Planning, Land Use Refinement, Transportation policy Planning) and two feedbackswith special MSA (Method of Success Averages) implementations at Stage 1 and Stage 3; (2) A new accessibility forthe system consideration is defined and used based on both land use data and the transportation data, which connectstruly these two important components; (3) A congestion measure for the local consideration is defined and used to pre-vent the over-development in certain development areas so that the transportation measure will be used to reflect thedevelopment impacts; (4) An integration between UPlan and Emme with a MSA process (tested numerically with a real
H. Su et al. / Transportation Research Part A 69 (2014) 329–353 331
city data) is used to make sure that the iterative process is convergent; and (5) Urban land use alternatives are evaluatedat Stage 1, while, once a land use alternative is selected, transportation policy options will be evaluated and iterationbetween these options and the selected land use alternative will result in a refined land use alternative and the transpor-tation options.
2. Literature review for modeling developments
2.1. Modeling developments
Land use model development has been evolving over time with many implementations in recent years. In the late 1960’s,Lowry (Lowry, 1967) documented existing models at that time and noted that, ‘‘as the ease with which a model can be usedfor forecasting diminishes, its educational potential increases. This judgment must be qualified by an assessment in eachcase of the care with which the data are handled.” In addition, in this model, there is no consideration of the congestionat the local condition. Johnston and Shabazian (2003) presented a classification of most commonly used land use models.Johnston et al. (2004) documented a report on a use of UPlan land use allocation model to evaluate a transportation planand projects in Merced County (population 211,000 in 2000) where there is no feedback established between these twocomponents.
As Hunt et al. (2005) put it, ‘‘across all integrated models, housing/floor space supply models are probably the least welldeveloped of any component of the entire modeling system.”While there are many reasons that housing supply models havebeen less developed than housing demand models, lack of data would seem to be foremost (Dipasquale, 1999). Waddellaet al. (2007) present a case study on the application of UrbanSim a detailed land use simulation model system, and its inte-gration with a regional travel demand model in the Greater Wasatch Front area of Utah. Dong and Gliebe (2011) usedarchived geo-coded housing permit data of eight years from 10 Metro, the regional government for the Portland, Oregonmetropolitan area. It also defined the employment based accessibility and made parameters for the model and then forecastthe future house allocation based on the road density of TAZs with no iterations between the land use model and the trans-portation model. Miller et al. (2011) discussed the land use model validation based on the ILUTE (Integrated Land Use, Trans-portation, Environment) model system. It is an agent-based micro-simulation model for the Greater Toronto-Hamilton Area(GTHA). Currently it is being used with either Emme or MATSim (a micro simulation model). Zhao and Zhong-Ren Peng(2010) propose a bilevel model to explore land use allocation and transportation. Ferreira et al. (2010) developed a frame-work that links the transportation model and land use model (Urbansim). Gao et al. (2010), report on the multi-year processof developing the California PECAS statewide integrated land use/transportation model and the preliminary results of a sen-sitivity test. Clay et al. (2011) proposed to use the InfoUSA data for the land use model development and linked it into atransportation model. Wang et al. (2011) discuss incremental Integration of Land Use and Activity-based Travel ModelingWorkplace Choices and Travel Demand. Chen and Naylor (2011) demonstrate that the densest mixed-use scenario has sig-nificant increases in transit ridership, non-motorized modes of travel and significant decreases in VMT and emissions.
Thekdi and Lambert (2012) proposed a decision framework of strategic considerations based on assessing risk, cost, andopportunity in order to prioritize needs and potential remedies that mitigate impacts of land development to the infrastruc-ture systems. The approach is demonstrated for a 5700-mile multimodal transportation system adjacent to 60,000 tracts ofpotential land development. Wang et al. (2014) applied an integrated framework consisted of a combination of a two-round18 Delphi survey with the integrated land-use and transport model (LUTI) MARS for Madrid to the case-study of the futureimplementation 13 of travel demand management (TDM) measures in Madrid.
In general each incorporates concepts from the other; sub-models in each may use elements from the others (White,2010). One can start with a simple Rule-Based Model, such as UPlan (Johnston et al., 2007) and WhatIf (Klosterman,1999, 2008), and then advance to a more complex model type as they gain expertise and gather more data. As the errorsfrom not forecasting land development changes can be substantial (Rodier, 2005), we should advance their land use mod-eling, at least to the Rule-Based level or the Equilibrium Allocation level, before improving their travel models to accountfor trip tours or household activity allocation. Although various accessibilities were defined and used, there is no discussionon use of them in these modeling methods regarding their convergence of the iteration and the results obtained on theirpolicy implications.
Sophisticated transportation models have been formulated into multi-modal equilibrium formulations and have beenimplemented in various systems (Florian et al., 2003; Wu et al., 2006), which may be integrated with the land use modelsand can be linked to these land use models.
2.2. Technical Issues with data, planning and modeling practices
The data requirements and development costs of integrated land use and transportation forecasting models can vary dra-matically depending on complexity, geographic size and quality of existing data. Integrated models often use a combinationof parcel data, survey data, national data sources (e.g. US Census data) and transportation model derived data.
Waddell (2002) documents more variables such as the presence/absence of children, real estate characteristics,neighborhood characteristics, policy constraints, site-specific characteristics (such as proximity to certain features) and ahost of other variables needed to support the development and application of a land use model. Integrated models often
332 H. Su et al. / Transportation Research Part A 69 (2014) 329–353
use a combination of parcel data, survey data, national data sources (e.g. US Census data) and transportation model deriveddata. Parcel data can be used as one source of information regarding the characteristics of location.
In the literature, while extensive data were used in projects and reports in either the US or Canada, there are very littleland use modeling done based on the Chinese data. Thus we observe the following several issues related to the current plan-ning policies, modeling practices and data compilations:
1. Planning policies. The urban planning documents have been serving as legal documents that would guide the transporta-tion plans. These policies have created many problems in the past for the transportation plans and the practices. Thuspotential traffic conditions are not envisioned at this stage, although transportation infrastructures are part of the urbanplanning process. In 2010, the Chinese government improved this policy and asked for the simultaneous compilation ofthe urban planning and the transportation planning documents together, which means that there will be interactionsbetween the land use and the transportation. In this paper, we will propose a new integration procedure to address thisissue so that this method will be efficient and practical with a sound modeling process.
2. Modeling practices. In many urban planning practices, the use of travel demand forecasting models has not been seenoften in many 2th or 3rd tier cities in China with populations more than one million. No transportation analysis wasrequired. This situation has been improved recently with more and more advanced modeling software systems beingused. In this paper, a particular modeling procedure is proposed and discussed so that it is feasible to implement in Chinawith the available resource and capability of the urban and transportation planners and engineers.
3. Data availabilities. Even in this ‘‘information age”, data to support land use model development still can be difficult and/or costly to obtain, especially in China. A survey of agencies in the US that have implemented land use models suggestsdevelopment and implementation costs are the lowest for the rule-based class of models. Analytical models are themost complex and can cost from $100,000 to more than $1,000,000 to develop for MPO efforts and from $200,000to $15,000,000 (White, 2010) for statewide efforts depending on the size of the study area, policy sensitivity require-ments, data availability/quality and the duration of effort. Even within the broad classes there is room for customiza-tion to meet a specific need. Data demands, development cost/schedule and total model run-times are therefore uniqueto each case (White, 2010). Regarding the data requirement, rule-based models typically rely on parcel data, zoning,comprehensive plans, census and state or local data sources, while analytical models use the same data but typicallyrequire the use of much more additional disaggregate datasets to estimate model parameters that reflect choice andprobability. While there are many reasons MPOs do not implement such tools, perhaps one of the primary reasonsis concern over the schedule and cost requirements of obtaining the data typically needed to support such models.Although there have been always problems with availability of the transportation and land use data in most of the cit-ies in China, the requirement of necessary data in this method proposed in this paper can be met as long as therequirement for these data is provided clearly with clear objectives. In this paper we specify an inventory of these datatypes based on the current practices.
Regarding theories and Practices in China, recently, Cao (2010) provided a summary of the land use theory developmentin China in her master thesis. The research of this subject in China started in 1987 with more research in recent years. Basicmodels (Qu et al., 1999; Yang, 2010) can be grouped from bi-level optimization models to multi-center concept basedapproach. Duduta et al. (2010) developed a collaborative project carried out with planning officials from the city of Jinan(pop. 3.4 million).
3. A Land use and transportation integration method
In this section, we will first define some basic concepts, propose the new integration method for an effective integrationof land use allocation and transportation demand forecasting process, and then develop an implementation concept for themodeling process. The basic methodology used in this paper is a sketch-plan methodology to address urban developmentstrategies at the urban planning level.
3.1. Basic definition
In this section, we define concepts of land use allocation modeling, basic land use attributes defined on parcel and TAZ,transportation network, and evaluation criteria.
3.1.1. Land use allocation modelingIn the urban planning, it is necessary to allocate the land use patterns based on the following assumptions (Walker et al.,
2007):
� The population growth can be converted into demand for various types of land use by applying conversion factors toemployment and households.
� The new urban expansion will conform to city and county general plans.
H. Su et al. / Transportation Research Part A 69 (2014) 329–353 333
� Land parcels have different attractiveness because of accessibility to transportation, transportation infrastructure, thefuture development policy visions/objectives, and equality requirements.
� Some land parcels, such as lakes and streams, will not be developed, while other parcels, such as sensitive habitats andfloodplains, will discourage new developments.
We use the rule-based modeling approach such as UPlan. In the land use allocation with the rule-based models, generallyspeaking, at least three residential densities must be represented, in addition to industrial and two densities of commercialland. This helps to identify fiscal, runoff, water quality, and habitat impacts more accurately. Although the model needs notbe calibrated on historical data because its intended use is for long-range scenario testing, it is a good practice to calibratethe model parameters based on the observed land use patterns. It relies on fine-grained grid data that represent existingurban, local general land use plans, and all other relevant natural and built features that define the model. It must be deter-ministic and rule based, so as to be transparent to the user. The allocation rules must simulate land markets, broadly.
The needed space for each land use type is calculated from simple demographics and assigned based on the net attrac-tiveness of locations to that land use (based on user input), locations unsuitable for any development and a general plan thatdetermines where specific types of development are permitted. The model, according to the attractiveness of the grid cells,allocates the population growth and employment growth within one county (one study area) to the land use types that aredesignated in the county general plan. The areas with higher attractiveness values will have more growth of residential andemployment than those with lower attractiveness values, given the same amount of available land. Therefore, the cities withhigher attractiveness and big amount of available land will have higher shares of population growth and employmentgrowth.
3.1.2. Basic land use attributes defined on parcel and TAZ
The planning area can be divided into a set of spatial areas called TAZs or Parcel level. In general, these parcel level datacan be grouped into these corresponding TAZs via a GIS spatial operation. Thus urban land use data such as the residentialarea, service/retail area and the industrial area may be defined at parcel level and grouped into TAZs for the traffic modelingprocess. Attractors, discouragers, and masks can be defined for each parcel and TAZs in terms of weights.
3.1.3. Transportation networkThe transportation network can be defined in terms of transportation links (for road classifications, link attributes such as
lengths and the capacities and the travel delay functions) and nodes for bus stops and the road intersection locations and thecentroids for the TAZs’ centroids. The network can be developed based on the GIS network data easily. In addition, turn pen-alties (turn limits) can be defined based as well. The network can be implemented in a demand forecasting modeling systemsuch as Emme (INRO, 2008).
3.1.4. Evaluation criteriaThere are several criteria defined and used here. However, the most important criterion is the VMT (Vehicle Mile Traveled,
or Vehicle Kilo-Meter Traveled). Basically, we want to develop land use allocation and the transportation systems so that theVMT can be reduced among some strategies and options. In this research, we demonstrate that via an iterative processbetween the land use and transportation system, this integration procedure will reduce VMT as compared to a planning pro-cess without the interaction. Here are these criteria.
3.1.4.1. TAZ Based accessibility. In this paper, we use a TAZ based accessibility as one criterion and used as an iterative var-iable. There are more than 14 measuring accessibility definitions in the literature and a more detailed discussion of this sub-ject is beyond the scope of this paper. Transportation accessibility in this paper is defined as follows, which reflects theaccessibility or a kind of general costs for each TAZ:
Aj ¼P
ie�aðtij�TijÞP
i
Pje
�aðtij�TijÞ ð3-1Þ
where
Aj is the accessibility at TAZ j;tij is the travel impedance between TAZ i and j;a is a parameter associated with the travel impedance;Tij is the travel demand between TAZ i and j.
3.1.4.2. TAZ based congestion measure. TAZ based congestion measures are defined to be average of V/C for all road segmentswithin a TAZ area. The basic idea is to use it to measure the congestion level. This can be used to discourage the over-devel-opment in a location and distribute the land use into near-by area, which is shown here:
334 H. Su et al. / Transportation Research Part A 69 (2014) 329–353
ASi ¼Xl2ZðiÞ
SlLl=Xl2ZðiÞ
Ll ð3-2Þ
where
Z(i) a set of links within TAZ i;ASi congestion measure at TAZ i;Sl = Vl/Cl congestion measures for road segment l;Vl traffic volumes on road segment l;Cl road capacity on road segment l.
3.1.4.3. VMT. VMT (Vehicles Miles Traveled or Kilo-Meter Traveled) is important to measure the reasonableness for the landuse allocation and the emission as defined here:
VMT ¼Xl
V l � Ll ¼Xi
Xj
Tij � dij ð3-3Þ
where
Vl traffic volumes at road segment l;Ll length of road segment l;Tij demand from TAZ i to TAZ j;dij distance from TAZ i to TAZ j.
3.1.4.4. Average distance. Average distance per vehicle is also used as criterion. In many cases, we deal with different land usepattern, which may results in different vehicle demands. This is defined as:
�d ¼Xi
Xj
Tij � dij
,Xi
Xj
Tij ð3-4Þ
where
�d average distance;Tij traffic demand from i to j;dij distance from TAZ i to TAZ j.
3.1.4.5. Average travel time. Average travel time is used as part of criterion to reflect the travel time in congestion, which isalso related to the urban land use allocation.
Average Travel Time ¼Xi
Xj
Tij � tij=Xi
Xj
Tij ð3-5Þ
where
Tij traffic demand from i to j;tij travel time from TAZ i to TAZ j.
3.1.4.6. Percent of population covered by bus stops. This one reflects the transit service coverage measured in population. Thecoverage can be measured in a radius of 300 or 500 m represented by D.
Percent of Population Covered by Bus Stops ðDÞ ¼ Population covered by radius of D meters of bus stopsTotal Population
ð3-6Þ
3.1.4.7. Percent of employment covered by bus stops. This one reflects the transit service coverage measured in employment.The coverage can be measured in a radius of 300 or 500 meter.
H. Su et al. / Transportation Research Part A 69 (2014) 329–353 335
Percent of Employment Covered by Bus Stops ðDÞ ¼ Employment covered by radius of D meters of bus stopsTotal Empolyment
ð3-7Þ
3.2. Basic data requirement
Most of the data listed below for the land use allocation would typically be needed. These data should be prepared in theArcGIS environment as follows:
� GIS Raster Data� Demographic Data and Land Use Parameters� Attractions to Development� Discouragements or Exclusions to Development
Attraction Grids related data may include: 1. Freeway Ramps, 2. Highways, 3. Major Arterials, 4. Minor Arterials, 5. Cities,and 6. Passenger Rail Stations. For industrial allocation only, we also use 7. Airport and 8. Port. Discouragement and Exclu-sion Grids related data may include: 1. Land Use Plans; 2. Rivers (A user-specified distance buffers the rivers before they areadded to the Mask Grid. This precludes development from occurring too close to waterways.); 3. Lakes (buffered); 4. VernalPools (seasonal wetlands; buffered); 5. Floodplains; 6. Slope (Steep slopes are used to mask out areas that are too steep todevelop, and moderately steep slopes are used as a discouragement factor for areas that remain. The discouragement factorworks by dividing the sum of the Attraction Grid weights by values >1, taken from a lookup table.); 7. Public Lands; 8. Exist-ing Urban (This grid is often constructed using satellite data. This layer can be corrected and updated with parcel data, wheresuch data exist.); 9. Permanent Open Space; 10. Farmlands.
3.3. Basic land use allocation steps
The computation procedure for the land use allocation adopted (Johnston et al., 2007) in the research is described asfollows.
Stage 1. Define demographic and land use density factors that are converted to acres of land consumed for each land use.Stage 2. Convert population projections for the entire region.Stage 3. Specify the demographic and land use characteristics that will be tested.Stage 4. Determine acre needed for future housing, specifies persons per household, percent of households in each density
class, and average parcel size for each density class.Stage 5. Convert the demand of land consumed for industry and commerce and uses workers per household, percent of
workers in each employment class, and average land area per worker.Stage 6. Produce a table of land demanded, for each land use type, from which the model operates its land allocation rou-
tine. In general, the input values for baseline cases are derived from recent experience in each jurisdiction.Stage 7. Derive overall gross land consumed per person from historical data.Stage 8. Allocate future development starting with the highest-valued cells. As the higher-valued cells are consumed, the
model looks for incrementally lower-valued cells until all ha of projected land consumption are allocated.
Assume that 200 m grid cells are used to represent average parcel size (�4 ha). Land use allocation sequence is describedhere. The model does this for each of the discrete land use categories and the user can decide the order in which land uses areallocated. By default, the model starts with the following sequence:
a. industry,b. high-density commercial,c. high-density residential,d. low-density commercial,e. medium-density residential,f. low-density residential, and finallyg. very low-density residential
3.4. Compliance
As indicated in UPlan Land Use Allocation Model (Johnston et al., 2007), there are four ways in which local land use plansrestrict the allocations, which are (1) Strict Compliance – Each land use can only be allocated to its corresponding designa-tions in the General Plan; (2) Limited Compliance – Each land use is allocated to its corresponding General Plan designation.Land uses are listed in order of allocation; (3) Industrial Compliance Only – Industry must go to industrially designated areas,
336 H. Su et al. / Transportation Research Part A 69 (2014) 329–353
and all other land uses can go anywhere; and (4) No Compliance – All land uses are allowed to go into any land use desig-nation. The second compliance is used here.
3.5. Land use model calibration
In the US, one can generally calibrate the location of residential development by using the Census block population datafor 1990 and 2000, both in the 2000 blocks. One can purchase these change data inexpensively from GeoLytics, Inc., and theyare especially useful for determining the location and percentage of growth for Low-Density Residential. This land use con-sumes over half of all land, in many jurisdictions. However, the existing land use data may not be available as in this projectfor the model calibration.
3.6. Integration of land use and transportation
This integration can be formulated as a bi-level optimization in nature. The objective is to minimize VMT given the con-straints such as land use allocations and the multi-modal transportation assignment. Thus this is a global optimization prob-lem, which means that this is a difficult problem to solve and may not even have a global minimum solution. However, inthis case, a stable solution may be found where an iterative procedure is used between land use allocation and the transpor-tation demand forecasting so that the variables such as the accessibility variables are stable or near stable. Then we canreview the solutions obtained to determine if they are reasonable from the planning point of view.
This method can be developed via an integration of UPlan and Emme. The application of UPlan is very new (may be thefirst) for this type of the projects in China. UPlan is selected and used for the land use allocation. The main reason of using it isthat it is implemented in an ArcGIS environment and can be easily implemented to reflect the planner’s visions as where thedevelopment should go. Emme is a complete travel demand forecasting system for urban, regional, and national transpor-tation planning. Make informed transport policy decisions with Emme’s comprehensive set of tools for demand modeling,multimodal network modeling, visualization and analysis. Emme can be used to compute the TAZ based accessibility forentire network and the TAZ based congestion level at local condition. Emme is an urban travel demand forecasting software(INRO, 2008) and has been widely used in many large cities in China. Therefore, UPlan and Emme may be used as effectivetools in the development of the land use allocation with consideration of the transportation.
This integration method called Three-Stage-Two-Feedback Method (Integration Method) is an innovative and uniquemethod developed and adapted to the local planning condition, which includes the following three stages and two feedbacksas shown in Fig. 1 for (1) Land Use Sketch Planning; (2) Land Use Refinement; (3) Transportation Policy Planning; and (4)Two special feedbacks with MSA (Method of Success Averages) implementations at Stage 1 and Stage 3.
3.6.1. Integration method
Stage 1. (Land Use Sketch Planning)a. Initialization. Define a set of sketch TAZ areas and land use factors for the study area. Either no specific trans-
portation network or specific transportation network is used. Start with iteration n = 0;b. Land Use Allocation. The input data include: total population, employment, a sketch city general plan (with a
larger TAZ) and a set of conversion factors. The output data include: the populations for residential area,employment for industrial, retail and service areas are computed for each TAZ;
c. Transportation Computation. Compute travel impedances based on either the Euclidian distances or transpor-tation network. Compute total productions and attractions based on the land use allocation obtained above.Apply a gravity model to total OD demand Tij for all i and j and then compute the TAZ based accessibilities basedon Eq. (3–2) results in the total daily travel demands (i.e., total attraction and production for each zone);
d. Evaluation. Compute the TAZ based accessibility Anj for each TAZ j at iteration l and compare the accessibility of
previous iteration An�1j ;
e. Convergence Test. Compute the following relative error r of accessibilities for iteration n:
a ¼ffiffiffiffiffiffiffiffiffiffiffiffiffiffiffiffiffiffiffiffiffiffiffiffiffiffiffiffiffiffiffiffiffiP
jðAnj � An�1
j Þ2q
PjA
nj
ð3-8Þ
f. If the error is smaller than a predetermined value, then Go To Stage 2;if the error is larger than a predeterminedvalue, then go to g. in Stage 1;
g. Land Use Factor Update. Compute accessibilities.h. MSA Computation for Accessibilities for iteration n: An
j ¼ An�1j þ An
j�An�1
j
n where Anj is the current accessibility mea-
sures at TAZj for iteration n;i. Set n = n + 1. Go to a. in Stage 1.
Stage 2. (Land Use Refinement)a. Review the land use allocation obtained;
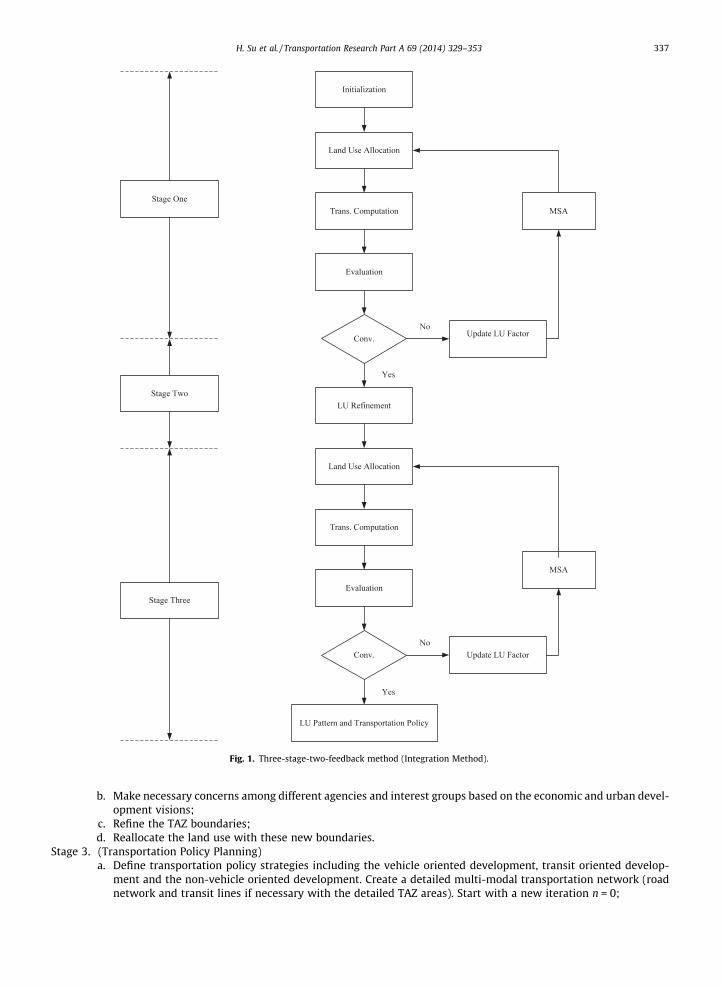
Fig. 1. Three-stage-two-feedback method (Integration Method).
H. Su et al. / Transportation Research Part A 69 (2014) 329–353 337
b. Make necessary concerns among different agencies and interest groups based on the economic and urban devel-opment visions;
c. Refine the TAZ boundaries;d. Reallocate the land use with these new boundaries.
Stage 3. (Transportation Policy Planning)a. Define transportation policy strategies including the vehicle oriented development, transit oriented develop-
ment and the non-vehicle oriented development. Create a detailed multi-modal transportation network (roadnetwork and transit lines if necessary with the detailed TAZ areas). Start with a new iteration n = 0;
338 H. Su et al. / Transportation Research Part A 69 (2014) 329–353
b. Use derived land use factors in Step One or more detailed land use factors for the study area. Either no specifictransportation network or specific transportation network is used;
c. Land Use Allocation. The input data include: total population, employment, a sketch city general plan (with amore detailed TAZ) and a set of conversion factors. The output data include: the populations for residential area,employment for industrial, retail and service areas are computed for each TAZ;
d. Transportation Computation. After compute total productions and attractions based on the l and use allocationobtained above. Compute travel impedances (such as the log sum, generalized costs) based on transportationnetwork. Apply a gravity model to total OD demand Tij for all i and j and then compute the TAZ based accessi-bilities based on Eq. (3–2) results in the total daily travel demands (i.e., total attraction and production for eachzone);
e. Evaluation. Compute the TAZ based accessibility Anj for each TAZ j at iteration n and compare the accessibility of
previous iteration An�1j ;
f. Convergence Test. Compute the following relative error r:
ffiffiffiffiffiffiffiffiffiffiffiffiffiffiffiffiffiffiffiffiffiffiffiffiffiffiffiffiffiffiffiffiffiq a ¼PjðAn
j � An�1j Þ2P
jAnj
ð3-9Þ
g. If the error is smaller than a predetermined value, then Stop.h. Land Use Update. Compute accessibilities and congestion measures;i. MSA Computations for both Congestion Measures and Accessibilities for iteration n:
ASnj ¼ ASn�1j þ ASnj � ASn�1
j
nand An
j ¼ An�1j þ An
j � An�1j
n
where ASnj and Anj are the current congestion and accessibility measures at TAZ j for iteration n.
j. Set n = n + 1. Go to a. of Stage 3.
4. Implementation and applications
In this section, a particular implementation of this integration method is described for the City of Luohe in China and itsapplication for the City general plan is presented as well using the City’s data collected. The detailed results are reported inFudan University and Wu and Song (2011).
4.1. City of Luohe in China
Luohe is a prefecture-level city in central Henan province, People’s Republic of China. It is surrounded by the cities ofXuchang, Zhoukou, Zhumadian and Pingdingshan to its north, east, south and west, respectively. Situated at the central area,south of the Yellow River, Luohe city region has an area of 2617 square kilometers and a population of 2.52 millions. It isfamous for its food production, the national garden city, and the inland special zone in Henan Province. Luohe is rich in tour-ism resources. Luohe today is not only a modern garden city, but also a green city in Central China, with the forest coverageup to 44.5%. The streets are lined with green trees and fresh flowers. Its urban proper area has a population of 800,000 with61.99 square kilo-meters and 1.2 million in 2030.
It is a typical medium city in China (a population between 0.5 and1 million). To develop a general plan of the city with thenew regulation, we developed the project to determine the future land use patterns with transportation infrastructure byapplying this modeling method.
4.2. Land use and transportation policies
Three land use allocation options and three transportation policy options are considered and evaluated with ApplicationMethod One and Two, where Method One is a traditional method used in Stage 3 and Method Two is this integrationmethod.
In Table 1, each cell (combination of land use, transportation options and an Application) is called an alternative such asLU2.T2.A1 for land use option 2, transportation policy option 2 and Application One. In Stage 1, these three land use optionswere evaluated and the disaggregated land use option was selected as LU3. Some refinements were made for LU3. In Stage 3,based on refined land use allocation LU3, two applications (Application One and Application Two) were done for three trans-portation policy options. With Application One, the refined land use allocation LU3 may change due to the impact of the tra-ditional transportation system and the three transportation policies were analyzed, while with Application Two, in Stage 3,the land use allocation may change due to the impact of the transportation policy options.
Urban Land Use Allocation/Development options are described here. Based on a draft urban general plan 2030 of Luohe, atStage 1, we mainly deal with impacts of major land use allocations on transportation structures at a sketch level in terms of
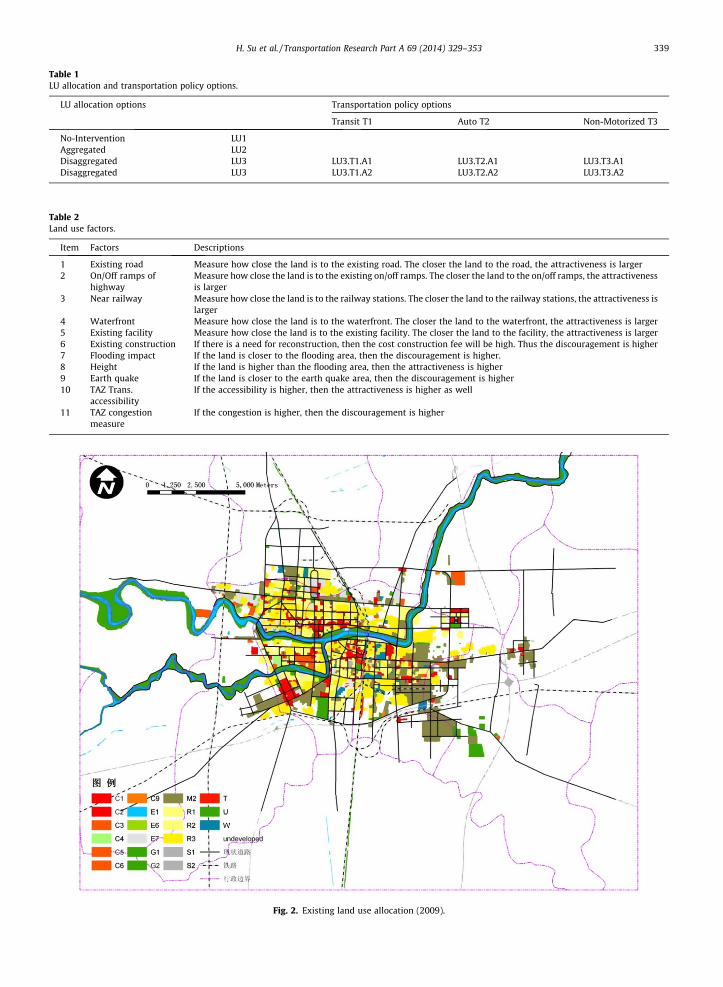
Table 1LU allocation and transportation policy options.
LU allocation options Transportation policy options
Transit T1 Auto T2 Non-Motorized T3
No-Intervention LU1Aggregated LU2Disaggregated LU3 LU3.T1.A1 LU3.T2.A1 LU3.T3.A1Disaggregated LU3 LU3.T1.A2 LU3.T2.A2 LU3.T3.A2
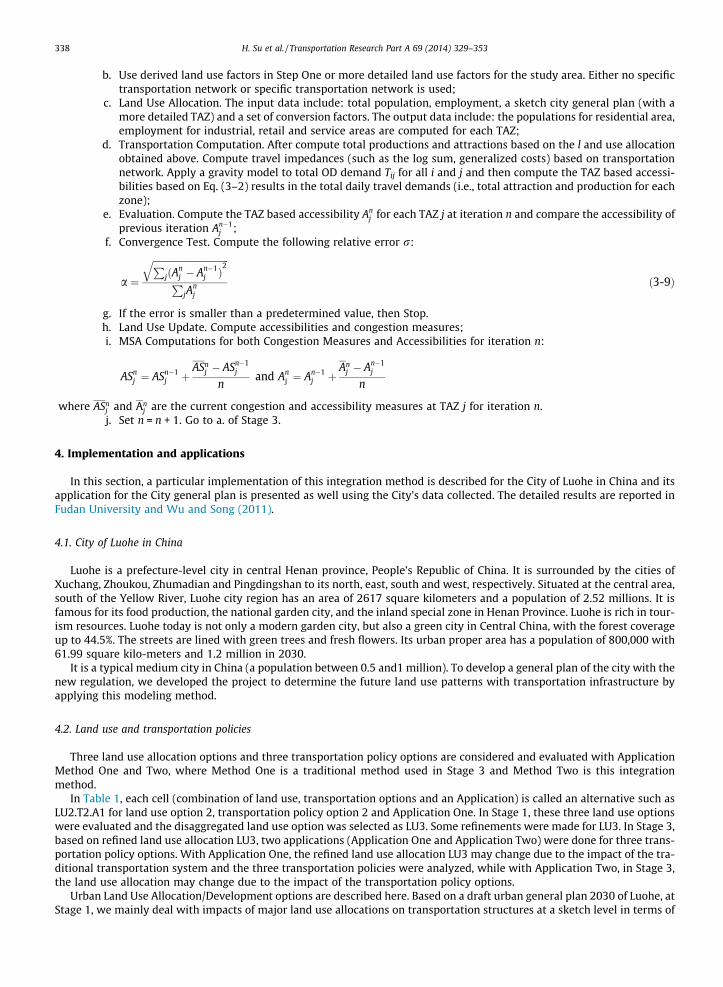
Fig. 2. Existing land use allocation (2009).
Table 2Land use factors.
Item Factors Descriptions
1 Existing road Measure how close the land is to the existing road. The closer the land to the road, the attractiveness is larger2 On/Off ramps of
highwayMeasure how close the land is to the existing on/off ramps. The closer the land to the on/off ramps, the attractivenessis larger
3 Near railway Measure how close the land is to the railway stations. The closer the land to the railway stations, the attractiveness islarger
4 Waterfront Measure how close the land is to the waterfront. The closer the land to the waterfront, the attractiveness is larger5 Existing facility Measure how close the land is to the existing facility. The closer the land to the facility, the attractiveness is larger6 Existing construction If there is a need for reconstruction, then the cost construction fee will be high. Thus the discouragement is higher7 Flooding impact If the land is closer to the flooding area, then the discouragement is higher.8 Height If the land is higher than the flooding area, then the attractiveness is higher9 Earth quake If the land is closer to the earth quake area, then the discouragement is higher10 TAZ Trans.
accessibilityIf the accessibility is higher, then the attractiveness is higher as well
11 TAZ congestionmeasure
If the congestion is higher, then the discouragement is higher
H. Su et al. / Transportation Research Part A 69 (2014) 329–353 339
Fig. 3. Draft land use allocation (2030).
Table 3LU model type and general plan LU type.
Land use model type General plan category
Industry Industry, urban reserveHigh-density
commercialIndustry, downtown commercial, mixed use, urban reserve
High-densityresidential
Industrial, downtown commercial, multi-family residential, planned development, mixed use, urban reserve
Low-densitycommercial
Industry, downtown commercial, neighborhood commercial, multi-family residential, planned development, mixed use,urban reserve
Medium-densityresidential
Industrial, downtown commercial, neighborhood commercial, multi-family residential, single-family residential, planneddevelopment, mixed use, urban reserve
Low-densityresidential
Industrial, downtown commercial, neighborhood commercial, multi-family residential, single-family residential, ruralresidential
Very low-density res. Rural residential
340 H. Su et al. / Transportation Research Part A 69 (2014) 329–353
the defined criteria. The three urban land use allocation policies are considered to be: No-Intervention Development (LU1),Aggregated Development (LU2) and Disaggregated Development (LU3) as follows:
� LU1: No-Intervention Development. The development policy follows the current development policy.� LU2: Aggregated Development. This policy focuses on the development in the urban core area so that it will induce thedevelopment around the core area.
� LU3: Disaggregated Development. This policy calls for the disaggregated development into several centers, which mayresult in a new development of the highway system and a housing and job balance development strategy.
Transportation policy options will include the following options:
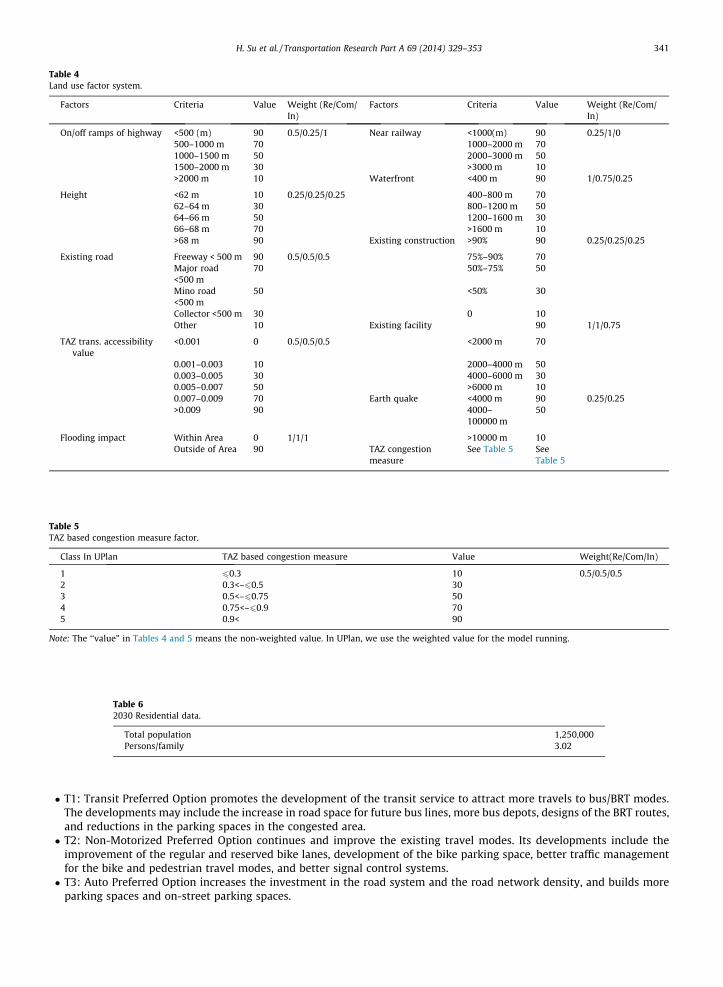
Table 4Land use factor system.
Factors Criteria Value Weight (Re/Com/In)
Factors Criteria Value Weight (Re/Com/In)
On/off ramps of highway <500 (m) 90 0.5/0.25/1 Near railway <1000(m) 90 0.25/1/0500–1000 m 70 1000–2000 m 701000–1500 m 50 2000–3000 m 501500–2000 m 30 >3000 m 10>2000 m 10 Waterfront <400 m 90 1/0.75/0.25
Height <62 m 10 0.25/0.25/0.25 400–800 m 7062–64 m 30 800–1200 m 5064–66 m 50 1200–1600 m 3066–68 m 70 >1600 m 10>68 m 90 Existing construction >90% 90 0.25/0.25/0.25
Existing road Freeway < 500 m 90 0.5/0.5/0.5 75%–90% 70Major road<500 m
70 50%–75% 50
Mino road<500 m
50 <50% 30
Collector <500 m 30 0 10Other 10 Existing facility 90 1/1/0.75
TAZ trans. accessibilityvalue
<0.001 0 0.5/0.5/0.5 <2000 m 70
0.001–0.003 10 2000–4000 m 500.003–0.005 30 4000–6000 m 300.005–0.007 50 >6000 m 100.007–0.009 70 Earth quake <4000 m 90 0.25/0.25>0.009 90 4000–
100000 m50
Flooding impact Within Area 0 1/1/1 >10000 m 10Outside of Area 90 TAZ congestion
measureSee Table 5 See
Table 5
Table 5TAZ based congestion measure factor.
Class In UPlan TAZ based congestion measure Value Weight(Re/Com/In)
1 60.3 10 0.5/0.5/0.52 0.3<–60.5 303 0.5<–60.75 504 0.75<–60.9 705 0.9< 90
Note: The ‘‘value” in Tables 4 and 5 means the non-weighted value. In UPlan, we use the weighted value for the model running.
Table 62030 Residential data.
Total population 1,250,000Persons/family 3.02
H. Su et al. / Transportation Research Part A 69 (2014) 329–353 341
� T1: Transit Preferred Option promotes the development of the transit service to attract more travels to bus/BRT modes.The developments may include the increase in road space for future bus lines, more bus depots, designs of the BRT routes,and reductions in the parking spaces in the congested area.
� T2: Non-Motorized Preferred Option continues and improve the existing travel modes. Its developments include theimprovement of the regular and reserved bike lanes, development of the bike parking space, better traffic managementfor the bike and pedestrian travel modes, and better signal control systems.
� T3: Auto Preferred Option increases the investment in the road system and the road network density, and builds moreparking spaces and on-street parking spaces.
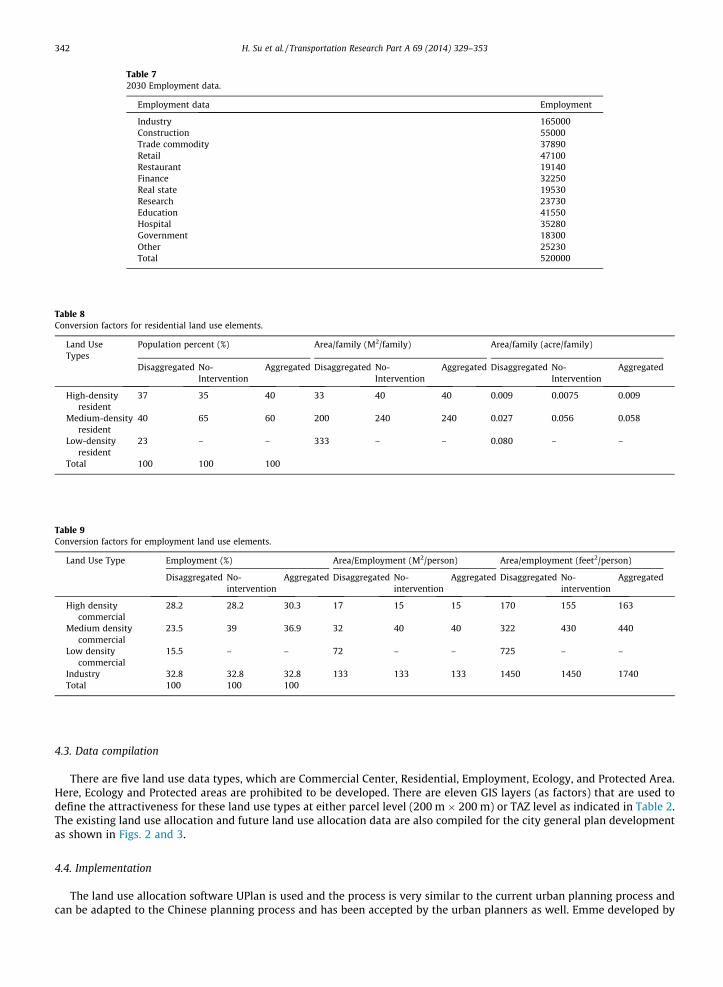
Table 72030 Employment data.
Employment data Employment
Industry 165000Construction 55000Trade commodity 37890Retail 47100Restaurant 19140Finance 32250Real state 19530Research 23730Education 41550Hospital 35280Government 18300Other 25230Total 520000
Table 8Conversion factors for residential land use elements.
Land UseTypes
Population percent (%) Area/family (M2/family) Area/family (acre/family)
Disaggregated No-Intervention
Aggregated Disaggregated No-Intervention
Aggregated Disaggregated No-Intervention
Aggregated
High-densityresident
37 35 40 33 40 40 0.009 0.0075 0.009
Medium-densityresident
40 65 60 200 240 240 0.027 0.056 0.058
Low-densityresident
23 – – 333 – – 0.080 – –
Total 100 100 100
Table 9Conversion factors for employment land use elements.
Land Use Type Employment (%) Area/Employment (M2/person) Area/employment (feet2/person)
Disaggregated No-intervention
Aggregated Disaggregated No-intervention
Aggregated Disaggregated No-intervention
Aggregated
High densitycommercial
28.2 28.2 30.3 17 15 15 170 155 163
Medium densitycommercial
23.5 39 36.9 32 40 40 322 430 440
Low densitycommercial
15.5 – – 72 – – 725 – –
Industry 32.8 32.8 32.8 133 133 133 1450 1450 1740Total 100 100 100
342 H. Su et al. / Transportation Research Part A 69 (2014) 329–353
4.3. Data compilation
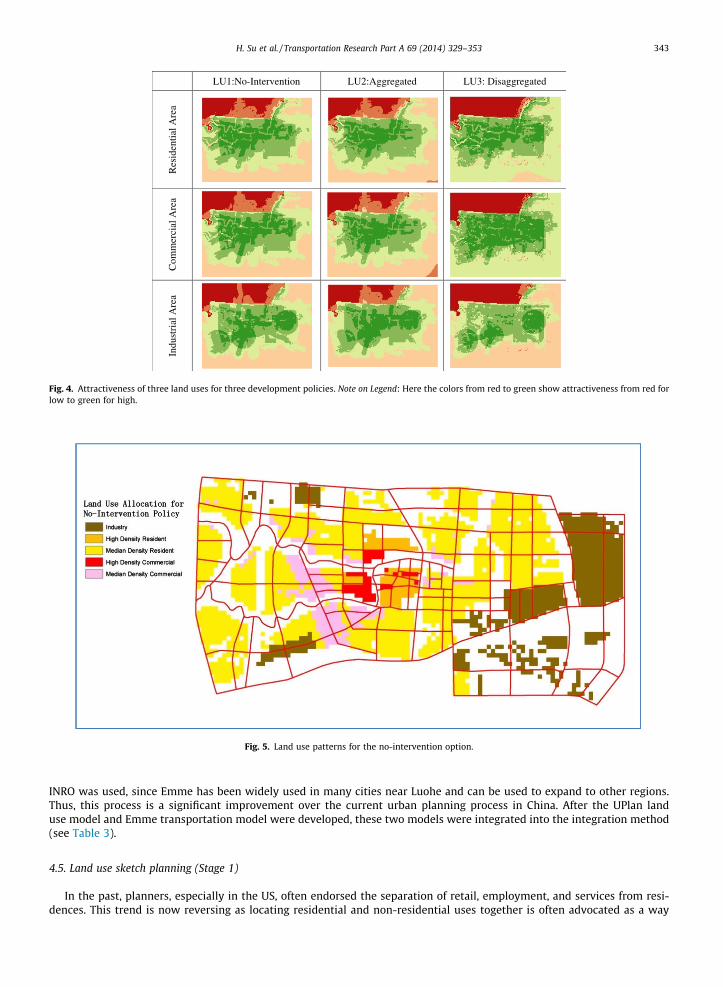
There are five land use data types, which are Commercial Center, Residential, Employment, Ecology, and Protected Area.Here, Ecology and Protected areas are prohibited to be developed. There are eleven GIS layers (as factors) that are used todefine the attractiveness for these land use types at either parcel level (200 m � 200 m) or TAZ level as indicated in Table 2.The existing land use allocation and future land use allocation data are also compiled for the city general plan developmentas shown in Figs. 2 and 3.
4.4. Implementation
The land use allocation software UPlan is used and the process is very similar to the current urban planning process andcan be adapted to the Chinese planning process and has been accepted by the urban planners as well. Emme developed by
LU1:No-Intervention LU2:Aggregated LU3: Disaggregated
Res
iden
tial A
rea
Com
mer
cial
Are
a In
dust
rial
Are
a
Fig. 4. Attractiveness of three land uses for three development policies. Note on Legend: Here the colors from red to green show attractiveness from red forlow to green for high.
Fig. 5. Land use patterns for the no-intervention option.
H. Su et al. / Transportation Research Part A 69 (2014) 329–353 343
INRO was used, since Emme has been widely used in many cities near Luohe and can be used to expand to other regions.Thus, this process is a significant improvement over the current urban planning process in China. After the UPlan landuse model and Emme transportation model were developed, these two models were integrated into the integration method(see Table 3).
4.5. Land use sketch planning (Stage 1)
In the past, planners, especially in the US, often endorsed the separation of retail, employment, and services from resi-dences. This trend is now reversing as locating residential and non-residential uses together is often advocated as a way
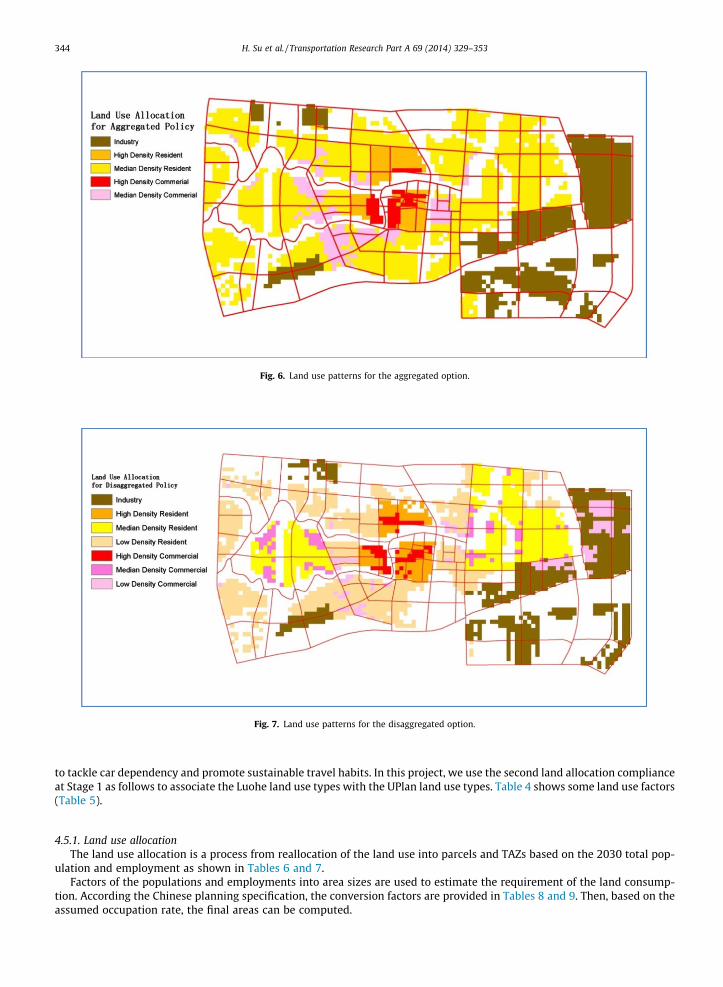
Fig. 6. Land use patterns for the aggregated option.
Fig. 7. Land use patterns for the disaggregated option.
344 H. Su et al. / Transportation Research Part A 69 (2014) 329–353
to tackle car dependency and promote sustainable travel habits. In this project, we use the second land allocation complianceat Stage 1 as follows to associate the Luohe land use types with the UPlan land use types. Table 4 shows some land use factors(Table 5).
4.5.1. Land use allocationThe land use allocation is a process from reallocation of the land use into parcels and TAZs based on the 2030 total pop-
ulation and employment as shown in Tables 6 and 7.Factors of the populations and employments into area sizes are used to estimate the requirement of the land consump-
tion. According the Chinese planning specification, the conversion factors are provided in Tables 8 and 9. Then, based on theassumed occupation rate, the final areas can be computed.
Opt
ion
Population Density Employment Density
No-
Inte
rven
tion
Agg
rega
ted
Dis
aggr
egat
ed
Legend
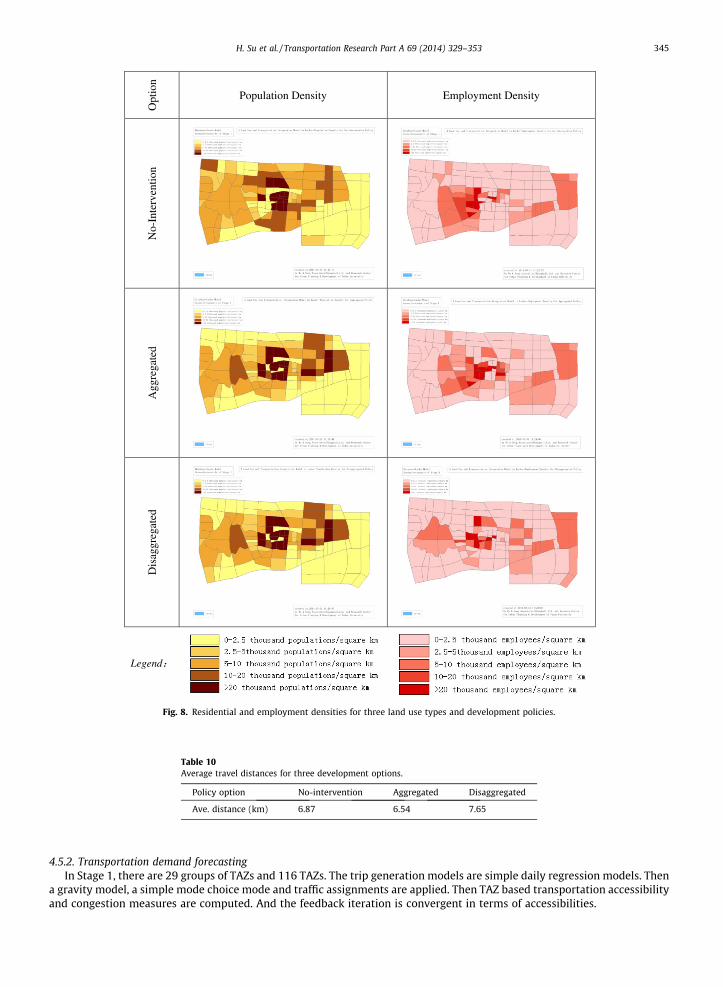
Fig. 8. Residential and employment densities for three land use types and development policies.
Table 10Average travel distances for three development options.
Policy option No-intervention Aggregated Disaggregated
Ave. distance (km) 6.87 6.54 7.65
H. Su et al. / Transportation Research Part A 69 (2014) 329–353 345
4.5.2. Transportation demand forecastingIn Stage 1, there are 29 groups of TAZs and 116 TAZs. The trip generation models are simple daily regression models. Then
a gravity model, a simple mode choice mode and traffic assignments are applied. Then TAZ based transportation accessibilityand congestion measures are computed. And the feedback iteration is convergent in terms of accessibilities.
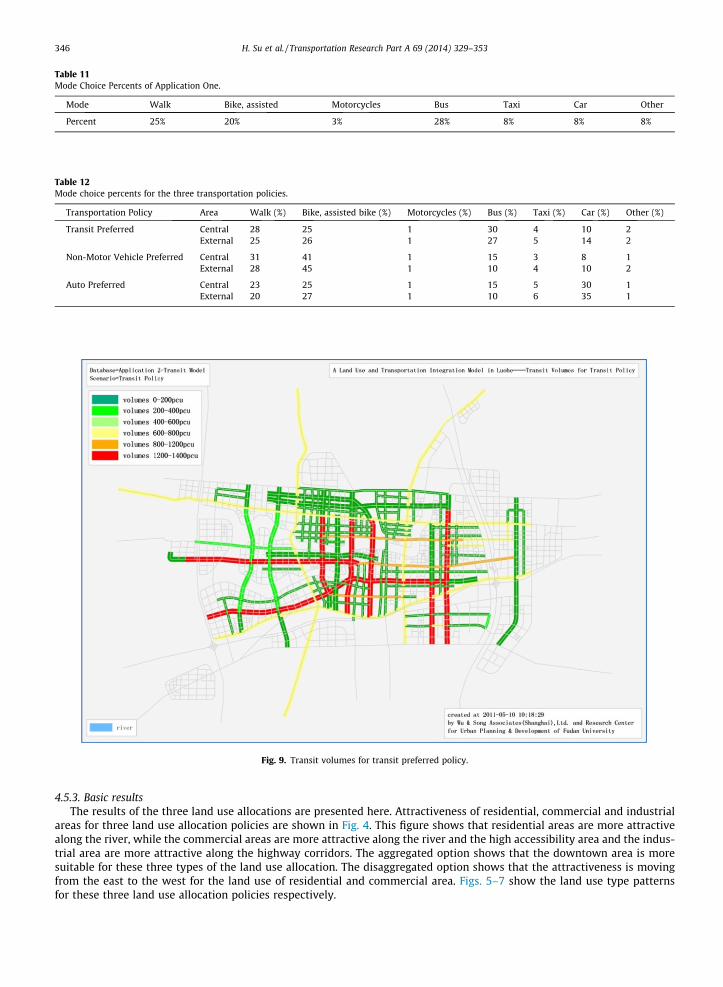
Table 11Mode Choice Percents of Application One.
Mode Walk Bike, assisted Motorcycles Bus Taxi Car Other
Percent 25% 20% 3% 28% 8% 8% 8%
Table 12Mode choice percents for the three transportation policies.
Transportation Policy Area Walk (%) Bike, assisted bike (%) Motorcycles (%) Bus (%) Taxi (%) Car (%) Other (%)
Transit Preferred Central 28 25 1 30 4 10 2External 25 26 1 27 5 14 2
Non-Motor Vehicle Preferred Central 31 41 1 15 3 8 1External 28 45 1 10 4 10 2
Auto Preferred Central 23 25 1 15 5 30 1External 20 27 1 10 6 35 1
Fig. 9. Transit volumes for transit preferred policy.
346 H. Su et al. / Transportation Research Part A 69 (2014) 329–353
4.5.3. Basic resultsThe results of the three land use allocations are presented here. Attractiveness of residential, commercial and industrial
areas for three land use allocation policies are shown in Fig. 4. This figure shows that residential areas are more attractivealong the river, while the commercial areas are more attractive along the river and the high accessibility area and the indus-trial area are more attractive along the highway corridors. The aggregated option shows that the downtown area is moresuitable for these three types of the land use allocation. The disaggregated option shows that the attractiveness is movingfrom the east to the west for the land use of residential and commercial area. Figs. 5–7 show the land use type patternsfor these three land use allocation policies respectively.
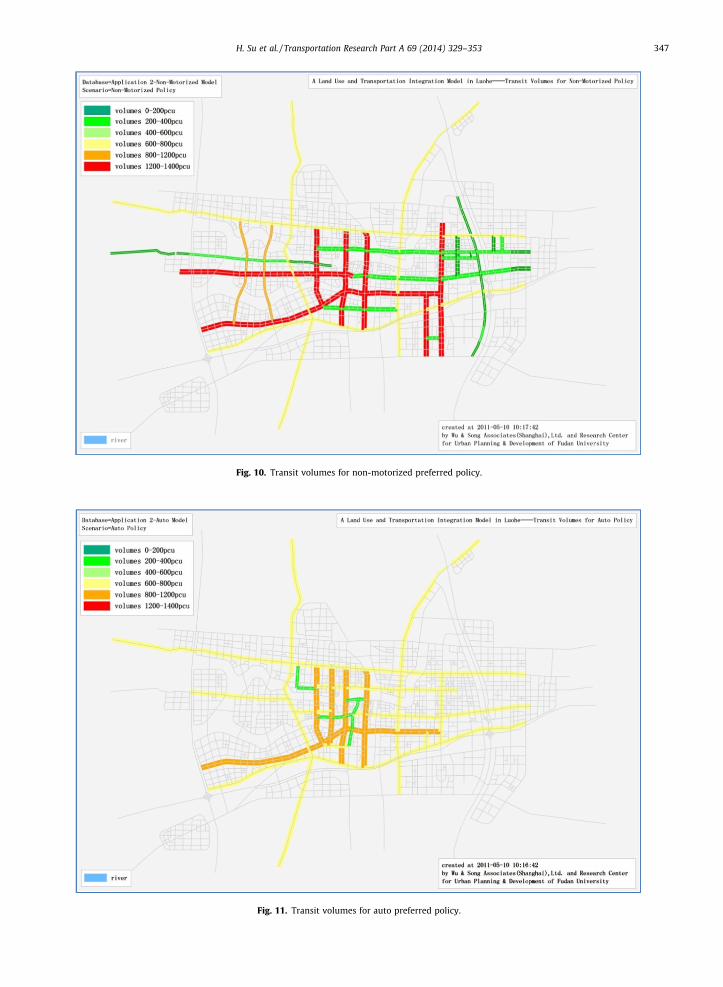
Fig. 10. Transit volumes for non-motorized preferred policy.
Fig. 11. Transit volumes for auto preferred policy.
H. Su et al. / Transportation Research Part A 69 (2014) 329–353 347
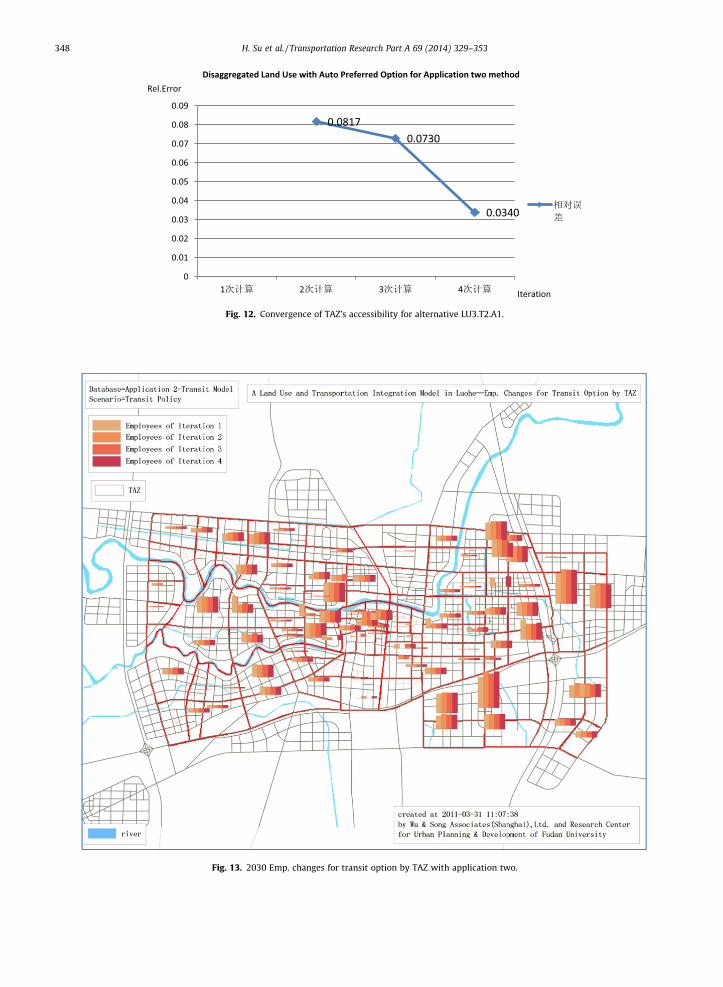
Fig. 12. Convergence of TAZ’s accessibility for alternative LU3.T2.A1.
Fig. 13. 2030 Emp. changes for transit option by TAZ with application two.
348 H. Su et al. / Transportation Research Part A 69 (2014) 329–353
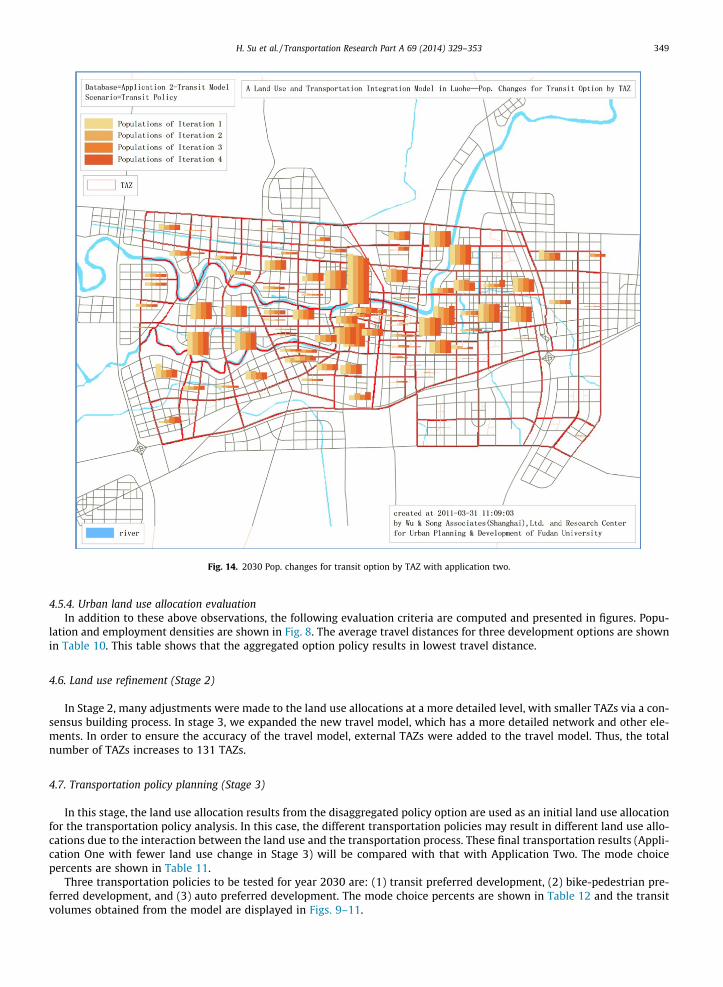
Fig. 14. 2030 Pop. changes for transit option by TAZ with application two.
H. Su et al. / Transportation Research Part A 69 (2014) 329–353 349
4.5.4. Urban land use allocation evaluationIn addition to these above observations, the following evaluation criteria are computed and presented in figures. Popu-
lation and employment densities are shown in Fig. 8. The average travel distances for three development options are shownin Table 10. This table shows that the aggregated option policy results in lowest travel distance.
4.6. Land use refinement (Stage 2)
In Stage 2, many adjustments were made to the land use allocations at a more detailed level, with smaller TAZs via a con-sensus building process. In stage 3, we expanded the new travel model, which has a more detailed network and other ele-ments. In order to ensure the accuracy of the travel model, external TAZs were added to the travel model. Thus, the totalnumber of TAZs increases to 131 TAZs.
4.7. Transportation policy planning (Stage 3)
In this stage, the land use allocation results from the disaggregated policy option are used as an initial land use allocationfor the transportation policy analysis. In this case, the different transportation policies may result in different land use allo-cations due to the interaction between the land use and the transportation process. These final transportation results (Appli-cation One with fewer land use change in Stage 3) will be compared with that with Application Two. The mode choicepercents are shown in Table 11.
Three transportation policies to be tested for year 2030 are: (1) transit preferred development, (2) bike-pedestrian pre-ferred development, and (3) auto preferred development. The mode choice percents are shown in Table 12 and the transitvolumes obtained from the model are displayed in Figs. 9–11.
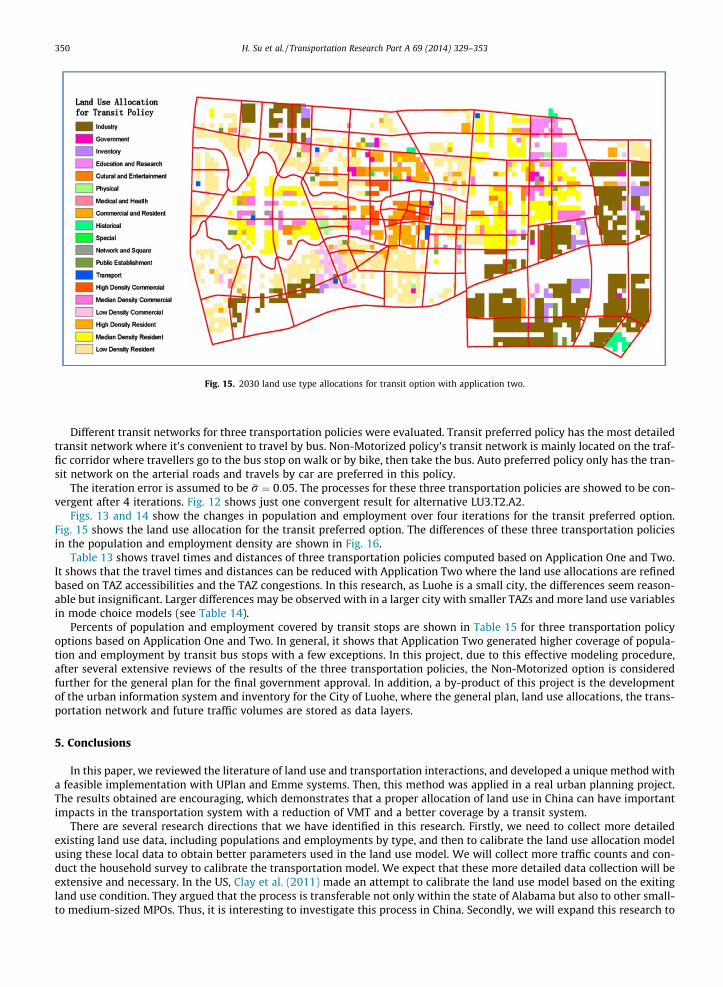
Fig. 15. 2030 land use type allocations for transit option with application two.
350 H. Su et al. / Transportation Research Part A 69 (2014) 329–353
Different transit networks for three transportation policies were evaluated. Transit preferred policy has the most detailedtransit network where it’s convenient to travel by bus. Non-Motorized policy’s transit network is mainly located on the traf-fic corridor where travellers go to the bus stop on walk or by bike, then take the bus. Auto preferred policy only has the tran-sit network on the arterial roads and travels by car are preferred in this policy.
The iteration error is assumed to be �r ¼ 0:05. The processes for these three transportation policies are showed to be con-vergent after 4 iterations. Fig. 12 shows just one convergent result for alternative LU3.T2.A2.
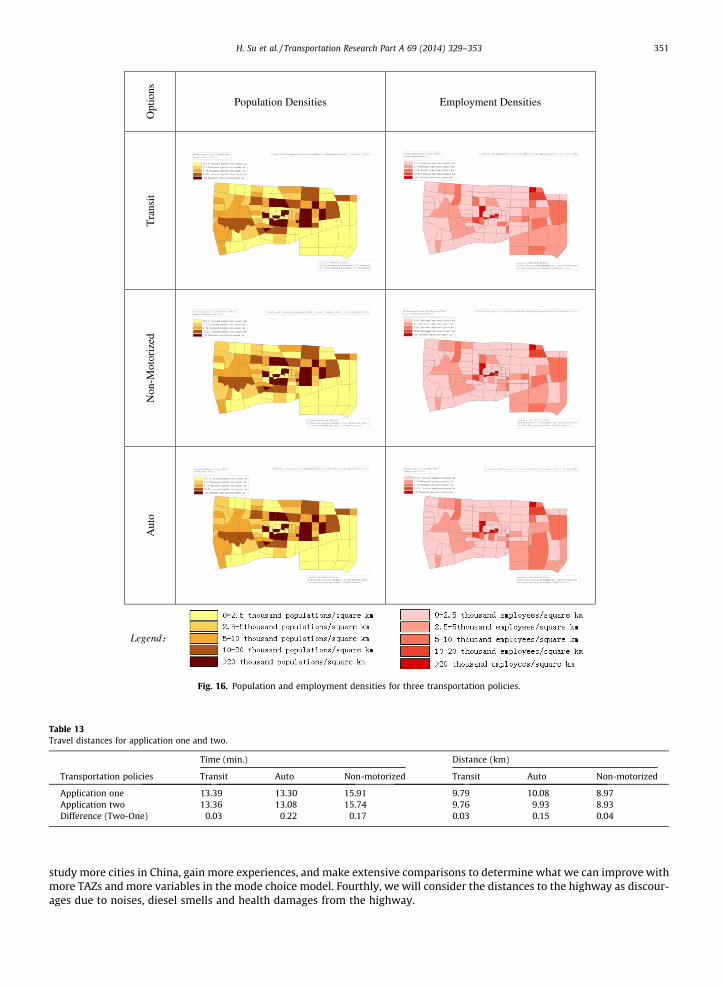
Figs. 13 and 14 show the changes in population and employment over four iterations for the transit preferred option.Fig. 15 shows the land use allocation for the transit preferred option. The differences of these three transportation policiesin the population and employment density are shown in Fig. 16.
Table 13 shows travel times and distances of three transportation policies computed based on Application One and Two.It shows that the travel times and distances can be reduced with Application Two where the land use allocations are refinedbased on TAZ accessibilities and the TAZ congestions. In this research, as Luohe is a small city, the differences seem reason-able but insignificant. Larger differences may be observed with in a larger city with smaller TAZs and more land use variablesin mode choice models (see Table 14).
Percents of population and employment covered by transit stops are shown in Table 15 for three transportation policyoptions based on Application One and Two. In general, it shows that Application Two generated higher coverage of popula-tion and employment by transit bus stops with a few exceptions. In this project, due to this effective modeling procedure,after several extensive reviews of the results of the three transportation policies, the Non-Motorized option is consideredfurther for the general plan for the final government approval. In addition, a by-product of this project is the developmentof the urban information system and inventory for the City of Luohe, where the general plan, land use allocations, the trans-portation network and future traffic volumes are stored as data layers.
5. Conclusions
In this paper, we reviewed the literature of land use and transportation interactions, and developed a unique method witha feasible implementation with UPlan and Emme systems. Then, this method was applied in a real urban planning project.The results obtained are encouraging, which demonstrates that a proper allocation of land use in China can have importantimpacts in the transportation system with a reduction of VMT and a better coverage by a transit system.
There are several research directions that we have identified in this research. Firstly, we need to collect more detailedexisting land use data, including populations and employments by type, and then to calibrate the land use allocation modelusing these local data to obtain better parameters used in the land use model. We will collect more traffic counts and con-duct the household survey to calibrate the transportation model. We expect that these more detailed data collection will beextensive and necessary. In the US, Clay et al. (2011) made an attempt to calibrate the land use model based on the exitingland use condition. They argued that the process is transferable not only within the state of Alabama but also to other small-to medium-sized MPOs. Thus, it is interesting to investigate this process in China. Secondly, we will expand this research to
Opt
ions
Population Densities Employment Densities
Tra
nsit
Non
-Mot
oriz
edA
uto
Legend
Fig. 16. Population and employment densities for three transportation policies.
Table 13Travel distances for application one and two.
Time (min.) Distance (km)
Transportation policies Transit Auto Non-motorized Transit Auto Non-motorized
Application one 13.39 13.30 15.91 9.79 10.08 8.97Application two 13.36 13.08 15.74 9.76 9.93 8.93Difference (Two-One) 0.03 0.22 0.17 0.03 0.15 0.04
H. Su et al. / Transportation Research Part A 69 (2014) 329–353 351
study more cities in China, gain more experiences, and make extensive comparisons to determine what we can improve withmore TAZs and more variables in the mode choice model. Fourthly, we will consider the distances to the highway as discour-ages due to noises, diesel smells and health damages from the highway.
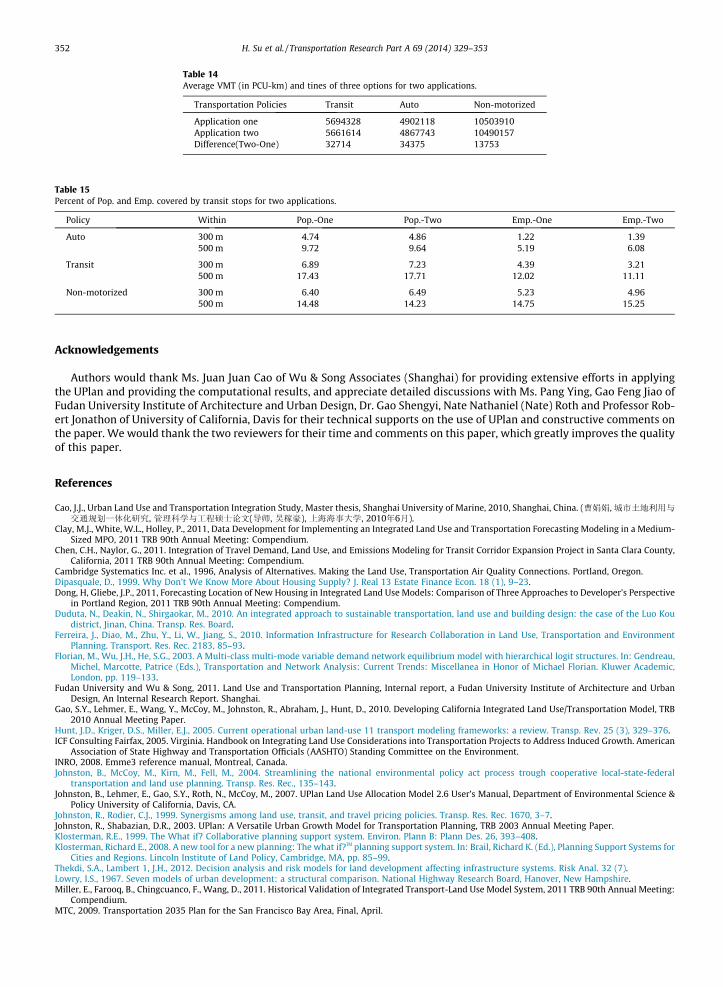
Table 14Average VMT (in PCU-km) and tines of three options for two applications.
Transportation Policies Transit Auto Non-motorized
Application one 5694328 4902118 10503910Application two 5661614 4867743 10490157Difference(Two-One) 32714 34375 13753
Table 15Percent of Pop. and Emp. covered by transit stops for two applications.
Policy Within Pop.-One Pop.-Two Emp.-One Emp.-Two
Auto 300 m 4.74 4.86 1.22 1.39500 m 9.72 9.64 5.19 6.08
Transit 300 m 6.89 7.23 4.39 3.21500 m 17.43 17.71 12.02 11.11
Non-motorized 300 m 6.40 6.49 5.23 4.96500 m 14.48 14.23 14.75 15.25
352 H. Su et al. / Transportation Research Part A 69 (2014) 329–353
Acknowledgements
Authors would thank Ms. Juan Juan Cao of Wu & Song Associates (Shanghai) for providing extensive efforts in applyingthe UPlan and providing the computational results, and appreciate detailed discussions with Ms. Pang Ying, Gao Feng Jiao ofFudan University Institute of Architecture and Urban Design, Dr. Gao Shengyi, Nate Nathaniel (Nate) Roth and Professor Rob-ert Jonathon of University of California, Davis for their technical supports on the use of UPlan and constructive comments onthe paper. We would thank the two reviewers for their time and comments on this paper, which greatly improves the qualityof this paper.
References
Cao, J.J., Urban Land Use and Transportation Integration Study, Master thesis, Shanghai University of Marine, 2010, Shanghai, China. (曹娟娟,城市土地利用与
交通规划一体化研究, 管理科学与工程硕士论文(导师, 吴稼豪), 上海海事大学, 2010年6月).Clay, M.J., White, W.L., Holley, P., 2011, Data Development for Implementing an Integrated Land Use and Transportation Forecasting Modeling in a Medium-
Sized MPO, 2011 TRB 90th Annual Meeting: Compendium.Chen, C.H., Naylor, G., 2011. Integration of Travel Demand, Land Use, and Emissions Modeling for Transit Corridor Expansion Project in Santa Clara County,
California, 2011 TRB 90th Annual Meeting: Compendium.Cambridge Systematics Inc. et al., 1996, Analysis of Alternatives. Making the Land Use, Transportation Air Quality Connections. Portland, Oregon.Dipasquale, D., 1999. Why Don’t We Know More About Housing Supply? J. Real 13 Estate Finance Econ. 18 (1), 9–23.Dong, H, Gliebe, J.P., 2011, Forecasting Location of New Housing in Integrated Land Use Models: Comparison of Three Approaches to Developer’s Perspective
in Portland Region, 2011 TRB 90th Annual Meeting: Compendium.Duduta, N., Deakin, N., Shirgaokar, M., 2010. An integrated approach to sustainable transportation, land use and building design: the case of the Luo Kou
district, Jinan, China. Transp. Res. Board.Ferreira, J., Diao, M., Zhu, Y., Li, W., Jiang, S., 2010. Information Infrastructure for Research Collaboration in Land Use, Transportation and Environment
Planning. Transport. Res. Rec. 2183, 85–93.Florian, M., Wu, J.H., He, S.G., 2003. A Multi-class multi-mode variable demand network equilibrium model with hierarchical logit structures. In: Gendreau,
Michel, Marcotte, Patrice (Eds.), Transportation and Network Analysis: Current Trends: Miscellanea in Honor of Michael Florian. Kluwer Academic,London, pp. 119–133.
Fudan University and Wu & Song, 2011. Land Use and Transportation Planning, Internal report, a Fudan University Institute of Architecture and UrbanDesign, An Internal Research Report. Shanghai.
Gao, S.Y., Lehmer, E., Wang, Y., McCoy, M., Johnston, R., Abraham, J., Hunt, D., 2010. Developing California Integrated Land Use/Transportation Model, TRB2010 Annual Meeting Paper.
Hunt, J.D., Kriger, D.S., Miller, E.J., 2005. Current operational urban land-use 11 transport modeling frameworks: a review. Transp. Rev. 25 (3), 329–376.ICF Consulting Fairfax, 2005. Virginia. Handbook on Integrating Land Use Considerations into Transportation Projects to Address Induced Growth. American
Association of State Highway and Transportation Officials (AASHTO) Standing Committee on the Environment.INRO, 2008. Emme3 reference manual, Montreal, Canada.Johnston, B., McCoy, M., Kirn, M., Fell, M., 2004. Streamlining the national environmental policy act process trough cooperative local-state-federal
transportation and land use planning. Transp. Res. Rec., 135–143.Johnston, B., Lehmer, E., Gao, S.Y., Roth, N., McCoy, M., 2007. UPlan Land Use Allocation Model 2.6 User’s Manual, Department of Environmental Science &
Policy University of California, Davis, CA.Johnston, R., Rodier, C.J., 1999. Synergisms among land use, transit, and travel pricing policies. Transp. Res. Rec. 1670, 3–7.Johnston, R., Shabazian, D.R., 2003. UPlan: A Versatile Urban Growth Model for Transportation Planning, TRB 2003 Annual Meeting Paper.Klosterman, R.E., 1999. The What if? Collaborative planning support system. Environ. Plann B: Plann Des. 26, 393–408.Klosterman, Richard E., 2008. A new tool for a new planning: The what if?TM planning support system. In: Brail, Richard K. (Ed.), Planning Support Systems for
Cities and Regions. Lincoln Institute of Land Policy, Cambridge, MA, pp. 85–99.Thekdi, S.A., Lambert 1, J.H., 2012. Decision analysis and risk models for land development affecting infrastructure systems. Risk Anal. 32 (7).Lowry, I.S., 1967. Seven models of urban development: a structural comparison. National Highway Research Board, Hanover, New Hampshire.Miller, E., Farooq, B., Chingcuanco, F., Wang, D., 2011. Historical Validation of Integrated Transport-Land Use Model System, 2011 TRB 90th Annual Meeting:
Compendium.MTC, 2009. Transportation 2035 Plan for the San Francisco Bay Area, Final, April.
H. Su et al. / Transportation Research Part A 69 (2014) 329–353 353
Qu, D.Y., Wang, W., Wang, D.H., 1999. Urban Land Use and Transportation Planning System Analysis, Urban Planning, P. 44–45, No., 6. (曲大义, 王炜, 王殿海,城市土地利用与交通规划系统分析.城市规划, 1999年第6期, 44–45).
Rodier, C., 2005. Verifying the accuracy of land use models used in transportation and air quality planning: a case study in the Sacramento, CaliforniaRegion. Mineta Transportation Institute, San Jose State University.
Waddell, P., 2002. UrbanSim: modeling urban development for land use. Transp. Environ. Plann. J. Am. Plann. Assoc. 68 (3), 297–314.Waddella, P., Ulfarssonb, G.F., Franklinc, J.P., Lobbd, J., 2007. Incorporating land use in metropolitan transportation planning. Transp. Res. Part A: Policy Pract.
41 (5), 382–410.Walker, W.T., Gao, S.Y., Johnston, R.A., 2007. UPlan: geographic information system as framework for integrated land use planning model. J. Transp. Res.
Board 1994, 117–127.Wang, L., Waddell Paul, Outwater, M.L., 2011. Incremental Integration of Land Use and Activity-Based Travel Modeling: Workplace Choices and Travel
Demand, 2011 TRB 90th Annual Meeting: Compendium.White, W., 2010. Examples of Land Use and Integrated Transport/Land Use Models in Florida and Elsewhere in the United States. A Case Study Synopsis.
Annapolis, MD.Wu, J.H., Florian, M., He, S.G., 2006. An algorithm for multi-class network equilibrium problem in PCE of trucks: application to The SCAG travel demand
model. Transportmetrica 2 (1), 1–10.Yang, J., 2010. Spatial and Social Characteristics of Urban Transportation in Beijing. In: The 89th Transportation Research Board (TRB) Annual Meeting,
Washington, D.C. January 10–14.Wang, Y., Ciommo, F.D., Kaplan, S., 2014. An Integrated Transport Planning Framework Involving a Combined Utility-Regret Approach, Presented at the 93rd
Annual Meeting of the Transportation Research Board, January 12–16, 2014, Washington D.C., and submitted for publication in the TransportationResearch Record (TRR): Journal of the Transportation Research Board.
Zhao, L., Zhong-Ren Peng, Z.R., 2010. An Integrated Bi-Level Model to Explore the Interaction between Land Use Allocation and Transportation. In: The 89thTransportation Research Board (TRB) Annual Meeting, Washington, D.C. January 10–14.