a knowledge-based automated cropland mapping … · a knowledge-based automated cropland mapping...
TRANSCRIPT
U.S. Geological Survey
U.S. Department of Interior
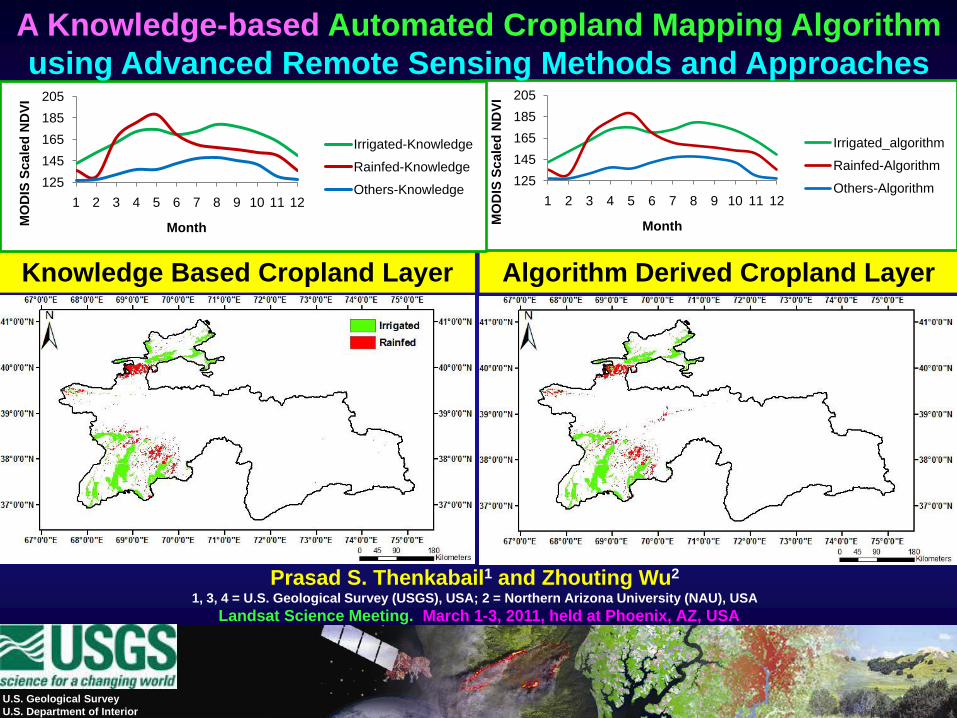
Knowledge Based Cropland Layer Algorithm Derived Cropland Layer
Prasad S. Thenkabail1 and Zhouting Wu2
1, 3, 4 = U.S. Geological Survey (USGS), USA; 2 = Northern Arizona University (NAU), USA
Landsat Science Meeting. March 1-3, 2011, held at Phoenix, AZ, USA
125
145
165
185
205
1 2 3 4 5 6 7 8 9 10 11 12
MO
DIS
Sc
ale
d N
DV
I
Month
Irrigated_algorithm
Rainfed-Algorithm
Others-Algorithm125
145
165
185
205
1 2 3 4 5 6 7 8 9 10 11 12
MO
DIS
Sc
ale
d N
DV
I
Month
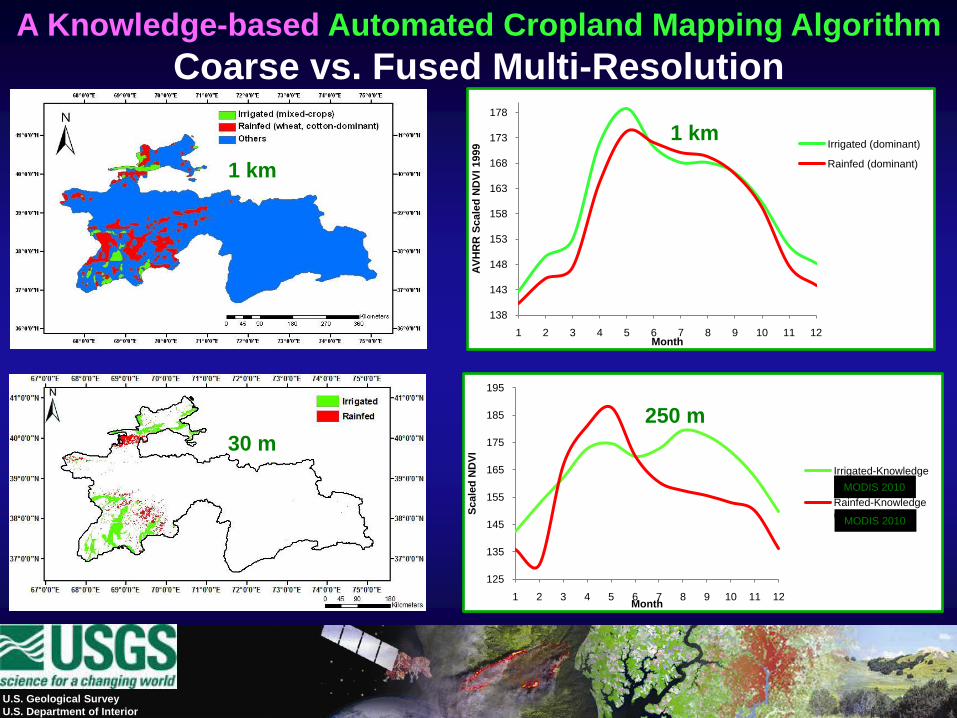
Irrigated-Knowledge
Rainfed-Knowledge
Others-Knowledge
A Knowledge-based Automated Cropland Mapping Algorithm
using Advanced Remote Sensing Methods and Approaches

U.S. Department of the Interior
U.S. Geological Survey
Importance, Need, and Scope
U.S. Geological Survey
U.S. Department of Interior
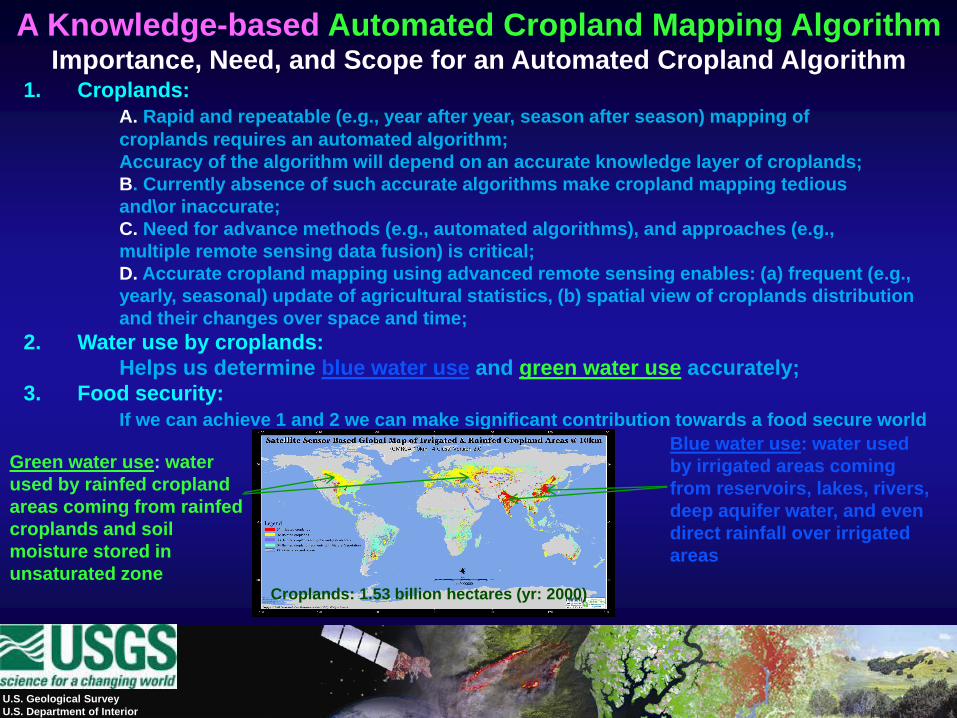
A Knowledge-based Automated Cropland Mapping Algorithm Importance, Need, and Scope for an Automated Cropland Algorithm
1. Croplands:
A. Rapid and repeatable (e.g., year after year, season after season) mapping of
croplands requires an automated algorithm;
Accuracy of the algorithm will depend on an accurate knowledge layer of croplands;
B. Currently absence of such accurate algorithms make cropland mapping tedious
and\or inaccurate;
C. Need for advance methods (e.g., automated algorithms), and approaches (e.g.,
multiple remote sensing data fusion) is critical;
D. Accurate cropland mapping using advanced remote sensing enables: (a) frequent (e.g.,
yearly, seasonal) update of agricultural statistics, (b) spatial view of croplands distribution
and their changes over space and time;
2. Water use by croplands:
Helps us determine blue water use and green water use accurately;
3. Food security:
If we can achieve 1 and 2 we can make significant contribution towards a food secure world
Blue water use: water used
by irrigated areas coming
from reservoirs, lakes, rivers,
deep aquifer water, and even
direct rainfall over irrigated
areas
Green water use: water
used by rainfed cropland
areas coming from rainfed
croplands and soil
moisture stored in
unsaturated zoneCroplands: 1.53 billion hectares (yr: 2000)
U.S. Geological Survey
U.S. Department of Interior
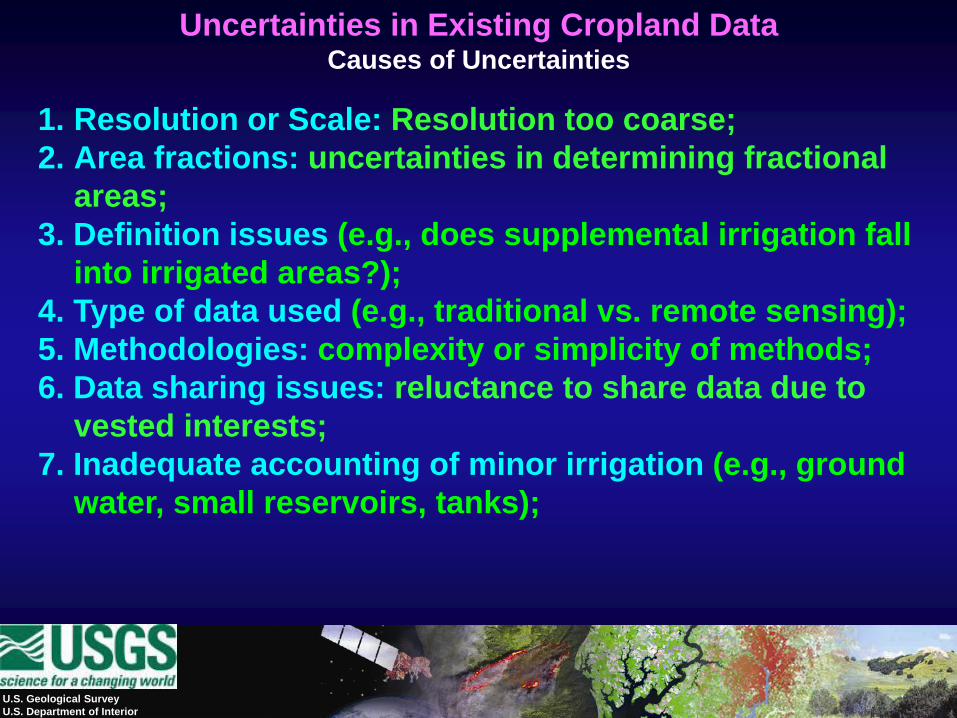
1. Resolution or Scale: Resolution too coarse;
2. Area fractions: uncertainties in determining fractional
areas;
3. Definition issues (e.g., does supplemental irrigation fall
into irrigated areas?);
4. Type of data used (e.g., traditional vs. remote sensing);
5. Methodologies: complexity or simplicity of methods;
6. Data sharing issues: reluctance to share data due to
vested interests;
7. Inadequate accounting of minor irrigation (e.g., ground
water, small reservoirs, tanks);
Uncertainties in Existing Cropland Data Causes of Uncertainties
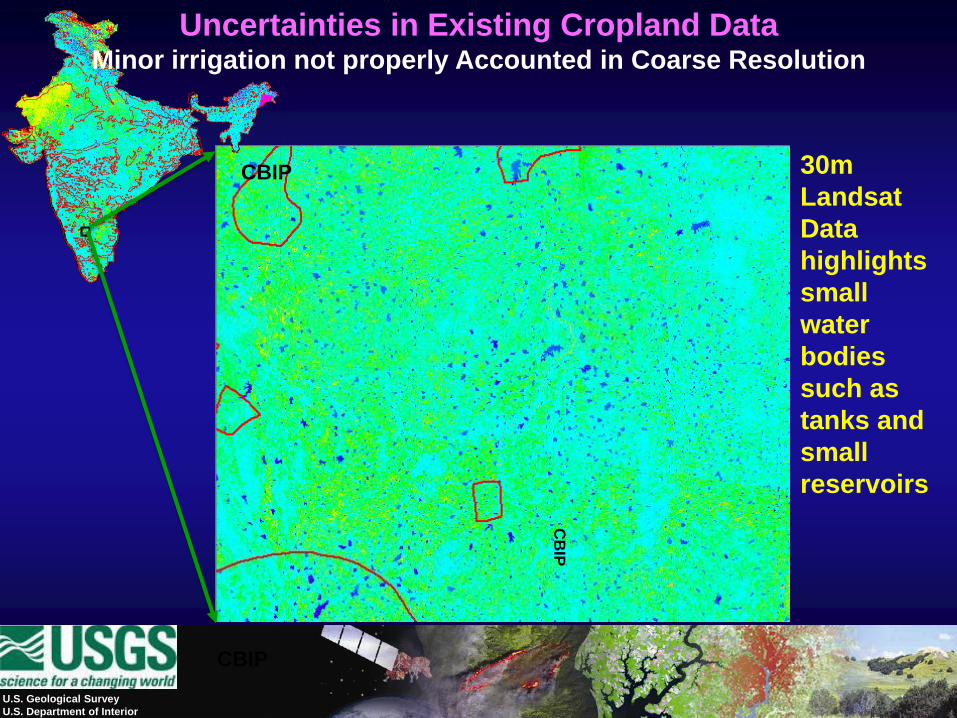
CBIP
CBIP
CB
IP
U.S. Geological Survey
U.S. Department of Interior
30m
Landsat
Data
highlights
small
water
bodies
such as
tanks and
small
reservoirs
Uncertainties in Existing Cropland Data Minor irrigation not properly Accounted in Coarse Resolution
U.S. Geological Survey
U.S. Department of Interior
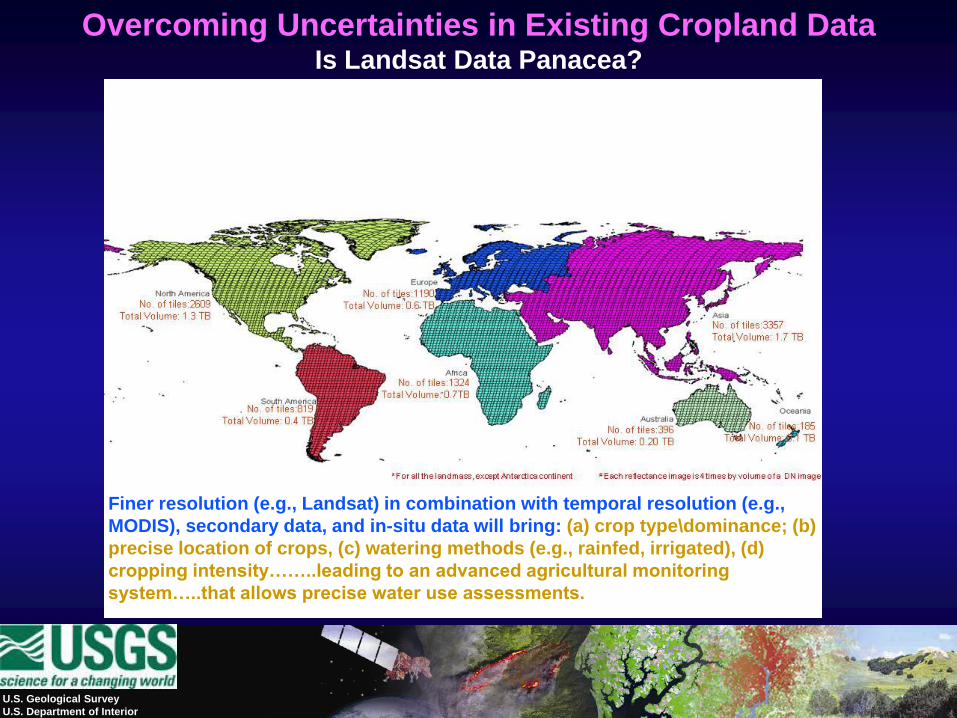
Finer resolution (e.g., Landsat) in combination with temporal resolution (e.g.,
MODIS), secondary data, and in-situ data will bring: (a) crop type\dominance; (b)
precise location of crops, (c) watering methods (e.g., rainfed, irrigated), (d)
cropping intensity……..leading to an advanced agricultural monitoring
system…..that allows precise water use assessments.
Overcoming Uncertainties in Existing Cropland Data Is Landsat Data Panacea?

U.S. Department of the Interior
U.S. Geological Survey
Overarching Goal
U.S. Geological Survey
U.S. Department of Interior
A Knowledge-based Automated Cropland Mapping Algorithm
Overarching Goal
The Overarching Goal
of this study is to develop
an Automated Algorithm, that is Knowledge-Based,
to Map Irrigated and Rainfed Cropland Areas
of a Country, Continent, and The World using Advanced Remote Sensing Methods and Approaches
This Presentation will Focus on a Country and
Demonstrate the Working of such an Algorithm
U.S. Department of the Interior
U.S. Geological Survey
A New Strategy for Mapping Croplands
Accurately and Rapidly
U.S. Geological Survey
U.S. Department of Interior
A Knowledge-based Automated Cropland Mapping Algorithm
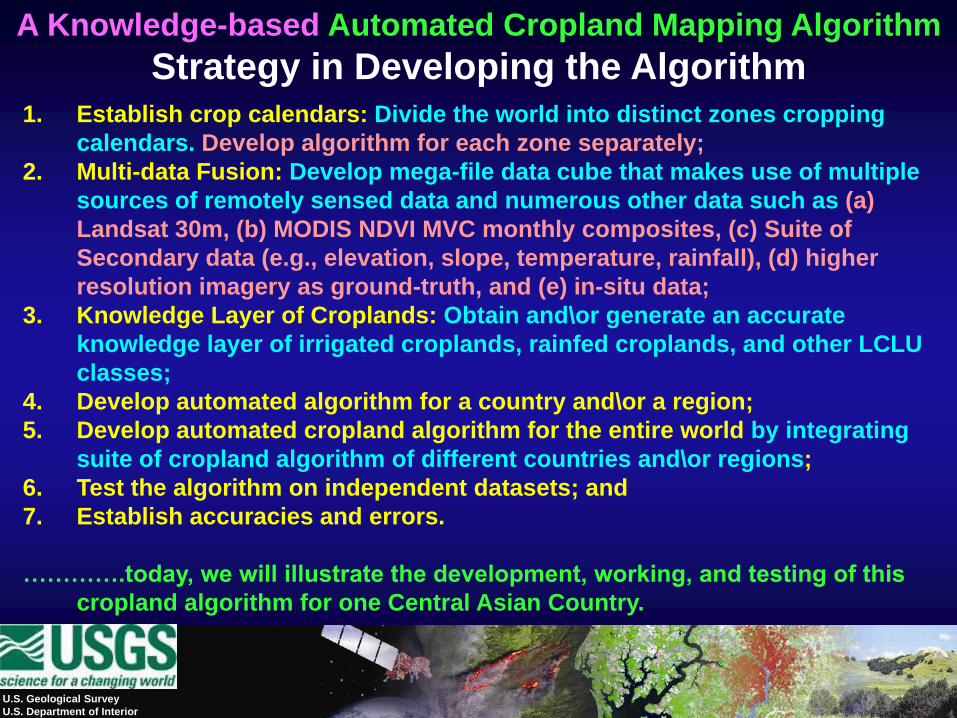
Strategy in Developing the Algorithm1. Establish crop calendars: Divide the world into distinct zones cropping
calendars. Develop algorithm for each zone separately;
2. Multi-data Fusion: Develop mega-file data cube that makes use of multiple
sources of remotely sensed data and numerous other data such as (a)
Landsat 30m, (b) MODIS NDVI MVC monthly composites, (c) Suite of
Secondary data (e.g., elevation, slope, temperature, rainfall), (d) higher
resolution imagery as ground-truth, and (e) in-situ data;
3. Knowledge Layer of Croplands: Obtain and\or generate an accurate
knowledge layer of irrigated croplands, rainfed croplands, and other LCLU
classes;
4. Develop automated algorithm for a country and\or a region;
5. Develop automated cropland algorithm for the entire world by integrating
suite of cropland algorithm of different countries and\or regions;
6. Test the algorithm on independent datasets; and
7. Establish accuracies and errors.
………….today, we will illustrate the development, working, and testing of this
cropland algorithm for one Central Asian Country.
U.S. Geological Survey
U.S. Department of Interior
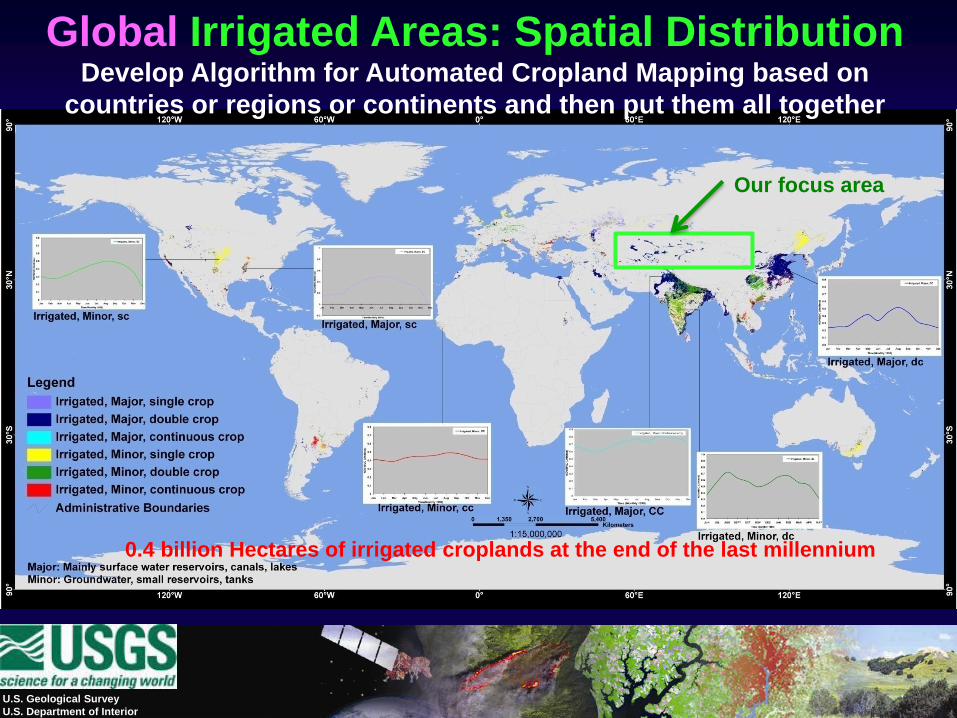
0.4 billion Hectares of irrigated croplands at the end of the last millennium
Global Irrigated Areas: Spatial DistributionDevelop Algorithm for Automated Cropland Mapping based on
countries or regions or continents and then put them all together
Our focus area
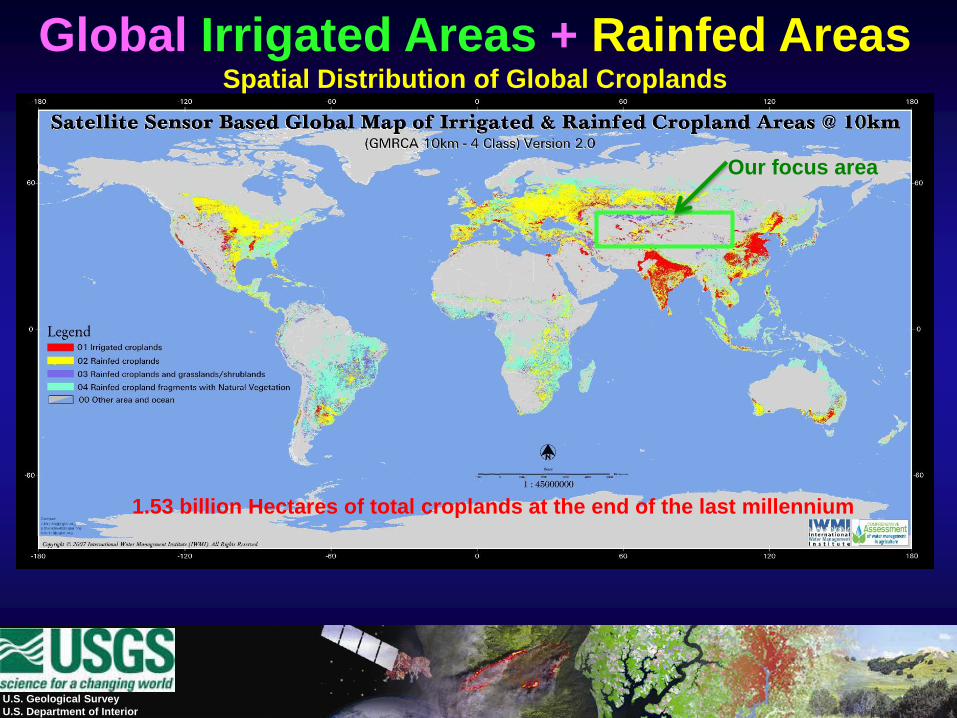
Global Irrigated Areas + Rainfed AreasSpatial Distribution of Global Croplands
1.53 billion Hectares of total croplands at the end of the last millennium
U.S. Geological Survey
U.S. Department of Interior
Our focus area
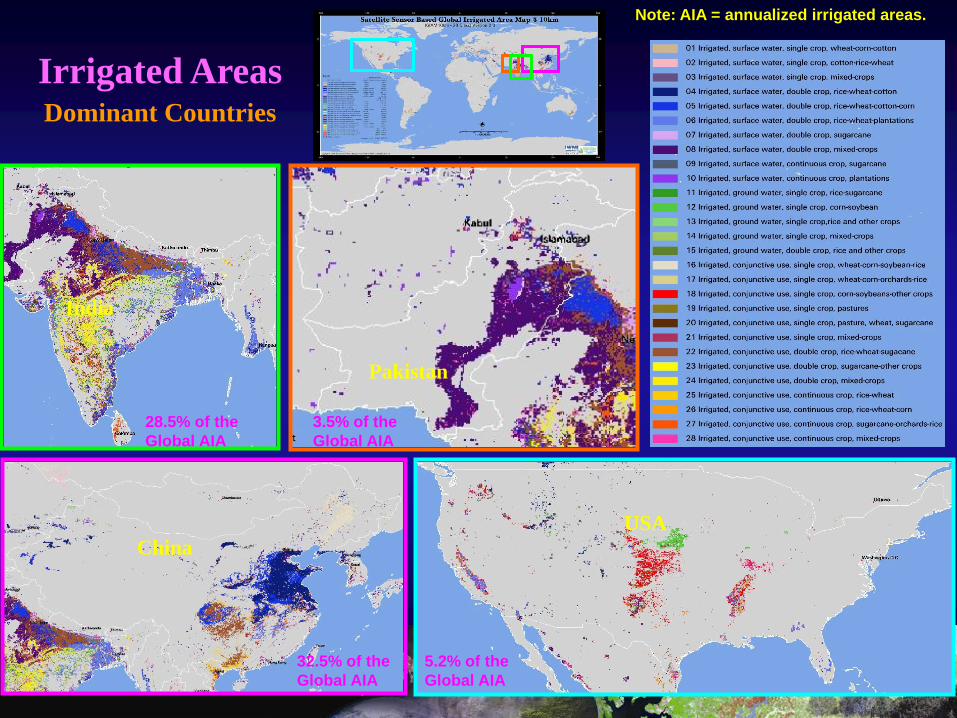
Pakistan
India
USA
China
Irrigated AreasDominant Countries
28.5% of the
Global AIA
3.5% of the
Global AIA
32.5% of the
Global AIA
5.2% of the
Global AIA
Note: AIA = annualized irrigated areas.
U.S. Geological Survey
U.S. Department of Interior
125
135
145
155
165
175
185
195
1 2 3 4 5 6 7 8 9 10 11 12
Scale
d N
DV
I
Month
Irrigated-Knowledge (MODIS 2009)
Rainfed-Knowledge (MODIS 2009)
138
143
148
153
158
163
168
173
178
1 2 3 4 5 6 7 8 9 10 11 12
AV
HR
R S
cale
d N
DV
I 1999
Month
Irrigated (dominant)
Rainfed (dominant)
A Knowledge-based Automated Cropland Mapping Algorithm
Coarse vs. Fused Multi-Resolution
1 km
1 km
30 m
250 m
MODIS 2010
MODIS 2010
U.S. Geological Survey
U.S. Department of Interior
0
25
50
75
0 10 20
HY675
HY
91
0
barley
wheat
0
10
20
30
40
50
400 460 520 580 640 700 760 820 880 940 1000
Wavelength (nm)
Ref
lect
an
ce (
per
cen
t)
Y. sec. Forest
P. forest
Slash&Burn
Raphia palm
Bamboo
P. Africana
0
0.1
0.2
0.3
0.4
0.5
300 400 500 600 700 800 900 1000
wavelength (nanometers)
refl
ecta
nce f
acto
r
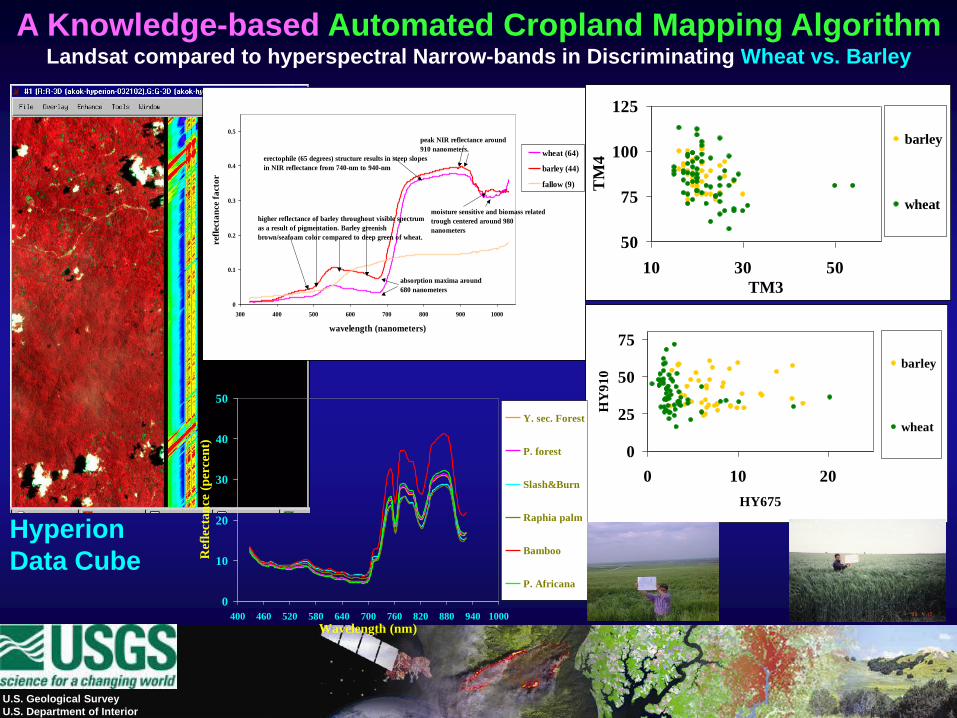
wheat (64)
barley (44)
fallow (9)
higher reflectance of barley throughout visible spectrum
as a result of pigmentation. Barley greenish
brown/seafoam color compared to deep green of wheat.
peak NIR reflectance around
910 nanometers.
absorption maxima around
680 nanometers
moisture sensitive and biomass related
trough centered around 980
nanometers
erectophile (65 degrees) structure results in steep slopes
in NIR reflectance from 740-nm to 940-nm
50
75
100
125
10 30 50
TM3
TM
4
barley
wheat
A Knowledge-based Automated Cropland Mapping Algorithm Landsat compared to hyperspectral Narrow-bands in Discriminating Wheat vs. Barley
Hyperion
Data Cube
0
10
20
30
40
50
400 500 600 700 800 900 1000Wavelength (nm)
Refl
ecta
nce (
percen
t)
Y. sec. Forest
P. forest
Slash&Burn
Raphia palm
Bamboo
P. Africana
0
10
20
30
40
50
400 900 1400 1900 2400
Wavelength (nm)
Refl
ecta
nce (
percen
t)
Y. sec. Forest
P. forest
Slash&Burn
Raphia palm
Bamboo
P. Africana
0
10
20
30
40
50
400 900 1400 1900 2400Wavelength (nm)
Refl
ecta
nce (
percen
t)
Y. sec. Forest
P. forest
Slash&Burn
Raphia palm
Bamboo
P. Africana 0
10
20
30
40
50
400 900 1400 1900 2400Wavelength (nm)
Refl
ecta
nce (
percen
t)
Y. sec. Forest
P. forest
Slash&Burn
Raphia palm
Bamboo
P. Africana
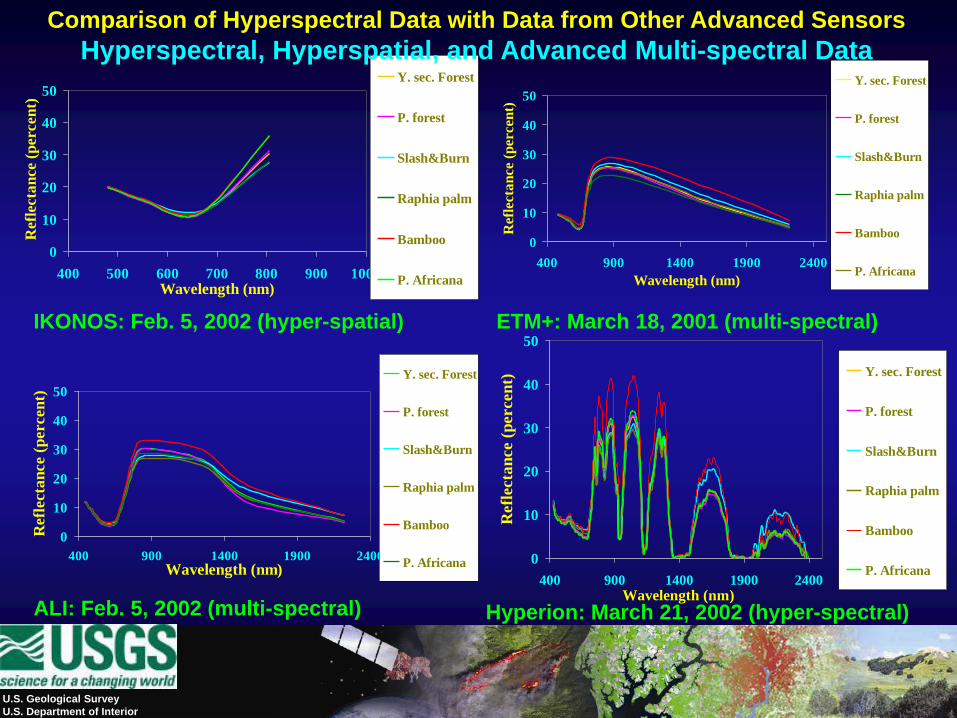
IKONOS: Feb. 5, 2002 (hyper-spatial)
ALI: Feb. 5, 2002 (multi-spectral)
ETM+: March 18, 2001 (multi-spectral)
Hyperion: March 21, 2002 (hyper-spectral)
Comparison of Hyperspectral Data with Data from Other Advanced Sensors
Hyperspectral, Hyperspatial, and Advanced Multi-spectral Data
U.S. Geological Survey
U.S. Department of Interior
0
0.2
0.4
0.6
0.8
1
1 49 97 145
193
241
289
337 17 65 11
316
120
925
730
535
3
Julian Date
ND
VI V
alu
e
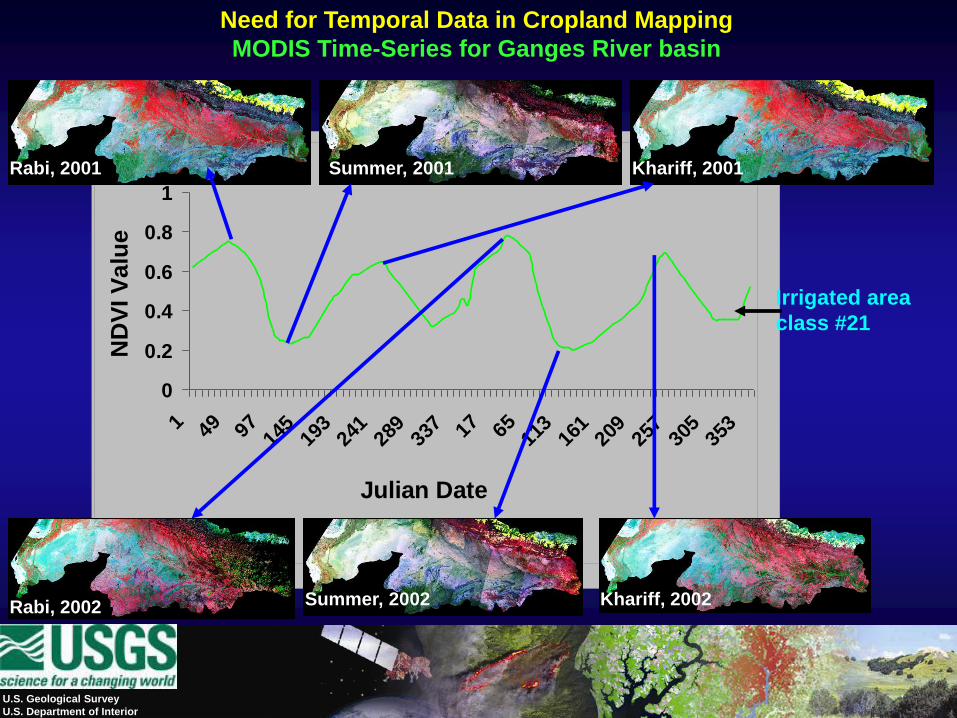
Rabi, 2001 Summer, 2001 Khariff, 2001
Rabi, 2002 Summer, 2002 Khariff, 2002
Irrigated area
class #21
Need for Temporal Data in Cropland Mapping
MODIS Time-Series for Ganges River basin
U.S. Geological Survey
U.S. Department of Interior
0
0.05
0.1
0.15
0.2
0.25
0.3
0.35
0.4
0.45
0.5
1 2 3 4 5 6 7 8 9 10 11 12
ND
VI
Irrigated cropland
-0.08
-0.06
-0.04
-0.02
0
0.02
0.04
0.06
1 2 3 4 5 6 7 8 9 10 11 12
ND
VI
Months
Tundra
-0.1
0
0.1
0.2
0.3
0.4
0.5
0.6
1 2 3 4 5 6 7 8 9 10 11 12
ND
VI
Rainfed cropland
0
0.1
0.2
0.3
0.4
0.5
0.6
1 2 3 4 5 6 7 8 9 10 11 12
ND
VI
Months
Forest
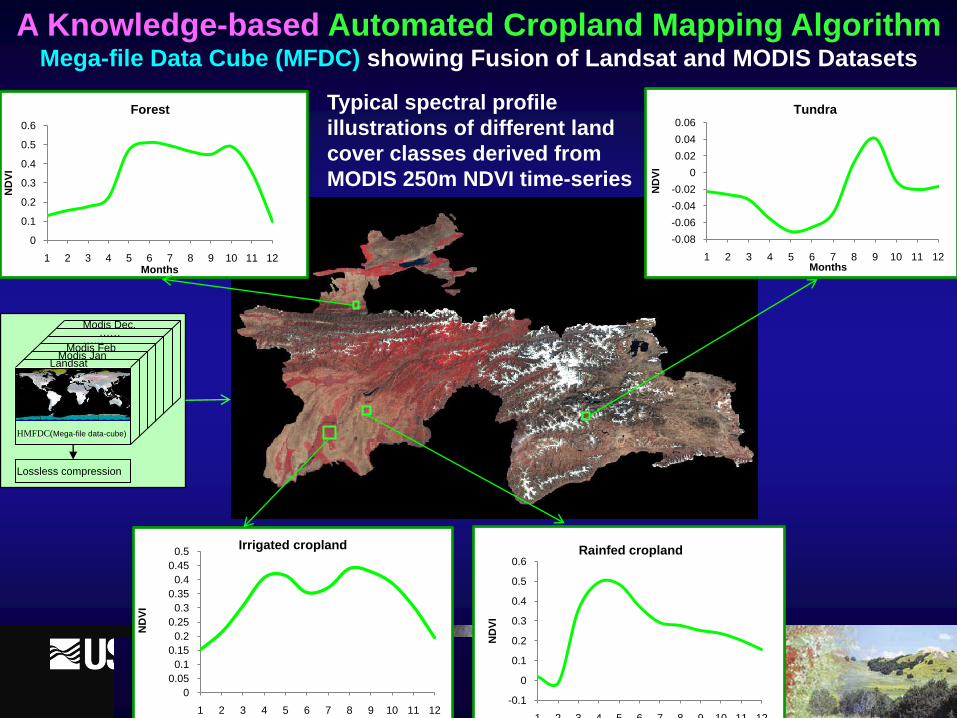
HMFDC(Mega-file data-cube)
LandsatModis Jan
Modis Feb
Modis Dec.
…………
Lossless compression
Typical spectral profile
illustrations of different land
cover classes derived from
MODIS 250m NDVI time-series
A Knowledge-based Automated Cropland Mapping Algorithm Mega-file Data Cube (MFDC) showing Fusion of Landsat and MODIS Datasets
U.S. Department of the Interior
U.S. Geological Survey
Datasets used to Generate
Knowledge Layer (year 2005)
U.S. Geological Survey
U.S. Department of Interior
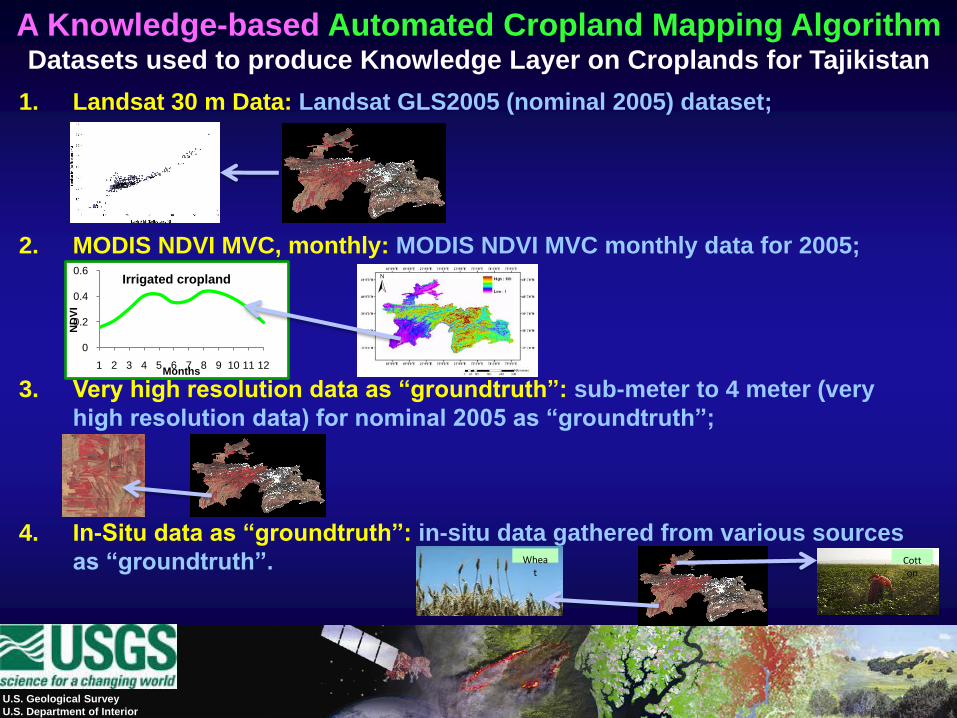
A Knowledge-based Automated Cropland Mapping Algorithm Datasets used to produce Knowledge Layer on Croplands for Tajikistan
1. Landsat 30 m Data: Landsat GLS2005 (nominal 2005) dataset;
2. MODIS NDVI MVC, monthly: MODIS NDVI MVC monthly data for 2005;
3. Very high resolution data as “groundtruth”: sub-meter to 4 meter (very
high resolution data) for nominal 2005 as “groundtruth”;
4. In-Situ data as “groundtruth”: in-situ data gathered from various sources
as “groundtruth”.
0
0.2
0.4
0.6
1 2 3 4 5 6 7 8 9 10 11 12
ND
VI
Months
Irrigated cropland
Wheat
Cotton
U.S. Geological Survey
U.S. Department of Interior
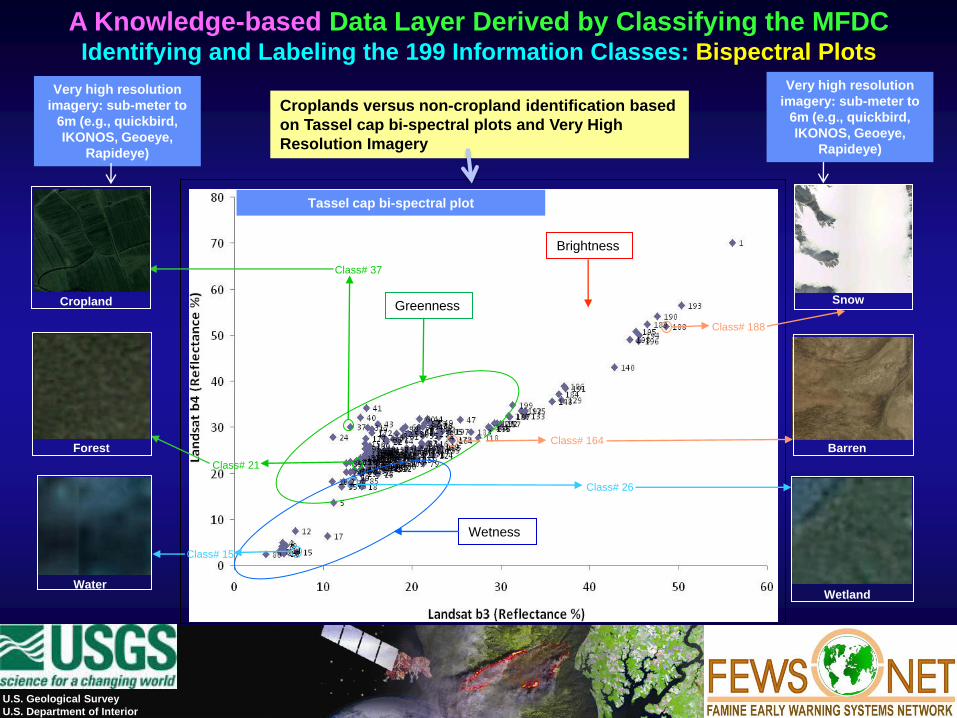
Croplands versus non-cropland identification based
on Tassel cap bi-spectral plots and Very High
Resolution Imagery
Very high resolution
imagery: sub-meter to
6m (e.g., quickbird,
IKONOS, Geoeye,
Rapideye)
WaterWetland
Greenness
Brightness
Wetness
Class# 21
Class# 37
Class# 26
Class# 15
Class# 188
Class# 164Barren
SnowCropland
Forest
Very high resolution
imagery: sub-meter to
6m (e.g., quickbird,
IKONOS, Geoeye,
Rapideye)
Tassel cap bi-spectral plot
A Knowledge-based Data Layer Derived by Classifying the MFDC Identifying and Labeling the 199 Information Classes: Bispectral Plots
Multiple measures used in
algorithms to identify and label
agricultural cropland classes
-0.1
-0.08
-0.06
-0.04
-0.02
0
0.02
0.04
0.06
1 2 3 4 5 6 7 8 9 10 11 12
ND
VI
Months
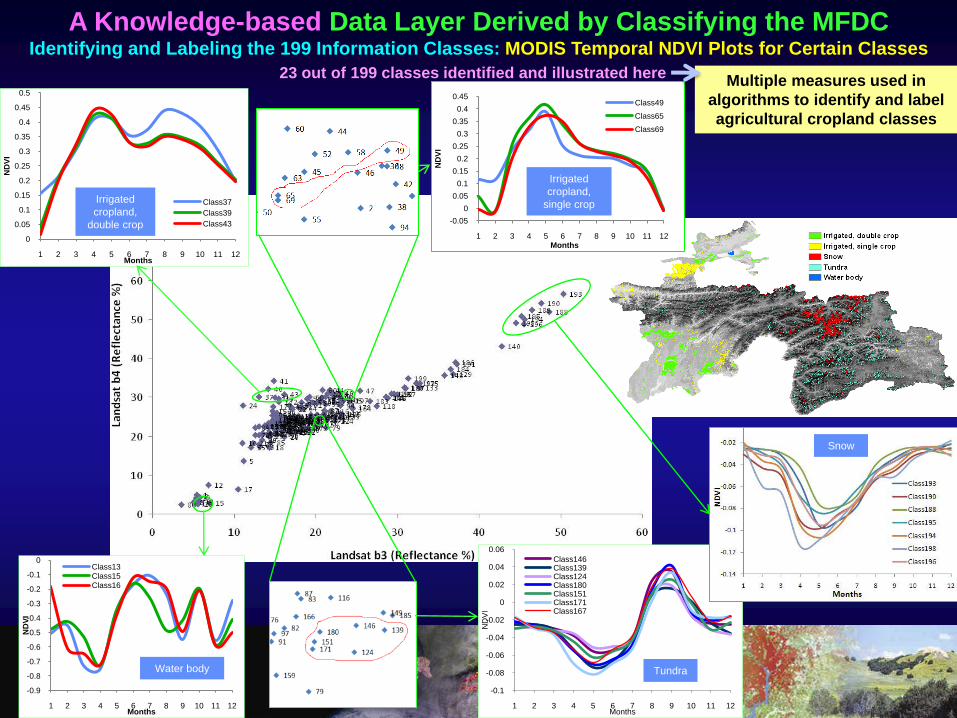
Class146Class139Class124Class180Class151Class171Class167
Tundra
0
0.05
0.1
0.15
0.2
0.25
0.3
0.35
0.4
0.45
0.5
1 2 3 4 5 6 7 8 9 10 11 12
ND
VI
Months
Class37
Class39
Class43
Irrigated
cropland,
double crop
-0.9
-0.8
-0.7
-0.6
-0.5
-0.4
-0.3
-0.2
-0.1
0
1 2 3 4 5 6 7 8 9 10 11 12
ND
VI
Months
Class13Class15Class16
Water body
Snow
-0.05
0
0.05
0.1
0.15
0.2
0.25
0.3
0.35
0.4
0.45
1 2 3 4 5 6 7 8 9 10 11 12
ND
VI
Months
Class49
Class65
Class69
Irrigated
cropland,
single crop
23 out of 199 classes identified and illustrated here
A Knowledge-based Data Layer Derived by Classifying the MFDC Identifying and Labeling the 199 Information Classes: MODIS Temporal NDVI Plots for Certain Classes
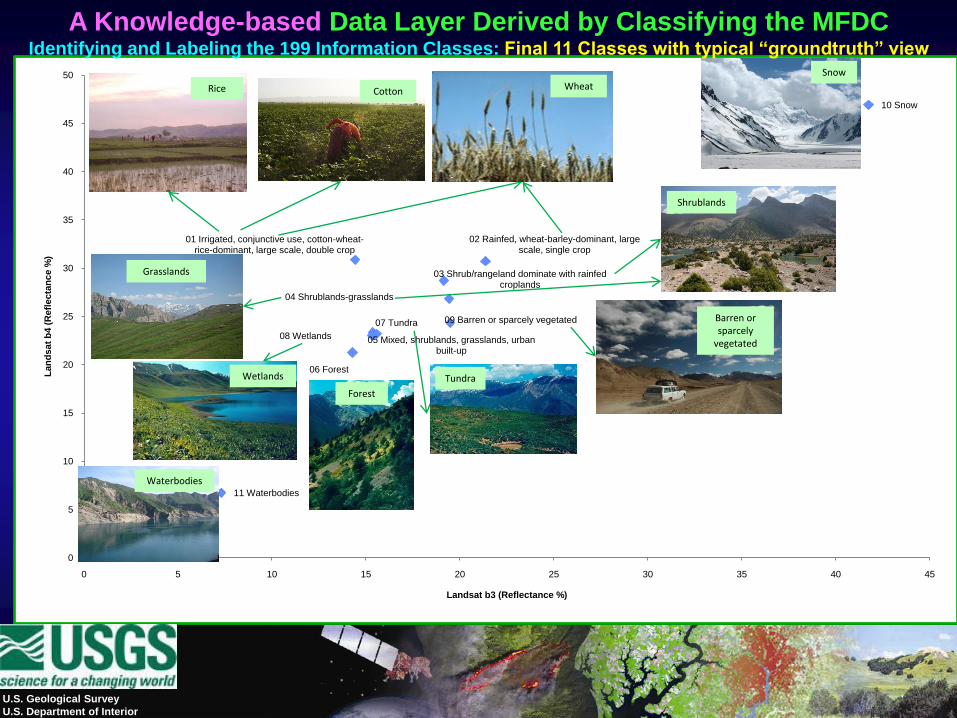
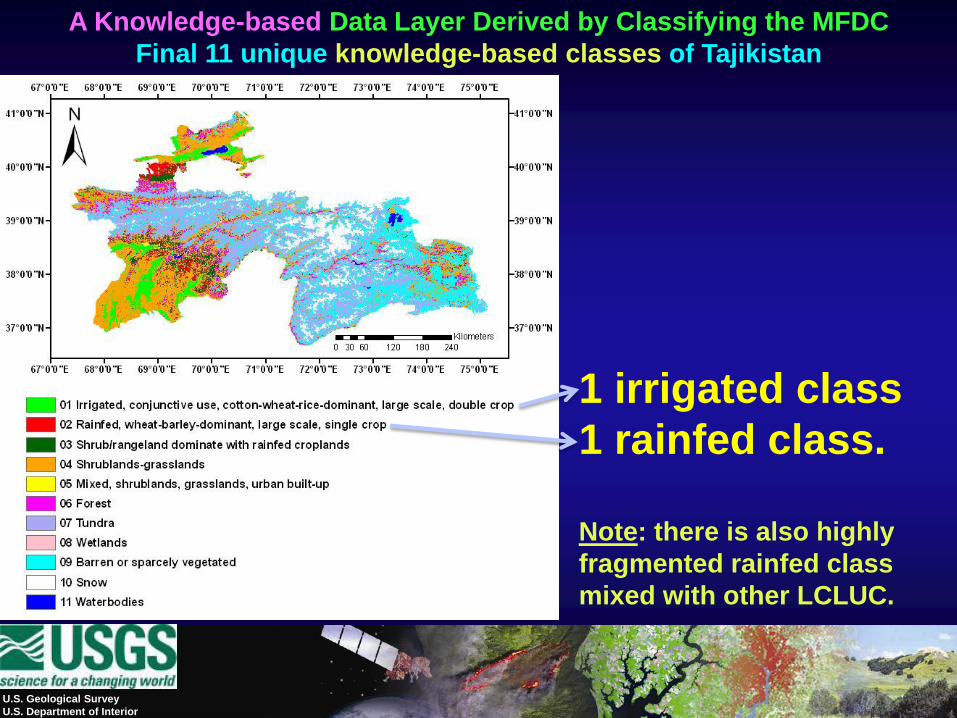
01 Irrigated, conjunctive use, cotton-wheat-rice-dominant, large scale, double crop
02 Rainfed, wheat-barley-dominant, large scale, single crop
03 Shrub/rangeland dominate with rainfed croplands
04 Shrublands-grasslands
05 Mixed, shrublands, grasslands, urban built-up
06 Forest
07 Tundra
08 Wetlands
09 Barren or sparcely vegetated
10 Snow
11 Waterbodies
0
5
10
15
20
25
30
35
40
45
50
0 5 10 15 20 25 30 35 40 45
La
nd
sa
t b
4 (
Re
fle
cta
nc
e %
)
Landsat b3 (Reflectance %)
Wetlands
U.S. Geological Survey
U.S. Department of Interior
WheatRice Cotton
Snow
Shrublands
Forest
Tundra
Waterbodies
Grasslands
Barren or sparcely
vegetated
A Knowledge-based Data Layer Derived by Classifying the MFDC Identifying and Labeling the 199 Information Classes: Final 11 Classes with typical “groundtruth” view
U.S. Geological Survey
U.S. Department of Interior
1 irrigated class
1 rainfed class.
Note: there is also highly
fragmented rainfed class
mixed with other LCLUC.
A Knowledge-based Data Layer Derived by Classifying the MFDC
Final 11 unique knowledge-based classes of Tajikistan
-0.1
0
0.1
0.2
0.3
0.4
0.5
0.6
1 2 3 4 5 6 7 8 9 10 11 12
Mo
dis
ND
VI
Months
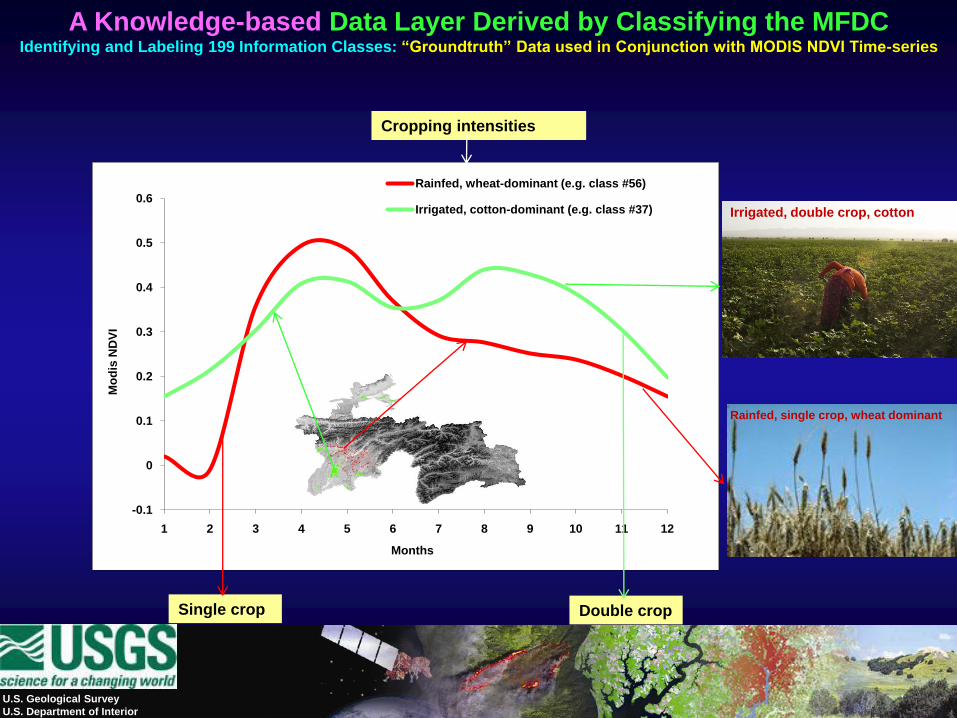
Rainfed, wheat-dominant (e.g. class #56)
Irrigated, cotton-dominant (e.g. class #37)
Cropping intensities
Single crop Double crop
U.S. Geological Survey
U.S. Department of Interior
Irrigated, double crop, cotton
Rainfed, single crop, wheat dominant
A Knowledge-based Data Layer Derived by Classifying the MFDC Identifying and Labeling 199 Information Classes: “Groundtruth” Data used in Conjunction with MODIS NDVI Time-series
U.S. Department of the Interior
U.S. Geological Survey
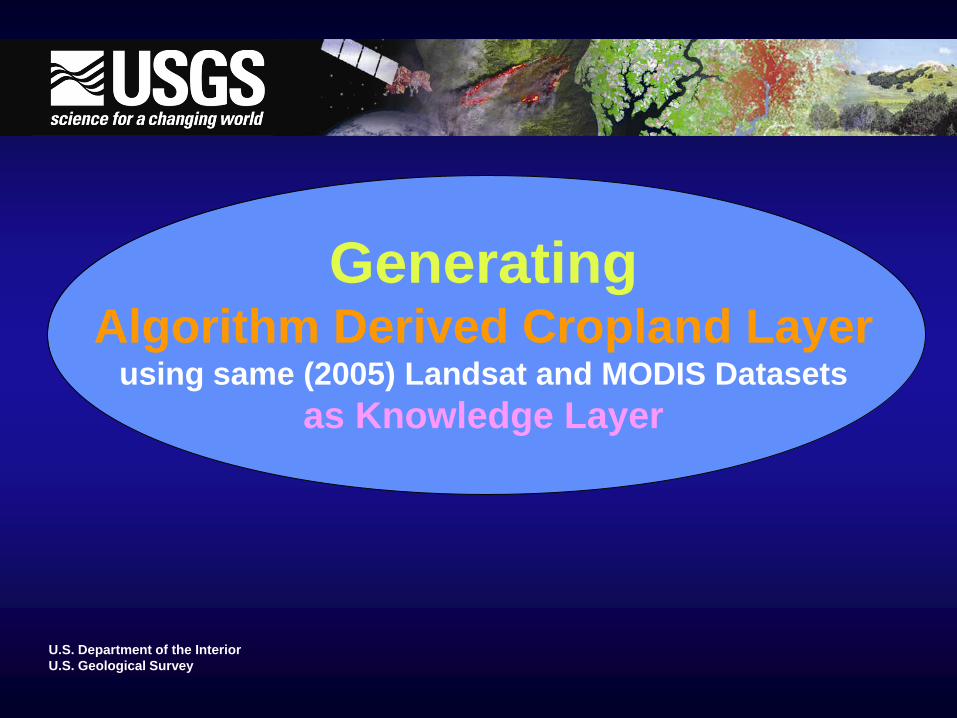
Generating Algorithm Derived Cropland Layer
using same (2005) Landsat and MODIS Datasets
as Knowledge Layer
U.S. Geological Survey
U.S. Department of Interior
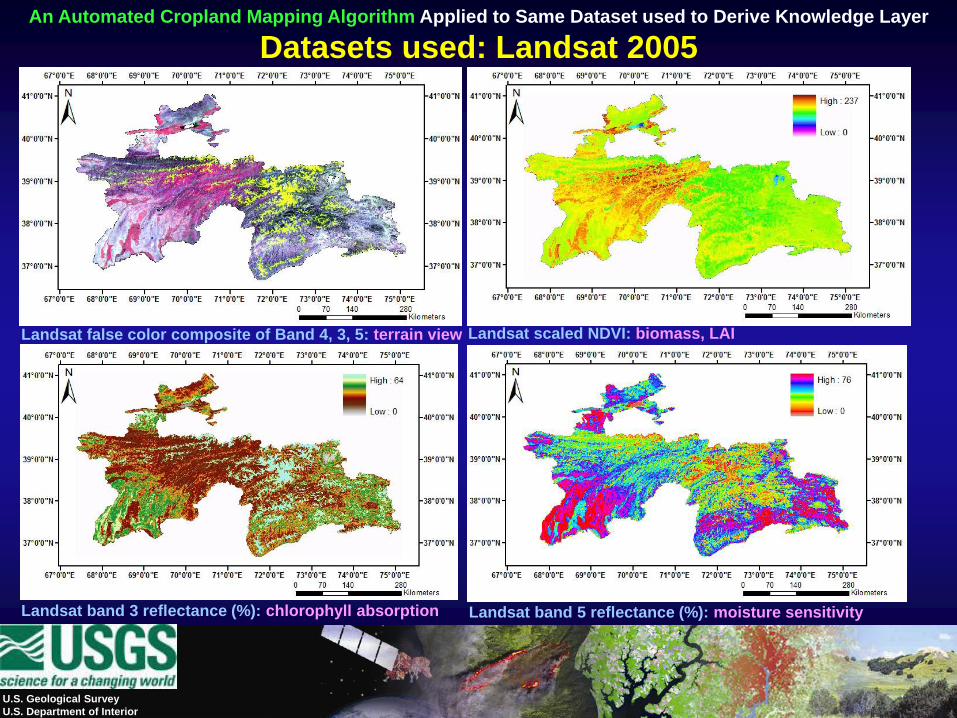
Landsat false color composite of Band 4, 3, 5: terrain view
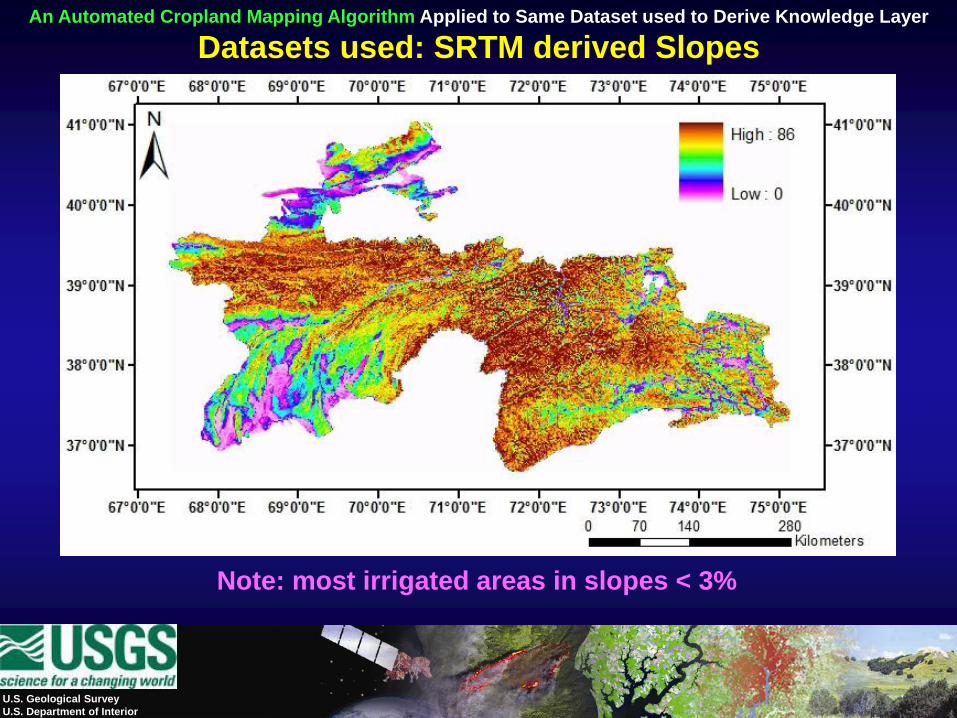
An Automated Cropland Mapping Algorithm Applied to Same Dataset used to Derive Knowledge Layer
Datasets used: Landsat 2005
Landsat scaled NDVI: biomass, LAI
Landsat band 3 reflectance (%): chlorophyll absorption Landsat band 5 reflectance (%): moisture sensitivity
U.S. Geological Survey
U.S. Department of Interior
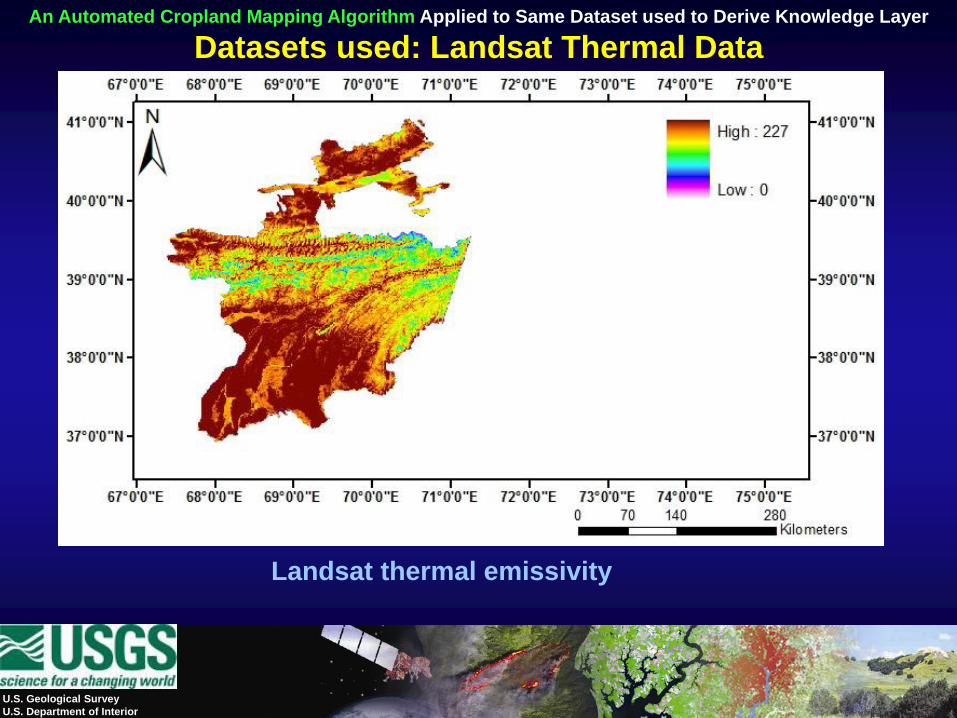
An Automated Cropland Mapping Algorithm Applied to Same Dataset used to Derive Knowledge Layer
Datasets used: Landsat Thermal Data
Landsat thermal emissivity
U.S. Geological Survey
U.S. Department of Interior
Jan Feb Mar Apr
May Jun Jul Aug
Sep Oct Nov Dec
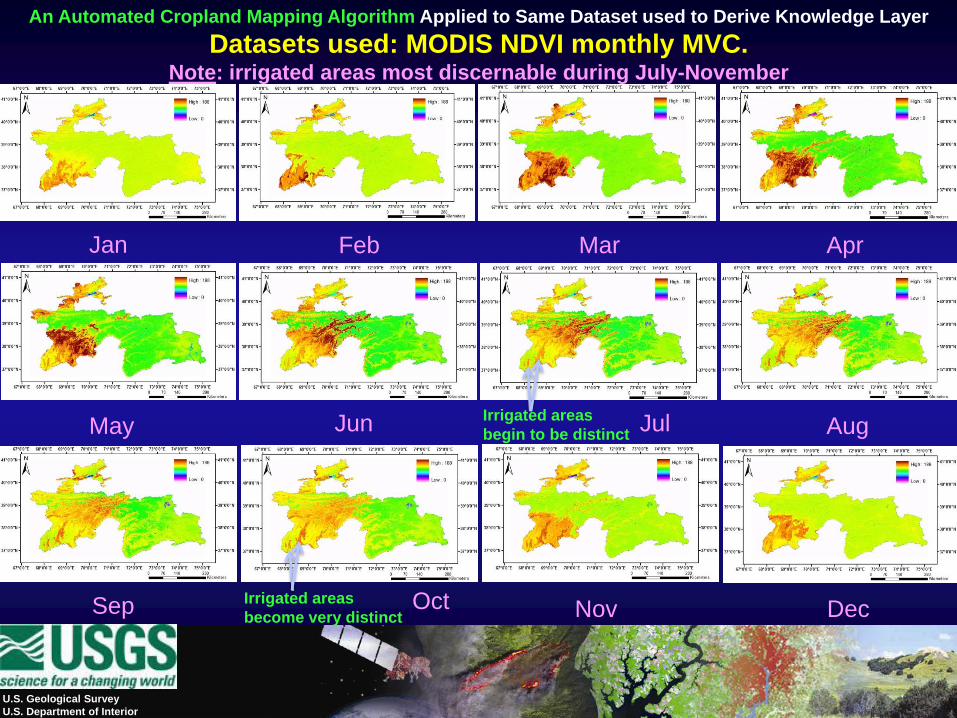
An Automated Cropland Mapping Algorithm Applied to Same Dataset used to Derive Knowledge Layer
Datasets used: MODIS NDVI monthly MVC. Note: irrigated areas most discernable during July-November
Irrigated areas
begin to be distinct
Irrigated areas
become very distinct
U.S. Geological Survey
U.S. Department of Interior
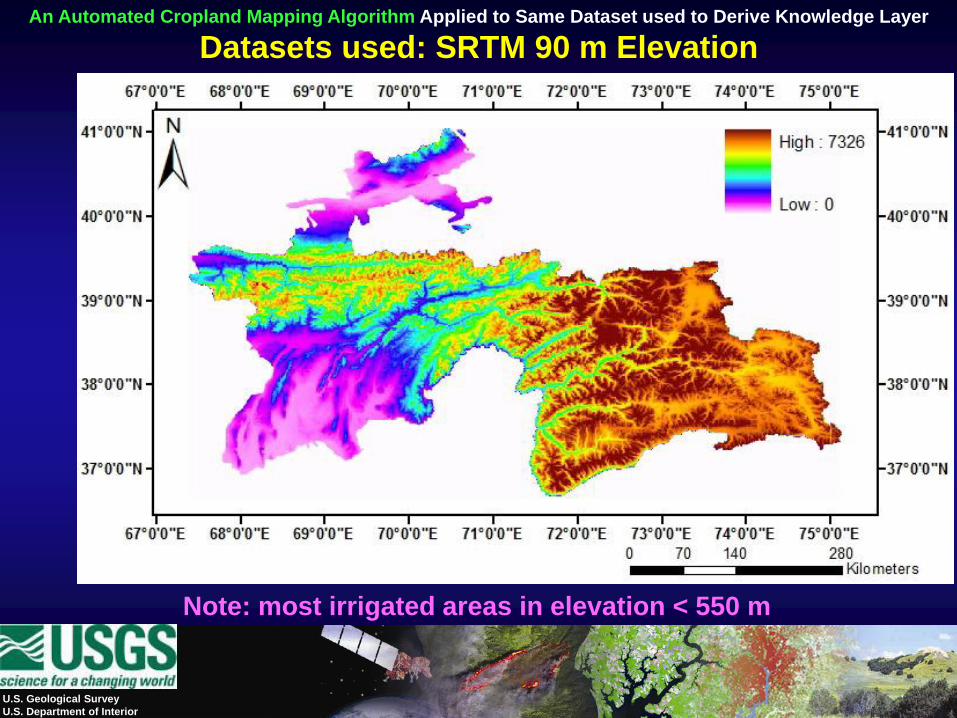
An Automated Cropland Mapping Algorithm Applied to Same Dataset used to Derive Knowledge Layer
Datasets used: SRTM 90 m Elevation
Note: most irrigated areas in elevation < 550 m
U.S. Geological Survey
U.S. Department of Interior
An Automated Cropland Mapping Algorithm Applied to Same Dataset used to Derive Knowledge Layer
Datasets used: SRTM derived Slopes
Note: most irrigated areas in slopes < 3%

U.S. Department of the Interior
U.S. Geological Survey
Algorithm for Irrigated Areas
using Data for the Years Same (2005)as Knowledge Layer
U.S. Geological Survey
U.S. Department of Interior
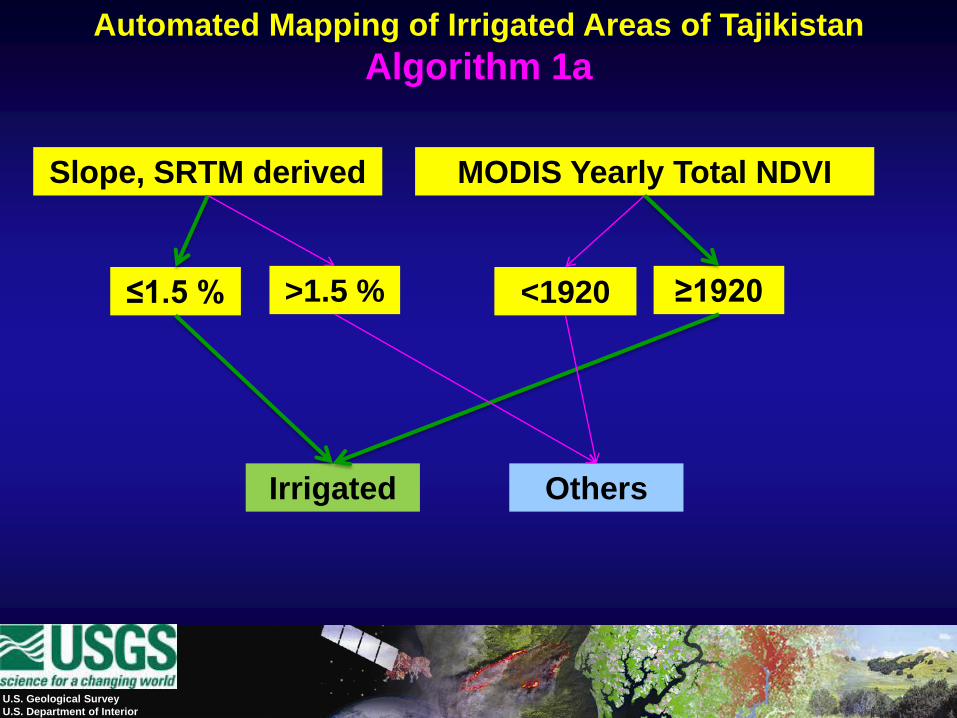
Automated Mapping of Irrigated Areas of Tajikistan
Algorithm 1a
Slope, SRTM derived MODIS Yearly Total NDVI
≤1.5 % >1.5 % <1920 ≥1920
Irrigated Others
U.S. Geological Survey
U.S. Department of Interior
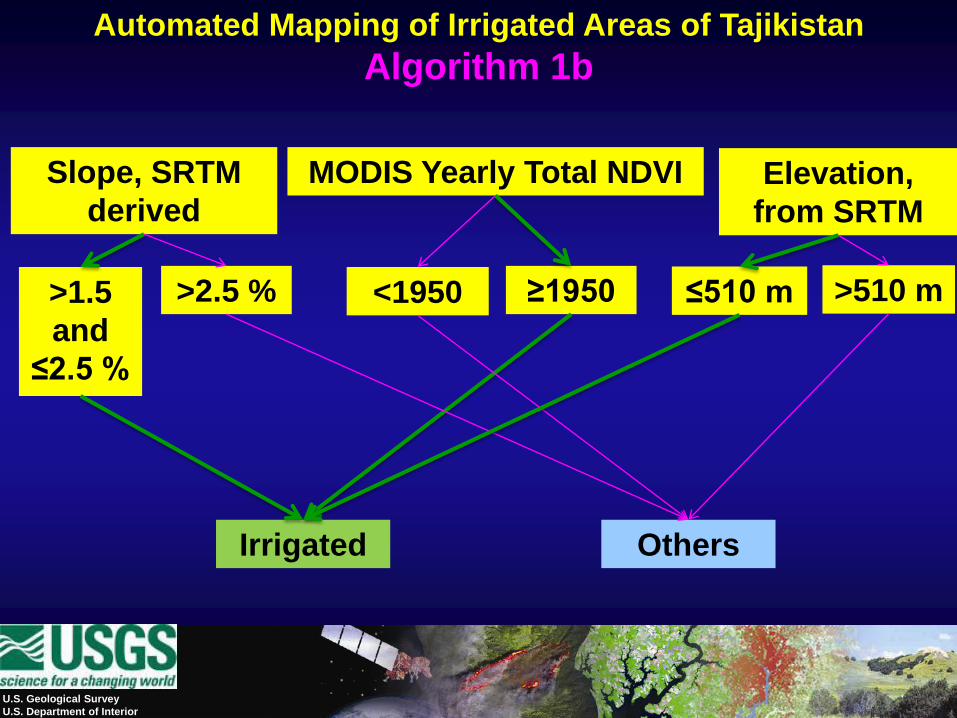
Slope, SRTM
derived
MODIS Yearly Total NDVI
>1.5
and
≤2.5 %
>2.5 % <1950 ≥1950
Irrigated Others
Elevation,
from SRTM
≤510 m >510 m
Automated Mapping of Irrigated Areas of Tajikistan
Algorithm 1b
U.S. Geological Survey
U.S. Department of Interior
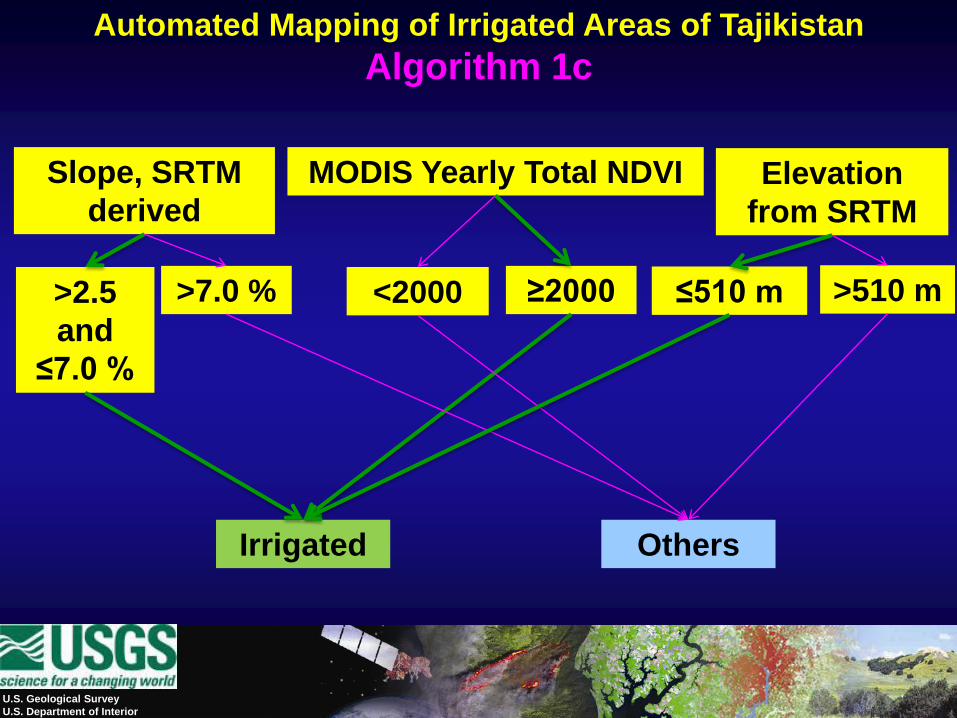
Slope, SRTM
derived
MODIS Yearly Total NDVI
>2.5
and
≤7.0 %
>7.0 % <2000 ≥2000
Irrigated Others
Elevation
from SRTM
≤510 m >510 m
Automated Mapping of Irrigated Areas of Tajikistan
Algorithm 1c
U.S. Geological Survey
U.S. Department of Interior
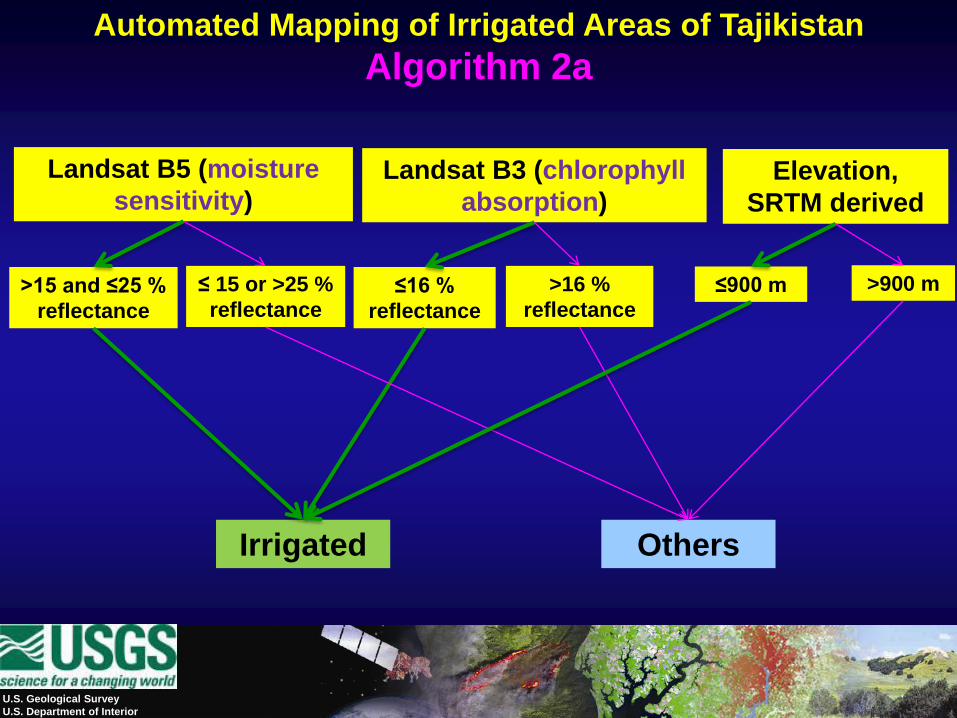
Landsat B5 (moisture
sensitivity)Landsat B3 (chlorophyll
absorption)
>15 and ≤25 %
reflectance
≤ 15 or >25 %
reflectance≤16 %
reflectance
>16 %
reflectance
Irrigated Others
Elevation,
SRTM derived
≤900 m >900 m
Automated Mapping of Irrigated Areas of Tajikistan
Algorithm 2a
U.S. Geological Survey
U.S. Department of Interior
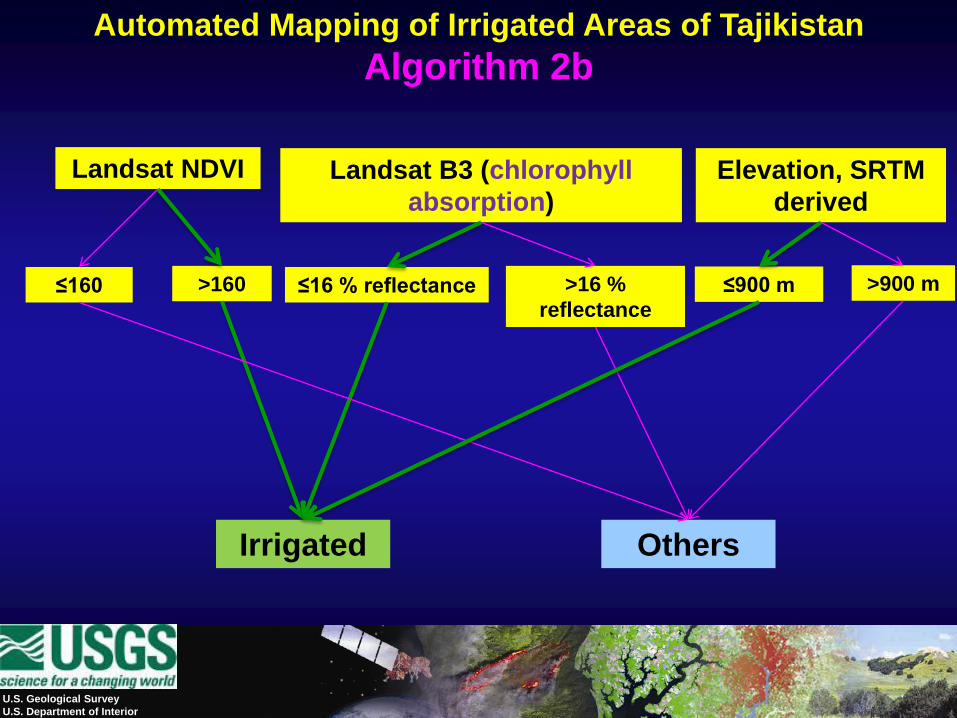
Landsat NDVI Landsat B3 (chlorophyll
absorption)
≤160 >160 ≤16 % reflectance >16 %
reflectance
Irrigated Others
Elevation, SRTM
derived
≤900 m >900 m
Automated Mapping of Irrigated Areas of Tajikistan
Algorithm 2b
U.S. Geological Survey
U.S. Department of Interior
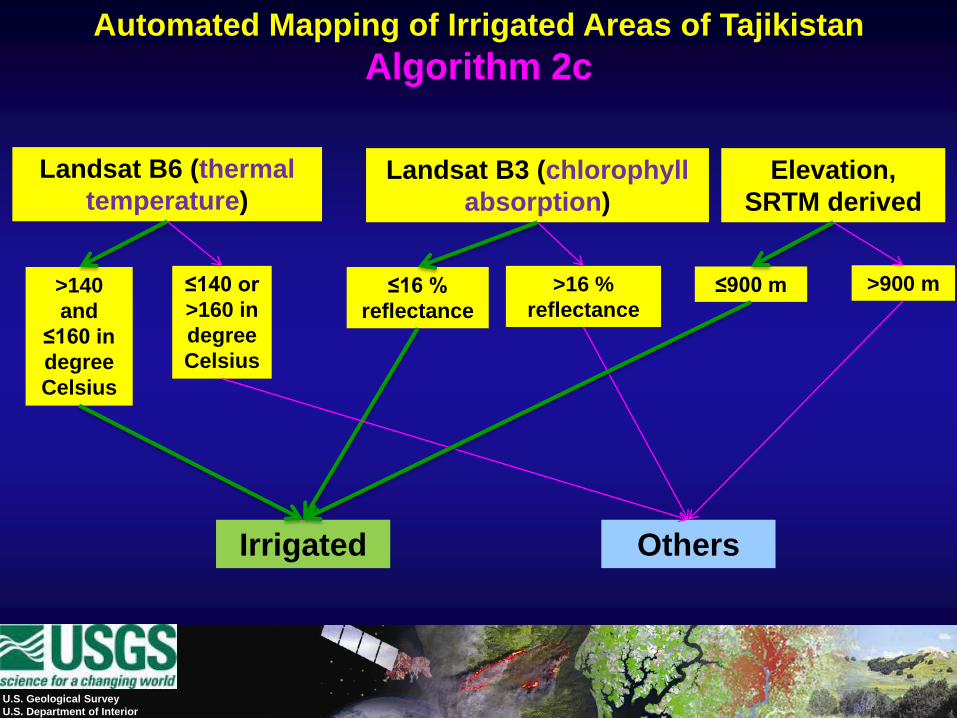
Landsat B6 (thermal
temperature)Landsat B3 (chlorophyll
absorption)
>140
and
≤160 in
degree
Celsius
≤140 or
>160 in
degree
Celsius
≤16 %
reflectance
>16 %
reflectance
Irrigated Others
Elevation,
SRTM derived
≤900 m >900 m
Automated Mapping of Irrigated Areas of Tajikistan
Algorithm 2c
U.S. Geological Survey
U.S. Department of Interior
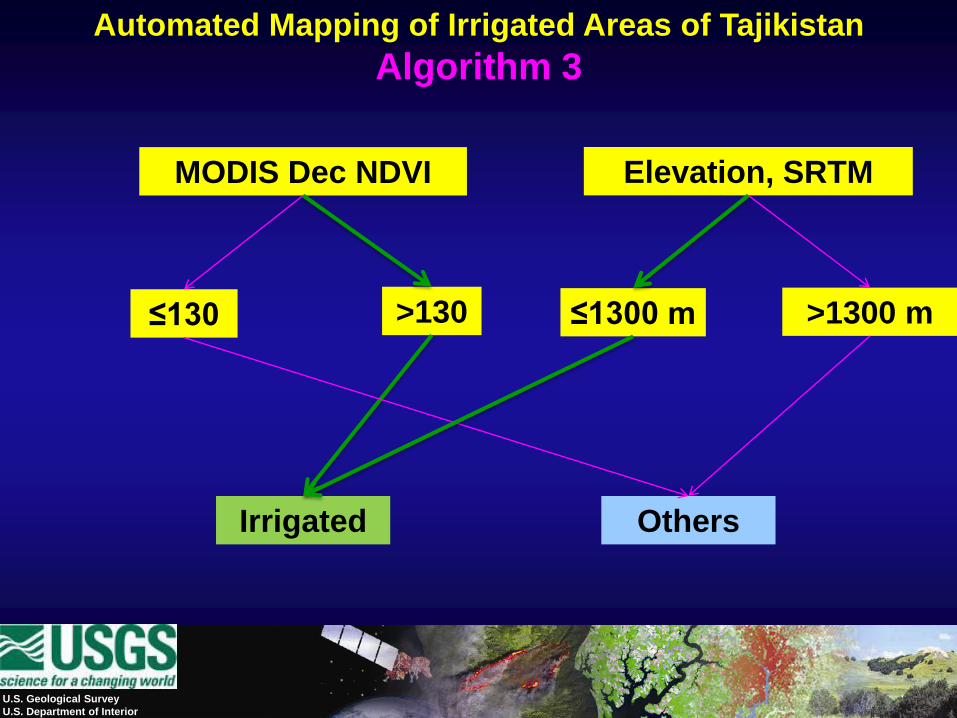
MODIS Dec NDVI
≤130 >130
Irrigated Others
Elevation, SRTM
≤1300 m >1300 m
Automated Mapping of Irrigated Areas of Tajikistan
Algorithm 3
U.S. Geological Survey
U.S. Department of Interior
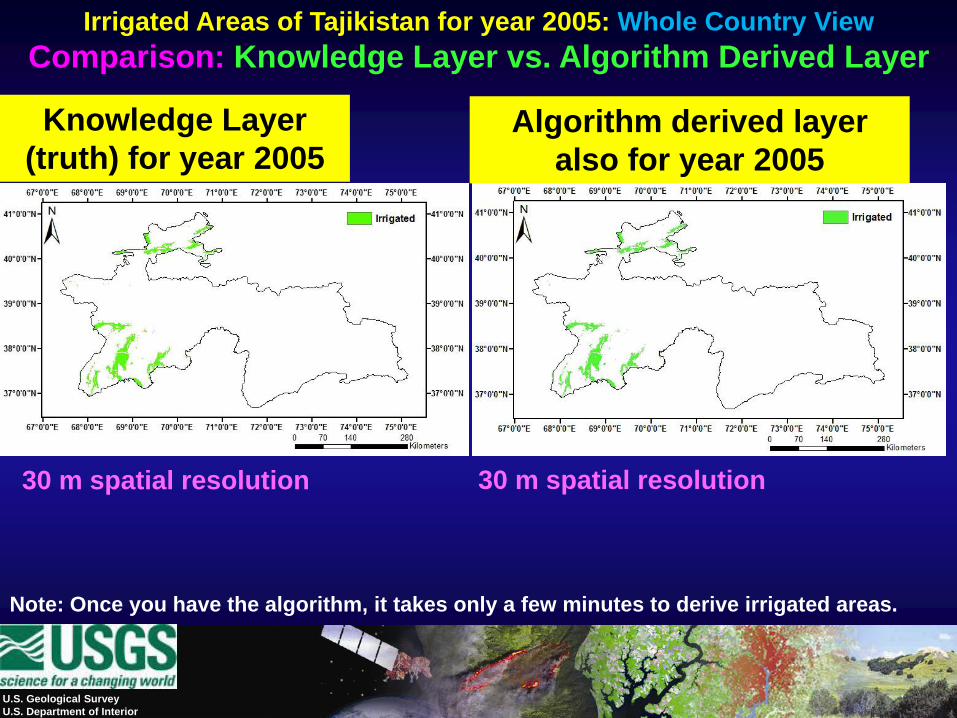
Irrigated Areas of Tajikistan for year 2005: Whole Country View
Comparison: Knowledge Layer vs. Algorithm Derived Layer
Note: Once you have the algorithm, it takes only a few minutes to derive irrigated areas.
30 m spatial resolution 30 m spatial resolution
Knowledge Layer
(truth) for year 2005Algorithm derived layer
also for year 2005
U.S. Geological Survey
U.S. Department of Interior
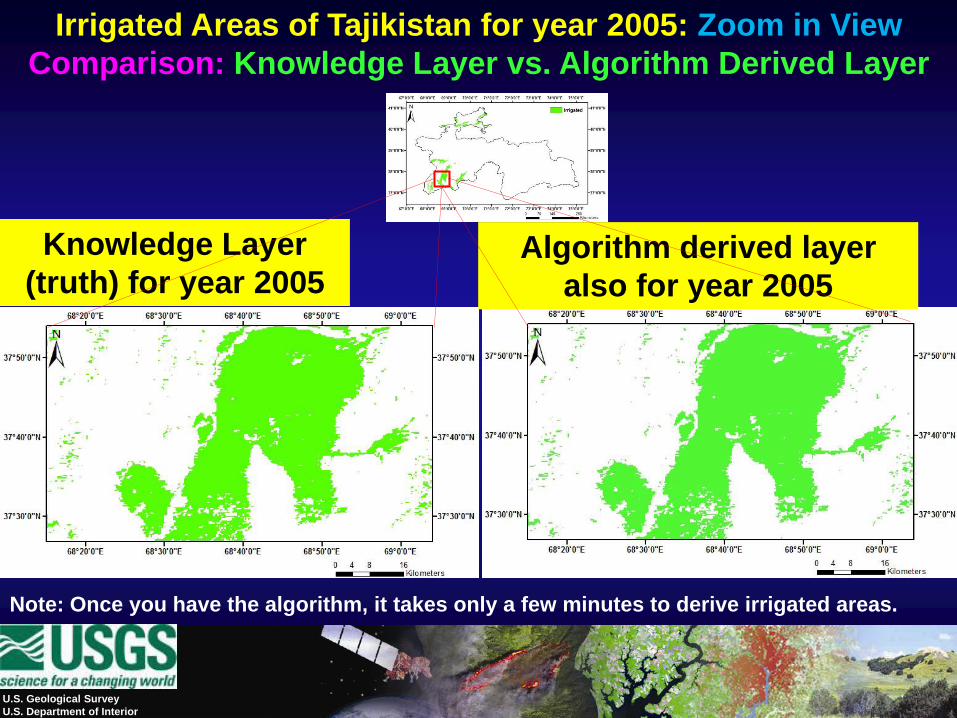
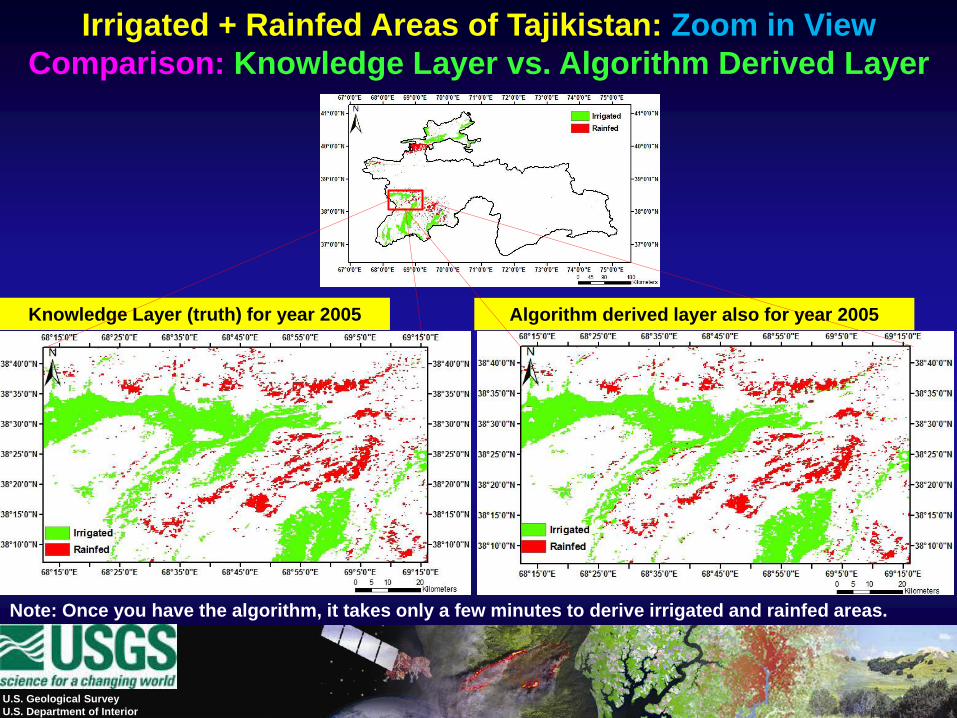
Knowledge Layer
(truth) for year 2005Algorithm derived layer
also for year 2005
Irrigated Areas of Tajikistan for year 2005: Zoom in View
Comparison: Knowledge Layer vs. Algorithm Derived Layer
Note: Once you have the algorithm, it takes only a few minutes to derive irrigated areas.
U.S. Department of the Interior
U.S. Geological Survey
Algorithm for rainfed Areas
using Data for the Years Same (2005)as Knowledge Layer
U.S. Geological Survey
U.S. Department of Interior
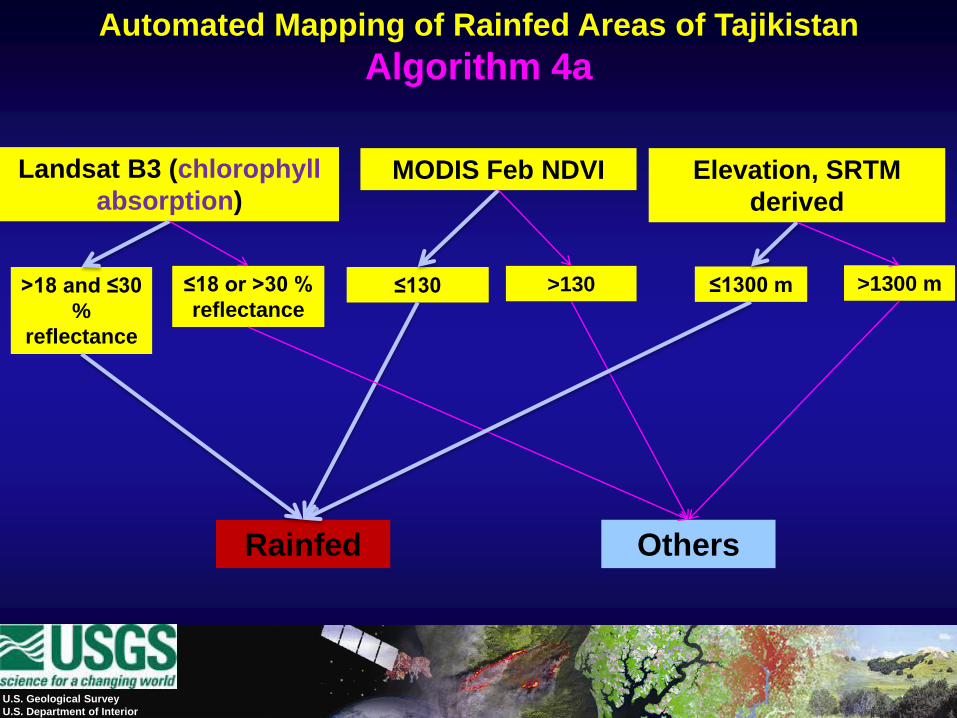
Landsat B3 (chlorophyll
absorption)MODIS Feb NDVI
>18 and ≤30
%
reflectance
≤18 or >30 %
reflectance≤130 >130
Rainfed Others
Elevation, SRTM
derived
≤1300 m >1300 m
Automated Mapping of Rainfed Areas of Tajikistan
Algorithm 4a
U.S. Geological Survey
U.S. Department of Interior
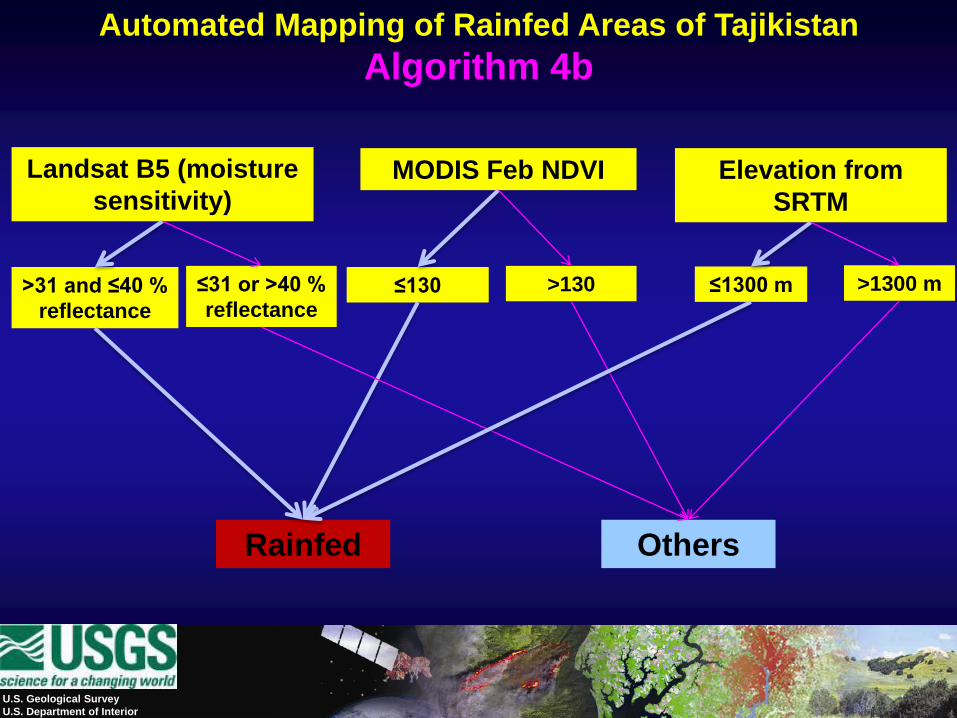
Landsat B5 (moisture
sensitivity)MODIS Feb NDVI
>31 and ≤40 %
reflectance
≤31 or >40 %
reflectance≤130 >130
Rainfed Others
Elevation from
SRTM
≤1300 m >1300 m
Automated Mapping of Rainfed Areas of Tajikistan
Algorithm 4b
U.S. Geological Survey
U.S. Department of Interior
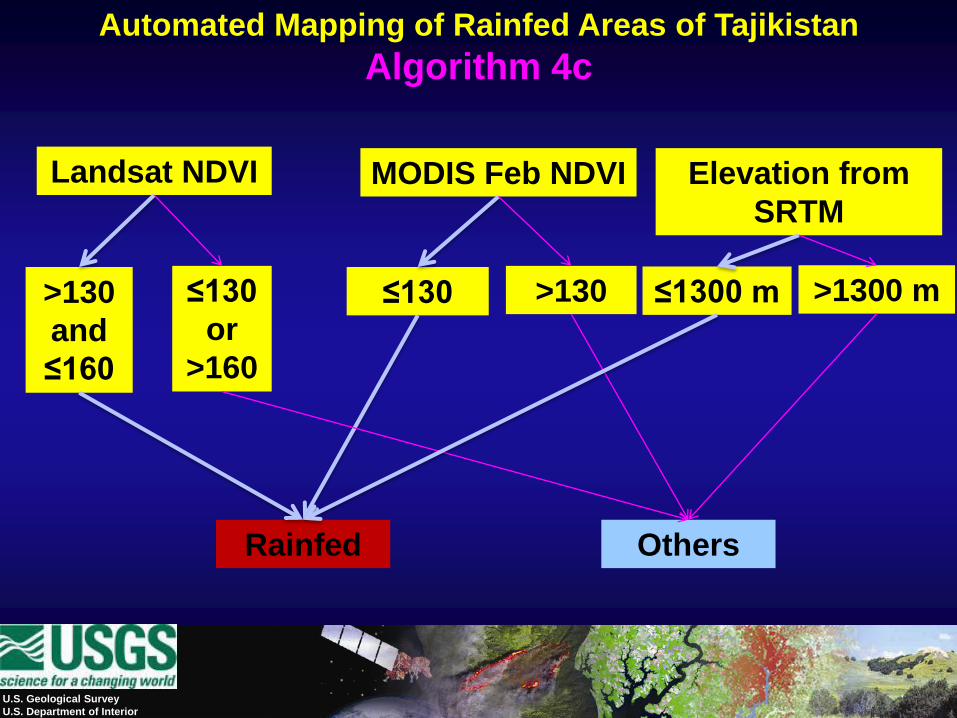
Landsat NDVI MODIS Feb NDVI
>130
and
≤160
≤130
or
>160
≤130 >130
Rainfed Others
Elevation from
SRTM
≤1300 m >1300 m
Automated Mapping of Rainfed Areas of Tajikistan
Algorithm 4c
U.S. Geological Survey
U.S. Department of Interior
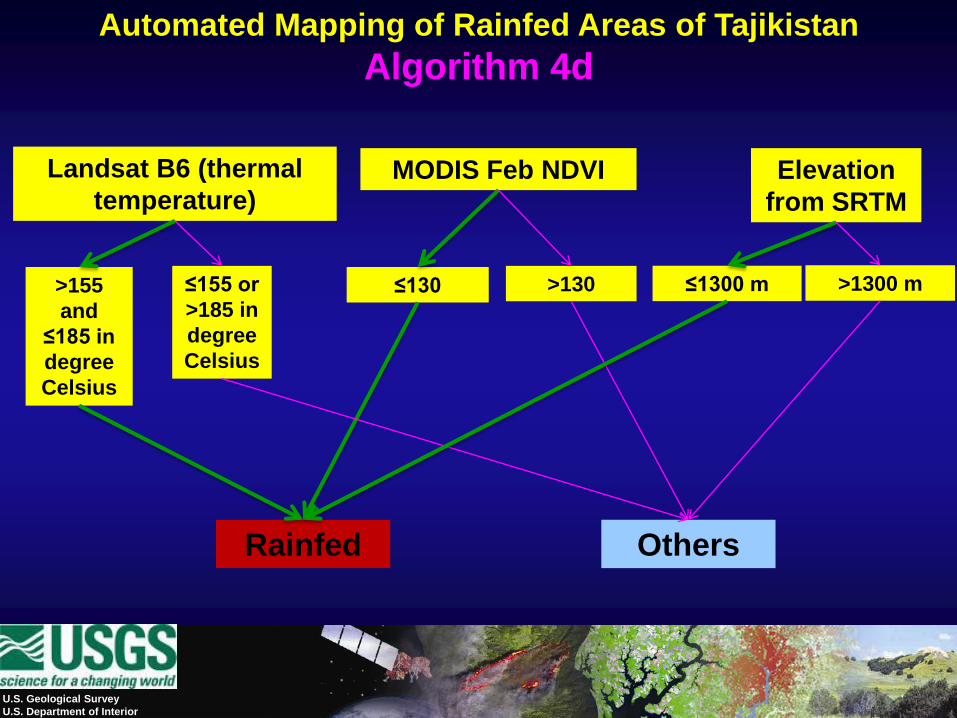
Landsat B6 (thermal
temperature)MODIS Feb NDVI
>155
and
≤185 in
degree
Celsius
≤155 or
>185 in
degree
Celsius
≤130 >130
Rainfed Others
Elevation
from SRTM
≤1300 m >1300 m
Automated Mapping of Rainfed Areas of Tajikistan
Algorithm 4d
U.S. Geological Survey
U.S. Department of Interior
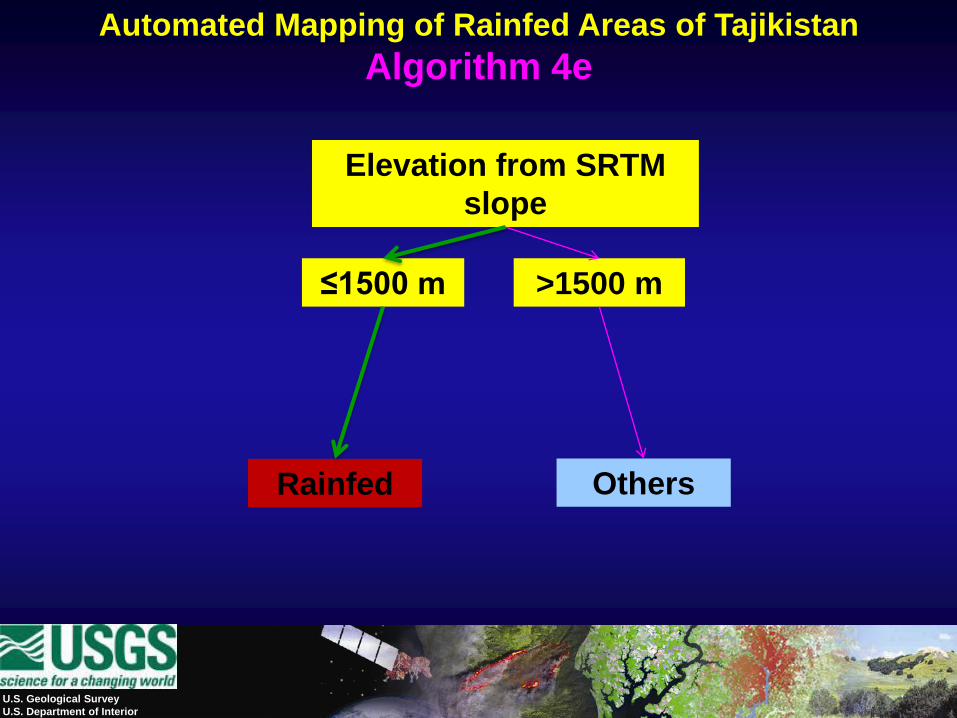
Rainfed Others
Elevation from SRTM
slope
≤1500 m >1500 m
Automated Mapping of Rainfed Areas of Tajikistan
Algorithm 4e
U.S. Geological Survey
U.S. Department of Interior
Knowledge Layer (truth) for year 2005
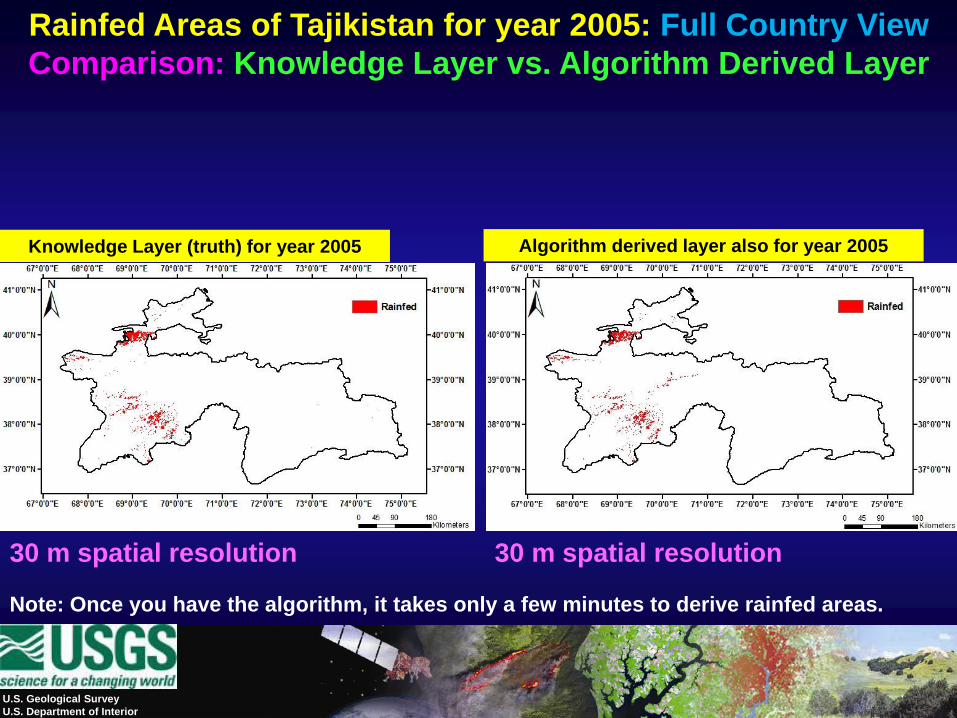
Rainfed Areas of Tajikistan for year 2005: Full Country View
Comparison: Knowledge Layer vs. Algorithm Derived Layer
Note: Once you have the algorithm, it takes only a few minutes to derive rainfed areas.
30 m spatial resolution 30 m spatial resolution
Algorithm derived layer also for year 2005
Algorithm derived layer also for year 2005Knowledge Layer (truth) for year 2005
U.S. Geological Survey
U.S. Department of Interior
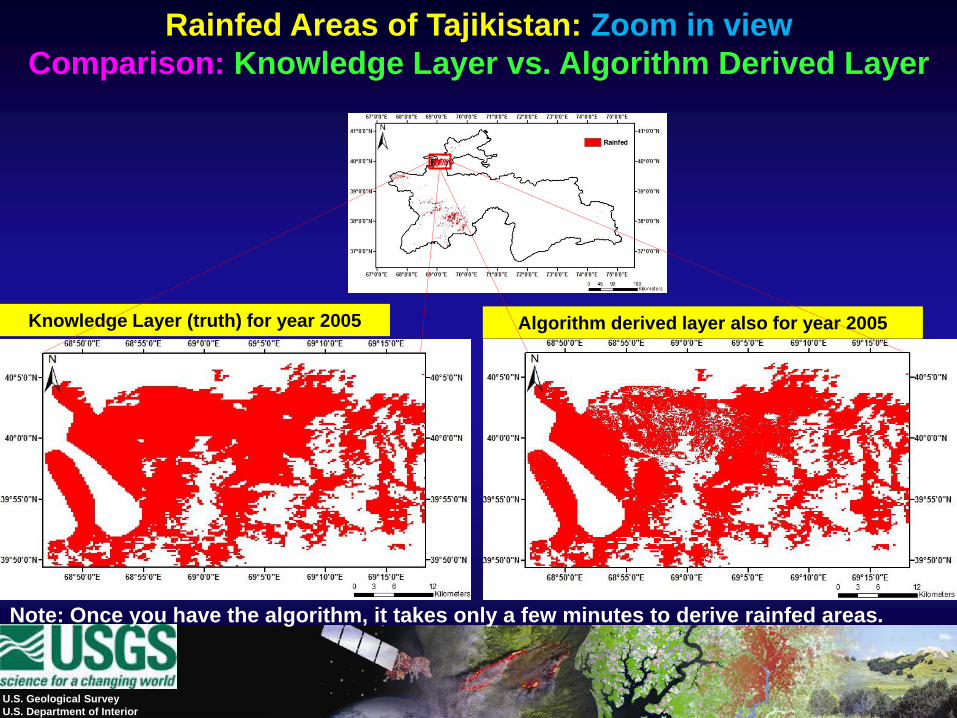
Rainfed Areas of Tajikistan: Zoom in view
Comparison: Knowledge Layer vs. Algorithm Derived Layer
Note: Once you have the algorithm, it takes only a few minutes to derive rainfed areas.
U.S. Department of the Interior
U.S. Geological Survey
Algorithm for irrigated +rainfed Areas
using Data for the Years Same (2005)as Knowledge Layer
U.S. Geological Survey
U.S. Department of Interior
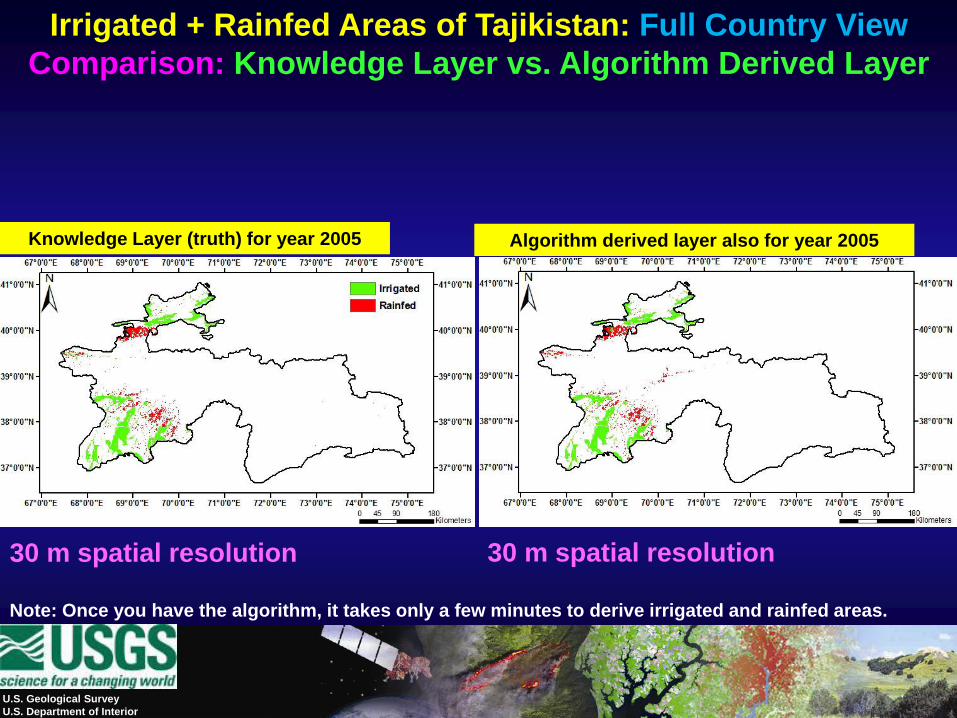
Irrigated + Rainfed Areas of Tajikistan: Full Country View
Comparison: Knowledge Layer vs. Algorithm Derived Layer
Note: Once you have the algorithm, it takes only a few minutes to derive irrigated and rainfed areas.
30 m spatial resolution 30 m spatial resolution
Algorithm derived layer also for year 2005Knowledge Layer (truth) for year 2005
Algorithm derived layer also for year 2005Knowledge Layer (truth) for year 2005
U.S. Geological Survey
U.S. Department of Interior
Irrigated + Rainfed Areas of Tajikistan: Zoom in View
Comparison: Knowledge Layer vs. Algorithm Derived Layer
Note: Once you have the algorithm, it takes only a few minutes to derive irrigated and rainfed areas.
U.S. Department of the Interior
U.S. Geological Survey
Accuracy Assessment
Error matrix
U.S. Geological Survey
U.S. Department of Interior
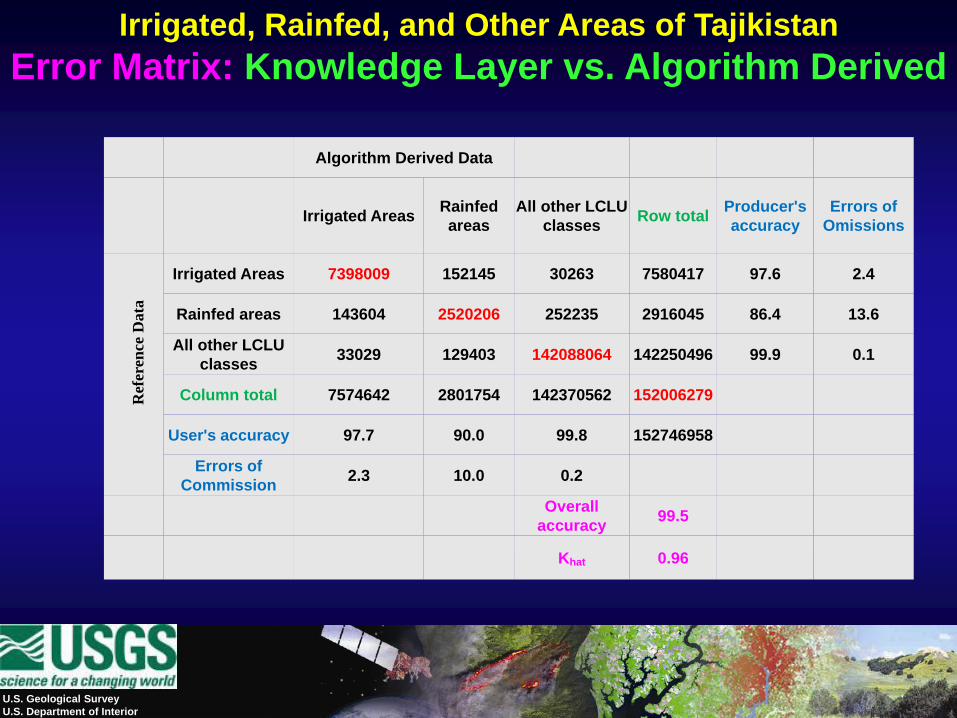
Irrigated, Rainfed, and Other Areas of Tajikistan
Error Matrix: Knowledge Layer vs. Algorithm Derived
Algorithm Derived Data
Irrigated AreasRainfed
areas
All other LCLU
classesRow total
Producer's
accuracy
Errors of
Omissions
Irrigated Areas 7398009 152145 30263 7580417 97.6 2.4
Rainfed areas 143604 2520206 252235 2916045 86.4 13.6
All other LCLU
classes33029 129403 142088064 142250496 99.9 0.1
Column total 7574642 2801754 142370562 152006279
User's accuracy 97.7 90.0 99.8 152746958
Errors of
Commission2.3 10.0 0.2
Overall
accuracy99.5
Khat 0.96
Ref
eren
ce D
ata
U.S. Department of the Interior
U.S. Geological Survey
Algorithm Applied for
Independent Data Layer (year 2010)
Showing Irrigated Areas
U.S. Geological Survey
U.S. Department of Interior
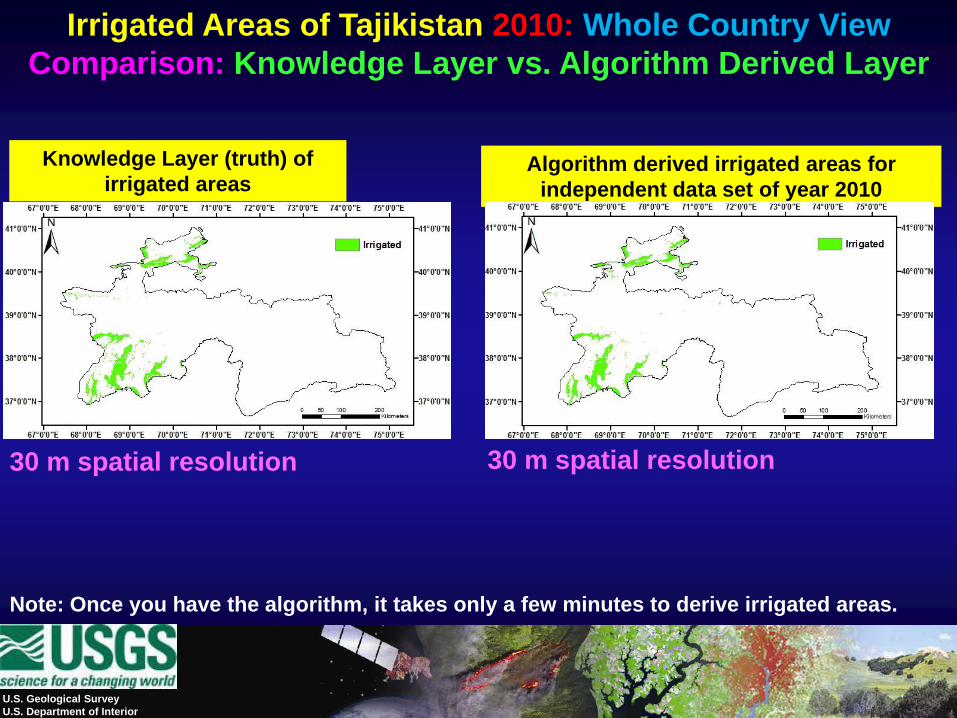
Irrigated Areas of Tajikistan 2010: Whole Country View
Comparison: Knowledge Layer vs. Algorithm Derived Layer
Knowledge Layer (truth) of
irrigated areasAlgorithm derived irrigated areas for
independent data set of year 2010
Note: Once you have the algorithm, it takes only a few minutes to derive irrigated areas.
30 m spatial resolution 30 m spatial resolution
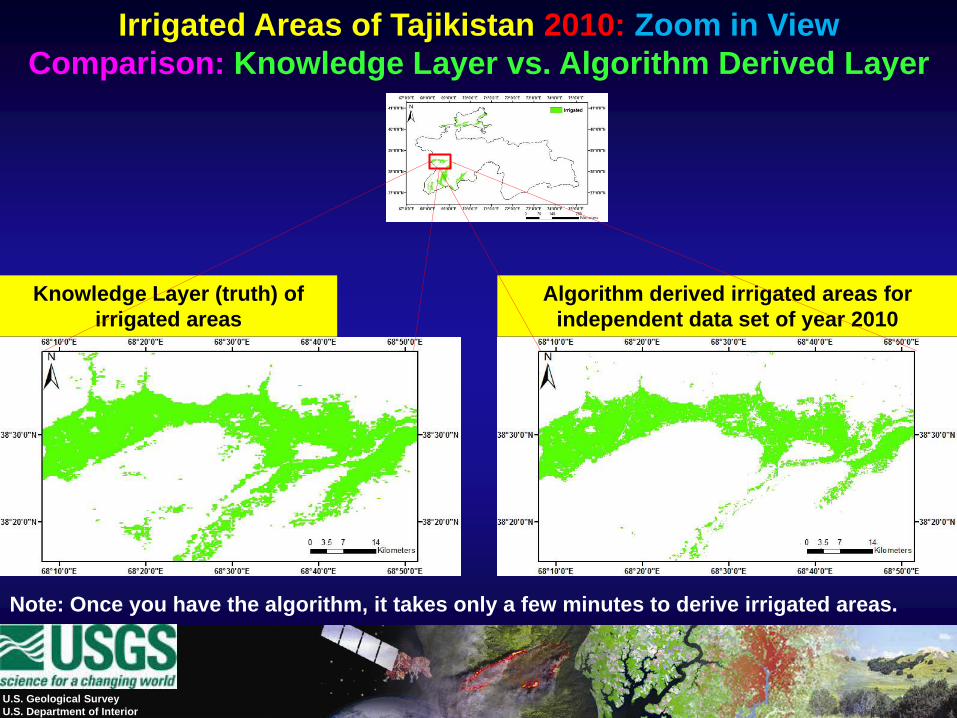
Knowledge Layer (truth) of
irrigated areas
Algorithm derived irrigated areas for
independent data set of year 2010
U.S. Geological Survey
U.S. Department of Interior
Irrigated Areas of Tajikistan 2010: Zoom in View
Comparison: Knowledge Layer vs. Algorithm Derived Layer
Note: Once you have the algorithm, it takes only a few minutes to derive irrigated areas.
U.S. Department of the Interior
U.S. Geological Survey
Algorithm Applied for
Independent Data Layer (year 2010)
Showing Rainfed Areas
U.S. Geological Survey
U.S. Department of Interior
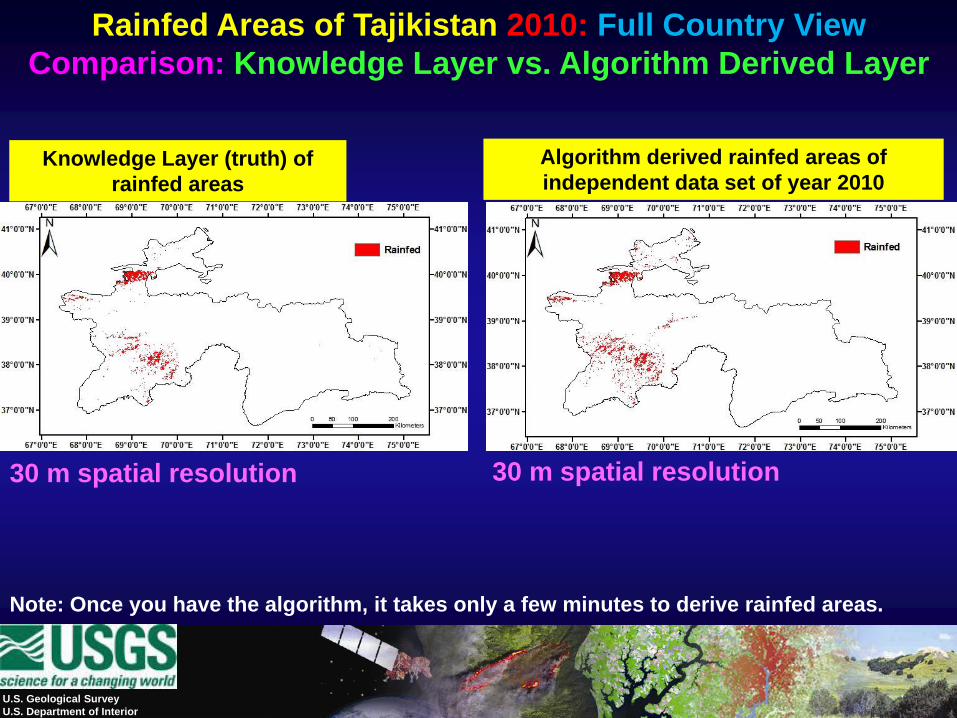
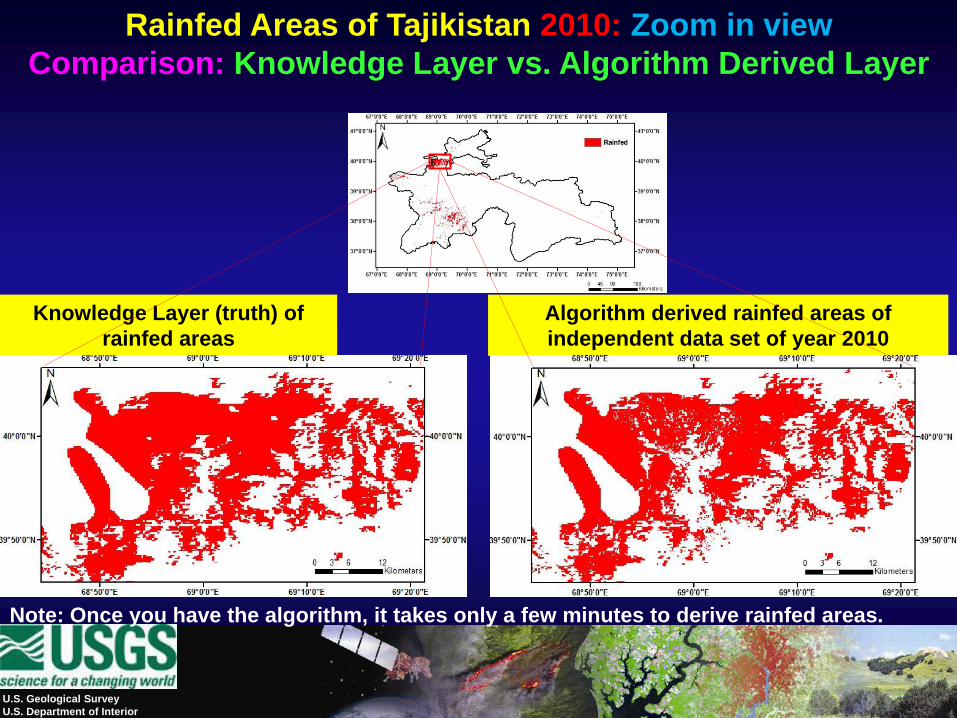
Rainfed Areas of Tajikistan 2010: Full Country View
Comparison: Knowledge Layer vs. Algorithm Derived Layer
Note: Once you have the algorithm, it takes only a few minutes to derive rainfed areas.
30 m spatial resolution 30 m spatial resolution
Knowledge Layer (truth) of
rainfed areas
Algorithm derived rainfed areas of
independent data set of year 2010
Algorithm derived rainfed areas of
independent data set of year 2010
Knowledge Layer (truth) of
rainfed areas
U.S. Geological Survey
U.S. Department of Interior
Rainfed Areas of Tajikistan 2010: Zoom in view
Comparison: Knowledge Layer vs. Algorithm Derived Layer
Note: Once you have the algorithm, it takes only a few minutes to derive rainfed areas.

U.S. Department of the Interior
U.S. Geological Survey
Algorithm Applied for
Independent Data Layer (year 2010)
Showing Rainfed Areas
U.S. Geological Survey
U.S. Department of Interior
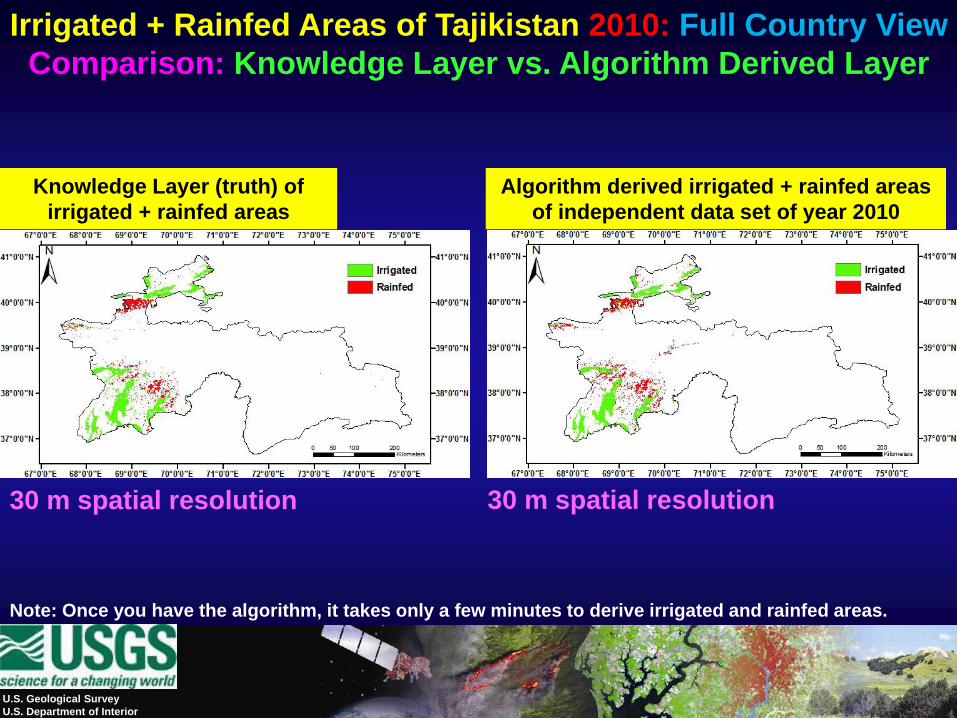
Irrigated + Rainfed Areas of Tajikistan 2010: Full Country View
Comparison: Knowledge Layer vs. Algorithm Derived Layer
Note: Once you have the algorithm, it takes only a few minutes to derive irrigated and rainfed areas.
30 m spatial resolution 30 m spatial resolution
Knowledge Layer (truth) of
irrigated + rainfed areas
Algorithm derived irrigated + rainfed areas
of independent data set of year 2010
Algorithm derived irrigated + rainfed areas
of independent data set of year 2010Knowledge Layer (truth) of
irrigated + rainfed areas
U.S. Geological Survey
U.S. Department of Interior
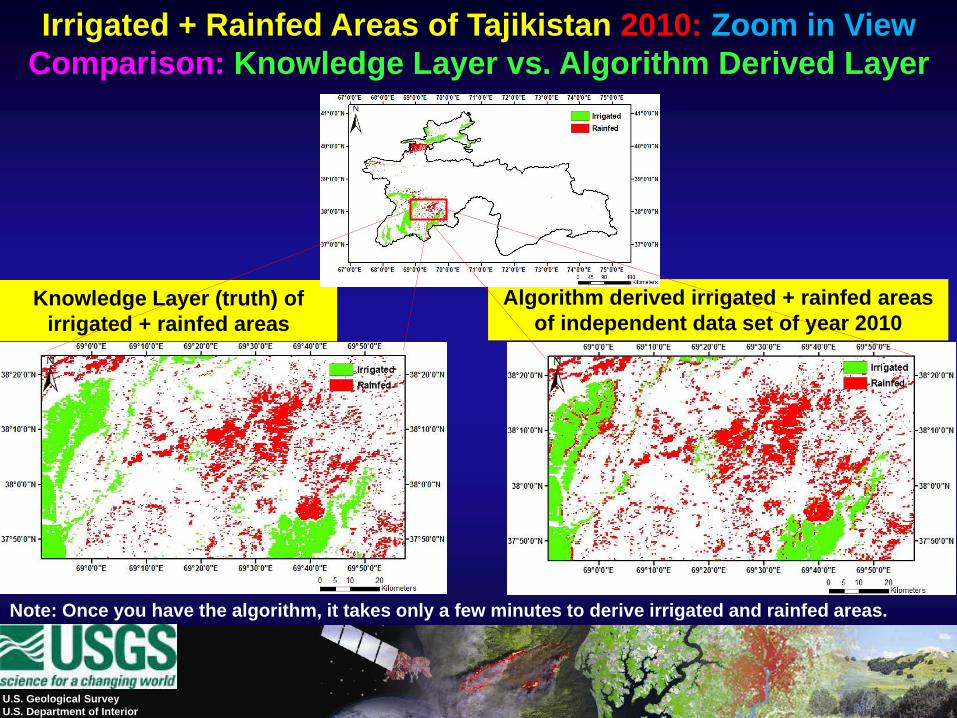
Irrigated + Rainfed Areas of Tajikistan 2010: Zoom in View
Comparison: Knowledge Layer vs. Algorithm Derived Layer
Note: Once you have the algorithm, it takes only a few minutes to derive irrigated and rainfed areas.
Knowledge Layer (truth) of
irrigated + rainfed areasAlgorithm derived irrigated + rainfed areas
of independent data set of year 2010
U.S. Geological Survey
U.S. Department of Interior
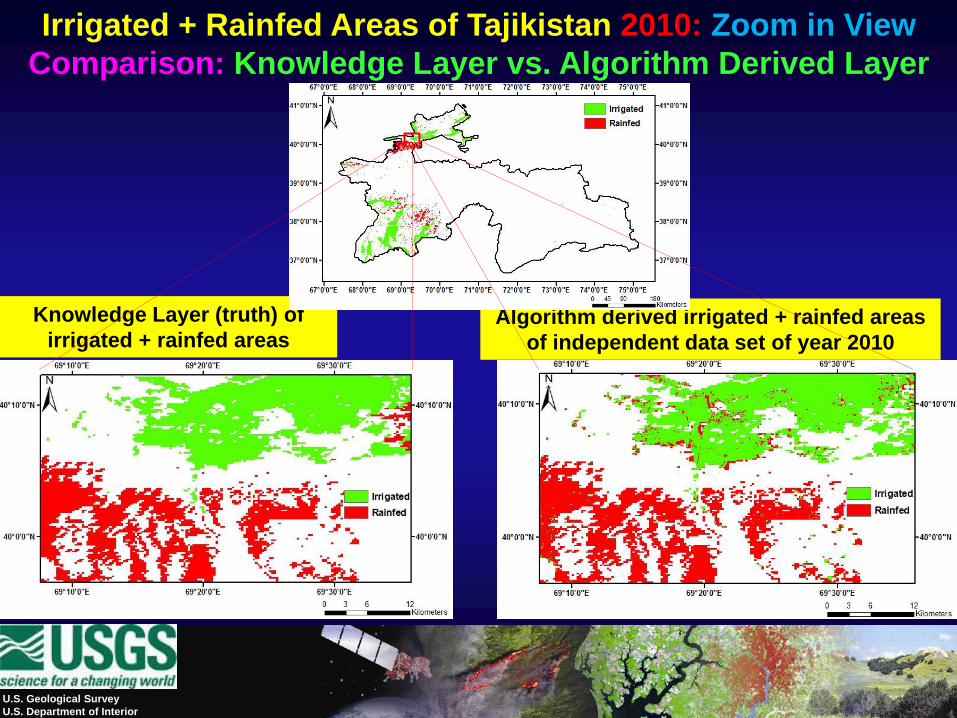
Irrigated + Rainfed Areas of Tajikistan 2010: Zoom in View
Comparison: Knowledge Layer vs. Algorithm Derived Layer
U.S. Department of the Interior
U.S. Geological Survey
Accuracy Assessment
Error matrix
U.S. Geological Survey
U.S. Department of Interior
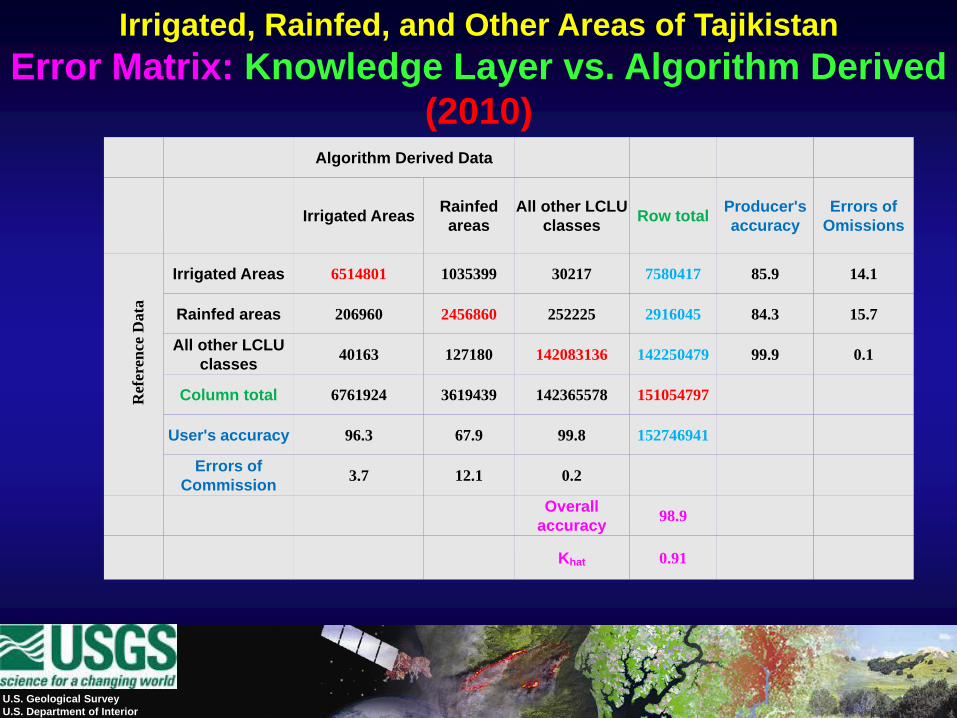
Irrigated, Rainfed, and Other Areas of Tajikistan
Error Matrix: Knowledge Layer vs. Algorithm Derived
(2010)Algorithm Derived Data
Irrigated AreasRainfed
areas
All other LCLU
classesRow total
Producer's
accuracy
Errors of
Omissions
Irrigated Areas 6514801 1035399 30217 7580417 85.9 14.1
Rainfed areas 206960 2456860 252225 2916045 84.3 15.7
All other LCLU
classes40163 127180 142083136 142250479 99.9 0.1
Column total 6761924 3619439 142365578 151054797
User's accuracy 96.3 67.9 99.8 152746941
Errors of
Commission3.7 12.1 0.2
Overall
accuracy98.9
Khat 0.91
Ref
eren
ce D
ata

U.S. Department of the Interior
U.S. Geological Survey
Way Forward
U.S. Geological Survey
U.S. Department of Interior
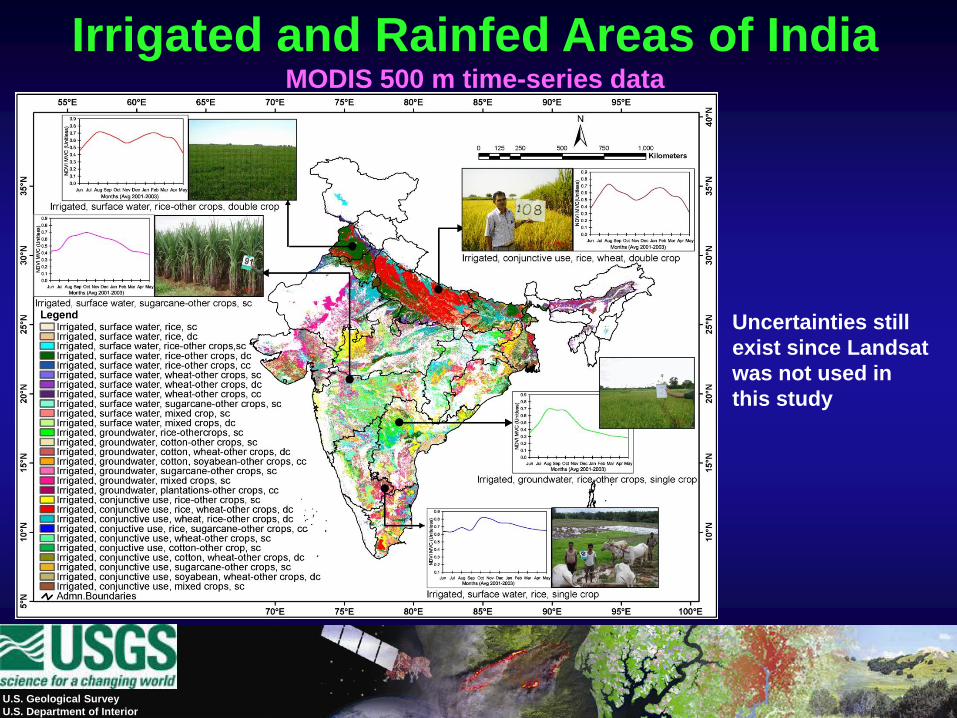
Irrigated and Rainfed Areas of India MODIS 500 m time-series data
Uncertainties still
exist since Landsat
was not used in
this study
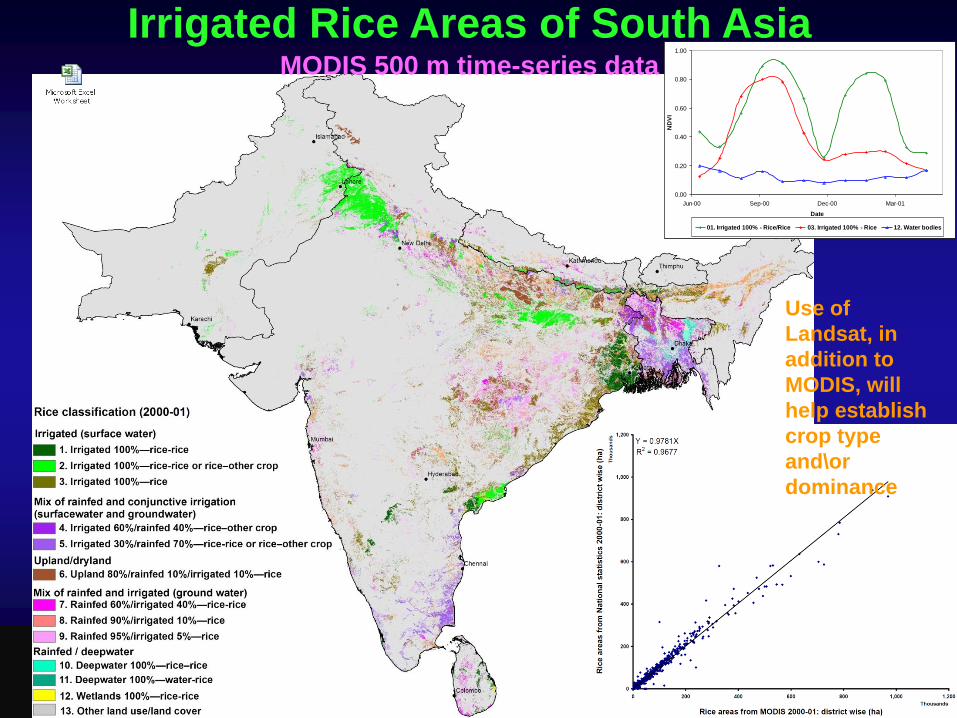
0.00
0.20
0.40
0.60
0.80
1.00
Jun-00 Sep-00 Dec-00 Mar-01
Date
ND
VI
01. Irrigated 100% - Rice/Rice 03. Irrigated 100% - Rice 12. Water bodies
Irrigated Rice Areas of South AsiaMODIS 500 m time-series data
Use of
Landsat, in
addition to
MODIS, will
help establish
crop type
and\or
dominance
U.S. Geological Survey
U.S. Department of Interior
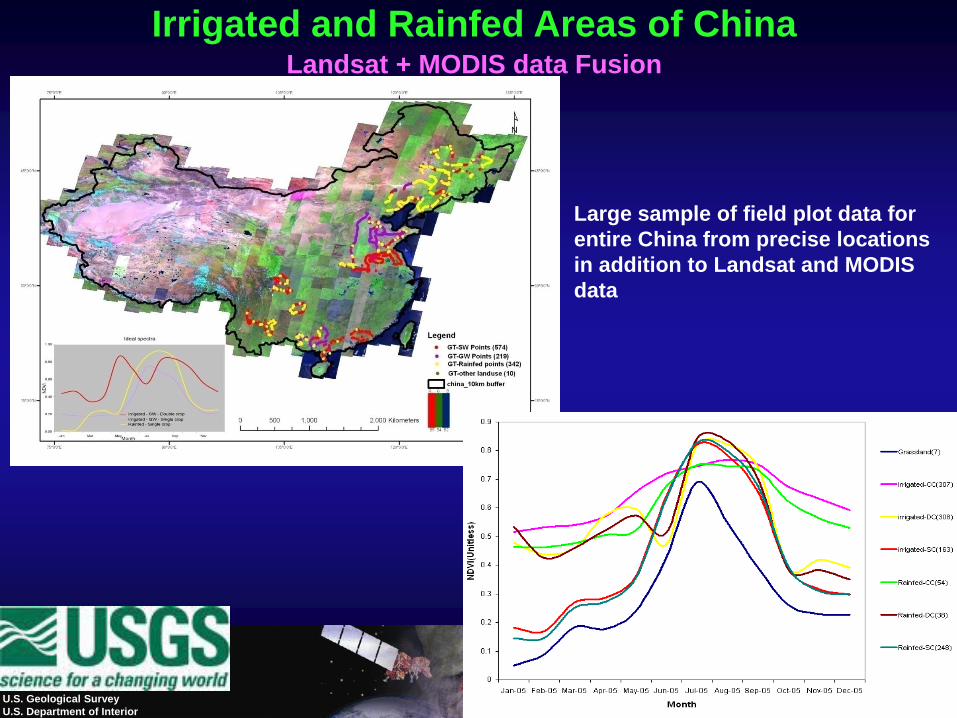
Irrigated and Rainfed Areas of ChinaLandsat + MODIS data Fusion
Large sample of field plot data for
entire China from precise locations
in addition to Landsat and MODIS
data
U.S. Geological Survey
U.S. Department of Interior
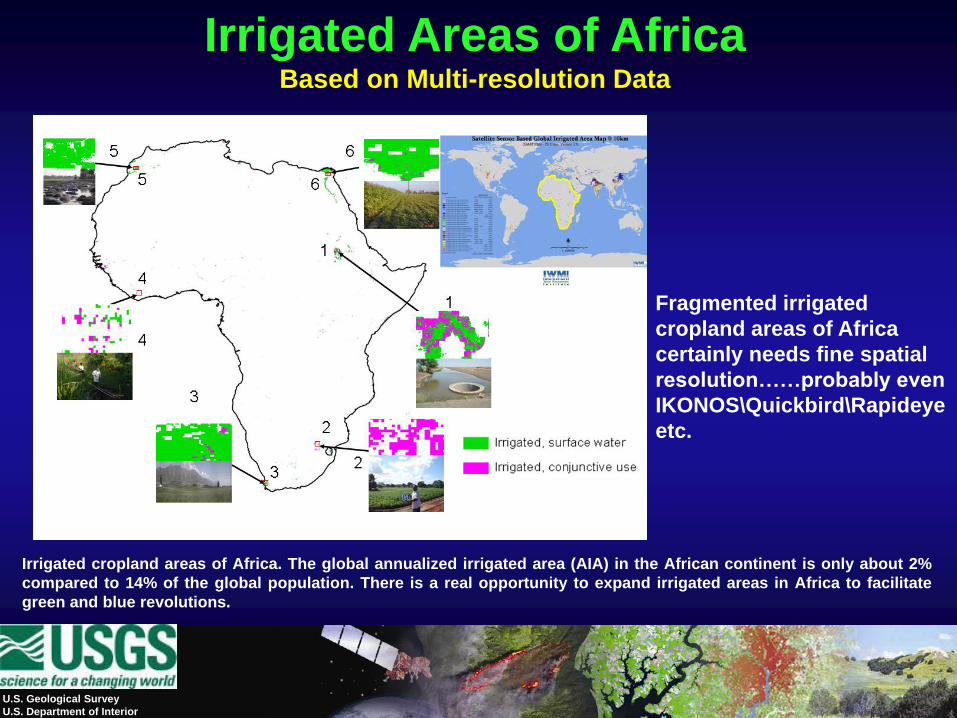
Irrigated cropland areas of Africa. The global annualized irrigated area (AIA) in the African continent is only about 2%
compared to 14% of the global population. There is a real opportunity to expand irrigated areas in Africa to facilitate
green and blue revolutions.
Irrigated Areas of Africa Based on Multi-resolution Data
Fragmented irrigated
cropland areas of Africa
certainly needs fine spatial
resolution……probably even
IKONOS\Quickbird\Rapideye
etc.
U.S. Geological Survey
U.S. Department of Interior
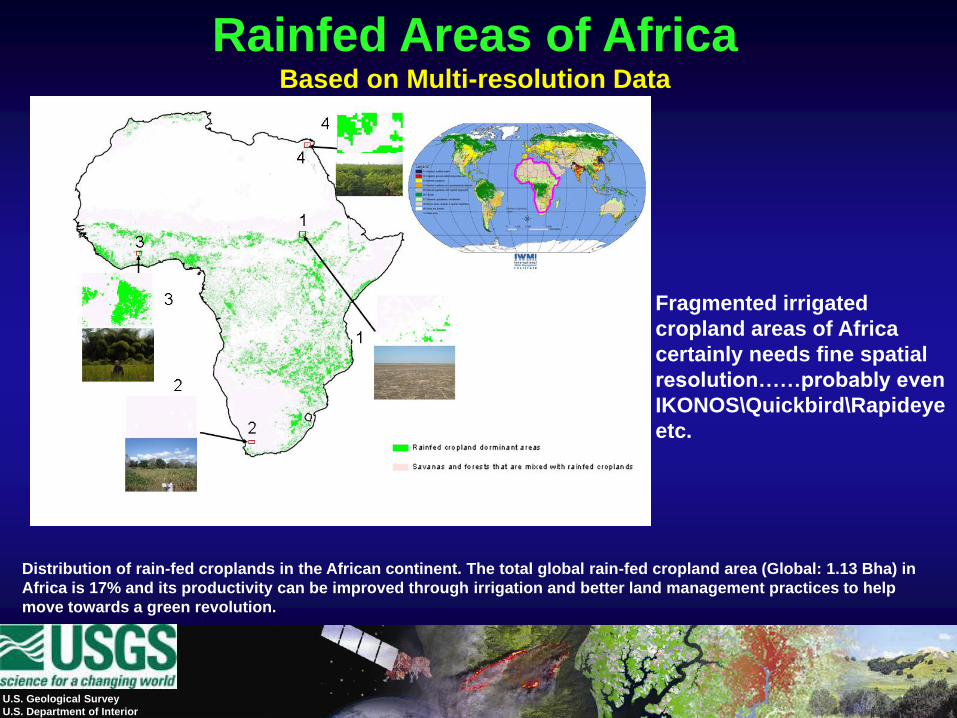
Distribution of rain-fed croplands in the African continent. The total global rain-fed cropland area (Global: 1.13 Bha) in
Africa is 17% and its productivity can be improved through irrigation and better land management practices to help
move towards a green revolution.
Rainfed Areas of Africa Based on Multi-resolution Data
Fragmented irrigated
cropland areas of Africa
certainly needs fine spatial
resolution……probably even
IKONOS\Quickbird\Rapideye
etc.
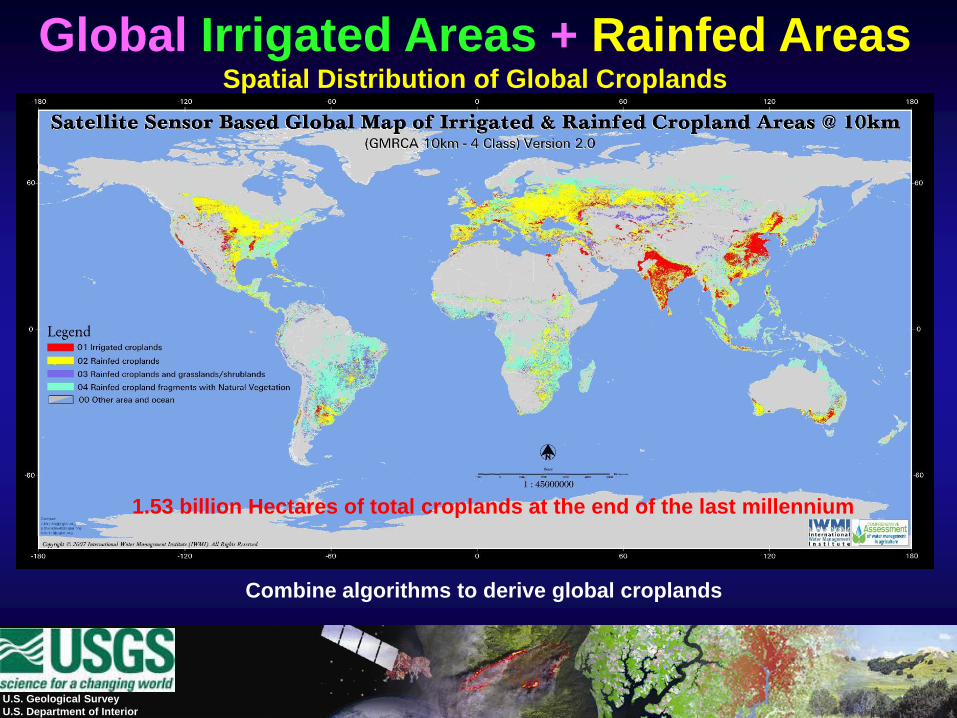
Global Irrigated Areas + Rainfed AreasSpatial Distribution of Global Croplands
1.53 billion Hectares of total croplands at the end of the last millennium
U.S. Geological Survey
U.S. Department of Interior
Combine algorithms to derive global croplands

U.S. Geological Survey
U.S. Department of Interior
PE&RS Special Issue on Remote Sensing of Global Croplands and Their Water Use: Call for Papers