a humidity sensor test - · page 2 of 20 relative references in relation to air temperature,...
TRANSCRIPT
Page 1 of 20
A Humidity Sensor Test
Kai C. Wong
Meteorological Service of Canada, 4905 Dufferin Street, Toronto, Ontario, Canada
ph: (416) 739-4139, fax: (416) 739-5721, email: [email protected]
Abstract
In this work, the performance of several humidity sensors that are currently in the market
is investigated in a field test. The sensors include the Rotronic MP100, Vaisala HMP155
and E plus E EE33 (the latter two in non-heating configuration). The relative humidity
reported by these sensors is compared to a reference value generated from two
Meteolabor VTP37 chilled mirror hygrometers that are installed along side with the
humidity sensors. The accuracy of relative humidity (RH) measurements under various
conditions, as well as the response at saturation, of these sensors is assessed. The study
also provides information on the performance of the VTP37 in winter conditions.
Introduction
In anticipation for the possible replacement the humidity sensor that is currently used in
the Environment Canada (EC) networks, a field test was conducted at the Observing
Systems and Engineering (OS&E) test site at the Centre for Atmospheric Research
Experiment (CARE) at Egbert, Ontario, Canada, from June 28, 2010 to June 28, 2011, to
assess the performances of several humidity sensors that are in the market. The sensors
that are included in the study are the Rotronic MP100, Vaisala HMP155, E plus E EE33.
The relative humidity measured by these capacitive humidity sensors is compared to a
reference value generated from two Meteolabor VTP37 chilled mirror hygrometers. This
paper describes the accuracy performance, and response at saturation, of these humidity
sensors, and the performance of the two VTP37 chilled mirror hygrometers in winter
conditions. Dew, as well as frost, can be formed on the chilled mirror at sub-zero
temperatures, and VTP37 has an indication of when ice is detected on the mirror and
adjusts its calculation of the relative humidity accordingly. This study provides some
field data on the performance of the VTP37 hygrometers.
Previous Studies
A WMO International Hygrometer Intercomparison ([7]) was held at the Norwegian
Meteorological Institute from February 1987 to March 1989, included psychrometers,
hair, resistive and capacitive hygrometers, and chilled-mirror hygrometers, together 20
different humidity sensors. Some of these instruments were installed in open air, and
some inside a specially constructed screen. In the absence of absolute reference, relative
reference values were constructed using chilled mirror hygrometers for the humidity
sensors in open air, and chilled mirror hygrometers and psychrometers for inside the
screen. The Meteolabor VTP6 chilled mirror hygrometer was used in the generation of
both the inside and outside references. The humidity sensors were compared to the
Page 2 of 20
relative references in relation to air temperature, relative humidity and certain weather
phenomena.
In order to find suitable replacements of the humidity sensor in its networks, the Royal
Netherlands Meteorological Institute (KNMI) conducted laboratory and field tests ([1]
and [2]) on humidity sensors from Vaisala (HMT337 and HMT317, heated), Rotronic
(Hygroclip) and E plus E (EE31, EE33 heated). In the laboratory, the accuracy and
response time of these sensors were tested in a climate chamber. In the field, only
HMT337 and EE33 were tested, with Meteolabor Thygan as the reference instrument,
and in every 2 months the sensors were checked in the laboratory to keep track of their
stability. Preliminary results from the field test showed that the sensors of the same type
deviate very little from each other, about 0.2%RH, and the difference between HMT337
and EE33 is about 1.5%RH. It was also observed that some sensors responded at different
speeds in case of condensation/fog.
A WMO field intercomparison of humidity sensors (and thermometer screens) ([5]) was
held from the 1st of November 2008 to the 31
st of October 2009, at Ghardaïa, Algeria,
included capacitive humidity sensors and chilled-mirror hygrometers, a total of 8
different types of sensors. Two references were used in the intercomparison: the
Meteolabor Thygan VTP37, the combination of VTP6 and a control unit, was chosen
initially as the reference, but because the data from the Thygan sensors were available
only for a portion of the test period due to a data acquisition failure, a working reference
was constructed as the average of two Vaisala HMP45 sensors in the same screen, using
the Thygan sensors as the primary reference. Accuracy, consistency, annual drift, and
influence of temperature and relative humidity were the aspects investigated.
Sensors, Test Site and Installation
The following humidity sensors are included in the field test: Rotronic MP100, Vaisala
HMP155, E plus E EE33, all capacitive sensors. Both HMP155 and EE33 have warmed
probe configuration, in which the sensing element is kept a few degrees above the
ambient air temperature, thus preventing condensation on the probe and allowing
measurements in high humidity. In this field test, only the non-warmed probe
configurations of HMP155 and EE33 are tested. The capacitive sensors outputs their
measurements, temperature and relative humidity, in voltages, and these are logged
minutely using a Campbell Scientific data logger CR10X.
Two Meteolabor Thygan VTP37 chilled mirror hygrometers are used to generate
reference values for the comparison. The Thygan hygrometer was recommended by the
Commission of Instruments and Methods of Observation (WMO-No. 807) for use as a
working reference, including at temperatures below 0°C, and it was used as a reference in
all three field studies cited above. The VTP37, in the normal mode, operates in a 10
minute cycle, and at the end of this cycle 10 measurements of temperature and dew point
are made within a 40-second period, and the instrument transmits, through RS232, the
average values, their standard deviations, calculated RH value, and status information.
Page 3 of 20
The capacitive humidity sensors and the Thygan hygrometers were installed at the OS&E
test site at Egbert, Ontario, in late June 2010. The site is located 80 km north of Toronto
in a rural agricultural and forested region. The latitude, longitude and elevation are
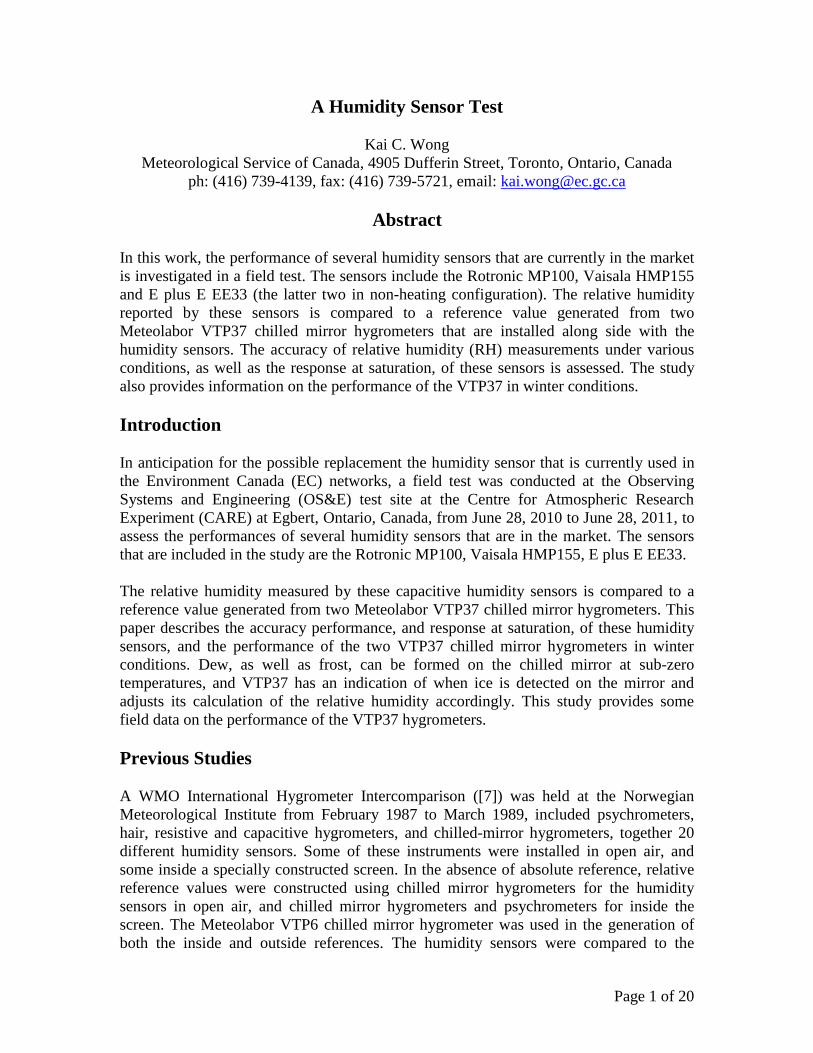
44°13'58.44"N, 79°46'53.28"W and 249 m respectively. The test site, the locations of the
capacitive, chilled-mirror humidity sensors and other supporting sensors, are displayed in
Figure 1.
The two Thygan VTP37 sensors, labelled as D2 and D3, were installed at position 11 and
12 respectively, while the capacitive sensors inside two aspirated Stevenson screens at
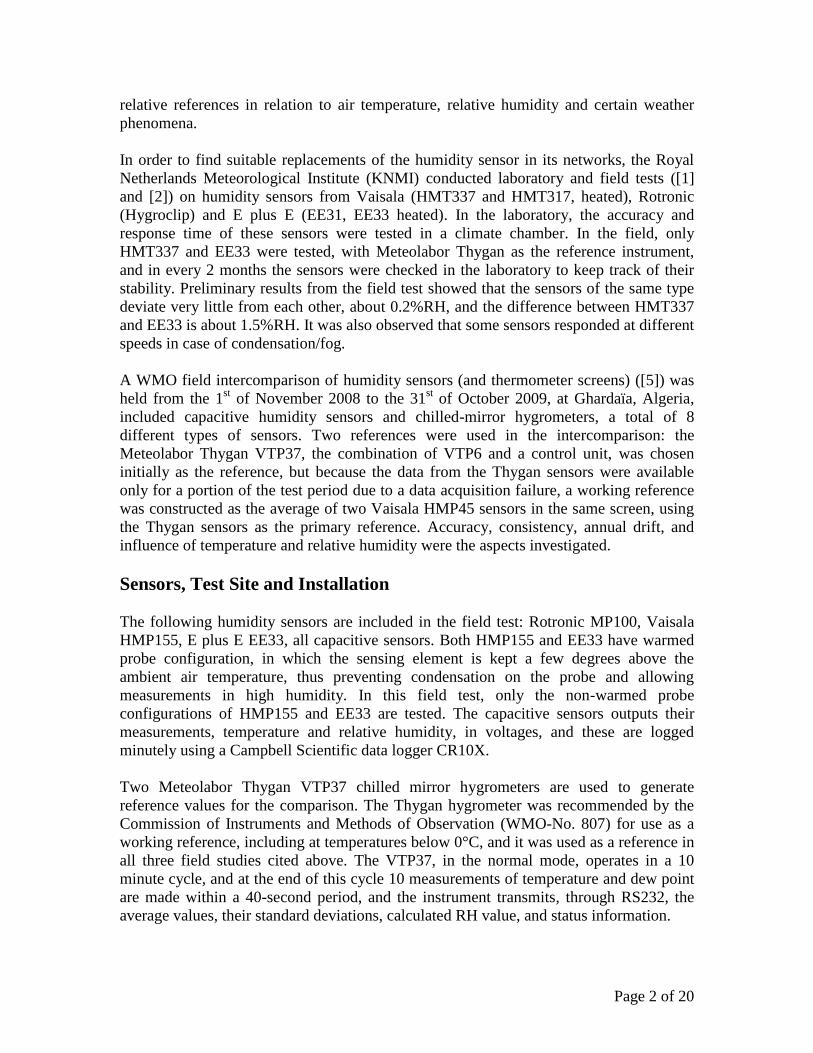
position 11A (labelled as D4) and 22 (labelled as D5). The installation of the capacitive
sensors (one from each model of the capacitive sensors, HMP155, MP100 and EE33) is
shown in Figure 2. Two YSI 44212 temperatures sensors were also installed inside the
screen, one inside the duct and the other outside. It turned out that the Thygan D3 (at
position 12) had a defective temperature sensor and it was replaced by another VTP37 in
early October, 2010.
Figure 1 - CARE site with the OS&E humidity sensor test site indicated by the star, and positions of
the chilled-mirror and capacitive humidity sensors.
Figure 2 - Installation of capacitive sensors inside a Stevenson screen.
The data quality control (QC) procedures for automatic weather stations of [10] are
adopted, when appropriate, for ensuring the integrity of the data.
Page 4 of 20
Thygan Performance
Air Temperature Measurement of Thygan
Since the reference Thygan VTP37 and the capacitive sensors are installed in separate
enclosures, the temperatures differences, if any, between Thygan and the Stevenson
screens is examined. The median of the differences is, for the Thygan D2 sensor, about
+0.3°C during the day and +0.1°C during the night, and, for the Thygan D3 sensor, about
+0.2°C during the day and close to zero during the night, above the duct temperatures in
Stevenson screen D4 and D5.
Thygan performance at sub-zero temperatures
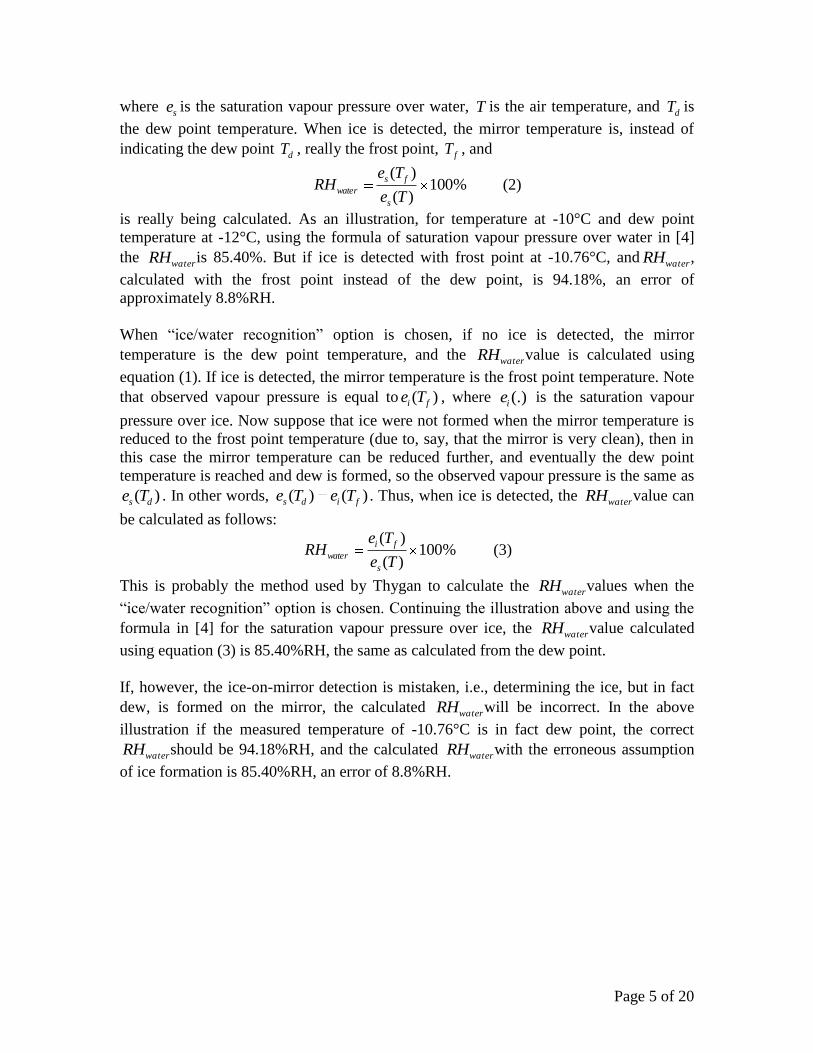
“Oscillations” are observed in the chilled mirror temperature measurements of the two
Thygan sensors at sub-zero temperatures, an example of which is shown in Figure 3 (a)
for December 9th
, 2010. There are 35 similar days from December 2010 to mid February
2011, about a half of the days. A closer examination of Figure 3 (a) reveals that the
oscillation in December 9th
mainly occurs from about 02:00 to 06:00, and from 17:00 to
24:00.
This behaviour of the mirror temperature is probably due to the fact that at temperatures
below zero, water vapour can become saturated with respect to ice, as well as water,
resulting in ice or dew formation on the mirror. Thygan identifies the nature of the layer
formed on the mirror, whether ice or dew, and transmits that information in its output
message. Figure 3 (b) shows the statuses of the two Thygan sensors for December 9th
,
where “0000” indicates that the sensor is operating normally, “0001” that ice-on-mirror is
detected, “0004” that mirror has been cleaned, and “0128” that the sensor has been
initialized. Ice is found on the mirrors of both Thygan for the most part of the day.
Furthermore, as evident from Figure 3 (b) the ice-on-mirror status oscillates between
“ice” and “no-ice” in the two periods during which the oscillation of mirror temperature
occurs. Between these two periods, the ice-on-mirror status indicates “ice” consistently,
and the mirror temperatures of the two Thyan sensors are in closer agreement with each
other than they are in those two periods.
In the ice-on-mirror situation Thygan can adjust the calculation of the RH (with respect to
water) accordingly. It has the option on choosing the calculation of the RH values with
and without ice/water recognition. If “no ice/water recognition” option is chosen,
according to an email communication with Meteolabor the RH values is always
calculated using the formula for water, and therefore the calculation is wrong when ice is
formed on the mirror.
To see this in detail, recall that the RH with respect to water, RHwater, is:
%100)(
)(
Te
TeRH
s
dswater (1)
Page 5 of 20
where se is the saturation vapour pressure over water, T is the air temperature, and
dT is
the dew point temperature. When ice is detected, the mirror temperature is, instead of
indicating the dew point dT , really the frost point, fT , and
%100)(
)(
Te
TeRH
s
fs
water (2)
is really being calculated. As an illustration, for temperature at -10°C and dew point
temperature at -12°C, using the formula of saturation vapour pressure over water in [4]
the waterRH is 85.40%. But if ice is detected with frost point at -10.76°C, and waterRH ,
calculated with the frost point instead of the dew point, is 94.18%, an error of
approximately 8.8%RH.
When “ice/water recognition” option is chosen, if no ice is detected, the mirror
temperature is the dew point temperature, and the waterRH value is calculated using
equation (1). If ice is detected, the mirror temperature is the frost point temperature. Note
that observed vapour pressure is equal to )( fi Te , where (.)ie is the saturation vapour
pressure over ice. Now suppose that ice were not formed when the mirror temperature is
reduced to the frost point temperature (due to, say, that the mirror is very clean), then in
this case the mirror temperature can be reduced further, and eventually the dew point
temperature is reached and dew is formed, so the observed vapour pressure is the same as
)( ds Te . In other words, )()( fids TeTe . Thus, when ice is detected, the waterRH value can
be calculated as follows:
%100)(
)(
Te
TeRH
s
fi
water (3)
This is probably the method used by Thygan to calculate the waterRH values when the
“ice/water recognition” option is chosen. Continuing the illustration above and using the
formula in [4] for the saturation vapour pressure over ice, the waterRH value calculated
using equation (3) is 85.40%RH, the same as calculated from the dew point.
If, however, the ice-on-mirror detection is mistaken, i.e., determining the ice, but in fact
dew, is formed on the mirror, the calculated waterRH will be incorrect. In the above
illustration if the measured temperature of -10.76°C is in fact dew point, the correct
waterRH should be 94.18%RH, and the calculated waterRH with the erroneous assumption
of ice formation is 85.40%RH, an error of 8.8%RH.
Page 6 of 20
Figure 3 – (a) Mirror temperatures, and (b) statuses of Thygan, of Thygan D2 and D3 on December
9, 2010.
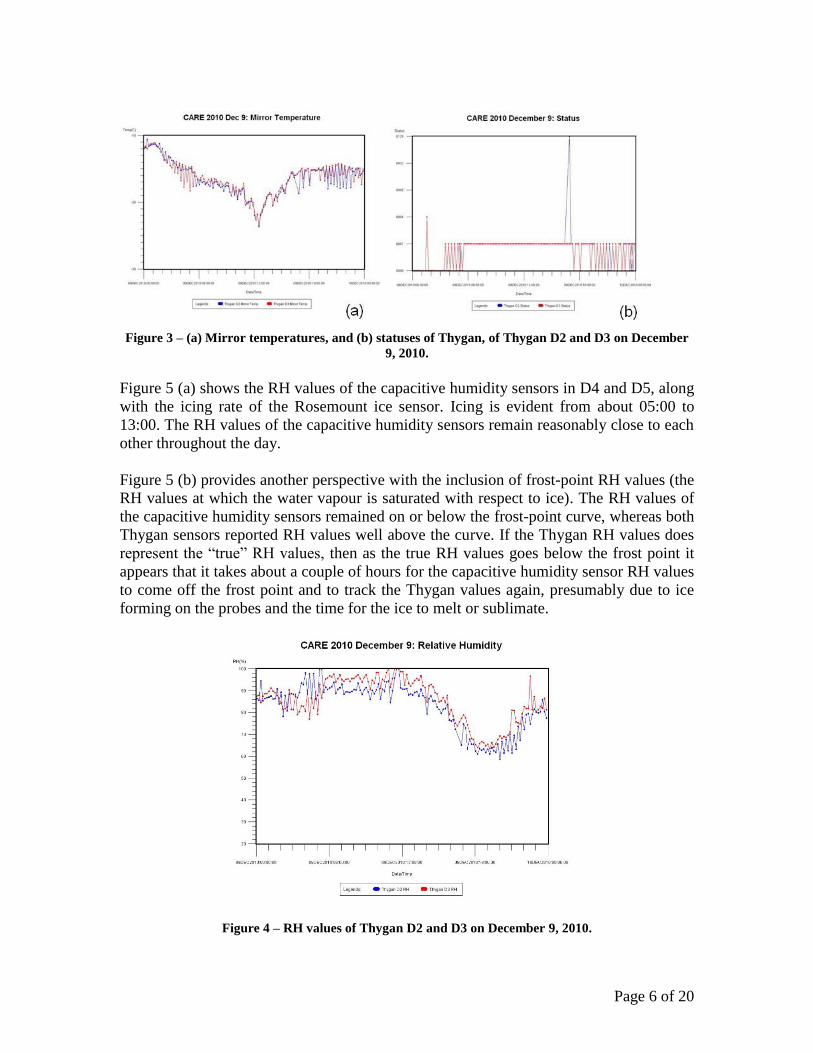
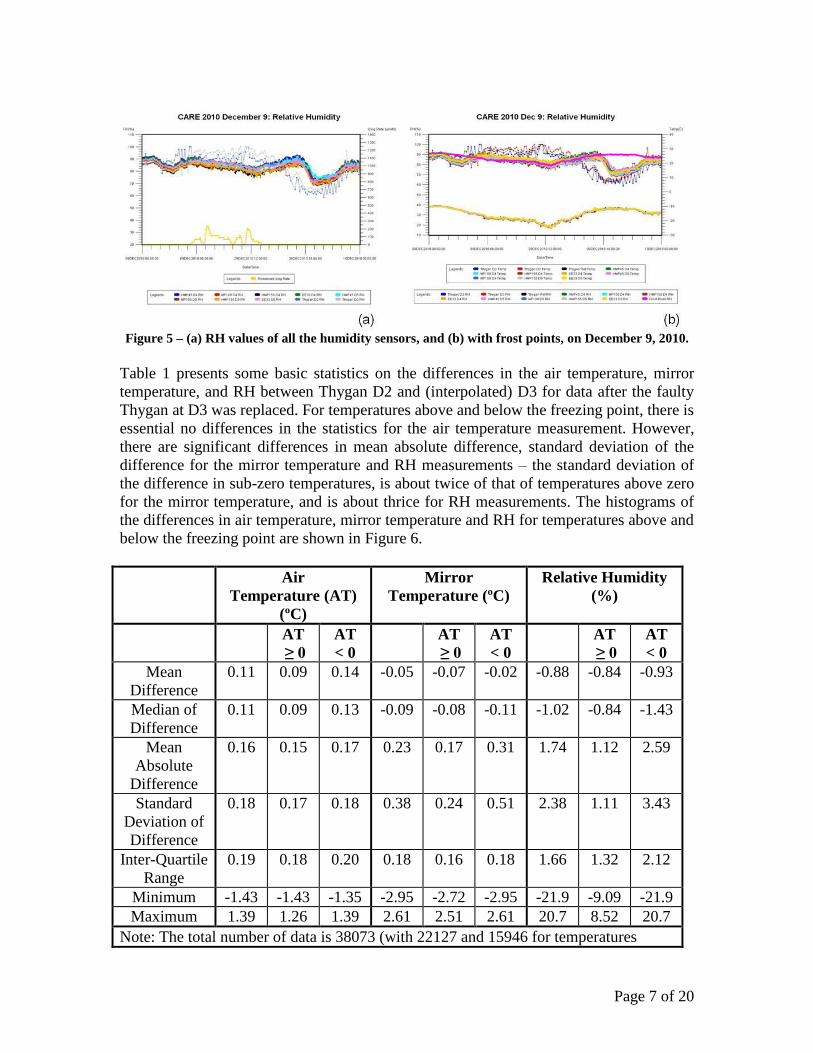
Figure 5 (a) shows the RH values of the capacitive humidity sensors in D4 and D5, along
with the icing rate of the Rosemount ice sensor. Icing is evident from about 05:00 to
13:00. The RH values of the capacitive humidity sensors remain reasonably close to each
other throughout the day.
Figure 5 (b) provides another perspective with the inclusion of frost-point RH values (the
RH values at which the water vapour is saturated with respect to ice). The RH values of
the capacitive humidity sensors remained on or below the frost-point curve, whereas both
Thygan sensors reported RH values well above the curve. If the Thygan RH values does
represent the “true” RH values, then as the true RH values goes below the frost point it
appears that it takes about a couple of hours for the capacitive humidity sensor RH values
to come off the frost point and to track the Thygan values again, presumably due to ice
forming on the probes and the time for the ice to melt or sublimate.
Figure 4 – RH values of Thygan D2 and D3 on December 9, 2010.
Page 7 of 20
Figure 5 – (a) RH values of all the humidity sensors, and (b) with frost points, on December 9, 2010.
Table 1 presents some basic statistics on the differences in the air temperature, mirror
temperature, and RH between Thygan D2 and (interpolated) D3 for data after the faulty
Thygan at D3 was replaced. For temperatures above and below the freezing point, there is
essential no differences in the statistics for the air temperature measurement. However,
there are significant differences in mean absolute difference, standard deviation of the
difference for the mirror temperature and RH measurements – the standard deviation of
the difference in sub-zero temperatures, is about twice of that of temperatures above zero
for the mirror temperature, and is about thrice for RH measurements. The histograms of
the differences in air temperature, mirror temperature and RH for temperatures above and
below the freezing point are shown in Figure 6.
Air
Temperature (AT)
(ºC)
Mirror
Temperature (ºC)
Relative Humidity
(%)
AT
≥ 0
AT
< 0
AT
≥ 0
AT
< 0
AT
≥ 0
AT
< 0
Mean
Difference
0.11 0.09 0.14 -0.05 -0.07 -0.02 -0.88 -0.84 -0.93
Median of
Difference
0.11 0.09 0.13 -0.09 -0.08 -0.11 -1.02 -0.84 -1.43
Mean
Absolute
Difference
0.16 0.15 0.17 0.23 0.17 0.31 1.74 1.12 2.59
Standard
Deviation of
Difference
0.18 0.17 0.18 0.38 0.24 0.51 2.38 1.11 3.43
Inter-Quartile
Range
0.19 0.18 0.20 0.18 0.16 0.18 1.66 1.32 2.12
Minimum -1.43 -1.43 -1.35 -2.95 -2.72 -2.95 -21.9 -9.09 -21.9
Maximum 1.39 1.26 1.39 2.61 2.51 2.61 20.7 8.52 20.7
Note: The total number of data is 38073 (with 22127 and 15946 for temperatures

Page 8 of 20
above and below zero respectively). Extreme points are removed and the limits are
1.44 for air temperature, 3 for mirror temperature, and 22% for RH.
Table 1 – General statistics on the Thygan sensors.
Figure 6 – Histograms of air temperature differences, mirror temperature differences, and RH
differences for air temperature above and below zero Celsius.
Reference Generation and Data Selection
Reference Generation
The reference temperature, and the reference RH value, is taken as the average of the two
Thygan temperatures, and as the average of the two Thygan RH values, respectively if
1. the absolute differences of the two Thygan temperatures is less than or equal
to 0.1°C,
2. the absolute differences of the two Thygan RH values is less than or equal to
1%RH,
3. for each Thygan sensor, if its temperature is less than 0°C, then its RH value
must be below the frost-point curve (see [6]).
Note that because Thygan D3 had a defective temperature sensor and was replaced on
October 2nd
, 2010, the reference temperature and RH value are taken to be those of
Thygan D2 before that day.
The Thygan sensor performs, and reports, its measurements every 10 minutes. Generally
two Thygan sensors would not report their data at the same time. Even if the two sensors
are synchronized at the start, their internal clocks may drift at different rates, or restart at
Page 9 of 20
different times after a power failure. To compensate for timing difference, the 10-
minutely values of air temperature, dew point temperature, and RH of Thygan D3 are
interpolated linearly to obtain the intervening minutely values. The Thygan D2 values, at
10-minute intervals, are compared with the Thygan D3, or interpolated if no values
available at that minute, values. The rationale of only interpolating one of the Thygan
sensors and still generating the reference values at 10-minute intervals is to minimize any
error introduced by the interpolation process. It is reasonable to assume that, when one of
the Thygan is out of synchronization with the other, the clocks are off by just a minute or
two and the error introduced by interpolation should be small. If interpolation is applied
to both sensors to generate minutely reference values, a large number of reference values
are based on interpolated data alone and at times when neither Thygan sensor performs
measurement. The error introduced would be larger. Of course, one could require that the
reference value be generated only at time when both Thygans report, but the number
reference values could potentially be very small.
The first condition of checking the consistency of the two Thygan temperatures is to
ensure that the reference temperature is more likely correct. This reference temperature
will be used, as discussed below, to select data from the test sensors for comparison. The
limit of 0.1°C is the resolution of the Thygan sensor.
The second condition is to ensure the likely correctness of the RH reading of the two
Thygan sensors. The current consistency limit of 1%RH is about the accuracy of a
chilled-mirror hygrometer ([8]).
The third condition is to ensure that the reference RH value is always below the frost-
point curve, because the capacitive humidity sensors in the test only report relative
humidity below the frost-point curve.
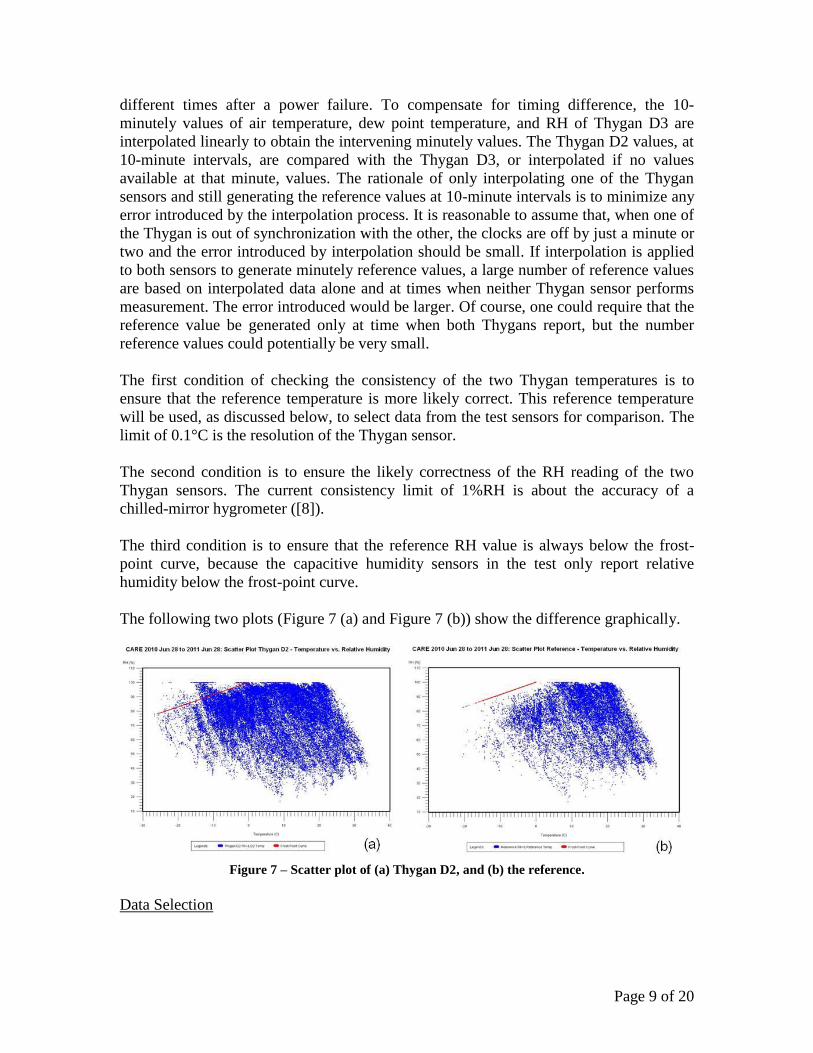
The following two plots (Figure 7 (a) and Figure 7 (b)) show the difference graphically.
Figure 7 – Scatter plot of (a) Thygan D2, and (b) the reference.
Data Selection
Page 10 of 20
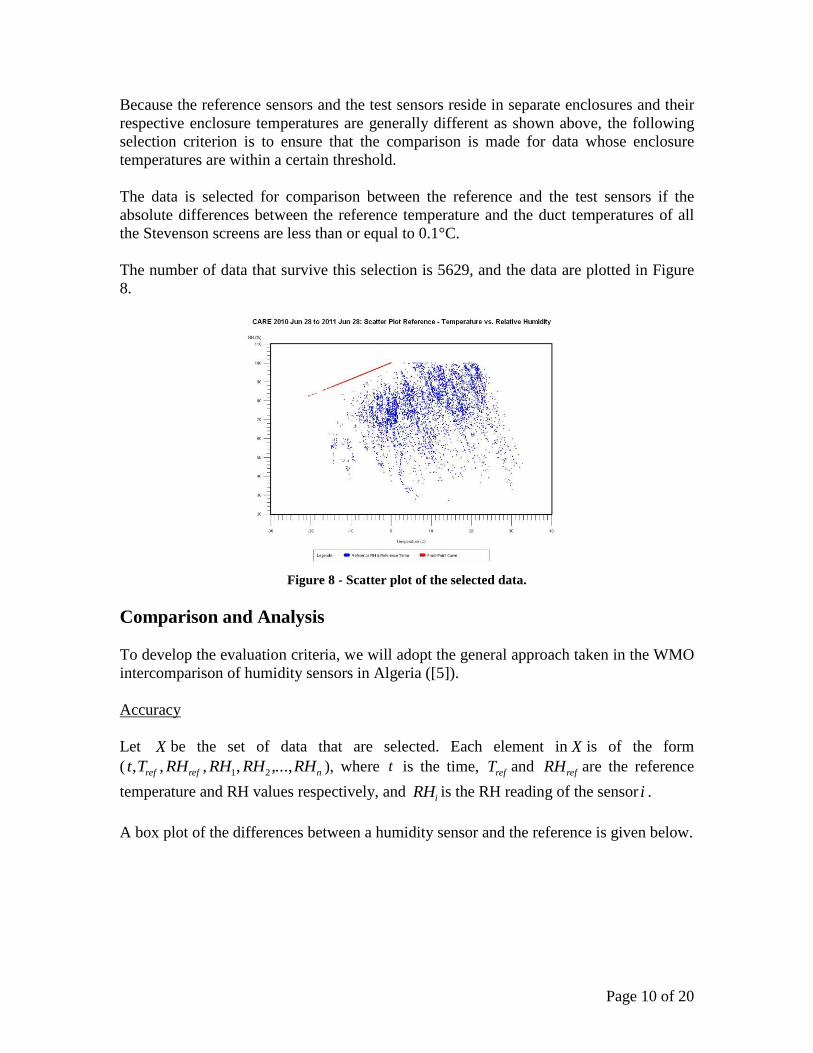
Because the reference sensors and the test sensors reside in separate enclosures and their
respective enclosure temperatures are generally different as shown above, the following
selection criterion is to ensure that the comparison is made for data whose enclosure
temperatures are within a certain threshold.
The data is selected for comparison between the reference and the test sensors if the
absolute differences between the reference temperature and the duct temperatures of all
the Stevenson screens are less than or equal to 0.1°C.
The number of data that survive this selection is 5629, and the data are plotted in Figure
8.
Figure 8 - Scatter plot of the selected data.
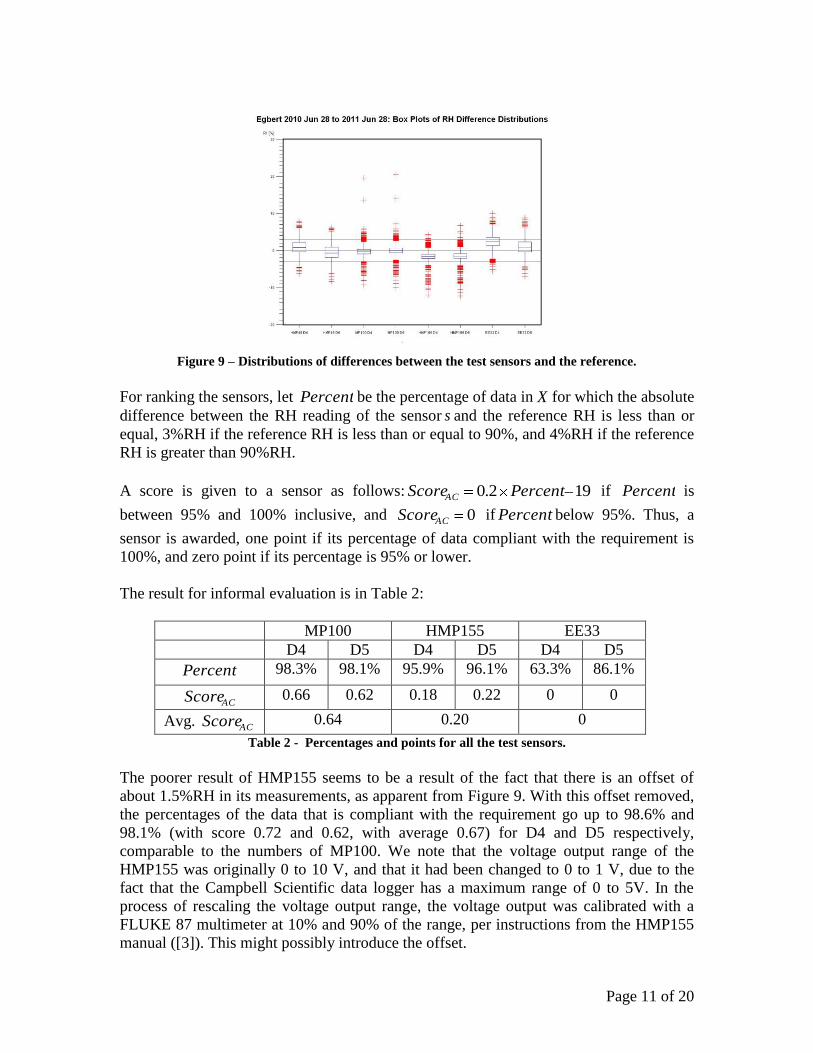
Comparison and Analysis
To develop the evaluation criteria, we will adopt the general approach taken in the WMO
intercomparison of humidity sensors in Algeria ([5]).
Accuracy
Let X be the set of data that are selected. Each element in X is of the form
( nrefref RHRHRHRHTt ,...,,,,, 21 ), where t is the time, refT and refRH are the reference
temperature and RH values respectively, and iRH is the RH reading of the sensor i .
A box plot of the differences between a humidity sensor and the reference is given below.
Page 11 of 20
Figure 9 – Distributions of differences between the test sensors and the reference.
For ranking the sensors, let Percent be the percentage of data in X for which the absolute
difference between the RH reading of the sensor s and the reference RH is less than or
equal, 3%RH if the reference RH is less than or equal to 90%, and 4%RH if the reference
RH is greater than 90%RH.
A score is given to a sensor as follows: 192.0 PercentScoreAC if Percent is
between 95% and 100% inclusive, and 0ACScore if Percent below 95%. Thus, a
sensor is awarded, one point if its percentage of data compliant with the requirement is
100%, and zero point if its percentage is 95% or lower.
The result for informal evaluation is in Table 2:
MP100 HMP155 EE33
D4 D5 D4 D5 D4 D5
Percent 98.3% 98.1% 95.9% 96.1% 63.3% 86.1%
ACScore 0.66 0.62 0.18 0.22 0 0
Avg. ACScore 0.64 0.20 0
Table 2 - Percentages and points for all the test sensors.
The poorer result of HMP155 seems to be a result of the fact that there is an offset of
about 1.5%RH in its measurements, as apparent from Figure 9. With this offset removed,
the percentages of the data that is compliant with the requirement go up to 98.6% and
98.1% (with score 0.72 and 0.62, with average 0.67) for D4 and D5 respectively,
comparable to the numbers of MP100. We note that the voltage output range of the
HMP155 was originally 0 to 10 V, and that it had been changed to 0 to 1 V, due to the
fact that the Campbell Scientific data logger has a maximum range of 0 to 5V. In the
process of rescaling the voltage output range, the voltage output was calibrated with a
FLUKE 87 multimeter at 10% and 90% of the range, per instructions from the HMP155
manual ([3]). This might possibly introduce the offset.
Page 12 of 20
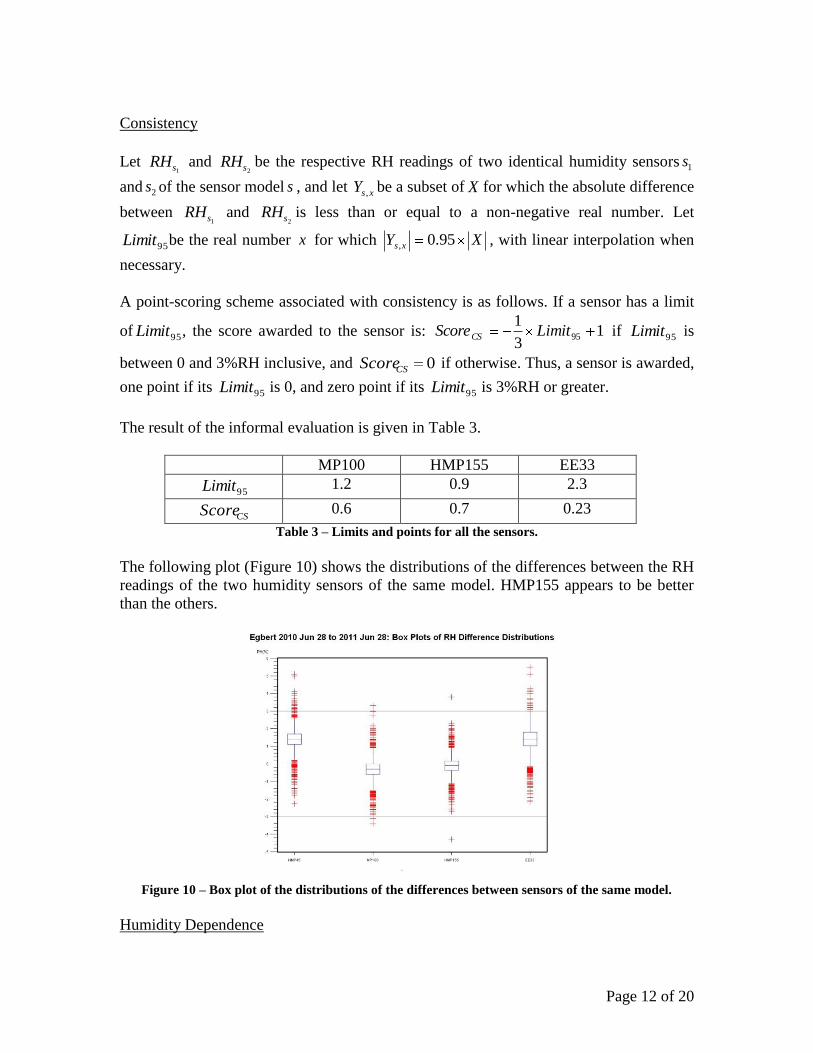
Consistency
Let 1sRH and
2sRH be the respective RH readings of two identical humidity sensors 1s
and 2s of the sensor model s , and let xsY , be a subset of X for which the absolute difference
between 1sRH and
2sRH is less than or equal to a non-negative real number. Let
95Limit be the real number x for which XY xs 95.0, , with linear interpolation when
necessary.
A point-scoring scheme associated with consistency is as follows. If a sensor has a limit
of 95Limit , the score awarded to the sensor is: 13
195LimitScoreCS if 95Limit is
between 0 and 3%RH inclusive, and 0CSScore if otherwise. Thus, a sensor is awarded,
one point if its 95Limit is 0, and zero point if its 95Limit is 3%RH or greater.
The result of the informal evaluation is given in Table 3.
MP100 HMP155 EE33
95Limit 1.2 0.9 2.3
CSScore 0.6 0.7 0.23
Table 3 – Limits and points for all the sensors.
The following plot (Figure 10) shows the distributions of the differences between the RH
readings of the two humidity sensors of the same model. HMP155 appears to be better
than the others.
Figure 10 – Box plot of the distributions of the differences between sensors of the same model.
Humidity Dependence
Page 13 of 20
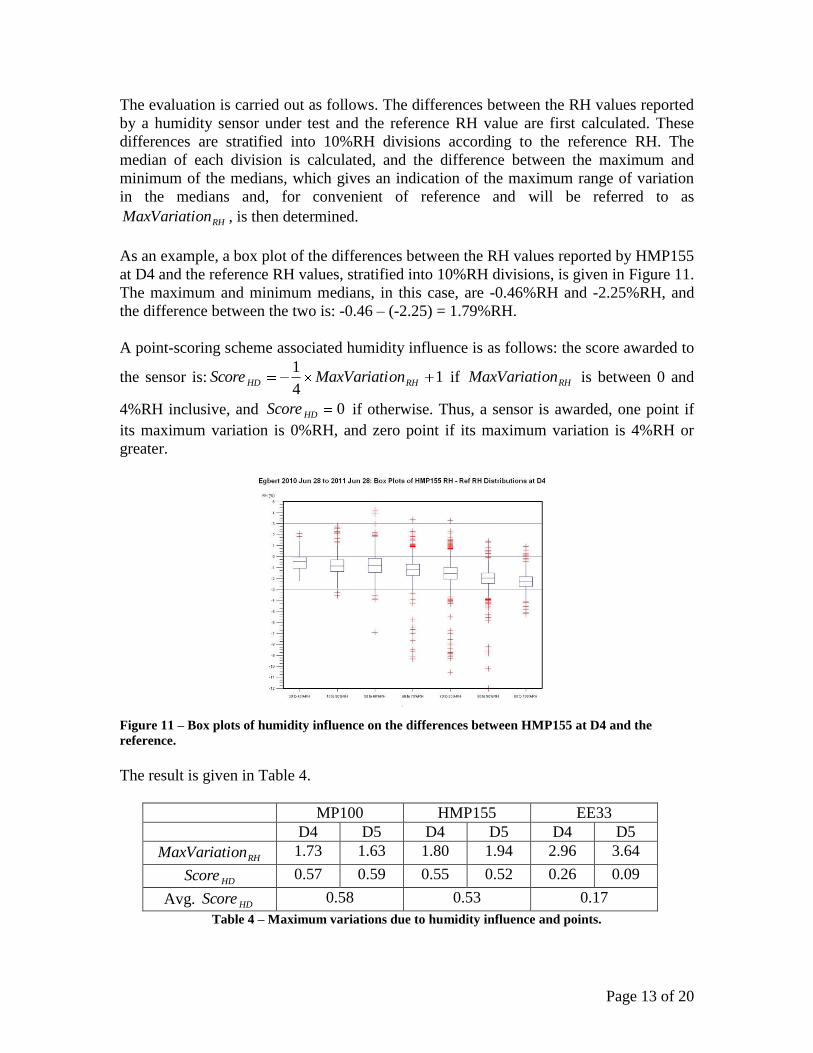
The evaluation is carried out as follows. The differences between the RH values reported
by a humidity sensor under test and the reference RH value are first calculated. These
differences are stratified into 10%RH divisions according to the reference RH. The
median of each division is calculated, and the difference between the maximum and
minimum of the medians, which gives an indication of the maximum range of variation
in the medians and, for convenient of reference and will be referred to as
RHonMaxVariati , is then determined.
As an example, a box plot of the differences between the RH values reported by HMP155
at D4 and the reference RH values, stratified into 10%RH divisions, is given in Figure 11.
The maximum and minimum medians, in this case, are -0.46%RH and -2.25%RH, and
the difference between the two is: -0.46 – (-2.25) = 1.79%RH.
A point-scoring scheme associated humidity influence is as follows: the score awarded to
the sensor is: 14
1RHHD onMaxVariatiScore if RHonMaxVariati is between 0 and
4%RH inclusive, and 0HDScore if otherwise. Thus, a sensor is awarded, one point if
its maximum variation is 0%RH, and zero point if its maximum variation is 4%RH or
greater.
Figure 11 – Box plots of humidity influence on the differences between HMP155 at D4 and the
reference.
The result is given in Table 4.
MP100 HMP155 EE33
D4 D5 D4 D5 D4 D5
RHonMaxVariati 1.73 1.63 1.80 1.94 2.96 3.64
HDScore 0.57 0.59 0.55 0.52 0.26 0.09
Avg. HDScore 0.58 0.53 0.17
Table 4 – Maximum variations due to humidity influence and points.
Page 14 of 20
Temperature Dependence
The evaluation is carried out as follows. The differences between the RH values reported
by a humidity sensor under test and the reference RH value are first calculated. These
differences are stratified into 5°C divisions according to the reference temperature. The
median of each division is calculated, and the difference between the maximum and
minimum of the medians, which gives an indication of the maximum range of variation
in the medians and, for convenient of reference and will be referred to as TonMaxVariati ,
is then determined.
As an example, a box plot of the differences between the RH values reported by HMP155
at D4 and the reference RH values, stratified into 5°C divisions, is given in Figure 12.
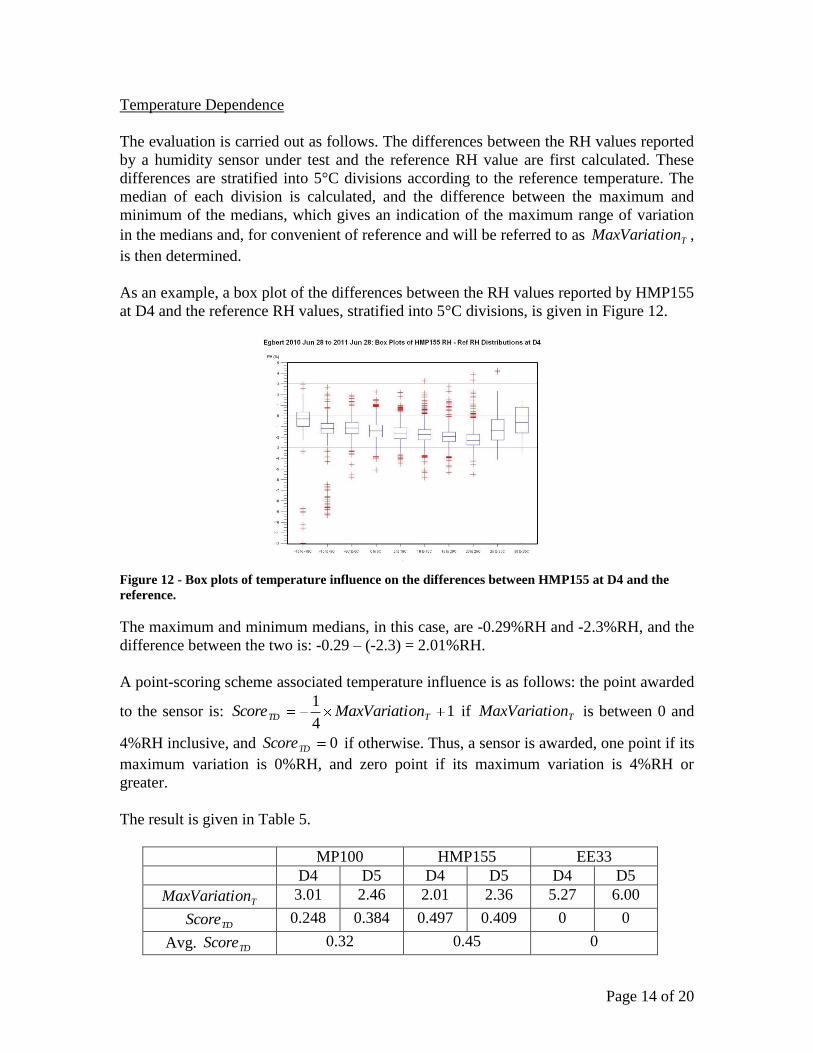
Figure 12 - Box plots of temperature influence on the differences between HMP155 at D4 and the
reference.
The maximum and minimum medians, in this case, are -0.29%RH and -2.3%RH, and the
difference between the two is: -0.29 – (-2.3) = 2.01%RH.
A point-scoring scheme associated temperature influence is as follows: the point awarded
to the sensor is: 14
1TTD onMaxVariatiScore if TonMaxVariati is between 0 and
4%RH inclusive, and 0TDScore if otherwise. Thus, a sensor is awarded, one point if its
maximum variation is 0%RH, and zero point if its maximum variation is 4%RH or
greater.
The result is given in Table 5.
MP100 HMP155 EE33
D4 D5 D4 D5 D4 D5
TonMaxVariati 3.01 2.46 2.01 2.36 5.27 6.00
TDScore 0.248 0.384 0.497 0.409 0 0
Avg. TDScore 0.32 0.45 0
Page 15 of 20
Table 5 - Maximum variations due to temperature influence and points.
The combined influence of humidity and temperature on the accuracies of the sensors can
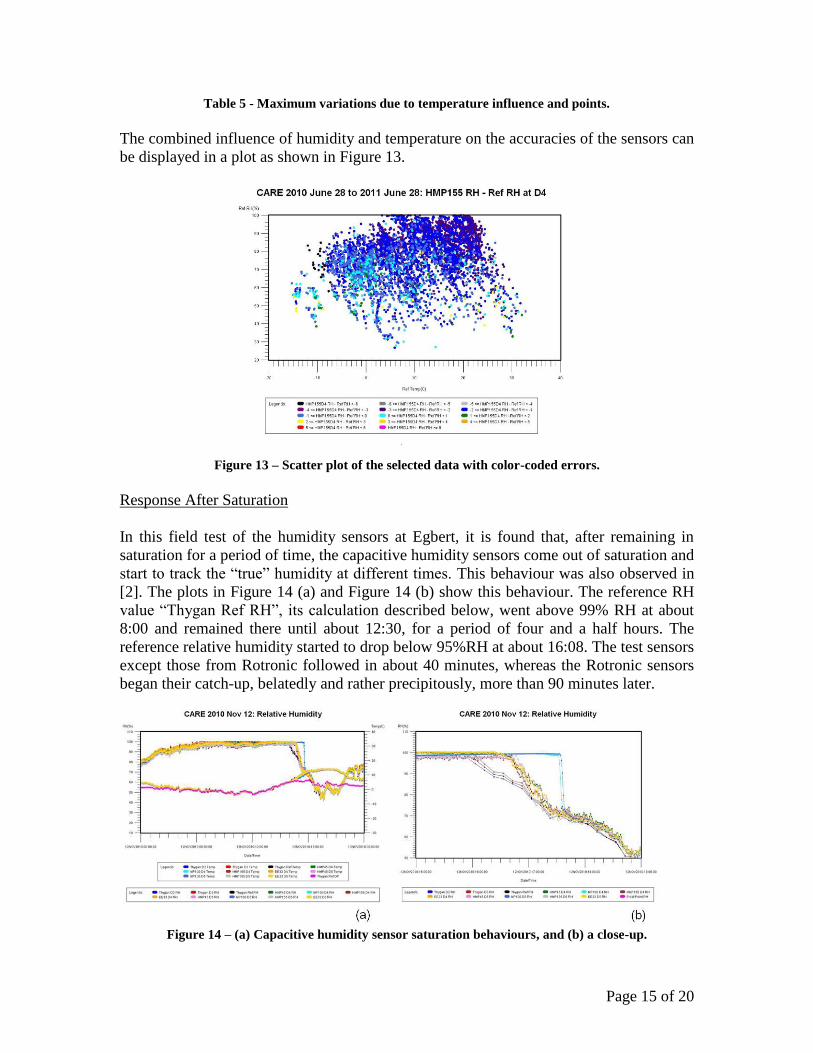
be displayed in a plot as shown in Figure 13.
Figure 13 – Scatter plot of the selected data with color-coded errors.
Response After Saturation
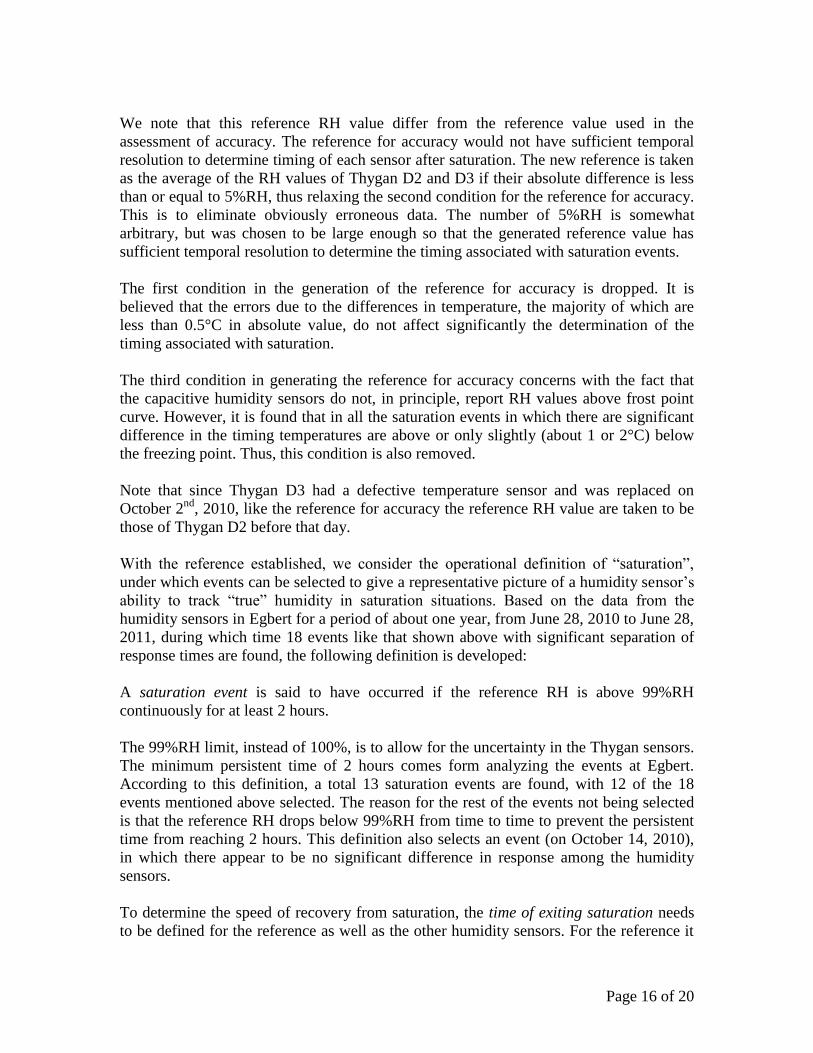
In this field test of the humidity sensors at Egbert, it is found that, after remaining in
saturation for a period of time, the capacitive humidity sensors come out of saturation and
start to track the “true” humidity at different times. This behaviour was also observed in
[2]. The plots in Figure 14 (a) and Figure 14 (b) show this behaviour. The reference RH
value “Thygan Ref RH”, its calculation described below, went above 99% RH at about
8:00 and remained there until about 12:30, for a period of four and a half hours. The
reference relative humidity started to drop below 95%RH at about 16:08. The test sensors
except those from Rotronic followed in about 40 minutes, whereas the Rotronic sensors
began their catch-up, belatedly and rather precipitously, more than 90 minutes later.
Figure 14 – (a) Capacitive humidity sensor saturation behaviours, and (b) a close-up.
Page 16 of 20
We note that this reference RH value differ from the reference value used in the
assessment of accuracy. The reference for accuracy would not have sufficient temporal
resolution to determine timing of each sensor after saturation. The new reference is taken
as the average of the RH values of Thygan D2 and D3 if their absolute difference is less
than or equal to 5%RH, thus relaxing the second condition for the reference for accuracy.
This is to eliminate obviously erroneous data. The number of 5%RH is somewhat
arbitrary, but was chosen to be large enough so that the generated reference value has
sufficient temporal resolution to determine the timing associated with saturation events.
The first condition in the generation of the reference for accuracy is dropped. It is
believed that the errors due to the differences in temperature, the majority of which are
less than 0.5°C in absolute value, do not affect significantly the determination of the
timing associated with saturation.
The third condition in generating the reference for accuracy concerns with the fact that
the capacitive humidity sensors do not, in principle, report RH values above frost point
curve. However, it is found that in all the saturation events in which there are significant
difference in the timing temperatures are above or only slightly (about 1 or 2°C) below
the freezing point. Thus, this condition is also removed.
Note that since Thygan D3 had a defective temperature sensor and was replaced on
October 2nd
, 2010, like the reference for accuracy the reference RH value are taken to be
those of Thygan D2 before that day.
With the reference established, we consider the operational definition of “saturation”,
under which events can be selected to give a representative picture of a humidity sensor’s
ability to track “true” humidity in saturation situations. Based on the data from the
humidity sensors in Egbert for a period of about one year, from June 28, 2010 to June 28,
2011, during which time 18 events like that shown above with significant separation of
response times are found, the following definition is developed:
A saturation event is said to have occurred if the reference RH is above 99%RH
continuously for at least 2 hours.
The 99%RH limit, instead of 100%, is to allow for the uncertainty in the Thygan sensors.
The minimum persistent time of 2 hours comes form analyzing the events at Egbert.
According to this definition, a total 13 saturation events are found, with 12 of the 18
events mentioned above selected. The reason for the rest of the events not being selected
is that the reference RH drops below 99%RH from time to time to prevent the persistent
time from reaching 2 hours. This definition also selects an event (on October 14, 2010),
in which there appear to be no significant difference in response among the humidity
sensors.
To determine the speed of recovery from saturation, the time of exiting saturation needs
to be defined for the reference as well as the other humidity sensors. For the reference it
Page 17 of 20
is defined as the time when its RH finally drops below 95%RH. The 95%RH value is
chosen so that it is certain that the saturation has ended for the event.
For the other humidity sensors, the time of exiting saturation is defined as the time when
the RH value of the sensor finally drops below the average RH value of the same sensor
for the period during which the reference indicates saturation (i.e., persistently above
99%RH) less 5%RH. The use of the average RH value of the sensor during saturation
instead of a fixed value such as 95%RH as in the case of the reference is to account for
the situation that the sensor under test might exhibit an offset. For instance, when the
reference indicates saturation, the sensor might report values around 98%RH. The 5%RH
reduction of the average value again is used as a means to ascertain that the saturation has
indeed ended as seen by the sensor. Thus, the limit for determining exit time for this
sensor is 98% - 5% = 93%RH.
The delay of the sensor in coming out of saturation with respect to that of the reference is
simply the difference between the two exit times.
The scoring scheme for response after saturation follows is as follows: the point awarded
to the sensor is: 1180
1DelayScore RS if Delay is between 0 and 180 (minutes)
inclusive, 1RSScore if Delay is negative, and 0RSScore if Delay is greater than 180
(minutes). Thus, a sensor is awarded, one point if its delay is 0 minute, and zero point if
its delay is 180 minutes or greater.
The results of test at Egbert are given below.
Time Delay and Point Awarded (June 28, 2010 to June 28, 2011)
Time Delay (minutes) MP100 HMP155 EE33 D4 D5 D4 D5 D4 D5
July 14 102 107 31 44 47 43 Aug 11 101 110 35 49 57 47 Sept 11 102 109 45 40 73 71 Sept 26 116 122 38 63 62 35 Sept 30 107 114 40 48 40 56 Oct 14 25 17 17 17 26 16 Oct 15 122 123 51 49 56 56 Oct 25 41 51 23 17 45 18 Nov 9 142 148 68 56 76 68 Nov 10 43 43 29 22 22 23 Nov 12 85 88 40 44 36 45 Nov 13 73 73 30 30 37 28 Jan 1 61 55 10 33 33 10 Jun 5 117 112 46 48 53 52
Average Delay 88.4 90.9 35.9 40.0 47.4 40.6
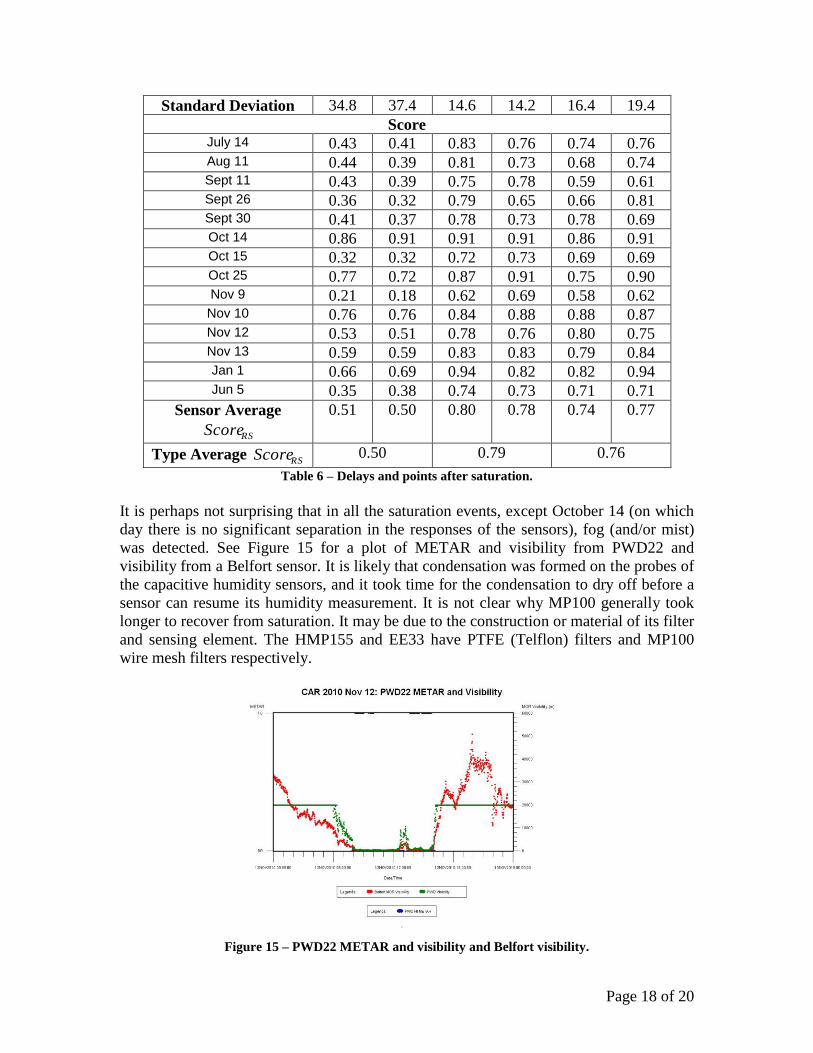
Page 18 of 20
Standard Deviation 34.8 37.4 14.6 14.2 16.4 19.4
Score July 14 0.43 0.41 0.83 0.76 0.74 0.76 Aug 11 0.44 0.39 0.81 0.73 0.68 0.74 Sept 11 0.43 0.39 0.75 0.78 0.59 0.61 Sept 26 0.36 0.32 0.79 0.65 0.66 0.81 Sept 30 0.41 0.37 0.78 0.73 0.78 0.69 Oct 14 0.86 0.91 0.91 0.91 0.86 0.91 Oct 15 0.32 0.32 0.72 0.73 0.69 0.69 Oct 25 0.77 0.72 0.87 0.91 0.75 0.90 Nov 9 0.21 0.18 0.62 0.69 0.58 0.62 Nov 10 0.76 0.76 0.84 0.88 0.88 0.87 Nov 12 0.53 0.51 0.78 0.76 0.80 0.75 Nov 13 0.59 0.59 0.83 0.83 0.79 0.84 Jan 1 0.66 0.69 0.94 0.82 0.82 0.94 Jun 5 0.35 0.38 0.74 0.73 0.71 0.71
Sensor Average
RSScore
0.51 0.50 0.80 0.78 0.74 0.77
Type Average RSScore 0.50 0.79 0.76
Table 6 – Delays and points after saturation.
It is perhaps not surprising that in all the saturation events, except October 14 (on which
day there is no significant separation in the responses of the sensors), fog (and/or mist)
was detected. See Figure 15 for a plot of METAR and visibility from PWD22 and
visibility from a Belfort sensor. It is likely that condensation was formed on the probes of
the capacitive humidity sensors, and it took time for the condensation to dry off before a
sensor can resume its humidity measurement. It is not clear why MP100 generally took
longer to recover from saturation. It may be due to the construction or material of its filter
and sensing element. The HMP155 and EE33 have PTFE (Telflon) filters and MP100
wire mesh filters respectively.
Figure 15 – PWD22 METAR and visibility and Belfort visibility.
Page 19 of 20
Summary
We summarize the evaluation criteria developed above and discuss various related issues.
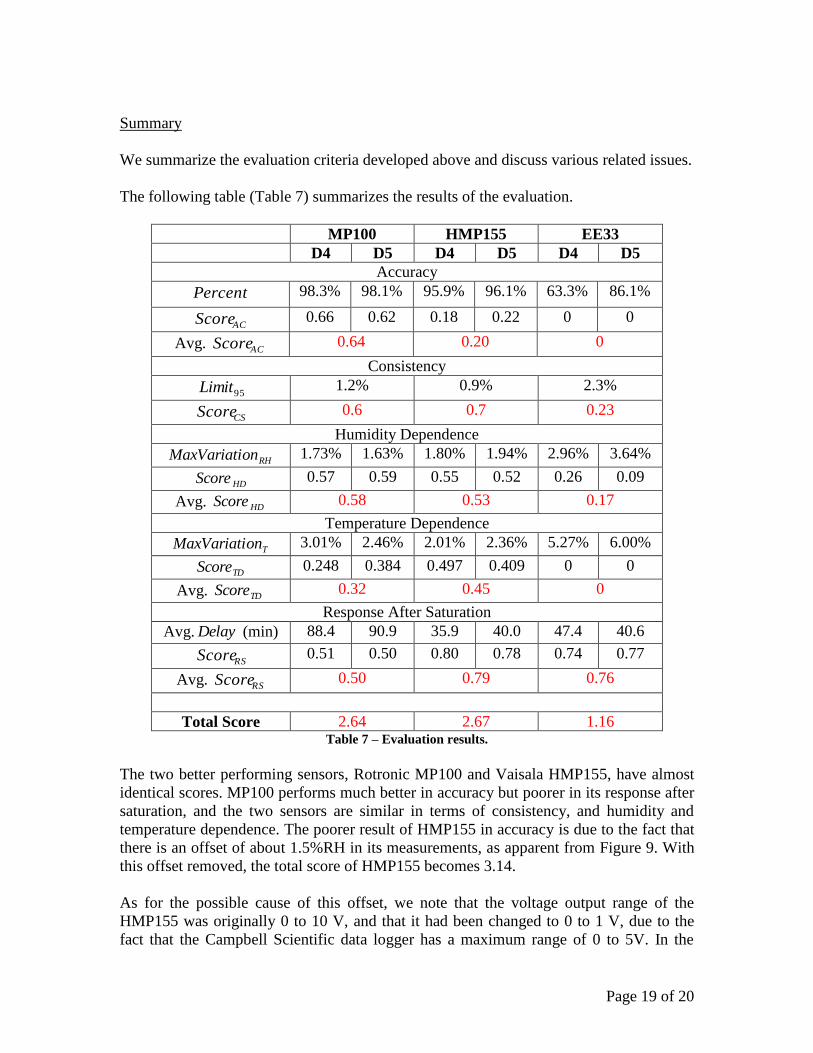
The following table (Table 7) summarizes the results of the evaluation.
MP100 HMP155 EE33
D4 D5 D4 D5 D4 D5
Accuracy
Percent 98.3% 98.1% 95.9% 96.1% 63.3% 86.1%
ACScore 0.66 0.62 0.18 0.22 0 0
Avg. ACScore 0.64 0.20 0
Consistency
95Limit 1.2% 0.9% 2.3%
CSScore 0.6 0.7 0.23
Humidity Dependence
RHonMaxVariati 1.73% 1.63% 1.80% 1.94% 2.96% 3.64%
HDScore 0.57 0.59 0.55 0.52 0.26 0.09
Avg. HDScore 0.58 0.53 0.17
Temperature Dependence
TonMaxVariati 3.01% 2.46% 2.01% 2.36% 5.27% 6.00%
TDScore 0.248 0.384 0.497 0.409 0 0
Avg. TDScore 0.32 0.45 0
Response After Saturation
Avg. Delay (min) 88.4 90.9 35.9 40.0 47.4 40.6
RSScore 0.51 0.50 0.80 0.78 0.74 0.77
Avg. RSScore 0.50 0.79 0.76
Total Score 2.64 2.67 1.16 Table 7 – Evaluation results.
The two better performing sensors, Rotronic MP100 and Vaisala HMP155, have almost
identical scores. MP100 performs much better in accuracy but poorer in its response after
saturation, and the two sensors are similar in terms of consistency, and humidity and
temperature dependence. The poorer result of HMP155 in accuracy is due to the fact that
there is an offset of about 1.5%RH in its measurements, as apparent from Figure 9. With
this offset removed, the total score of HMP155 becomes 3.14.
As for the possible cause of this offset, we note that the voltage output range of the
HMP155 was originally 0 to 10 V, and that it had been changed to 0 to 1 V, due to the
fact that the Campbell Scientific data logger has a maximum range of 0 to 5V. In the
Page 20 of 20
process of rescaling the voltage output range, the voltage output was calibrated with a
FLUKE 87 multimeter at 10% and 90% of the range, per instructions from the HMP155
manual ([3]). This possibly introduced the offset.
Conclusions
This field study assesses the performance of several capacitive humidity sensors as well
as the chilled-mirror hygrometer VTP37. Two areas are worth noting: One is that the
capacitive humidity sensors generally recover at different rates from a prolonged period
of saturation. This is consistent with the observation of a previous work. An attempt has
been made in this assessment to quantify the speed of the recovery. The other is that there
is a wider dispersion (about three times) in the difference of RH measurements between
two VTP37 in temperatures below zero than above zero. This occurs even though the
VTP37 has the ability to identify the nature of the layer on the mirror, and adjusts its RH
calculation accordingly.
Acknowledgement
The humidity sensors in the Egbert were installed, and maintained, by Sorin Pinzariou.
The layout of the Egbert test site and the pictures of sensors are courtesy of him.
References
[1] Bloemink, H.I. and R. van Krimpen, KNMI humidity sensor test, TECO 2006.
[2] Bloemink, H.I.: Humidity sensors for land and maritime stations. TECO 2008.
[3] HMP155 Humidity Sensor, Vaisala brochure, 2009.
[4] Huffman, G.J. and Norman, Jr., G.A., The supercooled warm rain process and the
specification of freezing precipitation, Monthly Weather Review, Vol. 116, pp.
2172-2182, 1988.
[5] Lacombe, M. and Bousri, D. and Leroy, M. and Mezred, M., WMO Field
Intercomparison of Thermometer Screens/Shields and Humidity Measuring
Instruments, Ghardaia, Algeria, November 2008 – October 2009, Instruments and
Observing Methods Report No. 106, WMO/TD-No. 1579, 2011.
[6] Makkonen, L., Comments on “a method for rescaling humidity sensors at
temperatures well below freezing”, Journal of Atmospheric and oceanic
technology, vol. 13, pp. 911-912, 1996.
[7] Skaar, J. and Hegg, K. and Moe, T. and Smedstud, K., WMO International
Hygrometer Intercomparison, WMO Instruments and Observing Methods Report
No. 38 (WMO/TD-No. 316), 1989.
[8] Tennermann, J., The chilled mirror dew point hygrometer as a measurement
standard, Sensors, Vol. 16, pp. 49-54, 1999.
[9] Ventilated thermohygrometer VTP37, Meteolabor Brochure.
[10] World Meteorological Organization Final Report of the Commission for Basic
Systems – Open Programme Area Group on Integrated Observing Systems
Expert Team on Requirements for Data from Automatic Stations, Geneva
(Switzerland), 20-24 March 2006.