a historical perspective on tech job growth · a historical perspective on tech job growth. 2 dr....
TRANSCRIPT

1
A Historical Perspective on Tech Job Growth

2
Dr. Michael Mandel
Director, Center for Emerging Employment
Chief Economic Strategist Progressive Policy Institute
January 10, 2017
Updated January 12, 2017
[email protected] 973-738-6749
3
Introduction General Motors reached 300,000 employees in 1941, 32 years after its 1909
founding. American Telephone & Telegraph hit the same milestone in 1926, 27 years
after its 1899 absorption of the local Bell systems. And Walmart went over 300,000
associates in its 1991 fiscal year, its 21st year as a public company.
But in 2016, Amazon became the fastest American company to reach 300,000 workers, hitting that mark in its 20th
year as a public company. This figure, which does not include contractors or temporary workers, represents an
average employment growth rate of roughly 30% per year. That figure was before Amazon’s January 12, 2017
promise to add more than 100,000 full-time jobs in the US over the next 18 months.
That’s an amazing growth rate. But Amazon is not alone. In fact, tech giants such as Google, Apple, Facebook and
Microsoft are adding jobs as fast or faster than the great job-producing companies of the past, like GM, AT&T,
Walmart, IBM, GE, US Steel, and Bethlehem Steel.
Consider this: Twenty years after its 1892 founding, General Electric had 41,000 employees. Google beat that
mark in 2012, only 8 years after its 2004 initial public offering.
Or let’s match Apple’s job growth up against Bethlehem Steel’s, which was the second largest steel maker and the
biggest shipbuilder during World War II. Apple hit 116,000 full-time equivalent employees in 2016, 35 years after
its fiscal year 1981 initial public offering. By comparison, Bethlehem Steel averaged roughly 95,000 employees
on payroll in 1939, 35 years after its 1904 incorporation. i (Indeed, Bethlehem Steel could trace its lineage much
further back to the founding of the Bethlehem Iron Company in 1861).
Even Facebook, the poster child for companies with high market values and low employment, looks better in
historical context. Facebook had 15,724 employees in the third quarter of 2016, its fifth year as a public company.
That doesn’t seem like much, but General Motors only had 20,000 in its fifth year of being incorporated as GM.
FedEx, one of the great job stories of all time, averaged 10,000 full-time equivalent employees in 1982, its fifth
year as a public company (see Table 1).
4
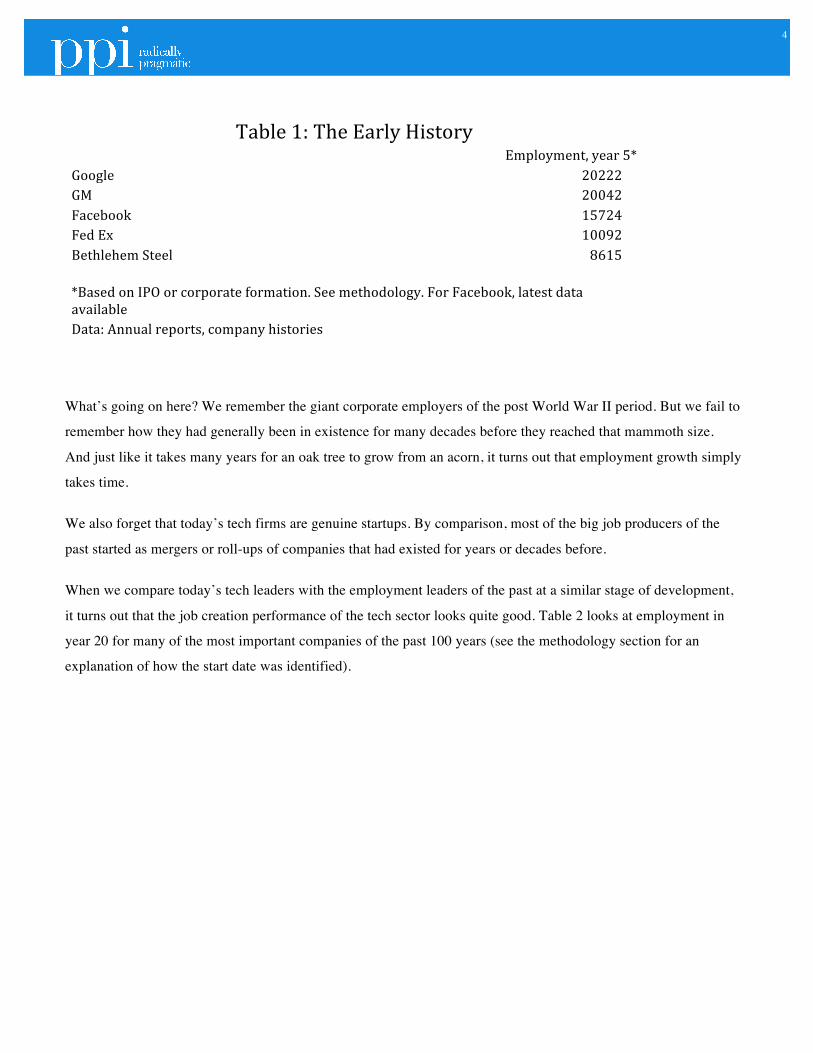
Table 1: The Early History
Employment, year 5*
Google 20222 GM 20042 Facebook 15724 Fed Ex 10092 Bethlehem Steel 8615 *Based on IPO or corporate formation. See methodology. For Facebook, latest data
available Data: Annual reports, company histories
What’s going on here? We remember the giant corporate employers of the post World War II period. But we fail to
remember how they had generally been in existence for many decades before they reached that mammoth size.
And just like it takes many years for an oak tree to grow from an acorn, it turns out that employment growth simply
takes time.
We also forget that today’s tech firms are genuine startups. By comparison, most of the big job producers of the
past started as mergers or roll-ups of companies that had existed for years or decades before.
When we compare today’s tech leaders with the employment leaders of the past at a similar stage of development,
it turns out that the job creation performance of the tech sector looks quite good. Table 2 looks at employment in
year 20 for many of the most important companies of the past 100 years (see the methodology section for an
explanation of how the start date was identified).

5
Table 2: How Tech Companies Compare to Some Big Job Creators of the Past
Company start date* year 1 year 20**
Amazon 1997 614 306800 Walmart 1971 1500 271000 General Motors (original) 1909 14250 208981 AT&T (original) 1899 19688 199914
US Steel 1901 168,000 191700 Fedex 1978 3224 130000
Apple 1997 8437 116000 Google 2004 3021 69953 year 13
Bethlehem Steel 1905 4882 57049 Microsoft 1985 998 57000 General Electric 1892 NA 41300 IBM 1924 3384 21251 Facebook 2012 4619 15724 year 5
Data: Annual reports, company histories.
*Based on IPO or corporate formation. See methodology **Includes first year. For Apple, Google, Amazon, Facebook latest data available
To be complete, Table 3 shows the current employment of top US tech and telecom companies. These figures will
be updated as companies report their 2016 results.

6
Table 3: Today’s Big Tech/Telecom
Employers
Company Employment*
IBM 377757 Amazon 306800 AT&T (new) 273140
Hewlett Packard Enterprise 195000 Verizon 162000 Comcast 153000 Oracle 136000 Apple 116000 Microsoft 114000 Intel 107300 Cisco 73700 Google 69953 HP 49000 Qualcomm 30500 Sprint 30000 Facebook 15724
* Latest data available as of January 11, 2017 Data: Annual and quarterly reports
Background
Let’s think back on the auto industry. Henry Ford unleashed his disruptive innovation on the automobile market in
1908. The Model T was a miracle of standardization and cost cutting, enabling Ford to make each vehicle faster
and more efficiently than his competitors.
At the same time, William Durant, an entrepreneur and salesman in Flint, Michigan, was creating General Motors.
Unlike Ford, however, Durant did not start from scratch. ii Durant rolled up thirteen car companies and ten parts-
and-accessories manufacturers into one huge multi-brand manufacturer, employing 14,250 employees in 1909,
GM’s first year of existence. This number quickly grew. By 1929, General Motors had more than 233,000 workers
in the United States and in other countries, including assembly plants located in London, Copenhagen, Stockholm,
Warsaw, Antwerp, Berlin, Buenos Aires, Sao Paulo, Osaka, Bombay, Wellington (New Zealand), Port Elizabeth
(South Africa), and multiple cities in Australia.iii
7
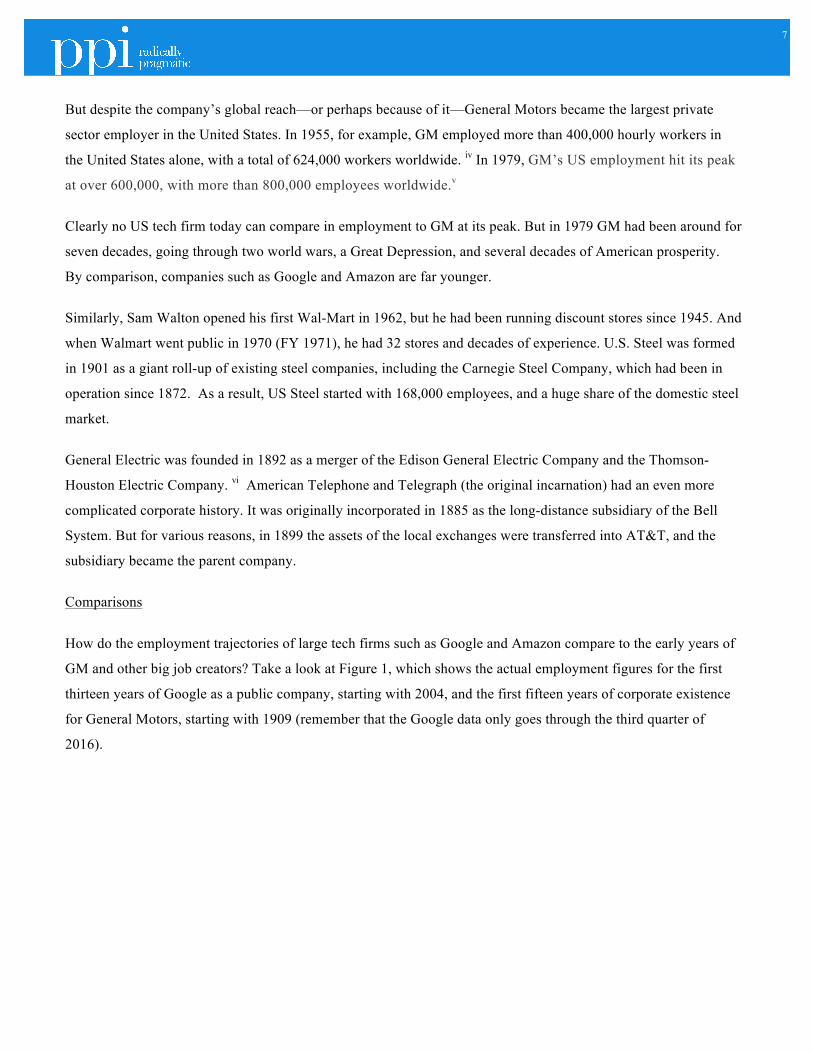
But despite the company’s global reach—or perhaps because of it—General Motors became the largest private
sector employer in the United States. In 1955, for example, GM employed more than 400,000 hourly workers in
the United States alone, with a total of 624,000 workers worldwide. iv In 1979, GM’s US employment hit its peak
at over 600,000, with more than 800,000 employees worldwide.v
Clearly no US tech firm today can compare in employment to GM at its peak. But in 1979 GM had been around for
seven decades, going through two world wars, a Great Depression, and several decades of American prosperity.
By comparison, companies such as Google and Amazon are far younger.
Similarly, Sam Walton opened his first Wal-Mart in 1962, but he had been running discount stores since 1945. And
when Walmart went public in 1970 (FY 1971), he had 32 stores and decades of experience. U.S. Steel was formed
in 1901 as a giant roll-up of existing steel companies, including the Carnegie Steel Company, which had been in
operation since 1872. As a result, US Steel started with 168,000 employees, and a huge share of the domestic steel
market.
General Electric was founded in 1892 as a merger of the Edison General Electric Company and the Thomson-
Houston Electric Company. vi American Telephone and Telegraph (the original incarnation) had an even more
complicated corporate history. It was originally incorporated in 1885 as the long-distance subsidiary of the Bell
System. But for various reasons, in 1899 the assets of the local exchanges were transferred into AT&T, and the
subsidiary became the parent company.
Comparisons
How do the employment trajectories of large tech firms such as Google and Amazon compare to the early years of
GM and other big job creators? Take a look at Figure 1, which shows the actual employment figures for the first
thirteen years of Google as a public company, starting with 2004, and the first fifteen years of corporate existence
for General Motors, starting with 1909 (remember that the Google data only goes through the third quarter of
2016).

8
We can see that Google is almost exactly paralleling GM’s early employment growth, with far fewer ups and
downs. Note also that GM had an extensive global presence almost from the beginning, so that a substantial share
of its employment was overseas.
We can make a similar comparison between GM and Amazon (Figure 2).
0
10000
20000
30000
40000
50000
60000
70000
80000
90000
100000
Data: Annual reports
FIgure 1: GM Jobs vs Google Jobs : The First Thirteen Years
GM
9
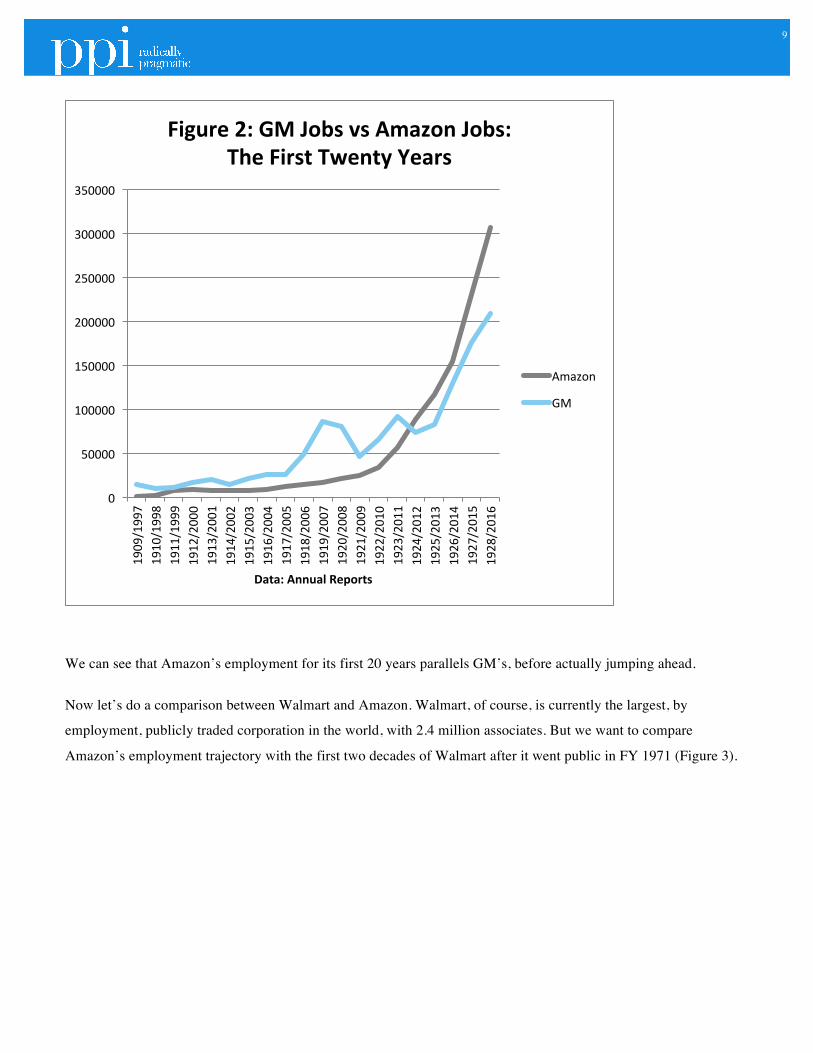
We can see that Amazon’s employment for its first 20 years parallels GM’s, before actually jumping ahead.
Now let’s do a comparison between Walmart and Amazon. Walmart, of course, is currently the largest, by
employment, publicly traded corporation in the world, with 2.4 million associates. But we want to compare
Amazon’s employment trajectory with the first two decades of Walmart after it went public in FY 1971 (Figure 3).
0
50000
100000
150000
200000
250000
300000
350000
1909/1997
1910/1998
1911/1999
1912/2000
1913/2001
1914/2002
1915/2003
1916/2004
1917/2005
1918/2006
1919/2007
1920/2008
1921/2009
1922/2010
1923/2011
1924/2012
1925/2013
1926/2014
1927/2015
1928/2016
Data: Annual Reports
Figure 2: GM Jobs vs Amazon Jobs: The First Twenty Years
Amazon
GM

10
What’s striking is just how similar the employment trajectories are between Walmart and Amazon.
Now let’s consider Apple, which originally went public in 1980 (FY 1981). Apple really had two starting points—
FY 1981, and then FY 1997, when Apple bought Next Software and Steve Jobs returned to the company he
founded. In Table 2 above, we used 1997 for the start date.
But as we also noted at the beginning of the paper, we can compare Apple to Bethlehem Steel, using the earlier
start date of FY 1981. That’s shown in Figure 4, below.
0
50000
100000
150000
200000
250000
300000
350000
1971/1997
1972/1998
1973/1999
1974/2000
1975/2001
1976/2002
1977/2003
1978/2004
1979/2005
1980/2006
1981/2007
1982/2008
1983/2009
1984/2010
1985/2011
1986/2012
1987/2013
1988/2014
1989/2015
1990/2016
1991/
Data: Annual Reports
Figure 3: Walmart Jobs vs Amazon Jobs: The First Twenty Years
Amazon
Walmart

11
Note that Bethlehem changed its method of calculating employment several times over this period.
Finally, let’s do a comparison of IBM and Microsoft, two companies that have a long history together. IBM, which
had more than 378,000 workers globally as of 2015, is one of the largest corporate employers in the world. By
comparison, Microsoft, with 114,000 employees, is a much smaller job creator.
But that comparison fails to take into account the difference in the age of the two firms. IBM started in 1911 as the
Computing- Tabulating- Recording Company (C-T-R), which was a merger of the Tabulating Machine Company,
with the International Time Recording Company and the Computing Scale Company of America, both of which
had been started a decade earlier.vii The new company had 1,300 employees and offices and plants in New York,
Michigan, Washington, D.C., and Canada. viii In 1924, more than 90 years ago, IBM changed its name from the
Computing- Tabulating- Recording Company (C-T-R) and became International Business Machines. By contrast,
it’s only been 31 years since Microsoft’s 1985 IPO.
0
20000
40000
60000
80000
100000
120000
140000
1904/1981
1906/1983
1908/1985
1910/1987
1912/1989
1914/1991
1916/1993
1918/1995
1920/1997
1922/1999
1924/2001
1926/2003
1928/2005
1930/2007
1932/2009
1934/2011
1936/2013
1938/2015
Data: Annual Reports
Figure 4: Bethlehem Steel vs Apple : The First Thirty-‐Five Years of Employment
Apple
Bethlehem Steel
12
In fact, Microsoft’s job growth over its three decades as a public company far exceeds IBM’s first three decades of
job growth. Since 1985, Microsoft averaged a 16.5% annual employment growth rate. By contrast, IBM grew from
roughly 3000 to 56,000 workers in the 31-year stretch from 1924 to 1955. That’s a strong 9.5% annual
employment growth rate, but still slower than Microsoft’s.ix We note that Microsoft’s domestic employment of
63,000 in 2016 substantially exceeds IBM’s 1955 domestic employment of 39,000.
Preliminary Discussion of Job Quality and Wages
We currently have underway an analysis of the quality and wages of tech/telecom jobs, including upstream and
downstream jobs. But for the purposes of this paper, we want to show some current data on average hourly wages
for selected tech and telecom industries, both for all employees and for productivity and nonsupervisory workers
(Table 5)

13
Table 5: Selected Tech/Telecom Industries, Average Hourly Wages, 2016
All workers
Average hourly wage
Software publishers
56.64 Computer systems design and related services 45.18 Data processing, hosting and related services 38.40 Telecommunications
32.16
Electronic shopping and electronic auctions 30.85 Total private
25.66
Production and nonsupervisory workers Average hourly wage Software publishers
45.46
Computer systems design and related services 41.27 Data processing, hosting and related services 30.54 Telecommunications
28.08
Electronic shopping and electronic auctions 25.57 Total private
21.55
Data: Bureau of Labor Statistics
We note that average hourly wages for the telecom and ecommerce industries are roughly 20-30% above the
average for the economy as a whole, both for all employees and for production and nonsupervisory workers. That
puts those industries solidly into the rank of “middle-class” jobs, though the concept of “middle-class” itself
requires more analysis and examination. Obviously we don’t have data on individual companies, but the aggregate
figures suggest that companies such as AT&T, Amazon, and Comcast are contributing to mid-skill jobs that are
open to a wide range of Americans. Indeed, companies such as AT&T are investing in their large existing
workforce to increase their skills levels and maintain them at middle-class levels.
Software publishers, computer programming firms, and Internet companies (not shown) typically have much
higher average wages. In that case we need a close examination of the upstream and downstream job creation to
understand the full range of jobs generated by the tech and telecom sectors. In earlier work, we have already shown
that the App Economy is generating in excess of a million jobs for non-tech workers. We will further expand those
results in the next paper.

14
Conclusion Today’s big tech companies are following a similar employment trajectory to the big job creators of the past. In the
next paper we will analyze the mix of jobs created by the tech sector, and the nature of the upstream and
downstream spillover effects.

15
Appendix: Methodology
Our goal is to compare the employment growth among firms from different eras. The current tech firms are
greenfield startups, in the sense that a new company was started from scratch and went public relatively soon
afterward. For these companies the fiscal year of the IPO is the logical starting point.
By comparison, most of the earlier big job-creators—such as US Steel, General Motors, and General Electric--were
generally formed by merging smaller, existing companies. For these companies, we picked the date of corporate
formation, that the company itself would pick as its beginning date. For AT&T and Bethlehem Steel, we picked the
date of corporate restructuring into its “final” form.
The two exceptions are IBM and Apple. As noted earlier, Apple has two natural start dates: FY 1981 for its IPO,
and FY 1997 for the return of Steve Jobs and the absorption of Next Software. IBM has two logical start dates:
1911, when C-T-R was formed, and 1924, when the company first took the name IBM. We chose the second one,
even though IBM itself celebrated its centennial in 2011.
We used employment data from annual reports when available, or corporate histories. In some cases, numbers from
different sources or different years of annual reports were inconsistent.

16
About PPI The Progressive Policy Institute is a catalyst for policy innovation and political reform based in Washington, D.C. Its mission is to create radically pragmatic ideas for moving America beyond ideological and partisan deadlock.
References i This number is for US workers, but Bethlehem had no plants or shipbuilding facilities outside of the country. ii http://www.mackinac.org/article.aspx?ID=651 iii 1929 GM annual report iv 1955 GM annual report vhttp://www.mlive.com/business/index.ssf/2008/09/a_brief_history_of_general_mot.html vi https://www.ge.com/about-us/fact-sheet vii https://www-03.ibm.com/ibm/history/history/decade_1900.html viii https://www-03.ibm.com/ibm/history/history/decade_1910.html ix We could start the comparison at 1911 for IBM, when C-T-R was created out of 3 smaller companies, and 1975 for Microsoft, when the company was first founded. But that comparison is even more favorable for Microsoft.