a guideline for efficient implementation of automation in ...640154/fulltext01.pdf · a guideline...
TRANSCRIPT
VOLVO GTO
Akademin för Innovation, Design och Teknik
A Guideline for Efficient Implementation of
Automation in Lean Manufacturing Environment
KPP231 Master Thesis
Advanced level, 30 credits
Product and process development, Innovative production
Masoud Zafarzadeh
Repport nr: KPP 231
Supervisor, company: Jan Berg
Supervisors, Mälardalens University: Jessica Bruch, Mats Jackson
Examiner: Sabah Audo
I
Abstract The competitive climate of production and high labour cost, motivate western companies to use
technologies like automation as a mean to increase manufacturing competitiveness. On the other hand
companies are aware about cost reductive policies like lean production which has shown noticeable
achievement; consequently some manufacturers tend to follow such system. In this situation, in order
to have lean enterprise, it is vital to find a clear picture of challenges and potentials of implementing
automation within a lean environment. If the process of developing automation is not efficient and
companies’ strategy and mission is not considered in time of project development, the result may not
be lean at the end. So finding an appropriate guideline that can be used in time of developing
automated projects is very important.
This thesis aims to develop a guideline that can be used in developing automation solutions to have
lean result at the end of the projects. The guidelines can be used in both assembly and manufacturing
development projects.
VOLVO GTO has chosen as the case study for this thesis. In order to find the answer of research
questions two main areas in manufacturing and assembly are marked.
Keywords: Lean automation, automation development, competitive manufacturing
II
Acknowledgment
I would like to express my gratitude to my supervisors Dr. Jessica Bruch and professor Mats Jackson for
the useful comments, remarks and engagement through the learning process of this master thesis. They
continually and convincingly conveyed a spirit of adventure in regard to research, and an excitement in
regard to teaching. Without their guidance and persistent help this dissertation would not have been
possible.
I would like to show my greatest appreciation to Jan Berg my company supervisor at VOLVO GTO. I
can’t say thanks enough for his tremendous support and help. I feel motivated and encouraged every time
I attend his meeting. Without his encouragement and guidance this project would not have materialized.
Also, hereby I admire the guidance and support received from all the people who contributed to this
thesis as interviewee which was vital for the success of the project. I am grateful for their kindness.
At last but not least I would like to say thanks to my beloved family that their constant support is the
highest motivation for me toward success.
III
Table of Contents Abstract ........................................................................................................................................................ I
Acknowledgment ......................................................................................................................................... II
List of Tables ............................................................................................................................................... III
List of Figures .............................................................................................................................................. IV
List of Abbreviations .................................................................................................................................... V
1. Introduction ............................................................................................................................................ 1
1.1 Background ........................................................................................................................................ 1
1.2 Problem area ...................................................................................................................................... 1
1.3 Aim and research questions ............................................................................................................... 2
1.4 Delimitation ....................................................................................................................................... 3
2. Frame of reference .................................................................................................................................. 4
2.1 Lean manufacturing ........................................................................................................................... 4
2.1.1 Waste reduction ......................................................................................................................... 4
2.1.2 Lean manufacturing indicators ................................................................................................... 5
2.2Automation ......................................................................................................................................... 6
2.2.1 Automation definition and driving forces .................................................................................. 6
2.2.2 Possible Automation Challenges ................................................................................................ 7
2.2.3 Human Touch in Automation ..................................................................................................... 8
2.2.4 Automation development and strategy ..................................................................................... 9
2.3 Automation development in lean environment ................................................................................ 15
3. Methodology ........................................................................................................................................ 18
3.1 Research method ............................................................................................................................. 18
3.2 Research process ............................................................................................................................. 19
3.3 Data collection ................................................................................................................................. 21
3.3.1 Interviews ................................................................................................................................. 21
3.3.2 Observation .............................................................................................................................. 21
3.3.3 Document studies .................................................................................................................... 22
3.3.4 Simulation ................................................................................................................................. 22
3.3.5 Value stream mapping ............................................................................................................. 22
3.4 Data analysis .................................................................................................................................... 22
IV
3.5 Validity and Reliability ................................................................................................................... 23
4. Empirical Findings ............................................................................................................................... 25
4.1 Case study introduction ................................................................................................................... 25
4.2 Automation development process ................................................................................................... 26
4.3 Current situation .............................................................................................................................. 28
4.3.1 Existing soft gear production cell (K7): ..................................................................................... 28
4.3.2 New automated cell within machining (K8) ............................................................................. 30
4.3.3 Existing Assembly area (Range assembly area) ......................................................................... 32
4.3.4 New Range Assembly Line ........................................................................................................ 33
4.4 Automation development potentials, Challenges and benefits at VOLVO GTO ............................ 36
4.4.1Automation challenges .............................................................................................................. 36
4.4.2 Automation benefits ................................................................................................................. 37
4.4.3 Potentials for Automation development ................................................................................. 37
5. Analysis ................................................................................................................................................ 39
5.1 Machining area ................................................................................................................................ 39
5.2 Assembly area .................................................................................................................................. 41
6. Lean automation development guideline .............................................................................................. 45
6.1 Improvement proposals ................................................................................................................... 45
7. Conclusion and further research ............................................................................................................ 50
8. References ......................................................................................................................................... 51
III
List of Tables Table 1 Lean production indicators check-list .............................................................................................. 5
Table 2 Automation levels ........................................................................................................................... 8
Table 3 Structured way of production development ................................................................................. 10
Table 4 Interview portfolio ......................................................................................................................... 21
Table 5 An example of I-PAP checklist ........................................................................................................ 27
Table 6 Analysis of K7 VSM ......................................................................................................................... 29
Table 7 Analysis of K8 VSM -Simulated process ......................................................................................... 32
Table 8 Analysis of AT robot cell VSM ........................................................................................................ 33
Table 9 Cost of losses within existing range assembly line ........................................................................ 34
Table 10 Challenges and problems categorization ..................................................................................... 38
Table 11 Comparing some indicators regarding automation in the machining area-K7&K8 ..................... 40
Table 12 comparing some indicators regarding automation in assembly area ......................................... 42
IV
List of Figures Figure 1 Muda, Muri, and Mura ................................................................................................................... 5
Figure 2 Hypothetical effects on varying the automation level for the automation balance ...................... 9
Figure 3 Warehouse automation development process ........................................................................... 11
Figure 4 Automation strategy model ......................................................................................................... 15
Figure 5 Case Study Design ......................................................................................................................... 19
Figure 6 Thesis Design ................................................................................................................................ 20
Figure 7 Empirical Study scope ................................................................................................................... 20
Figure 8 VOLVO GTO scope of Business ..................................................................................................... 25
Figure 9 Early Equipment Management (EEM) steps process in VOLVO ................................................... 26
Figure 10 K7 layout ..................................................................................................................................... 28
Figure 11 K7 value stream map .................................................................................................................. 29
Figure 12 K8 layout .................................................................................................................................... 31
Figure 13 Current assembly area-Layout ................................................................................................... 32
Figure 14 AT robot cell layout .................................................................................................................... 33
Figure 15 New range assembly line layout ................................................................................................. 35
Figure 16 Lean automation development guideline .................................................................................. 45
Figure 17 Simulation of K8 process ............................................................................................................ 48
Figure 18 An example of Extended VSM of K8 ........................................................................................... 49
V
List of Abbreviations
CO Change Over-time
CT Cycle Time
EEM Early Equipment Management
EWO Emergency Work Orders
FMEA Failure Method Evaluation Analysis
KPI Key Performance Indicators
LoA Level of Automation
MTBF Mean Time Between Failure
MTTR Mean Time To Repair
Non-VA Non Value Added
OEE Overall Equipment’s Efficiency
PM Professional Maintenance
QC Quality Control
Semi-VA Semi Value Added
TPM Total Productive Maintenance
VOLVO GTO VOLVO Group Truck Operation
VA Value Added
VPS VOLVO Production System
VSM Value Stream Mapping
WCM World Class Manufacturing
WIP Work In Process
1
1. Introduction
In this chapter, the background of the thesis, main issues regarding automation development for lean
manufacturing industries, research aim and delimitations are addressed.
1.1 Background
Western companies are struggling to maintain their market share in competition with fast growing
countries like China and India. Resource expense, labour cost, environmental challenges etc. intensify
this competition. Under such situation, companies try to be more efficient and follow cost saving
strategies like lean production which emphasizes on using less to create more through waste
reduction. Results of lean manufacturing mostly can be seen in form of less inventory level, less WIP
(Work-In-Process), more flexibility, shorter lead time, cost reduction and better environment (Womack
et al., 1990). Researches show most of companies which have positive approach towards lean
manufacturing, have better situation in market rather than those who do not have (Jackson et al., 2011).
On the other hand, western countries deals with labor cost challenge which is significantly higher than
their emerging competitors. A study shows 33% of companies participated in a survey, see human
cost as an important issue and 57% mentioned that the problem with labour cost has increase in recent
years (Granlund et al, 2011). Also market demand regarding quality improvement, products variation
and ergonomic challenges, motivate companies to find a way to be more efficient and reduce
production cost. One way in order to manage this situation is to invest in automation (Chen and Small,
1996). It seems automation can increase production capacity, produce with minimum number of
employees, better product disturbance, improve productivity, cut the costs and improve quality.
Consequently, companies tend to increase automation level by implementing more number of
automation solutions.
Despite what aforementioned, complexity of integrating robots and machines with lean principles,
visualization of automated cells, finding the optimum level of human touch and the ability to detect
mistakes in early stages within automated area are some problems that could happen for a company
which follow lean production system. Also many believe automation causes complexity which is in
contrast with lean principles emphasizing on simplicity of process as much as possible. Even in some
cases companies started to remove their automated solutions (Granlund, 2012).
Thus, finding a balance between lean and automation would be satisfactory for companies which want
to be lean and use automation. As Haris and Haris (2008) mentioned effective lean production systems
use both manual and automated process. In this respect, it is vital to find the appropriate level and type
of automation to have “lean automation” (Haris and Haris, 2008). The concept of “Lean automation”
stands at the intersection of lean manufacturing and automation. Lean automation is based on the
fundamental principle of lean manufacturing and the goal of lean automation is to make the value
adding steps. “Lean automation is a technique which applies the right amount of automation to a given
task. It stresses robust, reliable components and minimizes overly complicated solutions” (Dulchlnos
and Massaro, 2005, p. 26).
1.2 Problem area
Previous studies show that while companies in general desire a higher degree of automation, many
experience difficulties in managing automation projects and feel much dependent on the system
2
supplier in the acquisition process (Grandlund and Friedler, 2011). Automation implementation causes
some problems such as complexity, quality control issue, high investment and also it can challenge the
visualisation in production area. Due to the nature of lean production, companies which following lean
principles can feel the automation problems more than others. As an example, quality control in lean
area should be handled from the initial steps of production. Considering an automated cell with
robotized material handling, detecting the defects would be a challenge for the automated system
(Headlined and Jackson, 2011).
Also, concerning the type of industry which is involved with manufacturing or assembly, problems
regarding automation development and implementation can affect the system in different ways. Many
of lean characteristics fit production in form of assembly and less attention has been paid to
manufacturing. For instance, consideration of ergonomics and operator movements in assembly
area - in time of developing automation solutions - is crucial and it needs accurate study in
development steps. In contrast, in manufacturing, there might be a less need for attention to ergonomics
and operator movements because mostly operator is controller rather than having direct involvement.
To find a solution regarding mentioned problems, finding the right level and type of automation is the
key to meet robustness, reliability and simplicity of automation solution. Obviously, this needs an
efficient process of developing automation projects within industry. If the process of developing
automation is not efficient and companies’ strategy and mission is not considered in time of project
development, the result may not be lean at the end. So finding an appropriate guideline that can be
used in time of developing automated projects is very important.
1.3 Aim and research questions
The objective of this thesis is to develop a guideline that can be used in developing automation solutions
to have lean result at the end of the projects. The guidelines can be used in both assembly and
manufacturing development projects.
In order to fulfill the objective of the thesis, following research questions are addressed:
RQ1: What are the challenges and potentials of using automation in lean environment both in
assembly and manufacturing?
Lean manufacturing naturally focus on assembly activities more than production. Toyota initiated Lean
and JIT to reduce lead time, increase efficiency and meet cost reduction. Lean tools are perfectly fit to
assembly process rather than machining. Figuring out challenges and potentials of automation in both
assembly and machining and comparing the result would be helpful to find out what are the differences
and similarities of using automation in these two areas. The answer of this question, will be ended to ask
second question
RQ2: How companies can implement automation efficiently in lean environment?
As researches and history of automation show, automation would be noticeable part of manufacturing
in future of industries. Potentials and challenges obtained from previous questions and notification of
important elements can be used for future development of automation in lean environment. Figuring
out necessary elements to develop automation solutions in lean environment will be the second
question in this thesis.
3
1.4 Delimitation
Due to vast area of lean philosophy, this project has directed to manufacturing industry and other areas
such as healthcare systems are excluded. Automation concept in this thesis will more be focused on
robotized cells specially from material handling view and other types of automation such as CNC machines
are not considered within thesis scope.
According to thesis framework, the concept of development is the main issue of study and technical
aspects of automation like programming are not considered.
One case study in production area in automotive industry has been carried out and the scope of the
project has been defined by the support of VOLVO GTO. In manufacturing area, a developing
project of soft gear production cell (k8) and an existing production cell of soft gear (k7) are chosen for
research. In assembly area a developing project of assembly line (new range assembly line)
which is a combination of two existing assembly areas is chosen for this thesis.
The new projects are not implemented yet, so comparing the existing system with a system that still
doesn’t exist is another delimitation of this thesis. The data regarding new projects in some parts are
based on forecasting and in some parts there is no possibility to estimate the data.
4
2. Frame of reference
In this chapter, lean manufacturing, some aspects of automation related to thesis scope and the concept of
lean automation are discussed.
2.1 Lean manufacturing
Lean manufacturing is a conceptual framework became popular among western industries since
early1990s. Publishment of the book the machine that change the world by Womack et al., (1990)
encouraged companies-especially automotive industries- to implement lean as a production philosophy.
Implementation of lean manufacturing has been more addressed in fast changing industries (Duguay et
al., 1997).
Womack and Jones define lean manufacturing as a five-step process: “defining customer value, defining
the value stream, making it flow, pulling from the customer back, and striving for excellence”.(Liker,
2004,p20). The lean producer incorporates the good points of craft and mass production, while bypassing
the high cost of the former and the austerity of the latter. Lean producers administer teams of multi
skilled workers at all levels of the organization and use highly flexible, increasingly automated machines
to produce volumes of products in enormous varieties (Womack et al., 1990). Organising the production
line is another specification of lean production. Workers are forming the teams with team leader which is
different from head man in mass production. Workers are multi skills and are able to perform various
types of assignments. It also helps to have greater sense of fulfilling in the workers because they don’t
have to repeat same actions within mass production. (Delkhosh , 2012)
In addition, the teams have more authority in the production area and can stop the line in necessary
situation. There is a much more sense of contributions for personals by suggestion improvements ideas. It
can cause continuous improvement (Kaizen in Japanese) which can help companies to meet efficiency
because workers are the main group which involve production (Ribeiro and Barata, 2011).
2.1.1 Waste reduction
Lean producers should concentrate on value added activities with no interruption (one piece flow).
Production System should be pull instead of push. Considering customer demand, the system should only
fulfill what the next operation takes away at short intervals. Continuous improvement should be an
organizational culture. As Ohno, founder of TPS said:” All we are doing is looking at the time line from
the moment the customer gives us an order to the point when we collect the cash. And we are reducing
that time line by removing the non-value-added wastes”, (Liker, 2004, p20).
It is possible to say that Lean production is based on avoiding losses in three ways: “Muda”, ”Mura” and
“Muri” which refer to any kind of activity that use resource but creates no value in Japanese . Generally
Muda is divided into eight groups of wastes: (Liker, 2004)
Overproduction - Producing items for which there are no orders.
Waiting (time on hand) - Workers waiting for tools, parts, or next process step or just not having
work because of capacity bottle necks or stock outs and so on.
Unnecessary transport or conveyance - Carrying work in process long distance, or for example
inefficient transport between processes.
Over processing or incorrect processing -unneeded steps to process the parts, inefficiently
processing due to poor tools causing defects. Waste is also generated when producing higher
quality-products than necessary.
5
Excess inventory - Excess raw material, WIP or finished good, causing longer lead times. Extra
inventory also hides problem for a longer time.
Unnecessary movement - Looking for or reaching for parts, tools etc. and walking to get stuff is
waste.
Defects - Repair work, scrap, replacement production and inspection mean wasteful handling,
time, and effort and should be minimized.
Unused employee creativity - Losing time, ideas, skills, and improvements by not engaging or
listening to employees is a waste.
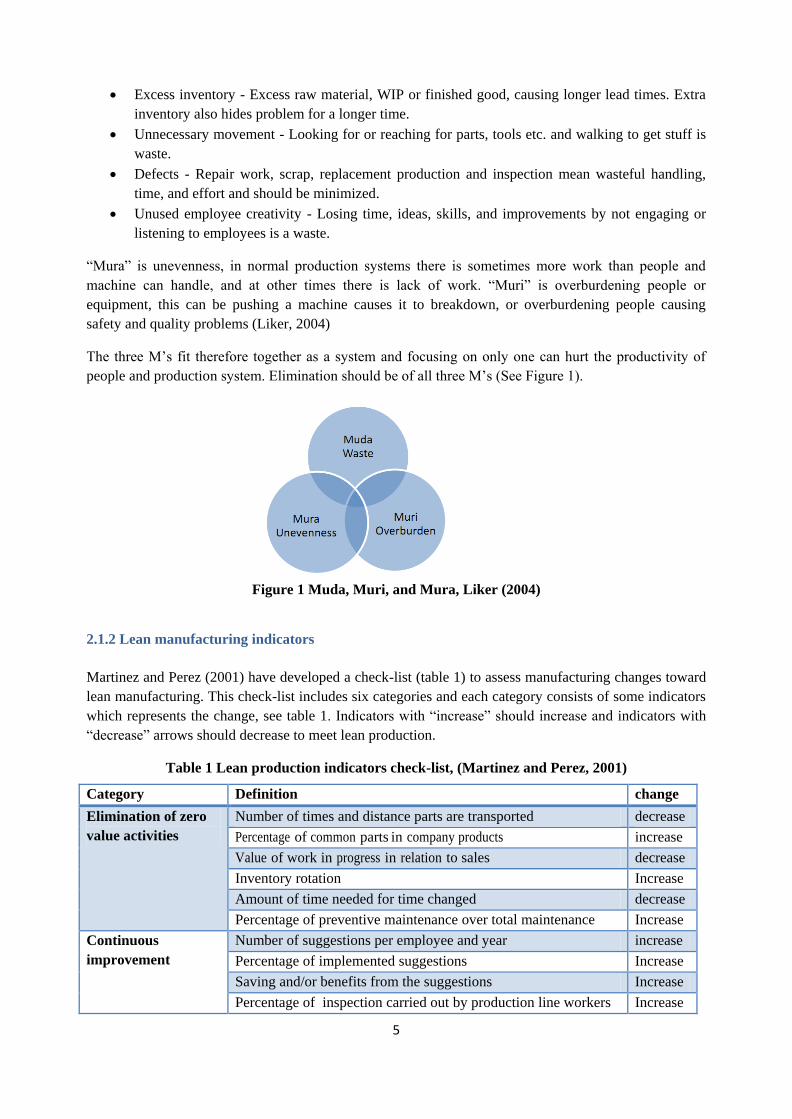
“Mura” is unevenness, in normal production systems there is sometimes more work than people and
machine can handle, and at other times there is lack of work. “Muri” is overburdening people or
equipment, this can be pushing a machine causes it to breakdown, or overburdening people causing
safety and quality problems (Liker, 2004)
The three M’s fit therefore together as a system and focusing on only one can hurt the productivity of
people and production system. Elimination should be of all three M’s (See Figure 1).
Figure 1 Muda, Muri, and Mura, Liker (2004)
2.1.2 Lean manufacturing indicators
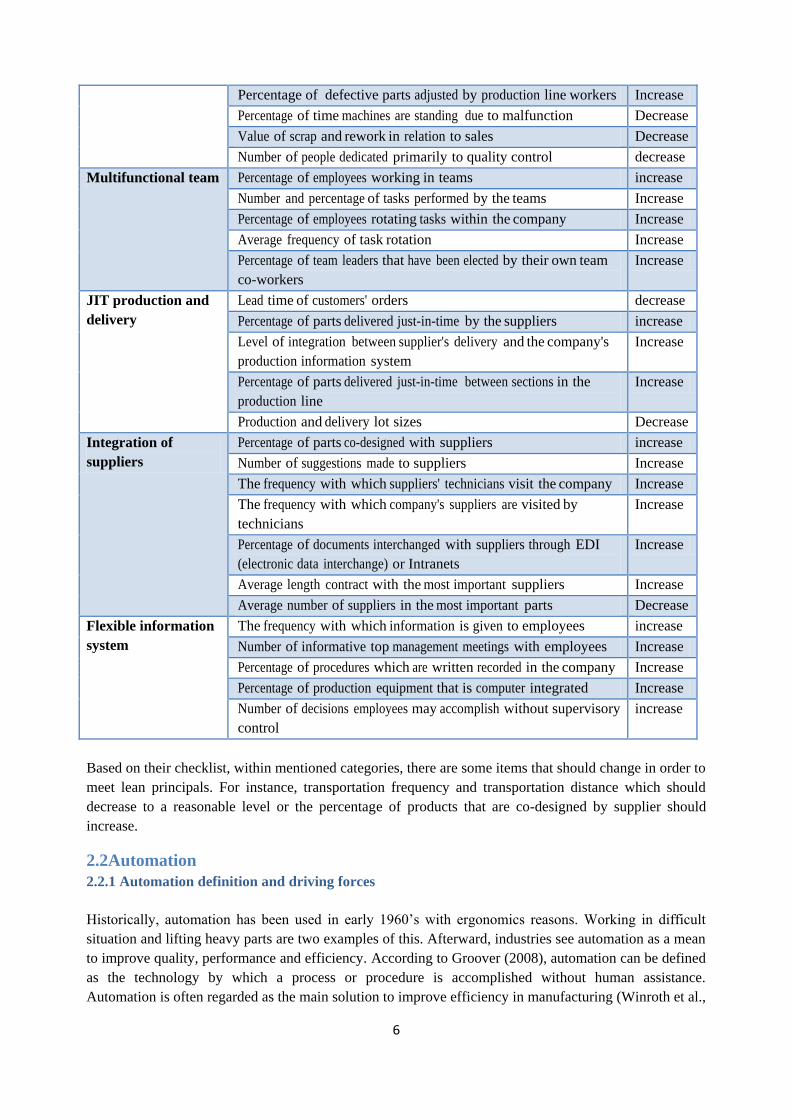
Martinez and Perez (2001) have developed a check-list (table 1) to assess manufacturing changes toward
lean manufacturing. This check-list includes six categories and each category consists of some indicators
which represents the change, see table 1. Indicators with “increase” should increase and indicators with
“decrease” arrows should decrease to meet lean production.
Table 1 Lean production indicators check-list, (Martinez and Perez, 2001)
Category Definition change
Elimination of zero
value activities
Number of times and distance parts are transported decrease
Percentage of common parts in company products increase
Value of work in progress in relation to sales decrease
Inventory rotation Increase
Amount of time needed for time changed decrease
Percentage of preventive maintenance over total maintenance Increase
Continuous
improvement
Number of suggestions per employee and year increase
Percentage of implemented suggestions Increase
Saving and/or benefits from the suggestions Increase
Percentage of inspection carried out by production line workers Increase
6
Percentage of defective parts adjusted by production line workers Increase
Percentage of time machines are standing due to malfunction Decrease
Value of scrap and rework in relation to sales Decrease
Number of people dedicated primarily to quality control decrease
Multifunctional team Percentage of employees working in teams increase
Number and percentage of tasks performed by the teams Increase
Percentage of employees rotating tasks within the company Increase
Average frequency of task rotation Increase
Percentage of team leaders that have been elected by their own team
co-workers
Increase
JIT production and
delivery
Lead time of customers' orders decrease
Percentage of parts delivered just-in-time by the suppliers increase
Level of integration between supplier's delivery and the company's
production information system
Increase
Percentage of parts delivered just-in-time between sections in the
production line
Increase
Production and delivery lot sizes Decrease
Integration of
suppliers
Percentage of parts co-designed with suppliers increase
Number of suggestions made to suppliers Increase
The frequency with which suppliers' technicians visit the company Increase
The frequency with which company's suppliers are visited by
technicians
Increase
Percentage of documents interchanged with suppliers through EDI
(electronic data interchange) or Intranets
Increase
Average length contract with the most important suppliers Increase
Average number of suppliers in the most important parts Decrease
Flexible information
system
The frequency with which information is given to employees increase
Number of informative top management meetings with employees Increase
Percentage of procedures which are written recorded in the company Increase
Percentage of production equipment that is computer integrated Increase
Number of decisions employees may accomplish without supervisory
control
increase
Based on their checklist, within mentioned categories, there are some items that should change in order to
meet lean principals. For instance, transportation frequency and transportation distance which should
decrease to a reasonable level or the percentage of products that are co-designed by supplier should
increase.
2.2Automation
2.2.1 Automation definition and driving forces
Historically, automation has been used in early 1960’s with ergonomics reasons. Working in difficult
situation and lifting heavy parts are two examples of this. Afterward, industries see automation as a mean
to improve quality, performance and efficiency. According to Groover (2008), automation can be defined
as the technology by which a process or procedure is accomplished without human assistance.
Automation is often regarded as the main solution to improve efficiency in manufacturing (Winroth et al.,
7
2006) and also regarded as either an ‘on or off’-decision, i.e. the system is either considered to be entirely
manual or fully automated (Winroth et al., 2006). Automation is mainly divided into two categories;
mechanisation and computerisation. Mechanisation mainly relates to the physical flow of goods and
represents the basic core technologies, such as drilling, grinding etc. and computerisation refers to the
flow of information which deals with the control and support of the mechanized technologies (Frohm,
2009). Also it should mention that automation is not only the process of shaping blanks to the good but
also the replacement of human cognitive process such as control of physical activities like mechanization.
(Frohm, 2009). In this respect, there are different types of automations, especially in mechanized
automation varying from fixed and programmable automation to flexible automation.
According to a survey among 18 organisations handled by Orr (1997), companies are in opinion that
Generally, product life cycle is now shorter
Demand for many products is lower than industry supply capacity
And, larger product ranges are required to maintain market share.
So, these companies are now using automation in order to reduce the cost and also shorten the time for
product development from initial phase to market delivery. According to Granlund (2011), automation
benefits can be presented as follow:
labour productivity,
reduce labour cost,
mitigate the effects of labour shortages,
reduce or eliminate routine manual and clerical tasks,
improve worker safety,
improve product quality, reduce lead time,
accomplish processes that cannot be done manually
And avoid the high cost of not automating.
The pressure to reduce the price per unit in the production site imposed the need for an increased pace in
production that could only be achieved by automating some of the process tasks (Ribeiro and Barata,
2011. A research by Jackson et al., (2011) showed that the main reasons for companies to address a
possible implementation of automated equipment were to:
reduce manual costs within operations (78% of all studies);
remove ergonomically bad workstations and operations (38% of all studies);
improve quality and achieve higher utilization (29% of all studies); and,
Reduce lead time/through-put time in operations (16% of all studies).
2.2.2 Possible Automation Challenges
Implementing automation in companies would involve many sectors and may cause some problems. In
some cases it is quiet challenging for companies to implement automation with high technology mainly
because companies have lack of confidence.
The analysis consisted also of analyzing the main obstacles to economically justify the investment, as
well as expressed reasons not to invest in robot automation Jackson et al., (2011):
Low and unsecure volumes (56% of all studies)
Short life-cycles, product variety and costs to reprogram the system (38% of all studies)
Reluctance in investing in advanced technology and the need to rely on external experts
(31% of all studies)
Costs related to the need of flexibility and reconfigurability (24% of all studies)
8
Problems regarding the handling of breakdowns and maintenance (16% of all studies)
Also in line with Granlund (2011), automation is considered as complicated issue which requires extra
effort and budget to develop and maintain. It is not flexible enough and it takes longer time for
organisations to install and get used to work with the new system. Additionally, companies may become
so dependent to automation suppliers. Previous studies show that following challenges might happen for
companies intended to develop automation:
Lack of flexibility
High cost of equipment/financial justification
Reliability of equipment
Software related problems, such as poor documentation
Integration of equipment into existing systems
Lengthy implementation and potential dips in service level during this period
Maintenance cost/maintenance parts
Poor user interface and need of training to operate systems
2.2.3 Human Touch in Automation
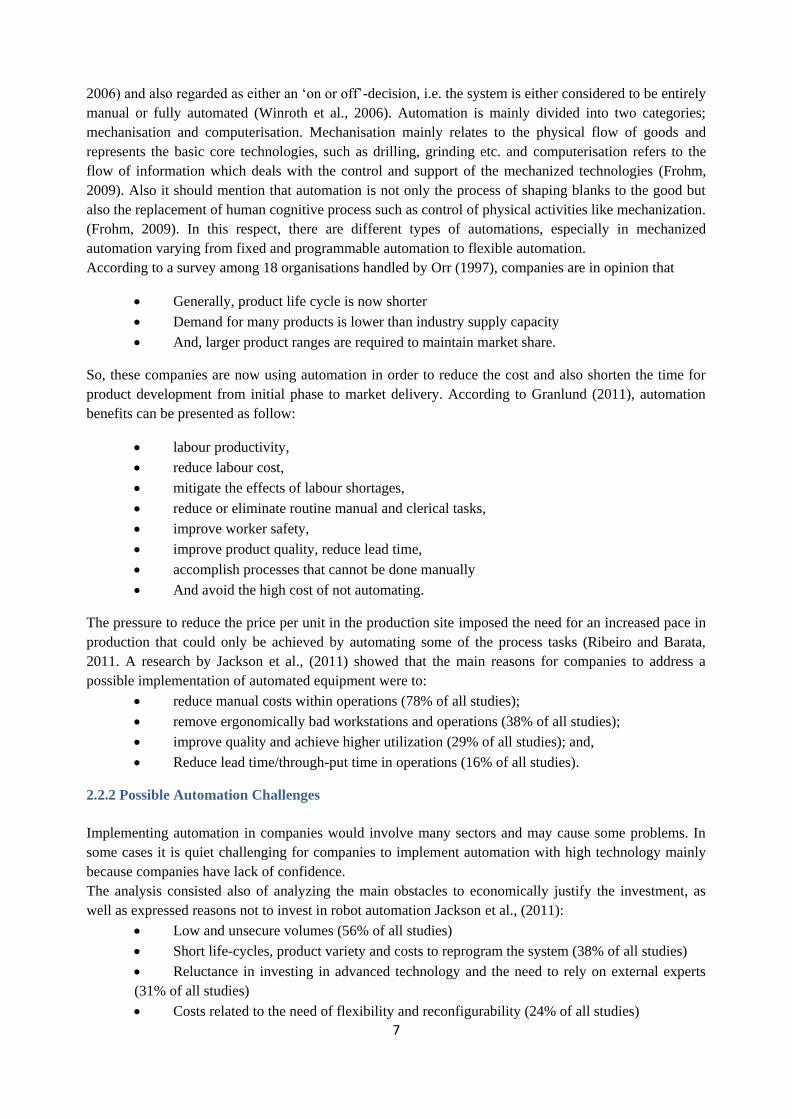
Automation level is a concept assessing the automation degree and pertaining to what extent a task is
handling automatically or manually. Different models in literature represent automation level. Frohm
(2009) has developed a scale which categorizes automation level into seven groups ranging from totally
manual to totally automatic, see table 2.
Table 2 Automation levels (Frohm 2009, p 44)
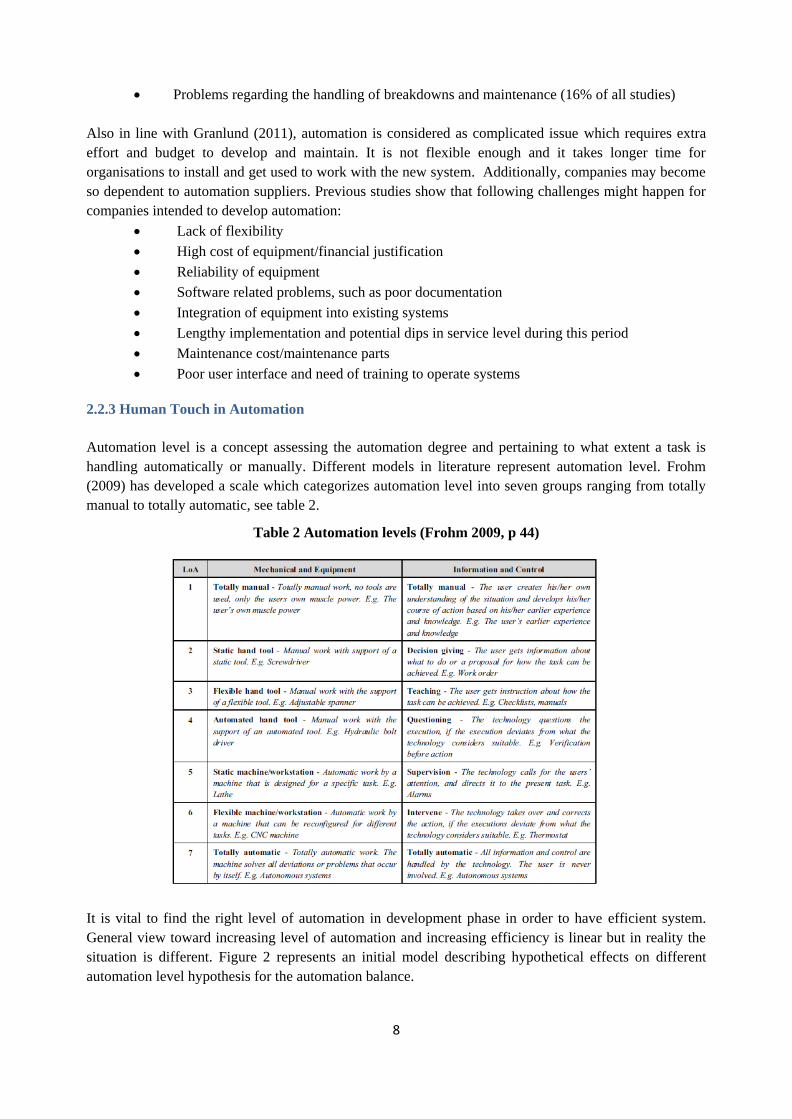
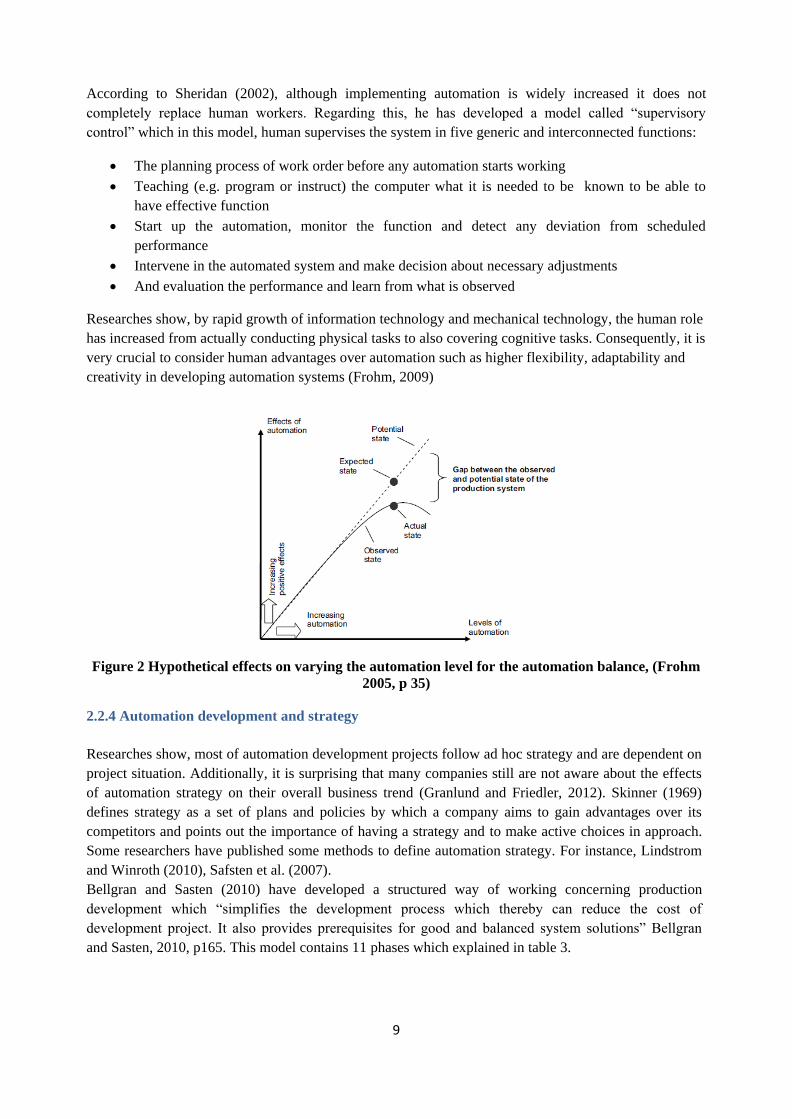
It is vital to find the right level of automation in development phase in order to have efficient system.
General view toward increasing level of automation and increasing efficiency is linear but in reality the
situation is different. Figure 2 represents an initial model describing hypothetical effects on different
automation level hypothesis for the automation balance.
9
According to Sheridan (2002), although implementing automation is widely increased it does not
completely replace human workers. Regarding this, he has developed a model called “supervisory
control” which in this model, human supervises the system in five generic and interconnected functions:
The planning process of work order before any automation starts working
Teaching (e.g. program or instruct) the computer what it is needed to be known to be able to
have effective function
Start up the automation, monitor the function and detect any deviation from scheduled
performance
Intervene in the automated system and make decision about necessary adjustments
And evaluation the performance and learn from what is observed
Researches show, by rapid growth of information technology and mechanical technology, the human role
has increased from actually conducting physical tasks to also covering cognitive tasks. Consequently, it is
very crucial to consider human advantages over automation such as higher flexibility, adaptability and
creativity in developing automation systems (Frohm, 2009)
Figure 2 Hypothetical effects on varying the automation level for the automation balance, (Frohm
2005, p 35)
2.2.4 Automation development and strategy
Researches show, most of automation development projects follow ad hoc strategy and are dependent on
project situation. Additionally, it is surprising that many companies still are not aware about the effects
of automation strategy on their overall business trend (Granlund and Friedler, 2012). Skinner (1969)
defines strategy as a set of plans and policies by which a company aims to gain advantages over its
competitors and points out the importance of having a strategy and to make active choices in approach.
Some researchers have published some methods to define automation strategy. For instance, Lindstrom
and Winroth (2010), Safsten et al. (2007).
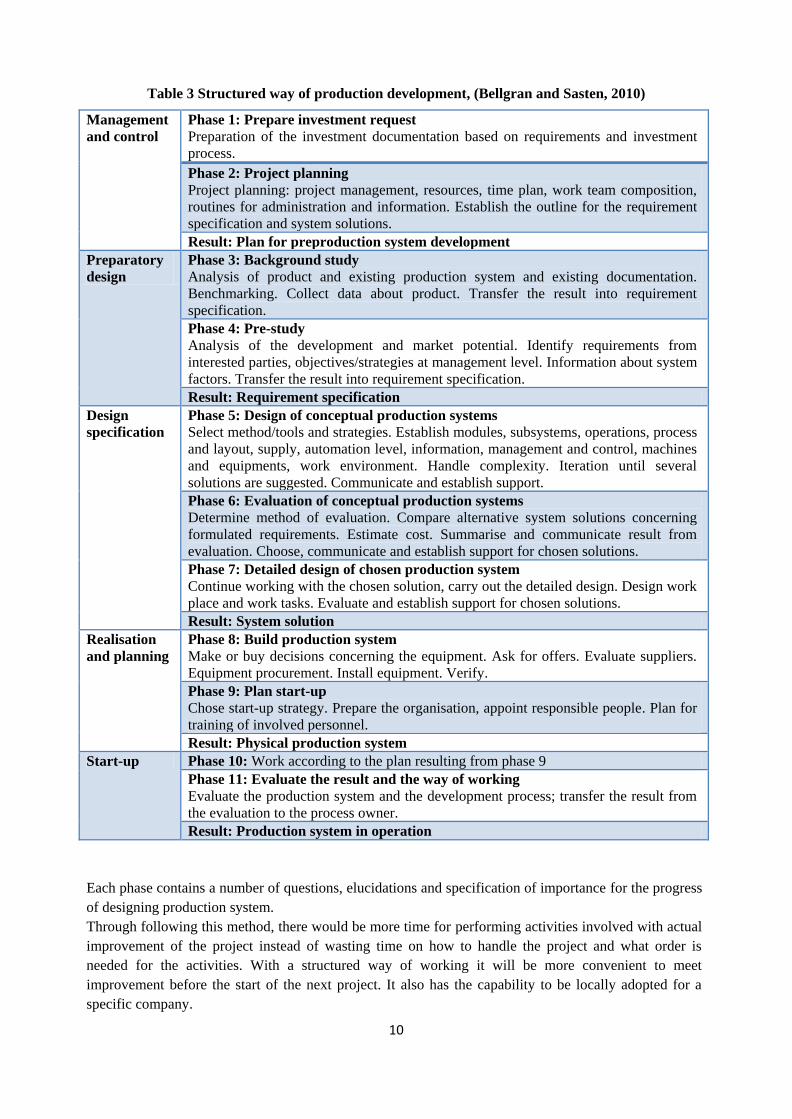
Bellgran and Sasten (2010) have developed a structured way of working concerning production
development which “simplifies the development process which thereby can reduce the cost of
development project. It also provides prerequisites for good and balanced system solutions” Bellgran
and Sasten, 2010, p165. This model contains 11 phases which explained in table 3.
10
Table 3 Structured way of production development, (Bellgran and Sasten, 2010)
Management
and control
Phase 1: Prepare investment request
Preparation of the investment documentation based on requirements and investment
process.
Phase 2: Project planning
Project planning: project management, resources, time plan, work team composition,
routines for administration and information. Establish the outline for the requirement
specification and system solutions.
Result: Plan for preproduction system development
Preparatory
design
Phase 3: Background study
Analysis of product and existing production system and existing documentation.
Benchmarking. Collect data about product. Transfer the result into requirement
specification.
Phase 4: Pre-study
Analysis of the development and market potential. Identify requirements from
interested parties, objectives/strategies at management level. Information about system
factors. Transfer the result into requirement specification.
Result: Requirement specification
Design
specification
Phase 5: Design of conceptual production systems
Select method/tools and strategies. Establish modules, subsystems, operations, process
and layout, supply, automation level, information, management and control, machines
and equipments, work environment. Handle complexity. Iteration until several
solutions are suggested. Communicate and establish support.
Phase 6: Evaluation of conceptual production systems
Determine method of evaluation. Compare alternative system solutions concerning
formulated requirements. Estimate cost. Summarise and communicate result from
evaluation. Choose, communicate and establish support for chosen solutions.
Phase 7: Detailed design of chosen production system
Continue working with the chosen solution, carry out the detailed design. Design work
place and work tasks. Evaluate and establish support for chosen solutions.
Result: System solution
Realisation
and planning
Phase 8: Build production system
Make or buy decisions concerning the equipment. Ask for offers. Evaluate suppliers.
Equipment procurement. Install equipment. Verify.
Phase 9: Plan start-up
Chose start-up strategy. Prepare the organisation, appoint responsible people. Plan for
training of involved personnel.
Result: Physical production system
Start-up Phase 10: Work according to the plan resulting from phase 9
Phase 11: Evaluate the result and the way of working
Evaluate the production system and the development process; transfer the result from
the evaluation to the process owner.
Result: Production system in operation
Each phase contains a number of questions, elucidations and specification of importance for the progress
of designing production system.
Through following this method, there would be more time for performing activities involved with actual
improvement of the project instead of wasting time on how to handle the project and what order is
needed for the activities. With a structured way of working it will be more convenient to meet
improvement before the start of the next project. It also has the capability to be locally adopted for a
specific company.
11
It should be noted that the responsibility for the actual design of the production system because it does
not provide solution but it can just guide the system designers through the design process.
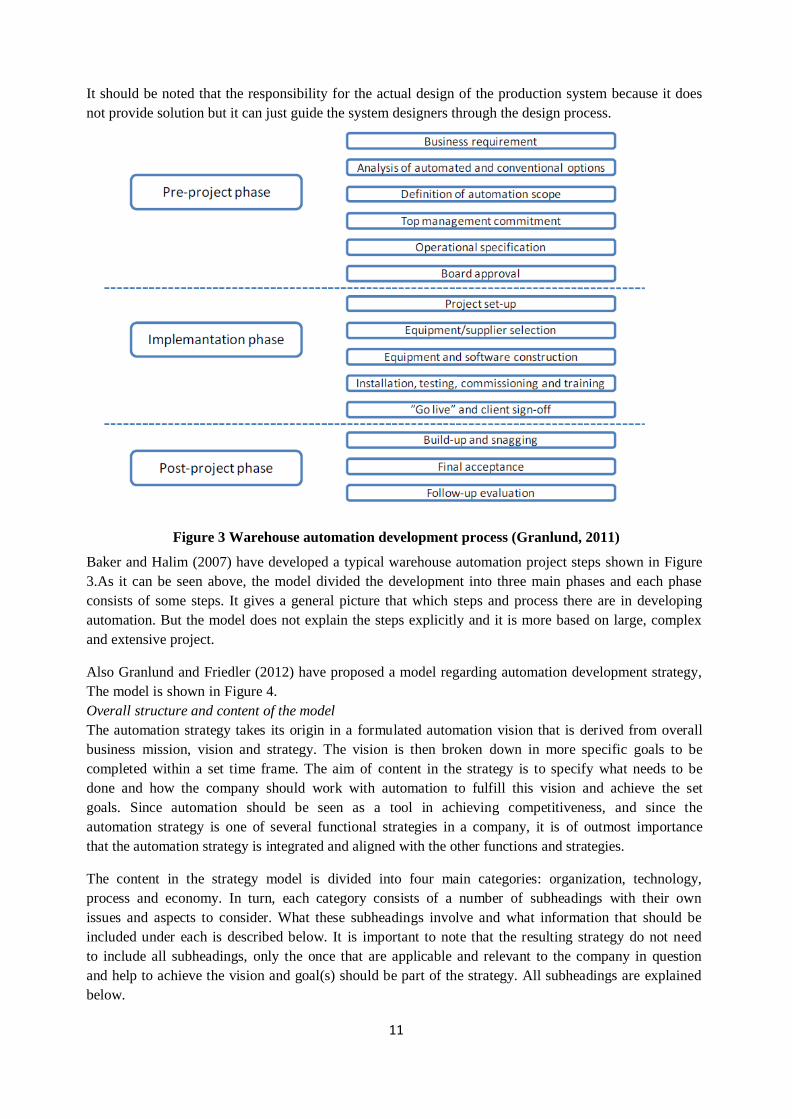
Figure 3 Warehouse automation development process (Granlund, 2011)
Baker and Halim (2007) have developed a typical warehouse automation project steps shown in Figure
3.As it can be seen above, the model divided the development into three main phases and each phase
consists of some steps. It gives a general picture that which steps and process there are in developing
automation. But the model does not explain the steps explicitly and it is more based on large, complex
and extensive project.
Also Granlund and Friedler (2012) have proposed a model regarding automation development strategy,
The model is shown in Figure 4.
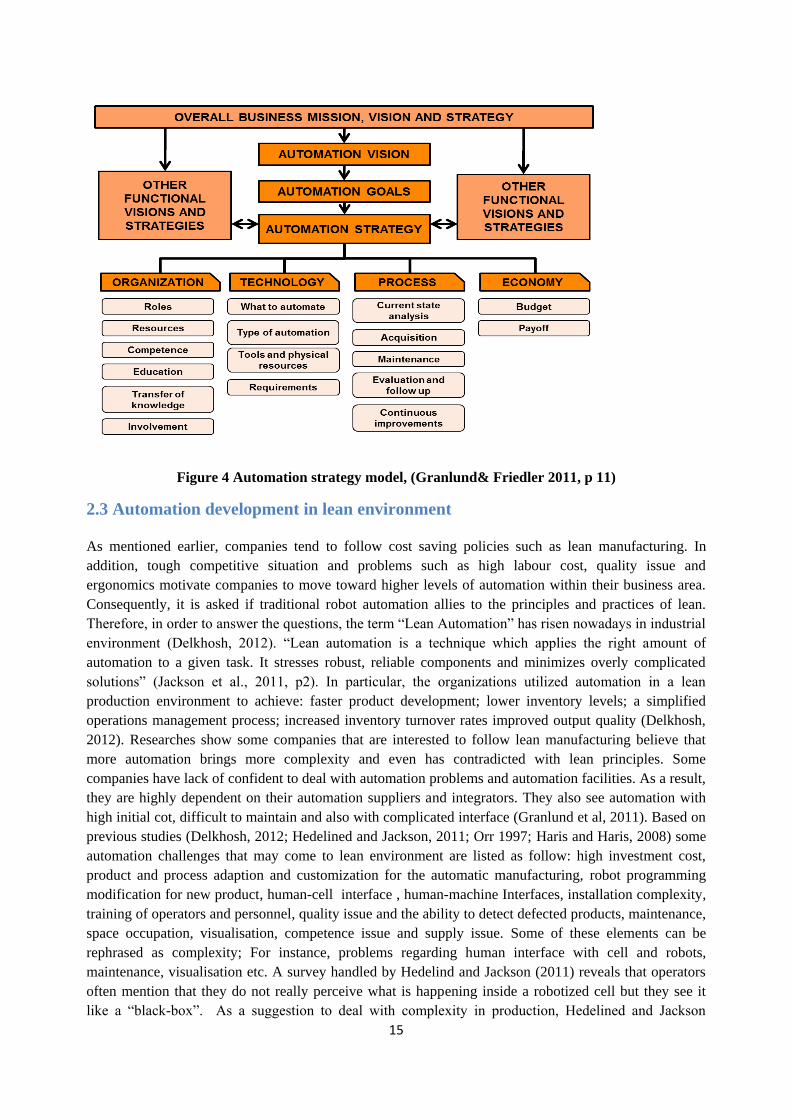
Overall structure and content of the model
The automation strategy takes its origin in a formulated automation vision that is derived from overall
business mission, vision and strategy. The vision is then broken down in more specific goals to be
completed within a set time frame. The aim of content in the strategy is to specify what needs to be
done and how the company should work with automation to fulfill this vision and achieve the set
goals. Since automation should be seen as a tool in achieving competitiveness, and since the
automation strategy is one of several functional strategies in a company, it is of outmost importance
that the automation strategy is integrated and aligned with the other functions and strategies.
The content in the strategy model is divided into four main categories: organization, technology,
process and economy. In turn, each category consists of a number of subheadings with their own
issues and aspects to consider. What these subheadings involve and what information that should be
included under each is described below. It is important to note that the resulting strategy do not need
to include all subheadings, only the once that are applicable and relevant to the company in question
and help to achieve the vision and goal(s) should be part of the strategy. All subheadings are explained
below.
12
Roles:
Appoint a person to be responsible for automation that also owns and governs the strategy. Identify
other key roles (such as for technology, education/training or maintenance) and clearly state the
responsibilities and authority to each role.
Resources:
Map the resource requirements for each area related to automation, such as acquisition, development,
operation and maintenance. Make an action plan to meet the requirements for example through hiring,
redistribution of resources or the use of consultants.
Competence:
Specify what skills/competences are needed to achieve the vision and goal. Map current automation
related competences and skills in the current staff and develop a competence matrix. Go through the, if
any, increased competence requirements and make an action plan for how to meet it, for example
through education/training, hiring or use of consultants.
Education:
Based on the competence matrix, go through the possible need for education of staff. Make an action
plan for necessary internal and external education, specify who is intended to both receive and give it
and within which time frame. If applicable, make plans that persons receiving external education are
responsible to in turn spread that knowledge internally.
Transfer of knowledge:
Identify key persons with knowledge and experience in automation. Appoint them as mentors to less
experienced staff to ensure transfer of knowledge. Also ensure the involvement of these persons in the
creation of new routines or support documents to take part of their knowledge and experience and to
ensure good quality and useful routines/support documents.
Involvement:
Make sure that the automation vision, and hence the automation strategy is supported by the
management. Inform concerned personnel at all levels and explain the automation vision and strategy
and what it will lead to in both the immediate and distant future. This is to secure commitment and
understanding for changes, new ways of working and towards automation in general.
Networking:
Settle on which main suppliers to work with and make sure to maintain good relations with these. Also
make sure to transfer well established contacts between employees in the company. Look into
networks that can provide helpful contacts and benchmarking opportunities as well as possible
collaborations with academia through thesis work, research projects etc.
What to automate:
Decide what level of automation is desired for different types of activities based on what creates value
in the organization and which aspects are key factors for success. Settle on which operations and
activities are desired to be automated to a large extent and what is preferred to be kept manual. Also
determine whether the automated activities should support the manual activities or vice versa.
Type of automation:
Decide what level of technology (regarding simplicity and novelty) and type of automation equipment
(i.e. industrial robots, linear actuators, automated guided vehicles, automated storage and retrieval
systems, feeders) is desired for different types of activities. Determine specific demands for flexibility,
reuse etc. for the automated solutions.
13
Tools and physical resources:
List any support tools and non-human resources needed to reach the desired vision and also specify how
to acquire these.
Requirements:
Develop a technical specification specifically for automation equipment. The specifications should
cover areas such as preferred brands for specific system components, safety, design, ergonomic
regulations, environmental aspects etc. It could also be useful to have an internal document specifying
which brands to even consider in general.
Current state analysis:
Establish routines for how to perform current state analysis in search for potential improvements. The
routines should include how the analysis should be performed (what to look for, how to evaluate, how
to document and take decision to proceed), how often it should be performed and by whom. Proper
support documents should also be established.
Acquisition:
Develop and establish routines for the different steps in the automation acquisition process (Friedler
and Granlund, 2012) such as formulation of requirements, development of concepts and solutions,
evaluation of concepts/solutions, decision gates, installation, tests, hand over etc. Define what should
be made during the different steps, how the work should be documented, who is responsible and which
functions should be involved. Proper support documentation should also be established. Also
determine what parts of the development work, installation, operation, maintenance etc. that should be
performed internally and when third parties such as consultants or system suppliers should be
involved.
Maintenance:
Establish routines for maintenance of automated equipment. Define how often preventive maintenance
should be made, what it should include and who is responsible for both corrective and preventive
maintenance.
Evaluation and follow up:
Specify how automation projects and investments should be evaluated and followed up. This is to secure
transfer of knowledge and lessons learnt and to future projects.
Continuous improvements:
Create procedures for making sure that routines and support documents are up to date, followed and
appropriate for the way of working. This also includes following up the work connected to the
strategic development and the work with the automation strategy itself.
Budget:
Financial means must be put aside to facilitate the vision. A budget and time plan for how and when to
use the means should be established. The budget should besides budget for automation investments
include posts for salaries, education, hiring, tools/physical resources and other means necessary to
fulfill the goals.
Payoff:
It should be stated what payoff time is demanded for new automation investments.
Automation strategy is deviated from overall business mission, vision and strategy. Generally the aim of
automation strategy is to determine what is needed to be done and how companies should work with

14
automation in order to meet overall business requirements.
According to Granlund and Friedler (2012) automation is a tool to gain competitiveness and also
automation strategy is one of several functional strategies in a company, so it is crucial to integrate
automation strategy with other functions and strategies.
The automation strategy is divided into four main categories:
Organization,
Technology,
Process and
Economy.
15
Figure 4 Automation strategy model, (Granlund& Friedler 2011, p 11)
2.3 Automation development in lean environment
As mentioned earlier, companies tend to follow cost saving policies such as lean manufacturing. In
addition, tough competitive situation and problems such as high labour cost, quality issue and
ergonomics motivate companies to move toward higher levels of automation within their business area.
Consequently, it is asked if traditional robot automation allies to the principles and practices of lean.
Therefore, in order to answer the questions, the term “Lean Automation” has risen nowadays in industrial
environment (Delkhosh, 2012). “Lean automation is a technique which applies the right amount of
automation to a given task. It stresses robust, reliable components and minimizes overly complicated
solutions” (Jackson et al., 2011, p2). In particular, the organizations utilized automation in a lean
production environment to achieve: faster product development; lower inventory levels; a simplified
operations management process; increased inventory turnover rates improved output quality (Delkhosh,
2012). Researches show some companies that are interested to follow lean manufacturing believe that
more automation brings more complexity and even has contradicted with lean principles. Some
companies have lack of confident to deal with automation problems and automation facilities. As a result,
they are highly dependent on their automation suppliers and integrators. They also see automation with
high initial cot, difficult to maintain and also with complicated interface (Granlund et al, 2011). Based on
previous studies (Delkhosh, 2012; Hedelined and Jackson, 2011; Orr 1997; Haris and Haris, 2008) some
automation challenges that may come to lean environment are listed as follow: high investment cost,
product and process adaption and customization for the automatic manufacturing, robot programming
modification for new product, human-cell interface , human-machine Interfaces, installation complexity,
training of operators and personnel, quality issue and the ability to detect defected products, maintenance,
space occupation, visualisation, competence issue and supply issue. Some of these elements can be
rephrased as complexity; For instance, problems regarding human interface with cell and robots,
maintenance, visualisation etc. A survey handled by Hedelind and Jackson (2011) reveals that operators
often mention that they do not really perceive what is happening inside a robotized cell but they see it
like a “black-box”. As a suggestion to deal with complexity in production, Hedelined and Jackson
16
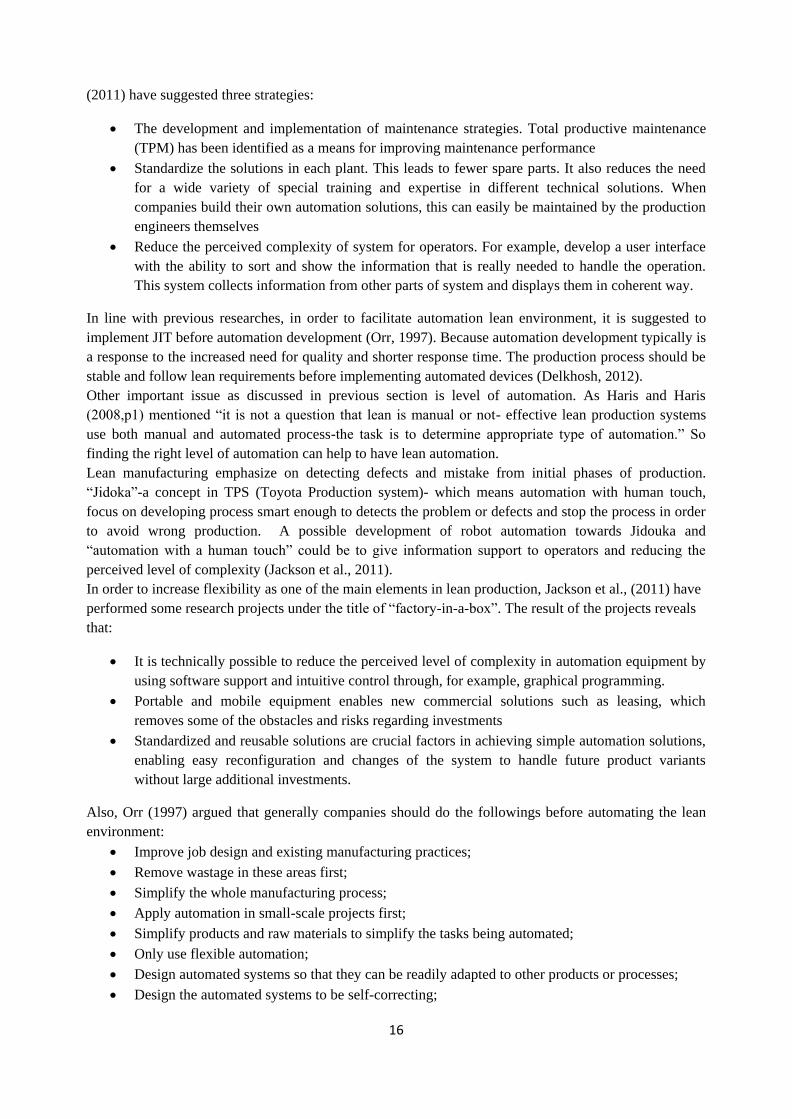
(2011) have suggested three strategies:
The development and implementation of maintenance strategies. Total productive maintenance
(TPM) has been identified as a means for improving maintenance performance
Standardize the solutions in each plant. This leads to fewer spare parts. It also reduces the need
for a wide variety of special training and expertise in different technical solutions. When
companies build their own automation solutions, this can easily be maintained by the production
engineers themselves
Reduce the perceived complexity of system for operators. For example, develop a user interface
with the ability to sort and show the information that is really needed to handle the operation.
This system collects information from other parts of system and displays them in coherent way.
In line with previous researches, in order to facilitate automation lean environment, it is suggested to
implement JIT before automation development (Orr, 1997). Because automation development typically is
a response to the increased need for quality and shorter response time. The production process should be
stable and follow lean requirements before implementing automated devices (Delkhosh, 2012).
Other important issue as discussed in previous section is level of automation. As Haris and Haris
(2008,p1) mentioned “it is not a question that lean is manual or not- effective lean production systems
use both manual and automated process-the task is to determine appropriate type of automation.” So
finding the right level of automation can help to have lean automation.
Lean manufacturing emphasize on detecting defects and mistake from initial phases of production.
“Jidoka”-a concept in TPS (Toyota Production system)- which means automation with human touch,
focus on developing process smart enough to detects the problem or defects and stop the process in order
to avoid wrong production. A possible development of robot automation towards Jidouka and
“automation with a human touch” could be to give information support to operators and reducing the
perceived level of complexity (Jackson et al., 2011).
In order to increase flexibility as one of the main elements in lean production, Jackson et al., (2011) have
performed some research projects under the title of “factory-in-a-box”. The result of the projects reveals
that:
It is technically possible to reduce the perceived level of complexity in automation equipment by
using software support and intuitive control through, for example, graphical programming.
Portable and mobile equipment enables new commercial solutions such as leasing, which
removes some of the obstacles and risks regarding investments
Standardized and reusable solutions are crucial factors in achieving simple automation solutions,
enabling easy reconfiguration and changes of the system to handle future product variants
without large additional investments.
Also, Orr (1997) argued that generally companies should do the followings before automating the lean
environment:
Improve job design and existing manufacturing practices;
Remove wastage in these areas first;
Simplify the whole manufacturing process;
Apply automation in small-scale projects first;
Simplify products and raw materials to simplify the tasks being automated;
Only use flexible automation;
Design automated systems so that they can be readily adapted to other products or processes;
Design the automated systems to be self-correcting;

17
Integrate automated manufacturing equipment and production scheduling so that production
which must be stored as inventory is avoided;
All automated equipment should offer simple visual inspection to identify production problems.
•
18
3. Methodology
In this chapter, the research method, research scope, the process and steps of handling the thesis and data
collection methods are described. At the end, validity and reliability are discussed.
3.1 Research method
Describing and understanding facts is the main goal of doing scientific research; so it would be essential to
conducting research in a structured manner which leads to scientific results, (Bryman and Bell, 2007).
Depends on the form of research question, control of behavioral events and focus on contemporary
events there are five main research strategies which case study is one of them.
Case study is a methodology for in depth study of current phenomenon when boundaries between
phenomenon and the real life are not completely clear. According to Yin (1994):
A case study is an empirical inquiry
Investigates a contemporary phenomenon within its real-life context, especially when the
boundaries between phenomenon and context are not clearly evident
Involves more variables of interest than data points
Relies on multiple sources of evidence – data needs to converge in a triangulating fashion
Try to answer “how” and “why” questions.
In this thesis, because of following reasons case study chose:
Research with “how” and “why” questions
Within this thesis, research questions had explanatory nature and
There were multiple sources of evidences such as expert ideas about research questions, existing
data and situation in the case company; and the current and future approach toward automation
development.
Additionally, the case study approach chose for this thesis since it was an empirical inquiry that
investigates a contemporary phenomenon within its real-life context.
Furthermore, according to literature, the boundaries between automation and other company’s sectors
are not clear which is another reason for choosing case study for this thesis.
These general characteristics of research designs, serve as a background for considering the specific
designs for case studies. Four types of designs are presented by Yin (1997) based on a 2 × 2 matrix which
is shown in figure 5. The matrix first shows that every type of design will include the desire to analyze
contextual conditions in relation to the “case,” with the dotted lines between the two signaling that the
boundaries between the case and the context are not likely to be sharp. The matrix then shows that single-
and multiple-case studies reflect different design situations and that, within these two variants, there also
can be unitary or multiple units of analysis.
In business studies, the case study research is particularly useful when the phenomenon under
investigation is difficult to study outside its natural setting. According to Bryman and Bell (2007), a
case in a case study can either be a single organisation, a single location, a person or a single event.
In line with Yin (1994), the single-embedded case study is chose for this research.
A single case, meeting all of the conditions for testing the theory, can confirm, challenge, or extend the
theory. The single case can then be used to determine whether a theory’s propositions are correct or
whether some alternative set of explanations might be more relevant. The single case can represent a
significant contribution to knowledge and theory building. Some may say a single case study is not
19
sufficient for handling this research but actually according to case design and type of information and
source of data which are variants, single case study with embedded units fits this research.
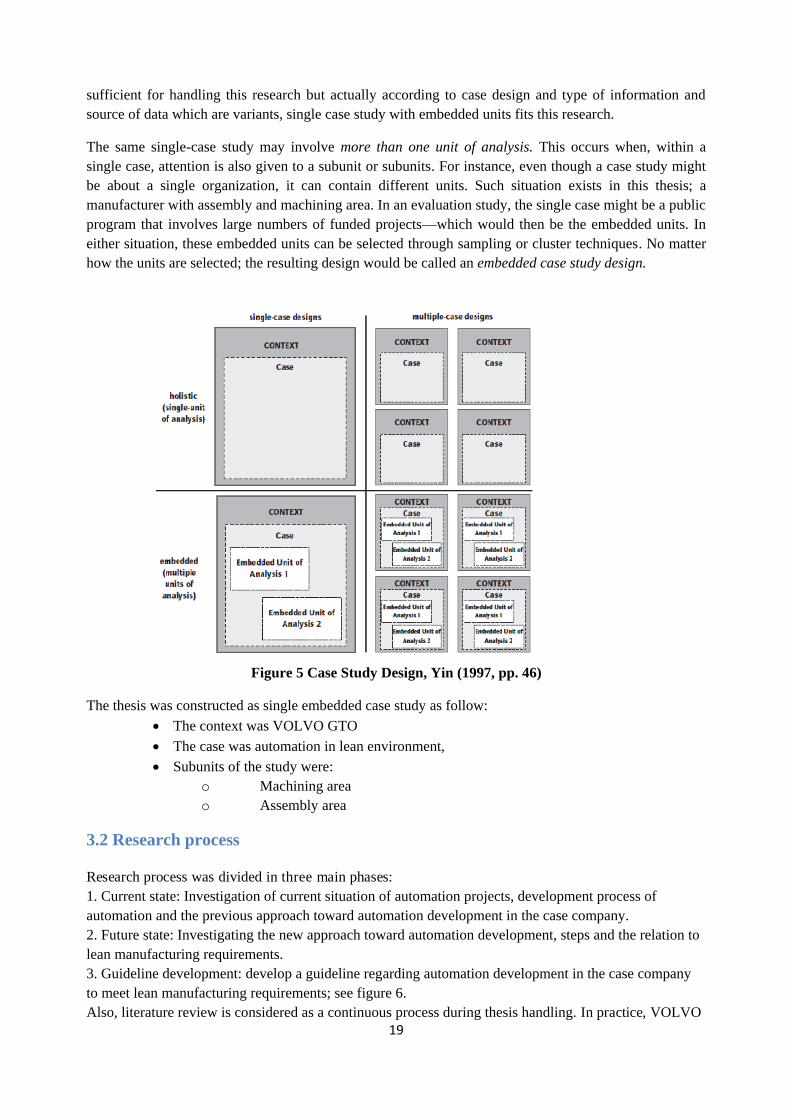
The same single-case study may involve more than one unit of analysis. This occurs when, within a
single case, attention is also given to a subunit or subunits. For instance, even though a case study might
be about a single organization, it can contain different units. Such situation exists in this thesis; a
manufacturer with assembly and machining area. In an evaluation study, the single case might be a public
program that involves large numbers of funded projects—which would then be the embedded units. In
either situation, these embedded units can be selected through sampling or cluster techniques. No matter
how the units are selected; the resulting design would be called an embedded case study design.
Figure 5 Case Study Design, Yin (1997, pp. 46)
The thesis was constructed as single embedded case study as follow:
The context was VOLVO GTO
The case was automation in lean environment,
Subunits of the study were:
o Machining area
o Assembly area
3.2 Research process
Research process was divided in three main phases:
1. Current state: Investigation of current situation of automation projects, development process of
automation and the previous approach toward automation development in the case company.
2. Future state: Investigating the new approach toward automation development, steps and the relation to
lean manufacturing requirements.
3. Guideline development: develop a guideline regarding automation development in the case company
to meet lean manufacturing requirements; see figure 6.
Also, literature review is considered as a continuous process during thesis handling. In practice, VOLVO
20
production system which is inspired from lean manufacturing principles is studied. Furthermore,
VOLVO follows “World Class Manufacturing” explained in empirical findings
Theortical Framework
Chapter 2
Meth
odolo
gy
Chap
ter 3
Existing
Automation
System
Chapter 4
New
Automation
Projects
Chapter4
Comparing the existing system with
the new projects
Chapter 5
Automation development
Guideline within lean
environment
Chapter 6&7
Case Study
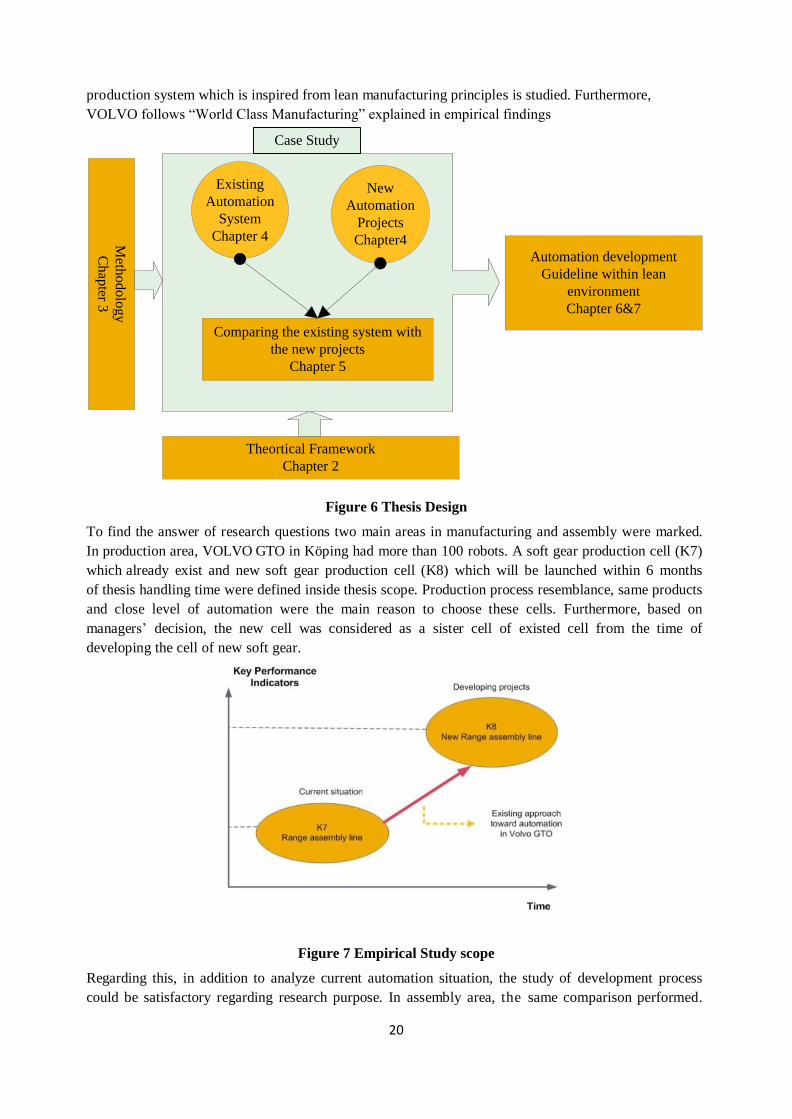
Figure 6 Thesis Design
To find the answer of research questions two main areas in manufacturing and assembly were marked.
In production area, VOLVO GTO in Köping had more than 100 robots. A soft gear production cell (K7)
which already exist and new soft gear production cell (K8) which will be launched within 6 months
of thesis handling time were defined inside thesis scope. Production process resemblance, same products
and close level of automation were the main reason to choose these cells. Furthermore, based on
managers’ decision, the new cell was considered as a sister cell of existed cell from the time of
developing the cell of new soft gear.
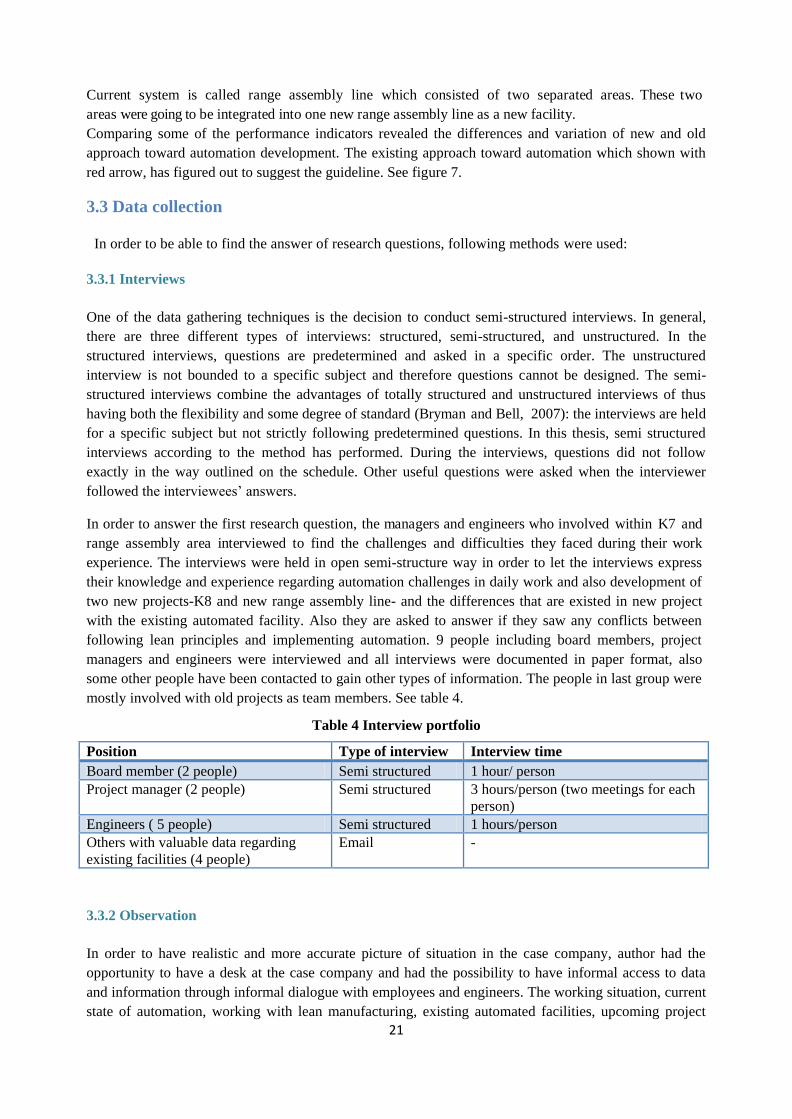
Figure 7 Empirical Study scope
Regarding this, in addition to analyze current automation situation, the study of development process
could be satisfactory regarding research purpose. In assembly area, the same comparison performed.
21
Current system is called range assembly line which consisted of two separated areas. These two
areas were going to be integrated into one new range assembly line as a new facility.
Comparing some of the performance indicators revealed the differences and variation of new and old
approach toward automation development. The existing approach toward automation which shown with
red arrow, has figured out to suggest the guideline. See figure 7.
3.3 Data collection
In order to be able to find the answer of research questions, following methods were used:
3.3.1 Interviews
One of the data gathering techniques is the decision to conduct semi-structured interviews. In general,
there are three different types of interviews: structured, semi-structured, and unstructured. In the
structured interviews, questions are predetermined and asked in a specific order. The unstructured
interview is not bounded to a specific subject and therefore questions cannot be designed. The semi-
structured interviews combine the advantages of totally structured and unstructured interviews of thus
having both the flexibility and some degree of standard (Bryman and Bell, 2007): the interviews are held
for a specific subject but not strictly following predetermined questions. In this thesis, semi structured
interviews according to the method has performed. During the interviews, questions did not follow
exactly in the way outlined on the schedule. Other useful questions were asked when the interviewer
followed the interviewees’ answers.
In order to answer the first research question, the managers and engineers who involved within K7 and
range assembly area interviewed to find the challenges and difficulties they faced during their work
experience. The interviews were held in open semi-structure way in order to let the interviews express
their knowledge and experience regarding automation challenges in daily work and also development of
two new projects-K8 and new range assembly line- and the differences that are existed in new project
with the existing automated facility. Also they are asked to answer if they saw any conflicts between
following lean principles and implementing automation. 9 people including board members, project
managers and engineers were interviewed and all interviews were documented in paper format, also
some other people have been contacted to gain other types of information. The people in last group were
mostly involved with old projects as team members. See table 4.
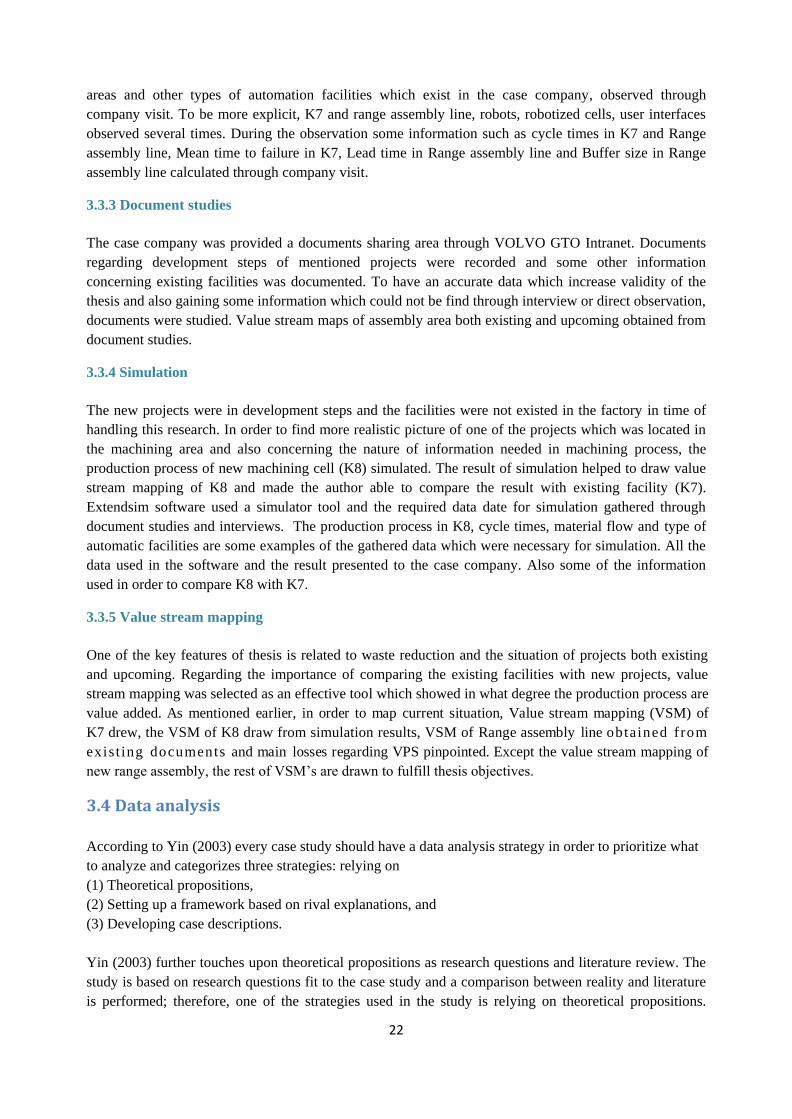
Table 4 Interview portfolio
Position Type of interview Interview time
Board member (2 people) Semi structured 1 hour/ person
Project manager (2 people) Semi structured 3 hours/person (two meetings for each
person)
Engineers ( 5 people) Semi structured 1 hours/person
Others with valuable data regarding
existing facilities (4 people)
Email -
3.3.2 Observation
In order to have realistic and more accurate picture of situation in the case company, author had the
opportunity to have a desk at the case company and had the possibility to have informal access to data
and information through informal dialogue with employees and engineers. The working situation, current
state of automation, working with lean manufacturing, existing automated facilities, upcoming project
22
areas and other types of automation facilities which exist in the case company, observed through
company visit. To be more explicit, K7 and range assembly line, robots, robotized cells, user interfaces
observed several times. During the observation some information such as cycle times in K7 and Range
assembly line, Mean time to failure in K7, Lead time in Range assembly line and Buffer size in Range
assembly line calculated through company visit.
3.3.3 Document studies
The case company was provided a documents sharing area through VOLVO GTO Intranet. Documents
regarding development steps of mentioned projects were recorded and some other information
concerning existing facilities was documented. To have an accurate data which increase validity of the
thesis and also gaining some information which could not be find through interview or direct observation,
documents were studied. Value stream maps of assembly area both existing and upcoming obtained from
document studies.
3.3.4 Simulation
The new projects were in development steps and the facilities were not existed in the factory in time of
handling this research. In order to find more realistic picture of one of the projects which was located in
the machining area and also concerning the nature of information needed in machining process, the
production process of new machining cell (K8) simulated. The result of simulation helped to draw value
stream mapping of K8 and made the author able to compare the result with existing facility (K7).
Extendsim software used a simulator tool and the required data date for simulation gathered through
document studies and interviews. The production process in K8, cycle times, material flow and type of
automatic facilities are some examples of the gathered data which were necessary for simulation. All the
data used in the software and the result presented to the case company. Also some of the information
used in order to compare K8 with K7.
3.3.5 Value stream mapping
One of the key features of thesis is related to waste reduction and the situation of projects both existing
and upcoming. Regarding the importance of comparing the existing facilities with new projects, value
stream mapping was selected as an effective tool which showed in what degree the production process are
value added. As mentioned earlier, in order to map current situation, Value stream mapping (VSM) of
K7 drew, the VSM of K8 draw from simulation results, VSM of Range assembly line obtained f rom
exist ing documents and main losses regarding VPS pinpointed. Except the value stream mapping of
new range assembly, the rest of VSM’s are drawn to fulfill thesis objectives.
3.4 Data analysis
According to Yin (2003) every case study should have a data analysis strategy in order to prioritize what
to analyze and categorizes three strategies: relying on
(1) Theoretical propositions,
(2) Setting up a framework based on rival explanations, and
(3) Developing case descriptions.
Yin (2003) further touches upon theoretical propositions as research questions and literature review. The
study is based on research questions fit to the case study and a comparison between reality and literature
is performed; therefore, one of the strategies used in the study is relying on theoretical propositions.
23
Furthermore developing case descriptions used as second strategy. The later one is used to analyze the
automation development in lean environment and figuring out corresponding challenges, potentials and
benefits. The process is described and compared with the literature.
Yin (2003) suggests choosing a specific analytic technique. A specific analytic technique is chosen in
order to analyze the current situation and developing projects and compare the result based on some key
performance indicators.
In the study, data analysis was held for both qualitative and quantitative data based on the data collected
during interviews held in the company with the managers and engineers of automation projects in
machining and assembly and documents gathered from the company. The qualitative analysis is based on
the interviews about the automation, challenges, potentials and benefits. The quantitative analysis is
performed for identifying some key performance indicators and some elements regarding projects
performance. Yin (2003) suggests that data analysis includes examining, categorizing, tabulating, and
testing. In the study, collected data regarding automation challenges and problems are categorized into
two main categories. The first category represents problems and challenges raised in development
process and second category represents problems and challenges in daily working.
In line with thesis objectives the gathered data analysed in a manner that could help to find answer of
research questions. Most of the data analysis results are presented in form of table in analysis section.
Regarding this, the data related to machining area are divided in to two parts including existing project-
K7 and developing project-K8. The indicators chose based on thesis scope and tried to focus on lean
aspect of developing project. For instance, value added percentage of production process, lead time, cycle
time, inventory level, Mean time to repair and Mean to failure are calculated or gathered.
3.5 Validity and Reliability
Validity and reliability are used to determine research quality. All research elements including
parameters, tools, data gathering techniques and research method have to be valid and reliable to be
useful. Scientific value of a research depends on the validity and reliability of the research (Bryman and
Bell, 2007).
Validity of a research concerns the accuracy and precision of the gathered data. Also it represents the
suitability of the information that has been collected in line with research questions (Bryman and Bell,
2007). In this thesis, data are gathered through different methods such as interview, observation,
simulation and document study. Almost all the data within the thesis were admitted through more than
one method. For instance information gathered in observation was admitted in interviews by experts. In
addition, the simulation results were according to what VOLVO GTO expected before. Value stream
mapping of the cells were admitted by engineers and project managers. Also, the sources of data
gathering were to somehow the same as sources the case company used for developing projects and daily
work. In addition to the interview, direct observation of the case company and situation of automation,
the existing facilities and the project development process were observed which validate the gathered
data. Document studies have been done in order to find precise information which might be absent during
interviews. Also document studies approved direct observation especially regarding performance
indicators which need extra attention.
Reliability concerns the credibility of the research methods which has been used and if the research
method suits the research topic. Further, reliability depends on how the measuring is performed and how
accurate the researcher has been regarding the interpretation and processing of the acquired information
24
(Bryman and Bell, 2007).
In order to have reliable results within this research, several aspects are considered. Research
methodology has chosen as case study which tries to investigate a phenomenon from new perspective
considering existing theories. Ellram (1996) discussed about the importance of case study method in
logistics and conclude that the most suitable method for creation of novel theory from insufficient theory
is cases study. Also the case study design is embedded case study design according to Yin (1997). This
design is valid for this research because it let the researcher to compare two different units inside one
environment.
Regarding data collection methods, semi structured interviews let the researcher to find a wider view
toward subject and the experts that are interviewed are the reliable source for data accuracy. In addition,
within the interviews it has tried to follow same structure in order to find different perspectives toward
same subject to avoid possible pitfalls.
Also in order to be able to have a reasonable comparing between existing automation system in the
machining and the future project, simulation is used. This make the result reliable and valid due to
precision of the calculation and because the entering data for simulation all acquired from real existing
system and through checking with experts. On the other hand a so-called tool within lean manufacturing,
Value stream mapping has used. VSM’s verify the interview findings and is a reliable tool for detecting
losses in the systems.
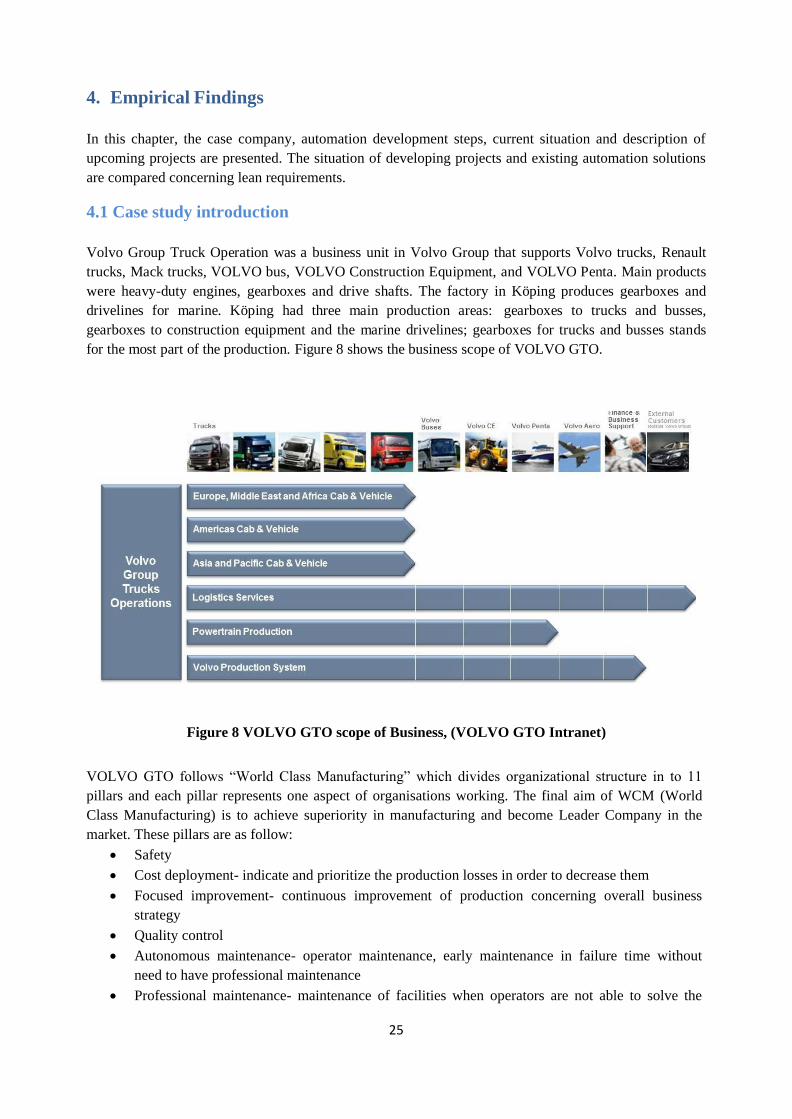
25
4. Empirical Findings
In this chapter, the case company, automation development steps, current situation and description of
upcoming projects are presented. The situation of developing projects and existing automation solutions
are compared concerning lean requirements.
4.1 Case study introduction
Volvo Group Truck Operation was a business unit in Volvo Group that supports Volvo trucks, Renault
trucks, Mack trucks, VOLVO bus, VOLVO Construction Equipment, and VOLVO Penta. Main products
were heavy-duty engines, gearboxes and drive shafts. The factory in Köping produces gearboxes and
drivelines for marine. Köping had three main production areas: gearboxes to trucks and busses,
gearboxes to construction equipment and the marine drivelines; gearboxes for trucks and busses stands
for the most part of the production. Figure 8 shows the business scope of VOLVO GTO.
Figure 8 VOLVO GTO scope of Business, (VOLVO GTO Intranet)
VOLVO GTO follows “World Class Manufacturing” which divides organizational structure in to 11
pillars and each pillar represents one aspect of organisations working. The final aim of WCM (World
Class Manufacturing) is to achieve superiority in manufacturing and become Leader Company in the
market. These pillars are as follow:
Safety
Cost deployment- indicate and prioritize the production losses in order to decrease them
Focused improvement- continuous improvement of production concerning overall business
strategy
Quality control
Autonomous maintenance- operator maintenance, early maintenance in failure time without
need to have professional maintenance
Professional maintenance- maintenance of facilities when operators are not able to solve the
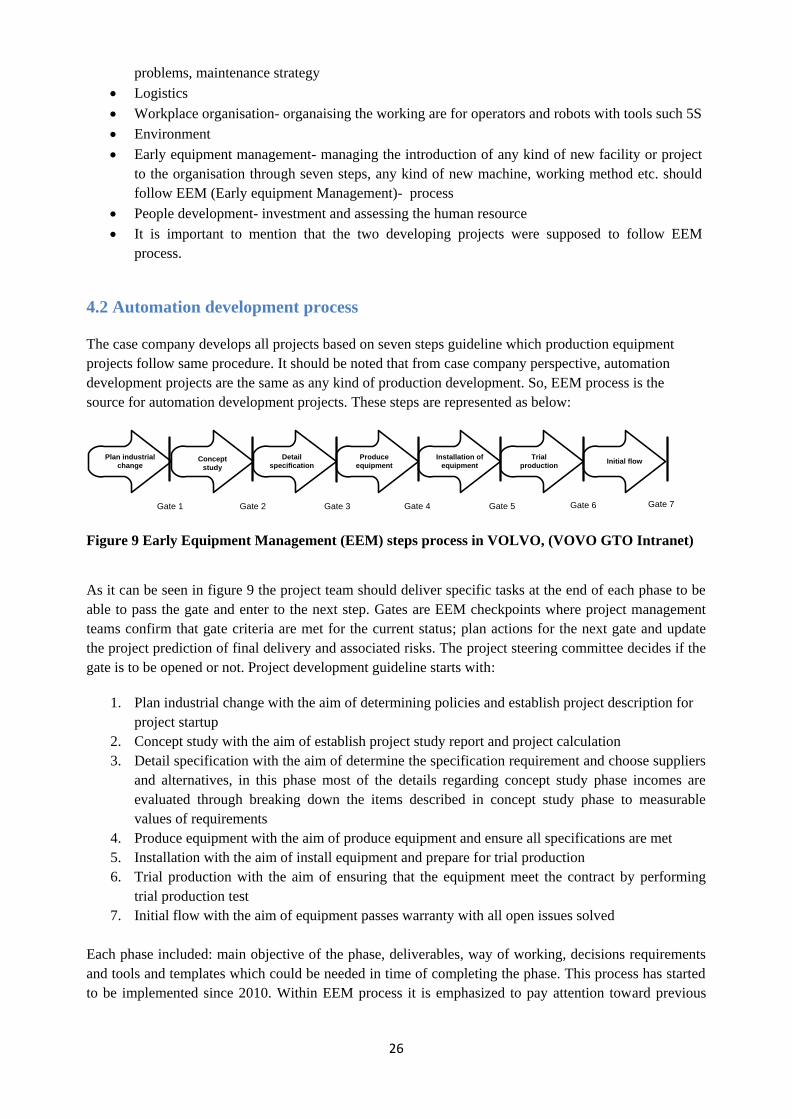
26
problems, maintenance strategy
Logistics
Workplace organisation- organaising the working are for operators and robots with tools such 5S
Environment
Early equipment management- managing the introduction of any kind of new facility or project
to the organisation through seven steps, any kind of new machine, working method etc. should
follow EEM (Early equipment Management)- process
People development- investment and assessing the human resource
It is important to mention that the two developing projects were supposed to follow EEM
process.
4.2 Automation development process
The case company develops all projects based on seven steps guideline which production equipment
projects follow same procedure. It should be noted that from case company perspective, automation
development projects are the same as any kind of production development. So, EEM process is the
source for automation development projects. These steps are represented as below:
Plan industrial
changeConcept
study
Detail
specification
Produce
equipment
Installation of
equipment
Trial
productionInitial flow
Gate 1 Gate 2 Gate 3 Gate 4 Gate 5 Gate 6 Gate 7
Figure 9 Early Equipment Management (EEM) steps process in VOLVO, (VOVO GTO Intranet)
As it can be seen in figure 9 the project team should deliver specific tasks at the end of each phase to be
able to pass the gate and enter to the next step. Gates are EEM checkpoints where project management
teams confirm that gate criteria are met for the current status; plan actions for the next gate and update
the project prediction of final delivery and associated risks. The project steering committee decides if the
gate is to be opened or not. Project development guideline starts with:
1. Plan industrial change with the aim of determining policies and establish project description for
project startup
2. Concept study with the aim of establish project study report and project calculation
3. Detail specification with the aim of determine the specification requirement and choose suppliers
and alternatives, in this phase most of the details regarding concept study phase incomes are
evaluated through breaking down the items described in concept study phase to measurable
values of requirements
4. Produce equipment with the aim of produce equipment and ensure all specifications are met
5. Installation with the aim of install equipment and prepare for trial production
6. Trial production with the aim of ensuring that the equipment meet the contract by performing
trial production test
7. Initial flow with the aim of equipment passes warranty with all open issues solved
Each phase included: main objective of the phase, deliverables, way of working, decisions requirements
and tools and templates which could be needed in time of completing the phase. This process has started
to be implemented since 2010. Within EEM process it is emphasized to pay attention toward previous
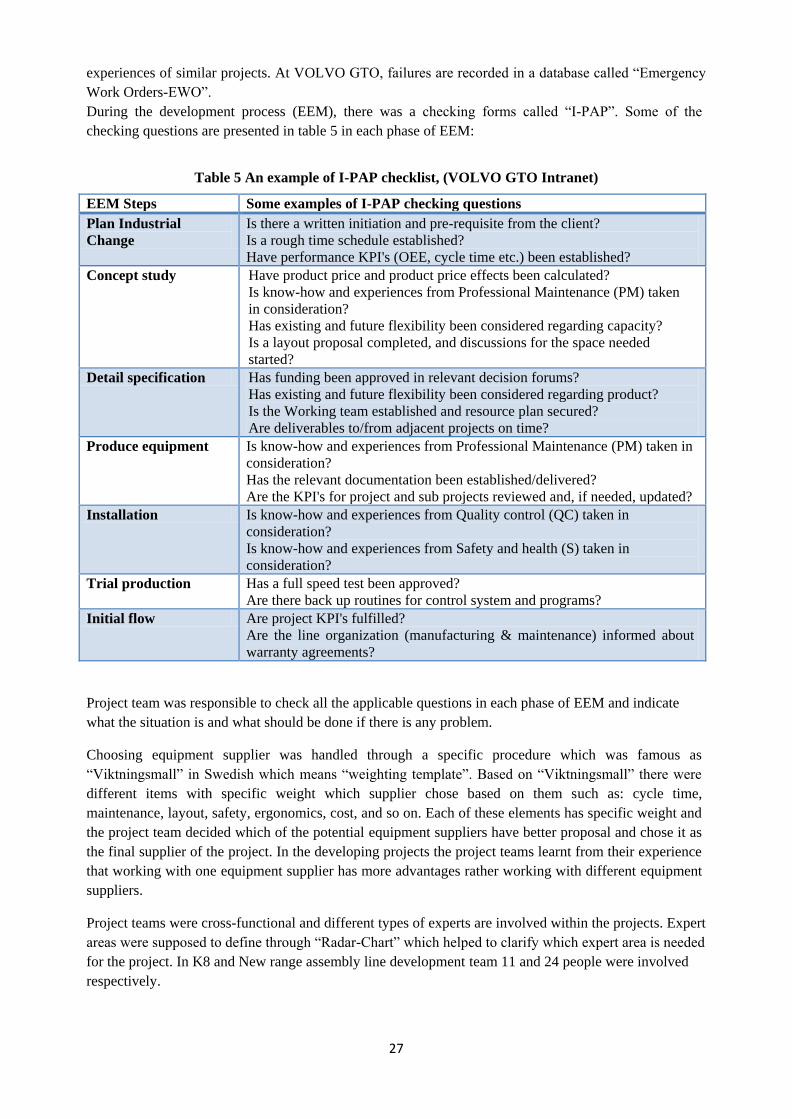
27
experiences of similar projects. At VOLVO GTO, failures are recorded in a database called “Emergency
Work Orders-EWO”.
During the development process (EEM), there was a checking forms called “I-PAP”. Some of the
checking questions are presented in table 5 in each phase of EEM:
Table 5 An example of I-PAP checklist, (VOLVO GTO Intranet)
EEM Steps Some examples of I-PAP checking questions
Plan Industrial
Change
Is there a written initiation and pre-requisite from the client?
Is a rough time schedule established?
Have performance KPI's (OEE, cycle time etc.) been established?
Concept study Have product price and product price effects been calculated?
Is know-how and experiences from Professional Maintenance (PM) taken
in consideration?
Has existing and future flexibility been considered regarding capacity?
Is a layout proposal completed, and discussions for the space needed
started?
Detail specification Has funding been approved in relevant decision forums?
Has existing and future flexibility been considered regarding product?
Is the Working team established and resource plan secured?
Are deliverables to/from adjacent projects on time?
Produce equipment Is know-how and experiences from Professional Maintenance (PM) taken in
consideration?
Has the relevant documentation been established/delivered?
Are the KPI's for project and sub projects reviewed and, if needed, updated?
Installation Is know-how and experiences from Quality control (QC) taken in
consideration?
Is know-how and experiences from Safety and health (S) taken in
consideration?
Trial production Has a full speed test been approved?
Are there back up routines for control system and programs?
Initial flow Are project KPI's fulfilled?
Are the line organization (manufacturing & maintenance) informed about
warranty agreements?
Project team was responsible to check all the applicable questions in each phase of EEM and indicate
what the situation is and what should be done if there is any problem.
Choosing equipment supplier was handled through a specific procedure which was famous as
“Viktningsmall” in Swedish which means “weighting template”. Based on “Viktningsmall” there were
different items with specific weight which supplier chose based on them such as: cycle time,
maintenance, layout, safety, ergonomics, cost, and so on. Each of these elements has specific weight and
the project team decided which of the potential equipment suppliers have better proposal and chose it as
the final supplier of the project. In the developing projects the project teams learnt from their experience
that working with one equipment supplier has more advantages rather working with different equipment
suppliers.
Project teams were cross-functional and different types of experts are involved within the projects. Expert
areas were supposed to define through “Radar-Chart” which helped to clarify which expert area is needed
for the project. In K8 and New range assembly line development team 11 and 24 people were involved
respectively.
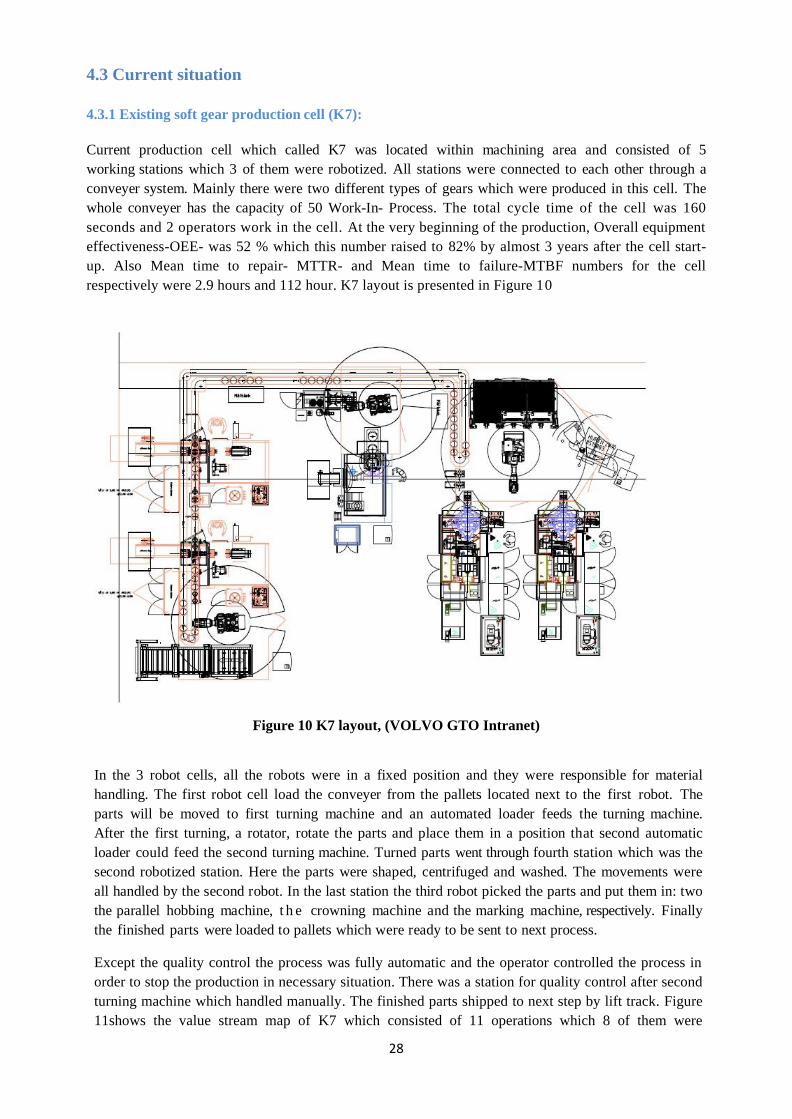
28
4.3 Current situation
4.3.1 Existing soft gear production cell (K7):
Current production cell which called K7 was located within machining area and consisted of 5
working stations which 3 of them were robotized. All stations were connected to each other through a
conveyer system. Mainly there were two different types of gears which were produced in this cell. The
whole conveyer has the capacity of 50 Work-In- Process. The total cycle time of the cell was 160
seconds and 2 operators work in the cell. At the very beginning of the production, Overall equipment
effectiveness-OEE- was 52 % which this number raised to 82% by almost 3 years after the cell start-
up. Also Mean time to repair- MTTR- and Mean time to failure-MTBF numbers for the cell
respectively were 2.9 hours and 112 hour. K7 layout is presented in Figure 10
Figure 10 K7 layout, (VOLVO GTO Intranet)
In the 3 robot cells, all the robots were in a fixed position and they were responsible for material
handling. The first robot cell load the conveyer from the pallets located next to the first robot. The
parts will be moved to first turning machine and an automated loader feeds the turning machine.
After the first turning, a rotator, rotate the parts and place them in a position that second automatic
loader could feed the second turning machine. Turned parts went through fourth station which was the
second robotized station. Here the parts were shaped, centrifuged and washed. The movements were
all handled by the second robot. In the last station the third robot picked the parts and put them in: two
the parallel hobbing machine, t h e crowning machine and the marking machine, respectively. Finally
the finished parts were loaded to pallets which were ready to be sent to next process.
Except the quality control the process was fully automatic and the operator controlled the process in
order to stop the production in necessary situation. There was a station for quality control after second
turning machine which handled manually. The finished parts shipped to next step by lift track. Figure
11shows the value stream map of K7 which consisted of 11 operations which 8 of them were
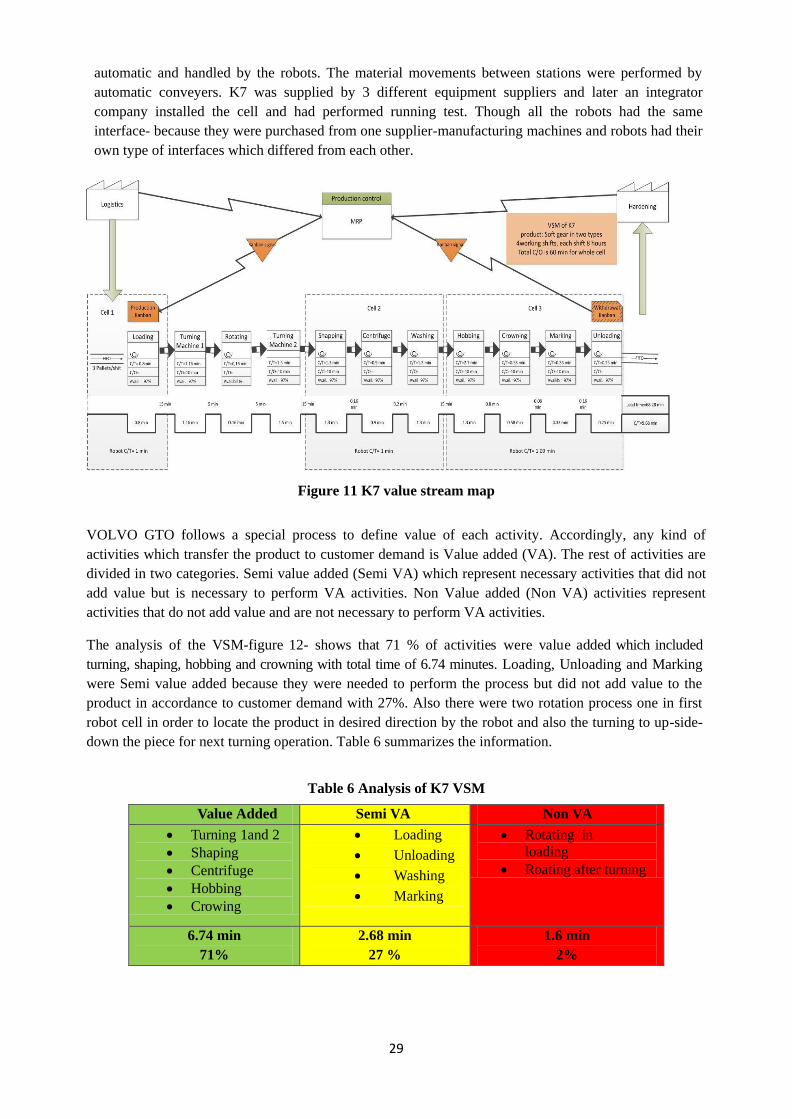
29
automatic and handled by the robots. The material movements between stations were performed by
automatic conveyers. K7 was supplied by 3 different equipment suppliers and later an integrator
company installed the cell and had performed running test. Though all the robots had the same
interface- because they were purchased from one supplier-manufacturing machines and robots had their
own type of interfaces which differed from each other.
Figure 11 K7 value stream map
VOLVO GTO follows a special process to define value of each activity. Accordingly, any kind of
activities which transfer the product to customer demand is Value added (VA). The rest of activities are
divided in two categories. Semi value added (Semi VA) which represent necessary activities that did not
add value but is necessary to perform VA activities. Non Value added (Non VA) activities represent
activities that do not add value and are not necessary to perform VA activities.
The analysis of the VSM-figure 12- shows that 71 % of activities were value added which included
turning, shaping, hobbing and crowning with total time of 6.74 minutes. Loading, Unloading and Marking
were Semi value added because they were needed to perform the process but did not add value to the
product in accordance to customer demand with 27%. Also there were two rotation process one in first
robot cell in order to locate the product in desired direction by the robot and also the turning to up-side-
down the piece for next turning operation. Table 6 summarizes the information.
Table 6 Analysis of K7 VSM
Value Added Semi VA Non VA
Turning 1and 2
Shaping
Centrifuge
Hobbing
Crowing
Loading
Unloading
Washing
Marking
Rotating in
loading
Roating after turning
6.74 min
71%
2.68 min
27 %
1.6 min
2%
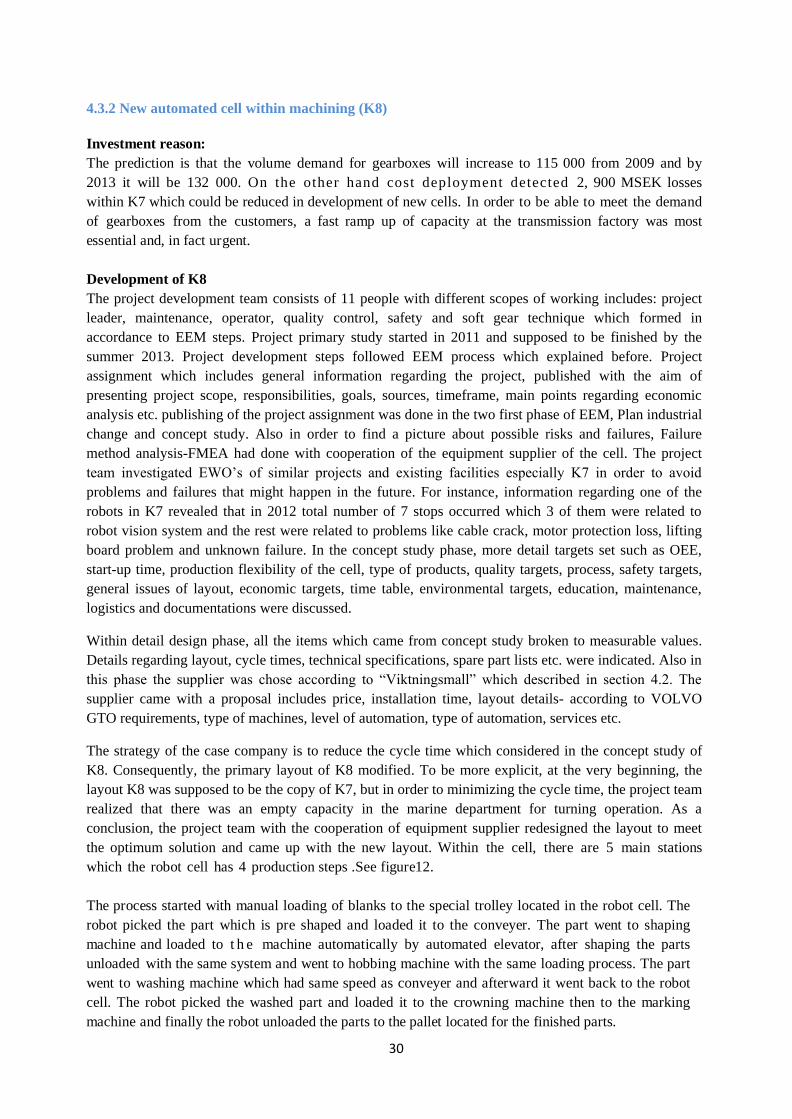
30
4.3.2 New automated cell within machining (K8)
Investment reason:
The prediction is that the volume demand for gearboxes will increase to 115 000 from 2009 and by
2013 it will be 132 000. On the other hand cost deployment detected 2, 900 MSEK losses
within K7 which could be reduced in development of new cells. In order to be able to meet the demand
of gearboxes from the customers, a fast ramp up of capacity at the transmission factory was most
essential and, in fact urgent.
Development of K8
The project development team consists of 11 people with different scopes of working includes: project
leader, maintenance, operator, quality control, safety and soft gear technique which formed in
accordance to EEM steps. Project primary study started in 2011 and supposed to be finished by the
summer 2013. Project development steps followed EEM process which explained before. Project
assignment which includes general information regarding the project, published with the aim of
presenting project scope, responsibilities, goals, sources, timeframe, main points regarding economic
analysis etc. publishing of the project assignment was done in the two first phase of EEM, Plan industrial
change and concept study. Also in order to find a picture about possible risks and failures, Failure
method analysis-FMEA had done with cooperation of the equipment supplier of the cell. The project
team investigated EWO’s of similar projects and existing facilities especially K7 in order to avoid
problems and failures that might happen in the future. For instance, information regarding one of the
robots in K7 revealed that in 2012 total number of 7 stops occurred which 3 of them were related to
robot vision system and the rest were related to problems like cable crack, motor protection loss, lifting
board problem and unknown failure. In the concept study phase, more detail targets set such as OEE,
start-up time, production flexibility of the cell, type of products, quality targets, process, safety targets,
general issues of layout, economic targets, time table, environmental targets, education, maintenance,
logistics and documentations were discussed.
Within detail design phase, all the items which came from concept study broken to measurable values.
Details regarding layout, cycle times, technical specifications, spare part lists etc. were indicated. Also in
this phase the supplier was chose according to “Viktningsmall” which described in section 4.2. The
supplier came with a proposal includes price, installation time, layout details- according to VOLVO
GTO requirements, type of machines, level of automation, type of automation, services etc.
The strategy of the case company is to reduce the cycle time which considered in the concept study of
K8. Consequently, the primary layout of K8 modified. To be more explicit, at the very beginning, the
layout K8 was supposed to be the copy of K7, but in order to minimizing the cycle time, the project team
realized that there was an empty capacity in the marine department for turning operation. As a
conclusion, the project team with the cooperation of equipment supplier redesigned the layout to meet
the optimum solution and came up with the new layout. Within the cell, there are 5 main stations
which the robot cell has 4 production steps .See figure12.
The process started with manual loading of blanks to the special trolley located in the robot cell. The
robot picked the part which is pre shaped and loaded it to the conveyer. The part went to shaping
machine and loaded to t h e machine automatically by automated elevator, after shaping the parts
unloaded with the same system and went to hobbing machine with the same loading process. The part
went to washing machine which had same speed as conveyer and afterward it went back to the robot
cell. The robot picked the washed part and loaded it to the crowning machine then to the marking
machine and finally the robot unloaded the parts to the pallet located for the finished parts.
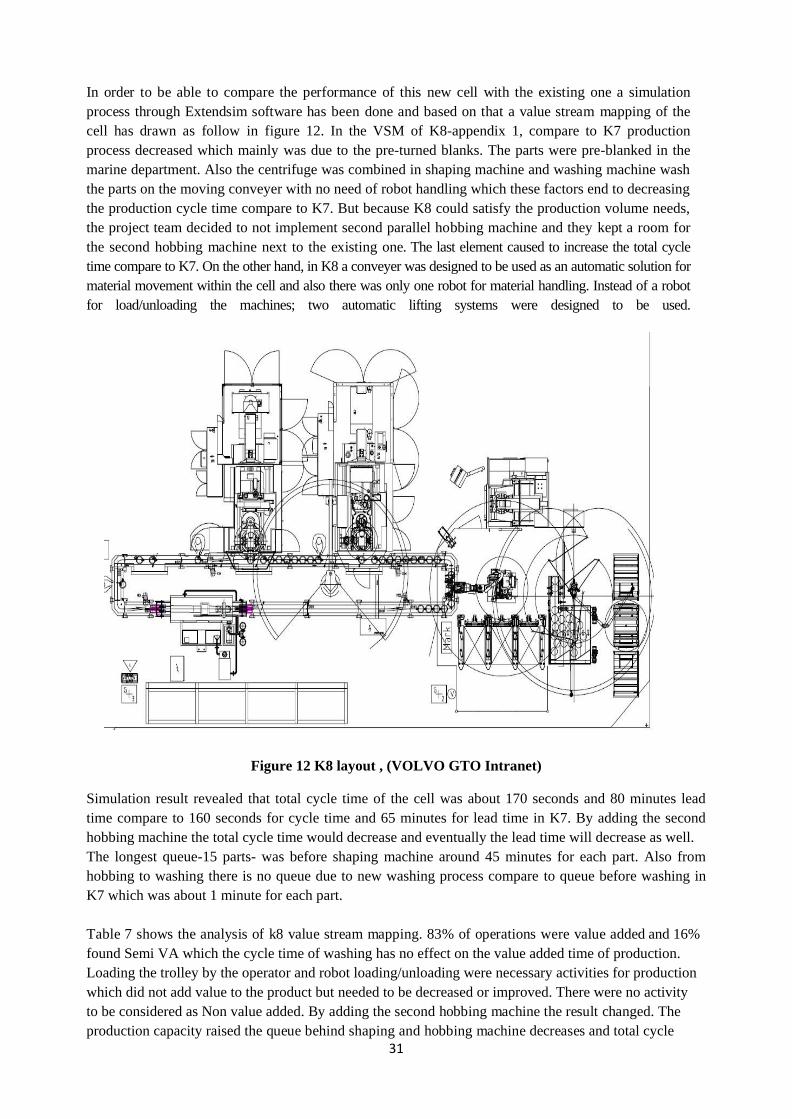
31
In order to be able to compare the performance of this new cell with the existing one a simulation
process through Extendsim software has been done and based on that a value stream mapping of the
cell has drawn as follow in figure 12. In the VSM of K8-appendix 1, compare to K7 production
process decreased which mainly was due to the pre-turned blanks. The parts were pre-blanked in the
marine department. Also the centrifuge was combined in shaping machine and washing machine wash
the parts on the moving conveyer with no need of robot handling which these factors end to decreasing
the production cycle time compare to K7. But because K8 could satisfy the production volume needs,
the project team decided to not implement second parallel hobbing machine and they kept a room for
the second hobbing machine next to the existing one. The last element caused to increase the total cycle
time compare to K7. On the other hand, in K8 a conveyer was designed to be used as an automatic solution for
material movement within the cell and also there was only one robot for material handling. Instead of a robot
for load/unloading the machines; two automatic lifting systems were designed to be used.
Figure 12 K8 layout , (VOLVO GTO Intranet)
Simulation result revealed that total cycle time of the cell was about 170 seconds and 80 minutes lead
time compare to 160 seconds for cycle time and 65 minutes for lead time in K7. By adding the second
hobbing machine the total cycle time would decrease and eventually the lead time will decrease as well.
The longest queue-15 parts- was before shaping machine around 45 minutes for each part. Also from
hobbing to washing there is no queue due to new washing process compare to queue before washing in
K7 which was about 1 minute for each part.
Table 7 shows the analysis of k8 value stream mapping. 83% of operations were value added and 16%
found Semi VA which the cycle time of washing has no effect on the value added time of production.
Loading the trolley by the operator and robot loading/unloading were necessary activities for production
which did not add value to the product but needed to be decreased or improved. There were no activity
to be considered as Non value added. By adding the second hobbing machine the result changed. The
production capacity raised the queue behind shaping and hobbing machine decreases and total cycle
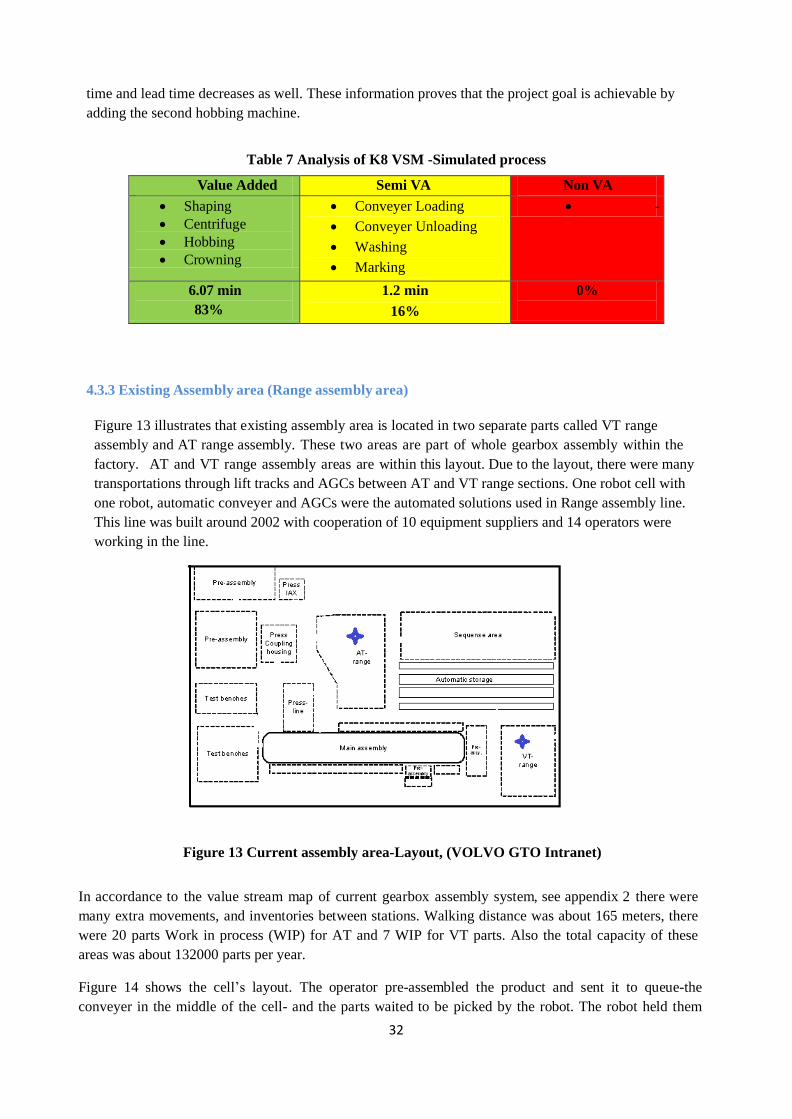
32
time and lead time decreases as well. These information proves that the project goal is achievable by
adding the second hobbing machine.
Table 7 Analysis of K8 VSM -Simulated process
Value Added Semi VA Non VA
Shaping
Centrifuge
Hobbing
Crowning
Conveyer Loading
Conveyer Unloading
Washing
Marking
-
6.07 min
83%
1.2 min
16%
0%
4.3.3 Existing Assembly area (Range assembly area)
Figure 13 illustrates that existing assembly area is located in two separate parts called VT range
assembly and AT range assembly. These two areas are part of whole gearbox assembly within the
factory. AT and VT range assembly areas are within this layout. Due to the layout, there were many
transportations through lift tracks and AGCs between AT and VT range sections. One robot cell with
one robot, automatic conveyer and AGCs were the automated solutions used in Range assembly line.
This line was built around 2002 with cooperation of 10 equipment suppliers and 14 operators were
working in the line.
Figure 13 Current assembly area-Layout, (VOLVO GTO Intranet)
In accordance to the value stream map of current gearbox assembly system, see appendix 2 there were
many extra movements, and inventories between stations. Walking distance was about 165 meters, there
were 20 parts Work in process (WIP) for AT and 7 WIP for VT parts. Also the total capacity of these
areas was about 132000 parts per year.
Figure 14 shows the cell’s layout. The operator pre-assembled the product and sent it to queue-the
conveyer in the middle of the cell- and the parts waited to be picked by the robot. The robot held them
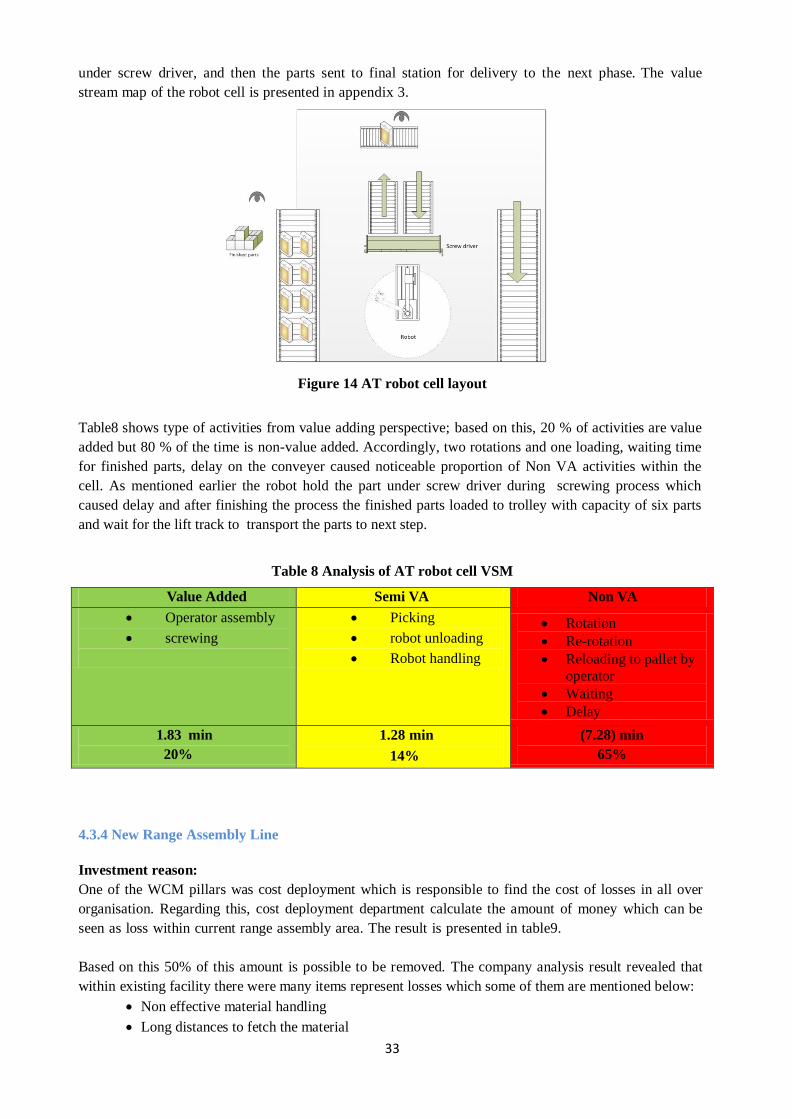
33
under screw driver, and then the parts sent to final station for delivery to the next phase. The value
stream map of the robot cell is presented in appendix 3.
Figure 14 AT robot cell layout
Table8 shows type of activities from value adding perspective; based on this, 20 % of activities are value
added but 80 % of the time is non-value added. Accordingly, two rotations and one loading, waiting time
for finished parts, delay on the conveyer caused noticeable proportion of Non VA activities within the
cell. As mentioned earlier the robot hold the part under screw driver during screwing process which
caused delay and after finishing the process the finished parts loaded to trolley with capacity of six parts
and wait for the lift track to transport the parts to next step.
Table 8 Analysis of AT robot cell VSM
Value Added Semi VA Non VA
Operator assembly
screwing
Picking
robot unloading
Robot handling
Rotation
Re-rotation
Reloading to pallet by
operator
Waiting
Delay
1.83 min
20%
1.28 min
14%
(7.28) min
65%
4.3.4 New Range Assembly Line
Investment reason:
One of the WCM pillars was cost deployment which is responsible to find the cost of losses in all over
organisation. Regarding this, cost deployment department calculate the amount of money which can be
seen as loss within current range assembly area. The result is presented in table9.
Based on this 50% of this amount is possible to be removed. The company analysis result revealed that
within existing facility there were many items represent losses which some of them are mentioned below:
Non effective material handling
Long distances to fetch the material
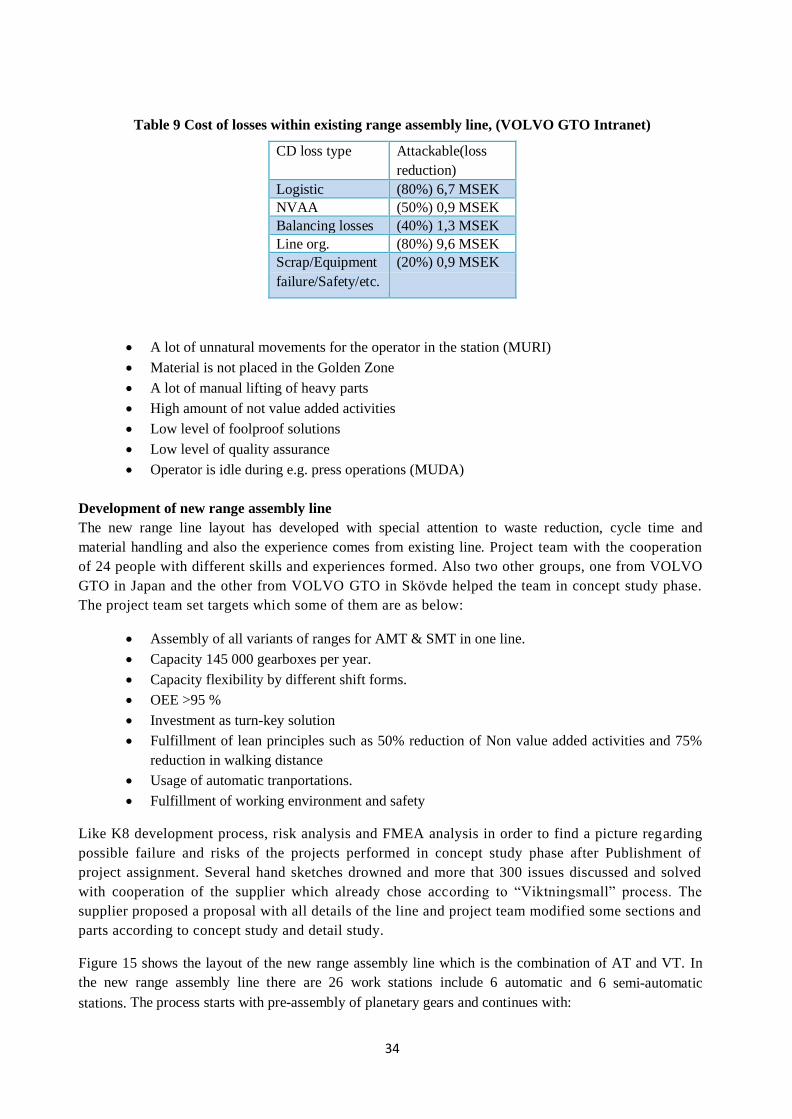
34
Table 9 Cost of losses within existing range assembly line, (VOLVO GTO Intranet)
CD loss type Attackable(loss
reduction)
Logistic (80%) 6,7 MSEK
NVAA (50%) 0,9 MSEK
Balancing losses (40%) 1,3 MSEK
Line org. (80%) 9,6 MSEK
Scrap/Equipment
failure/Safety/etc.
(20%) 0,9 MSEK
A lot of unnatural movements for the operator in the station (MURI)
Material is not placed in the Golden Zone
A lot of manual lifting of heavy parts
High amount of not value added activities
Low level of foolproof solutions
Low level of quality assurance
Operator is idle during e.g. press operations (MUDA)
Development of new range assembly line
The new range line layout has developed with special attention to waste reduction, cycle time and
material handling and also the experience comes from existing line. Project team with the cooperation
of 24 people with different skills and experiences formed. Also two other groups, one from VOLVO
GTO in Japan and the other from VOLVO GTO in Skövde helped the team in concept study phase.
The project team set targets which some of them are as below:
Assembly of all variants of ranges for AMT & SMT in one line.
Capacity 145 000 gearboxes per year.
Capacity flexibility by different shift forms.
OEE >95 %
Investment as turn-key solution
Fulfillment of lean principles such as 50% reduction of Non value added activities and 75%
reduction in walking distance
Usage of automatic tranportations.
Fulfillment of working environment and safety
Like K8 development process, risk analysis and FMEA analysis in order to find a picture regarding
possible failure and risks of the projects performed in concept study phase after Publishment of
project assignment. Several hand sketches drowned and more that 300 issues discussed and solved
with cooperation of the supplier which already chose according to “Viktningsmall” process. The
supplier proposed a proposal with all details of the line and project team modified some sections and
parts according to concept study and detail study.
Figure 15 shows the layout of the new range assembly line which is the combination of AT and VT. In
the new range assembly line there are 26 work stations include 6 automatic and 6 semi-automatic
stations. The process starts with pre-assembly of planetary gears and continues with:
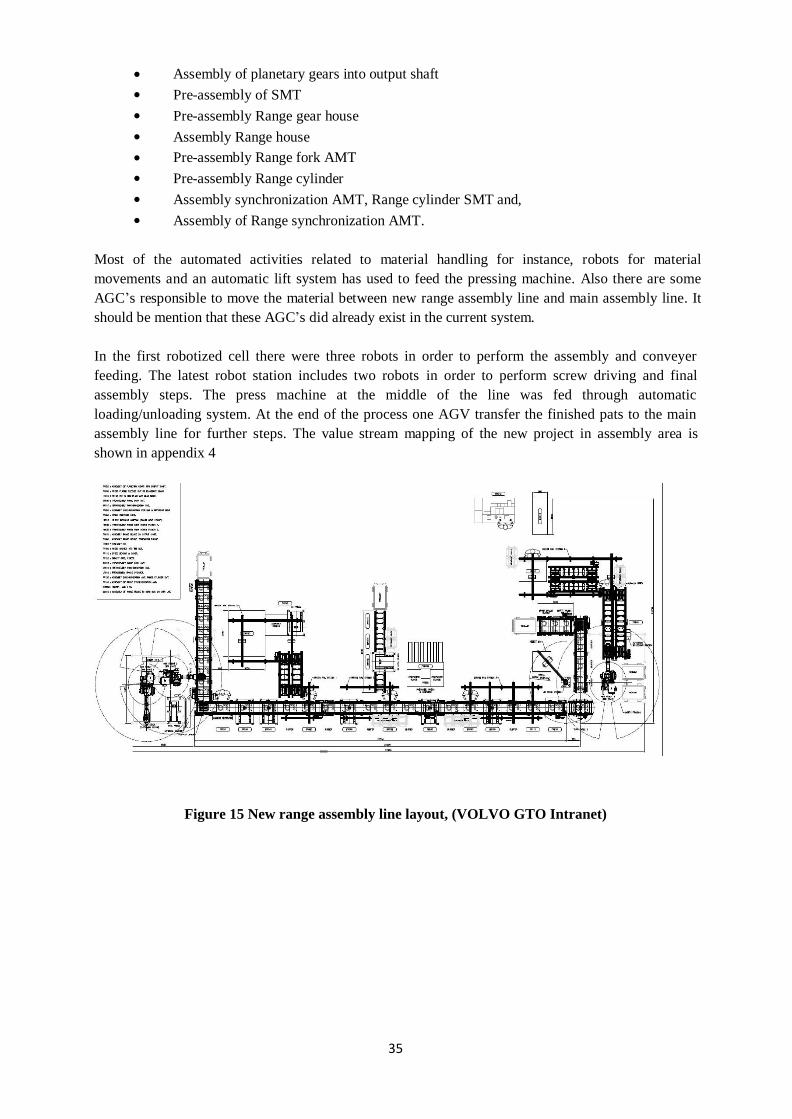
35
Assembly of planetary gears into output shaft
Pre-assembly of SMT
Pre-assembly Range gear house
Assembly Range house
Pre-assembly Range fork AMT
Pre-assembly Range cylinder
Assembly synchronization AMT, Range cylinder SMT and,
Assembly of Range synchronization AMT.
Most of the automated activities related to material handling for instance, robots for material
movements and an automatic lift system has used to feed the pressing machine. Also there are some
AGC’s responsible to move the material between new range assembly line and main assembly line. It
should be mention that these AGC’s did already exist in the current system.
In the first robotized cell there were three robots in order to perform the assembly and conveyer
feeding. The latest robot station includes two robots in order to perform screw driving and final
assembly steps. The press machine at the middle of the line was fed through automatic
loading/unloading system. At the end of the process one AGV transfer the finished pats to the main
assembly line for further steps. The value stream mapping of the new project in assembly area is
shown in appendix 4
Figure 15 New range assembly line layout, (VOLVO GTO Intranet)
36
4.4 Automation development potentials, Challenges and benefits at VOLVO GTO
As mentioned in methodology section, managers and engineers involved in automation development
projects, interviewed in order to figure out what potentials, challenges and benefits they faced during
development of projects or daily work with automation solutions. Also the result of data collections added
to this section and automation challenges and problems presented as follow:
4.4.1Automation challenges
Automation integrating issue:
In VOLVO Köping, there were different types of automation supplier with different programming
approach. For instance in k7, there were three different suppliers which supplied the conveyers, the robots
and the machines. Consequently, at installation time and also during production time there were many
problems to synchronize all these facilities. As one of the managers said” we have to think about the
logic of one programmer which is located in North America and the other one in Germany and find a way
to integrate these two.” Regarding this challenge, it is tried to work with less number of suppliers in future
automation projects, specifically the new soft gear production cell and new range assembly line which are
in the scope of this thesis.
High initial cost:
As responders mentioned, robot purchasing is costly and in addition to robots it makes marginal cost like
programming modification, maintenance etc.
Quality issue:
In some cases the robots are not able to detect defected parts and scraps. Though in current production cell
of soft gear almost there is no scrap but this problem occurred in other production cells with older
production machines.
Visualisation:
The concept of black box is mentioned during interviews. Operators and observers do not have clear
picture that what is going on inside robots and –sometimes- the cells.
Maintenance:
As one of the responders mentioned “high-tech projects cause disturbances and complexity”. For instance,
high mean time to repair (MTTR) is a result of complex maintenance of robots, automated facilities and
their tools. Finding suitable spare parts, contact supplier etc. are some examples that increase MTTR.
Supplier-customer relationship:
It is so common to see that supplier is not aware about his customer needs. Mostly suppliers due to
vast range of their customers are not familiar with their customers’ production strategy and situation. In
this respect, there is a need to modify the automation facility setting and programming after purchasing
which is a time and cost consuming activities. Even in some cases it cause high amount of losses because
the customer is not satisfied with the robots and need to replace them.
Dependency on third party:
Maintaining robots, programming modification and integrating one production area are some
examples that lead to dependency on third party which can be supplier or consultant. The case
company study shows lack of competence regarding automation which causes dependency on third
party.
37
Training:
Working with robots needs well trained operators and engineers. Training operators in automated are
takes longer time. As an example “it takes at least six months to train pre skilled operators to be able to
work within one production cell with three robots” as one of the interviewees said. Consequently other
involved people also might need to have more information and skills to be able to deal with
breakdowns and development.
4.4.2 Automation benefits
Reducing production and human resource cost:
Robots can continue working nonstop. Concerning high human cost in Sweden and working rules which
let all operators to have 5 weeks holiday during a year, using robots seems more reasonable.
Eventually the overall production cost will increase through automation.
Ergonomics:
Weight and size of many products, need lifting help tools. In such situation robots can handle the
handling process much easier than operators with less ergonomic risk.
Availability:
Comparing to human source, robots do not need vacation, rest or changing shifts. As managers
express, almost all robots have the availability around 97%.
Capacity improvement:
As mentioned earlier, the high availability rate of robots will end to production capacity improvement.
4.4.3 Potentials for Automation development
In the case company, generally it is believed that the EEM approach toward automation development- which
mentioned earlier - has achieved significant improvements in the most of indicators. For instance, OEE, the
percentage of Non-VA activates, ergonomics indicators, movements, complexity of solutions, vertical
startup and etc. improved. On the other hand still there are crucial elements to be considered in
development phase which seems were absent in development phase of the new projects and the case
company did not pay enough attention toward them. These are presented as follow:
Organise Ad hoc approach toward following EEM steps
Comparing the results of new projects in assembly and machining, it is found that EEM process from
project manager team members is not matured enough and still there are some doubts about
deliverables at the end of each phase of the process.
Reduce the complexity of solutions
Despite existing of numbers of simple solution which offered by suppliers such as automatic
conveyers, automatic rotators and automated lifting devices; the current approach toward
implementing automated solutions are complicated and using simple solutions is not a strategy.
Integrate various interfaces from various suppliers
Human-Machine-Interfaces are supplied by different suppliers during the development of the factory and
each HMI designed based on supplier or project team demand. There is no unique procedure to develop
HMI in time of purchasing and development. As a result types of data and interacting with the HMIs have
variation.
Manage difficult visual management in the robot cells
In accordance to the visualisation challenge that has presented in the interviews, automated cells have the
38
potential to become more visualized. Showing information regarding the production process and
automated process especially for operators, would help to increase visualisation within the cells and avoid
black box issue.
Continue production in time of robot/automation breakdowns
Investigation of current facilities show that if for any reason the robots or other automated solutions have
a breakdown the production will stop and there is no possibility to run the system unless maintaining the
affected item.
Reduce complicated programming
The case company suffers from lack of robotic programmers. Programming of robot cells is a problem
that the case company is dealing with. For instance, it is so common to have a problem with robot
visualisation system which needs supplier(s) to modify the programming and in some cases even the
vision system needs to be replaced with new system.
Knowledge sharing regarding automation
During performing interviews, in order to find right data it was needed to meet project managers and also
regarding automation the data and information are kept with individuals. It is needed to share the data
regarding project achievements and difficulties to able other personnel to handle future projects.
Furthermore, it was so common that operators do not tend to find the cause of stops in robot cells and
prefer to restart the cell as a solution. Regarding this, in break downs, if operator cannot solve the
problem, will ask the maintenance team for help. Sometimes operators could not detect the right cause of
the problem, so the maintenance team needed to spend extra time and effort to find the real cause.
On the other hand, automation level was an issue that varied from one project to the other; almost there
was no determined method to define automation level in the case company and defining the automation
type depends on project team decision, technical limitations, their experience and also supplier(s)
proposal. Type of automation is highly depended on supplier(s). There were some examples of simple
solutions offered by integrators which these solutions could be existed in whole factory but due to
suppliers’ variations, the offered solutions were different. Investigating the layout of one automated cell
showed the current situation was not optimized and even robot movement analysis revealed that there
were some non-value added movements by the robots.
According to what mentioned the problems and challenges are categorized as below- table 10- in order to
facilitate guideline development:
Table 10 Challenges and problems categorization
Development challenges and
problems
Operation challenges and
problems
Automation integrating issue
High initial cost
Training
Dependency on third party
Supplier-customer relationship
• Quality issue
• Visualisation
• Maintenance
Development issues represent challenges and problems arising in developing phase or start to affect the
system in this phase. Operation issues are related to challenges and problems occur in production time.
In order to be able to overcome these problems or try to minimize their effect a guideline has
proposed in next section.
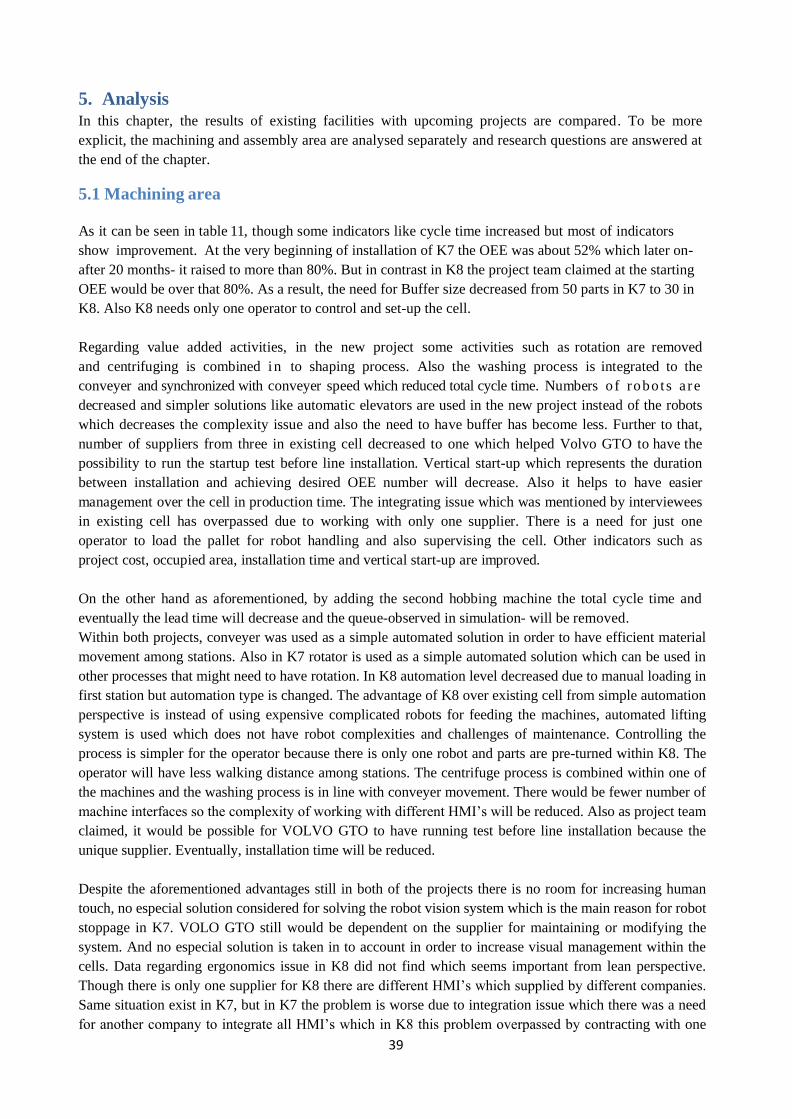
39
5. Analysis In this chapter, the results of existing facilities with upcoming projects are compared. To be more
explicit, the machining and assembly area are analysed separately and research questions are answered at
the end of the chapter.
5.1 Machining area
As it can be seen in table 11, though some indicators like cycle time increased but most of indicators
show improvement. At the very beginning of installation of K7 the OEE was about 52% which later on-
after 20 months- it raised to more than 80%. But in contrast in K8 the project team claimed at the starting
OEE would be over that 80%. As a result, the need for Buffer size decreased from 50 parts in K7 to 30 in
K8. Also K8 needs only one operator to control and set-up the cell.
Regarding value added activities, in the new project some activities such as rotation are removed
and centrifuging is combined in to shaping process. Also the washing process is integrated to the
conveyer and synchronized with conveyer speed which reduced total cycle time. Numbers o f robo ts a re
decreased and simpler solutions like automatic elevators are used in the new project instead of the robots
which decreases the complexity issue and also the need to have buffer has become less. Further to that,
number of suppliers from three in existing cell decreased to one which helped Volvo GTO to have the
possibility to run the startup test before line installation. Vertical start-up which represents the duration
between installation and achieving desired OEE number will decrease. Also it helps to have easier
management over the cell in production time. The integrating issue which was mentioned by interviewees
in existing cell has overpassed due to working with only one supplier. There is a need for just one
operator to load the pallet for robot handling and also supervising the cell. Other indicators such as
project cost, occupied area, installation time and vertical start-up are improved.
On the other hand as aforementioned, by adding the second hobbing machine the total cycle time and
eventually the lead time will decrease and the queue-observed in simulation- will be removed.
Within both projects, conveyer was used as a simple automated solution in order to have efficient material
movement among stations. Also in K7 rotator is used as a simple automated solution which can be used in
other processes that might need to have rotation. In K8 automation level decreased due to manual loading in
first station but automation type is changed. The advantage of K8 over existing cell from simple automation
perspective is instead of using expensive complicated robots for feeding the machines, automated lifting
system is used which does not have robot complexities and challenges of maintenance. Controlling the
process is simpler for the operator because there is only one robot and parts are pre-turned within K8. The
operator will have less walking distance among stations. The centrifuge process is combined within one of
the machines and the washing process is in line with conveyer movement. There would be fewer number of
machine interfaces so the complexity of working with different HMI’s will be reduced. Also as project team
claimed, it would be possible for VOLVO GTO to have running test before line installation because the
unique supplier. Eventually, installation time will be reduced.
Despite the aforementioned advantages still in both of the projects there is no room for increasing human
touch, no especial solution considered for solving the robot vision system which is the main reason for robot
stoppage in K7. VOLO GTO still would be dependent on the supplier for maintaining or modifying the
system. And no especial solution is taken in to account in order to increase visual management within the
cells. Data regarding ergonomics issue in K8 did not find which seems important from lean perspective.
Though there is only one supplier for K8 there are different HMI’s which supplied by different companies.
Same situation exist in K7, but in K7 the problem is worse due to integration issue which there was a need
for another company to integrate all HMI’s which in K8 this problem overpassed by contracting with one
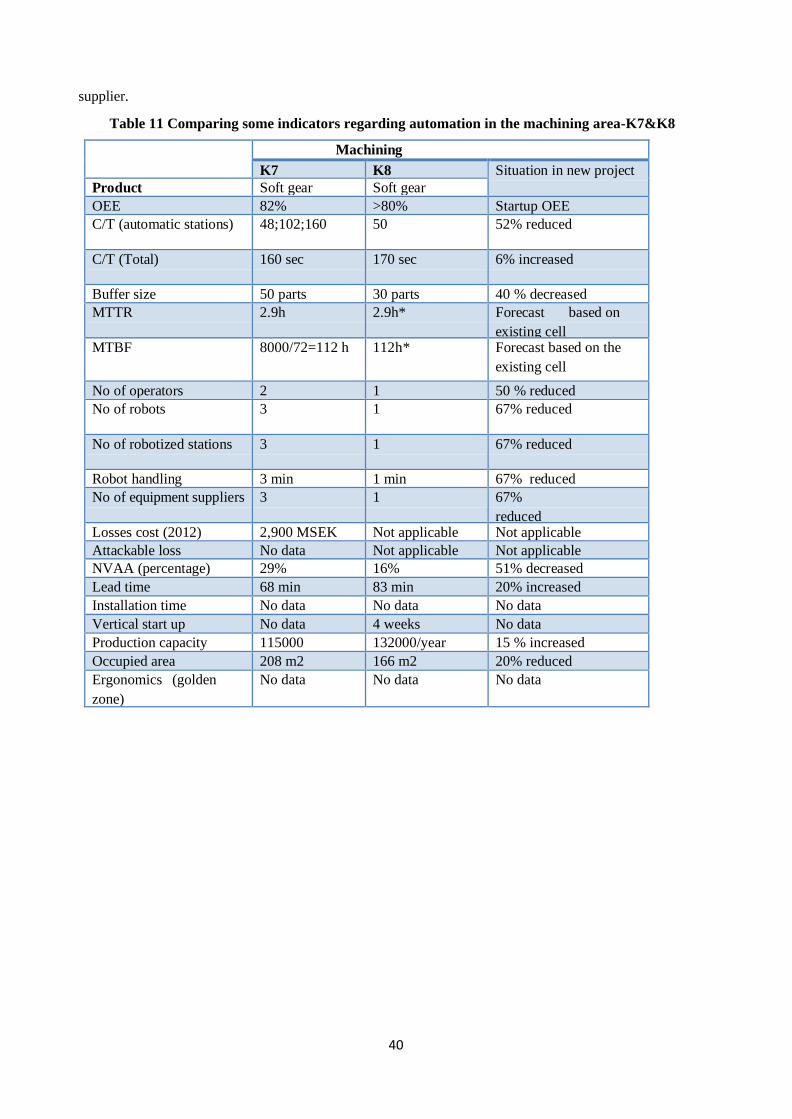
40
supplier.
Table 11 Comparing some indicators regarding automation in the machining area-K7&K8
Machining
K7 K8 Situation in new project
Product Soft gear Soft gear
OEE 82% >80% Startup OEE
C/T (automatic stations) 48;102;160 50 52% reduced
C/T (Total) 160 sec 170 sec 6% increased
Buffer size 50 parts 30 parts 40 % decreased
MTTR 2.9h 2.9h* Forecast based on
existing cell MTBF 8000/72=112 h 112h* Forecast based on the
existing cell
No of operators 2 1 50 % reduced
No of robots 3 1 67% reduced
No of robotized stations 3 1 67% reduced
Robot handling 3 min 1 min 67% reduced
No of equipment suppliers 3 1 67%
reduced Losses cost (2012) 2,900 MSEK Not applicable Not applicable
Attackable loss No data Not applicable Not applicable
NVAA (percentage) 29% 16% 51% decreased
Lead time
(one piece)
68 min 83 min 20% increased
Installation time No data No data No data
Vertical start up No data 4 weeks No data
Production capacity 115000 132000/year 15 % increased
Occupied area 208 m2 166 m2 20% reduced
Ergonomics (golden
zone)
No data No data No data
41
5.2 Assembly area
In order to find the differences from lean automation perspective in current state and the developing
project following table 12 has drawn. Compare to existing line, there are more examples of
implementing simple solutions such as vast usage of automated conveyers, automated lifting
systems which feed the assembly machines. Also the integration of two separated area helps
VOLVO GTO to simplify the assembly and have better control over the working process.
Automation level increased which can help to reduce human cost, have better quality, increase
production volume and increase the line OEE. During the development process, almost all steps
handled considering lean requirements. Especially non-value added activities are reduced more
than 50%.For instance, comparing to the existing robot cell in AT assembly in the new range
line for same process, the robot does not hold the part under screw driver and screw driving is
handled by automatic system. Also due to combination of two separated areas, there would be
no lift track movement. Movement of heavy parts is noticeably decreased. Generally, almost all
indicators represent improvement compare to existing facilities. Increasing automation level would
have positive effect on the indicators. For instance, walking distance decreased more than 90% and
presenting parts in the most appropriate area for operators- golden zone- increased up to 87%.
Production capacity, lead time and cycle time have improved. Reducing number of suppliers from 10 in
existing line to 1 in developing line is an important item which might reduce the complexity and help to
overcome the integration issue. Number of operators 50% reduced which will decrease the cost and
reduce the complexity of training though training multi-task operator can have some challenges.
In the existing line, high number of forklift transportations caused problems concerning safety. Also it
was not in line with lean requirements which emphasize on less movement and shorter distance.
In addition to what is mentioned in table 3, comparing the existing area and the new range line reveals
that following will be achieved through increasing the automation level in range assembly which are
important from lean perspective:
Reduction of container sizes and packages
No use of forklifts within range assembly area
Increased safety due to reduced no. of transportations and a more visual flow
Reducing the movement of heavy parts and lifting operation
From manual transportations to automatic e.g. finished range to main line
Despite achievements in the new project, still there is no possibility to run the automated cells in robots
breakdown. Or in other word, system is not flexible enough to continue production in stoppages.
Despite unique supplier of the line, there are different HMI’s in new range assembly line supported by
different companies. There is no evident show how it is planned to avoid robot vision system. Still the
robot cells are designed in a way that does not help to increase visual management. The case company
would be dependent on the supplier for maintenance and probable modifications in the future. In the new
range line there is no specific target regarding reducing the MTTR and MTBF. Involved people talk
about zero stop but actually no evident found that show how this target will be meet.
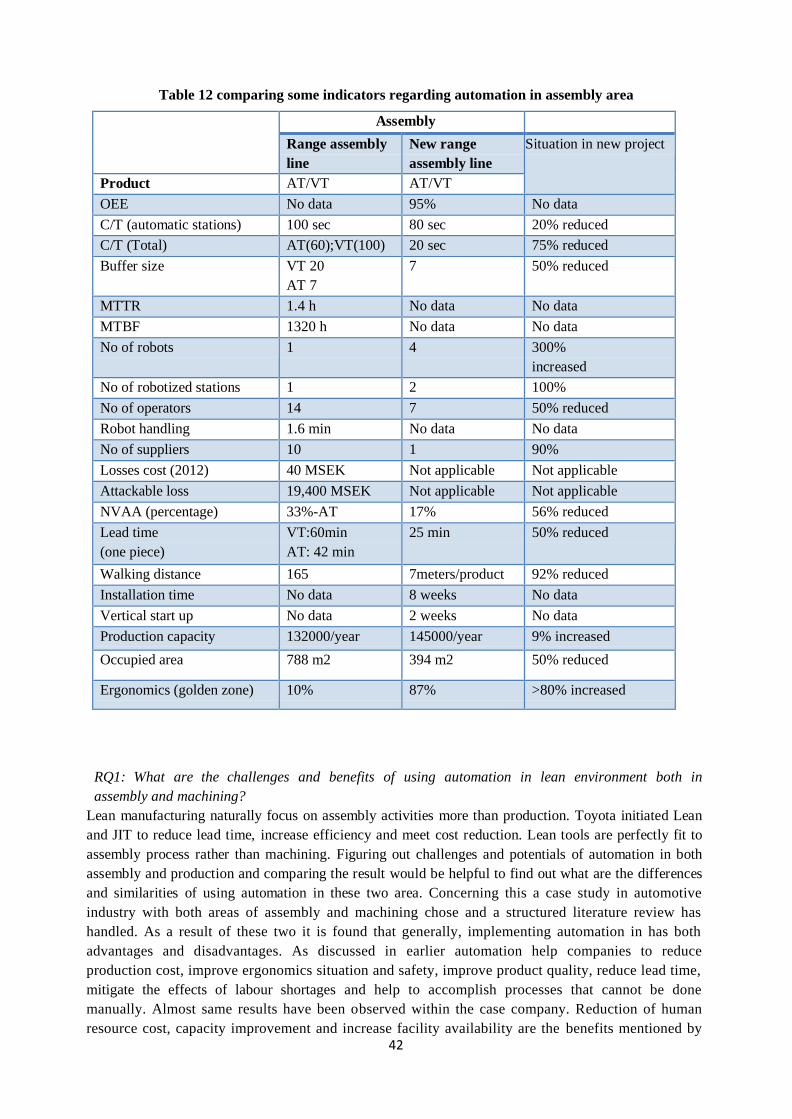
42
Table 12 comparing some indicators regarding automation in assembly area
Assembly
Range assembly
line
New range
assembly line
Situation in new project
Product AT/VT AT/VT
OEE No data 95% No data
C/T (automatic stations) 100 sec 80 sec 20% reduced
C/T (Total) AT(60);VT(100) 20 sec 75% reduced
Buffer size VT 20
AT 7
7 50% reduced
MTTR 1.4 h No data No data
MTBF 1320 h No data No data
No of robots 1 4 300%
increased
No of robotized stations 1 2 100%
No of operators 14 7 50% reduced
Robot handling 1.6 min No data No data
No of suppliers 10 1 90%
reduced Losses cost (2012) 40 MSEK Not applicable Not applicable
Attackable loss 19,400 MSEK Not applicable Not applicable
NVAA (percentage) 33%-AT
24%-VT
17% 56% reduced
Lead time
(one piece)
VT:60min
AT: 42 min
25 min 50% reduced
Walking distance 165
meters/product
7meters/product 92% reduced
Installation time No data 8 weeks No data
Vertical start up No data 2 weeks No data
Production capacity 132000/year 145000/year 9% increased
Occupied area 788 m2 394 m2 50% reduced
Ergonomics (golden zone) 10% 87% >80% increased
RQ1: What are the challenges and benefits of using automation in lean environment both in
assembly and machining?
Lean manufacturing naturally focus on assembly activities more than production. Toyota initiated Lean
and JIT to reduce lead time, increase efficiency and meet cost reduction. Lean tools are perfectly fit to
assembly process rather than machining. Figuring out challenges and potentials of automation in both
assembly and production and comparing the result would be helpful to find out what are the differences
and similarities of using automation in these two area. Concerning this a case study in automotive
industry with both areas of assembly and machining chose and a structured literature review has
handled. As a result of these two it is found that generally, implementing automation in has both
advantages and disadvantages. As discussed in earlier automation help companies to reduce
production cost, improve ergonomics situation and safety, improve product quality, reduce lead time,
mitigate the effects of labour shortages and help to accomplish processes that cannot be done
manually. Almost same results have been observed within the case company. Reduction of human
resource cost, capacity improvement and increase facility availability are the benefits mentioned by
43
interviewees.
Regarding the differences of assembly and production, it seems there are not so many studies in
literature, but in practice, thesis findings show the main different between assembly and machining is
ergonomics issue. For instance within VOLVO GTO, the project development team, assumed human
as main element in designing the new range assembly line. So many studies have done regarding
reduction of walking distance for operators in the automated area. And also automated conveyers are
designed in the most appropriate height for operators. Furthermore, due the assembly’s nature in
range assembly line, VOLVO GTO has used AGC’s as automated material handler between stations.
In contrast, in the machining, finished parts ship to next step by lift tracks. This is because in the
assembly area the batch size is bigger than machining; consequently more number of transportation is
needed between stations.
As literature study shows, implementing automation for companies have drawbacks such as Lack of
flexibility, high cost of equipment/financial justification, maintenance cost/maintenance parts and
integration of equipment into existing systems. On the other hand complexity is an expression which
contains some of these issues and represents the difficulty of working with high-tech systems. The later
item assumes challenging if automation system is implementing in a lean environment. Lean
manufacturing emphasize on simplicity of working process, high level of visualisation, flexibility and
error-proof system. Literature shows some companies believe automation brings complexity to lean
system and even some remove automation. On the hand the concept of lean automation applies the right
amount of automation to a given task. It stresses robust, reliable components and minimizes overly
complicated solutions. So, automation can enhance lean manufacturing if right level and appropriate type
of automation is using. As mentioned earlier, clear picture of automation and have a long term view in
lean environment help companies to benefit from both lean manufacturing and automation both in
assembly and machining. Assembly area contains more ergonomics issue and machining area needs
precision. Automation in both areas can be useful and advantageous. Considering implementing
automation in lean environment this advantage can be in line with lean principles and improve overall
business of organization.
RQ2: How companies can implement automation efficiently in lean environment?-or how companies
can overcome automation challenges in lean environment?
Development of automation solutions is a multidimensional decision which includes many organizational
aspects. Considering roles, resources, requirements, company capabilities and weaknesses, market
situation, new technologies and overall business strategy are some examples of elements should be taken
into account for efficient development of automation.
According to lean principles, lean production cannot be meet unless standardization of production
process. It is vital for the companies to have stable production process. Indubitably, it is not possible to
expect have lean organiastion with unstable process. According to literature companies must have stable
process in order to be able to implement automation. Automating the stable process would be more
efficient rather than automating an unstable system which can change any time. In order to meet efficient
automation in lean environment, it is crucial to know the possible challenges and benefits of automation
which discussed in last research question. In next step, companies should have a long term view toward
automation and have well-defined strategy regarding automation within lean context. Literature shows
most of automation development projects follow ad hoc strategy and are dependent on project situation.
It is recommended to VOLVO GTO to have a holistic view toward automation and publish automation
strategy in accordance to previous sections.
44
Many companies and to be more specific, VOLVO GTO, have lack of competence regarding automation.
Definitely, poor competence cannot lead to efficiency and companies will always be dependent on their
suppliers and third party for maintaining the automated systems. Furthermore, through appropriate level
of competence companies would be able to develop their automation by long term plan. It can help
companies to develop solutions in-house which increase organizational knowledge concerning
automation. Reduce the cost and create simple solutions best fit to the company needs.
As mentioned in the literature, the key to meet efficiency in automation in lean environment is to realize
what should be automated and how it should be automated. So, finding the right level and type of
automation can lead to meet lean principles with automation.
Moving toward implementation of simple solutions would be beneficiary regarding reducing initial cost,
reducing complexity and reducing the level of dependency to third party. This needs to have reasonable
level of competition in the case company and have a long term view toward automation development.
Consideration of technical issues such as Human Machine Interfaces and programming can help VOLVO
GTO to improve automation situation. Defining HMI standard that all the company’s’ suppliers follow it
can help to avoid complexity and problems of operators training. Also investment on simple
programming would be useful to increase flexibility and reduce the need to the suppliers. Also it can
reduce the setup time noticeably.
Also flexibility is an issue that needs special attention and effort to meet lean requirements through
automation. Automation solutions should design flexible and possible to run through alternative plan. For
instance use portable lifting device in robot cell stoppages in order to keep the production flow. Further
to this, it is vital to design the layout of robotized cells multi process. It should be noticed that the cell
should have the possibility to be rearranged in order to deal with production variations.
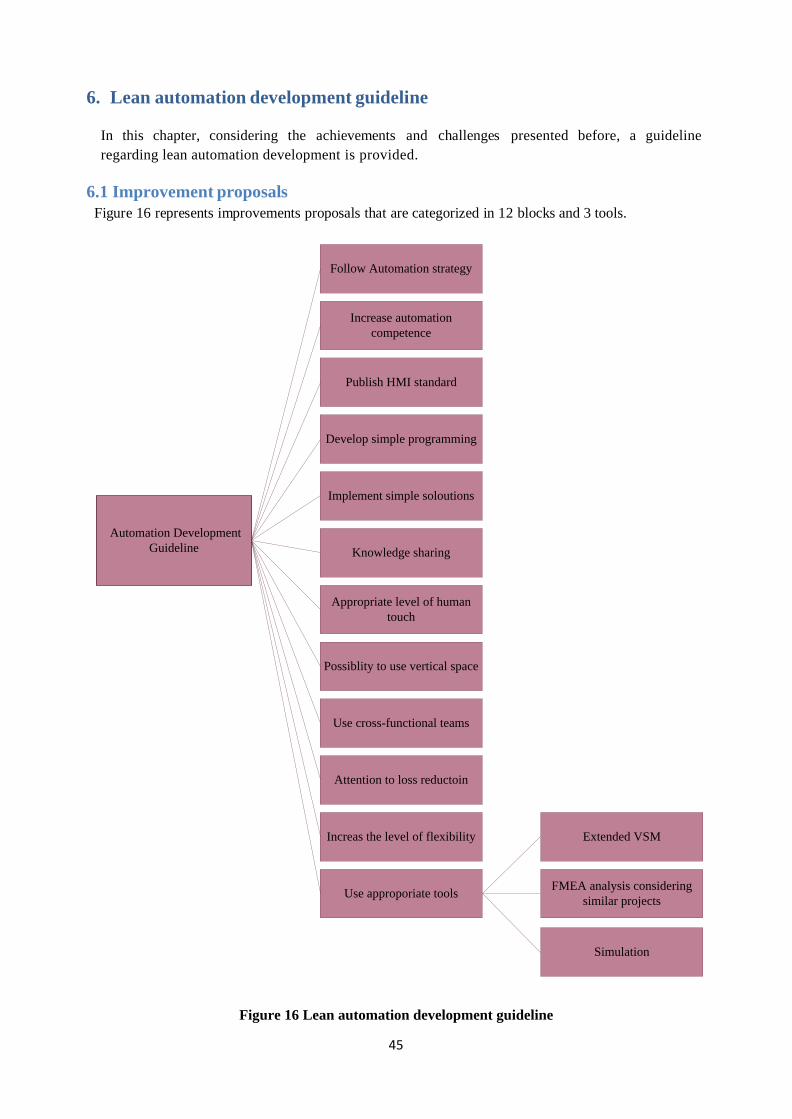
45
6. Lean automation development guideline
In this chapter, considering the achievements and challenges presented before, a guideline
regarding lean automation development is provided.
6.1 Improvement proposals
Figure 16 represents improvements proposals that are categorized in 12 blocks and 3 tools.
Automation Development
Guideline
Follow Automation strategy
Increase automation
competence
Publish HMI standard
Develop simple programming
Implement simple soloutions
Knowledge sharing
Appropriate level of human
touch
Possiblity to use vertical space
Use approporiate tools
Use cross-functional teams
Attention to loss reductoin
Increas the level of flexibility Extended VSM
FMEA analysis considering
similar projects
Simulation
Figure 16 Lean automation development guideline
46
Each proposal is corresponding to some of challenges and problems aforementioned. Following will
explain each item.
Follow Automation strategy:
As explained in previous sections, it is vital for companies to have clear automation strategy derived
from overall business strategy and in line with other organizational activities. It will lead to decrease
development cost, increase internal competence and avoid wrong investment. Also, appropriate
automation strategy may cause to have flexible automation solutions with high reliability.
Use cross-functional team:
According to lean production requirements, it is vital to form cross-functional development teams in
order to benefit from different views and skills. As a consequence of forming multi-skills development
teams, decision making will be easier and finding the optimum solutions will be more accessible.
Furthermore, the automation solutions offered by cross-functional team would be more reliable compare
to one-dimensional team. Project manager should choose different skills in line with project scope and
automation strategy (if existed). Each person will have acceptable level of involvement and the decisions
should be made by all team members.
Increase flexibility:
One of the most important features to meet lean requirements is flexibility. Considering flexibility in
development of automation projects will satisfy many needs such as loss reduction, shorter lead-time
and possibility to run the production in stoppages. The term flexibility may refer to flexibility in
production process or may refer to the possibility to rearrange the automation solutions according to
situation. It is vital to pay to consider flexibility issue from the initial phase of development. A flexible
system let the company to adjust the production according to the requirements and the system would be
less affected by fluctuation in production volume or technical limitations. To be more explicit,
automation equipments should design in a way that later can be moved to another department or sector.
Also there should be an alternative mood for production. For instance if the automated system encounter
breakdown the systems should have the possibility to run manually.
Increasing the internal competence level in:
Programming
Robotic
Maintenance
Etc.
In order to reduce the level of dependency to suppliers, promote organisation to implement automation
knowledge, decrease cost of supplying the automation maintenance and development and increase the
level of implementing simple and innovative customized solutions. From long term perspective,
investment in automation competence development would help the company to avoid losses regarding
not suitable solutions. Also, it would help to increase the automation knowledge, and have long term
view toward automation in time of negotiating with suppliers.
Publish internal HMI standard:
Publish internal standard regarding HMI’s and ask suppliers to follow the same process. Type of the
data, working instruction, visualizing the data etc. is some examples that can be standardized. It is
needed to have clear scope of supply in order to be able to publish mentioned standard. Unique
method of representing data to the operator will ease the training and also it will reduce human
errors. As a consequent of standardizing HMIs, the situation would more flexible for company to
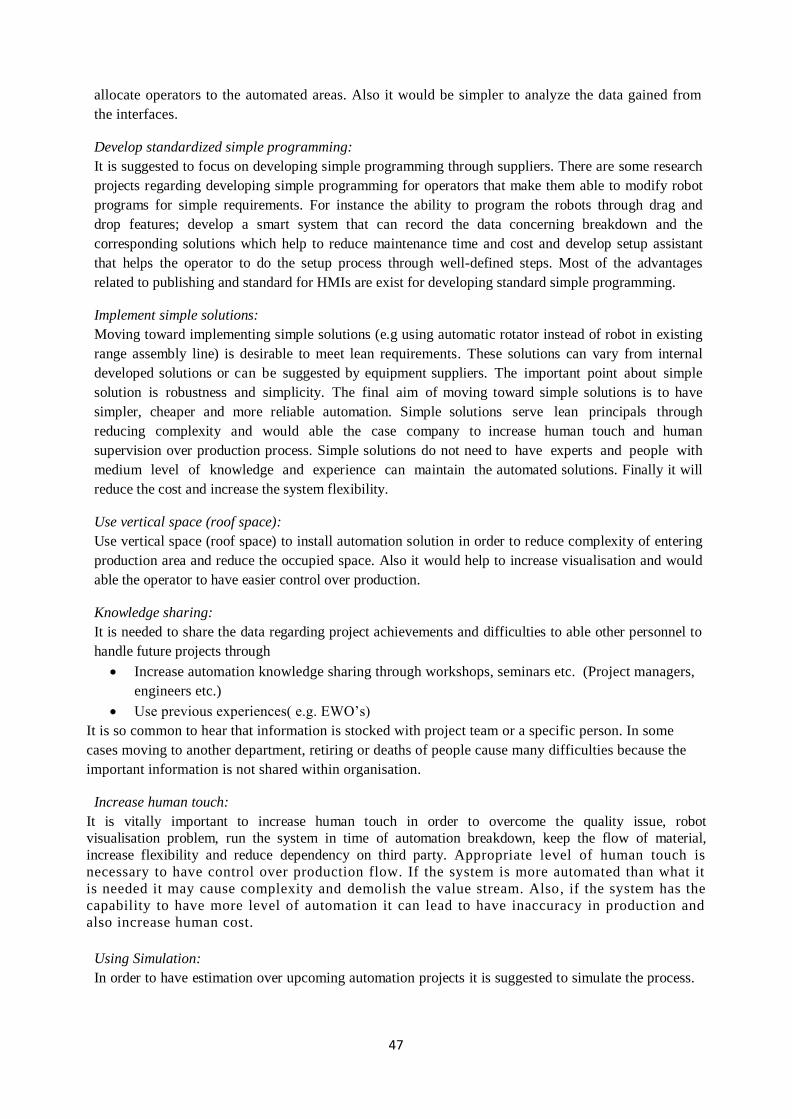
47
allocate operators to the automated areas. Also it would be simpler to analyze the data gained from
the interfaces.
Develop standardized simple programming:
It is suggested to focus on developing simple programming through suppliers. There are some research
projects regarding developing simple programming for operators that make them able to modify robot
programs for simple requirements. For instance the ability to program the robots through drag and
drop features; develop a smart system that can record the data concerning breakdown and the
corresponding solutions which help to reduce maintenance time and cost and develop setup assistant
that helps the operator to do the setup process through well-defined steps. Most of the advantages
related to publishing and standard for HMIs are exist for developing standard simple programming.
Implement simple solutions:
Moving toward implementing simple solutions (e.g using automatic rotator instead of robot in existing
range assembly line) is desirable to meet lean requirements. These solutions can vary from internal
developed solutions or can be suggested by equipment suppliers. The important point about simple
solution is robustness and simplicity. The final aim of moving toward simple solutions is to have
simpler, cheaper and more reliable automation. Simple solutions serve lean principals through
reducing complexity and would able the case company to increase human touch and human
supervision over production process. Simple solutions do not need to have experts and people with
medium level of knowledge and experience can maintain the automated solutions. Finally it will
reduce the cost and increase the system flexibility.
Use vertical space (roof space):
Use vertical space (roof space) to install automation solution in order to reduce complexity of entering
production area and reduce the occupied space. Also it would help to increase visualisation and would
able the operator to have easier control over production.
Knowledge sharing:
It is needed to share the data regarding project achievements and difficulties to able other personnel to
handle future projects through
Increase automation knowledge sharing through workshops, seminars etc. (Project managers,
engineers etc.)
Use previous experiences( e.g. EWO’s)
It is so common to hear that information is stocked with project team or a specific person. In some
cases moving to another department, retiring or deaths of people cause many difficulties because the
important information is not shared within organisation.
Increase human touch:
It is vitally important to increase human touch in order to overcome the quality issue, robot
visualisation problem, run the system in time of automation breakdown, keep the flow of material,
increase flexibility and reduce dependency on third party. Appropriate level of human touch is
necessary to have control over production flow. If the system is more automated than what it
is needed it may cause complexity and demolish the value stream. Also, if the system has the
capability to have more level of automation it can lead to have inaccuracy in production and
also increase human cost.
Using Simulation:
In order to have estimation over upcoming automation projects it is suggested to simulate the process.
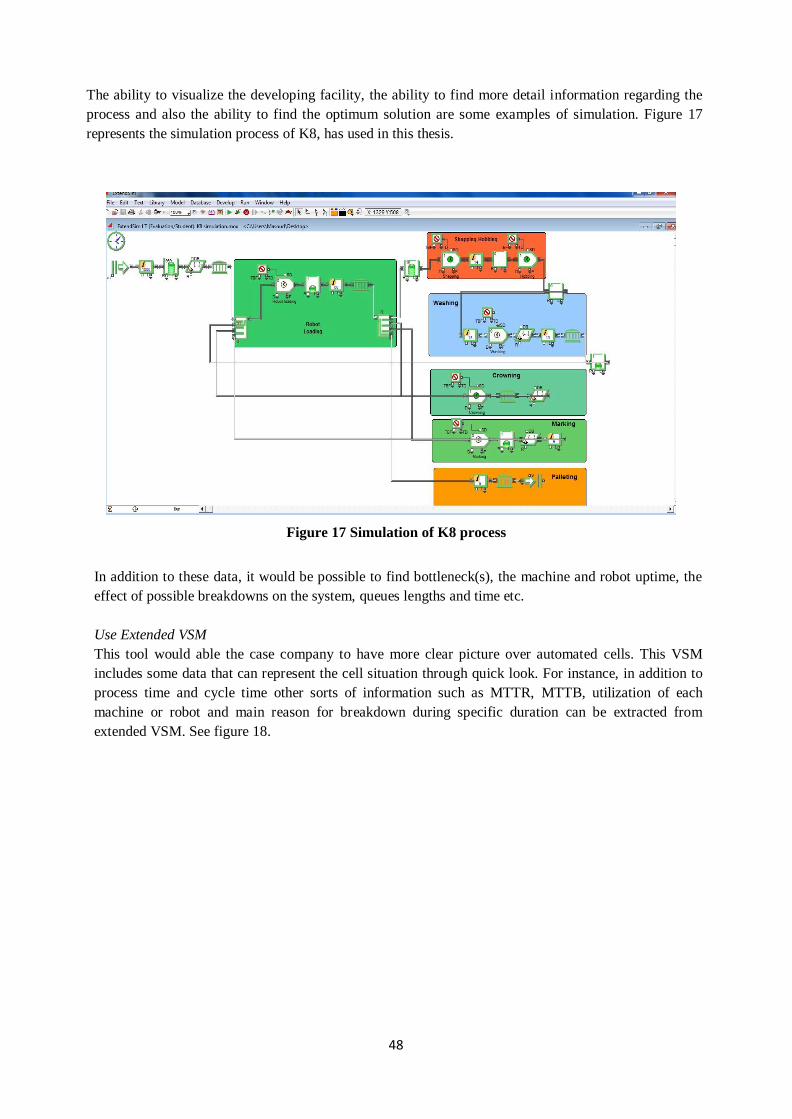
48
The ability to visualize the developing facility, the ability to find more detail information regarding the
process and also the ability to find the optimum solution are some examples of simulation. Figure 17
represents the simulation process of K8, has used in this thesis.
Figure 17 Simulation of K8 process
In addition to these data, it would be possible to find bottleneck(s), the machine and robot uptime, the
effect of possible breakdowns on the system, queues lengths and time etc.
Use Extended VSM
This tool would able the case company to have more clear picture over automated cells. This VSM
includes some data that can represent the cell situation through quick look. For instance, in addition to
process time and cycle time other sorts of information such as MTTR, MTTB, utilization of each
machine or robot and main reason for breakdown during specific duration can be extracted from
extended VSM. See figure 18.
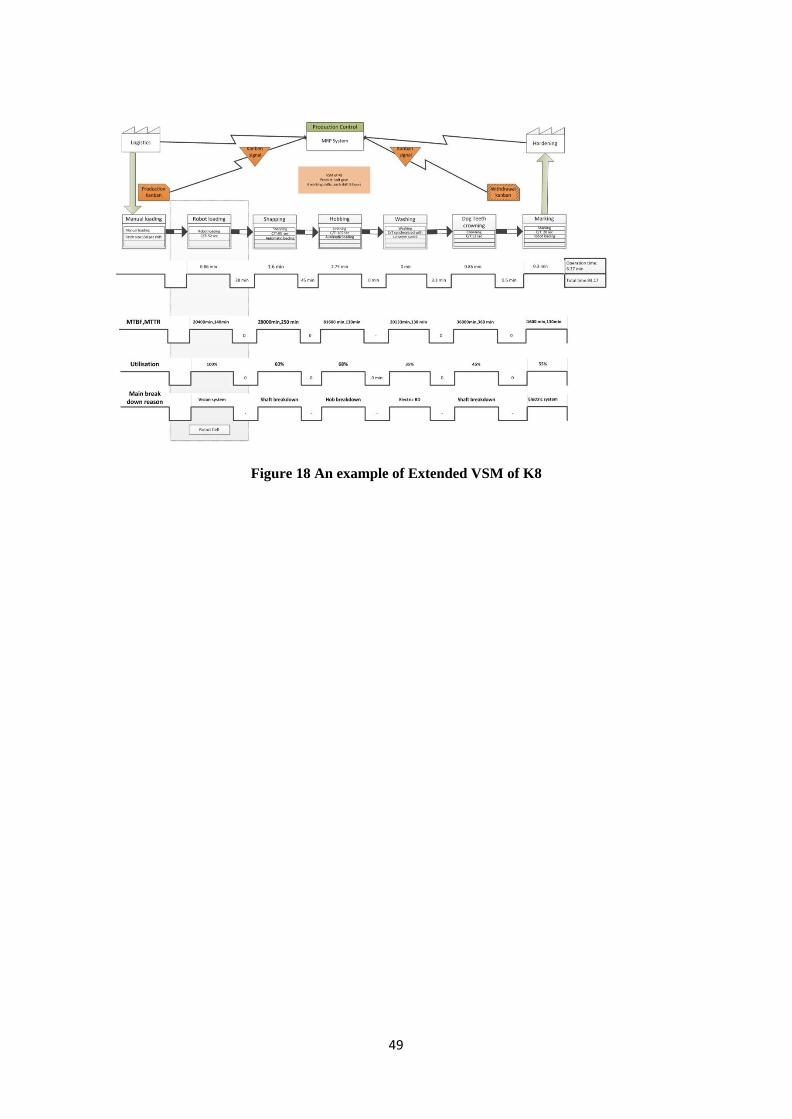
49
Figure 18 An example of Extended VSM of K8
50
7. Conclusion and further research
I n this chapter, thesis conclusion and suggesting areas are presented.
Considering what aforementioned, implementing automation has advantages and disadvantages.
Especially implementing automation in lean environment seems challenging. This can be due to
complexity of automated systems, high initial cost and lack of flexibility.
In order to be able to overcome these challenges and develop automation within lean environment
successfully, following points can be taken into account as conclusion to meet automation efficiency in
lean environment:
Holistic view toward automation
Clear strategy and long term view toward automation
Stability in process and strategy
Flexibility of solutions and devices
Appropriate level of organisational competence
Appropriate type of automation solutions
More attention toward ergonomics, walking distance and movement analysis in assembly area
and any situation with human involvement
More attention toward precision and robot movement analysis in machining
Simplicity of automated solutions
Use efficient tools such as 3Dsimulation and process simulation in order to find realistic
picture of automation system
In line with noted points, it is always vital to ask what is needed to be automated and how it should be
done. Automation necessarily does not mean to use complicated robotized systems. There would be
many other simpler options which are not only more convenient to work but also cheaper to purchase.
Furthermore, depends on the companies situation, it would be possible to produce equipment internally
which will help the company to increase internal competence as well.
As explained in the delimitation section, this thesis focused on automation development concerning robot
cells. It would be interesting to have research for other types of automation within material movement
context. Furthermore, level of automation within production companies needs in-depth study which can
be useful to find the appropriate level of automation through a well-defined process. In this case some
researches have performed which mostly remains at theoretical level. Also, type of automation is another
area which has high potential for research. Arising technologies concerning automation, lead researchers
to have more précis answer for the automation type issue.
51
8. References
Baker, P. & Z. Halim, 2007, an exploration of warehouse automation implementations: cost, service and
flexibility issues, Supply Chain Management: An International Journal 12(2): 129-138.
Bellgran, M. & Säfsten, K., 2010, Production Development design and operation of production systems,
Springer, New York
Bryman, A. and Bell, E. 2007, business research methods, Oxford university press, Oxford university
Carnbo L., 2012, Framtagning av en utvecklingsprocessför automation - Baseratpå konceptetLean
Automation, , Master thesis, Malardalen University
Chen, I. J. and Small, M. H. 1996, Planning for advanced manufacturing technology: a research
framework. International Journal of Operations & Production Management Vol. 16, No. 5, pp. 4-24.
Delkhosh, A. 2012, Lean Automation: Combining Lean with Industrial Robotics in Real Examples,
master thesis, Malardalen University.
Duguay, C. et al. 1997, From mass production to flexible/agile production , International
]ournal of Operations & Production Management, Vol. 17 No. 12, pp. 1183-95
Dulchlnos, J. and P. Massaro, 2005. The time is right for labs to embrace the principles of industrial
automation. Drug World Discovery, (Winter-issue 2005-2006): p. 25-28.
Ellram, L., M., and Carr, A., 1994. Strategic purchasing: A history and review of the literature. National
association of purchasing management, Inc. [e-journal] 30(2), pp.9-19. Available through: Jönköping
University Library Database. [Accessed 13 March 2013].
Frohm, J. 2008, Levels of Automation in Production Systems, Doctoral thesis, Department of Product
and Production Development, Chalmers University of Technology, Göteborg, Sweden.
Granlund, A. 2011, Competitive Internal Logistics Systems through Automation, Licentiate thesis no.
137, School of Innovation, Design and Engineering, Malardalen University, Vasteras, Sweden.
Granlund, A. & Friedler, N. 2012, A model for the formulation of an automation strategy, The 4th World
Conference Production & Operations Management, 1-5 July 2012, Amsterdam, the Netherlands.
Granlund, A., Friedler, N., Jackson, M., Hellström, E. and Carnbo, L. 2012, The concept of Lean
Automation – a pilot installation., 5th Swedish Production Symposium, Linköping, Sweden.
Groover, M. P. 2000, Automation, Production Systems, and Computer-Integrated Manufacturing,
Prentice Hall.
Harris, C. & Harris, R. 2008, Can Automation Be a Lean Tool? Automation That Enhances Flow Is
Lean; Automation That Reduces Uptime and Extends Changeover Is Not Lean, Manufacturing
Engineering, Vol. 141, No. 2, pp. 27-34.
Hedelind, M. & Jackson, M. 2011, How to Improve the Use of Industrial Robots in Lean Manufacturing
Systems,Journal of Manufacturing Technology Management, Vol. 22, No. 7, pp. 891-905.
52
Jackson, M.; Hedelind, M.; Hellstrom, E.; Granlnd, A. & Friedler, N. 2011, Lean Automation:
Requirements and Solutions for Efficient Use of Robot Automation in the Swedish Manufacturing
Industry., International Journal of Engineering Research & Innovation, Vol. 3, No. 2, pp. 36-44.
Lindström, V. and Winroth, M. 2010, Aligning manufacturing strategy and levels of automation: A
case study, Journal of Engineering and Technology Management Vol. 27, No. 3-4, pp. 148-159.
Martinez A. and Pérez M., Lean indicators and manufacturing strategies, International Journal of
Operations & Production Management Volume: 21 Issue: 11 2001
Orr, S. C. 1997, Automation in the Workplace: An Australasian Perspective, Technovation, Vol. 17,
No. 2, pp. 83-105.
Riberio, L. & Barata, J., 2011, Re-Thinking Diagnosis for Future Automation Systems: An Analysis of
Current Diagnostic Practices and Their Applicability in Emerging IT Based Production Paradigms.
Computers in Industry, Vol. 62, No. 7, pp. 639-659.
Safsten, K.; Winroth, M. & Stahre, J. 2007, The Content and Process of Automation Strategies,
International Journal of Production Economics, Vol. 110, No. 1-2, pp. 25-38.
Sambasivarao, K.V. & Deshmukh, S.G., 1995, Selection and implementation of advanced
manufacturing technologies: classification and literature review of issues, International Journal of
Operations & Production Management, Vol. 15 Iss: 10, pp.43 – 62
Skinner, W. 1969, Manufacturing–missing link in corporate strategy, Harvard business review Vol.
47, No. 3, pp. 136-145.
Sheridan, T. B., 2002, Humans and Automation: System Design and Research Issues. John Wiley &
Sons, Inc., Santa Monica, USA.
Winroth, M.; Safsten, K. & Stahre, J. 2006, Automation Strategies - Requirements on the Strategy
Process, The 39th CIRP International Seminar On Manufacturing Systems, June 7 – 9, . Ljubljana,
Slovenia.
Womack, J. P.; Jones, D. T. & Roos, D. 1990, The Machine that Changed the World: The Story of Lean
Production, New York, Macmillan.
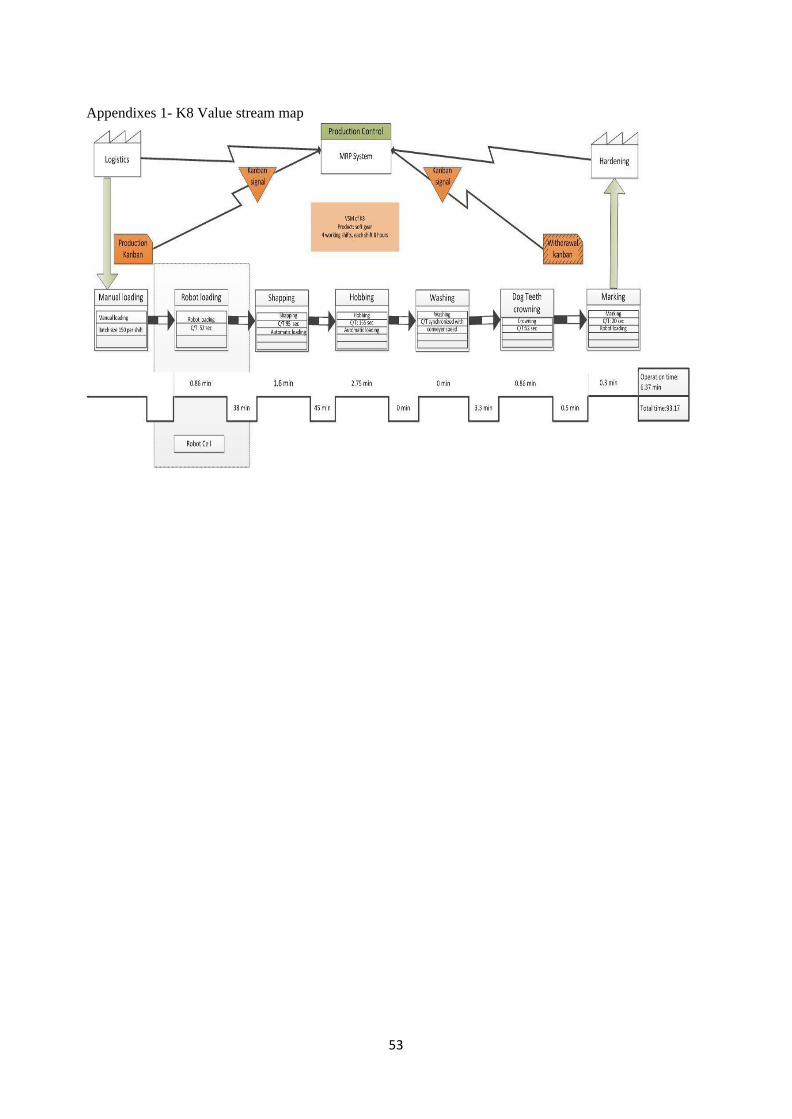
53
Appendixes 1- K8 Value stream map
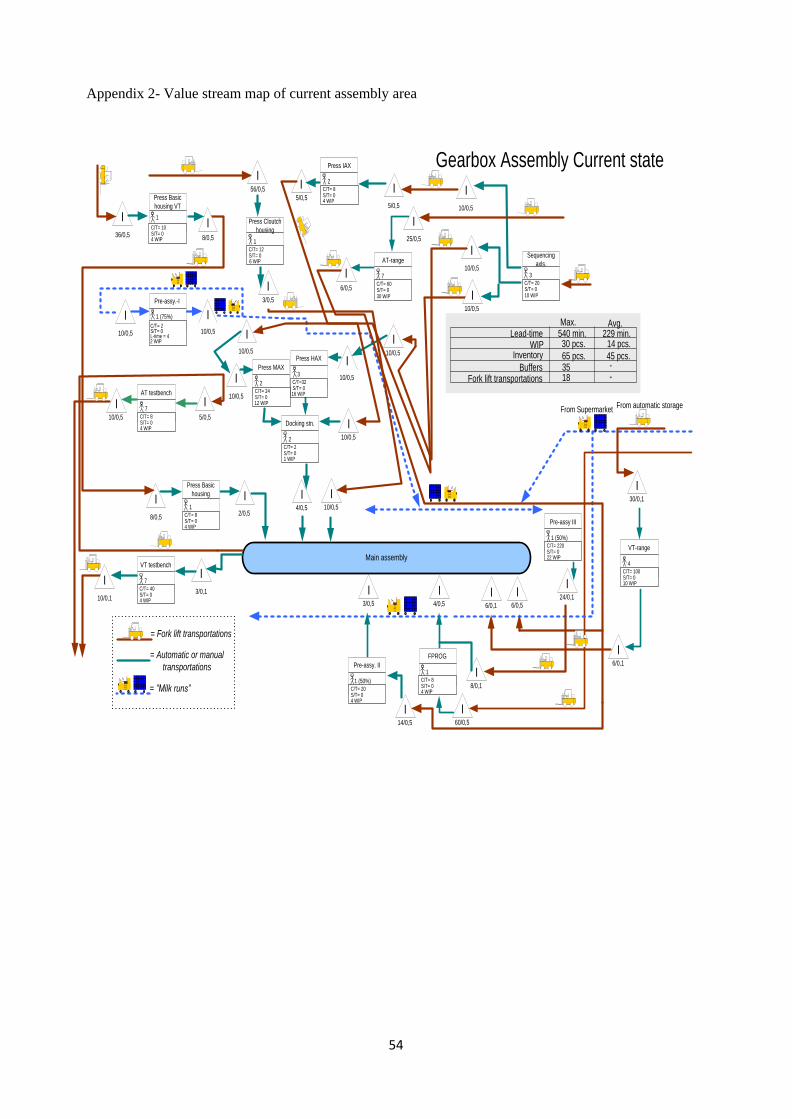
54
Appendix 2- Value stream map of current assembly area
10/0,5
5/0,5
I10/0,5
6/0,5
5/0,5
10/0,5
Main assembly
Press Basic
housing VT
I
10/0,5
I
I10/0,5
I10/0,5
I
10/0,5
I
I
25/0,5
56/0,5 I
10/0,5
I
5/0,5
I
I
2/0,5
I
8/0,5
I
36/0,5
I
10/0,5
I10/0,5
I
I
3/0,1
I
10/0,1
Gearbox Assembly Current state
From SupermarketFrom automatic storage
1
S/T= 04 WIP
C/T= 10
Pre-assy.-I
1 (75%)
S/T= 0L-time = 42 WIP
C/T= 2
4/0,5
I
I
10/0,5
I
10/0,5
I 30/0,1
I
6/0,1
I
6/0,1
I6/0,5
I4/0,5
I
14/0,5
I60/0,5
I
3/0,5
I
= Fork lift transportations
= Automatic or manual
transportations
= ”Milk runs”
8/0,5
I
24/0,1
I
8/0,1
I
Press Basic
housing
1
S/T= 04 WIP
C/T= 8
Docking stn.
2
S/T= 01 WIP
C/T= 2
3/0,5
I
Pre-assy. II
1 (50%)
S/T= 04 WIP
C/T= 20
Lead-time
Fork lift transportations
WIP
18
30 pcs. Inventory 65 pcs.
540 min.
VT-range
4
S/T= 010 WIP
C/T= 100
Press Cloutch
housing
1
S/T= 06 WIP
C/T= 12Sequencing
axls.
3
S/T= 010 WIP
C/T= 20
AT-range
7
S/T= 030 WIP
C/T= 60
Press IAX
2
S/T= 04 WIP
C/T= 8
Press HAX
3
S/T= 016 WIP
C/T=32
Press MAX
2
S/T= 012 WIP
C/T= 24
FPROG
1
S/T= 04 WIP
C/T= 8
Pre-assy III
1 (50%)
S/T= 022 WIP
C/T= 220
VT testbench
7
S/T= 04 WIP
C/T= 40
AT testbench
7
S/T= 04 WIP
C/T= 8
Max. Avg.229 min.
14 pcs.
45 pcs.
-
I
Buffers 35 -
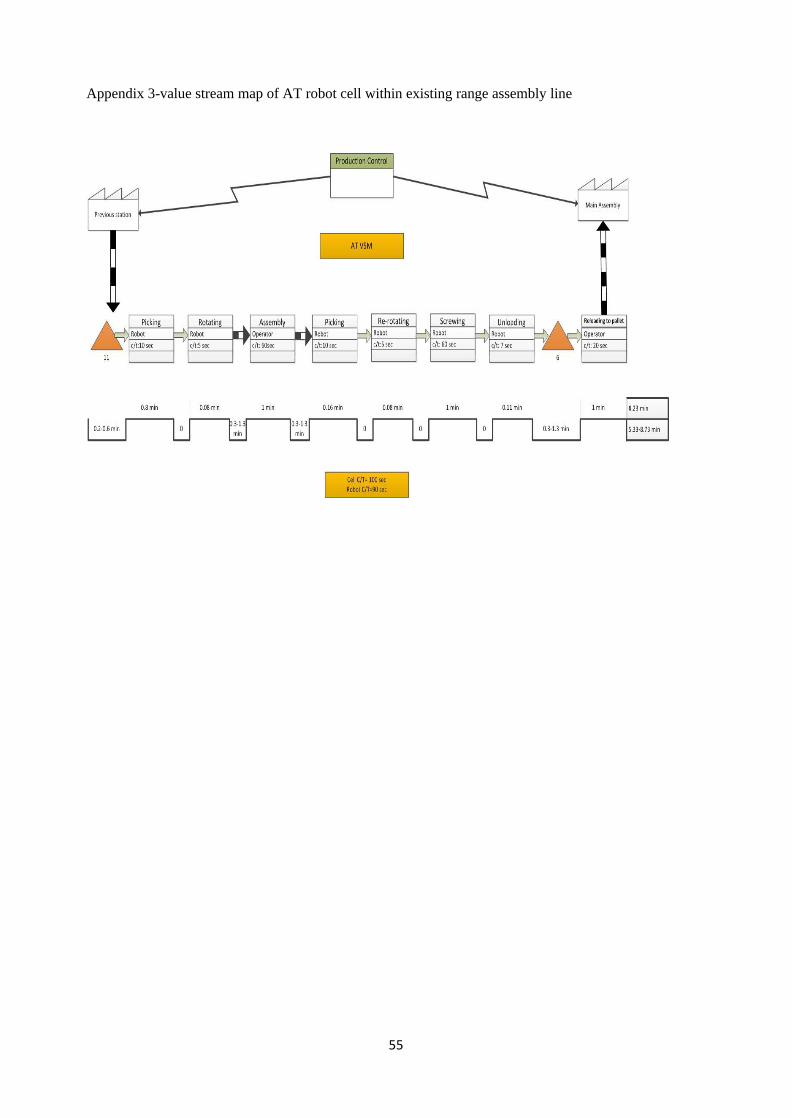
55
Appendix 3-value stream map of AT robot cell within existing range assembly line
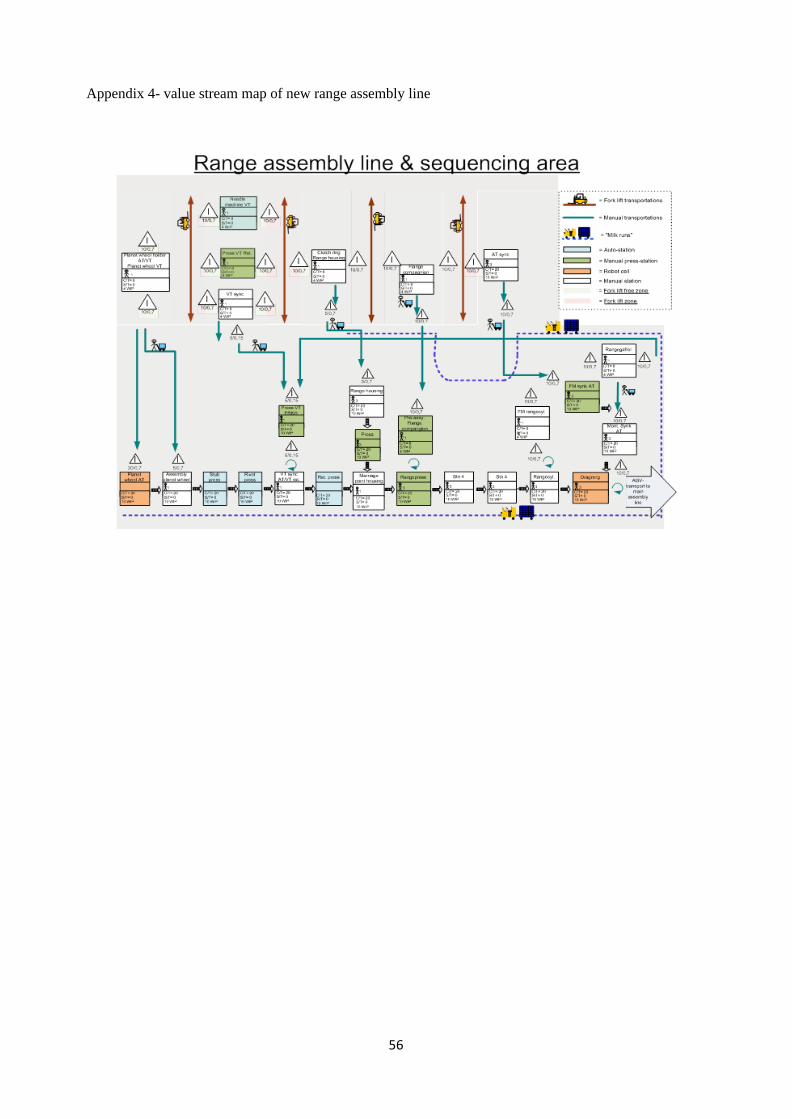
56
Appendix 4- value stream map of new range assembly line